 Stephanie K. Archer1,2*
 Amanda S. Kahn3,4
 Mary Thiess1,5Lauren Law3
 Sally P. Leys3Sophia C. Johannessen6
 Craig A. Layman7†
 Lily Burke6Anya Dunham1
- 1Pacific Biological Station, Fisheries and Oceans Canada, Nanaimo, BC, Canada
- 2Louisiana Universities Marine Consortium, Chauvin, LA, United States
- 3Department of Biological Sciences, University of Alberta, Edmonton, AB, Canada
- 4Monterey Bay Aquarium Research Institute, Moss Landing, CA, United States
- 5Parks Canada, Peterborough, ON, Canada
- 6Institute of Ocean Sciences, Fisheries and Oceans Canada, Sidney, BC, Canada
- 7Department of Applied Ecology, North Carolina State University, Raleigh, NC, United States
Foundation species support communities across a wide range of ecosystems. Non-trophic interactions are considered the primary way foundation species influence communities, with their trophic interactions having little impact on community structure. Here we assess the relative trophic importance of a foundation species and assess how its abundance can influence food web topology. Using empirical data and published trophic interactions we built food web models for 20 glass sponge reefs to examine how average live reef-building sponge abundance (proxied by percent cover) at the reef level is correlated with community structure and food web network topology. Then, using a generalized food web model and stable isotope data we examined the relative importance of sponges. Sponges were consumed by all species examined and contributed significantly to their diets. Additionally, sponges were the second most important node in our generalized reef food web. Several metrics of food web topology (connectance, clustering, and median degree) and community structure exhibited a threshold response to reef-building sponge cover, with the change point occurring between 8 and 13% live sponge cover. Below this threshold, as average sponge cover increases, the consumers observed on a reef rely on fewer sources and are consumed by fewer predators, resulting in food webs that are more clustered and less connected. Above the threshold, as average sponge cover increases, the reefs’ food webs are less clustered and more connected, with consumers utilizing more sources and having more predators. This corresponds with the finding that several generalist predators (e.g., rockfishes) are associated with high sponge cover reefs. Our results are not consistent with previous reports that increasing foundation species abundance decreases connectance in food webs. We propose that the influence of foundation species on food web topology may be dependent on palatability, and therefore relative trophic importance, of the foundation species. Finally, our findings have important implications for sponge reef conservation and management, as they suggest that reefs below the 10% sponge cover threshold support different communities than high live sponge cover reefs.
Introduction
Foundation species are spatially dominant species whose physical structure creates habitat for associated taxa, supporting more diverse and abundant communities with complex food webs (Bruno and Bertness, 2001; Altieri and van de Koppel, 2014). This effect is commonly attributed to non-trophic mechanisms, such as habitat provisioning and positive indirect interactions, centered around alleviation of abiotic stress (e.g., wave attenuation, Bruno et al., 2003). Recent work has suggested that a foundation species’ trophic interactions are relatively unimportant when compared to their non-trophic impacts on community structure and food web network dynamics (Baiser et al., 2013; van der Zee et al., 2016; Borst et al., 2018). Many of these studies were either correlative or theoretical papers that assumed that the foundation species was unpalatable to or not consumed by most community members. An experimental study that used habitat mimics to separate the importance of trophic and non-trophic interactions found that both types of interactions were important for structuring communities (Borst et al., 2019). Consequently, the importance of foundation species’ trophic interactions in structuring food webs is unclear.
In the deeper parts of the ocean, beyond the photic zone, food limitation is a strong driver of biodiversity and community structure (Smith et al., 2008). Food energy arrives in the form of detrital inputs (Smith et al., 2001, 2008; Bernardino et al., 2010), and the long-term energetic demand of benthic communities outstrips the supply of surface water production (Smith and Kaufmann, 1999). Despite the general rule of food limitation in deep-water systems, large productive ecosystems formed by foundation species, such as cold-water coral and sponge reefs, exist throughout the world (Carlier et al., 2009; Beazley et al., 2013; Maldonado et al., 2016; Hawkes et al., 2019). For example, glass sponge reefs are a deep-water ecosystem in the shelf waters of the Northeast Pacific, from the Canada-Alaska border south through the Salish Sea (Stone et al., 2014; Dunham et al., 2018a; Shaw et al., 2018). Since the discovery of glass sponge reefs in the late 1980’s (Conway et al., 1991), several studies have documented the diverse and abundant consumer communities associated with reefs throughout their geographic range (Cook et al., 2008; Chu and Leys, 2010; Dunham et al., 2015, 2018a; Law, 2018). The glass sponges that form these reefs efficiently capture large amounts of carbon from the water column (Kahn et al., 2015; Dunham et al., 2018a), potentially acting as an important base for the food web.
Sponges are not traditionally considered a high-quality food source because of their spicules, low nutritional content (Barthel, 1995), and propensity to produce (or harbor bacteria that produce) toxic or difficult-to-digest chemicals (Pawlik et al., 1995). However, a variety of animals in many systems consume sponges. For example, asteroids, dorid nudibranchs, several species of fish, sea turtles, and cidarid urchins have all been documented to consume sponges regularly throughout the world’s oceans (Mauzey et al., 1968; Randall and Hartman, 1968; Dayton et al., 1974; Faulkner and Ghiselin, 1983; Meylan, 1988; Wulff, 1995; Bo et al., 2012; Chu and Leys, 2012; Gale et al., 2013). In the few systems where researchers have investigated the role of sponges within a larger food web, sponges were shown to form a critical link between the water column and the benthic food web, concentrating energy and nutrients and likely allowing for a more abundant consumer community (de Goeij et al., 2013). For example, sponges play a pivotal role in the food web of McMurdo Sound in Antarctica, where they are consumed by a wide range of mollusks and asteroids (Dayton, 1972; Dayton et al., 1974; McClintock et al., 2005). Sponges’ benthic-pelagic coupling and widespread consumption suggest that both trophic and non-trophic interactions of habitat-forming sponges may be critical in shaping food webs.
By representing food webs as networks, we can calculate the relative importance of taxa within a web (McCann et al., 2017). Additionally, we can evaluate network topology using several metrics correlated with network complexity, stability, and function (Albert and Barabási, 2002; Dunne et al., 2002; Layman et al., 2015). For example, the clustering coefficient (a measure of how many sets of closely interacting species are present) can provide insight into the prevalence of tightly connected, and likely strongly interacting, groups of species in the food web (Watts and Strogatz, 1998; Delmas et al., 2019). Network-based approaches that incorporate interaction strength can shed even more light on the stability of food webs (Nilsson and McCann, 2015). When information regarding interaction strength is unknown, as is the case for many deep-water food webs, simple network topology-based metrics provide a starting point from which to ask questions regarding the influence of foundation species on food web structure (Poisot and Gravel, 2014; van der Zee et al., 2016; Delmas et al., 2019). Many network metrics, such as how well-connected species are within the food web, correlate strongly with the distribution of interaction strengths (O’Gorman et al., 2010). Consequently, their use allows us to speculate on interaction strengths in systems where direct measurement is difficult.
Here we hypothesize that reef-building sponges play an important role in reef food webs. We predict that sponges will have high relative importance within reef food webs and that many common consumers on sponge reefs utilize sponges as a direct food source. Further, we predict that this will be evident through changes in food web topology and community structure that correlate with live reef-building sponge abundance (as measured by percent cover).
Materials and Methods
Site Descriptions
Data used in this study come from 19 sponge reef complexes in the Salish Sea (Strait of Georgia and Howe Sound; Dunham et al., 2018a) and one reef complex in Hecate Strait (Figure 1; Law, 2018). Sponge reef complexes are clusters of neighboring reefs and the delineation and naming of complexes follows those put forward by Conway et al. (2005) and expanded on by Cook et al. (2008) and Dunham et al. (2018a). The reefs are formed by three species of sponges from the subclass Hexasterophora: Aphrocallistes vastus (Schulze, 1887), Farrea occa (Bowerbank, 1862), and Heterochone calyx (Schulze, 1887) although many other species of sponges (both Hexactinellids and Demosponges) are present within the reefs. Farrea occa is not present on the reefs in the Salish Sea. The reefs included in this study occur at depths of 22–230 m (72 m ± 44, mean ± SD). Although several reefs are shallow enough to potentially receive direct energetic inputs from photosynthesizing species, no evidence of benthic primary productivity has been documented in these systems. Further descriptions of the reefs can be found in Dunham et al. (2018a) and Law (2018), and the references therein.
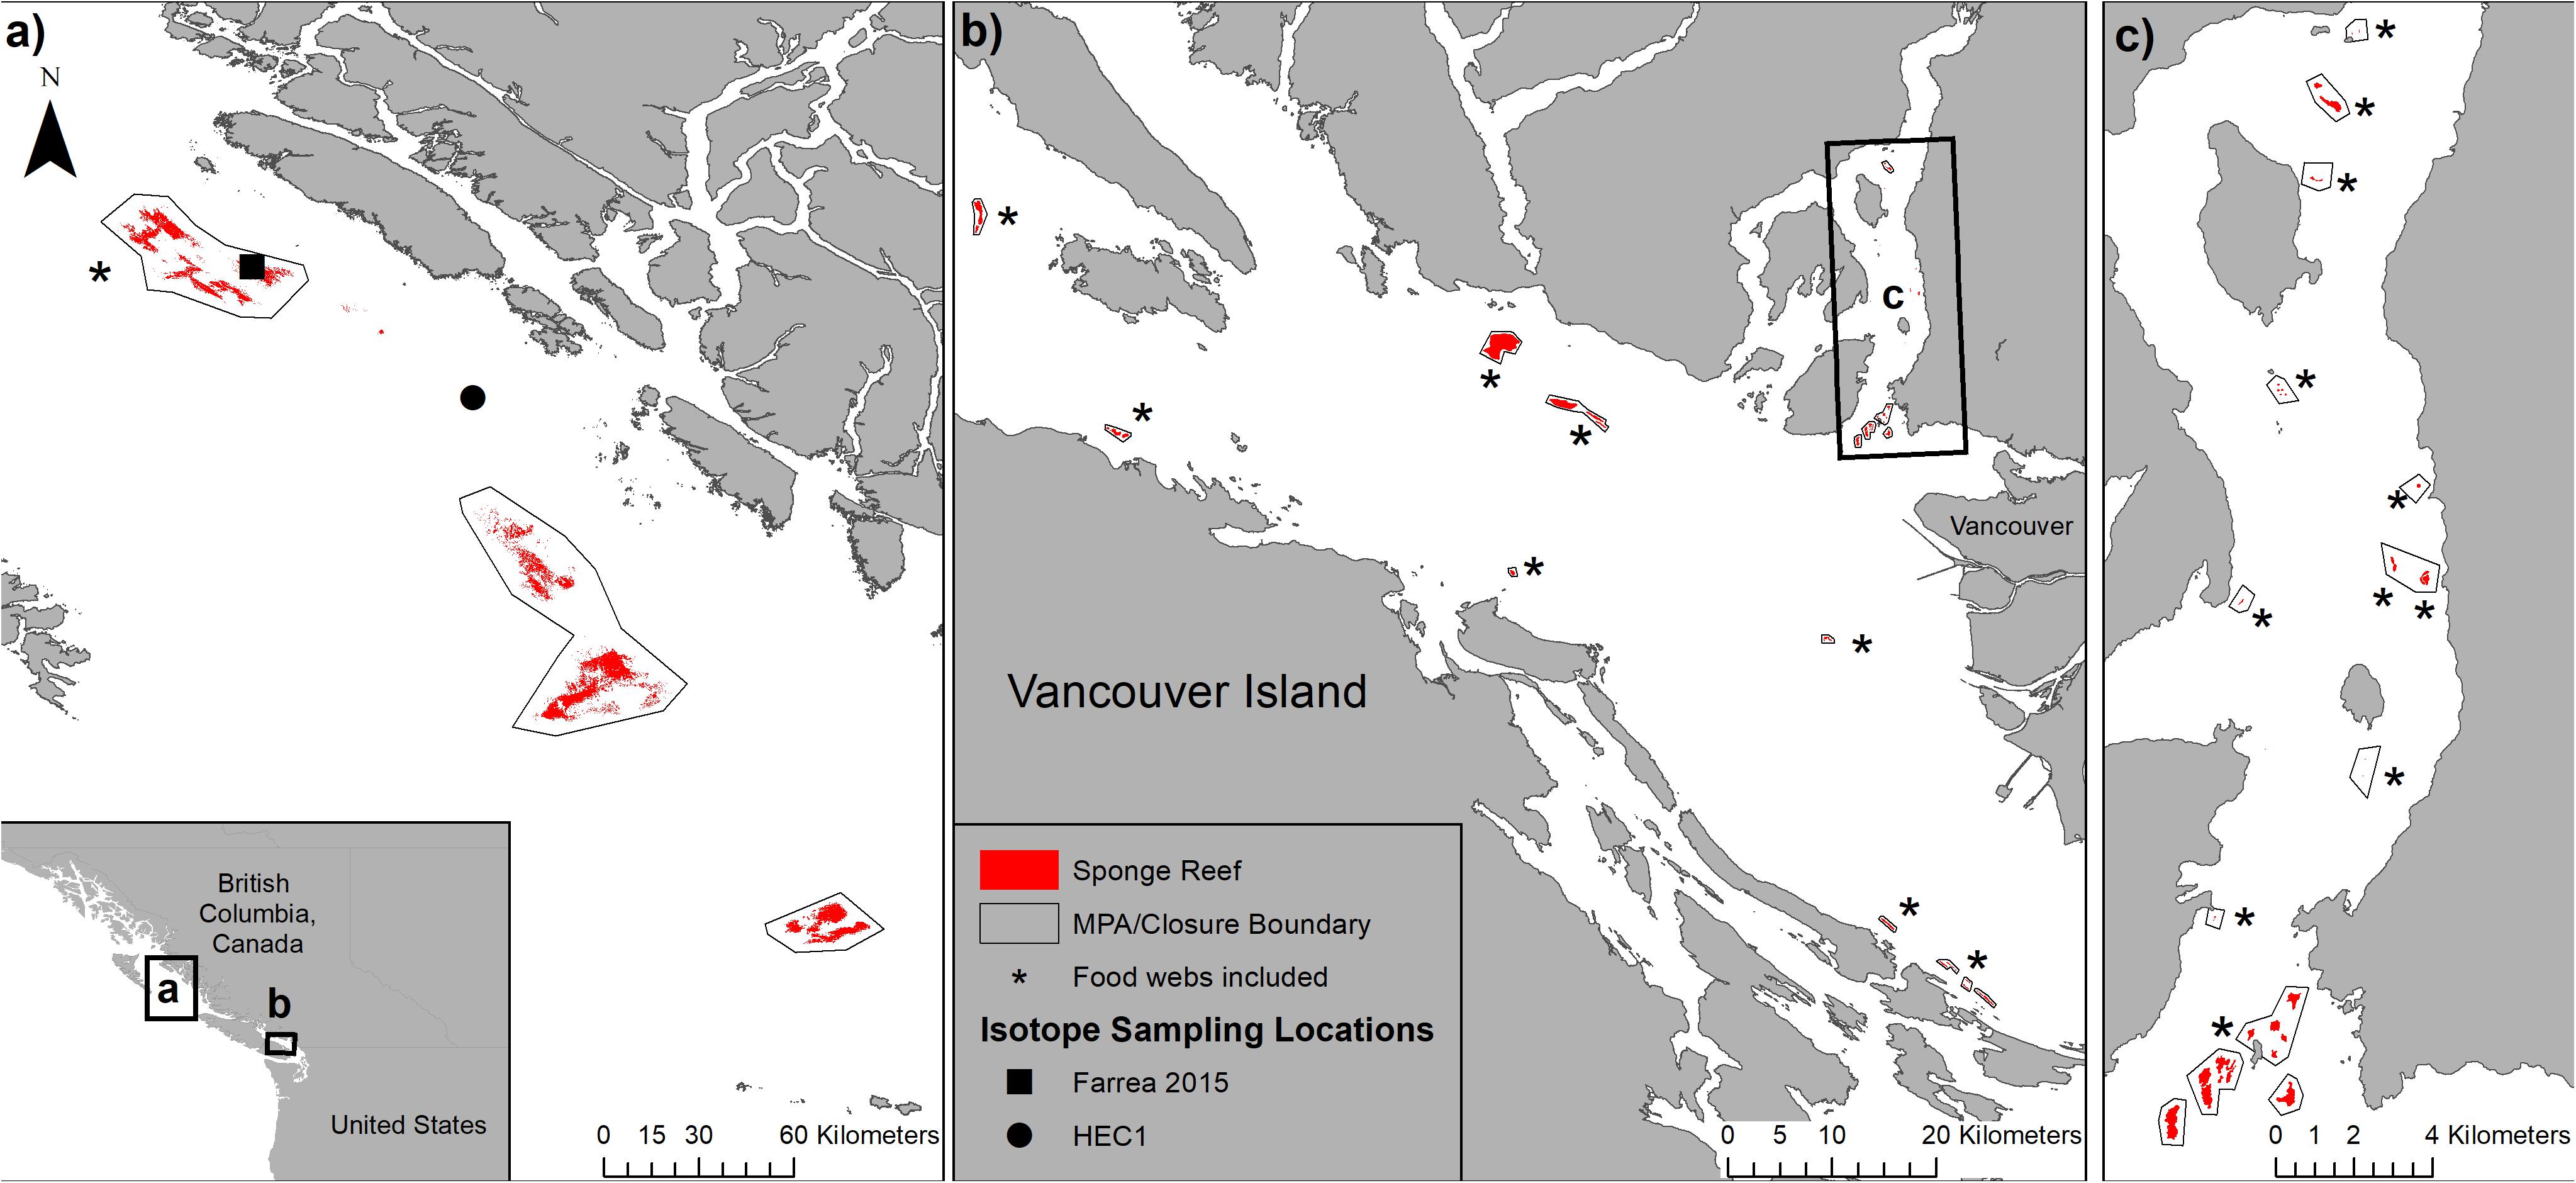
Figure 1. Location of the sponge reefs and sampling sites: (a) Hecate Strait and Queen Charlotte sound glass sponge reefs marine protected area, (b) Strait of Georgia sponge reefs, and (c) sponge reefs in Howe Sound. Food webs from sponge reef complexes marked with an * were included in this study. Samples for stomach content analysis and stable isotopes were collected from Farrea 2015 and HEC1 within the Northern Sponge Reef complex within Hecate Strait.
Animal Collection, Stable Isotopes, and Stomach Content Analysis
Species collected for stomach content and stable isotope analysis were determined based on previously published data—all consumer species collected were previously reported to be strongly associated with or indicator species of areas of live sponge cover (Chu and Leys, 2012; Dunham et al., 2018b). All sponge, consumer, zooplankton, and sediment samples were collected on a research cruise conducted 9–23 May 2017, onboard the CCGS John P. Tully in the Hecate Strait, and Queen Charlotte Sound Glass Sponge Reefs Marine Protected Area (HSQCS-MPA) using the remotely operated vehicle (ROV) ROPOS. The three sponge reef complexes protected within the HSQCS-MPA cover over 380 km2 of the seafloor (Figure 1a). All samples were collected within or near the northern reef complex, with all but the marine snow samples collected at the Farrea 2015 site (Figure 1a). All applicable institutional and national guidelines for the care and use of animals were followed.
Sediment and Animal Sample Collection and Processing
Sediment organic matter (SOM) was collected from cores (7.6 cm diameter, 60 cm depth, n = 13) taken within the HSQCS sponge reef by ROPOS; two 2 mL aliquots were collected from the top 2 cm of each core. Aliquots were immediately frozen at −20°C. Zooplankton samples (n = 10) were collected from within the sponge reef by running a “suction sampler” with a 4 cm diameter hose for 5–10 min into a collection jar outfitted with 64 μm Nitex mesh; all zooplankton collected during this period were pooled for isotope analysis. Pieces of glass sponges, A. vastus (n = 11), F. occa (n = 10), H. calyx (n = 10), and demosponges Desmacella spp. (n = 5), as well as several species of consumers including two asteroid species Ceramaster patagonicus (n = 6) and Henricia sp. (n = 5), the decorator crab Chorilia longipes (n = 5), squat lobsters Munida quadrispina (n = 12), and the dorid nudibranch Peltodoris lentiginosa (n = 6), were collected using either the ROPOS manipulator arm or suction sampler. Spot prawns, Pandalus platyceros (n = 16), were collected using Fukui traps (Model FT-100) baited with a punctured can of cat food (Wellness Complete Health Chicken PateTM, WellPet, Tewksbury, MA, United States) deployed by ROPOS within the reef for 20 h. Sponge samples were retrieved from the ROV, rinsed in deionized (DI) water, wrapped in pre-combusted aluminum foil, and frozen at −20°C. Zooplankton samples were retrieved from the suction sampler jars and emptied onto a 64 μm filter, rinsed in DI water, wrapped in pre-combusted aluminum foil, and frozen at −20°C. All consumers were euthanized and their stomachs (or digestive tracts in the case of asteroids) were removed; stomachs were preserved separately in 70% ethanol. Remaining tissues were rinsed in DI water, wrapped in pre-combusted aluminum foil, and frozen at −20°C.
After the research cruise, all samples were transported to the Pacific Biological Station, Nanaimo, British Columbia (BC), where they were thawed and appropriate tissue was selected and dried at 50°C for 48–72 h. Entire samples for both sponges and zooplankton were dried. Muscle tissue from squat lobsters, spot prawns, and decorator crabs, podia from the two asteroid species, and the foot muscle from nudibranchs were removed and dried. Zooplankton and asteroid samples were acidified to remove calcium skeletons before δ13C analysis. All samples were ground and analyzed for δ13C and δ15N by the G. G. Hatch Stable Isotope Laboratory at the University of Ottawa. Carbon and nitrogen isotope values were determined using a Delta Advantage isotope ratio mass spectrometer with a Vario EL Cube elemental analyzer in line. δ13C and δ15N were reported relative to the Vienna Peedee Belemnite Standard (± 0.2‰) and air (± 0.3‰), respectively.
Marine Snow Collection and Processing
Three Baker-style, cylindrical sediment traps were moored at 50 m depth in southeastern Hecate Strait, at site HEC1 (Figure 1a), from July 2013 to July 2016. Each trap contained a carousel of 10 collection cups, with each cup set to collect for 11.5–12 days (Johannessen et al., 2019). The collection cups were filled with a brine and mercuric chloride solution (S = 38–40, [HgCl2] = 1 mg mL–1) before deployment to preserve the samples. The three traps were set to operate sequentially so that together they collected a continuous record of sinking particles for nearly a year during each deployment (334, 336, and 334 days). Currents at trap depth were < 20 cm s–1 87% of the time, implying the traps did not significantly over- or under-collect sinking particles (e.g., Gardner et al., 1997). Some data were lost due to trap failures, and some cups collected so little material that they were combined for analysis. Sediment trap samples were sieved through a 500 μm mesh to separate zooplankton from finer particles. Both portions were retained for further analysis. On return to the laboratory at the Institute of Ocean Sciences, Sidney, BC, the < 500 μm fraction was divided into and portions using a McLane Labs wet sample divider. The larger portion was analyzed for total dry mass and, where sample quantities permitted, geochemical analysis. The smaller portion was retained for taxonomic analysis of phytoplankton and enumeration of zooplankton fecal pellets. Sediment trap samples were rinsed, dried, ground, weighed, and analyzed at the University of British Columbia, Vancouver, BC. Inorganic carbon, as carbonate, was measured by coulometry on acidified samples. Total carbon and nitrogen were determined using a Carlo Erba CHN Analyzer, following Calvert and Pedersen (1995; ± 0.3%), and organic carbon was calculated as the difference between total and inorganic carbon. Stable isotopes of carbon and nitrogen were determined by VG PRISM isotope ratio mass spectrometry with a Carlo Erba CHN analyzer inline (Calvert et al., 2001). δ13C and δ15N were reported relative to the Peedee Belemnite Standard (± 0.2‰) and to air (± 0.3‰), respectively.
Stomach Content Analysis
The stomachs of all consumers were examined for the presence of sponge spicules. Stomach contents were first examined under a dissecting scope; in several cases, large pieces of reef-building sponge tissue and spicules were visible. In these cases, the animals were recorded as sponge consumers, and no further analysis was undertaken. In cases where sponge tissue was not visible under the dissecting scope, the stomach contents were dissolved in bleach for 72 h. After this period the supernatant was removed and the remaining contents were rinsed four to five times with DI water. Rinsing involved the addition of water, agitation of the remaining material, and a 24-h settlement period, after which time the supernatant was again removed. Any remaining material after the final rinse was placed onto glass microscope slides and examined for the presence of reef-building sponge spicules. When possible, other identifiable contents (e.g., demosponge spicules, spines of crab megalopae) were recorded.
Isotope Mixing Model
For all consumers, the sponge species (A. vastus, F. occa, H. calyx, and Desmacella spp.), water-column particulate organic matter (POM) or marine snow, SOM, and zooplankton were included as potential food sources (Figure 2). The proportion of potential sources in the diet of each consumer was estimated via a Bayesian mixing model using the simmr package (Parnell et al., 2013; Parnell, 2020) in R 3.5.0 (R Core Team, 2019). The model was run for 1 × 10⁶ iterations with a burn-in period of 1 × 10³ iterations and a thinning rate of 100. Model convergence was evaluated using the Brooks–Gelman–Rubin convergence diagnostic and visual inspection of trace plots. The isotopic range of the sponge species largely overlapped; therefore, they were combined into a single source (sponges) after the model was run, using the combine_sources command in simmr. The sponges were combined a posteriori to preserve the covariance structure among sources (Phillips et al., 2005, 2014). Trophic enrichment factors (TEFs) are not known for the organisms in this study; therefore, for all organisms, we included TEFs of 3.4 for nitrogen and 1.3 for carbon (Post, 2002) with large standard deviations to reflect uncertainty (2.0 and 1.0, respectively).
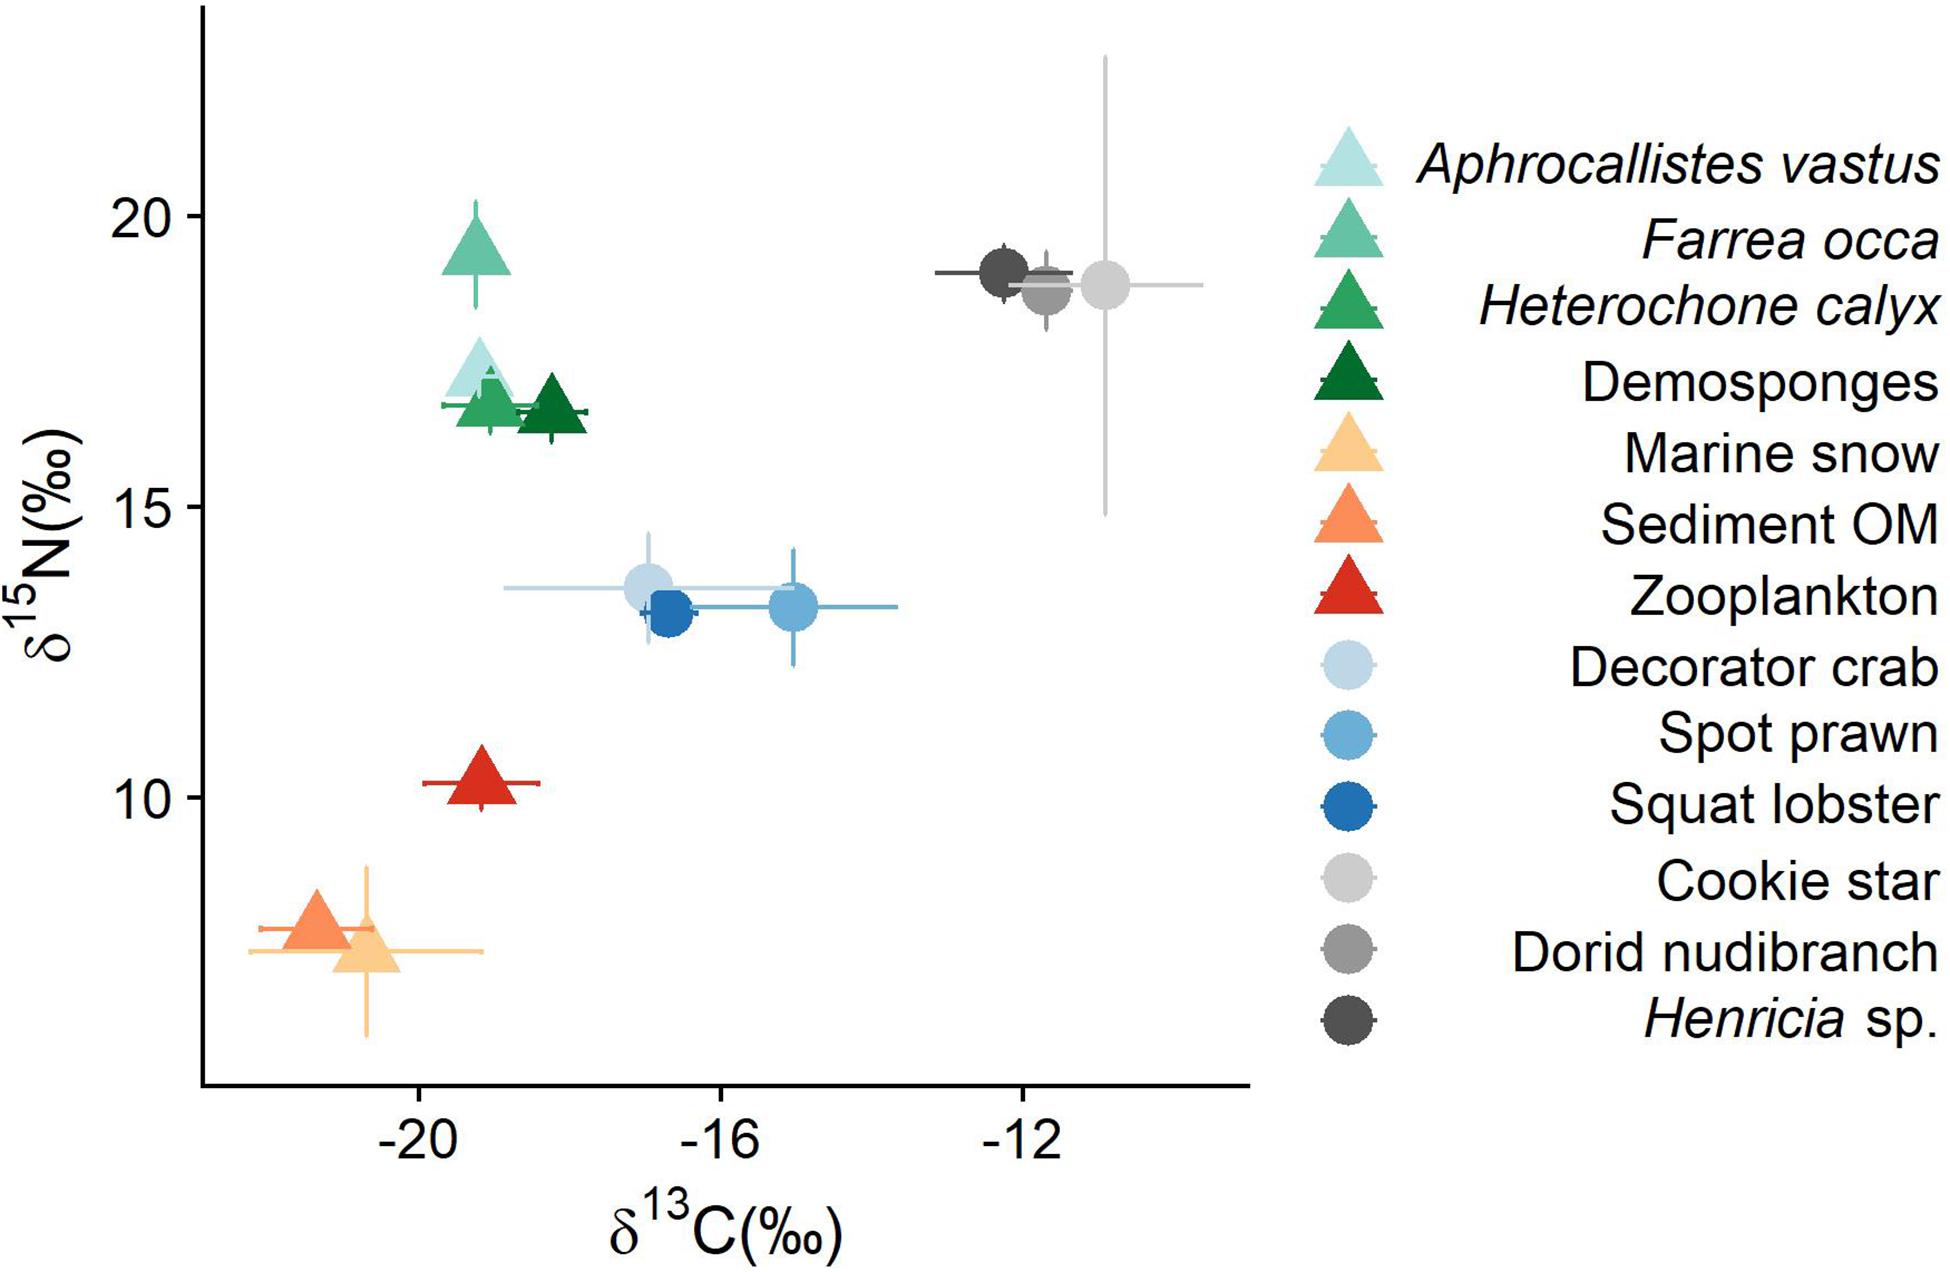
Figure 2. Isospace plot for all sources and consumers sampled in this study. Raw data can be found in Supplementary Table S6. Error bars represent standard error.
Taxa Observations and Datasets
Datasets were gathered from the analysis of video and still imagery obtained during multiple research surveys between 2011 and 2017, as well as from published descriptions of sponge reef communities (Cook et al., 2008; Chu and Leys, 2010; Dunham et al., 2015; Law, 2018). These data sources can be divided into three datasets. Dataset 1 was gathered during research surveys conducted on the 19 sponge reef complexes in the Salish Sea that were completed using Fisheries and Oceans Canada’s ROV, the Phantom (Figures 1b,c; details can be found in Dunham et al., 2018a). Dataset 2 consists of community data from the HSQCS-MPA reefs that were collected using the ROV ROPOS (ropos.com) in May 2017 (Figure 1a; details can be found in Law, 2018). Dataset 3 represents a list of taxa observed on reefs in the Salish Sea compiled from Cook et al. (2008), Chu and Leys (2010), and Dunham et al. (2015).
Food Web Model Structure
All three datasets were used to create the master and reef-specific food webs. Taxa lists were combined across time and data sources so that each reef food web contains all taxa known to have occurred on the reef. This was done due to the limited spatial coverage of most individual surveys and the difficulty in detecting taxa in highly complex habitats. No abundance data were used in food web construction. To build a master food web for the sponge reefs a list of all taxa observed at any point on any sponge reef was generated. This resulted in a total of 120 taxa. Three basal sources were added to this list: POM (or marine snow), detritus, and SOM. A master food web was generated from this list. Trophic interactions were established in three ways: (1) empirical data collected as part of this study, (2) published diet information for the taxa recorded on the reefs or closely related taxa, and (3) unpublished diet data and expert knowledge (Supplementary Table S1). The third option was used for 10 taxa and only when the first two approached yielded no trophic interactions. Cannibalism was possible in the food web models. Using the master food web taxa were combined into tropho-species, where appropriate. A tropho-species was defined as any group of two or more taxa that consume the same resources and are consumed by the same predators in this food web (Briand and Cohen, 1984; Supplementary Table S2). The master food web was reorganized to replace individual taxa with the combined tropho-species. Food webs for each of the 20 sponge reefs were created from this master food web. For each reef, a list of all taxa observed on the reef from any of the data sources described above was generated and then taxa were combined into tropho-species using the tropho-species groupings identified in the master food web. Reef-specific food webs were created by generating a subset of the master food web so that only taxa and tropho-species reported from the reef were included in the list of consumers and resources. Including the three basal resources (POM, SOM, and detritus), the average number of taxa in each reef food webs was 35 (± 10, SD) and ranged from 19 to 48. Each food web model was examined to ensure that each consumer had at least one food source identified. There were no instances where a species did not have any food sources, so no species were removed from the food web models. Lists of tropho-species present on each reef and the master dataset of trophic interactions can be found in Supplementary Tables S3, S4, respectively.
Generalized Food Web and Relative Importance of Sponges
A generalized food web was created by focusing on taxa that were either found on at least two-thirds of the reefs examined or have been identified as being strongly associated with sponge reefs in the published literature. One species, a tube-dwelling anemone, Pachycerianthus fimbriatus, was removed from this web, due to its known associations with mud habitats surrounding sponge reefs, rather than with the reefs themselves (Dunham et al., 2018b). Using this generalized food web, the relative importance of each taxon/tropho-species was calculated using the index proposed by McCann et al. (2017). Briefly, this index combines four metrics (1) the number of incoming links per node, (2) the number of outgoing links per node, (3) how many paths pass through each node, and (4) the uniqueness of each node into a single value that captures how important each node is in the overall structure of the food web. How many paths pass through each node was calculated using the betweenness centrality index (Freeman, 1978; Brandes, 2001). The uniqueness of a node was calculated using the concept of regular equivalence (Lai et al., 2012). For two nodes to be regularly equivalent, they do not have to eat (or be eaten by) the same taxa, they simply need to eat and be eaten by taxa at the same trophic level. For example, two herbivores that are eaten by secondary consumers are regularly equivalent, regardless of the identity of their predators or their food sources. Consequently, a node is unique if it does not have the same trophic position as any other node within the network. The four metrics of trophic importance were combined into a final composite index by first calculating a z-score for each index, and then averaging the z-scores for each taxon/tropho-species. The relative importance of sponges was evaluated in all 20 food web models and the generalized food web using this index, as well as through an isotope mixing model based on samples collected at the Hecate Strait sponge reef in May of 2017 (see above).
Network Analysis
Seven metrics of network topology were calculated for each reef: (1) connectance (C), (2) median Out-Degree, (3) variance of Out-Degree, (4) median In-Degree, (5) variance of In-Degree, (6) clustering coefficient (Cl), and (7) trophic coherence (q; Table 1). Connectance—a measure of network complexity—was re-scaled to ensure that values were comparable among reefs despite differing numbers of species in the food webs (Poisot and Gravel, 2014; Delmas et al., 2019). A node’s degree—the number of links connected to that node—was divided into two components: the number of links coming into the node (In-Degree; the number of sources) and the number of links leaving the node (Out-Degree; the number of predators). We included the central tendency and variance of these two properties to examine how patterns of trophic generalization may change across reefs. The clustering coefficient—a measure of how many sets of closely interacting species there are—was calculated by ignoring the directionality of the links between taxa. Trophic coherence relates to how well species fall into trophic levels and has been linked to stability in food webs—food webs that can be organized into distinct trophic levels are more stable (Johnson et al., 2014). Because most of these metrics are correlated to some degree with connectance or with the size of the network (i.e., the number of species), we took steps to standardize them before comparison with live sponge cover (Table 1). All networks were generated, and metrics calculated, in R (R Core Team, 2019) using iGraph (Csardi and Nepusz, 2006) and multi-web (Saravia, 2019).
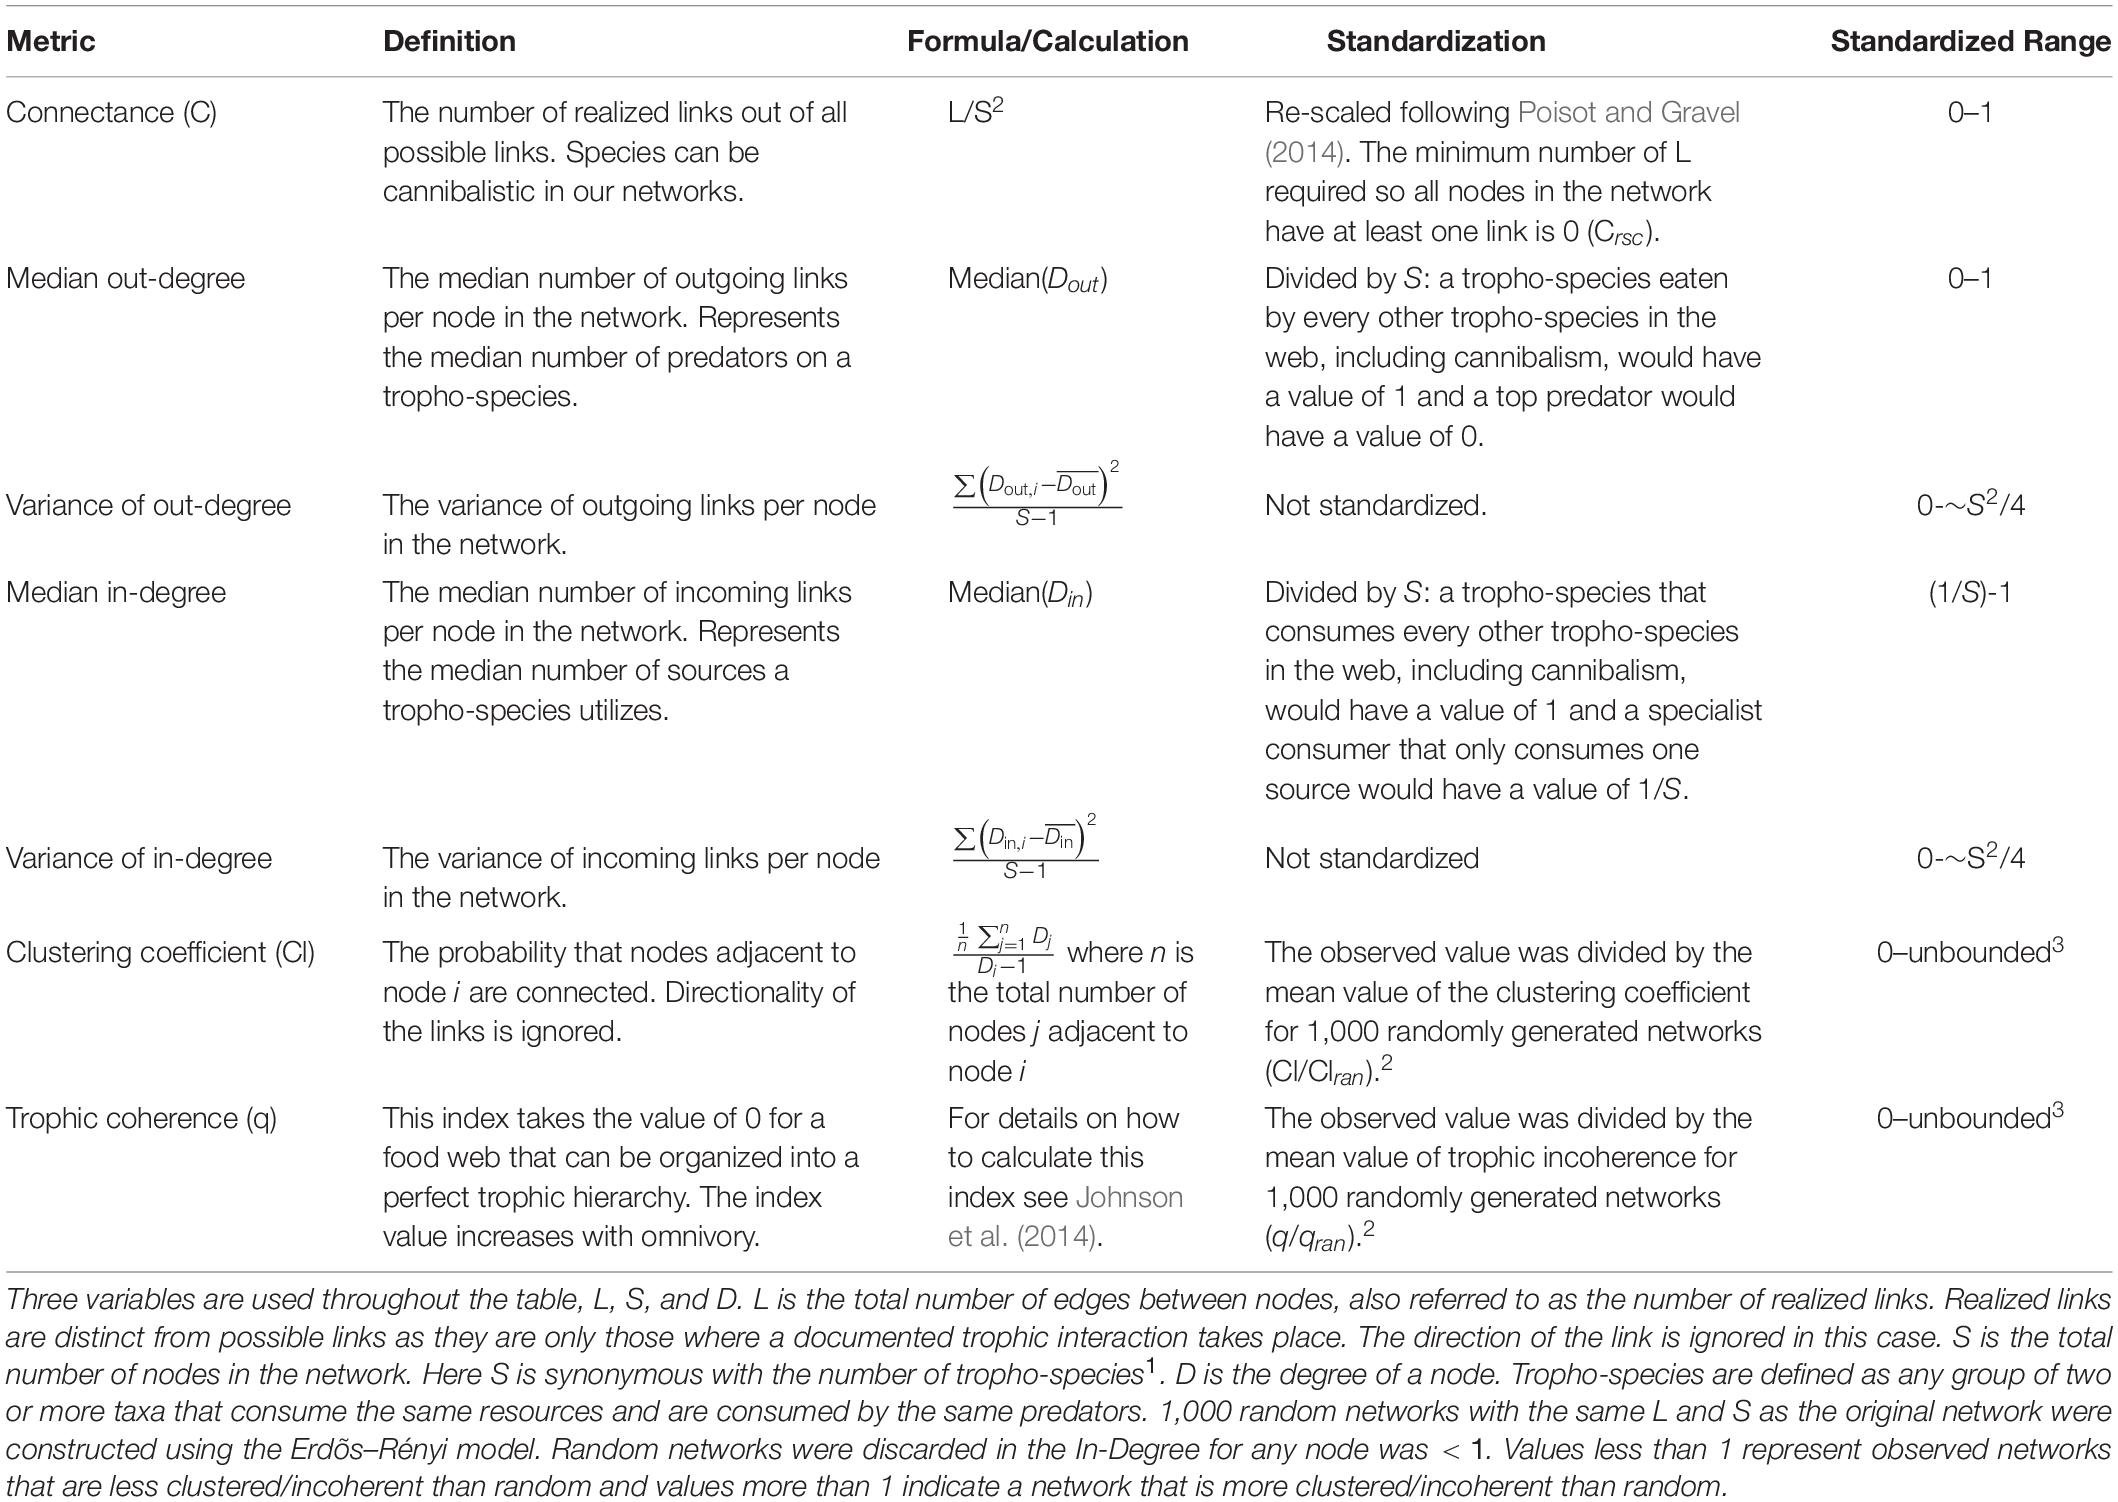
Table 1. Metrics used to evaluate network topology, their definition, formula, and the standardization applied to reduce correlation with food web size.
Initially, all network metrics were visually examined for a relationship with live sponge abundance measured as the percent cover of live reef-building sponges (hereinafter PSC). Percent cover of live reef-building sponges was calculated following Dunham et al. (2018a). Briefly, PSC was calculated from still images taken during the ROV transects described in Dunham et al. (2018a) and Law (2018). The PSC for a reef was calculated as the average PSC of all images taken while the ROV was within the reef’s boundaries. A reef’s boundaries were defined a priori, based on the geological signature of the reef (see Conway et al., 2005 for more information on defining reefs using geological signatures). Sponge reefs included in this study currently range from 0.11 to 17.5% live sponge cover (7.49 ± 6.21, mean ± SD, Supplementary Table S5). For many of the metrics, there was a strong non-linear pattern suggesting a threshold response at mid-range values of PSC. Consequently, each index was tested for a relationship with PSC using first a linear regression followed by a piecewise linear regression using the segment package in R (Muggeo, 2008). If a change point was identified, its significance was evaluated using the Davies test (Davies, 1987) to test for non-zero difference in slopes. If the change point was significant, results from the piecewise regression are discussed; otherwise, results from the simple linear regression are presented.
Community Analysis
Community analysis was done using only dataset 1. This was done because abundances were used in this analysis; restricting the datasets allowed us to ensure continuity in survey design, video annotation, and data quality control. For this same reason, squat lobsters (M. quadrispina) were excluded, as the methods used to assess their abundance was not consistent across reefs. Finally, reef-building sponges were also excluded from this analysis, as the goal of the analysis was to identify shifts in community structure associated with a gradient of percent sponge cover at the reef-level. Taxa were not combined into tropho-species for this analysis. Using dataset 1, individual transects (n = 98) were considered the sampling unit. The community dataset was then examined for the presence of a community threshold associated with PSC using Threshold Indicator Taxa Analysis (TITAN; Baker and King, 2010). This method combines change point analysis with indicator species analysis (Dufrêne and Legendre, 1997) to search iteratively for a change point that maximizes the sum of the standardized indicator values of individual taxa. The purity and reliability of individual species were assessed using a bootstrap approach. Pure species are those that consistently respond in the same direction (positive or negative) across bootstrap iterations. Reliable species are those whose indicator species value is consistently equal or larger than expected from random permutations of the data. The bootstrap iterations were also used to generate empirical quantiles surrounding the change point estimates. Only pure and reliable species were used to estimate the community level threshold.
Results
Stomach Content Analysis
Spicules from both reef-building sponges and demosponges were found in at least one stomach for each species. The percent of stomachs containing reef-building sponge spicules ranged from 43% in squat lobsters (n = 12) to 100% in Henricia sp. (n = 5) and dorid nudibranchs (n = 6). For most consumers, reef-building sponges were found in > 50% of stomachs [cookie sea stars (n = 6): 67%, decorator crabs (n = 5): 80%, and spot prawns (n = 16): 57%]. Fewer stomachs contained demosponge spicules, with the percent of stomachs for individual consumer groups ranging from 17% (cookie sea stars and dorid nudibranchs) to 100% (decorator crabs and squat lobsters). Demosponge spicules were found in 40% of Henricia sp. and 86% of spot prawn stomachs. In addition to sponges, consumer’s stomachs contained algal detritus, polychaetes, zooplankton, unidentified crustacean, and other animal remains (Table 2). The stomach contents of the two asteroids, cookie sea stars, and Henricia sp., were too fully digested to identify any other remains visually.
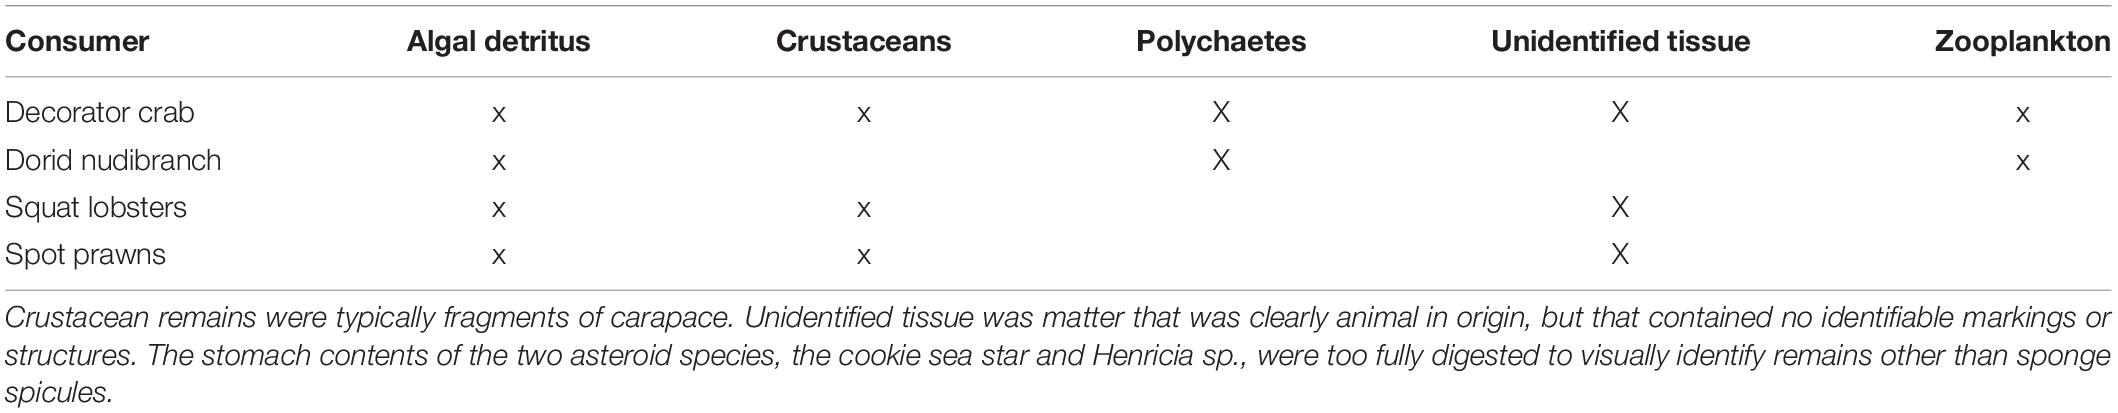
Table 2. Food items other than sponge spicules found in consumer stomachs.
Isotope Values
Consumers fell into two groups (Figure 2): generalist feeders (decorator crabs, squat lobsters, and spot prawns) and the more dedicated sponge feeders (cookie sea stars, Henricia sp., and dorid nudibranchs). Both the sponges and the sponge feeders had relatively high δ15N values, which range from 16.62 ± 0.52 (mean ± SD, demosponges) to 19.34 ± 0.92 (F. occa). There was a wide range in δ13C values; detritus in various forms were the most depleted and the sponge feeders were the most enriched (Figure 2 and Supplementary Table S6). The enriched carbon values of sponge feeders suggests either other unsampled dietary sources or larger than assumed TEFs.
Isotope Mixing Model
Models for all consumers converged (Supplementary Figures S1–S6). Consistent with stomach contents results, the results of the mixing model suggest that sponges represent between 0.2 (0.09–0.57 95% CI, squat lobsters) and 0.77 (0.34–0.94, dorid nudibranchs, Figure 3) of the total proportion of consumers’ diets. The probability that sponges make up the largest proportion of the diet varies among consumers (0.11 for spot prawns to 0.95 for dorid nudibranchs). For four consumers, sponges are likely to make up the largest proportion of the diet of any potential source evaluated by this model: cookie sea stars (probability [sponges > any other single source] = 0.91), decorator crabs (p = 0.61), Henricia sp. (p = 0.95), and dorid nudibranchs (p = 0.95). Of the sources evaluated, zooplankton was the source most probable to comprise the largest proportion of spot prawns’ diet (p = 0.43), and POM was the source most likely consumed by squat lobsters (p = 0.56, Figure 3).
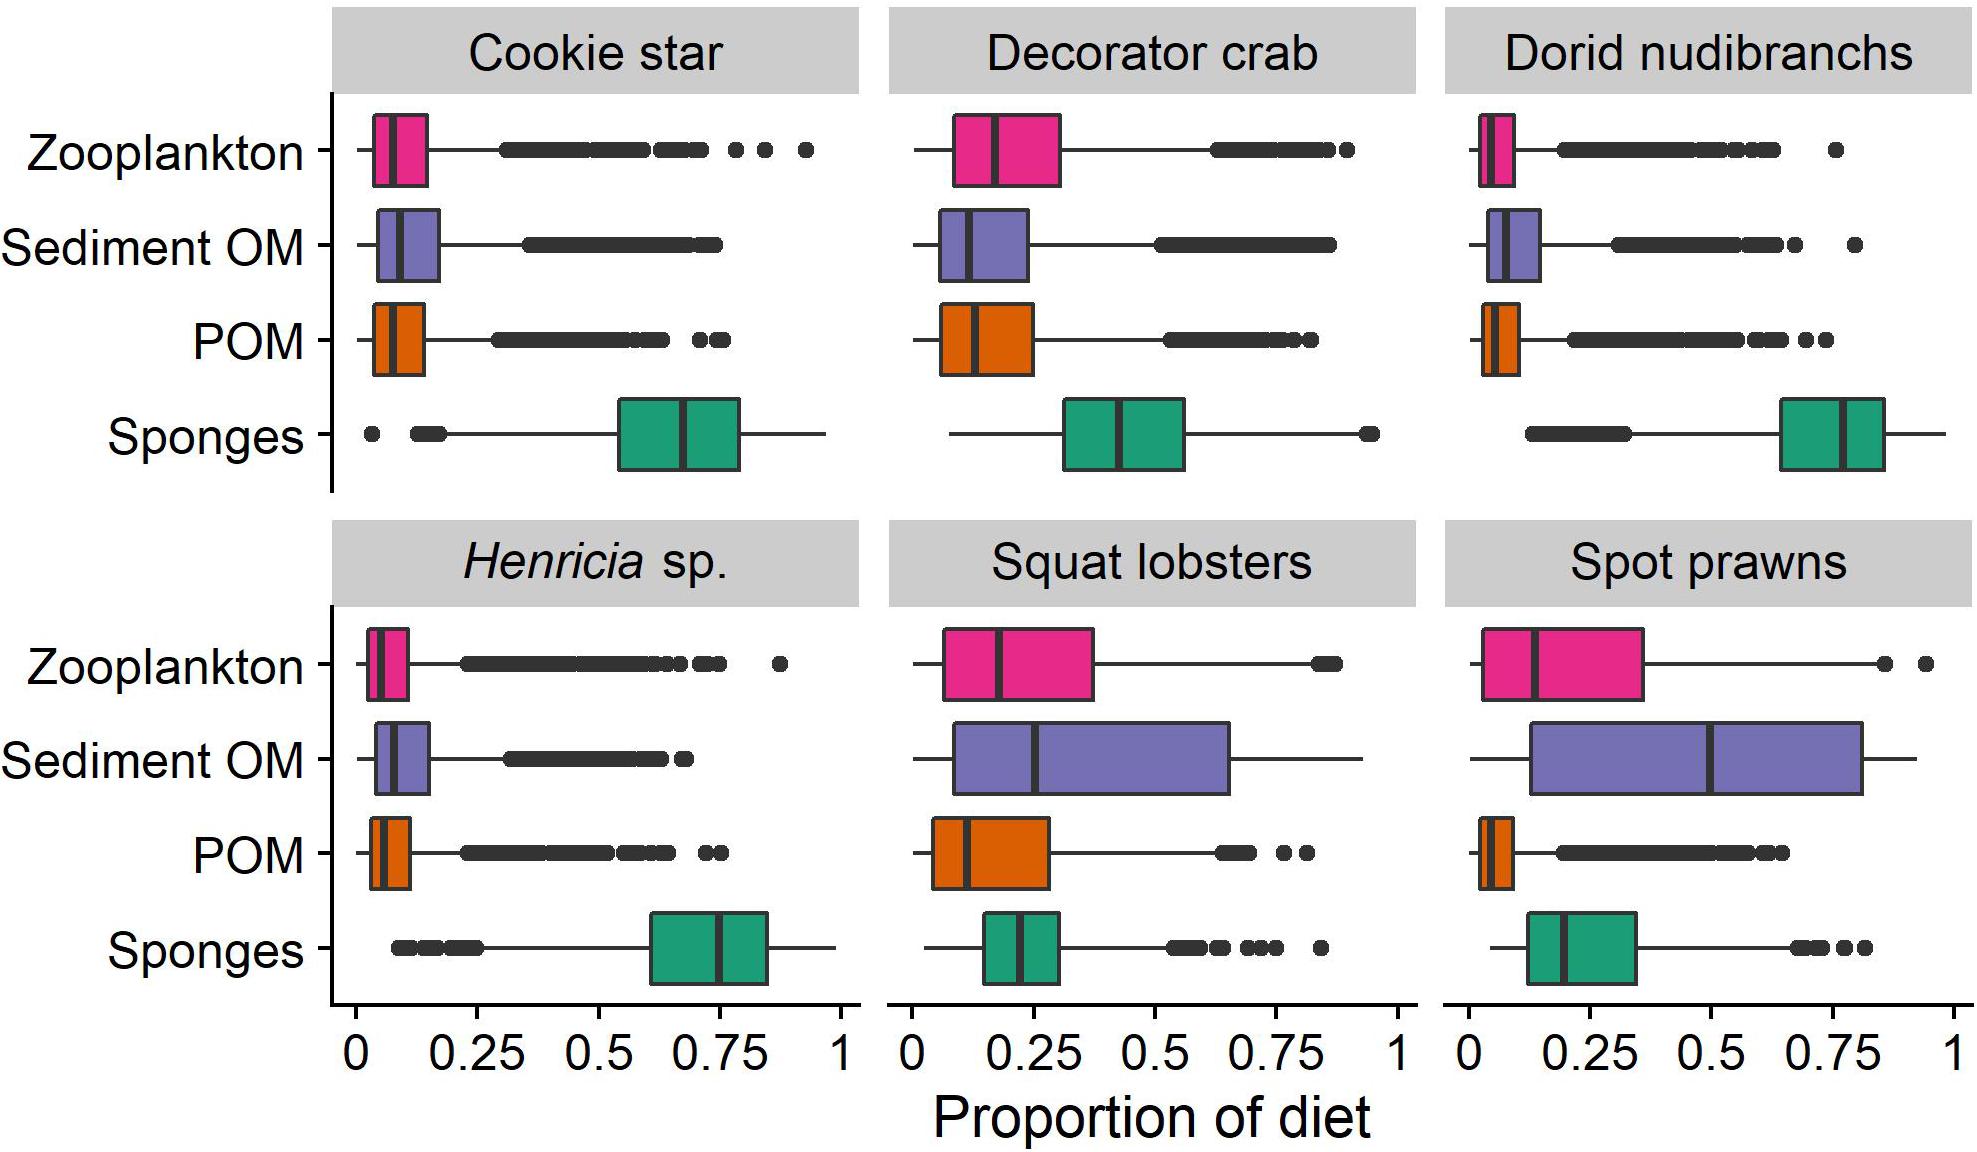
Figure 3. Results of the stable isotope mixing model. Values represent the estimated proportion of each source in the diet of each consumer.
Generalized Food Web
The generalized sponge reef food web contains 18 trophic nodes (Figure 4). Several nodes in the generalized food web represent tropho-species. When this is the case these tropho-species have been given descriptive names (e.g., Shrimps). Large and small rockfish represent tropho-species and were given names based on the relative adult size of the species in the tropho-species group. Tropho-species groupings can be found in Supplementary Table S2. Nodes vary widely in their relative importance (as defined by McCann et al., 2017, see section “Materials and Methods”). Zooplankton has the highest relative importance (25.65), followed by sponges (21.32). Hydroids (−0.63) and small rockfish (0.95) have the lowest relative importance. Large rockfish consume the largest number of sources, while zooplankton and sponges are consumed by most predators. More pathways travel through the zooplankton node than through any other node (other than POM). After zooplankton, the sponge node has the most paths traveling through it. The decorator crab, C. longipes, was the most unique node, followed closely by sponges, and then by unidentified shrimps. Sponges were one of the most important taxa on all 20 sponge reefs in this study (rank ranged from 3 to 14; median rank: 3.4). When considering only taxa that occurred on more than one reef, sponges were, on average, the 3rd most important taxa in reef food web models behind zooplankton (most important) and polychaetes (2nd).
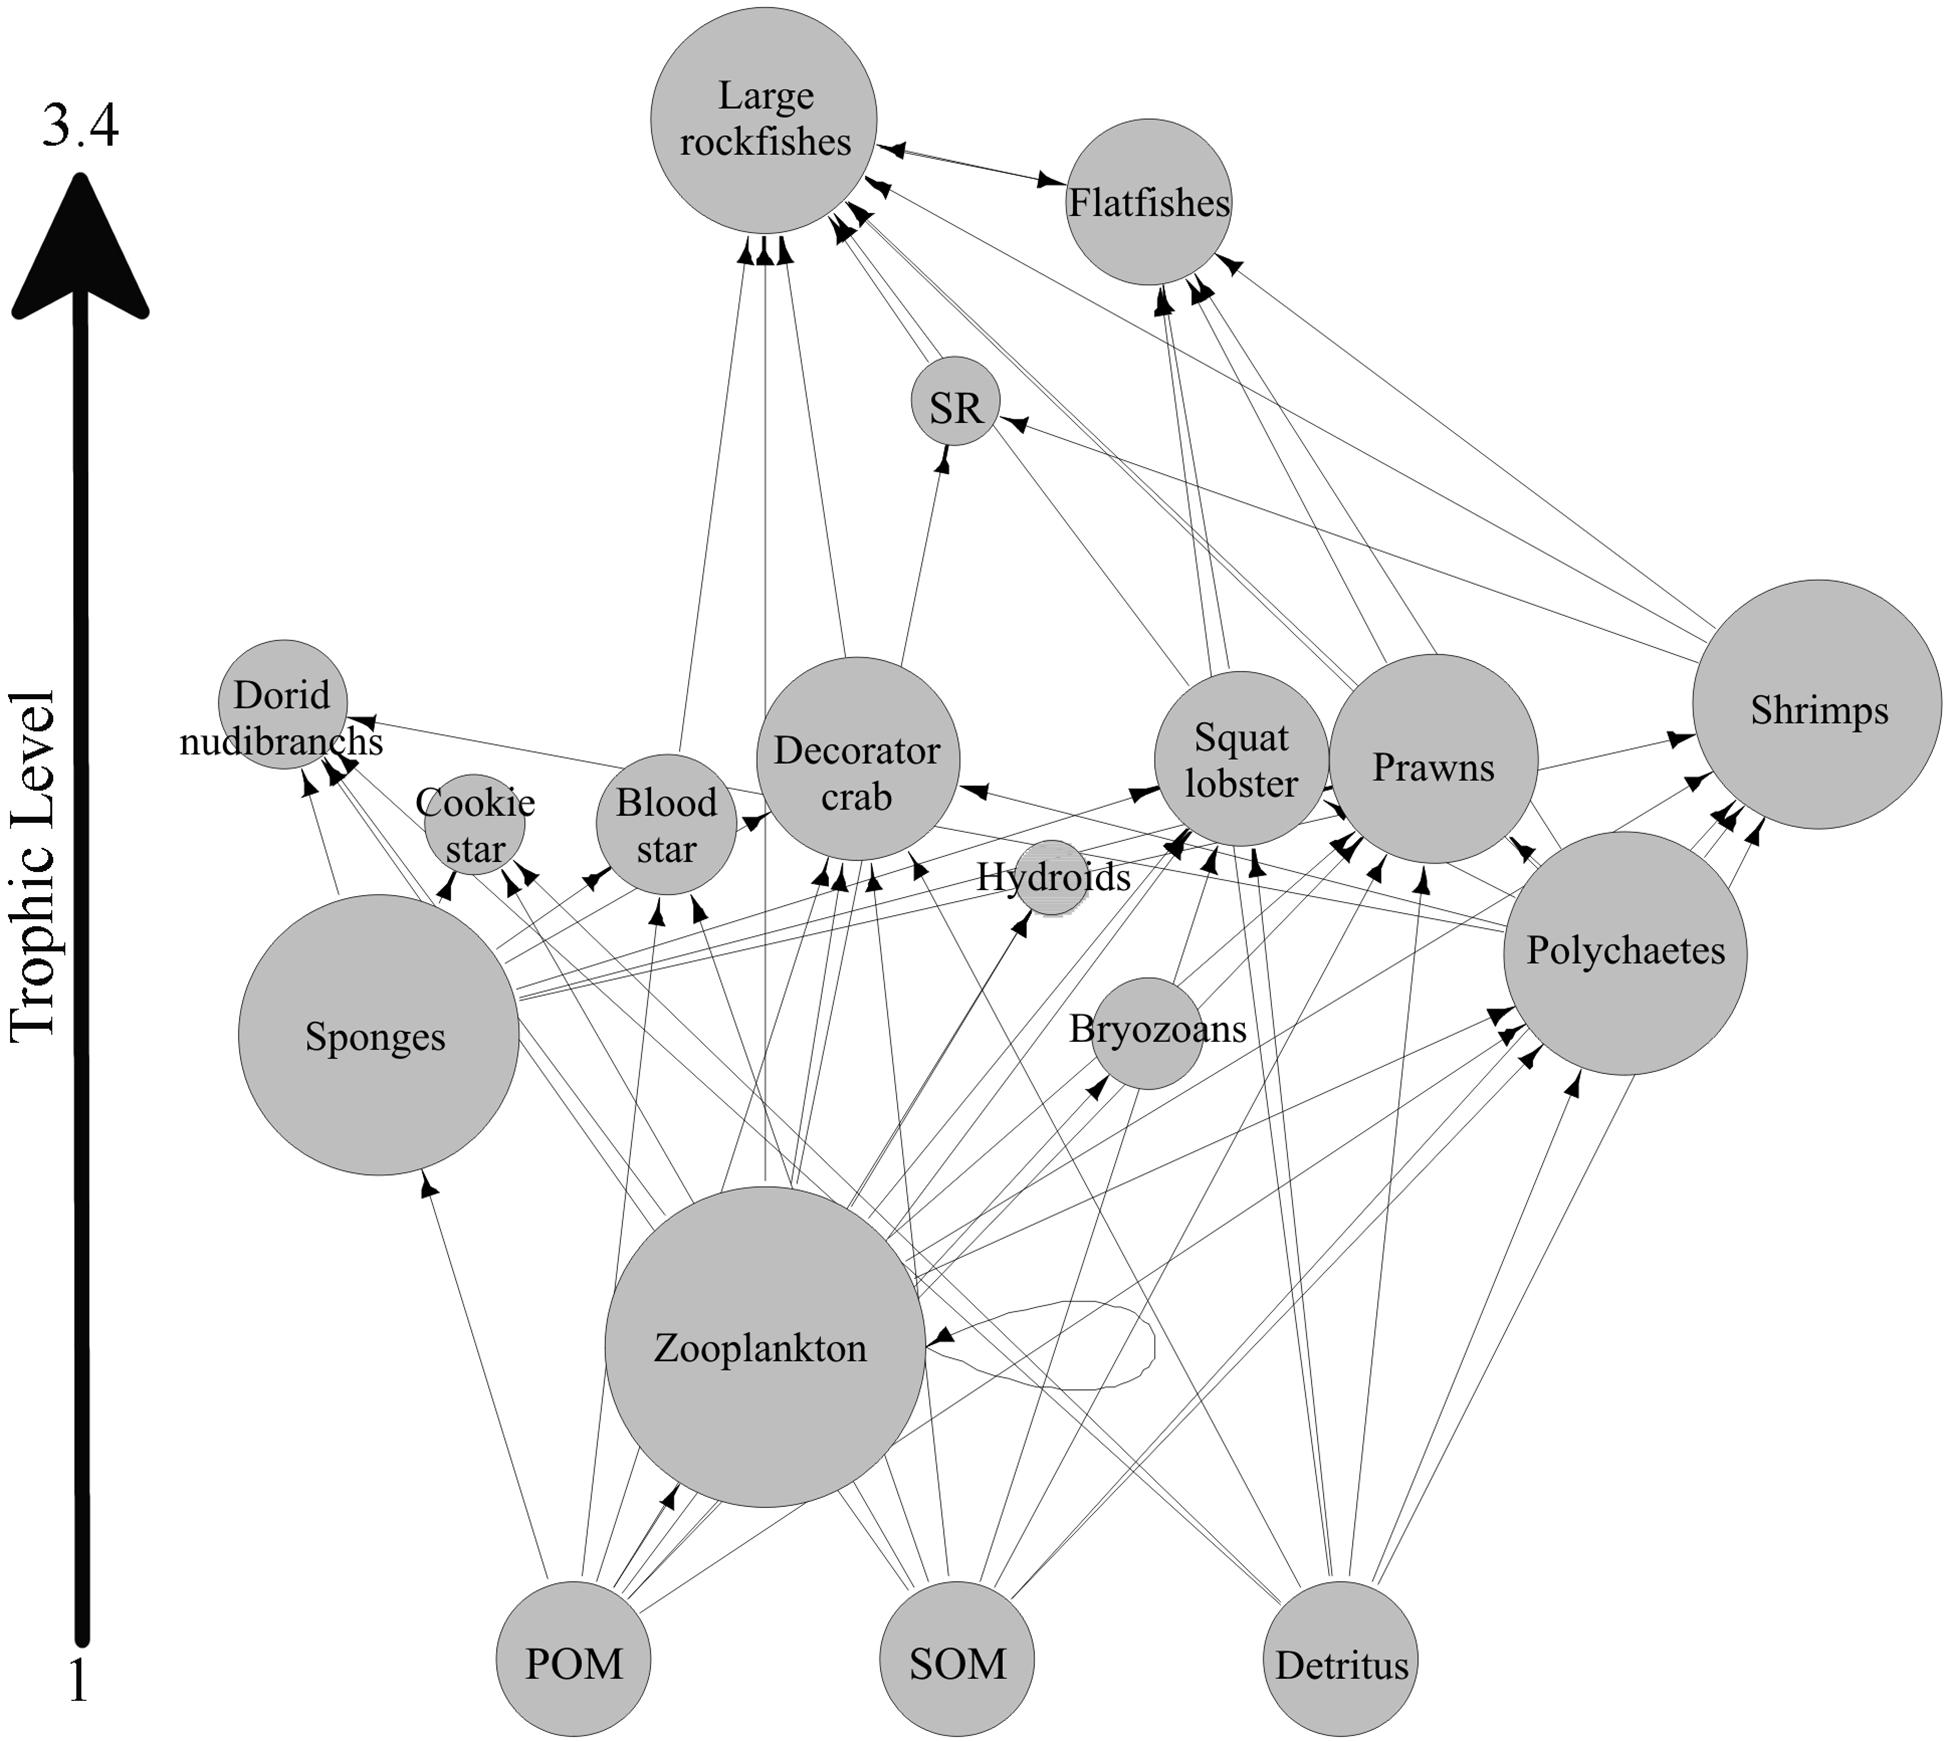
Figure 4. A generalized food web for sponge reefs. Taxa were considered if they were present on two-thirds of the reefs included in this study. Two taxa, Ceramaster patagonicus and dorid nudibranchs, were also included due to previous work indicating their strong association with live reef habitat (Chu and Leys, 2010; Dunham et al., 2018b). The size of each node corresponds to its relative importance in the food web. SR represents small rockfish. Several nodes in the generalized food web represent tropho-species. When this is the case these tropho-species have been given descriptive names (e.g., Shrimps). Large and small rockfish represent tropho-species and were given names based on the relative adult size of the species in the tropho-species group. Tropho-species groupings can be found in Supplementary Table S2.
Network Analysis
Many topological metrics had a relationship with live sponge cover. Re-scaled connectance (Crsc, Davies test for non-zero difference in slope p = 0.002, Figure 5A), clustering coefficient (Cl/Clran, p = 0.01, Figure 5B), median In-Degree (p = 0.01, Figure 5C), and median Out-Degree (p = 0.02) all had a threshold relationship with live sponge cover (Figure 5). Thresholds ranged from 9.5 (± 1.7 SE, Median In-Degree) to 13.1% (± 0.96 SE, Crs, Figures 5A,C,D). The variance of In-Degree (linear: F1,18 = 0.08, p = 0.78, R2adj = −0.05, threshold: p = 0.29), variance of Out-Degree (linear: F1,18 = 1.64, p = 0.22, R2adj = 0.03, threshold: p = 0.53), and trophic coherence (q, linear: F1,18 = 0.36, p = 0.55, R2adj = −0.03, threshold: p = 0.05) do not have a significant relationship with sponge cover. However, trophic coherence was bordering on a significant threshold relationship (threshold at 11.21 PSC, p = 0.05), where reef food webs trended toward becoming less coherent with increasing sponge cover below the threshold (slope = 0.40, −0.09 to 0.89 95% CI) and became more coherent with increasing sponge cover above the threshold (slope = −0.86, −1.64 to −0.07 95% CI). The lack of a significant relationship between variation and sponge cover for either In-Degree or Out-Degree suggests that these patterns were driven by a true shift in the central tendency, rather than by the presence or absence of a few highly connected species. It should be noted that all reef food web models were more clustered (largest p = 0.02) and were more coherent (all p < 0.001) than expected in random webs.
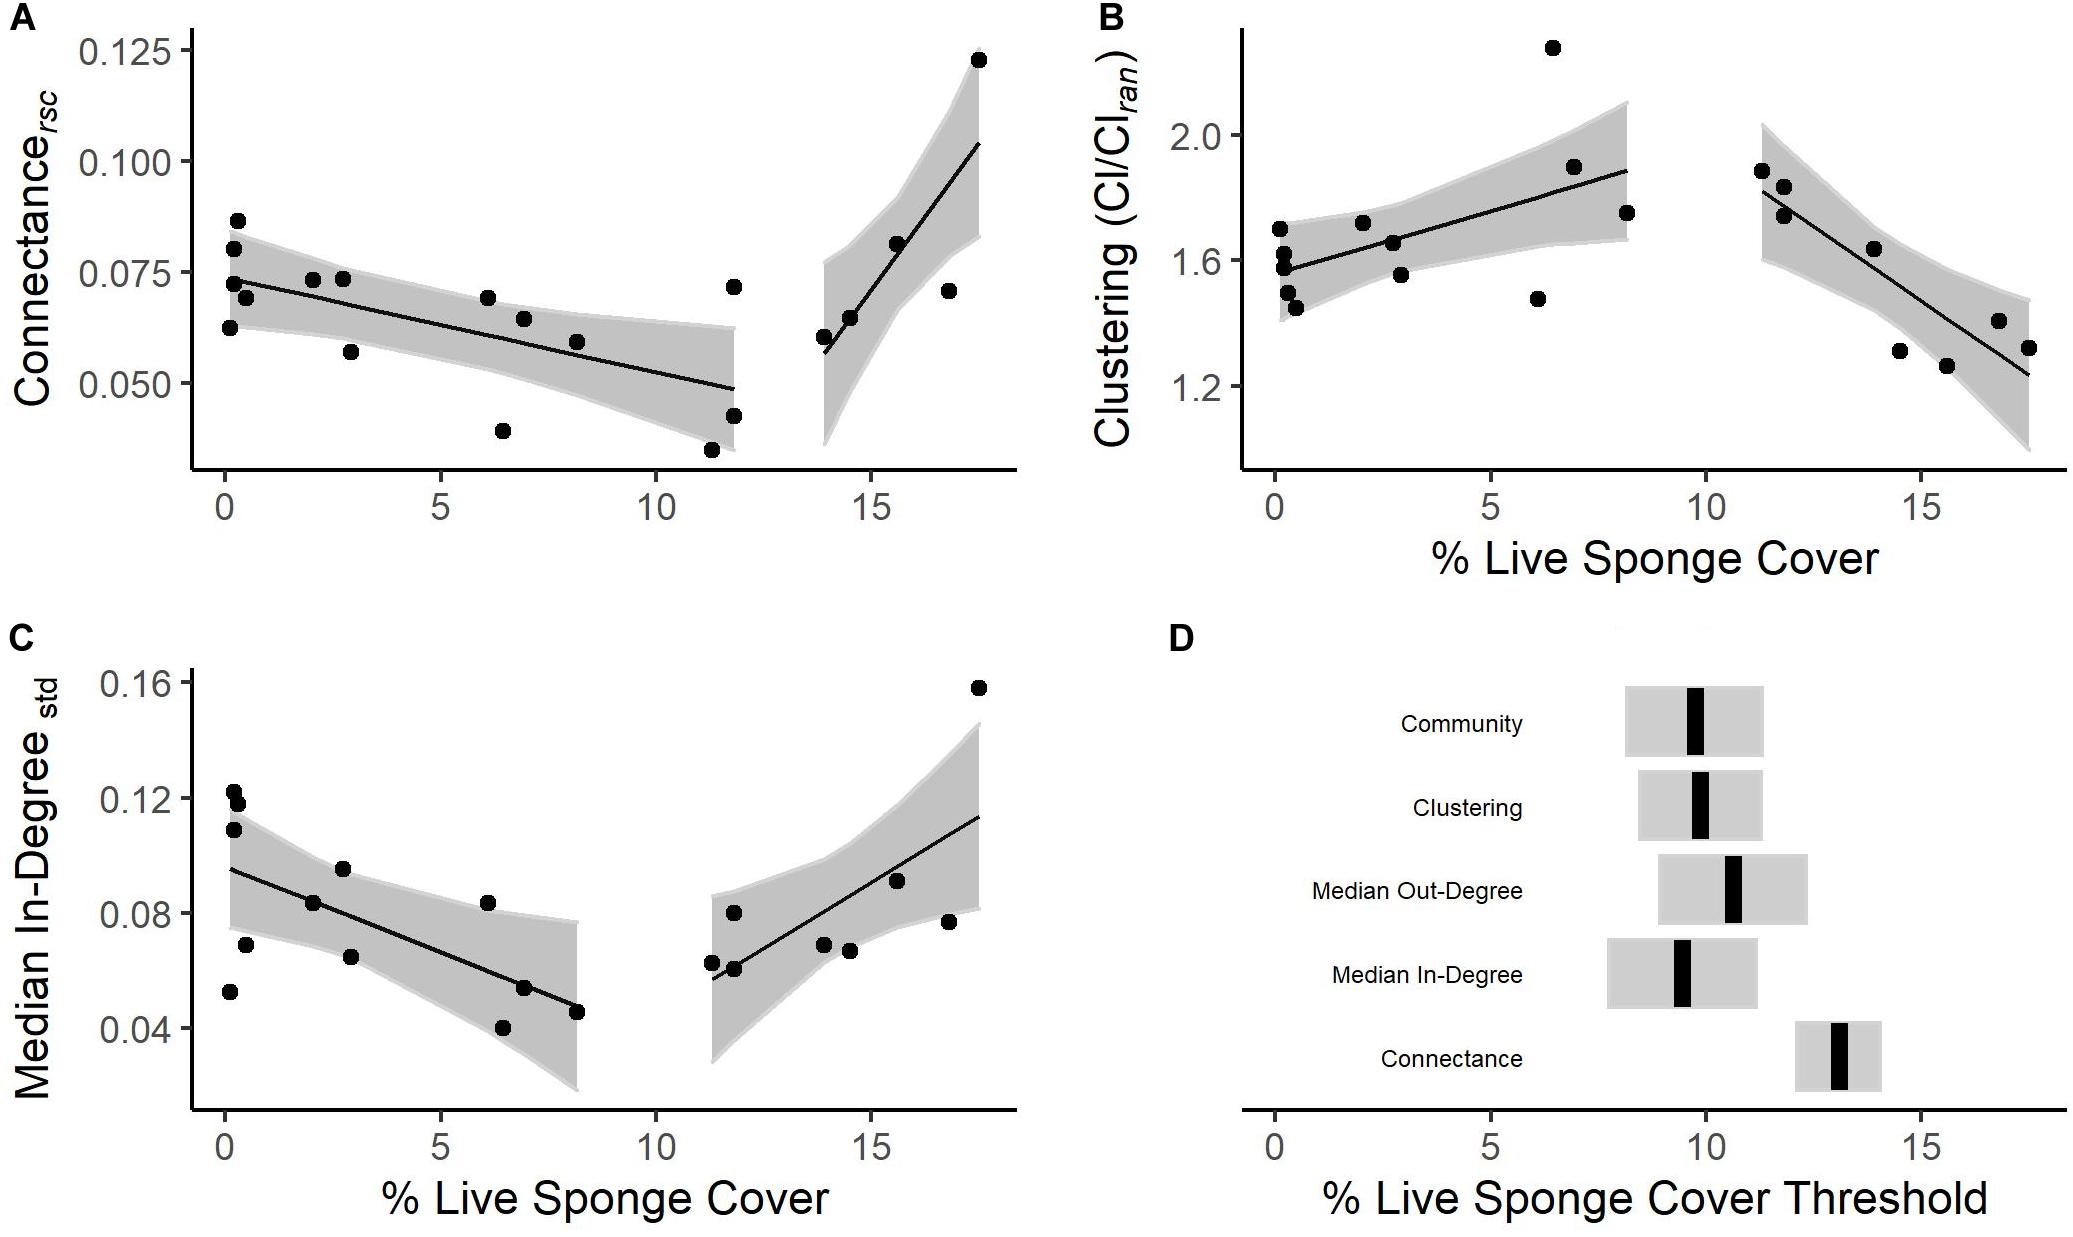
Figure 5. Food web topological metrics related to percent cover of live reef-building sponge: (A) re-scaled connectance, (B) the ratio of observed to random clustering coefficients, and (C) median In-Degree standardized by the total number of possible incoming links. The lines are the result of piecewise linear regression and the shaded areas represent the 95% confidence intervals (CIs). In panel (D) we show the estimated threshold, or change point, for each index that demonstrated this behavior. The shaded area represents 95% CIs, except in the case of the community threshold where it represents 95% empirical quantile estimates.
Overall, there appear to be two general reef food web “types”(Supplementary Figure S7): one characterizing reefs with low sponge cover (below ∼10%; hereafter “low sponge reef”, n = 12 reefs), and one typical of those with high sponge cover (above ∼10%; hereafter “sponge-dominated reef”, n = 8 reefs). Within the low sponge cover food webs, as sponge cover increases, species tend to rely on fewer sources (In-Degree, slope = −0.006; −0.011 to −0.0009 95% CI) and have fewer predators (Out-Degree, slope = −0.004; −0.008 to −0.0006 95% CI). Consequently, connectance also decreases (Crs, slope = −0.002; −0.004 to −0.0005 95% CI). Low sponge reef food webs become increasingly more clustered than random (Cl/Clran, slope = 0.04, 0.003 to 0.077 95% CI) as sponge cover increases. Within the sponge-dominated reefs, as sponge cover increases, species tend to consume more sources (In-Degree, slope = 0.009; 0.001 to 0.02 95% CI) and have more predators (Out-Degree, slope = 0.006; 0.001 to 0.01 95% CI). Consequently, connectance increases (Crs, slope = 0.01; 0.004 to 0.02 95% CI). Sponge-dominated food webs become increasingly less clustered (Cl/Clran, slope = −0.09; −0.15 to −0.03 95% CI), becoming closer to what is expected in a random web.
Community Analysis
There was a significant community change point, or threshold, at 9.73% live sponge cover (8.17–11.3, 5, and 95% empirical quantiles, Figure 5D). Of the 90 species evaluated, 12 are consistently (min purity = 0.95) and reliably (min reliability = 0.96) associated with sponge-dominated reefs. Of these, two species have a lower change point than the rest of the community: Quillback rockfish Sebastes maliger (cp = 2.03, 2.03–8.17, 5 and 95% empirical quantiles) and the spiny lithode crab Acantholithodes hispidus (cp = 2.03, 0.40–2.38, 5 and 95% empirical quantiles). Overall, species associated with the sponge-dominated reef type were non-reef-building filter feeders (demosponges Hymeniacidon sp. and Iophon sp., and polychaetes Serpulidae and Sabellidae), predatory fishes (flatfishes, Pleuronectiformes, and rockfishes, Sebastes sp., S. proriger, S. wilsoni, and S. zacentrus), and decorator crabs (Chorilia longipes).
Thirteen species were consistently (min purity = 0.97) and reliably (min reliability = 0.97) associated with low sponge cover reefs. These included several sea stars: cookie sea star (C. patagonicus), Henricia sp., Mediaster sp., the cushion sea star (Pteraster tesselatus), and unidentified sea stars. In addition to sea stars, brittle stars (Ophiuroidea), small unidentified shrimps, hermit crabs (Paguroidea), the crimson anemone (Cribrinopsis fernaldi), the Oregon hairy triton (Fusitriton oregonensis), and polychaetes (other than Serpulidae and Sabellidae) were associated with low sponge cover reefs. Only two species of fish, the Spotted Ratfish (Hydrolagus colliei) and Yelloweye Rockfish (Sebastes ruberrimus) were associated with low sponge cover reefs. Overall, these taxa tend to either use detritus as a food source or consume detritivores. However, many of the sea stars also consume sponges regularly and Yelloweye Rockfish are generalist predators.
Discussion
In deeper parts of the ocean, food limitation determines community structure to a large extent (Smith et al., 2008). Here, we show that the foundation species, sponges, can play an important role in marine food webs, acting as a key source of food for consumers. Further, we show that the topology of the food web and community structure shows a threshold response to increasing reef-building sponge cover, suggesting two potential states: low sponge and sponge-dominated reefs. Consequently, reefs with sponge cover near the threshold (∼10% PSC) have food webs that are less connected and more clustered—traits associated with stronger and destabilizing species interaction strengths (McCann et al., 1998; O’Gorman et al., 2010).
Contrary to previous works we found that sponges, the foundation species on sponge reefs, are important in the food web (Baiser et al., 2013; Borst et al., 2018). Zooplankton and sponges are the two most important non-basal nodes in a generalized sponge reef food web, and sponges were on average the third most important node in individual reef food web models, a finding that is supported by our stomach content and stable isotope data. We found evidence of feeding on sponges in every consumer we examined and for many of these consumers sponges represented a significant portion of their diet. Our results are not consistent with those of Borst et al. (2018); they found that foundation species in seven different ecosystems were no more important in the food web than other species when considering only trophic links. However, they only considered the number of out-going links (i.e., the number of consumers for a species) as their indicator of importance within the food web. We used an indicator of the importance that combined how well connected a species is (including both the number of consumers and the number of sources), how many trophic pathways pass through the species, and how unique a species is within the food web (McCann et al., 2017). Our approach provides a broader picture of trophic importance. If we restrict our indicator of relative importance to the number of outgoing links, we still find that sponges are the second most important node within our food web, suggesting that sponges, at least in these ecosystems, are a more commonly utilized food source than the foundation species examined by Borst et al. (2018). Further work is needed to determine how the palatability of a foundation species and the availability of other food sources affect the relative importance of a foundation species within a food web.
The results of the isotope mixing model generally agree with our stomach content analysis. Yet, care should be taken when interpreting the results, due to limited knowledge of the diets of the consumers we examined. Mixing models are very sensitive to sources, as well as to the TEFs used in the model (Phillips et al., 2014). Consequently, although our results show that all consumers consume sponges, the exact proportions of the diets estimated by the mixing model would vary if an additional source(s) was included in the model. It is very unlikely that we were able to account for all potential food sources for consumers within the sponge reefs. For example, Archer et al. (2018) documented the decorator crab, C. longipes, feeding on pyrosomes during the 2017 research cruise during which organisms were collected for this study. Historically, pyrosomes are unlikely to have been a significant contributor to the benthic food web in Hecate Strait and Queen Charlotte Sound, as the pyrosome bloom in 2017 was the first such bloom in recorded history (Archer et al., 2018; Sutherland et al., 2018). Pyrosome blooms were subsequently reported in the Northeast Pacific again in 2018 (Sutherland et al., 2018), and are predicted to become more common in this area in the future. Additionally, deep-water consumers are known to be opportunistic, taking advantage of occasional sources of energy, such as fish and marine mammal carcasses or wood falls (Smith and Baco, 2003; Bernardino et al., 2010; McClain and Barry, 2014). This is consistent with algal detritus’ being found in the stomachs of several of the consumers we examined. However, no such food sources were observed during this study; therefore, we were unable to include them in our mixing model. Additionally, the TEFs are unknown for all consumers examined in this study. Although we attempted to account for this source of uncertainty in our mixing model by including large standard deviations, there is no doubt that accurate TEFs would improve estimations.
There is strong and consistent evidence for a threshold response in community and food web structure at mid-levels of sponge percent cover (i.e., 10%). Overall, more generalist predators are associated with sponge-dominated systems. For example, several of the species associated with sponge-dominated communities are rockfish, which are generalist predators. Our findings correspond with those of Chu and Leys (2010), who also found an association between rockfish and live sponge cover. While the finding of an association between sponge cover and rockfish is consistent, it should be noted that issues with taxa detection may make similar associations between sponge abundance and smaller-bodied animals difficult. When reef-building sponges are abundant they form a dense and complex three-dimensional matrix of habitat with many portions of this habitat visually inaccessible to ROV cameras. This makes it more difficult to detect all taxa in areas of live sponge cover when compared to less structurally complex locations. Extractive sampling methods are generally not advisable (Loh et al., 2019) given that reef-building sponges are extremely fragile and slow to recover from physical disturbance (Kahn et al., 2016). Consequently, our community data are likely incomplete, especially in high sponge cover reefs.
Such shifts in community structure are reflected in the food web topology. Below ∼10% sponge cover, food webs are less connected with consumers relying on fewer food sources, and generally predated upon by fewer predators, as sponge cover increases. Above ∼10% we see the opposite trend, with webs that become more connected as species utilize more sources and are eaten by more predators. Although initial theoretical work suggested that more densely connected communities are more unstable (May, 1973), other research points toward the importance of the distribution of interaction strengths (McCann, 2000). If communities are dominated by weak interaction strengths, complex, densely connected communities might be more stable (McCann, 2012; Nilsson and McCann, 2015). Although we were unable to include interaction strength in our study, there is theoretical and empirical evidence of a strong negative correlation between how well connected a species is and the strength of its interactions: highly connected species tend to be involved in weaker interactions than are species with fewer connections (O’Gorman et al., 2010). Our results show that reefs near the transition between low sponge cover and sponge-dominated states are characterized by species with fewer connections. If species with low numbers of trophic connections are involved in stronger interactions, and strong interactions destabilize communities, then reef communities near the transition point (∼10% sponge cover) are likely less stable and more susceptible to perturbations.
While our study focuses on trophic interactions, there is no way to disentangle these from reef-building sponges’ non-trophic facilitation of associated species. Dead sponges provide physical structure, but this structure is often less complex than live sponges. The threshold we document may be an indication of the live sponge cover necessary for non-trophic facilitation by sponges to influence community structure. However, the patterns of network structure that we show do not correspond with other studies. For example, van der Zee et al. (2016) and Borst et al. (2018) found that as foundation species abundance increased, connectance decreased. We saw this pattern in our low sponge systems, but the opposite pattern in sponge-dominated systems. This may reflect the opportunistic nature of the predators associated with sponge-dominated systems. It may also reflect a fundamental difference in the types of systems that we examined. Whereas the foundation species examined in the above-cited studies were generally considered unpalatable and consequently had few trophic links, we found that a large proportion of mid-trophic level consumers associated with sponge-dominated systems consumed sponges. This widespread consumption of the foundation species serves to increase connectance. This suggests that foundation species’ impacts on food web structure may be dependent on their palatability and their relative trophic importance within the food web.
Our findings suggest that sponge reef food webs may be less stable near a 10% sponge cover. This has important implications for the management of this and other ecosystems created by filter feeders. Sponge reefs, and other deep-water benthic habitats formed by sponges and corals, are easily damaged by human activities that contact the bottom; for example, several sponge reefs included in this study have been impacted by human activities (e.g., fishing, Conway et al., 2001; Cook et al., 2008; Dunham et al., 2015). Although all reefs in this study are now protected from bottom-contact fishing activities (DFO, 2015, 2017, 2019), other anthropogenic stressors might affect these systems. For example, increased sedimentation, such as that caused by trawling near protected area boundaries, may disrupt filter-feeding of reef-building sponges, resulting in decreased growth or increased mortality (Grant et al., 2019). Additionally, there is now evidence that increasing water temperatures and ocean acidification may impact reef sponges’ ability to feed, resulting in tissue necrosis and, potentially, starvation (Stevenson et al., 2020). Our results suggest that reefs above, but near, the 10% threshold should be carefully managed to prevent, a shift away from the sponge-dominated state.
Other factors mediate live sponge cover on reefs. For example, Dunham et al. (2018a) found that seabed terrain is a significant driver suggesting some reefs may have naturally low levels of live sponge cover. However, all known sponge reefs were impacted to some degree by bottom contact activities before their discovery and subsequent protection (Dunham et al., 2018a). Consequently, a precautionary approach would be to manage all reefs as if a return to above 10% of live sponge cover is possible. Currently, the primary management tool applied to sponge reefs—spatial bottom-contact fishery closures—aims to prevent further physical damage to both the live sponges and the dead sponge reef matrix (DFO, 2015, 2017, 2019). Preventing further damage is of paramount importance but given the slow recovery and growth rates of reef-building sponges (Dunham et al., 2015; Kahn et al., 2016), future research should be directed at developing restoration methods to promote reef recovery. Given the depths at which many sponge reefs occur, this may prove to be a challenging task.
Consideration of the impact of foundation species on community structure has focused on the facilitation of community members by the habitat-forming species, typically the provision of habitat and other indirect positive interactions. Here we show that foundation species can also play a large role in the food web, acting as a major pathway of energy. Future work should incorporate multiple forms of interaction types into a single framework to fully understand the roles that foundation species play in shaping communities, particularly in deep-water systems.
Data Availability Statement
The original contributions presented in the study are included in the article/Supplementary Material, further inquiries can be directed to the corresponding author.
Author Contributions
SA conceived of the study. SA, AD, AK, CL, and SL designed the data collection. SA, AD, LL, MT, and SJ collected and processed the samples. SA and LB analyzed the data. SA and SJ wrote the initial draft of the manuscript. SK, AD, AK, CL, LB, LL, MT, SJ, and SL reviewed, edited, and revised the manuscript. All authors contributed to the article and approved the submitted version.
Funding
This research was supported by the NSERC Canadian Healthy Oceans Network (CHONeII) and its partners: Department of Fisheries and Oceans Canada and INREST (representing the Port of Sept-Îles and City of Sept-Îles; NETGP 468437-14, CHONe Project 2.2.3). The research was also supported by an NSERC Ship Time grant to SL and Fisheries and Oceans Ship Time and National Conservation Plan funding to AD.
Conflict of Interest
The authors declare that the research was conducted in the absence of any commercial or financial relationships that could be construed as a potential conflict of interest.
Acknowledgments
We thank the crews of the CCGS J. P. Tully and CCGS Neocaligus for their hard work and the CSSF ROPOS and DFO Phantom ROV teams for their technical expertise in collecting samples, as well as maintaining and operating the visual survey technology used in this study.
Supplementary Material
The Supplementary Material for this article can be found online at: https://www.frontiersin.org/articles/10.3389/fmars.2020.549478/full#supplementary-material
References
Albert, R., and Barabási, A. L. (2002). Statistical mechanics of complex networks. Rev. Modern Phys. 74:47.
Altieri, A. H., and van de Koppel, J. (2014). “Foundation Species in Marine Ecosystems,” in Marine Community Ecology and Conservation, eds M. D. Bertness, J. F. Bruno, B. R. Silliman, and J. J. Stachowicz (Sunderland, MA: Sinauer Associates, Inc), 37–56.
Archer, S. K., Kahn, A. S., Leys, S. P., Norgard, T., Girard, F., and Dunham, A. (2018). Pyrosome consumption by benthic organisms during blooms in the northeast Pacific and Gulf of Mexico. Ecology 99, 981–984. doi: 10.1002/ecy.2097
Baiser, B., Whitaker, N., and Ellison, A. M. (2013). Modeling foundation species in food webs. Ecosphere 4:art146. doi: 10.1890/es13-00265.1
Baker, M. E., and King, R. S. (2010). A new method for detecting and interpreting biodiversity and ecological community thresholds. Methods Ecol. Evol. 1, 25–37. doi: 10.1111/j.2041-210x.2009.00007.x
Barthel, D. (1995). Tissue composition of sponges from the Weddell Sea, Antarctica: not much meat on the bones. Mar. Ecol. Prog. Ser. 123, 149–153. doi: 10.3354/meps123149
Beazley, L. I., Kenchington, E. L., Murillo, F. J., and Sacau, M. D. M. (2013). Deep-sea sponge grounds enhance diversity and abundance of epibenthic megafauna in the Northwest Atlantic. ICES J. Mar. Sci. 70, 1471–1490. doi: 10.1093/icesjms/fst124
Bernardino, A. F., Smith, C. R., Baco, A., Altamira, I., and Sumida, P. Y. (2010). Macrofaunal succession in sediments around kelp and wood falls in the deep NE Pacific and community overlap with other reducing habitats. Deep Sea Res. I Oceanogr. Res. Pap. 57, 708–723. doi: 10.1016/j.dsr.2010.03.004
Bo, M., Bertolino, M., Bavestrello, G., Canese, S., Giusti, M., Angiolillo, M., et al. (2012). Role of deep sponge grounds in the Mediterranean Sea: a case study in southern Italy. Hydrobiologia 687, 163–177. doi: 10.1007/978-94-007-4688-6_14
Borst, A. C. W., Angelini, C., ten Berge, A., Lamers, L., Derksen-Hooijberg, M., and van der Heide, T. (2019). Food or furniture: separating trophic and non-trophic effects of Spanish moss to explain its high invertebrate diversity. Ecosphere 10:e02846.
Borst, A. C. W., Verberk, W. C. E. P., Angelini, C., Schotanus, J., Wolters, J. W., Christianen, M. J. A., et al. (2018). Foundation species enhance food web complexity through non-trophic facilitation. PLoS One 13:e0199152. doi: 10.1371/journal.pone.0199152
Bowerbank, J. S. (1862). On the anatomy and physiology of the spongiadæ. Part III on the generic characters, the specific characters, and on the method of examination. Philos. Trans. Royal Soc. 152, 1087–1135. doi: 10.1098/rstl.1862.0044
Brandes, U. (2001). A faster algorithm for betweenness centrality. J. Math. Sociol. 25, 163–177. doi: 10.1080/0022250x.2001.9990249
Briand, F., and Cohen, J. E. (1984). Community food webs have scale-invariant structure. Nature 307, 264–267. doi: 10.1038/307264a0
Bruno, J. F., and Bertness, M. D. (2001). “Habitat modification and facilitation in benthic marine communities,” in Marine Community Ecology, ed. M. D. Bertness (Sunderland, MA: Sinauer), 201–218.
Bruno, J. F., Stachowicz, J. J., and Bertness, M. D. (2003). Inclusion of facilitation into ecological theory. Trends Ecol. Evol. 18, 119–125. doi: 10.1016/s0169-5347(02)00045-9
Calvert, S. E., and Pedersen, T. F. (1995). On the organic carbon maximum on the continental slope of the eastern Arabian Sea. J. Mar. Res. 53, 269–296. doi: 10.1357/0022240953213232
Calvert, S. E., Pedersen, T. F., and Karlin, R. E. (2001). Geochemical and isotopic evidence for post-glacial palaeoceanographic changes in Saanich Inlet, British Columbia. Mar. Geol. 174, 287–305. doi: 10.1016/S0025-3227(00)00156-0
Carlier, A., Le Guilloux, E., Olu, K., Sarrazin, J., Mastrototaro, F., and Taviani, M. (2009). Trophic relationships in a deep Mediterranean cold-water coral bank (Santa Maria di Leuca, Ionian Sea). Mar. Ecol. Prog. Ser. 397, 125–137. doi: 10.3354/meps08361
Chu, J., and Leys, S. (2010). High resolution mapping of community structure in three glass sponge reefs (Porifera, Hexactinellida). Mar. Ecol. Prog. Ser. 417, 97–113. doi: 10.3354/meps08794
Chu, J. W., and Leys, S. P. (2012). The dorid nudibranchs Peltodoris lentiginosa and Archidoris odhneri as predators of glass sponges. Invertebr. Biol. 131, 75–81. doi: 10.1111/j.1744-7410.2012.00262.x
Conway, K., Barrie, J., Austin, W., and Luternauer, J. (1991). Holocene sponge bioherms on the western Canadian continental shelf. Continent. Shelf Res. 11, 771–790. doi: 10.1016/0278-4343(91)90079-l
Conway, K. W., Barrie, J. V., and Krautter, M. (2005). Geomorphology of unique reefs on the western Canadian shelf: sponge reefs mapped by multibeam bathymetry. Geo Mar. Lett. 25, 205–213. doi: 10.1007/s00367-004-0204-z
Conway, K. W., Krautter, M., Barrie, J. V., and Neuweiler, M. (2001). Hexactinellid sponge reefs on the Canadian continental shelf: a unique “living fossil”. Geosci. Can. 28, 71–78.
Cook, S. E., Conway, K. W., and Burd, B. (2008). Status of the glass sponge reefs in the Georgia Basin. Mar. Environ. Res. 66, S80–S86.
Csardi, G., and Nepusz, T. (2006). The igraph software package for complex network research. InterJournal Complex Syst. 1695, 1–9.
Davies, R. B. (1987). Hypothesis testing when a nuisance parameter is present only under the alternative. Biometrika 74, 33–43. doi: 10.1093/biomet/74.1.33
Dayton, P. K. (1972). “Toward an understanding of community resilience and the potential effects of enrichments to the benthos at McMurdo Sound, Antarctica,” in Proceedings of the Colloquium on Conservation Problems in Antarctica, (Kansas: Allen Press Lawrence), 81–96.
Dayton, P. K., Robilliard, G. A., Paine, R. T., and Dayton, L. B. (1974). Biological accommodation in the benthic community at mcmurdo sound, Antarctica. Ecol. Monogr. 44, 105–128. doi: 10.2307/1942321
de Goeij, J. M., van Oevelen, D., Vermeij, M. J. A., Osinga, R., Middelburg, J. J., de Goeij, A. F. P. M., et al. (2013). Surviving in a marine desert: the sponge loop retains resources within coral reefs. Science 342, 108–110. doi: 10.1126/science.1241981
Delmas, E., Besson, M., Brice, M. H., Burkle, L. A., Fortin, M. J., and Gravel, D. (2019). Analysing ecological networks of species interactions. Biol. Rev. 94, 16–36. doi: 10.1111/brv.12433
DFO (2015). Fishery Notice FN0415. Available online at: http://www-ops2.pac.dfo-mpo.gc.ca/fns-sap/index-eng.cfm?pg=view_notice&DOC_ID=183964&ID=all (accessed May 6, 2020).
DFO (2017). Hecate Strait and Queen Charlotte Sound Glass Sponge Reefs Marine Protected Areas Regulations (SOR/2017-15). Available online at: https://laws-lois.justice.gc.ca/eng/regulations/SOR-2017-15/index.html (accessed May 6, 2020).
DFO (2019). Fishery Notice FN0205. Available online at: https://www-ops2.pac.dfo-mpo.gc.ca/fns-sap/index-eng.cfm?pg=view_notice&DOC_ID=219517&ID=all (accessed May 6, 2020).
Dufrêne, M., and Legendre, P. (1997). Species assemblages and indicator species: the need for a flexible asymmetrical approach. Ecol. Monogr. 67, 345–366. doi: 10.2307/2963459
Dunham, A., Archer, S. K., Davies, S. C., Burke, L. A., Mossman, J., and Pegg, J. R. (2018a). Assessing condition and ecological role of deep-water biogenic habitats: glass sponge reefs in the Salish Sea. Mar. Environ. Res. 141, 88–99. doi: 10.1016/j.marenvres.2018.08.002
Dunham, A., Mossman, J., Archer, S. K., Pegg, J., Davies, S., and Archer, E. (2018b). Glass Sponge Reefs in the Strait of Georgia and Howe Sound: Status Assessment and Ecological Monitoring Advice. DFO Can. Sci. Advis. Sec. Res. Doc. 2018/010 x+220 p. Seongnam-si: DFO.
Dunham, A., Pegg, J., Carolsfeld, W., Davies, S., Murfitt, I., and Boutillier, J. (2015). Effects of submarine power transmission cables on a glass sponge reef and associated megafaunal community. Mar. Environ. Res. 107, 50–60. doi: 10.1016/j.marenvres.2015.04.003
Dunne, J. A., Williams, R. J., and Martinez, N. D. (2002). Food-web structure and network theory: the role of connectance and size. Proc. Natl. Acad. Sci. U.S.A. 99, 12917–12922. doi: 10.1073/pnas.192407699
Faulkner, D. J., and Ghiselin, M. T. (1983). Chemical defense and evolutionary ecology of dorid nudibranchs and some other opisthobranch gastropods. Mar. Ecol. Prog. Ser. 13, 295–301. doi: 10.3354/meps013295
Freeman, L. C. (1978). Centrality in social networks conceptual clarification. Soc. Networks 1, 215–239. doi: 10.1016/0378-8733(78)90021-7
Gale, K. S. P., Hamel, J. F., and Mercier, A. (2013). Trophic ecology of deep-sea Asteroidea (Echinodermata) from eastern Canada. Deep Sea Res. I Oceanogr. Res. Pap. 80, 25–36. doi: 10.1016/j.dsr.2013.05.016
Gardner, W. D., Biscaye, P. E., and Richardson, M. J. (1997). A sediment trap experiment in the Vema Channel to evaluate the effect of horizontal particle fluxes on measured vertical fluxes. J. Mar. Res. 55, 995–1028. doi: 10.1357/0022240973224139
Grant, N., Matveev, E., Kahn, A. S., Archer, S. K., Dunham, A., and Bannister, R. J. (2019). Effect of suspended sediments on the pumping rates of three species of glass sponge in situ. Mar. Ecol. Prog. Ser. 615, 79–100. doi: 10.3354/meps12939
Hawkes, N., Korabik, M., Beazley, L., Rapp, H. T., Xavier, J. R., and Kenchington, E. (2019). Glass sponge grounds on the Scotian Shelf and their associated biodiversity. Mar. Ecol. Prog. Ser. 614, 91–109. doi: 10.3354/meps12903
Johannessen, S. C., Macdonald, R. W., and Wright, C. A. (2019). Rain, Runoff, and Diatoms: the Effects of the North Pacific 2014–2015 Warm Anomaly on Particle Flux in a Canadian West Coast Fjord. Estuar. Coasts 42, 1052–1065. doi: 10.1007/s12237-018-00510-0
Johnson, S., Domínguez-García, V., Donetti, L., and Muñoz, M. A. (2014). Trophic coherence determines food-web stability. Proc. Natl. Acad. Sci. U.S.A. 111, 17923–17928. doi: 10.1073/pnas.1409077111
Kahn, A. S., Vehring, L. J., Brown, R. R., and Leys, S. P. (2016). Dynamic change, recruitment and resilience in reef-forming glass sponges. J. Mar. Biol. Assoc. U.K. 96, 429–436. doi: 10.1017/s0025315415000466
Kahn, A. S., Yahel, G., Chu, J. W., Tunnicliffe, V., and Leys, S. P. (2015). Benthic grazing and carbon sequestration by deep-water glass sponge reefs. Limnol. Oceanogr. 60, 78–88. doi: 10.1002/lno.10002
Lai, S.-M., Liu, W. C., and Jordán, F. (2012). On the centrality and uniqueness of species from the network perspective. Biol. Lett. 8, 570–573. doi: 10.1098/rsbl.2011.1167
Law, L. K. (2018). Distribution, Biodiversity, and Function of Glass Sponge Reefs in the Hecate Strait, British Columbia, Canada. Edmonton, AB: University of Alberta.
Layman, C. A., Giery, S. T., Buhler, S., Rossi, R., Penland, T., and Henson, M. N. (2015). A primer on the history of food web ecology: fundamental contributions of fourteen researchers. Food Webs 4, 14–24. doi: 10.1016/j.fooweb.2015.07.001
Loh, T. L., Archer, S. K., and Dunham, A. (2019). Monitoring program design for data-limited marine biogenic habitats: a structured approach. Ecol. Evol. 9, 7346–7359. doi: 10.1002/ece3.5261
Maldonado, M., Aguilar, R., Bannister, R. J., Bell, J. J., Conway, K. W., and Dayton, P. K. (2016). “Sponge grounds as key marine habitats: a synthetic review of types, structure, functional roles, and conservation concerns,” in Marine Animal Forests: The Ecology of Benthic Biodiversity Hotspots, eds S. Rossi, L. Bramanti, A. Gori, and C. Orejas Saco del Valle (Cham: Springer International Publishing), 1–39. doi: 10.1007/978-3-319-17001-5_24-1
Mauzey, K. P., Birkeland, C., and Dayton, P. K. (1968). Feeding behavior of asteroids and escape responses of their prey in the puget sound region. Ecology 49, 603–619. doi: 10.2307/1935526
May, R. M. (1973). Complexity and Stability in Model Ecosystems. Princeton: Princeton UniversityPress.
McCann, K., Hastings, A., and Huxel, G. R. (1998). Weak trophic interactions and the balance of nature. Nature 395:794. doi: 10.1038/27427
McCann, M. J., Able, K. W., Christian, R. R., Fodrie, F. J., Jensen, O. P., and Johnson, J. J. (2017). Key taxa in food web responses to stressors: the Deepwater Horizon oil spill. Front. Ecol. Environ. 15, 142–149. doi: 10.1002/fee.1474
McClain, C., and Barry, J. (2014). Beta-diversity on deep-sea wood falls reflects gradients in energy availability. Biol. Lett. 10:20140129. doi: 10.1098/rsbl.2014.0129
McClintock, J. B., Amsler, C. D., Baker, B. J., and van Soest, R. W. M. (2005). Ecology of antarctic marine sponges: an overview. Integr. Comp. Biol. 45, 359–368. doi: 10.1093/icb/45.2.359
Meylan, A. (1988). Spongivory in Hawksbill Turtles- A diet of glass. Science 239, 393–395. doi: 10.1126/science.239.4838.393
Muggeo, V. M. (2008). Segmented: an R package to fit regression models with broken-line relationships. R News 8, 20–25.
Nilsson, K. A., and McCann, K. S. (2015). Interaction strength revisited—clarifying the role of energy flux for food web stability. Theor. Ecol. 9, 59–71. doi: 10.1007/s12080-015-0282-8
O’Gorman, E. J., Jacob, U., Jonsson, T., and Emmerson, M. C. (2010). Interaction strength, food web topology and the relative importance of species in food webs. J. Anim. Ecol. 79, 682–692. doi: 10.1111/j.1365-2656.2009.01658.x
Parnell, A. C., Phillips, D. L., Bearhop, S., Semmens, B. X., Ward, E. J., and Moore, J. W. (2013). Bayesian stable isotope mixing models. Environmetrics 24, 387–399.
Parnell, A. (2020). simmr: A Stable Isotope Mixing Model. R package version 0.4.1. https://CRAN.R-project.org/package=simmr (accessed January 1, 2019).
Pawlik, J. R., Chanas, B., Toonen, R. J., and Fenical, W. (1995). Defenses of Caribbean sponges against predatory reef fish. I. Chemical deterrency. Mar. Ecol. Prog. Ser. 127, 183–194. doi: 10.3354/meps127183
Phillips, D. L., Inger, R., Bearhop, S., Jackson, A. L., Moore, J. W., Parnell, A. C., et al. (2014). Best practices for use of stable isotope mixing models in food-web studies. Can. J. Zool. 92, 823–835. doi: 10.1139/cjz-2014-0127
Phillips, D. L., Newsome, S. D., and Gregg, J. W. (2005). Combining sources in stable isotope mixing models: alternative methods. Oecologia 144, 520–527. doi: 10.1007/s00442-004-1816-8
Poisot, T., and Gravel, D. (2014). When is an ecological network complex? Connectance drives degree distribution and emerging network properties. PeerJ 2:e251. doi: 10.7717/peerj.251
Post, D. M. (2002). Using stable isotopes to estimate trophic position: models, methods, and assumptions. Ecology 83, 703–718. doi: 10.1890/0012-9658(2002)083[0703:usitet]2.0.co;2
R Core Team (2019). R: A Language and Environment for Statistical Computing. Vienna: R Foundation for Statistical Computing.
Randall, J., and Hartman, W. (1968). Sponge-feeding fishes of the West Indies. Mar. Biol. 1, 216–225. doi: 10.1007/bf00347115
Saravia, L. A. (2019). multiweb: Ecological Analysis Includind Multiplex Networks. R Package Version 0.2.9.9000.
Schulze, F. E. (1887). Report on the Hexactinellida collected by H.M.S. ‘Challenger’ during the years 1873–76. Report on the scientific results of the voyage of H.M.S. challenger during the years 1873–76. Zool. 21, 1–514.
Shaw, J., Conway, K., Wu, Y., and Kung, R. (2018). Distribution of hexactinellid sponge reefs in the Chatham Sound region, British Columbia. Ottawa, ON: Geological Survey of Canada.
Smith, C. R., and Baco, A. R. (2003). Ecology of whale falls at the deep-sea floor. Oceanogr. Mar. Biol. 41, 311–354.
Smith, C. R., De Leo, F. C., Bernardino, A. F., Sweetman, A. K., and Arbizu, P. M. (2008). Abyssal food limitation, ecosystem structure and climate change. Trends Ecol. Evol. 23, 518–528. doi: 10.1016/j.tree.2008.05.002
Smith, K. L., and Kaufmann, R. S. (1999). Long-term discrepancy between food supply and demand in the Deep Eastern North Pacific. Science 284, 1174–1177. doi: 10.1126/science.284.5417.1174
Smith, K. L., Kaufmann, R. S., Baldwin, R. J., and Carlucci, A. (2001). Pelagic-benthic coupling in the abyssal eastern North Pacific: an 8-year time-series study of food supply and demand. Limnol. Oceanogr. 46, 543–556. doi: 10.4319/lo.2001.46.3.0543
Stevenson, A., Archer, S. K., Schultz, J. A., Dunham, A., Marliave, J. B., Martone, P., et al. (2020). Warming and acidification threaten glass sponge Aphrocallistes vastus pumping and reef formation. Sci. Rep. 10:8176.
Stone, R. P., Conway, K., Csepp, D., and Barrie, J. (2014). The boundary reefs: glass sponge (Porifera: Hexactinellidae) reefs on the international border between Canada and the United States. NOAA Techn. Memorandum NMFS AFSC 264, 1–41.
Sutherland, K. R., Sorensen, H. L., Blondheim, O. N., Brodeur, R. D., and Galloway, A. W. E. (2018). Range expansion of tropical pyrosomes in the northeast Pacific Ocean. Ecology 99, 2397–2399. doi: 10.1002/ecy.2429
van der Zee, E. M., Angelini, C., Govers, L. L., Christianen, M. J. A., Altieri, A. H., and Heide, T. V. D. (2016). How habitat-modifying organisms structure the food web of two coastal ecosystems. Proc. R. Soc. B Biol. Sci. 283:20152326. doi: 10.1098/rspb.2015.2326
Watts, D. J., and Strogatz, S. H. (1998). Collective dynamics of ‘small-world’ networks. Nature 393, 440–442. doi: 10.1038/30918
Keywords: community structure, facilitation, food webs, networks, porifera, species interactions, sponge aggregation, trophic interactions
Citation: Archer SK, Kahn AS, Thiess M, Law L, Leys SP, Johannessen SC, Layman CA, Burke L and Dunham A (2020) Foundation Species Abundance Influences Food Web Topology on Glass Sponge Reefs. Front. Mar. Sci. 7:549478. doi: 10.3389/fmars.2020.549478
Received: 06 July 2020; Accepted: 01 September 2020;
Published: 24 September 2020.
Edited by:
Rowan Trebilco, Centre for Marine Socioecology, AustraliaReviewed by:
Tomás I. Marina, Centro Austral de Investigaciones Científicas, Consejo Nacional de Investigaciones Científicas y Técnicas (CONICET), ArgentinaAlejandro Frid, Independent Researcher, Bowen Island, Canada
Copyright © 2020 Archer, Kahn, Thiess, Law, Leys, Johannessen, Layman, Burke and Dunham. This is an open-access article distributed under the terms of the Creative Commons Attribution License (CC BY). The use, distribution or reproduction in other forums is permitted, provided the original author(s) and the copyright owner(s) are credited and that the original publication in this journal is cited, in accordance with accepted academic practice. No use, distribution or reproduction is permitted which does not comply with these terms.
*Correspondence: Stephanie K. Archer, c2FyY2hlckBsdW1jb24uZWR1
†Present address: Craig A. Layman, Center for Energy, Environment, and Sustainability, Department of Biology, Wake Forest University, Winston-Salem, NC, United States