 Melissa J. Schulze1
 Sophie von der Heyden1
 David Japp2Larvika Singh3Deon Durholtz3
 Veronica K. Kapula4Hilkka O. N. Ndjaula4
 Romina Henriques1,5*
- 1Department of Botany and Zoology, Stellenbosch University, Stellenbosch, South Africa
- 2CapFish, Cape Town, South Africa
- 3Department of Environment, Forestry and Fisheries, Pretoria, South Africa
- 4Sam Nujoma Marine and Coastal Resources Research Centre, University of Namibia, Windhoek, Namibia
- 5National Institute of Aquatic Resources, Technical University of Denmark, Lyngby, Denmark
Kingklip, Genypterus capensis, is a valuable fish resource in southern African waters, with a wide geographic distribution spanning South Africa and Namibia. Previous studies have provided evidence for multiple stocks in South Africa, but the extent of stock structuring across the southern Africa region remains unclear. In this study we genotyped over 40,000 SNPs to characterize the spatial distribution of genomic variation for G. capensis throughout its core distribution. Results suggest that fish sampled at the northernmost range (off central Namibia) are characterized by lower genomic diversity, although the region exhibited the highest number of private SNPs, suggesting some degree of geographic isolation. Using neutral and putative outlier loci independently, we show that kingklip exhibits three population clusters, “northern Benguela,” “southern Benguela,” and South African “South Coast.” Population differentiation was observed only using putative outlier loci, suggesting that local adaptation might be one of the main drivers of the observed differentiation. Overall, our research provides novel insights into the regional dynamics that can support the sustainable long-term exploitation of this valuable fisheries resource.
Introduction
Kingklip, Genypterus capensis (Smith, 1847), is a slow-growing, long-lived demersal fish endemic to the southern African coastline, occurring from northern Namibia to southeastern South Africa, spanning the entire Benguela and Agulhas Currents ecosystems (Japp, 1990; Punt and Japp, 1994). It is a valuable marine resource in the southern African region that is caught, and generally retained, as incidental by-catch in the hake-directed demersal trawl and longline fisheries (Olivar and Sabatés, 1989; Pecquerie et al., 2004; de Moor et al., 2015; Henriques et al., 2017). Kingklip has been exploited since the advent of trawling in southern African waters in the early 1900’s, with the earliest records of trawl catches dating back to the 1930s (Punt and Japp, 1994). The development of a directed longline fishery for the species from 1983 to 1989 led to a rapid increase in total catches, followed shortly afterward by a marked decline in both catches and abundance (Badenhorst, 1988; Shannon et al., 1992; Punt and Japp, 1994). These indications of over-exploitation of the resource led to the closure of the directed longline fishery and implementation of various restrictions on the trawl fishery in 1990 (Punt and Japp, 1994; Brandão and Butterworth, 2013). Following these and subsequent management responses (including the implementation of catch limits in 2005), by-catches of kingklip in the hake directed trawl and longline fisheries (the latter established in 1994), as well as estimates of abundance derived from fishery-independent trawl surveys have gradually increased. Exploitation of the resource is now considered to be at near optimal exploitation levels (Brandão and Butterworth, 2013; de Moor et al., 2015). Despite this, the effects of past exploitation on effective population size and contemporary diversity levels is currently unknown, and the by-catch of kingklip remains an on-going management concern (Brandão and Butterworth, 2008; Henriques et al., 2017).
From a fisheries management perspective, a unit stock can be defined as a group of fish that can be treated as a stock and managed as an independent unit (Gulland, 1983). In some cases, stocks may be structured as “metapopulations” in which local populations may inhabit discrete habitat patches and inter-patch dispersal is neither so low as to negate significant demographic connectivity, nor so high as to eliminate any independence of local population (LP) dynamics (Sale et al., 2006). Despite its economic value (± $ 8.6 million/year), and a distribution range that spans multiple countries and ecoregions (Spalding et al., 2007), consensus regarding the population substructure patterns of kingklip is currently lacking, with previous studies yielding contrasting results (Payne, 1977, 1985; Olivar and Sabatés, 1989; Grant and Leslie, 2005; Henriques et al., 2017). This uncertainty poses fundamental fishery management questions, namely if management is based on (i) the whole metapopulation, how is it expected to avoid local depletion, and (ii) one or more local populations, understanding the relationship among subpopulations and how management avoids over-exploitation within both the selected local populations, and more broadly in the whole metapopulation is essential.
The earliest demographic studies based on morphological differences, identified three distinct stocks along the southern African coastline: the “Walvis” (i.e., Namibian), “Cape” and “South-East” (Payne, 1977, 1985) stocks, while a later study based on larval distribution patterns provided further support for the existence of two discrete South African stocks (Olivar and Sabatés, 1989). To date, only two molecular studies have been conducted with a view to elucidating kingklip stock structure and these yielded contrasting results. The earliest study, based on allozymes, did not detect significant genetic differentiation along the West (Benguela system) and South coast (Agulhas system) off South Africa, suggesting the existence of a single South African population (Grant and Leslie, 2005). In contrast, a more recent study by Henriques et al. (2017), based on mitochondrial DNA (mtDNA) and microsatellite loci, provided evidence for two sub-populations along the South African coastline, with a disruption in gene flow detected between the Benguela (West Coast) and Agulhas systems (South coast of South Africa). Although patterns of differentiation were not temporally stable, potentially due to the effects of reproductive sweepstakes, observed genetic differentiation appeared to be associated with the two oceanographic regimes within the region (Henriques et al., 2017). However, these studies focused exclusively on the southern distribution of kingklip, and did not include samples from the northern part of its distribution in Namibia. Therefore, the extent of possible connectivity of kingklip populations around southern Africa remains to be assessed. This could have important implications for the management of the resource as kingklip is currently assumed to be composed of (and is managed as) two separate stocks each confined to either Namibian or South African waters (DAFF, 2016). Further, despite evidence for the existence of two stocks in South African waters, management of kingklip in South Africa adopts a single-stock approach through the implementation of a Precautionary Upper Catch Limit (PUCL; de Moor et al., 2015; DAFF, 2016). Managing an exploited resource as a single unit if it is in fact a mixture or more than one stock (or vice-versa) has inherent risks such as under- or over-exploitation, with potential loss of genetic diversity associated with the latter (Carvalho and Hauser, 1994; Henriques et al., 2017; Pinsky et al., 2018). Such risks are of greater concern for long-lived, slow growing species, particularly if their distribution is localized or if possible migration is not accounted for Grant and Leslie (2005), Henriques et al. (2017).
Previous studies on genetic population structure of kingklip employed only a few neutral markers, which may explain the low levels of differentiation found, as neutral markers may not have enough statistical power to detect subtle levels of genetic divergence (Carvalho and Hauser, 1994; Ward et al., 1994; Hauser and Carvalho, 2008; Nielsen et al., 2009; Milano et al., 2014). Increasing the number of markers through utilizing Single Nucleotide Polymorphism (SNPs) provides opportunities for detecting finer-scale population differentiation even in high gene flow systems, or between populations shaped by recent divergence (Waples and Gaggiotti, 2006; Reiss et al., 2009; Bernatchez et al., 2017; D’Aloia et al., 2020). Furthermore, putatively adaptive (statistical outlier) loci have been shown to improve the resolution of population sub-structuring, revealing additional barriers to gene flow and providing insight into the occurrence of adaptive divergence (Reiss et al., 2009; Milano et al., 2011; Nielsen et al., 2012; Bradbury et al., 2012).
The current study extends previous work on the spatial distribution of genetic variation in kingklip (see Henriques et al., 2017). By applying a Restriction-Site Associated DNA sequencing (RAD-Seq) approach to samples collected across the entire distribution of the species off southern Africa, patterns of population connectivity, genomic diversity and the possibility of detecting signals of local adaptation was assessed. In particular, we were interested in understanding: (1) population connectivity between South African and Namibian kingklip; (2) fine-scale population genomic structuring across the South African range, specifically to test the hypothesis of two separate stocks on the west and south coasts of South Africa, and (3) assess if the developed SNP dataset reflects the previously proposed sub-populations identified by Henriques et al. (2017) (genetic versus genomic patterns of differentiation). Using a RAD-seq approach our work provides important insights into the population dynamics and genomic variation of kingklip across its core distribution off southern Africa that can support evidence-based decision-making and management of this commercially important fish resource.
Materials and Methods
Sample Collection
Tissue samples from mature individuals (total length > 30 cm), spanning the distributional range of kingklip in South Africa and Namibia were collected in the austral summer of 2017, and stored in 95% ethanol (Figure 1 and Table 1). A subset of individuals collected in 2012, 2014, and 2015 within South African waters that had been used in the microsatellite-based study of Henriques et al. (2017) were also included for comparative purposes. Specifically, we included individuals based on their association with two clusters (P1 and P2) previously identified using microsatellite loci. Due to spatial and temporal variation found by Henriques et al. (2017), these two genetic clusters contained a mixture of individuals collected from different years (2012, 2014, and 2016) and locations (WC, SWC, EC; Figure 1) along the South African coastline (Figure 1, Table 1 and Supplementary Table 1).
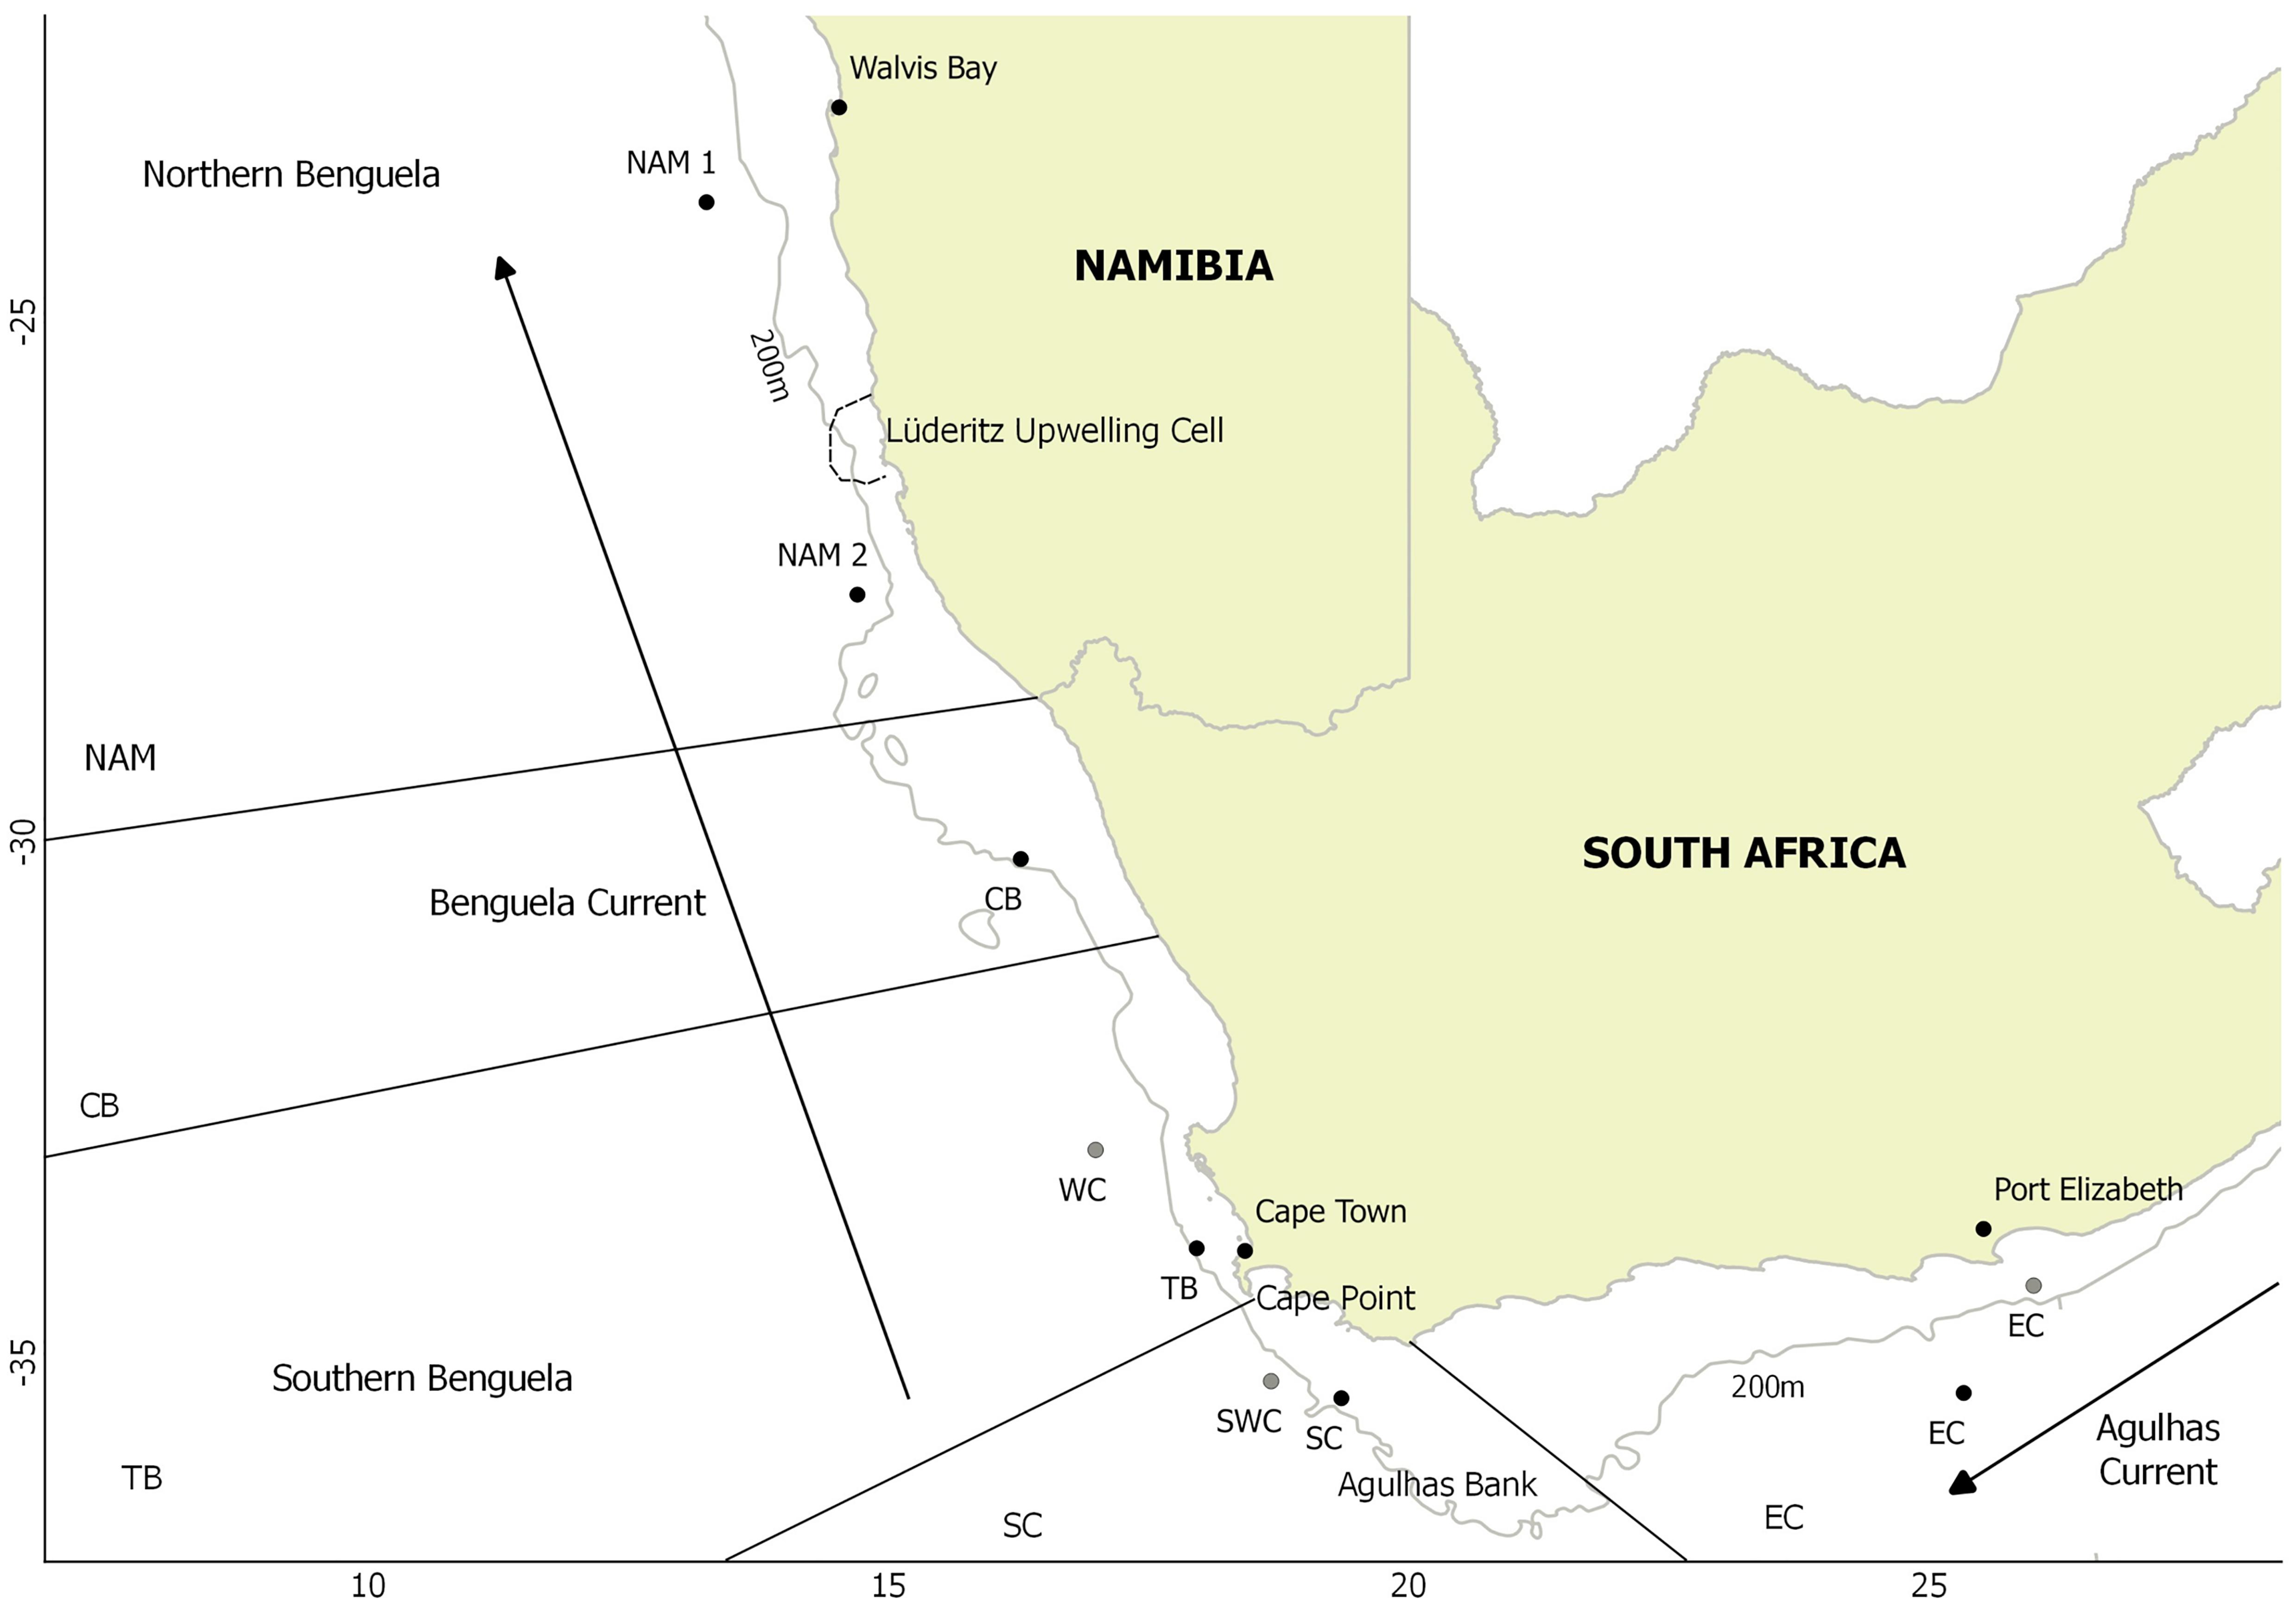
Figure 1. Sampling locations for kingklip: black 2017, gray 2012, 2014, and 2015. CB – Child’s Bank, WC – West Coast, TB – Table Bay, SWC – South West Coast, SC – South Coast, EC – Eastern Cape and NAM – Namibia. Depth contour (200 m) as well as oceanographic features indicated (including the Agulhas Current, Benguela Current and approximate location of the Lüderitz upwelling cell and the Agulhas Bank).
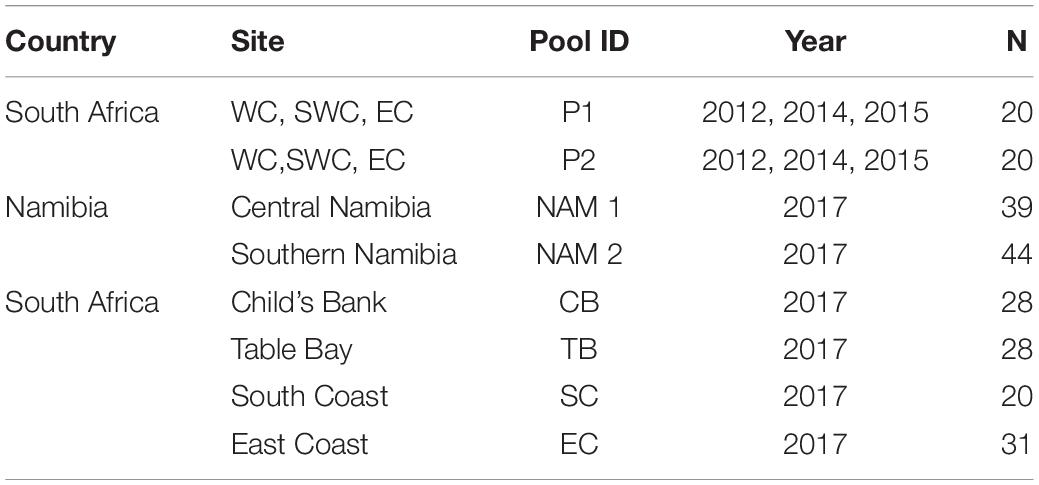
Table 1. Sampling location (Country and Site), code (Pool ID), year and number of individuals sampled per pool (N).
DNA Extraction and Pool-Seq Protocols
Total genomic DNA was extracted from tissue samples following the CTAB protocol (Winnepenninckx et al., 1993), and stored at −20°C. DNA concentration was quantified using Qubit and samples with a concentration below 5 ng/μl excluded.
Despite the reduction in Next Generation Sequencing costs, sequencing a large number of individuals remains expensive (Huang et al., 2015). As an alternative, sequencing pools of DNA samples (Pool-Seq) provides a more cost-effective approach for SNP discovery and genome-wide sequencing, allowing for increased samples to be analyzed at a fraction of the cost (Futschik and Schlötterer, 2010; Schlötterer et al., 2014; Fu et al., 2016). Pool-Seq has been shown to increase the probability of SNP detection as well as accuracy of allele frequency and population-based genetic parameter estimates, by increasing the number of individuals analyzed (Futschik and Schlötterer, 2010; Toonen et al., 2013). Following DNA extraction, between 20 and 50 individuals collected in 2017 were pooled by sampling location (latitude) and depth, resulting in a total of six pools for Illumina sequencing. As mentioned above, two pools (P1 and P2) containing 20 individuals identified by Henriques et al. (2017) as belonging to two genetic clusters in South Africa were also included. DNA concentrations were standardized to ensure equal representation of individuals within each pool, to a final concentration of 3000 ng/μl. Pooled samples were flash frozen and sent to the Hawaii Institute of Marine Biology (HIMB) for library construction and 2 × 300 bp Paired-End Mi-Seq Illumina sequencing, following a specific Restriction-Site Associated DNA sequencing (RAD-Seq), the ezRAD protocol first described by Toonen et al. (2013). Isochimozer enzymes Mbo1 and Sau3AI were used for ezRAD preparation and DNA double digestion, following the library preparation protocols described by Toonen et al. (2013) and Knapp et al. (2016) (refer to Supplementary Material 1 for further details).
Bioinformatic Analyses
Reads were received from HIMB as fastq files. All raw reads were trimmed in TrimGalore! 0.4.4 (Babraham Bioinformatics, 2017) with overrepresented sequences, adapter sequences, and reads with a Phred quality score below 25 (Q < 25) removed. The success of these initial quality control steps was assessed in FASTQC (Basespace Illumina platform; Andrews, 2010), and trimmed reads were used for further analyses. In order to obtain a predominantly nuclear DNA (nDNA) dataset, potential mtDNA reads were filtered from the original data by mapping quality controlled reads to the mitochondrial genome of Atlantic cod, Gadus morhua (Genbank HG514359.1), in BWA-MEM 0.7.13 (Li and Durbin, 2009). SAM files were converted to BAM file format then sorted by position, with ambiguous reads with a mapping quality below 20 (MAPQ < 20) removed in SAMtools 1.3 (Li et al., 2009; Supplementary Material 1). The obtained mtDNA files from all pools were merged and filtered from the original quality-controlled reads using the “filterbyname.sh” script of BBMAP (Barnett et al., 2011), resulting in a set of filtered and mtDNA-free fastq files per pool.
Filtered reads were assembled de novo in SPAdes (Bankevich et al., 2012), creating a Kingklip-specific nDNA reference sequence (nDNA_ref). SPAdes employs multiple k-mer values for assembly (Bankevich et al., 2012), with multi-kmer assemblers largely outperforming approaches based on a single k-mer value (Durai and Schulz, 2016). K-mer lengths of 19, 21, and 31 were selected for the de novo assembly based on the outputs of KmerGenie (Chikhi and Medvedev, 2014). Assembly statistics including number of contigs, total contig length, largest contig, N50 and L50 were estimated in Quast (Gurevich et al., 2013). Due to the effectiveness of NGS sequencing approaches (such as ezRAD) in capturing large portions of the mtDNA genome, the largest contig of the resulting reference sequence (nDNA_ref) underwent a BLASTN search to ensure the successful removal of mtDNA reads (Hahn et al., 2013; Ding et al., 2015). Filtered and cleaned reads were mapped to the reference sequence (nDNA_ref) using BWA-MEM 0.7.13 (Li and Durbin, 2009). The resulting SAM files were filtered to remove ambiguous reads and any reads with a mapping quality score of less than 20 (MAPQ < 20), converted into BAM file format and sorted by position (SAMTools; Li et al., 2009). Sorted BAM files (nDNA_BAM) were subsequently used for SNP/variant calling (further details provided in Supplementary Material 1).
SNP calling was completed using the SAMtools “mpileup” command (Li et al., 2009). Calling was completed per sampling site/pool (Per region SNPs; pileup), to allow for calculation of regional diversity measures per sampling site/pool. In addition, SNP calling was completed for all sampling sites/pools combined (combined SNPs; mpileup) to assess patterns of population sub-structuring and connectivity. The mpileup file (combined SNPs) was converted to a sync file with the “mpileup2sync.pl” in PoPoolation2 (Kofler et al., 2011b). The resulting pileup files (per region SNPs) and sync file (all regions combined SNPs) were used for subsequent analyses.
Diversity Measures
Summary measures of genomic diversity were calculated from individual pileup files in PoPoolation 1.2.2 (Kofler et al., 2011a), using the “variance-sliding.pl” (Supplementary Material 1). Nucleotide diversity (Tajima’s π), population mutation rate (Watterson’s θW) and Tajima’s D were calculated per pool, using a window- and step-size of 100 bp, a minimum count of three reads (or two, for Tajima’s D), a minimum coverage of 10 and a maximum coverage of 500. For the overall mpileup file, SNPs were identified based on a minimum count of four, a minimum coverage of 20 and a maximum coverage of 500 reads, using the “snp-frequency-diff.pl” command in PoPoolation 2 (Kofler et al., 2011b; Supplementary Material 1). These parameters were set to prevent the possible loss of rare alleles and/or inclusion of sequencing errors, with too low a minimum count and coverage potentially resulting in the inclusion of sequencing errors, whilst too strict a minimum count and coverage potentially resulting in a loss of rare alleles (Kofler et al., 2011b). “Reference call” (rc) SNPs were filtered out in order to retain SNPs that are present among sampling sites (pop) only. Only biallelic SNPs were used in all subsequent analyses, as non-biallelic SNPs are more likely to represent sequencing errors (Kumar et al., 2012). Resulting allele counts were used to identify the total number of biallelic SNPs, as well as private biallelic SNPs per pool.
Putative Outlier Detection
For the purpose of this study, putative outlier loci were identified using three methodologies, Bayesian-, empirical- and Principal Component Analysis (PCA)-based approaches. Based on stringent filtering criteria, a subset of previously identified biallelic, “pop” SNPs were used for outlier detection, with biallelic SNPs requiring a minimum allele count of four, minimum coverage of 28 reads and maximum coverage of 100 reads. This was done to reduce the potential influence of false positives, with a target coverage of 28 selected based on the median number of samples per pool and a maximum coverage of 100 to reduce the inclusion of over-duplicated regions.
Sync files and biallelic SNP lists were used to create a Genepop file (Rousset, 2008) using the “subsample-sync2GenePop.pl” command in PoPoolation2 (Kofler et al., 2011b), and based on the median number of samples per pool (N = 28). The resulting Genepop file was then edited and converted into Bayescan file format using PGDSpider2 v2.1.03 (Lischer and Excoffier, 2012). Outlier loci were identified in Bayescan 2.1 (Foll and Gaggiotti, 2008) based on a total of 40 pilot runs of 5,000 iterations each and a burn-in period of 50,000 reversible jump chains with a thinning interval of 20 employed. Prior odds were set to 100, suitable for thousands of loci, with a False Discovery Rate (FDR) of 0.05 used to identify candidate outlier loci. The second method employed an empirical outlier detection approach in PoPoolation2 (Kofler et al., 2011a). Pairwise FST values were calculated for each SNP using the “fst-sliding.pl” command of PoPoolation2 (Kofler et al., 2011b). SNPs/loci falling into the upper 95th percentile of the empirical distribution of pairwise FST values were subsequently identified as outlier loci. Finally, outlier loci were identified using the R package pcadapt (Luu et al., 2017), with loci excessively related to structure (q-value < 0.05) identified as candidates for selection (Luu et al., 2017).
Potential outliers identified by either of the three approaches were subsequently removed from the “full” dataset, producing both “neutral” (putative outlier loci removed) and “outlier” (outlier loci only) datasets to be used for downstream population sub-structuring analyses. The loci identified by two of the three methodologies were further investigated in BLASTX (NCBI; National Center for Biotechnology Information, 2018) to assess if they had a functional response. Searches were done using default parameters and the non-redundant protein sequence database.
Population Sub-Structuring Analyses of Kingklip in Southern Africa
All population sub-structuring analyses were performed on three datasets: “full” (neutral and outlier loci), “neutral” (neutral loci only) and “outlier” (putative outlier loci only). Three different approaches were used. Firstly, we estimated pairwise differentiation levels (Weir and Cockerham’s fixation index, FST), between all pools using the “diffCalc” command of the R package diveRsity (Keenan et al., 2013). 95% Confidence intervals (95% CI) were calculated based on 1,000 bootstrap replicates to assess statistical significance, with diveRsity employing a bias corrected bootstrapping method for multiple testing. Secondly, a PCA, based on SNP allele frequencies per pool, was employed to visualize the relationship between the proposed groupings. This method does not require prior information regarding Hardy-Weinberg Equilibrium (HWE) or Linkage disequilibrium (LD), and is thus suitable for pooled data sets. PCAs were generated in R using the “prcomp” function (R Core Development Team, 2008), based on allele frequencies per pool, with allele counts estimated from sync files using the “snp-freq-diff.pl” command of PoPoolation2 (Kofler et al., 2011b). Finally, population clustering was further investigated using the software Bayesian Analysis of Population Structure (BAPS; Corander and Marttinen, 2006). Clustering analyses were performed on both the “full” and “outlier” datasets with number of clusters K = 1–10 tested. The mixture analysis “Clustering of groups of individuals” was performed, with the resulting binary files used to evaluate the statistical significance of clusters (p < 0.05). Admixture coefficients were estimated after 100 iterations.
Genetic Versus Genomic Differentiation of Kingklip
In order to determine if the observed clustering found by Henriques et al. (2017) could still be identified using the SNP nDNA dataset, pairwise comparisons as well as multivariate analyses were performed for the P1 and P2 pools as well as the 2017 South African pools. In addition, in order to assess the possibility of a marker-effect, previously employed microsatellite primer sequences (Ward and Reilly, 2001) were mapped to the de novo nDNA reference to determine to what extent they were represented in the RADseq reference sequence and, consequently, SNP datasets. Mapping was conducted in Bowtie2 (Langmead and Salzberg, 2012), with the “-sensitive” option and allowing for a mismatch rate of 0.05 (Daley et al., 2000; Smith and Paulin, 2003), as these primers were initially developed for the sister-species G. blacodes (Ward and Reilly, 2001).
Population sub-structuring among P1, P2 and South Africa-only pools was assessed based on pairwise genetic differentiation levels (FST), PCA plots and BAPS analyses as outlined above. The possible influence of the methods for calling, as well as the final number of SNPs on the patterns of genetic differentiation observed between P1, P2 and the 2017 South Africa sampling sites was investigated. In order to do so, the most informative loci contributing to the differentiation of P1 and P2 were identified. Based on the PCA of P1 versus P2 generated for the “full” dataset, the contribution of each locus to the differentiation of P1 versus P2 was determined using the “get_pca_var,” “var$contrib,” and “fviz_contrib” commands of the FactoExtra 1.0.5 R package (Kassambara and Mundt, 2017). Relative contributions were then ranked to identify the top 500 loci (± 5%) contributing to the observed differentiation, resulting in a “top 500” dataset for P1, P2 and the 2017 South African sampling sites/pools. Population sub-structuring analyses were subsequently performed on these “top 500” loci to compare results to the “full” dataset, by estimating pairwise genetic differentiation levels, and generating a PCA based on the SNP allele frequencies per pool, as before.
Outlier detection was performed on the “top 500” dataset, using the same three methodologies described above: Bayescan 2.1 (Foll and Gaggiotti, 2008), PoPoolation2 (Kofler et al., 2011b), and pcadapt (Luu et al., 2017). Loci identified by two of the three outlier detection methods were subsequently recognized as candidate outlier loci, and their functional role evaluated by blasting 1 000 bp upstream and downstream of the candidate outlier SNP to online database BLASTX (Hess et al., 2015), using default parameters and the non-redundant protein sequence database.
Results
Sequencing, Quality Control, and Assembly
A total of 42.7 million paired-end reads were received following ezRAD sequencing, with an average of 5.3 million paired-end reads per pool. After trimming, adapter removal and removal of mtDNA reads, 41.8 million reads remained (Supplementary Table 2). De novo assembly of filtered reads produced a nuclear reference sequence containing 269,771 contigs, with the longest contig being 7,228 bp and N50 and L50 equalling 918 and 91,520 bp, respectively. A total of 15,246 quality-controlled reads were found to map to the mtDNA genome of G. morhua (16 696 bp). Following removal of these reads, BLASTN results of the largest nDNA contig found no mtDNA, thereby suggesting the successful removal of the majority of mtDNA reads. Finally, 32.5 million (77.75%) filtered reads mapped to the nDNA_ref, with an average of 4.1 million reads per pool, ranging from 3,390,428 (P1) to 4,533,875 (CB) reads (Supplementary Table 2).
Regional Diversity
A total of 41,369 biallelic SNPs were identified across all pools with the number of biallelic SNPs per pool ranging from 23,564 (P2) to 27,838 (CB), with private biallelic SNPs ranging from 79 (EC) to 167 (CB) SNPs per pool, representing less than 1% of the total (Table 2). Genome-wide diversity measures ranged from π = 0.014 (NAM1) to π = 0.020 (P1), θW = 0.014 (NAM1) to θW = 0.021 (P1) and D = −0.550 (P1) to D = −0.433 (NAM2), with an average of π = 0.017, θW = 0.017 and D = −0.466 across all pools (Table 2). All pools displayed negative Tajima’s D values (Table 2).
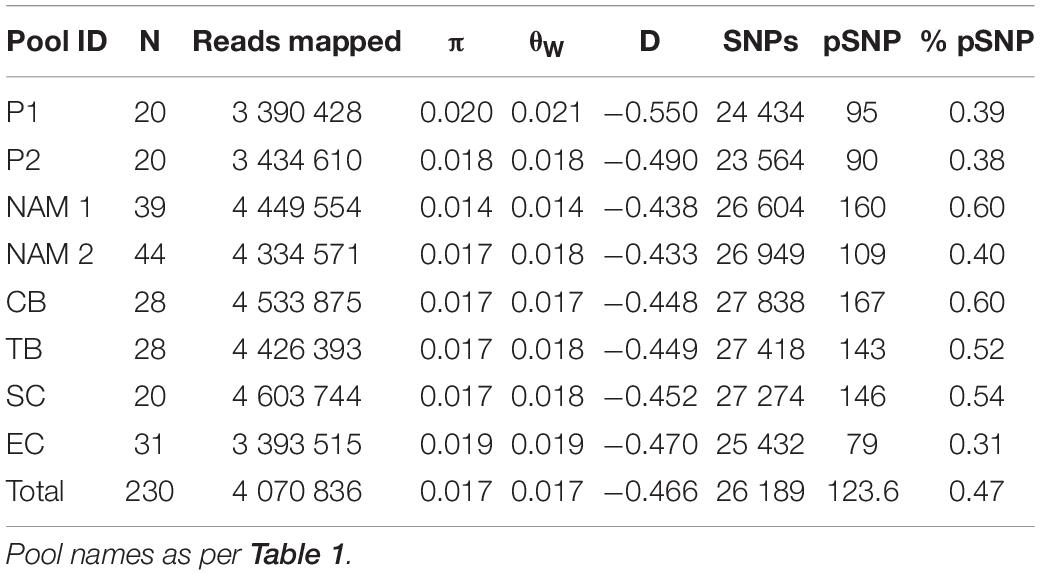
Table 2. Regional diversity measures per pool for kingklip: N – number of individuals; π – nucleotide diversity (Tajima’s); θW – population mutation rate (Watterson’s); D – Tajima’s index; SNPs – total number biallelic loci; pSNP – private biallelic SNPs, and% pSNP – percentage private biallelic SNPs.
Overall, the pool consisting of kingklip sampled at the most northern site (NAM1) exhibited the lowest genomic diversity levels, despite having one of the highest number of private SNPs (0.60%—Table 2 and Supplementary Table 3). In contrast, genomic diversity measures were relatively similar across all South African samples, with EC exhibiting the highest levels of π and θW, despite having the lowest number of private SNPs (0.31% – Table 2 and Supplementary Table 3).
Putative Outlier Detection
Putative outlier loci were identified from a more stringent SNP calling dataset, totalling 10 068 loci. While Bayescan analyses identified one locus, empirical outlier detection using Popoolation2 and pcadapt detected 678 and 179 outlier loci, respectively (Supplementary Figure 1). Only one outlier locus was shared among all methods, while 24 loci were identified by Popoolation2 and pcadapt (Supplementary Figure 1). The number, major allele frequency and combination of the 25 candidate outliers identified by more than one method varied across pools, ranging from 21 (EC) to 25 (NAM 1) putative outliers per pool (Supplementary Figure 1 and Supplementary Table 4). BLASTX searches of the 20 outlier contigs matched largely to hypothetical and uncharacterized proteins, with some involved in cellular transport, regulation and functioning, as well photoreception, hearing and sensory transduction (Supplementary Table 4).
The final “neutral” dataset contained 9,236 loci (91.74%), whereas the final “outlier” dataset contained 832 loci identified by either of the three methods (8.26% – loci identified by at least one of the outlier detection method).
Population Sub-Structuring of Kingklip Across Southern Africa
Overall, pairwise genomic differentiation based on the “full” (FST = 0.005) and “neutral” (FST = 0.002) datasets were low, and not different from 0 (Table 3). Clustering/sub-structuring analyses (PCA and BAPS) based on the “full” datasets did not retrieve obvious population groupings (Figures 2A, 3A), although the PCA did suggest some level of isolation of NAM1 and EC from the remaining samples (Figure 2A). The “outlier” dataset, on the contrary, retrieved higher and statistically significant levels of differentiation for many comparisons (Table 3). However, the retrieved geographic pattern of differentiation was complex, with NAM1 and EC significantly different from all pools (except NAM1—CB comparison: FST = 0.034, 95% CI = −0.001 to 0.097), while NAM2 was only significantly different from SC (FST = 0.003, 95% CI = 0.003–0.100; Table 3). Similarly, the PCA based on the “outlier” dataset showed a complex pattern (Figure 2B). The two first axes explained 44.6% of the total variation, and supported the findings of the pairwise comparisons, with three main clusters observed: NAM1, EC, and all other pools (Figure 2B). Clustering analyses in BAPS using the “outlier” dataset detected two clusters: one containing all pools from the western and southern coasts of Southern Africa, and another containing only the EC pool (Figure 3B).
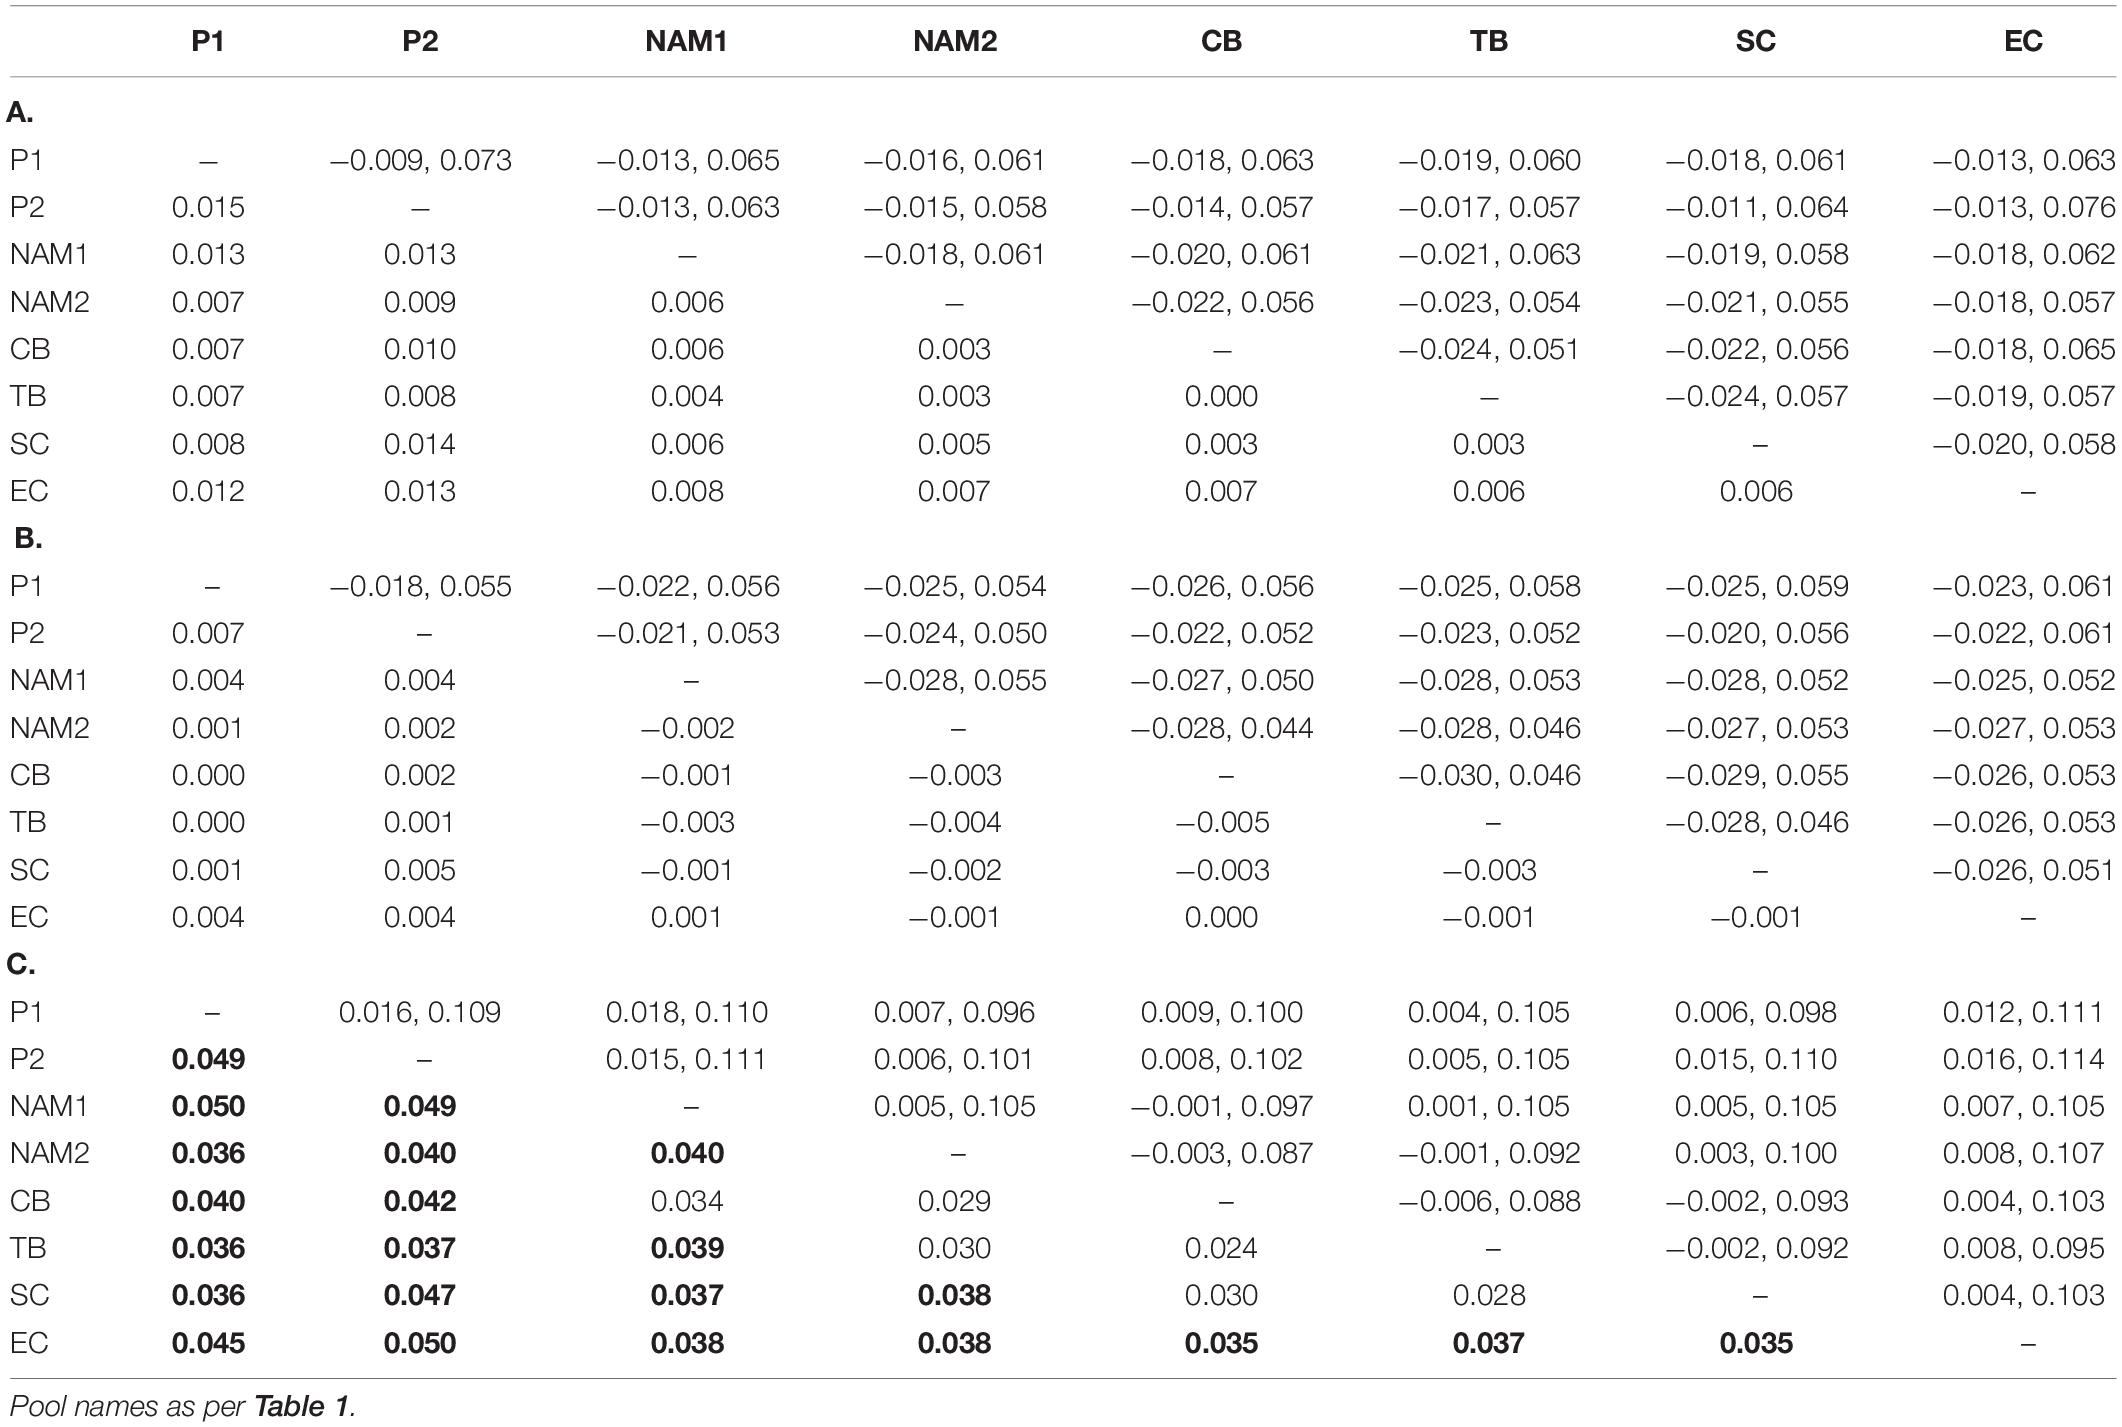
Table 3. Estimates of pairwise genomic differentiation (FST, below diagonal) and 95% confidence intervals (above diagonal) for all sampling sites/pools, based on (A) full (outlier ad neutral loci), (B) neutral (neutral loci only), and (C) outlier (outlier loci only) datasets. Statistically significant results in bold.
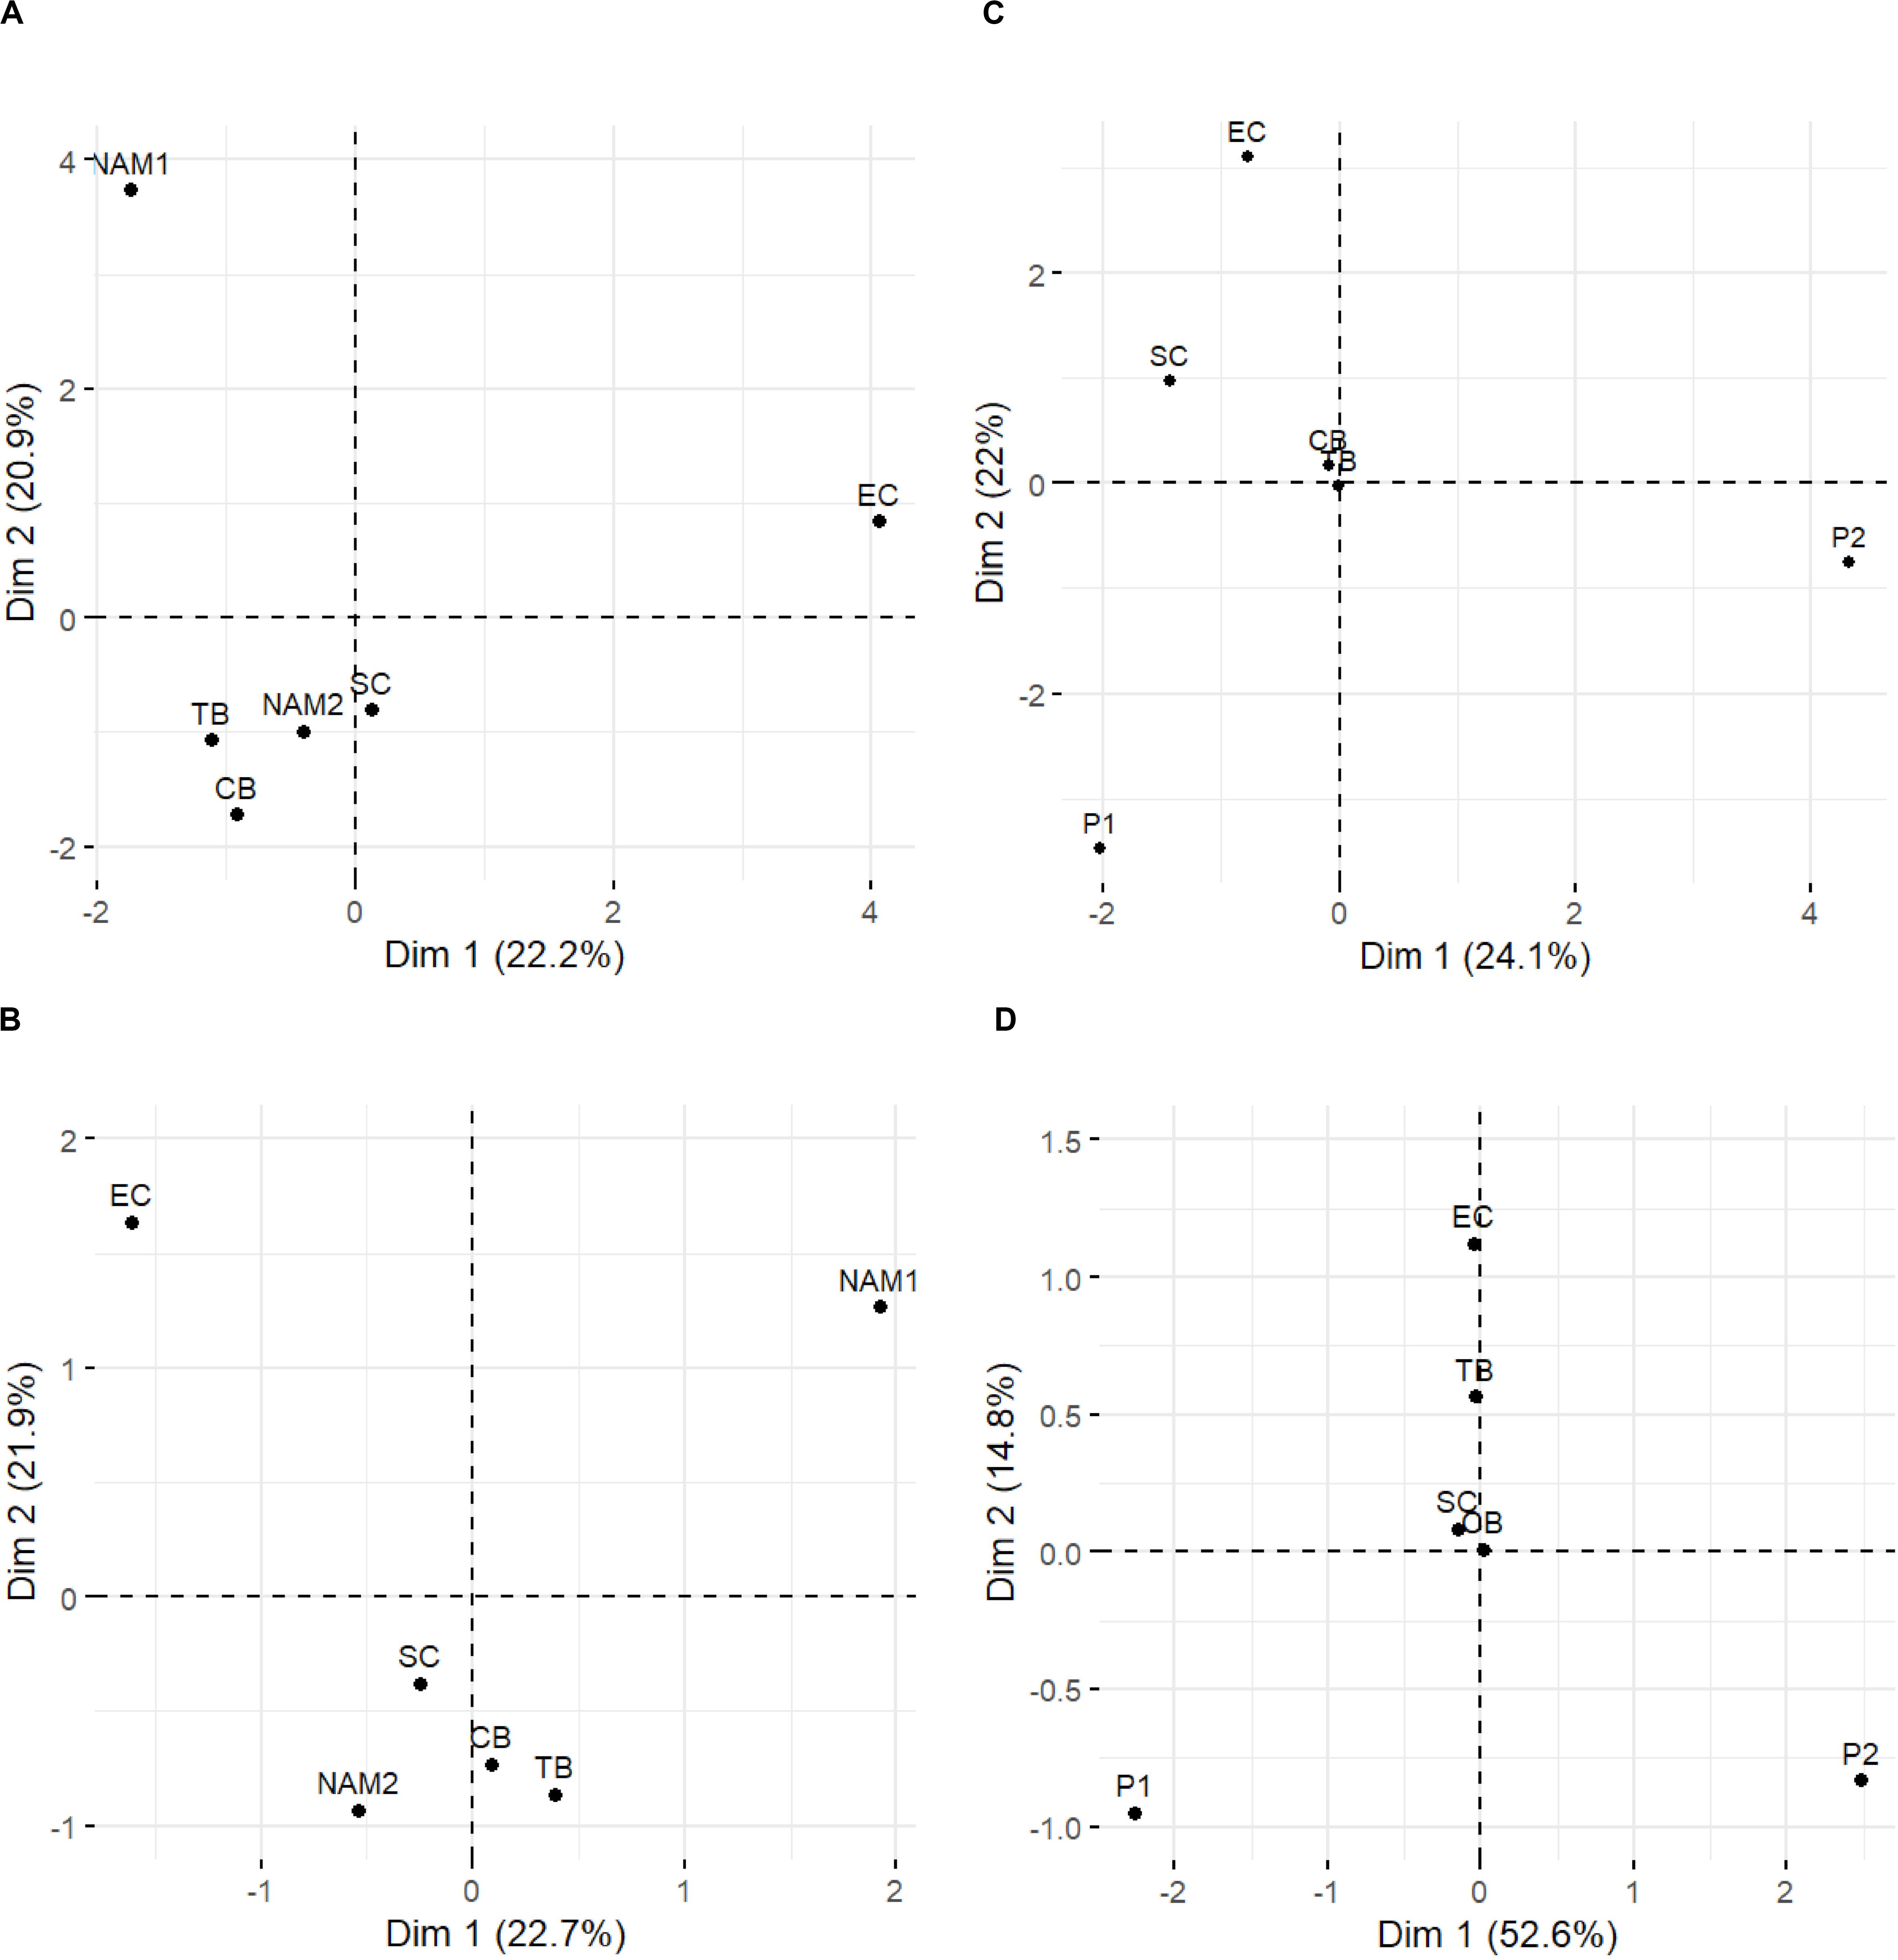
Figure 2. Principal component analysis (PCA) of variation in allele frequencies per pool, based on full (neutral and outlier loci – A) and outlier loci (B) for the 2017 samples, as well as full (C), and top 500 loci (D) for the South African comparisons. Pool names as per Table 1.
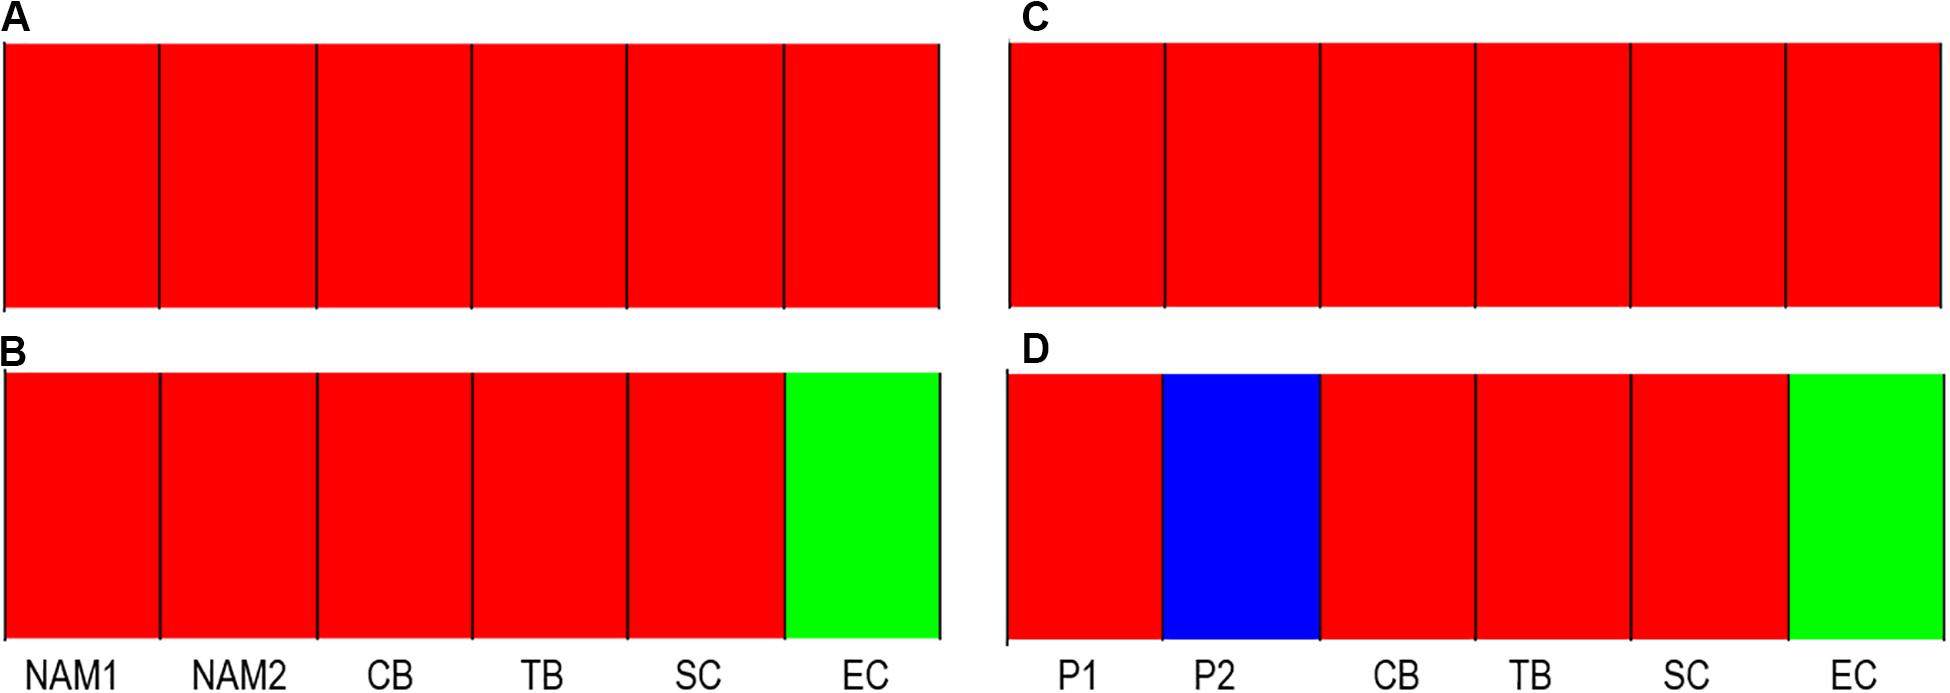
Figure 3. BAPS Bayesian clustering analysis for full (neutral and outlier loci – A) and outlier (B) datasets for the 2017 samples, as well as full (C), and outlier datasets (D) for the South African comparisons. Pool names as per Table 1.
Genetic Versus Genomic Patterns of Differentiation
A total of six of 10 previously described microsatellite loci mapped to the de novo reference sequence, with at least one read mapping per primer pair (Supplementary Table 5). Of these six primers, only two had both the forward and reverse sequences mapped: cmrGb2.6.1 and cmrGb5.8B. It must be noted, however, that some primer sequences were found to be split between nodes, with forward and reverse sequences mapping to different nodes along the reference sequence. Interestingly, none of the contigs to which primer sequences mapped to contained either neutral or outlier SNPs. Therefore, although microsatellite primer sequences were found within the generated reference sequence, no SNP variation was captured within these repeat regions.
As observed for the complete dataset, the pairwise FST values estimated for the comparison between P1 and P2 were not significantly different from 0, based on the “full” (FST = 0.015, 95% CI = −0.0089, 0.0732) and “neutral” (FST = 0.007, 95% CI = −0.0178, 0.0552) datasets (Table 3). However, genetic differentiation was found to be statistically significant (FST = 0.049, 95% CI = 0.0156, 0.1091) when using the outlier dataset of 832 loci (Table 3). This pattern did not change with the inclusion of the 2017 South African samples, with only the “outlier” dataset detecting significant differentiation levels (average FST = 0.037, Table 3), with significant differentiation found for 12 out of 15 pairwise comparisons. Here, four distinguishable sub-populations were detected among the six sampled pools: P1, P2, West coast (CB, TB, SC) and EC (Table 3).
Although FST values based on the “full” dataset suggest the existence of a single population, the obtained PCAs revealed a geographically ordered pattern, with neighboring West coast sites CB and TB clustering together and differing from southern and eastern coast sampling sites SC and EC, along axis 1 (Figure 2C). Previously identified clusters P1 and P2 appeared to differentiate from 2017 South African sampling sites along axis 2, with P1 and P2 failing to group with any 2017 South African sampling sites (Figure 2C).
Bayesian clustering analysis revealed a single cluster (K = 1, p < 0.05; Figure 3C). However, when analyses were conducted on the outlier dataset, three clusters (K = 3, p < 0.05; Figure 3D) were identified, with cluster one consisting of 2017 sampling sites found west of the Agulhas Bank (CB, TB, and SC) as well as P1, and cluster two and three represented by sampling sites P2 and EC respectively (Figure 3D). Notably, in contrast to what was observed for outlier FST values, the pool P1 was found to cluster with CB, SC, and TB, while the separate clustering of P2 and EC was in line with FST patterns of differentiation.
As expected, pairwise differentiation of P1 versus P2 based on the top 500 loci was higher and statistically different from zero (FST = 0.111; 95% CI = 0.0683–0.01729; Table 4). In addition, patterns of differentiation and sub-structuring among P1, P2, and contemporary 2017 South African sampling sites were also different from the previously obtained results, regardless of the dataset used (Table 3). Namely, pairwise FST estimates of P1 versus CB, TB and SC were found to be non-significant, suggesting the possible relation of these pools with P1 and contrasting the previous FST estimates based on the outlier dataset (Table 3). Furthermore, P2 was found to be significantly different from TB (FST = 0.040, 95% CI = 0.0015–0.1109) and SC (FST = 0.044, 95% CI = 0.0074 – 0.1212), but not from CB (FST = 0.036, 95% CI = −0.0013 – 0.1122; Table 4). As with FST estimates based on outlier loci alone, EC was found to be significantly differentiated from P1 and P2 (Table 4).
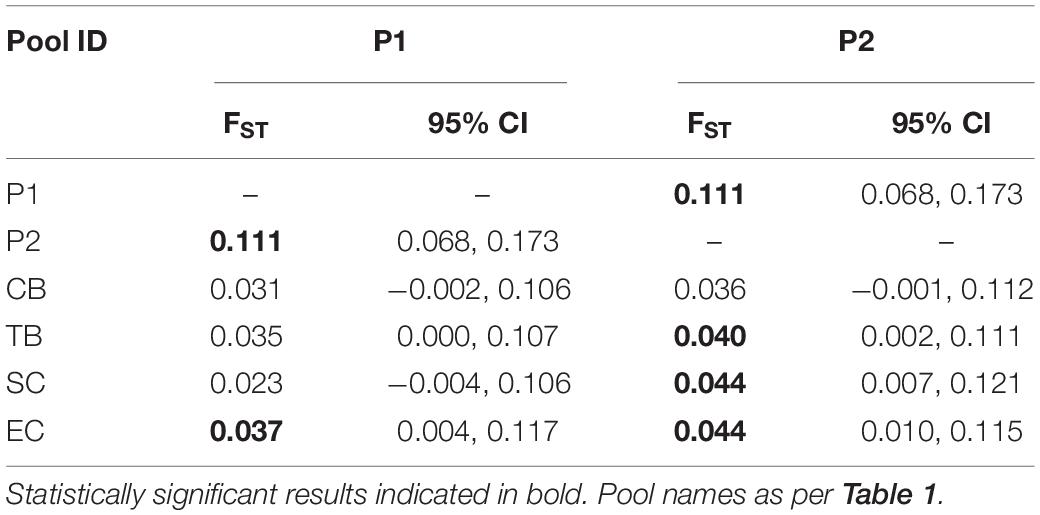
Table 4. Estimates of pairwise genomic differentiation (FST) and 95% confidence intervals (95% CI) for South African sampling sites/pools, based top 500 loci dataset.
The generated PCA revealed similar patterns of differentiation as found by the PCA based on the full dataset: P1 and P2 remained differentiated from all 2017 South African sampling sites (Figure 2D). The observed patterns of differentiation potentially reflected pairwise FST estimates, with EC found to be largely differentiated from all sampling sites along the second axis (Dim 2 = 14.8%). Whilst 2017 South African sampling sites fall largely between P1 and P2 along the principal axis (Dim 1 = 52.6% variance).
Outlier analysis of the top 500 loci identified 32 outlier loci. Empirical outlier detection through PoPoolation2 (Kofler et al., 2011b) identified a total of 32 (6.45%) outlier loci, whilst pcadapt (Luu et al., 2017) identified four (0.8%), and Bayescan (Foll and Gaggiotti, 2008) failed to identify potential outlier loci. Four outlier loci were identified by both pcadapt and PoPoolation2 analyses, with two of the four outlier loci matching to protein sequences of known function (Supplementary Table 6).
Discussion
Advances in sequencing technologies have allowed for genome-wide studies to be conducted on a range of organisms, including non-model species (Helyar et al., 2012; Hess et al., 2015; Carreras et al., 2017). In this study, we utilized a pooled RADseq approach to identify genome-wide SNPs for kingklip, a valuable resource distributed around Namibia and South Africa. Our findings corroborate those of a previous study (Henriques et al., 2017), showing population differentiation within South African waters between the Benguela (West Coast) and Agulhas (South Coast) Currents ecosystems. Furthermore, the inclusion of samples from the northern Benguela region (Namibia) showed differentiation between kingklip in the northernmost area of the species distribution and those further south. The genetic structure of a species is shaped by the interaction of different micro-evolutionary forces, namely genetic drift, gene flow, selection and mutation (Gaggiotti et al., 2009; Carreras et al., 2017). However, as a result of generally large effective population size (Ne) for many marine species, such as kingklip, the effects of genetic drift are likely to be minimal (Allendorf et al., 2010; Tigano and Friesen, 2016; Carreras et al., 2017; Dennenmoser et al., 2017; Mullins, 2017). Selection and gene flow are predicted to have a stronger effect in influencing allele frequency differences between populations of marine species (Allendorf et al., 2010; Carreras et al., 2017; Mullins, 2017), and the observed genetic structure found in kingklip may be a product of these two forces. By separating neutral (gene flow) and outlier (putatively under selection) loci, inferences regarding the relative role of these two components in shaping the observed patterns of differentiation can be made, revealing complex spatial patterns of population sub-structuring in southern African kingklip.
Genome-Wide Levels of Diversity
Genomic diversity measures of kingklip were found to be largely similar across its distribution. The number of SNPs did not vary strongly among pools (average 26,919 SNPs), although the EC had the lowest number of private SNPs detected. Average genomic diversity for southern African kingklip was estimated at π = 0.017, with fishes sampled from the northernmost part of their distribution (central Namibia) exhibiting the lowest values, but one of the highest number of private SNPs (160–0.6%). All samples exhibited negative values of Tajima D, suggesting the occurrence of a past demographic expansion (Tajima, 1989; Fischer et al., 2017; Henriques et al., 2017). Henriques et al. (2017) suggested that this past expansion could be linked with historical changes in oceanographic conditions in the region. Alternatively, the observed negative Tajima D values may reflect the recovery of kingklip abundance/spawning biomass from the over-exploitation during the 1980s, following the closure of the directed longline fishery (Brandão and Butterworth, 2013). Further work using individual-based sequencing analyses should be conducted to assess the likelihood of these two hypotheses, and the current status of the Ne of kingklip.
Detection of Putative Outlier Loci
The detection of highly differentiated loci (referred here as “outlier loci”) across the kingklip genome provide evidence for the possible influence of selection, suggesting that local adaptation might be more common in species with high levels of gene flow than previously predicted (Hauser and Carvalho, 2008; Bradbury et al., 2012; Benestan et al., 2015; Guo et al., 2015; Dennenmoser et al., 2017). However, although such loci were identified as significantly different does not itself provide evidence for their role in adaptation and their true function remains unknown. Taking into account all SNPs identified as putative outliers, ∼8%, is largely consistent with patterns of past studies, where between 5 and 10% of the genome was considered to be under selection (Nosil et al., 2009; Galindo et al., 2010; Bradbury et al., 2012; Strasburg et al., 2012; Guo et al., 2015, 2016). Additionally, those loci identified by more than one method provided insights into the possible selective pressures acting within kingklip populations. Interestingly, candidate outlier loci were shared between the majority of pools, with no private outliers identified, despite considerable environmental variation across sampled sites. This shared “adaptive” variation may result from high levels of connectivity, as previously reported for kingklip (Grant and Leslie, 2005; Henriques et al., 2017). Furthermore, observed patterns of shared putative adaptive variation may indicate the influence of common selective pressures experienced by kingklip, across both space and time. Similar evidence for high levels of shared adaptive variation between sites has been reported for several other species, including Atlantic salmon (Salmon salar – Freamo et al., 2011), southern African seagrass (Zostera capensis – Phair et al., 2019) as well as Atlantic cod (G. morhua – Nielsen et al., 2009). On the contrary, observed shared adaptive variation may be due to the reduced genomic cover obtained through the RADseq approach employed within this study, with the lack of genome-wide coverage potentially resulting in several loci under selection being missed (Lowry et al., 2017). Future studies incorporating candidate gene and functional genetic approaches, as well as whole genome coverage, may aid to identify additional outlier loci (Lowry et al., 2017).
The majority of candidate outliers were found to map to genes and/or proteins involved in signal transduction, nucleic-acid binding and catalytic activity. Certain outlier loci were found to be within genomic regions related to genes and/or proteins involved in vision (myosin IIIA protein), haemostasis (von Willebrand Factor; vWF protein) and adipogenesis (VPS13 gene). The identification of outlier loci found to be associated with these genes and proteins may therefore indicate potential selective forces acting on different physiological processes in southern African kingklip.
Ultimately, while genome scans prove highly valuable in identifying loci that may be under selection (Nielsen et al., 2009; Seeb et al., 2011; Limborg et al., 2012; Milano et al., 2014), demonstrating the adaptive significance and function of these loci requires selection experiments and functional tests, a considerable challenge within marine systems. However, given the number of loci as well as multiple analytical approaches employed, the hypothesis of selective pressures acting in differentiating kingklip populations cannot be refuted at this point.
Population Sub-Structuring of Kingklip Across Southern Africa: Genome-Wide Patterns of Isolation
This study provides novel insights into population sub-structuring patterns of kingklip across the Benguela and Agulhas Currents region, encompassing the entire distributional range of the species. While population genetic analyses based on the “full” and “neutral” datasets did not reveal significant departures to the hypothesis of panmixia (although samples from the Eastern Cape of South Africa always had higher levels of divergence), the “outlier” dataset identified three major genomic clusters across the region: (1) central Namibia, (2) southern Namibia plus West Coast South Africa, and (3) South Coast of South Africa. This “neutral” versus “outlier” discrepancy has been observed for other marine species (e.g., Atlantic herring – Guo et al., 2016; European hake – Milano et al., 2014, and Atlantic cod – Hemmer-Hansen et al., 2014). While neutral markers are highly valuable for elucidating connectivity patterns and demographic history, outlier loci have been shown to increase resolution to detect subtle levels of genetic divergence, particularly for species with characterized by high gene flow (Lamichhaney et al., 2012; Raeymaekers et al., 2017).
Interestingly, our results based on the “outlier” dataset are mainly congruent with previous morphological studies that identified three stocks of kingklip (“Walvis,” “Cape,” and “South East” stocks – Payne, 1977, 1985), and of two spawning grounds off South Africa (Olivar and Sabatés, 1989). In addition, these results further support the findings of Henriques et al. (2017), which reported the presence of two populations of kingklip off South Africa, with the EC population strongly differentiated. These findings are also largely similar to those reported for another demersal fish in the region, the shallow-water hake Merluccius capensis. In a study using microsatellite loci, Henriques et al. (2016) observed a significant genetic differentiation between northern and southern Benguela samples. Kingklip and shallow-water hake are sympatric species that co-occur at similar depths and are targeted by the same longline fishery. Therefore, it is likely that the observed genomic differentiation in kingklip results from a combination between demographic history (e.g., different spawning grounds) and the influence of regional oceanographic features, as suggested for shallow-water hake.
Despite several oceanographic and coastal features found within this area, our results indicate on-going connectivity across the Orange River region for kingklip (Shannon et al., 1992; Hutchings et al., 2009), with no significant differentiation observed between southern Namibia (Nam 2) and the western South African regions (CB, TB), regardless of the analyses or dataset employed. In fact, the observed genetic break appears to occur south off the coast of Lüderitz, at 26°S, with central Namibia (NAM1 – ± 23°S) found to be significantly differentiated from the remaining southern Benguela regions (Nam 2 – ± 27°S, CB, TB and SC – 30 – 34°S). The Lüderitz upwelling cell represents the most intense as well as persistent upwelling cell within the region (Parrish et al., 1983; Boyd, 1987; Lett et al., 2007), dividing the Benguela into a northern and southern sub-system. This feature has been identified as a barrier to gene flow for several marine species, including silver kob (Argyrosomus inodurus), leervis (Lichia amia), geelbek (Atractoscion aequidens), and shallow-water hake (Henriques et al., 2012, 2014, 2015, 2016; Mirimin et al., 2016). In addition, the observed differentiation within the southern range of kingklip’s distribution appears to coincide with two distinct biogeographic provinces, the warm temperate region found along the south coast, and the cool temperate region occurring off the west coast (Hutchings et al., 2009). Here, Cape Point and Cape Agulhas are two well-known phylogeographic barriers for several marine species (although all available evidence comes from coastal species; Teske et al., 2011), and appear to also coincide with the observed genomic divergence in kingklip within South Africa. Another possible explanation for the observed patterns of differentiation, where NAM1 was differentiated from all other pools except CB, while NAM2 was not different from CB and TB, but diverged from TB, might be linked with the sequencing method used. Although Pool-Seq has been shown to reliably distinguish between populations, grouping multiple individuals together without prior knowledge of fine-scale population structure might lead to “mixed” pools, and thus lower genetic differentiation values. If this was the case, our results suggest that spatial mixing of the three populations might occur throughout the region. We recommend that further studies aiming to unveil fine-scale movement patterns of kingklip rely on individual-based sequencing approaches.
The fact that genomic divergence in kingklip across the Benguela Current region was only observed using “outlier” loci suggests some level of local adaptation and spawning site fidelity. In fact, significant environmental variation, relating to salinity, upwelling patterns, bathymetric profiles and low oxygen availability, is observed across this system. Seasonal upwelling and associated low oxygen water (LOW) events in the southern Benguela system contrast to year-round LOW in the north (Shillington et al., 2006; Hutchings et al., 2009). For the shallow-water hake, seascape analyses identified significant associations between genetic divergence, upwelling events and bathymetry, suggesting the potential occurrence of local adaptation and Isolation-by-Environment across the Benguela for this species (Henriques et al., 2016).
In addition, homing behavior has been identified as a key mechanism underlying patterns of population divergence in marine fishes (Lundy et al., 2000). In particular, population sub-structuring has been linked to homing behavior for several wide-ranging, high gene flow species such as mackerel (Scomber scombrus – Nesbo et al., 2000), herring (Clupeus harengus – McQuinn, 1997) and European hake (M. merluccius – Lundy et al., 2000). As such, given the evidence for high levels of gene flow across the Benguela region, homing behavior may similarly act to maintain observed patterns of kingklip divergence. Moreover, taking into account the high degree of gene flow observed, it is argued that some level of homing behavior is required to allow for signals of divergence to be detected. Currently information regarding the occurrence of kingklip homing behavior, as well as the possible position of spawning sites/aggregations along the Namibian coastline is limited, with anecdotal evidence from fisheries suggesting the presence of a spawning component in southern Namibia (Japp, personal communication). Additionally, and often working in conjunction with homing behavior, local larval retention may similarly act to maintain as well as promote divergence, through a reduction in gene flow and recruitment between spawning aggregations/sites (Waters and Roy, 2004; Bernadi, 2013; Milá et al., 2017). Upwelling cells have been shown to disrupt larvae and egg movement, promoting local larval retention on either side of the upwelling region (Waters and Roy, 2004; Lett et al., 2007; Henriques et al., 2014). While information regarding the potential location of kingklip spawning sites in relation to the observed genetic break is unavailable, the environmental conditions within the Lüderitz upwelling region are proposed to be unsuitable for the recruitment and survival of larvae, with the spawning aggregations of several fish species found to occur on either side of the upwelling region (Olivar and Fortuño, 1991; Olivar and Shelton, 1993; Sundby et al., 2001; Lett et al., 2007).
One of the caveats of the present study is the lack of seasonality in the sampling scheme. All 2017 samples were collected during summer, and as such, we cannot make inferences regarding the stability of the boundaries of the observed populations. However, a recent study on Shallow-water hake, M. capensis, across the same geographic range suggests seasonal changes in migration levels between the two populations, but the relative position of the genetic break does not, as it remains around 27–29°S throughout the year (Kapula et al., in prep). Further, while conclusions regarding the potential selective forces shaping the observed patterns of adaptive divergence were not within the scope of this study, future seascape-genomic studies may allow for a more comprehensive understanding of the potential influence of environmental features and seasonal variation in shaping this divergence.
Genetic Versus Genomic Differentiation
Based on the generated PCA, as well as significant levels of differentiation observed for the outlier dataset, the identified SNPs appear to be effective in confirming the existence of the previously identified/hypothesized sub-populations off South Africa (Henriques et al., 2017). Due to differences in marker characteristics including, for example, allelic state and mutation rate, direct comparisons with regards to pairwise FST values between previous microsatellite-based and reported SNP-based estimates cannot be taken at face-value (DeFaveri et al., 2013; Fischer et al., 2017; Vendrami et al., 2017). However, although the full dataset-based FST values failed to significantly differentiate the two pools, the generated PCA clearly differentiated P1 and P2. This observed variation in results may be due to multivariant analyses not relying on underlying models of differentiation, modes of inheritance or assumptions of HWE or LD, as with FST-based analyses. As such, PCAs provide a less biased and simplified image of population sub-structuring, with the principal components maximizing variation and thereby potentially detecting subtle structure “overlooked” by FST values alone (Jombart, 2008; Sham et al., 2009; Allendorf et al., 2010; Helyar et al., 2011; Mullins, 2017).
With microsatellite markers representing differences in repeat units and not necessarily single mutations, discordance between the two marker types may be expected. Relating the newly developed SNP dataset to the previously employed microsatellite primers revealed that, while the microsatellite sequences were represented within the de novo reference genome, no SNPs were found within the vicinity of the repeat units. As such, the previous variation contributing to the observed differentiation of P1 and P2 is not accurately reflected within the SNP dataset, thereby explaining the observed differences seen between genetic (microsatellite markers) versus genomic (SNPs) relationships of P1 and P2, whilst simultaneously emphasizing the difficulty of directly comparing separate marker sets (DeFaveri et al., 2013; Fischer et al., 2017; Vendrami et al., 2017). Ultimately, the detection of differentiation between these two pools, based on the genomic dataset (SNPs), corroborates the results of Henriques et al. (2017), providing further support for the existence of two separate South African sub-populations.
With P1 and P2 representing two potential sub-populations found along the South African coastline, contemporary 2017 South African sampling sites were expected to group with either of the two pools. Yet, based on the “full” and “neutral” datasets, no clear pattern of grouping was detected. Furthermore, “outlier”-based FST values, as well as the PCA, showed a clear differentiation between 2017 sampling sites and the previously identified clusters. Interestingly, BAPS clustering analysis based on the “outlier” dataset, clustered P1 (representing the most western cluster) with 2017 western and southwestern sampling regions (CB, TB, and SC), whilst P2 remained a separate cluster. The general inability to assign 2017 samples to the previously identified clusters may be a result of spatial and temporal variation in kingklip population sub-structuring (Henriques et al., 2017). The previously identified clusters consisted of samples collected from different sampling years (2012, 2014, and 2015) and various sampling regions. Therefore, the failure to group with contemporary (2017) sampling sites may be a result of stochastic temporal and/or spatial variation. Furthermore, the pooling of individuals may have equally contributed to the observed findings. It is thus possible that future sequencing of individual fish may allow for a more comprehensive comparison between P1, P2 and contemporary samples, with the expectation that a mix of individuals from various sampling sites will group more clearly with either of the previously hypothesized clusters, as compared to pools of individuals.
Overall, evidence for the potential influence of marker selection, and number, on the observed patterns of sub-structuring between P1, P2 and 2017 South African sampling sites was found. Marker selection, and number, have been shown to potentially influence observed patterns of population sub-structuring as well as assignment success (Ackerman et al., 2011; Freamo et al., 2011; Benestan et al., 2015; Hess et al., 2015). Accordingly, observed variation between the full and top 500 loci results was observed. By selecting the top 500 loci contributing to the differentiation of P1 and P2, increased levels of divergence were detected as compared to past results. Furthermore, marker selection and number were found to influence the relations of P1 and P2 to 2017 South African sites, with FST values found to be intermediate as compared to past estimates based on the full and outlier datasets. Notably, P1 was found to be non-significantly different from CB, TB, and SC, largely reflecting BAPS outlier results and indicating the potential occurrence of a single sub-population off western South Africa. Correspondingly, as with the BAPS outlier results, P2 was found to be significantly different from the majority of 2017 South African regions.
Interestingly, SNP selection was not found to influence PCA results, as the general patterns observed between the full and top 500 datasets were largely congruent, differentiating P1 and P2 from the 2017 South African sampling sites. Similar results were found for the Atlantic mackerel (S. scombrus), where multivariant analyses found the same population structure patterns regardless of the combinations of individuals and SNPs employed (Rodríguez-Ezpeleta et al., 2016).
Conclusions and Implications for Kingklip Fishery Management
Overall, the population structure analyses completed provide the most up-to-date and comprehensive information regarding kingklip population sub-structuring along its southern African distribution. The findings of this paper provide evidence for a three-stock hypothesis of kingklip across southern Africa, namely “northern Benguela” (NAM1), “southern Benguela” (NAM2, CB, TB, and SC) and “South Coast” (EC), separated by two break points occurring within the vicinity of the Lüderitz upwelling cell and Cape Agulhas. Despite there being several potential barriers to dispersal across kingklip’s distribution, the results of the full and neutral dataset supported a panmictic population, pointing to the occurrence of extensive connectivity across the range of kingklip, thereby potentially creating a dynamic, panmictic system composed of mixed stocks. As a result of this, significant divergence was only observed in a few outlier loci, providing insight into the possible influence of selection in shaping kingklip population substructure. The new findings of three putative populations of kingklip across the southern African region can thus be used to aid future management decisions, and changes to current management strategies should be considered. Our results therefore support a management approach toward a region-wide metapopulation where the potential for depletion through overfishing of local populations is likely. As suggested by Japp (1989) localized depletion of the east Coast spawning aggregations of kingklip, in a relative short period resulted in a significant population decline most likely through two processes – spawner biomass removal followed by recruitment impairment. The reduction in trawl catch rates of kingklip was shown by Punt and Japp (1994) retrospectively, with the east Coast population decline significantly higher than that of the west Coast, mostly likely due to historically different levels of fishing intensity on the local populations of kingklip.
In particular and under the precautionary approach, it seems prudent to consider the independent management of each of the three identified sub-populations. Currently, kingklip resources are managed independently between South Africa and Namibia, with each employing its own management strategy (DAFF, 2016). Our findings suggest that one of the populations (southern Benguela) might be shared between the two countries, and thus future stock assessment analyses should take this into consideration to properly evaluate whether or not a joint management approach of this stock is required. With regard to management of kingklip in South African waters, results presented within this study support the existence of two South African sub-populations occurring off the West and South coasts, respectively, and aligning with previously observed genetic, morphological and biological differences found between the two regions (Olivar and Sabatés, 1989; Punt and Japp, 1994; Henriques et al., 2017). Accordingly, taking into account the observed genomic divergence between the two regions, we suggest that the one-stock management approach should be reconsidered. To ensure future management is as effective as possible, further studies employing a marker panel that allows to clearly distinguish between populations should be performed to quantify the extent of mixing between the two populations (Japp, 1989; Japp, 1990; Grant and Leslie, 2005; Henriques et al., 2017). Finally, the use of informative loci often enables researchers to assign samples to a single source (Martinsohn and Ogden, 2009), with previous studies investigating the use of reduced, informative marker panels for individual assignment as well as population sub-structuring analyses (Freamo et al., 2011; Benestan et al., 2015). By preliminarily investigating the effects of marker selection and number on observed patterns, this study provides the necessary first steps toward the development of a reduced, highly informative marker panel to be used for the identification and assignment of harvested kingklip individuals; with the aims of improving product traceability and deterring Illegal, Unregulated and Unreported (IUU) fishing (Martinsohn and Ogden, 2009) in the region. An additional advantage of such a marker panel would be to facilitate rapid and cost-effective identification of individuals in commercial and survey catches to the level of their stock. This information would be crucial to realistic stock-specific assessments of resource status and hence effective management measures.
Data Availability Statement
The datasets presented in this study can be found in online repositories. The names of the repository/repositories and accession number(s) can be found below: Dryad (https://doi.org/10.5061/dryad.2280gb5q1).
Ethics Statement
This study was exempt from animal ethical clearance, as all samples were obtained as tissue and no live animals were handled (Stellenbosch University Research Ethics Committee: Animal Care and Use #ACU-2020-15258).
Author Contributions
RH, SvdH, and HN designed the study. MS conducted the experiments, analyzed, and interpreted the data. DJ, VK, LS, and DD contributed samples. RH and MS led the writing of the manuscript. All authors contributed to its writing.
Funding
The project was funded through the National Research Foundation of South Africa (Grant No. 105949). MS was funded through a Stellenbosch University Faculty of Science bursary.
Conflict of Interest
DJ was employed by the company CapFish.
The remaining authors declare that the research was conducted in the absence of any commercial or financial relationships that could be construed as a potential conflict of interest.
Acknowledgments
We would like to thank TUNACOR fisheries (Namibia) and Melanie Smith from CapMarine for help with sample collection. We also thank Y. Cwecwe for help with reference formatting and the reviewers for helpful and insightful suggestions.
Supplementary Material
The Supplementary Material for this article can be found online at: https://www.frontiersin.org/articles/10.3389/fmars.2020.557146/full#supplementary-material
References
Ackerman, M. W., Habitcht, C., and Seeb, L. W. (2011). Single-nucleotide polymorphisms (SNPs) under diversifying selection provide increased accuracy and precision in mixed-stock analyses of Sockeye Salmon from the Copper River, Alaska. Trans. Am. Fish. Soc. 140, 865–881. doi: 10.1080/00028487.2011.588137
Allendorf, F. W., Hohenlohe, P. A., and Luikart, G. (2010). Genomics and the future of conservation genetics. Nat. Rev. Genet. 11, 697–709. doi: 10.1038/nrg2844
Andrews, S. (2010). FastQC: a Quality Control Tool for High Throughput Sequence Data. Available online at: http://www.bioinformatics.babraham.ac.uk/projects/fastqc (accessed, 2018).
Babraham Bioinformatics (2017). Trim-Galore! Available online at: https://www.bioinformatics.babraham.ac.uk/projects/trim_galore (accessed, 2018).
Badenhorst, A. (1988). Aspects of the South African longline fishery for Kingklip Genypterus capensis and the Cape hakes Merluccius capensis and M. paradoxus. South Afr. J. Marine Sci. 6, 33–42. doi: 10.2989/025776188784480708
Bankevich, A., Nurk, S., Antipov, D., Gurevich, A. A., Dvorkin, M., Kulikov, A. S., et al. (2012). SPAdes: a new genome assembly algorithm and its applications to single-cell sequencing. J. Comp. Biol. 5, 455–477. doi: 10.1089/cmb.2012.0021
Barnett, D. W., Garrison, E. K., Quinlan, A. R., Strömberg, M. P., and Marth, G. T. (2011). BamTools: a C++ API and toolkit for analyzing and managing BAM files. Bioinformatics 27, 1691–1692. doi: 10.1093/bioinformatics/btr174
Benestan, L., Gosselin, T., Perrier, C., Sainte-Marie, B., Rochette, R., and Bernatchez, L. (2015). RAD genotyping reveals fine-scale genetic structuring and provides powerful population assignment in a widely distributed marine species, the American lobster (Homarus americanus). Mol. Ecol. 24, 3299–3315. doi: 10.1111/mec.13245
Bernatchez, L., Wellenreuther, M., Araneda, C., Ashton, D. T., Barth, J. M. I., Beacham, T. D., et al. (2017). Harnessing the power of genomics to secure the future of seafood. Trends Ecol. Evol. 32, 665–680. doi: 10.1016/j.tree.2017.06.010
Boyd, A. J. (1987). The Oceanography of the Namibian Shelf. Ph.D. dissertation, University of Cape Town, Rondebosch.
Bradbury, I. R., Hubert, S., Higgins, B., Bowman, S., Borza, T., Paterson, I. G., et al. (2012). Genomic islands of divergence and their consequences for the resolution of spatial structure in an exploited marine fish. Evol. Appl. 6, 450–461. doi: 10.1111/eva.12026
Brandão, A., and Butterworth, D. S. (2008). “An updated assessment of the South African kingklip resource including some sensitivity tests,” in Marine Resource Assessment and Management Group (Cape Town: University of Cape Town).
Brandão, A., and Butterworth, D. S. (2013). “A “replacement yield” model fit to catch and survey data for the south and west coasts Kingklip resource of South Africa,” in Marine Resource Assessment and Management Group, (Cape Town: University of Cape Town).
Carreras, C., Ordóñez, V., Zane, L., Kruschel, C., Nasto, I., Macpherson, E., et al. (2017). Population genomics of an endemic Mediterranean fish: differentiation by fine scale dispersal and adaptation. Sci. Rep. 7:4341. doi: 10.1038/srep43417
Carvalho, G., and Hauser, L. (1994). Molecular genetics and the stock concept in fisheries. Rev. Fish Biol. Fish. 4, 326–350. doi: 10.1007/bf00042908
Chikhi, R., and Medvedev, P. (2014). Informed and automated k-mer size selection for genome assembly. Bioinformatics 30, 31–37. doi: 10.1093/bioinformatics/btt310
Corander, J., and Marttinen, P. (2006). Bayesian identification of admixture events using multilocus molecular markers. Mol. Ecol. 15, 2833–2843. doi: 10.1111/j.1365-294X.2006.02994.x
DAFF (2016). Status of the South African Marine Fishery Resources. Cape Town: Department of Agriculture, Forestry and Fishery.
D’Aloia, C. D., Andrés, J. A., Bogdanowicz, S. M., McCune, A. R., Harrison, R. G., and Buston, P. M. (2020). Unraveling hierarchical genetic structure in a marine metapopulation: a comparison of three high−throughput genotyping approaches. Mol. Ecol. 29, 2189–2203. doi: 10.1111/mec.15405
Daley, R. K., Ward, R. D., Last, P. R., Reilly, A., Appleyard, S. A., and Gledhill, D. C. (2000). “Stock delineation of the pink ling (Genypterus blacodes) in Australian waters using genetic and morphometric techniques,” in Fisheries Research and Development Corporation Final Report. Project No. 97/117 (Hobart: CSIRO Marine Research).
de Moor, C. L., Johnston, S. J., Brandão, A., Rademeyer, R. A., Glazer, J. P., Furman, L. B., et al. (2015). A review of the assessments of the major fisheries resources in South Africa. Afr. J. Marine Sci. 37, 285–311. doi: 10.2989/1814232x.2015.1070201
DeFaveri, J., Viitaniemi, H., Leder, E., and Merilä, J. (2013). Characterizing genic and nongenic molecular markers: comparison of microsatellites and SNPs. Mol. Ecol. Resour. 13, 377–392. doi: 10.1111/1755-0998.12071
Dennenmoser, S., Vamosi, S. M., Nolte, A. W., and Rogers, S. M. (2017). Adaptive genomic divergence under high gene flow between freshwater and brackish-water ecotypes of prickly sculpin (Cottus asper) revealed by Pool-Seq. Mol. Ecol. 26, 25–42. doi: 10.1111/mec.13805
Ding, J., Sidore, C., Butler, T. J., Wing, M. K., Qian, Y., Meirelles, O., et al. (2015). Assessing mitochondrial DNA variation and copy number in lymphocytes of ~2,000 Sardinians using tailored sequencing analysis tools. PLoS Genet. 11:e1005306. doi: 10.1371/journal.pgen.1005306
Durai, D. A., and Schulz, M. H. (2016). Informed kmer selection for de novo transcriptome assembly. Bioinformatics 32, 1670–1677. doi: 10.1093/bioinformatics/btw217
Fischer, M. C., Rellstab, C., Leuzinger, M., Roumet, M., Gugerli, F., Shimizu, K. K., et al. (2017). Estimating genomic diversity and population differentiation an empirical comparison of microsatellite and SNP variation in Arabidopsis helleri. BMC Genomics 18:69. doi: 10.1186/s12864-016-3459-7
Foll, M., and Gaggiotti, O. (2008). A genome-scan method to identify selected loci appropriate for both dominant and codominant markers: a bayesian perspective. Genetics 180, 977–993. doi: 10.1534/genetics.108.092221
Freamo, H., O’Reilly, P., Berg, P. R., Lien, S., and Boulding, E. G. (2011). Outlier SNPs show more genetic structure between two Bay of Fundy metapopulations of Atlantic salmon than do neutral SNPs. Mol. Ecol. Resour. 11, 254–267. doi: 10.1111/j.1755-0998.2010.02952.x
Fu, L., Cai, C., Cui, Y., Wu, J., Liang, J., Cheng, F., et al. (2016). Pooled mapping: an efficient method of calling variations for population samples with low-depth resequencing data. Mol. Breed. 36:48. doi: 10.1007/s11032-016-0476-9
Futschik, A., and Schlötterer, C. (2010). The next generation of molecular markers from massively parallel sequencing of pooled DNA samples. Genetics 186, 207–218. doi: 10.1534/genetics.110.114397
Gaggiotti, O. E., Bekkevold, D., Jørgensen, H. B. H., Foll, M., Carvalho, G. R., Andre, C., et al. (2009). Disentangling the effects of evolutionary, demographic, and environmental factors influencing genetic structure of natural populations: Atlantic herring as a case study. Evolution 63, 2939–2951. doi: 10.1111/j.1558-5646.2009.00779.x
Galindo, J., Grahame, J. W., and Butlin, R. K. (2010). An EST-based genome scan using 454 sequencing in the marine snail Littorina saxatilis. J. Evol. Biol. 22, 2004–2016. doi: 10.1111/j.1420-9101.2010.02071.x
Grant, W. S., and Leslie, R. W. (2005). Bayesian analysis of allozyme markers indicates a single genetic population of Kingklip Genypterus capensis off South Africa. Afr. J. Marine Sci. 27, 479–485. doi: 10.2989/18142320509504106
Gulland, J. A. (1983). Fish Stock Assessment. A Manual of Basic Methods. FAO/Wiley Series on Food and Agriculture, 1. Chichester: John Wiley and Sons, 223.
Guo, B., DeFaveri, J., Sotelo, G., Nair, A., and Merilä, J. (2015). Population genomic evidence for adaptive differentiation in Baltic Sea three-spined sticklebacks. BMC Biol. 13:19. doi: 10.1186/s12915-015-0130-8
Guo, B., Li, Z., and Merilä, J. (2016). Population genomic evidence for adaptive differentiation in the Baltic Sea herring. Mol. Ecol. 25, 2833–2852. doi: 10.1111/mec.13657
Gurevich, A., Saveliev, V., Vyahhi, N., and Tesler, G. (2013). QUAST: quality assessment tool for genome assemblies. Bioinformatics 29, 1072–1075. doi: 10.1093/bioinformatics/btt086
Hahn, C., Bachman, L., and Chevreux, B. (2013). Reconstructing mitochondrial genomes directly from genomic next-generation sequencing reads–a baiting and iterative mapping approach. Nucleic Acids Res. 14:e129. doi: 10.1093/nar/gkt371
Hauser, L., and Carvalho, G. (2008). Paradigm shifts in marine fisheries genetics: ugly hypotheses slain by beautiful facts. Fish Fish. 9, 333–362. doi: 10.1111/j.1467-2979.2008.00299.x
Helyar, S., Hemmer-Hansen, J., Bekkevold, D., Taylor, M. I., Ogden, R., Limborg, M. T., et al. (2011). Application of SNPs for population genetics of nonmodel organisms: new opportunities and challenges. Mol. Ecol. Resour. 11, 123–136. doi: 10.1111/j.1755-0998.2010.02943.x
Helyar, S. J., Limborg, M. T., Bekkevold, D., Babbucci, M., van Houdt, J., Maes, G. E., et al. (2012). SNP discovery using next generation transcriptomic sequencing in Atlantic Herring (Clupea harengus). PLoS One, 7:e42089. doi: 10.1371/journal.pone.0042089
Hemmer-Hansen, J., Therkildsen, N. O., and Pujolar, J. M. (2014). Population genomics of marine fishes: next-generation prospects and challenges. Biol. Bull. 227, 117–132. doi: 10.1086/BBLv227n2p117
Henriques, R., Nielsen, E., Durholtz, D., Japp, D., and von der Heyden, S. (2017). Genetic population sub-structuring of Kingklip (Genypterus capensis – Ophidiidiae), a commercially exploited demersal fish off South Africa. Fish. Res. 187, 86–95. doi: 10.1016/j.fishres.2016.11.007
Henriques, R., Potts, W. M., Santos, C. V., Sauer, W. H. H., and Shaw, P. W. (2014). Population connectivity and phylogeography of a coastal fish, Atractoscion aequidens (Sciaenidae), across the Benguela Current Region: evidence of an ancient vicariant event. PLoS One 9:e87907. doi: 10.1371/journal.pone.0087907
Henriques, R., Potts, W. M., Sauer, W. H. H., and Shaw, P. W. (2012). Evidence of deep genetic divergence between populations of an important recreational fishery species, Lichia amia L. 1758, around southern Africa. Afr. J. Mar. Sci. 34, 585–591. doi: 10.2989/1814232X.2012.749809
Henriques, R., Potts, W. M., Sauer, W. H. H., and Shaw, P. W. (2015). Incipient genetic isolation of a temperate migratory coastal sciaenid fish (Argyrosomus inodorus) within the Benguela Cold Current system. Mar. Biol. Res. 11, 423–429. doi: 10.1080/17451000.2014.952309
Henriques, R., von der Heyden, S., Lipinski, M. R., du Toit, N., Kainge, P., Bloomer, P., et al. (2016). Spatio-temporal genetic structure and the effects of long-term fishing in two partially sympatric offshore demersal fishes. Mol. Ecol. 25, 5843–5861. doi: 10.1111/mec.13890
Hess, J. O., Campbell, N. R., Docker, M. F., Baker, C., Jackson, A., Lampman, R., et al. (2015). Use of genotyping by sequencing data to develop a high-throughput and multifunctional SNP panel for conservation applications in Pacific lamprey. Mol. Ecol. 15, 187–202. doi: 10.1111/1755-0998.12283
Huang, H. W., Mullikin, J. C., and Hansen, N. F. (2015). Evaluation of variant detection software for pooled next-generation sequence data. BMC Bioinform. 16:235. doi: 10.1186/s12859-015-0624-y
Hutchings, L., van der Lingen, C. D., Shannon, L. J., Crawford, R. J. M., Verheye, H. M. S., Bartholomae, C. H., et al. (2009). The Benguela Current: An ecosystem of four components. Prog. Oceanogr. 83, 15–32. doi: 10.1016/j.pocean.2009.07.046
Japp, D. W. (1989). An Assessment of the South African Longline Fishery with Emphasis on Stock Integrity of Kingklip Genypterus capensis (Pisces: Ophidiidae). MSc thesis, Rhodes University, Grahamstown.
Japp, D. W. (1990). A new study on age and growth of Kingklip Genypterus capensis off the south and west coasts of South Africa, with comments on its use for stock identification. South Afr. J. Marine Sci. 9, 223–237. doi: 10.2989/025776190784378754
Jombart, T. (2008). Adagenet: a R package for multivariant analysis of genetic markers. Bioinformatics 24, 1403–1405. doi: 10.1093/bioinformatics/btn129
Kassambara, A., and Mundt, F. (2017). Factoextra: Extract and Visualize the Results of Multivariate Data Analyses. Available online at: https://rpkgs.datanovia.com/factoextra/index.html
Keenan, K., McGinnity, P., Cross, T. F., Crozier, W. W., and Prodohl, P. A. (2013). diveRsity: an R package for the estimation and exploration of population genetics parameters and their associated errors. Methods Ecol. Evol. 4, 782–788. doi: 10.1111/2041-210x.12067
Knapp, I. S., Puritz, J. B., Bird, C. E., Whitney, J. L., Sudek, M., Forsman, Z. H., et al. (2016). ezRAD-An Accessible Next Generation RAD Sequencing Protocol Suitable for Non-model Organisms v3.2. io Protocols. Available online at: https://www.protocols.io/view/ezrad-an-accessible-next-generation-rad-sequencing-e9pbh5n (accessed December 13, 2016).
Kofler, R., Orozco-terWengel, P., De Maio, N., Pandey, R. V., Nolte, V., Futschik, A., et al. (2011a). PoPoolation: a toolbox for population genetic analysis of next generation sequencing data from pooled individuals. PLoS One 6:e15925. doi: 10.1371/journal.pone.0015925
Kofler, R., Pandey, R. W., and Schlotterer, C. (2011b). PoPoolation2: identifying differentiation between populations using sequencing of pooled DNA samples (Pool-Seq). Bioinformatics 27, 3435–3436. doi: 10.1093/bioinformatics/btr589
Kumar, S., Banks, T. W., and Cloutier, S. (2012). SNP discovery through next-generation sequencing and its applications. Int. J. Plant Genom. 2012:831460. doi: 10.1155/2012/831460
Lamichhaney, S., Barrio, A. M., Rafati, N., Sundström, G., Rubin, C. J., Gilbert, E. R., et al. (2012). Population-scale sequencing reveals genetic differentiation due to local adaptation in Atlantic herring. Proc. Natl. Acad. Sci. U.S.A. 109, 19345–19350. doi: 10.1073/pnas.1216128109
Langmead, B., and Salzberg, S. (2012). Fast gapped-read alignment with Bowtie 2. Nat. Methods 9, 357–359. doi: 10.1038/nmeth.1923
Lett, C., Veitch, J., van der Lingen, C. D., and Hutchings, L. (2007). Assessment of an environmental barrier to transport of ichthyoplankton from the southern to the northern Benguela ecosystems. Mar. Ecol. Prog. Ser. 347, 247–259. doi: 10.3354/meps06982
Li, H., and Durbin, R. (2009). Fast and accurate short read alignment with Burrows-Wheeler transform. Bioinformatics 25, 1754–1760. doi: 10.1093/bioinformatics/btp324
Li, H., Handsaker, B., Wysoker, A., Fennell, T., Ruan, J., Homer, N., et al. (2009). The sequence alignment/map format and SAMtools. Bioinformatics 25, 2078–2079. doi: 10.1093/bioinformatics/btp352
Limborg, M. T., Helyar, S. J., De Bruyn, M., Taylor, M. I., Nielsen, E., Ogden, R., et al. (2012). Environmental selection on transcriptome-derived SNPs in a high gene flow marine fish, the Atlantic herring (Clupea harengus). Mol. Ecol. 21, 3686–3703. doi: 10.1111/j.1365-294X.2012.05639.x
Lischer, H. E. L., and Excoffier, L. (2012). PGDSpider: an automated data conversion tool for connecting population genetics and genomics programs. Bioinformatics 28, 298–299. doi: 10.1093/bioinformatics/btr642
Lowry, D. B., Hoban, S., Kelley, J. L., Lotterhos, K. E., Reed, L. K., Antolin, M. F., et al. (2017). Breaking RAD: an evaluation of the utility of restriction site-associated DNA sequencing for genome scans of adaptation. Mol. Ecol. Res. 17, 142–152. doi: 10.1111/1755-0998.12635
Lundy, C., Rico, C., and Hewitt, G. M. (2000). Temporal and spatial genetic variation in spawning grounds of European hake (Merluccius merluccius) in the Bay of Biscay. Mol. Ecol. 9, 2067–2079. doi: 10.1046/j.1365-294X.2000.01120.x
Luu, K., Bazini, E., and Blum, M. G. B. (2017). pcadapt: an R package to perform genome scans for selection based on principal component analysis. Mol. Ecol. Resour. 17, 67–77. doi: 10.1111/1755-0998.12592
Martinsohn, J., and Ogden, R. (2009). FishPopTrace—Developing SNP-based population genetic assignment methods to investigate illegal fishing. Forensic Sci. Int. Genet. Suppl. Ser. 2, 294–296. doi: 10.1016/j.fsigss.2009.08.108
McQuinn, I. H. (1997). Metapopulations of the Atlantic herring. Rev. Fish Biol. 7, 297–329. doi: 10.1023/A:1018491828875
Milá, B., van Tassell, J. L., Calderón, J. A., Rüber, L., and Zardoya, R. (2017). Cryptic lineage divergence in marine environments: genetic differentiation at multiple spatial and temporal scales in the widespread intertidal goby Gobiosoma bosc. Ecol. Evol. 7, 5514–5523. doi: 10.1002/ece3.3161
Milano, I., Babbucci, M., Cariani, A., Atanassova, M., Bekkevold, D., Carvalho, G. R., et al. (2014). Outlier SNP markers reveal fine-scale genetic structuring across European hake populations (Merluccius merluccius). Mol. Ecol. 23, 118–135. doi: 10.1111/mec.12568
Milano, I., Babbucci, M., Panitz, F., Ogden, R., Nielsen, R. O., Taylor, M. I., et al. (2011). Novel tools for conservation genomics: comparing two high-throughput approaches for SNP discovery in the transcriptome of the European Hake. PLoS One 6:e28008. doi: 10.1371/journal.pone.0028008
Mirimin, L., Kerwath, S. E., Macey, B. M., Lamberth, S. J., Cowley, P. D., Bester-van der Merwe, A., et al. (2016). Genetic analysis of overfished silver kob Argyrosomus inodorus (Scieanidae) stocks along the southern African coast. Fish. Res. 176, 100–106.
Mullins, R. B. (2017). Population Genomics Analyses of Yellowfin tuna Thunnus Albacares off South Africa Reveals Need for a Shifted Management Boundary. MSc thesis, Rhodes University, Grahamstown.
National Center for Biotechnology Information (2018). Translate BLAST: Blastx. Available online at: https://blast.ncbi.nlm.nih.gov/Blast.
Nesbo, C. L., Rueness, E. K., Iversen, S. A., Skagen, D. W., and Jakobsen, K. S. (2000). Phylogeography and population history of Atlantic Mackerel (Scomber scombrus L.): a genealogical approach reveals genetic structuring among the eastern Atlantic stocks. Proc. Royal Soc. Lond. B 267, 281–292.
Nielsen, E., Cariani, A., Mac Aoidh, E., Maes, G. E., Milano, I., Ogden, R., et al. (2012). Gene-associated markers provide tools for tackling illegal fishing and false eco-certification. Nature Commun. 3:851. doi: 10.1038/ncomms1845
Nielsen, E., Hemmer-Hansen, J., Poulsen, N. A., Loeschcke, V., Moen, T., Johansen, T., et al. (2009). Genomic signatures of local directional selection in a high gene flow marine organism; the Atlantic cod (Gadus morhua). BMC Evol. Biol. 9:276. doi: 10.1186/1471-2148-9-276
Nosil, P., Funk, D. J., and Oritz-Barrientos, D. (2009). Divergent selection and heterogeneous genomic divergence. Mol. Ecol. 18, 375–402. doi: 10.1111/j.1365-294X.2008.03946.x
Olivar, M., and Sabatés, A. (1989). Early life history and spawning of Genypterus capensis (Smith, 1849) in the southern Benguela system. South Afr. J. Marine Sci. 8, 173–181. doi: 10.2989/02577618909504559
Olivar, M. P., and Fortuño, J. M. (1991). Guide to ichthyoplankton of the Southeast Atlantic (Benguela Current region). Sci. Mar. 55, 1–383.
Olivar, M. P., and Shelton, P. A. (1993). Larval fish assemblages of the Benguela current. Bull. Mar. Sci.] 53, 450–474.
Parrish, R. H., Bakun, A., Husby, D. M., and Nelson, C. S. (1983). “Comparative climatology of selected environmental processes in relation to eastern boundary current pelagic fish reproduction,” in Proceedings of the Expert Consultation to Examine Changes in Abundance and Species Composition of Neritic Fish Resources in FAO Fish Rep, eds. G. D. Sharp and J. Csirke (San Jose, CA), 731–777.
Payne, A. I. L. (1977). Stock differentiation and growth of the southern African Kingklip Genypterus capensis. Investl. Rep. Sea Fish. Brch. S. Afr. 113:32.
Payne, A. I. L. (1985). Growth and stock differentiation of Kingklip (Genypterus capensis) on the south-east coast of South Africa. South African J. Zool. 20, 49–56. doi: 10.1080/02541858.1985.11447913
Pecquerie, L., Drapeau, L., Fréon, P., Coetzee, J. C., Leslie, R. W., and Griffiths, M. H. (2004). Distribution patterns of key fish species of the southern Benguela ecosystem: an approach combining fishery-dependent and fishery-independent data. Afr. J. Marine Sci. 26, 115–139. doi: 10.2989/18142320409504053
Phair, N. L., Toonen, R. J., Knapp, I., and von der Heyden, S. (2019). Shared genomic outliers across two divergent population clusters of a highly threatened seagrass. PeerJ 7:e6806. doi: 10.7717/peerj.6806
Pinsky, M. L., Reygondeau, G., Caddell, R., Palacios-Abrantes, J., Spijkers, J., and Cheng, W. W. L. (2018). Preparing ocean governance for species on the move. Science 360, 1189–1191. doi: 10.1126/science.aat2360
Punt, A. E., and Japp, D. W. (1994). Stock assessment of Kingklip Genypterus capensis off South Africa. South Afr. J. Marine Sci. 14, 133–149. doi: 10.2989/025776194784286996
R Core Development Team (2008). R: A Language and Environment for Statistical Computing. Available online at: http://www.R-project.org (accessed June 22, 2020).
Raeymaekers, J. A. M., Chaturvedi, A., Hablützel, P. I, Verdonck, I., Hellemans, B., Maes, G. E., et al. (2017). Adaptive and non-adaptive divergence in a common landscape. Nature Commun. 8:267. doi: 10.1038/s41467-017-00256-6
Reiss, H., Hoarau, G., Dickey-Collas, M., and Wolff, W. J. (2009). Genetic population structure of marine fish: mismatch between biological and fisheries management units. Fish Fish. 10, 361–395. doi: 10.1111/j.1467-2979.2008.00324.x
Rodríguez-Ezpeleta, N., Bradbury, I. R., Mendibil, I., Álvarez, P., Cotano, U., and Irigoien, X. (2016). Population structure of Atlantic mackerel inferred from RAD-seq-derived SNP markers: effects of sequence clustering parameters and hierarchical SNP selection. Mol. Ecol. Resour. 16, 991–1001. doi: 10.1111/1755-0998.12518
Rousset, F. (2008). GENEPOP’ 007: a complete re-implementation of the GENEPOP software for Windows and Linux. Mol. Ecol. Resour. 8, 103–106. doi: 10.1111/j.1471-8286.2007.01931.x
Sale, P. F., Hanski, I., and Kritzer, J. P. (2006). “The merging of metapopulation theory and marine ecology: establishing the historical context,” in Marine Metapopulations, eds J. P. Kritzer and P. F. Sale (Amsterdam: Elsevier), 3–28. doi: 10.1016/B978-012088781-1/50004-2
Schlötterer, C., Tobler, R., Kofler, R., and Nolte, V. (2014). Sequencing pools of individuals — mining genome-wide polymorphism data without big funding. Nat. Rev. Genet. 15, 749–763. doi: 10.1038/nrg3803
Seeb, J. E., Carvalho, G., Hauser, L., Naish, K., Roberts, S., and Seeb, L. W. (2011). Single-nucleotide polymorphism (SNP) discovery and applications of SNP genotyping in nonmodel organisms. Mol. Ecol. Res. 11, 1–8. doi: 10.1111/j.1755-0998.2010.02979.x
Sham, P., Cherny, S., and Purcell, S. (2009). Application of genome-wide SNP data for uncovering pairwise relationships and quantitative trait loci. Genetica 136, 237–243. doi: 10.1007/s10709-008-9349-4
Shannon, L., Crawford, R. J. M., Pollock, D. E., Hutchings, L., Boyd, A. J., Taunton-Clark, J., et al. (1992). The 1980s – a decade of change in the Benguela ecosystem. South Afr. J. Marine Sci. 12, 271–296. doi: 10.2989/02577619209504707
Shillington, F. A., Reason, C. J. C., Duncombe Rae, C. M., Florenchie, P., and Penven, P. (2006). Large scale physical variability of the Benguela Current Large Marine Ecosystem (BCLME). Elsevier 14, 47–68.
Smith, A. (1847). “Pisces,” in Illustrations of the Zoology of South Africa; Consisting Chiefly of Figures and Descriptions of the Objects of Natural History Collected During an Expedition into the Interior of South Africa in 1834–36 (London: Elder and Co.).
Smith, P. J., and Paulin, C. D. (2003). Genetic and morphological evidence for a single species of pink ling (Genypterus blacodes) in New Zealand waters. New Zeal. J. Mar. Fresh. Res. 37, 183–194. doi: 10.1080/00288330.2003.9517156
Spalding, M. D., Fox, H. E., Allen, G. R., Davidson, N., Ferdaña, Z. A., Finlayson, M., et al. (2007). Marine ecoregions of the world: a bioregionalization of coastal and shelf areas. BioScience 57, 573–583. doi: 10.1641/b570707
Strasburg, J. L., Sherman, N. A., Wright, K. M., Moyle, L. C., Willis, J. H., and Rieseberg, L. H. (2012). What can patterns of differentiation across plant genomes tell us about adaptation and speciation. Philos. Trans. R. Soc. B 367, 364–373. doi: 10.1098/rstb.2011.0199
Sundby, S., Boyd, A. J., Hutchings, L., O’Toole, M. J., Thorisson, K., and Thorsen, A. (2001). Interaction between Cape hake spawning and the circulation in the northern Benguela upwelling ecosystem. South Afr. J. Mar. Sci. 23, 317–336. doi: 10.2989/025776101784528971
Tajima, F. (1989). Statistical method for testing the neutral mutation hypothesis by DNA polymorphism. Genetics 123, 585–595.
Teske, P. R., von der Heyden, S., McQuaid, C. D., and Barker, N. P. (2011). A review of marine phylogeography in southern Africa. South Afr. J. Sci. 107, 45–53. doi: 10.4102/sajs.v107i5/6.514
Tigano, A., and Friesen, V. I. (2016). Genomics of local adaptation with gene flow. Mol. Ecol. 25, 2144–2164. doi: 10.1111/mec.13606
Toonen, R. J., Puritz, J. B., Forsman, Z. H., Whitney, J. I, Fernandez-Silva, I., Andrews, K. R., et al. (2013). ezRAD: a simplified method for genomic genotyping in non-model organisms. PeerJ 1:e203. doi: 10.7717/peerj.203
Vendrami, D. L. J., Telesca, L., Weigand, H., Weiss, M., Fawcett, K., Lehman, K., et al. (2017). RAD sequencing resolves fine-scale population structure in a benthic invertebrate: implications for understanding phenotypic plasticity. R. Soc. Open Sci. 4:1605458. doi: 10.1098/rsos.160548
Waples, R. S., and Gaggiotti, O. (2006). What is a population? An empirical evaluation of some genetic methods for identifying the number of gene pools and their degree of connectivity. Mol. Ecol. 15, 1419–1439. doi: 10.1111/j.1365-294x.2006.02890.x
Ward, R. D., and Reilly, A. (2001). Development of microsatellite loci for population studies of the pink ling, Genypterus blacodes (Teleostei: Ophidiidae). Mol. Ecol. Notes 1, 173–175. doi: 10.1046/j.1471-8278.2001.00066.x
Ward, R. D., Woodward, M., and Skibinski, D. O. F. (1994). A comparison of genetic diversity levels in marine, freshwater, and anadromous fishes. J. Fish Biol. 44, 213–232. doi: 10.1111/j.1095-8649.1994.tb01200.x
Waters, J. M., and Roy, S. (2004). Phylogeography of a high-dispersal New Zealand sea-star: does upwelling block gene-flow. Mol. Ecol. 13, 2797–2806. doi: 10.1111/j.1365-294X.2004.02282.x
Keywords: fisheries genetics, Pool-Seq, genomic diversity, marine biodiversity, stock structure
Citation: Schulze MJ, von der Heyden S, Japp D, Singh L, Durholtz D, Kapula VK, Ndjaula HON and Henriques R (2020) Supporting Fisheries Management With Genomic Tools: A Case Study of Kingklip (Genypterus capensis) Off Southern Africa. Front. Mar. Sci. 7:557146. doi: 10.3389/fmars.2020.557146
Received: 29 April 2020; Accepted: 28 August 2020;
Published: 24 September 2020.
Edited by:
Rodrigo Vidal, University of Santiago, ChileReviewed by:
Nazli Demirel, Istanbul University, TurkeyEllen Biesack, College of William & Mary, United States
Papius Dias Tibihika, National Environment Management Authority (NEMA), Uganda
Copyright © 2020 Schulze, von der Heyden, Japp, Singh, Durholtz, Kapula, Ndjaula and Henriques. This is an open-access article distributed under the terms of the Creative Commons Attribution License (CC BY). The use, distribution or reproduction in other forums is permitted, provided the original author(s) and the copyright owner(s) are credited and that the original publication in this journal is cited, in accordance with accepted academic practice. No use, distribution or reproduction is permitted which does not comply with these terms.
*Correspondence: Romina Henriques, cmhlbnJpcXVlc0BzdW4uYWMuemE=; cm9oZW5yaXF1ZXNAZ21haWwuY29t