 Trevor McKenzie1,2*
 Michael Twardowski1,2
 Nathan Briggs3
 Aditya R. Nayak1,2
 Kevin M. Boswell4Fraser Dalgleish1,2
- 1Harbor Branch Oceanographic Institute, Florida Atlantic University, Fort Pierce, FL, United States
- 2Department of Ocean and Mechanical Engineering, Florida Atlantic University, Boca Raton, FL, United States
- 3National Oceanography Centre, Southampton, United Kingdom
- 4Coastlines and Oceans Division of the Institute of Environment, Florida International University, North Miami, FL, United States
The ocean’s mesopelagic zone is largely uncharacterized despite its vital role in sustaining ocean ecosystems. The composition, cycling, and fate of particle fields in the mesopelagic lacks an integrative multi-scale understanding of organism migration patterns, distribution, and diversity. This problem is addressed by combining complementary technologies with overlapping size spectra, including profiler mounted optical scattering sensors, profiler, and ship mounted acoustic devices, and a custom Unobtrusive Multi-Static Lidar Imager (UMSLI). This unique sensor suite can observe distributions of particles including organisms over a six order of magnitude dynamic size range, from microns to meters. Overlapping size ranges between different methods allows for cross-validation. This work focuses on the lidar imaging measurements and optical backscattering and attenuation, covering a combined particle size range of 0.1 mm to several cm. Particles at the small end of this range are sized using an existing backscattering time series inversion method after Briggs et al. (2013). Larger particles are resolved with UMSLI over an expanding volume using three-dimensional photo-realistic laser serial imaging. UMSLI’s image rectifying ability over time allows for derivation of particle concentration, size, and spatial distribution. Technical details on the development and post-processing methods for the novel UMSLI system are provided. Image resolved particle size distributions (PSDs) revealed a size shift from smaller to larger particles (>0.5 mm) as indicated by flatter slopes from dawn (slope = 2.6) to dusk (slope = 3.0). PSD trends are supported by an optical backscatter and transmissometer time series inversion analysis. Size shifts in the particle field are largely attributed to aggregation effects. Images support evidence of temporal variation between dusk and dawn stations through statistical analysis of particle concentrations for particle sizes 0.50–5.41 mm. Spatial analysis of the particle field revealed a dominantly uniform distributed marine snow background. The importance and potential of integrated approaches to studying particle and organism dynamics in ocean environments are discussed.
Introduction
The Earth’s oceans are a reservoir for an estimated 31% of anthropogenically produced CO2. Of the 100 Gt of organic carbon taken up by ocean surface waters per year, up to 10% is transferred to the mesopelagic (similar magnitude as fossil fuel emissions) (Gardner et al., 2000; Giering et al., 2014, 2018). Without this carbon export mechanism, the concentration of CO2 in the atmosphere would be an estimated 200 ppm higher than present day levels (McDonnell, 2011; Davison et al., 2013; Volk and Hoffert, 2013). This process, known as the “biological pump” is controlled by the productivity of primary producers in the surface ocean and active/passive downward transport of organic and inorganic composite material. Current estimates suggest, up to 90% of surface water detrital material is recycled, consumed, and respired before reaching 1,000 m (Stemmann et al., 2008; McDonnell, 2011; Davison et al., 2013; Hansen and Visser, 2016). Understanding the role of the mesopelagic zone (bottom of euphotic zone to 1,000 m) in mediating remineralization and transport to the deep ocean is currently a subject of intense research (Giering et al., 2019; Briggs et al., 2020).
Much of our knowledge of particle dynamics and transport through the water column has been gathered using sediment traps (Martin et al., 1987; Buesseler et al., 2007). Sediment traps function much like rain gauges, accumulating sinking particles over a period of days to weeks at predetermined depths. This allows for the collection and biological analysis of a wide size range of particles (Chester, 2000; Stemmann et al., 2008; Hung et al., 2010; Giering et al., 2018). While sediment traps have been used extensively, their spatial coverage is limited, thus decreasing the probability of capturing larger particles. Small sampling areas on the order of m2 must also be extrapolated temporally and across large regional areas and wide depth ranges. This may be particularly problematic for resolving significant episodic, localized sinking events associated with bloom crashes (Briggs et al., 2020). Sediment traps also hydrodynamically disturb suspended particles, inhibiting their efficiency and making interpretation more complex (Yu et al., 2001).
To compensate for an imbalance between carbon export and metabolic demands in the mesopelagic, many processes such as mortality, defecation, fragmentation, and export from diel vertical migrators require further investigation to accurately gauge these contributions in carbon budget models (Burd et al., 2010; Kelly et al., 2019; Briggs et al., 2020). Many studies have shifted the view of the mesopelagic to a more dynamic transit zone of the ocean that harbors organisms participating in massive diel vertical migrations (DVM) (Passow and Alldredge, 1995; Hiaka et al., 2001; Steinberg et al., 2002; Kaartvedt et al., 2012; Taucher et al., 2018; Proud et al., 2019; Boswell et al., 2020). Some of these animal’s form what is called the deep scattering layer (DSL), named for its strong acoustic reflection. This layer has long been observed to migrate upward to the surface at dusk and back downward at dawn as motivated by predation and feeding (Hays, 2003; Hansen and Visser, 2016; Calleja et al., 2018; Taucher et al., 2018). Migration by zooplankton and nekton are increasingly recognized as playing a significant role in transport of carbon through the mesopelagic (Steinberg et al., 2002; Burd et al., 2010; Kaartvedt et al., 2012; Klevjer et al., 2012; Hansen and Visser, 2016; Calleja et al., 2018; Kelly et al., 2019). Mesopelagic micronekton and zooplankton directly affect the distribution and size of suspended particles through feeding, migration and defecation. Similarly, gelatinous grazers also directly affect the repackaging and vertical fluctuation of sinking particles, through ingestion and release of larger fecal pellets. These processes affect the rates of fragmentation and remineralization of sinking particles and are often excluded from carbon export budgets. Studies of DVM and other active transport mechanisms in the mesopelagic suggest that these missing export processes could explain apparent imbalances between carbon supply and metabolic demands (Steinberg et al., 2002; Burd et al., 2010; Kelly et al., 2019). New technologies which feature in situ measurements using optical instrumentation and autonomous platforms create new potential for characterizing particle fields for size, shape, distribution, and concentration (Nayak and Twardowski, 2020).
To investigate this potential and to better understand particle dynamics in the mesopelagic ocean, acoustic, and optical techniques are used to characterize distributions of particle fields (including organisms) and spatial patchiness. The focus of this work is on using optical backscattering and beam attenuation instrumentation in combination with UMSLI to resolve particle size distributions (including organisms) from about 0.1 to 50 mm. UMSLI uses three-dimensional laser serial scanning to provide traceable volumetric images of particle and organism fields down to about 1 mm. Smaller particles are resolved from optical backscattering and attenuation with a time series inversion method (Briggs et al., 2013). Details of UMSLI data processing are discussed and particle distribution results compared between the two methods.
Materials and Methods
Imaging Lidar
Lidar systems consist of two main components, a transmitter and receiver. The transmitter consists of a highly collimated laser, often directed by a mechanical mirror device. The receiver may take many forms, but generally consist of a light receptor that quantifies intensity per unit area. Just as a conventional camera measures the reflection of light off objects with dependency on source and receiver geometry, so does a lidar system. The basis of a lidar’s function is to actively illuminate a volume of water with an intense pulse of optical energy from a laser transmitter and measure irradiance returned as a function of time with a receiver coupled with a high-speed digitizer. The range (R) of a target is described by McGill (2002):
where cl is the speed of light. Time of arrival (TOA) is defined as the time it takes for a laser pulse to leave the transmitter, reflect from a specific volume of water, and return to the receiver. The sampling capability of the receiver defines the gate time (Δt) and temporal resolution of the system. Lasers are capable of emitting light at very fast repetition rates with high energy levels and the collimated monochromatic nature of the beam makes it ideal for probing environments such as water. A complete physical characterization of laser transmission for lidar is well summarized in several studies (Mullen et al., 2009; Caimi and Dalgleish, 2013; Dalgleish F.R. et al., 2013; De Dominicis, 2013).
The method of laser imaging for UMSLI uses serially scanned pulsed lasers for extending imaging range in turbid seawater (Dalgleish F. et al., 2013; Dalgleish F.R. et al., 2013). Traditional optical cameras can be effective when significant ambient or artificial light is present in low turbidity conditions. When using artificial light in imaging, marine life can show a behavior response, i.e., attraction or avoidance, to light within their visual light frequency range (Zorn et al., 2000). Artificial light in conventional imaging also introduces backscatter path radiance effects that can obscure objects. However, unlike active acoustic solutions, the primary advantage of using optical approaches is high resolution contrasted scene descriptions essential for object classification and detailed observations.
Red lasers can be configured below the wavelength range that is visible to marine wildlife allowing for unobtrusive observation. UMSLI uses a 638 nm red diode laser which is beyond the photopic response for most marine organisms in the mesopelagic (Zorn et al., 2000). The UMSLI system was originally built with the intention of observing large marine species without affecting behavior (Dalgleish et al., 2017). It features an alternating field-of-view (FOV) that outputs time-resolved images capable of extracting three-dimensional features. The quasi-monostatic approach and dynamically expanding scan field make UMSLI suitable for resolving organisms across discrete size classes due to an adaptive resolution feature based on the angular control of the laser scan field during operation. For this study, capabilities are extended to observe relatively small particles, such as copepods, krill, and flocs of marine snow.
UMSLI Components
UMSLI’s design concept was focused on surveying a large volume of water for the use of observation and identification of targets on a wide range of size scales (mm to m). Transmitters serially illuminate a volume of water by scanning a grid of pulses in a bi-directional raster pattern using an analog micromirror device (AMD) and a scan angle expansion lens. The scan field of the receiver can be instantly configured to operate in three different modes, i.e., sparse, dense, or densest. Each different scan mode features a different image resolution and scan volume as controlled by the transmitter. The resolution is adjusted by concentrating a lower density pulse grid through a wider range of angles (sparse). Once an object is detected, a higher pulse density scan can be conducted through a narrower range of angles (dense/denser) using a digital Micro-Electro-Mechanical-Systems (MEMS) scanning device. The volume scan field for each channel is maximized by an overlapping FOV region between the quasi-monostatic transmitters and receivers. The system consists of three transmitter housings (each with a different total scan field) and three receiver housings, the details of which are described below.
The UMSLI transmitter (Figure 1A), features a 638 nm red laser diode with a laser driver that controls the laser pulse output energy. A separate transmitter controller uses RS-232 communication protocol with the MEMS driver that adjusts the polar and azimuthal angle of a scanning two axis (tip-tilt) MEMS mirror (or “micromirror”). The MEMS mirror is mechanically responsible for the serial scan-like pattern of the system (Dalgleish et al., 2018). The reflected beam from the MEMS mirror is expanded using a small angle expansion lens that outputs a full beam divergence of 2.80 mrad in water. The beam radial intensity follows an azimuthally symmetric Gaussian profile.

Figure 1. (A) Inside components of the transmitter with DMD device for laser scanning array. (B) Represents a ray-trace of the PMT array with acceptance angle shield. (C) Rise and fall time of PMT.
The total scan angle of the volume, post beam expansion, emits over a polar angle of 0.9425 radians. For this setup, the geometry of the fully illuminated plane is consistent for both polar and azimuthal angles. The transmitter has a 4 ns Full-Width-at-Half-Maximum (FWHM) pulse duration with an average power of 185 mW at a pulse rate of 80 kHz. The transmitter emits each pulse in a raster-like fashion, such that the transmitter emits 200 lines consisting of 200 pulses each. Individual lines take the transmitter 2.50 ms to complete, which allows the system to scan a full 200 × 200 plane in 500 ms for a total of 40,000 pulses (Supplementary Appendix A). The UMSLI system’s adaptive viewing mode emits the same number of pulses at a smaller angle of 0.3142 radians (dense) and 0.1047 radians (densest).
The receivers consist of a pair of bi-directional red sensitive high-speed photomultiplier modules with focusing optics and a spectral bandpass filter. Receivers are designed to collect backscatter returns from the emitted laser pulses (Dalgleish et al., 2018). To eliminate ambient light, the PMT is capped with a rectangular light shield that allows for a 30° acceptance angle; Figure 1B demonstrates a ray trace of the light shield rejection pattern. A high-speed digitizer and digital signal processor are used to reconstruct the illuminated volume and output imagery waveforms. These waveforms are transformed and processed as a volumetric scan, within a x–y spatial plane and a temporal z-plane. A single element Photo-Multiplier Tube (PMT) is used as a detector. The PMT used for this system is a Hamamatsu R11265U series, type H11934-20 with a spectral response from 300 to 920 nm, a quantum efficiency of 19% and radiant efficiency of 78 mA/W. The temporal response of the PMT is the dominant restriction for the system response time. Figure 1C shows the rise time of the impulse response to be 1.3 ns and the fall time 5.8 ns. The PMT and its components described above are housed in a Vitrovex glass sphere from Nautilus which are paired as two combined hemispheres. The 187 mm outside diameter glass housing has a total glass thickness of 14 mm and is pressure rated to a depth of 12,000 m.
Field Experiment
During March 25, 2018, the NOAA Okeanos Explorer navigated the Gulf of Mexico to explore the mesopelagic region and monitor biological migration patterns. A single deployment was carried out at each station. The first deployment was in the morning from 0430 to 0900 (local) at 28.66N, 87.86W and the second deployment was in the evening at 1,600–2,100 (local) at 28.66N, 87.46W (Figure 2A). The two sites were 57.92 km apart. For each station, an instrument cage was profiled from the surface to 300 m. Immediately after reaching 300 m sampling began and lasted 3 h. Periods for time series were aligned with dusk ascents and dawn descents of the DSL. The dusk migration was sampled at the first site, the dawn migration at the second. Deployed instrumentation included UMSLI, Seabird Scientific ac-9 and ECO-VSF, and a hull mounted and calibrated Simrad EK-80 multifrequency echosounder. Deployment protocols and post-processing for ac-9 and ECO-VSF followed Twardowski et al. (2018) and Sullivan et al. (2013), respectively. These sensors (excluding the EK-80) were mounted onto an aluminum frame with dimensions of 1.8 × 1.2 × 1.7 (m3) as shown in Figure 2B. During deployment, the EK-80 measured profiles of acoustic water column backscatter at 18 and 38 kHz to monitor migration patterns from the surface to 600 m. The EK-80 was configured to transmit narrowband signals with pulse duration at 0.2 transmissions per second. Acoustic data were processed following procedures outlined in Boswell et al. (2020). UMSLI’s sampling period was programmed before deployments; for the first station, it continuously sampled from 0515 to 0630 (local) and at the second station it sampled from 1,745 to 1,900 (local). UMSLI’s scan modes were sequenced, following the scan order sparse, dense, densest (see Supplementary Appendix A).
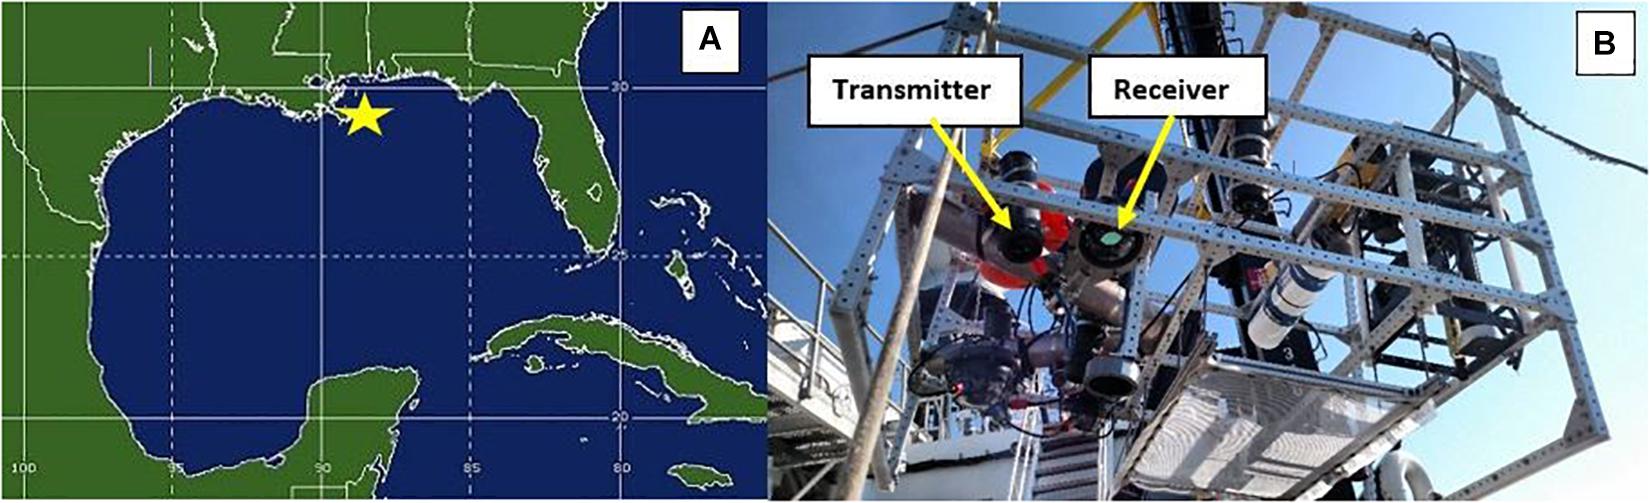
Figure 2. (A) Map with yellow star showing locations of the two stations sampled. (B) Profiler set up with UMSLI transmitter and receiver configuration highlighted (yellow arrows).
Results
Overview
Throughout this section, emphasis is on the dense and densest lidar scan modes, which have the highest resolution for particle sizes and the most overlap given their relatively close scan angles. The sparse scan mode, while still valuable, is better adapted toward identifying marine fish and larger organisms, which is beyond the size range focus of this analysis. Densest scans for the dawn station are unusable due to lack of quality.
EK-80
During deployments the EK-80 displayed the pattern of the sound scattering layers in real-time. A persistent DSL was observed between 300 and 400 m at both stations with migrating filaments linking the surface layers during the upward and downward migrations (Figure 3). Upward migration was observed as coherent vertical layers of backscatter ascending from 300 to 375 m to shallower surface layers < 100 m at dusk. The layers detected in the 38 kHz data followed a similar pattern and revealed persistent less dense backscatter return at deeper depths (∼600 m). At dawn, multiple downward migrating layers were detected beginning at 0600 (local) in both the 18 and 38 kHz data. In the 18 kHz data, the downward migration was comprised of two main layers, splitting and settling at 300 and 450 ms, respectively. Similarly, the downward migration recorded at 38 kHz displayed several coherent layers settling to form a high-density scattering layer between 350 and 450 ms.
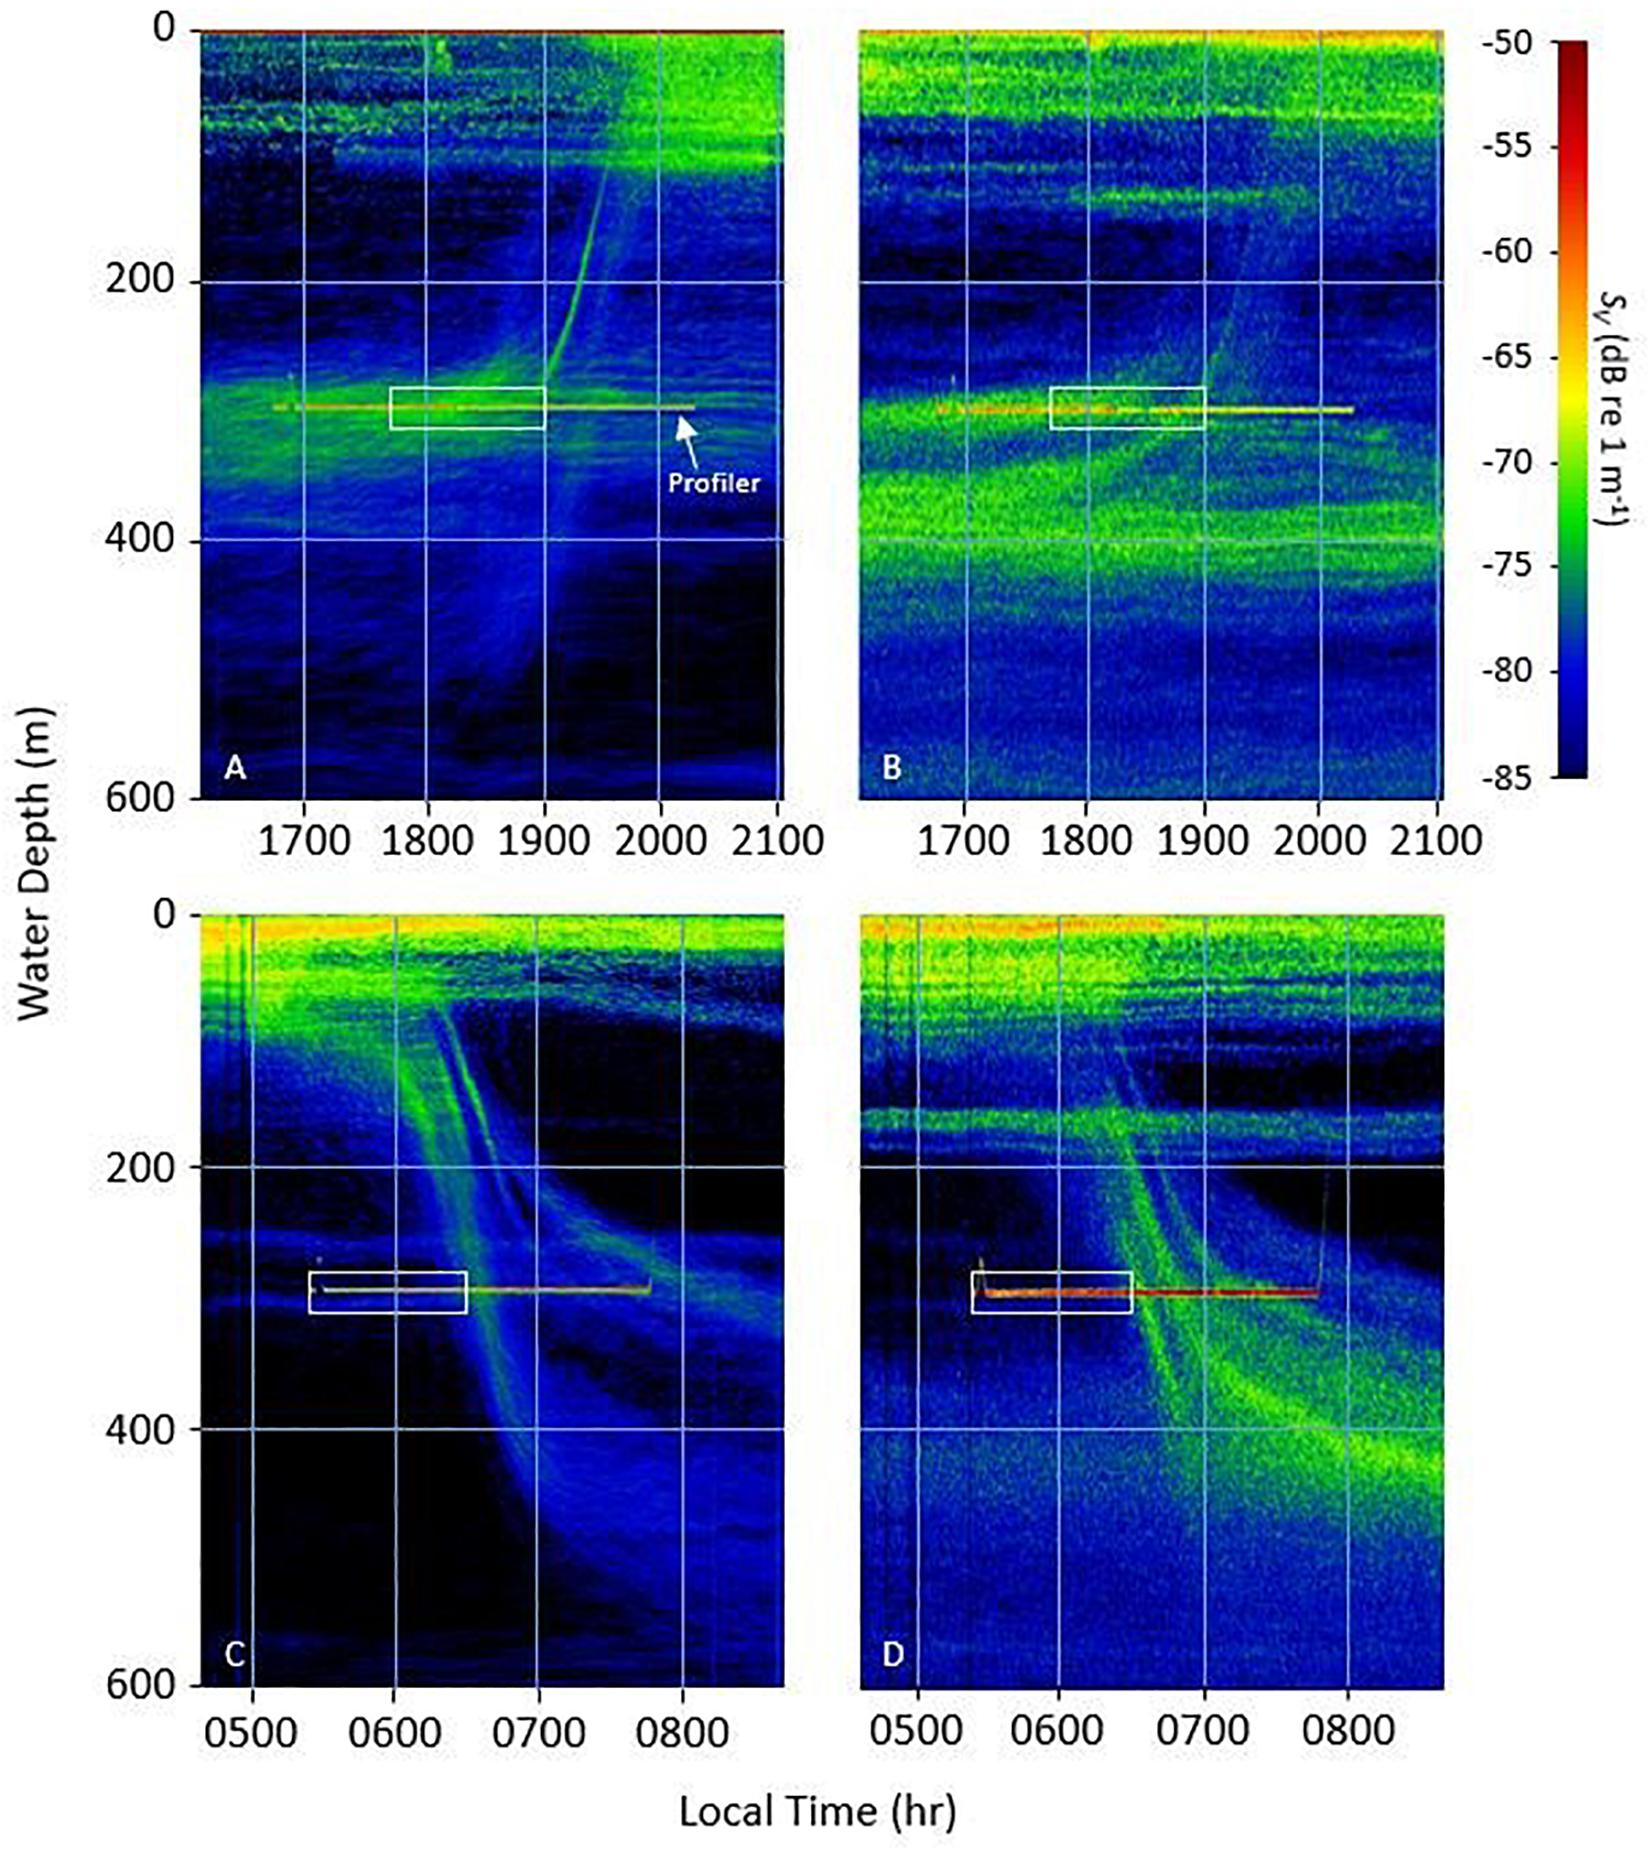
Figure 3. Acoustic volume backscatter strength (SV, dB re 1 m–1) profiles derived from the shipboard EK-80 echosounder at 18 kHz (A,C) and 38 kHz (B,D). Persistent backscatter at approximately 300 m is coincident with the position of the profiling package during full timeseries, while the white boxes represents the time period for which data with the lidar imager is presented.
Lidar Derived Particle Size Distributions (PSDs)
Particle size distributions (PSDs) include all particles, i.e., living organisms as well as detrital flocs and fecal pellets. Analyzing single image slices avoids alternating resolution capabilities (Supplementary Appendix A). PSDs are reported as equivalent spherical diameter D, derived from where A is the extracted filled particle area (Supplementary Appendix B.7). Note that A is a measure of the image pixel count for a particle and the calculated diameter was scaled in accordance with the resolution of the image slice. All extracted particles were then subcategorized into size bins based on calculated diameter. The concentration levels of each size bin were normalized by dividing the total number of particles counted per size bin, by the sample volume, resolution of the size bin and the fractional volume lost due to masking (Supplementary Appendix B.6). PSDs were modeled as a power law also known as a Junge distribution:
where Do is a reference diameter, no is the differential particle concentration at Do (L–1 mm–1) and γ is the slope of the distribution (Kitchen et al., 1982; Liley, 1992; Boss et al., 2001, 2009; Twardowski et al., 2001; Sullivan et al., 2005, 2013; Buonassissi and Dierssen, 2010; Nayak et al., 2018).
Due to the path attenuation of the transmitted and returned signals, an exponential loss was observed in extracted particles for slices with increasing distance from the sensor. As a result, only particle field data from the first slice, i.e., closest to the sensor, are presented. Figure 4 shows resulting PSDs averaged over the entire dusk and dawn time series. After applying a correction for blurring (see Supplementary Appendix A), reasonable agreement was observed between sparse, dense, and densest scan modes. Power law slopes in corrected data were approximately 3.0 and 2.6 for the dusk and dawn time series, respectively, slopes were flatter at dawn for all scan modes.
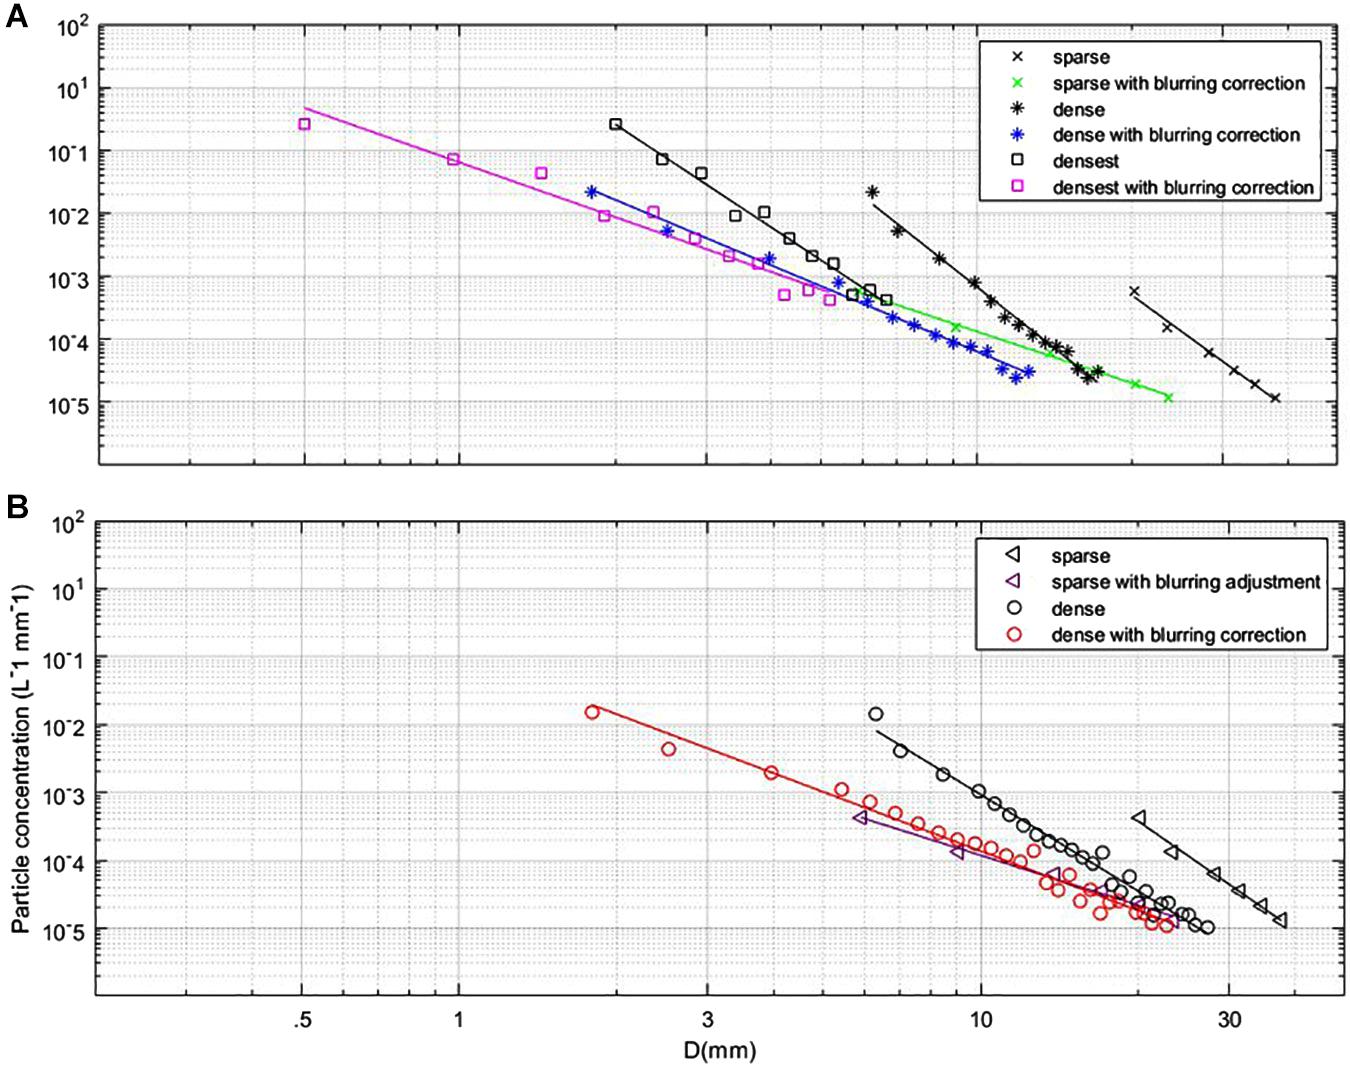
Figure 4. (A) PSD averages from sparse, dense and densest scan modes with and without blurring correction for dusk time-series. (B) PSD averages for sparse and dense scan modes with and without blurring correction for dawn timeseries.
For the dense scans, comparison of averaged PSDs revealed elevated particle concentrations for the dusk time series in comparison to the dawn time series below 5 mm (Figure 5), while for particles > 5 mm higher concentrations were observed at dawn relative to dusk. Above 10 mm, the dawn station recorded much higher concentrations; these size bins most likely represent swimming organisms periodically entering the sample volume. A cumulative view of the particle concentrations for each size bin revealed a non-normal distribution, this led to outlier selection using nonparametric statistics, detailed in the next sub-section.
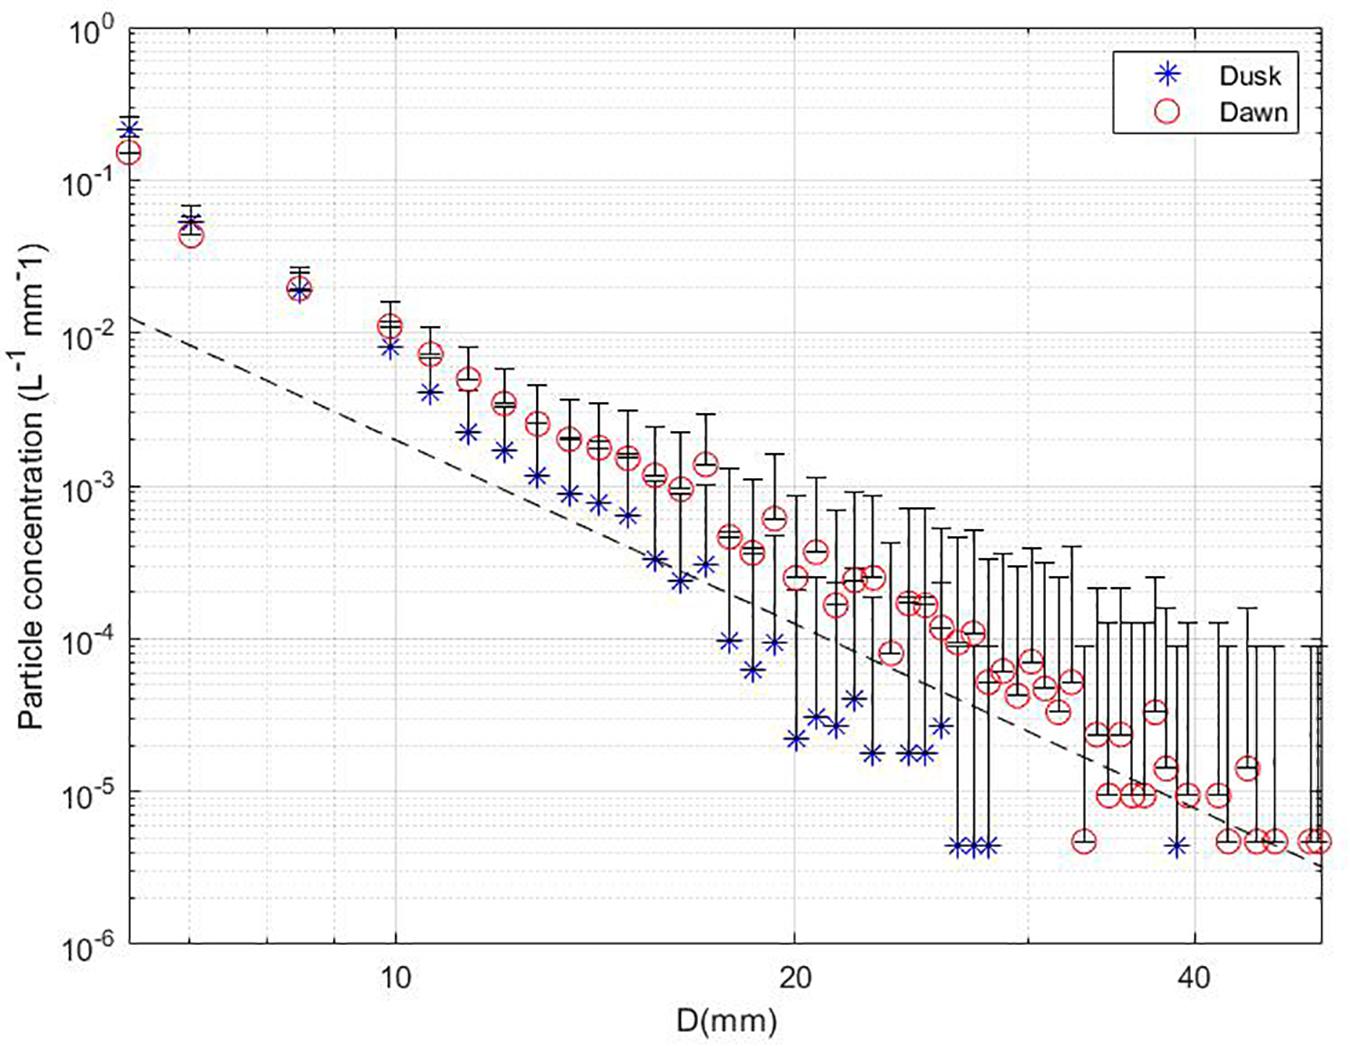
Figure 5. Average particle concentrations for dense scan mode at dusk (blue stars) and dawn (red circles); error bars represent one positive standard deviation. Large particles (>50 mm) are not shown due to insufficient numbers sampled. Dotted line represents the steady state slope of −4.
Outlier Scans With Enhanced Particle Concentrations
Outlier scans record anomalously high particle concentrations relative to the typical marine snow background and are labeled “particle enhancements.” Outliers are identified as values greater than the upper quartile whisker of a box plot for a size bin. The upper whisker is calculated as Q3 + 2.5 × (Q3 – Q1), where Q1 is the lower quartile and Q3 is the upper quartile (Figure 6). Particle enhancements were assessed for the first four size bins for the dense and densest scans; beyond the first four size bins particle abundance was too low to conduct statistical analysis. Images from the dusk and dawn stations revealed particle enhancements occurring for particle size bins 3.96 (Figures 6A,B) and 5.41 mm (Figures 6C,D), respectively. For the densest scans, particle enhancements were most observed for size bin 2.52 mm. This particle enhancement analysis can be used as a metric to identify images where organisms such as copepods may be entering image volumes. The increasing trend in particle size is consistent with trends found in Figure 4. The densest station had enhancement events relatively evenly distributed across all size classes. The most notable feature in many of the densest scans were long, ellipsoid shaped organisms with enhancements for size bins 0.5, 0.96, 1.43, and 2.5 mm (Figure 6F).
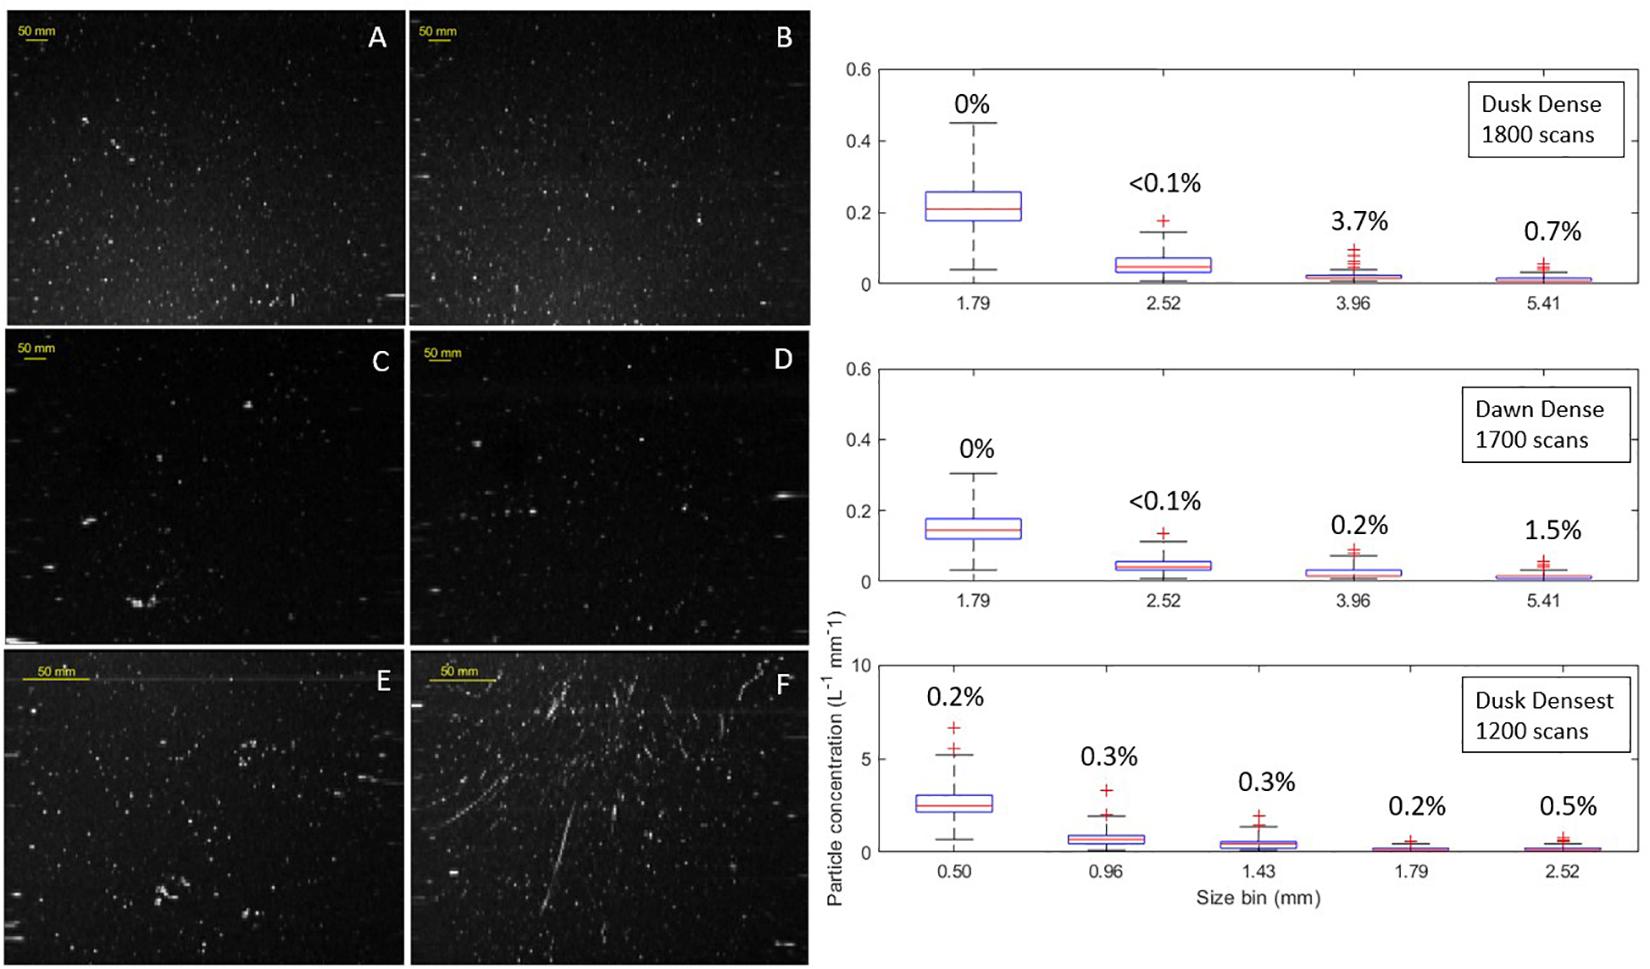
Figure 6. Gray scale images containing anomalous particle enhancements taken in dense scan mode for dusk (A,B) and dawn (C,D) stations, similarly images taken in densest scan mode for dusk station (E,F). Box and whisker plots per size bin for dense and densest scan modes on right with percentage of particle enhancement events provided above box and whiskers (see text for details).
Large organisms were imaged in the sparse, dense and densest scan modes for both dusk and dawn stations; these occurrences are too few to represent statistically but this is a notable result which indicates a population of larger organisms present among the marine snow background (Figure 7). Size and shape characteristics indicate these include siphonophores, various cnidarians, tunicates, and micronekton.
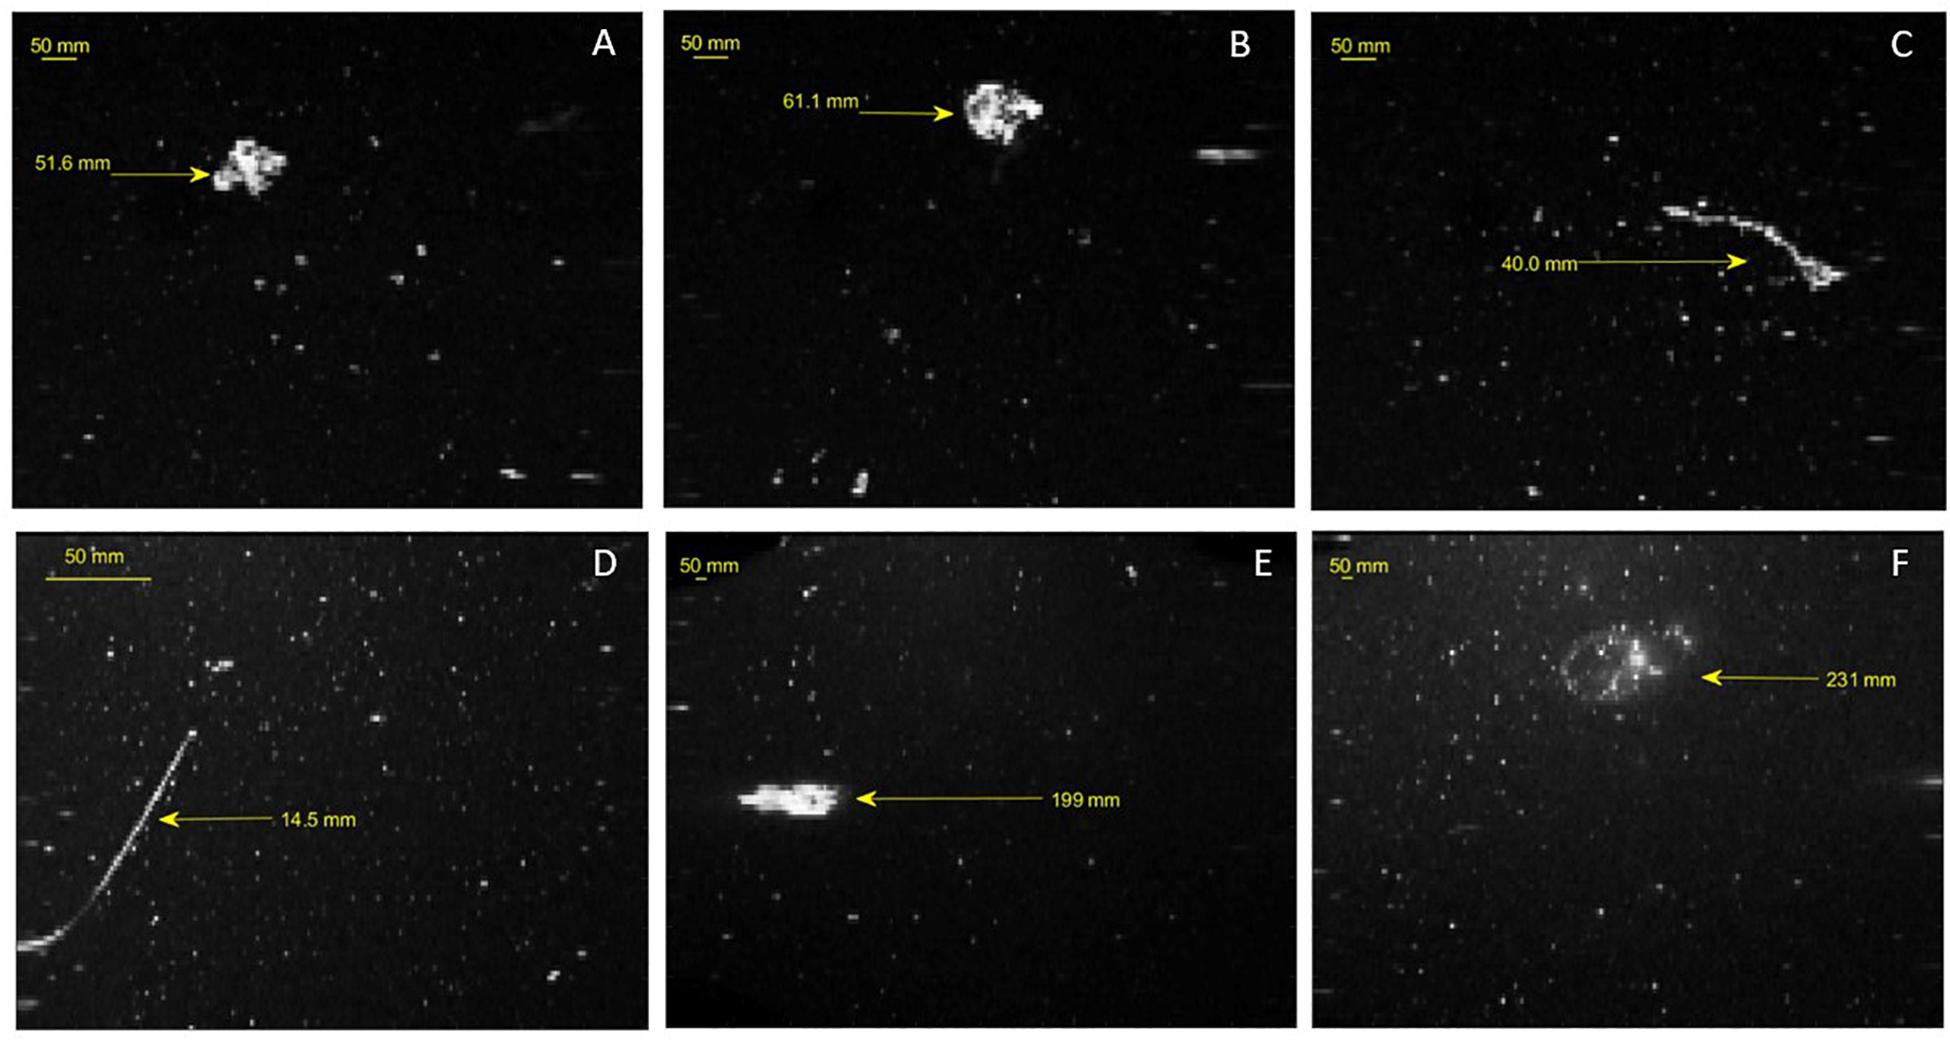
Figure 7. Gray-scale images of large organisms with calculated spherical diameter in mm. Images (A–C) are imaged in dense mode, image (D) represents the densest scan mode (E,F) are imaged in sparse scan mode.
Lidar Derived Particle Patchiness
For every particle extracted from the volume, its Euclidian distance from all other particles was determined to assess relative clustering or dispersion of particles. A two-tail z-test was conducted for this distance metric (Malkiel et al., 2006). This form of hypothesis testing determines the likelihood that the sample distribution differs statistically from the population distribution mean () and standard deviation (σp). Statistical significance for this hypothesis test was determined by the z-score, defined as,
where is the mean distance between particles in the scan slice and N is the combination of distances counted for each particle. Z-score is an indicator of significance, where z < −3 corresponds to significant (p < 0.001) particle clustering and z > 3 to significant dispersion. The spatial distribution of particles in each scan was compared to a random uniform distribution of particles. The random distribution was simulated with similar particle concentrations and the same geometric sample volume as all scans from the dusk and dawn timeseries. The simulated uniform distribution defined the population mean () and standard deviation (σp) to allow for an unbiased description of particle proximity when calculating the z-score. Figure 8 provides a comparison of the particle spatial distribution of an image from the dawn station with a simulated uniform distribution. The z-score for the sample image (Figure 8A) was calculated as −0.53, indicating agreement with uniformly distributed particles. The rectangular (200 × 100) image skews the proximity of uniform particles as exemplified by the simulated data line in Figure 8B. Z-scores are calculated for every dense scan for each station to test for closer particle proximity (clustering) or more distant particle proximity (dispersion) than the average simulated distribution. Scans which feature mostly marine snows background are expected to demonstrate a particle field with a uniform distribution. The dusk station scans strongly favored clustering as indicated by the extended lower limit tail and the peak in z-scores falling below 0 (Figure 8C). The cumulative z-scores of the dawn station were centered around 0 (Figure 8D), indicating the majority of scans had particles uniformly distributed in the scan volume. Visual inspection of the images such as those shown in Figures 6, 7 confirms the statistical interpretation of dusk and dawn differences in PSDs and spatial patchiness. Generally, the dusk scans featured a higher concentrations of particles less than 5 mm. The increased population of small particles (<5 mm) created a higher likelihood of clustering caused by smaller particles (Figure 5). At both dusk and dawn, less than 4% of all scans featured images with particle enhancements and clustering. There were select cases of images with large organisms > 50 mm and clustering; examples of these included Figures 7A,D with z-scores of −3.65 and −12.5, respectively. Excluding scans with particle enhancements and large organisms, the spatial distribution of the particle field followed a uniform distribution.
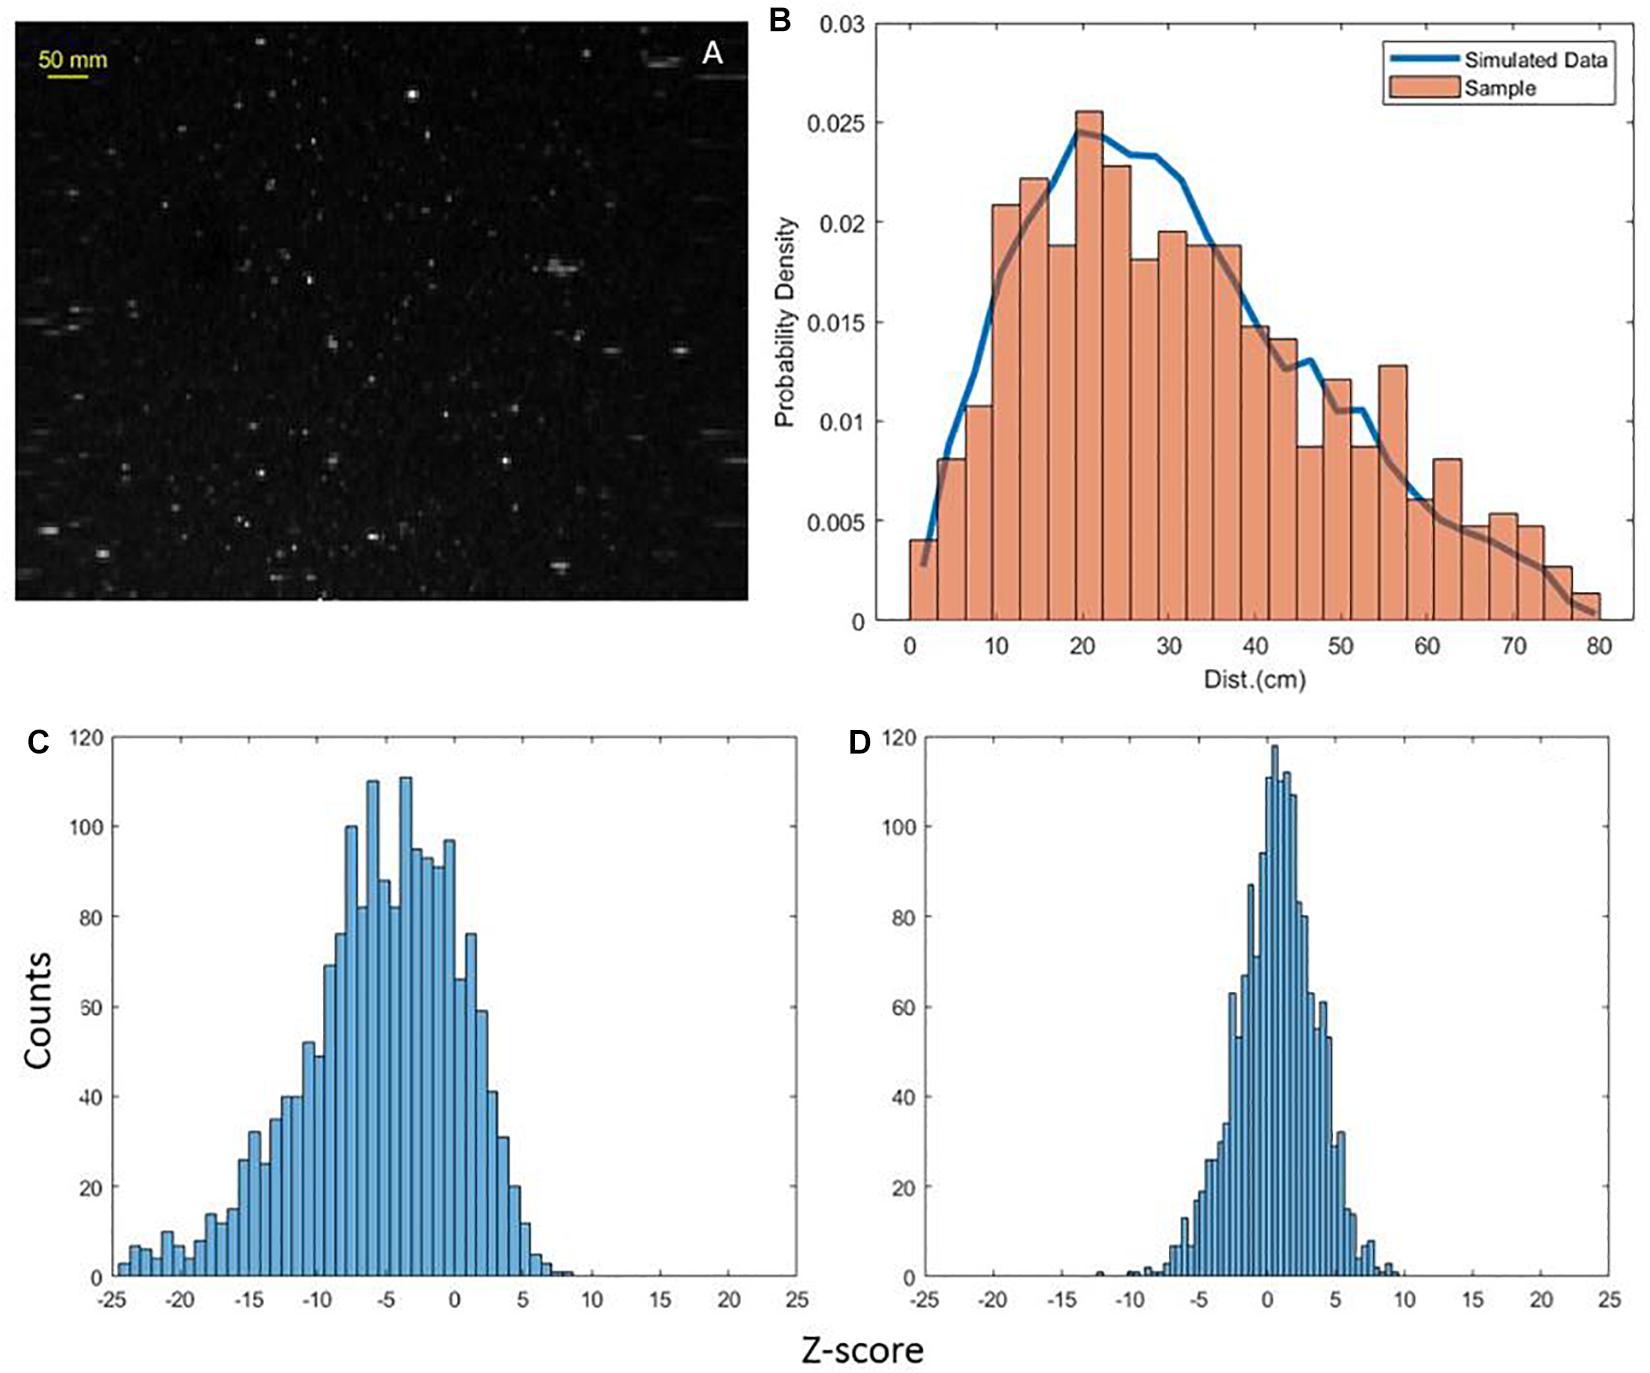
Figure 8. Sample dense image from dawn station (A). Probability density function of spatial distance of particles from sample image compared with simulated data (B). Histogram of all calculated z-scores for dense scans at dusk (C) and dawn (D).
The scarcity of larger particles in the relatively small volumes sampled allows for interpretation of spiking in optical backscatter and transmissometer time series data to be classified as individual particles (Gardner et al., 2000; Briggs et al., 2013; Giering et al., 2019). Briggs et al. (2013) present an inversion method which uses the variance-to-mean ratio (VMR) of optical signal to estimate mean particle size. Briefly, Briggs et al. (2013) used the VMR of de-trended optical time series data to obtain a weighted mean signal per particle. This per particle optical proxy was then converted to a particle cross-sectional area using estimates of sample volume, scattering efficiency Q, particle residence time in the sample volume tres, and sample integration time tsamp. This area was then converted to an equivalent circular diameter. Here, we follow the same method, but replace the VMR with the height of each optical parameter spike above a running median background of smaller particles, effectively deriving a diameter for each spike height, rather than a single mean diameter for the time series. The window for the running median was seven times either tres or tsamp, whichever was greater. For attenuation, Qc = 2 and tsamp = 0.003 s were used (Briggs et al., 2013). The sample volume was 12.5 ml, 2.5 times larger than Briggs et al. (2013) due to the 25 cm path length and tres was estimated following Briggs et al. (2013) to be 0.39 s (dusk) and 0.61 s (dawn). Logarithmically spaced bins from 0.11 to 11 mm were derived for cp and divided by bin width and the total volume sampled after correcting for water movement for each time series to yield cp-derived PSDs for each station (Briggs et al., 2013). The cp-derived PSD was calculated separately for each of the nine ac-9 wavelengths and all the resulting PSDs were averaged. As in Briggs et al. (2013), the same method was used to calculate PSDs from the bbp time series, substituting bbp for cp and Qbb for Qc. A Qbb of 0.04 was chosen following Briggs et al. (2013) based on the mean bbp/cp ratio of ∼1/50 observed during this study. The sample volume was estimated at 0.62 ml, tsamp was 1 s, and tres was estimated continuously from the estimated path length of a particle through the ECO-VSF sample volume (∼1 cm) divided by the vertical velocity of the sensor package calculated from the pressure sensor over a 3 s interval. A bbp-derived PSD was estimated separately for each of the three angles of the ECO-VSF, and the three PSDs were averaged to create a final PSD. Figure 9 presents bbp measurements recorded during the time series for dusk and dawn, with the spikier dawn timeseries indicating enhanced concentrations of large particles. Figure 10 shows combined PSDs from ECO-VSF backscattering, ac-9 attenuation, and all available lidar scan modes. PSD slopes from cp and bbp were about 4.7 and 4.5 from the dusk and dawn time series, respectively, both significantly steeper than the slopes observed from lidar (also see Figure 5). PSDs were also higher for the lidar measurements for overlapping size bins.
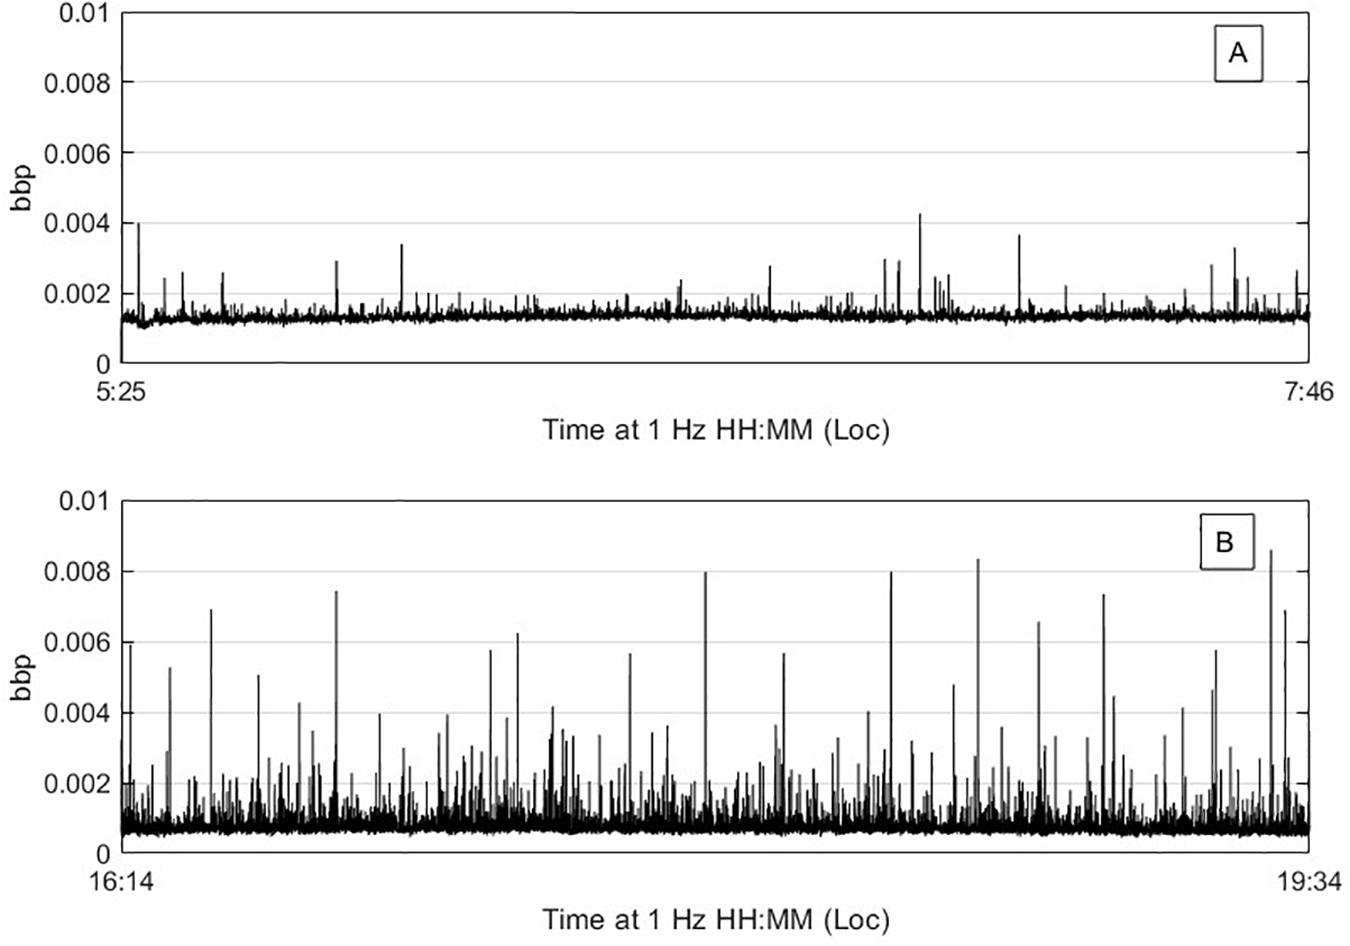
Figure 9. Particle backscatter time series from the ECO-VSF for dusk (A) and dawn (B).
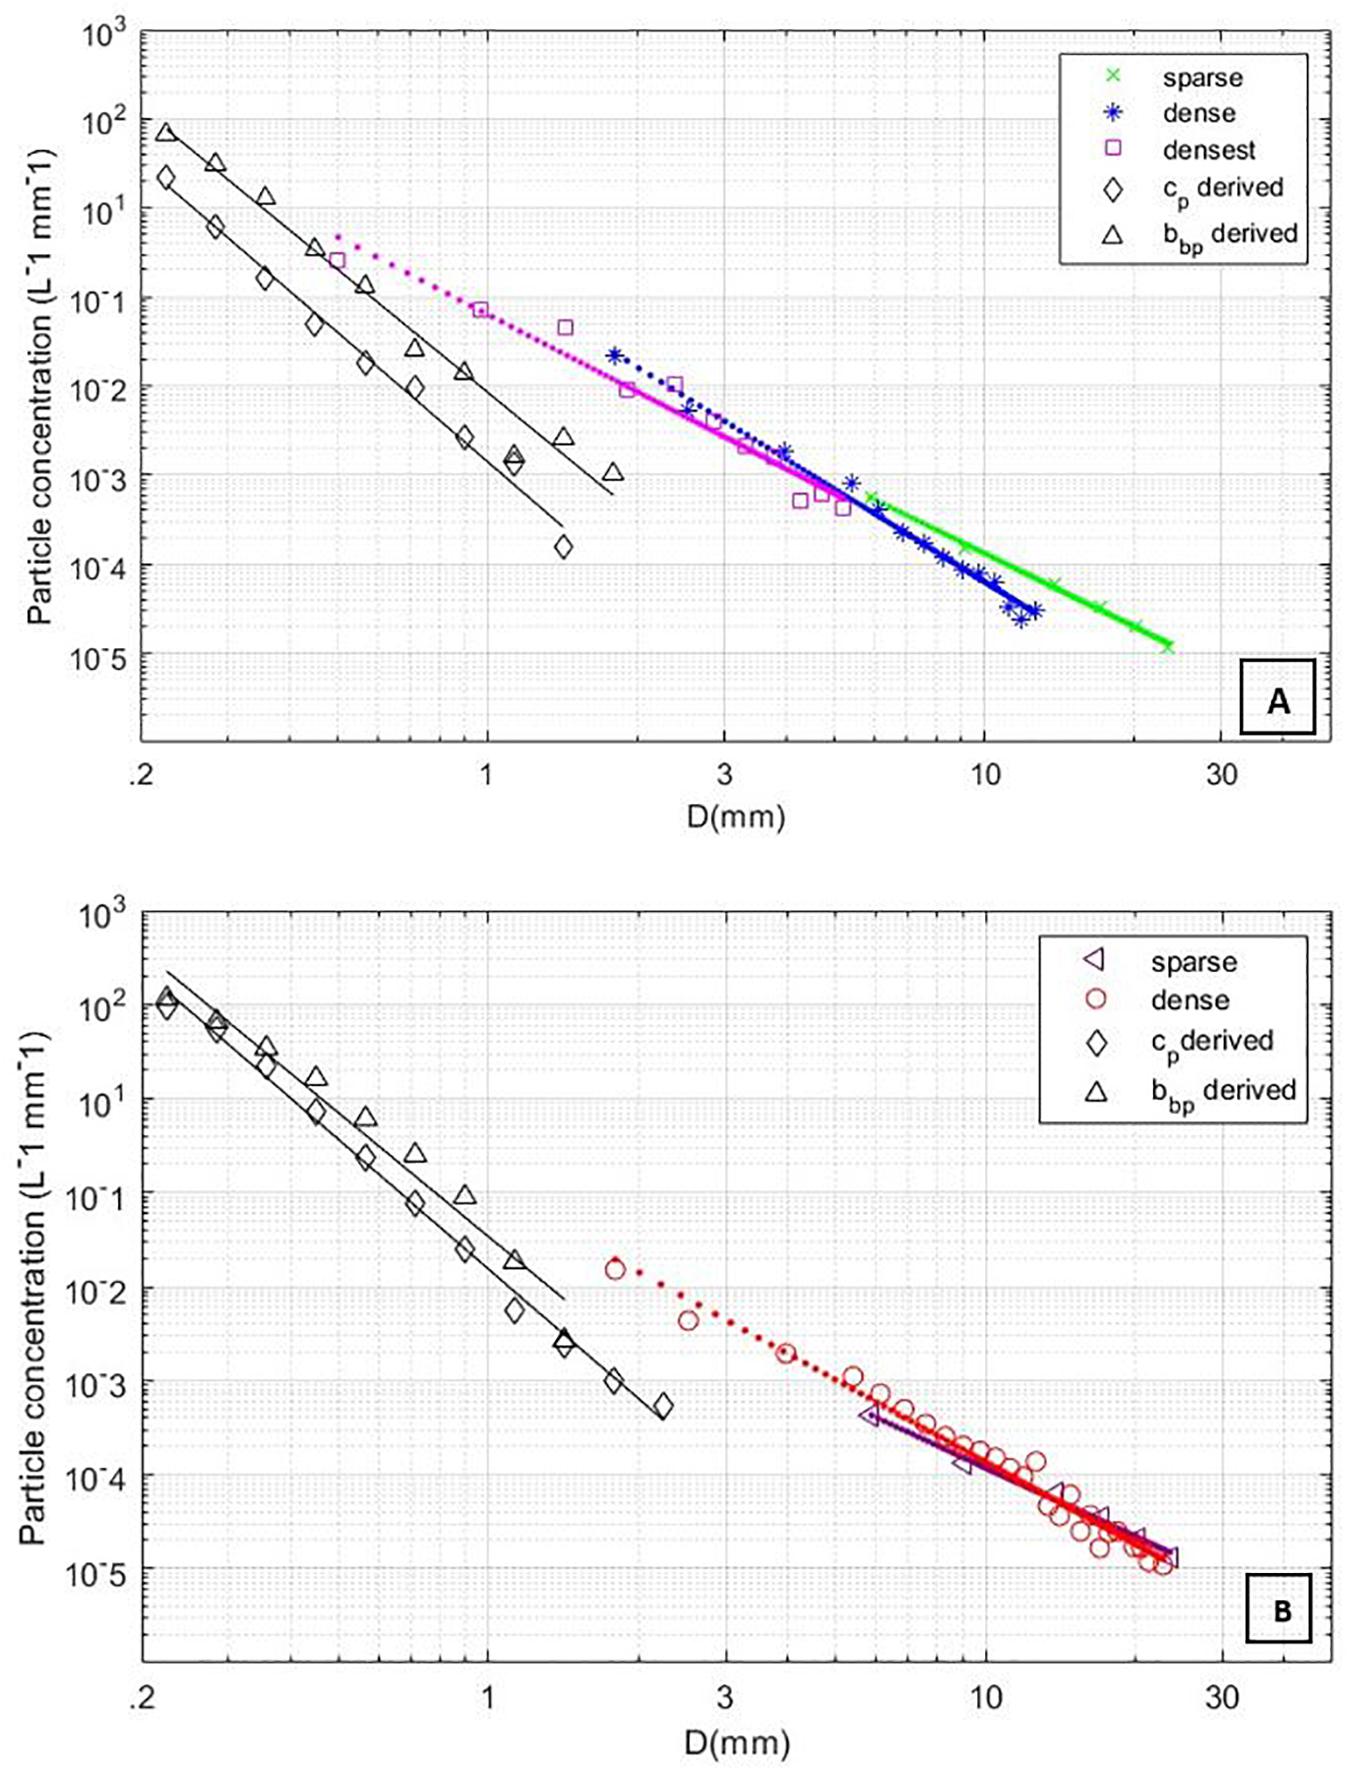
Figure 10. (A) Sparse, dense, and densest lidar derived PSDs with bbp and cp derived PSDs for dusk time series. (B) Sparse and dense lidar derived PSDs with bbp and cp derived PSDs for dawn time series.
Discussion
The marine particle field and its variability in relation to the mesopelagic ecosystem is of growing interest in the scientific community, but still lacks understanding as it is deeply connected through many processes which span a wide size spectra (Stemmann et al., 2000b, 2004; Baird and Suthers, 2007; Guidi et al., 2008; Boss et al., 2009; Burd and Jackson, 2009; Stemmann and Boss, 2012; Burd, 2013; Giering et al., 2014; St. John et al., 2016; Calleja et al., 2018; Cavan et al., 2019). Imaging lidar is presented as a new tool with a unique niche in capturing both non-living macroscopic aggregates (marine snow) and living macro-zooplankton, crustaceans, decapods, gelatinous taxon and other swimming fauna. Lidar allows in situ imaging of large delicate aggregates such as larvacean houses, mucous webs of pteropods, and other delicate organisms such as salps and siphonophores which are otherwise destroyed by nets, meshes and pumps. Figure 7 exemplifies the imaging ability of UMSLI as it serves as a tool for observing a large array of organisms but also shows the limits of identification due to resolution. Image processing expands UMSLI’s abilities beyond large organisms and into particle sizes down to 0.5 mm, allowing connectivity between intra-class organisms and processes affecting mesopelagic marine snow.
Particle abundance and size are useful metrics for biogeochemical models which describe the function of the mesopelagic zone in the biological pump process. PSDs presented here are consistent with other methods which use imaging techniques to derive PSDs for living and non-living particles ranging up to several mm (Jackson et al., 1997; Checkley et al., 2008; Picheral et al., 2010; Slade et al., 2011; Stemmann and Boss, 2012; Taucher et al., 2018). The PSD slopes presented in Figure 5 were 3.0 for the dusk station and 2.6 for dawn, where a slope of 4 indicates equal particle volumes in equal logarithmic size intervals that are representative of oceanic environments without significant influence from active biogeochemical processes (Twardowski et al., 2001; Sullivan et al., 2005; Stemmann et al., 2008). Flatter slopes in this study are likely due to aggregation of particles into larger flocs of marine snow which has occurred through downward flux from upper waters (Stemmann et al., 2004; Taucher et al., 2018). For large aggregates, studies suggest that aggregation through particle–particle interaction occurs through shear and differential sedimentation, which greatly depend on collision rates between particles, stickiness, and overall diffuse turbulence of the water column (Hunt, 1980; Jackson, 1995; Stemmann et al., 2004; Stemmann and Boss, 2012). The use of instrumentation which measure aggregate sequestration processes are vital to supplementing biogeochemical models. This study demonstrates the potential of using lidar imaging to record large aggregates within natural particle fields without causing particle breakup. UMSLI shows potential for making distinctions between living and non-living organisms based on target shape, size, and perspective information from imagery. UMSLI’s high sampling rate captures identifiable targets across multiple images, allowing for multiple capture angles and positions. It is conceivable to use this information with machine learning algorithms for organism identification based on size and morphology if a representative library could be constructed for algorithm training. This is a current area of interest in our lab.
While our dataset includes only two stations, preventing statistical inferences, results from this study reveal differences between stations that were plausibly associated with temporal dynamics of mesopelagic activity. Further such deployments to verify patterns could therefore enable important insight. Night time activity in the mesopelagic has been reported to shift particles into larger size classes (Stemmann et al., 2000a, b). Stemmann et al. (2000a); reported size shifts of increasing particle abundance at night for particles > 0.5 mm and showed that this pattern was reversed during the day. In the northeast Atlantic, observations reported in Lampitt et al. (1993) using time-lapse camera recordings showed evidence for increasing concentrations of particulate matter at night, linked specifically to the abundance in large particles. These observations are consistent with results from the dawn station, which recorded larger concentrations of particles greater than 5 mm in comparison to the dusk station (Figure 5). Stemmann et al. (2000a) suggest that, “diel vertical migration is the best candidate to explain the diel transformation of PM (particulate matter).” As DVMs hold a diverse array of organisms with dynamic temporal migratory patterns, it is difficult to attribute particle field changes to a single cause. There has been evidence linking zooplankton including copepods with particulate matter fluxes and migration activity (Stemmann and Boss, 2012). However, it is difficult to discriminate particle flux contribution between migratory consumers and residential nightly feeder (Stemmann et al., 2000a, b, 2004; Guidi et al., 2008; Giering et al., 2014; Archibald et al., 2019).
Resident and migratory mesopelagic fish are responsible for up to 15% of the total export of carbon through the mesopelagic zone, and the passive and active transport of carbon is largely attributed to swimming organisms and their fecal matter production (Davison et al., 2013; Cavan et al., 2019). It is expected that if biological activity such as feeding was apparent then resulting PSDs would demonstrate a bump at specific size classes. Evidence of this type of activity was investigated through the evaluation of outlier scans and patchiness. Overall, the results showed limited cases of scans with particle concentration enhancements for specific size classes (Figure 6). While PSD slopes for all scan modes showed no major inconsistencies which would indicate biological activity, it is obvious that the dawn station featured a higher concentration of particles > 20 mm (Figure 5). This is supported by images in Figure 7 which feature evidence of nightly feeders or migratory species. During the time periods of measurement, most observations showed uniformly distributed particle fields largely composed of marine snow (Figure 8). As mentioned, clustering in the dawn time period resulted from increased particle concentrations, likely associated with the nighttime migration. Clustering may also be caused by groups of swimming organisms. Observations of both particle enhancements and spatial clustering provided an approach to identify swimming organisms moving through the scan field in smaller size bins. The dense scan data for dawn and dusk recorded limited association of particle enhancements with clustering (<4%), this was only for smaller size bins dominated by marine snow. For the dense scans, particle enhancements were most common for the 3.96 and 5.41 mm size bins. This may be evidence of macro-zooplankton such as copepods, or small fish larvae swimming through the scan volume. The combination of images with PSD calculation allows for observation across broad size scales further connecting detritus remineralization, fauna abundance, nightly migrators, and full-time residents of the mesopelagic. Further expansion with complementary instruments could supplement the goal of observing mesopelagic dynamics in greater detail.
Despite significant differences in measurement approaches for lidar, bbp, and cp, they all showed similar trends in particle abundance, increasing for the dawn timeseries. Increases in backscatter spiking for the dawn station associated with large particles was consistent with PSD results from the lidar imager. For overlapping size bins, bbp and cp approaches result in lower PSD abundances, and overall steeper PSD slopes. Moreover, the steeper slopes, much steeper than 4, may not be realistic (Sullivan et al., 2005). Differences in derived PSDs may have resulted from differences in sample volumes and the way the bbp and cp inversions were formulated. While the lidar scans a large undisturbed sample volume, the ECO-VSF has a sample volume that is < 1 mL and only ∼1 cm away from the sensor face. The cp measurement has an active pump rapidly flowing samples through a cuvette. There is thus the potential for turbulent disruption of relatively large, fragile aggregates for bbp and cp measurements, shifting particle abundance from larger to smaller particles (Slade et al., 2011). The greater turbulence associated with the cp measurement may explain its lower PSD relative to the PSD obtained from bbp inversion. Additionally, the larger the particle the more rare its occurrence, which may lead to an increasing level of under sampling with increasing particles size for the relatively small sample volumes associated with bbp and cp measurements. Indeed, this likely is the cause of apparent rollovers in the log-log representation of size distributions derived from bbp and cp that were clearly observed for the dawn station.
The inversion of bbp and cp measurements is also sensitive to the assumed efficiencies Qc and Qbb. While estimations used here are expected to approximate the bulk optical signal, Qbb and Qc differ with particle size and shape (Briggs et al., 2011, 2013). Briggs et al. (2013) showed an apparent decreasing bulk Qc for clay aggregates measured using an ac-9 device leading to an estimated mean size decrease in the inversion. Despite these differences, results from all measurements showed similar trends and magnitudes were comparable, particularly for lidar and bbp inversion results, where PSDs could be nearly seamlessly linked (Figure 10). Moreover, the comparison with cp and bbp spike method provided a valuable check. Relative agreement between independent approaches demonstrates the potential for extending the range over which PSDs can be resolved using multiple techniques, a key objective of this study.
In order to progress in the study of how organisms play a role in the transport of carbon through the mesopelagic zone, new technologies must be developed to both monitor particle fields while observing organisms without effecting behavior. UMSLI, as an instrument originally designed for imaging large marine fish and mammals, has shown extended capabilities for characterization of relatively small particles including marine snow in this field experiment. UMSLI’s unobtrusive red laser creates opportunity for observing larger swimming organisms that otherwise practice avoidance behaviors from tow nets and ROVs (Peña, 2019; Urmy et al., 2019; Robison et al., 2020). With demonstrated capabilities of observing nekton in situ simultaneously with particulate organic matter fields, this technology shows potential for studying interactions of aggregates with organisms and resulting transformations through remote, undisturbed observation. The potential of UMSLI can also be further enhanced. The possibility of calibrating lidar returns in absolute units of backscattering would enable another approach for quantifying particle abundance while providing a measure of backscattering for a particle population that is not included in current measurements made by the oceanographic community with very small sample volumes. The contribution of this large particle size class on ocean color remote sensing in surface waters is unknown. Coupling optical measurements with multi-frequency acoustics may also allow seamless remote monitoring of size distributions over the range of microns to meters (Gruber et al., 2016). This is the focus of future work.
Data Availability Statement
The raw data supporting the conclusions of this article will be made available by the authors, without undue reservation, to any qualified researcher.
Author Contributions
TM was responsible for the processing and analysis of data and manuscript preparations. MT conceived of the study, participated in the analysis of methods and results, and provided guidance in presentation and preparation of manuscript. NB assisted with the PSD inversion method from cp and bbp data with associated results and assisted in aspects of manuscript development. AN assisted with image processing methods and manuscript development. KB processed and analyzed the acoustic data presented. FD was the principal investigator for the design, fabrication, laboratory, and field testing of the UMSLI system, and provided guidance on interpretation of raw lidar waveform arrays, filtering, and noise reduction, processing protocols, and analysis. All authors contributed to the article and approved the submitted version.
Funding
This research was funded through an award to MST by the NOAA Office of Ocean Exploration and Research under grants NA09OAR4320073 and NA14OAR4320260 to the Cooperative Institute for Ocean Exploration, Research and Technology (CIOERT) at Florida Atlantic University’s Harbor Branch Oceanographic Institute. This work was also supported by a HBOI Foundation award to MST. The development of UMSLI comes from a Marine Hydrokinetic project awarded to FD and funded by the Department of Energy under award DE-EE0006787.
Conflict of Interest
The authors declare that the research was conducted in the absence of any commercial or financial relationships that could be construed as a potential conflict of interest.
Acknowledgments
We thank the crew of the R/V Okeanos Explorer, and all correspondents with NOAA, CIOERT, and the DOE. We thank Brian Ramos, Bing Ouyang, David Windisch, Christopher Strait, and Nicole Stockley at HBOI for their contributions to the UMSLI development, field deployment, data collection, and helpful discussions in data analyses.
Supplementary Material
The Supplementary Material for this article can be found online at: https://www.frontiersin.org/articles/10.3389/fmars.2020.558745/full#supplementary-material
References
Archibald, K. M., Siegel, D. A., and Doney, S. C. (2019). Modeling the impact of zooplankton diel vertical migration on the carbon export flux of the biological pump. Global Biogeochem. Cycles 33, 181–199. doi: 10.1029/2018GB005983
Baird, M. E., and Suthers, I. M. (2007). A size-resolved pelagic ecosystem model. Ecol. Model. 203, 185–203. doi: 10.1016/j.ecolmodel.2006.11.025
Boss, E., Slade, W., and Hill, P. (2009). Effect of particulate aggregation in aquatic environments on the beam attenuation and its utility as a proxy for particulate mass. Opt. Express 17:9408. doi: 10.1364/OE.17.009408
Boss, E., Twardowski, M. S., and Herring, S. (2001). Shape of the particulate beam attenuation spectrum and its inversion to obtain the shape of the particulate size distribution. Appl. Opt. 40:4885. doi: 10.1364/AO.40.004885
Boswell, K. M., D’Elia, M., Johnston, M. W., Mohan, J. A., Warren, J. D., Wells, R. J. D., et al. (2020). Oceanographic structure and light levels drive patterns of sound scattering layers in a low-latitude oceanic system. Front. Mar. Sci. 7:51. doi: 10.3389/fmars.2020.00051
Bradley, D., and Roth, G. (2007). Adaptive thresholding using the integral image. J. Graph. Tools 12, 13–21. doi: 10.1080/2151237X.2007.10129236
Briggs, N., Dall’Olmo, G., and Claustre, H. (2020). Major role of particle fragmentation in regulating biological sequestration of CO2 by the oceans. Science 367, 791–793. doi: 10.1126/science.aay1790
Briggs, N., Perry, M. J., Cetiniæ, I., Lee, C., D’Asaro, E., Gray, A. M., et al. (2011). High-resolution observations of aggregate flux during a sub-polar North Atlantic spring bloom. Deep Sea Res. Part I 58, 1031–1039. doi: 10.1016/j.dsr.2011.07.007
Briggs, N. T., Slade, W. H., Boss, E., and Perry, M. J. (2013). Method for estimating mean particle size from high-frequency fluctuations in beam attenuation or scattering measurements. Appl. Opt. 52:6710. doi: 10.1364/AO.52.006710
Buesseler, K. O., Antia, A. N., Chen, M., Fowler, S. W., Gardner, W. D., Gustafsson, O., et al. (2007). An assessment of the use of sediment traps for estimating upper ocean particle fluxes. J Mar. Res. 65, 345–416. doi: 10.1357/002224007781567621
Buonassissi, C. J., and Dierssen, H. M. (2010). A regional comparison of particle size distributions and the power law approximation in oceanic and estuarine surface waters. J. Geophys. Res. 115:C10028. doi: 10.1029/2010JC006256
Burd, A. B. (2013). Modeling particle aggregation using size class and size spectrum approaches: Modeling Particle Aggregation. J. Geophys. Res. Oceans 118, 3431–3443. doi: 10.1002/jgrc.20255
Burd, A. B., Hansell, D. A., Steinberg, D. K., Anderson, T. R., Arístegui, J., Baltar, F., et al. (2010). Assessing the apparent imbalance between geochemical and biochemical indicators of meso- and bathypelagic biological activity: what the @$#! is wrong with present calculations of carbon budgets? Deep Sea Res. Part II 57, 1557–1571. doi: 10.1016/j.dsr2.2010.02.022
Burd, A. B., and Jackson, G. A. (2009). Particle aggregation. Annu. Rev. Mar. Sci. 1, 65–90. doi: 10.1146/annurev.marine.010908.163904
Caimi, F. M., and Dalgleish, F. R. (2013). “Subsea laser scanning and imaging systems,” in Subsea Optics and Imaging (Amsterdam: Elsevier), 327–352. doi: 10.1533/9780857093523.3.327
Calleja, M. L., Ansari, M. I, Røstad, A., Silva, L., Kaartvedt, S., Irigoien, X., et al. (2018). The mesopelagic scattering layer: a hotspot for heterotrophic prokaryotes in the red sea twilight zone. Front. Mar. Sci. 5:259. doi: 10.3389/fmars.2018.00259
Cavan, E. L., Laurenceau-Cornec, E. C., Bressac, M., and Boyd, P. W. (2019). Exploring the ecology of the mesopelagic biological pump. Progr. Oceanogr. 176:102125. doi: 10.1016/j.pocean.2019.102125
Checkley, D. M., Davis, R. E., Herman, A. W., Jackson, G. A., Beanlands, B., and Regier, L. A. (2008). Assessing plankton and other particles in situ with the SOLOPC. Limnol. Oceanogr. 53, 2123–2136. doi: 10.4319/lo.2008.53.5_part_2.2123
Choksi, B., Venkitaraman, A., and Mali, S. (2017). Finding best fit for hand-drawn curves using polynomial regression. IJCA 174, 20–23. doi: 10.5120/ijca2017915390
Dalgleish, F., Ouyang, B., Dalgleish, A., Ramos, B., Li, Y., Principe, J., et al. (2018). “MEMS-based serial LiDAR detection and imaging architecture for automated surveillance of undersea marine life,” in Proceedings of the SPIE 10677, Unconventional Optical Imaging, 1067726 (24 May 2018), Strasbourg. doi: 10.1117/12.2309997
Dalgleish, F., Ouyang, B., and Vuorenkoski, A. (2013). “A unified framework for image performance enhancement of extended range laser seabed survey sensors,” in Proceedings of the 2013 IEEE International Underwater Technology Symposium (UT), (Tokyo: IEEE), 1–7. doi: 10.1109/UT.2013.6519906
Dalgleish, F., Ouyang, B., Vuorenkoski, A., Ramos, B., Alsenas, G., Metzger, B., et al. (2017). “Undersea LiDAR imager for unobtrusive and eye safe marine wildlife detection and classification,” in Proceedings of the OCEANS 2017 – Aberdeen, (Aberdeen: IEEE), 1–5. doi: 10.1109/OCEANSE.2017.8085029
Dalgleish, F. R., Vuorenkoski, A. K., and Ouyang, B. (2013). Extended-range undersea laser imaging: current research status and a glimpse at future technologies. Mar. Technol. Soc. J. 47, 128–147. doi: 10.4031/MTSJ.47.5.16
Davison, P. C., Checkley, D. M., Koslow, J. A., and Barlow, J. (2013). Carbon export mediated by mesopelagic fishes in the northeast Pacific Ocean. Progr. Oceanogr. 116, 14–30. doi: 10.1016/j.pocean.2013.05.013
De Dominicis, L. (2013). “Underwater 3D vision, ranging and range gating,” in Subsea Optics and Imaging, (Amsterdam: Elsevier), 379–410. doi: 10.1533/9780857093523.3.379
Fang, H.-T., and Huang, D.-S. (2004). Noise reduction in lidar signal based on discrete wavelet transform. Opt. Commun. 233, 67–76. doi: 10.1016/j.optcom.2004.01.017
Foi, A., Trimeche, M., Katkovnik, V., and Egiazarian, K. (2008). Practical poissonian-gaussian noise modeling and fitting for single-image raw-data. IEEE Trans. Image Process 17, 1737–1754. doi: 10.1109/TIP.2008.2001399
Fournier, G. R. (1993). Range-gated underwater laser imaging system. Opt. Eng. 32:2185. doi: 10.1117/12.143954
Gardner, W. D., Richardson, M. J., and Smith, W. O. (2000). Seasonal patterns of water column particulate organic carbon and fluxes in the Ross Sea, Antarctica. Deep Sea Res. Part II 47, 3423–3449. doi: 10.1016/S0967-0645(00)00074-6
Giering, S. L. C., Cavan, E. L., Basedow, S. L., Briggs, N., Burd, A. B., Darroch, L., et al. (2019). Sinking organic particles in the ocean – Flux estimates from in situ optical devices. Front. Mar. Sci. 6:834. doi: 10.3389/fmars.2019.00834
Giering, S. L. C., Sanders, R., Lampitt, R. S., Anderson, T. R., Tamburini, C., Boutrif, M., et al. (2014). Reconciliation of the carbon budget in the ocean’s twilight zone. Nature 507, 480–483. doi: 10.1038/nature13123
Giering, S. L. C., Yan, B., Sweet, J., Asper, V., Diercks, A., Chanton, J. P., et al. (2018). The ecosystem baseline for particle flux in the Northern Gulf of Mexico. Elem. Sci. Anth. 6:6. doi: 10.1525/elementa.264
Gonzalez, R., Woods, R., and Eddins, S. (2009). Digital Image Processing Using MATLAB, 2nd Edn. Knoxville, TN: Gatesmark Publishing.
Gruber, P., Felix, D., Storti, G., Lattuada, M., Fleckenstein, P., and Deschwanden, F. (2016). Acoustic measuring techniques for suspended sediment. IOP Conf. Ser. 49:122003. doi: 10.1088/1755-1315/49/12/122003
Guidi, L., Jackson, G. A., Stemmann, L., Miquel, J. C., Picheral, M., and Gorsky, G. (2008). Relationship between particle size distribution and flux in the mesopelagic zone. Deep Sea Res. Part I 55, 1364–1374. doi: 10.1016/j.dsr.2008.05.014
Hansen, A. N., and Visser, A. W. (2016). Carbon export by vertically migrating zooplankton: an optimal behavior model: optimal vertical migration and carbon export. Limnol. Oceanogr. 61, 701–710. doi: 10.1002/lno.10249
Hays, G. C. (2003). A review of the adaptive significance and ecosystem consequences of zooplankton diel vertical migrations. Hydrobiologia 503, 163–170. doi: 10.1023/B:HYDR.82503408476.23617.b0
Hiaka, K., Kawaguchi, K., and Murakami, M. (2001). Downward Transport of Organic Carbon by diel Migratory Micronekton in the Western Equatorial Pacific: Its Quantitative and Qualitative Importance – ScienceDirect. Available online at: https://www.sciencedirect.com/science/article/pii/S0967063701000036 (accessed December 5, 2019).
Hung, C.-C., Xu, C., Santschi, P. H., Zhang, S.-J., Schwehr, K. A., Quigg, A., et al. (2010). Comparative evaluation of sediment trap and 234Th-derived POC fluxes from the upper oligotrophic waters of the Gulf of Mexico and the subtropical northwestern Pacific Ocean. Mar. Chem. 121, 132–144. doi: 10.1016/j.marchem.2010.03.011
Hunt, J. R. (1980). “Prediction of oceanic particle size distributions from coagulation and sedimentation mechanisms,” in Particulates in Water Advances in Chemistry, eds M. C. Kavanaugh and J. O. Leckie (Washington, DC: American Chemical Society), 243–257. doi: 10.1021/ba-1980-0189.ch011
Jackson, G. A. (1995). Comparing observed changes in particle size spectra with those predicted using coagulation theory. Deep Sea Res. Part II 42, 159–184. doi: 10.1016/0967-0645(95)00010-N
Jackson, G. A., Maffione, R., Costello, D. K., Alldredge, A. L., Logan, B. E., and Dam, H. G. (1997). Particle size spectra between 1 μm and 1 cm at Monterey Bay determined using multiple instruments. Deep Sea Res. Part I 44, 1739–1767. doi: 10.1016/S0967-0637(97)00029-0
Kaartvedt, S., Staby, A., and Aksnes, D. (2012). Efficient trawl avoidance by mesopelagic fishes causes large underestimation of their biomass. Mar. Ecol. Prog. Ser. 456, 1–6. doi: 10.3354/meps09785
Kelly, T. B., Davison, P. C., Goericke, R., Landry, M. R., Ohman, M. D., and Stukel, M. R. (2019). The importance of mesozooplankton diel vertical migration for sustaining a mesopelagic food web. Ecology 6, 2–14. doi: 10.1101/642975
Kitchen, J. C., Zaneveldan, J. R. V., and Pak, H. (1982). Effect of particle size distribution and chlorophyll content on beam attenuation spectra. Appl. Opt. 21:3913. doi: 10.1364/AO.21.003913
Klevjer, T. A., Torres, D. J., and Kaartvedt, S. (2012). Distribution and diel vertical movements of mesopelagic scattering layers in the Red Sea. Mar. Biol. 159, 1833–1841. doi: 10.1007/s00227-012-1973-y
Lampitt, R. S., Hillier, W. R., and Challenor, P. G. (1993). Seasonal and diel variation in the open ocean concentration of marine snow aggregates. Nature 362, 737–739. doi: 10.1038/362737a0
Liley, J. B. (1992). Fitting size distributions to optical particle counter data. Aeros. Sci. Technol. 17, 84–92. doi: 10.1080/02786829208959562
Liu, Z., Hunt, W., Vaughan, M., Hostetler, C., McGill, M., Powell, K., et al. (2006). Estimating random errors due to shot noise in backscatter lidar observations. Appl. Opt. 45:4437. doi: 10.1364/AO.45.004437
Malkiel, E., Abras, J. N., Widder, E. A., and Katz, J. (2006). On the spatial distribution and nearest neighbor distance between particles in the water column determined from in situ holographic measurements. J. Plankton Res. 28, 149–170. doi: 10.1093/plankt/fbi107
Martin, J. H., Knauer, G. A., Karl, D. M., and Broenkow, W. W. (1987). VERTEX: carbon cycling in the northeast Pacific. Deep Sea Res. Part A 34, 267–285. doi: 10.1016/0198-0149(87)90086-0
McDonnell, A. M. P. (2011). Marine Particle Dynamics: Sinking Velocities, Size Distributions, Fluxes, and Microbial Degradation Rates. Woods Hole, MA: Massachusetts Institute of Technology and Woods Hole Oceanographic Institution. doi: 10.1575/1912/4512
McGill, M. J. S. (2002). Lidar Remote Sensing. Available online at: https://ntrs.nasa.gov/search.jsp?R=20020070892 (accessed May 3, 2020).
Mullen, L., Laux, A., and Cochenour, B. (2009). Propagation of modulated light in water: implications for imaging and communications systems. Appl. Opt. 48:2607. doi: 10.1364/AO.48.002607
Mullen, L. J., Contarino, V. M., Laux, A., Concannon, B. M., Davis, J. P., Strand, M. P., et al. (1999). “Modulated laser line scanner for enhanced underwater imaging,” in SPIE 3761, Airborne and In-Water Underwater Imaging, (28 October 1999), ed. G. D. Gilbert (Denver, CO: SPIE), 2–9. doi: 10.1117/12.366470
Nayak, A. R., McFarland, M. N., Sullivan, J. M., and Twardowski, M. S. (2018). Evidence for ubiquitous preferential particle orientation in representative oceanic shear flows: nonrandom particle orientation in ocean. Limnol. Oceanogr. 63, 122–143. doi: 10.1002/lno.10618
Nayak, A. R., and Twardowski, M. S. (2020). “Breaking” news for the ocean’s carbon budget. Science 367, 738–739. doi: 10.1126/science.aba7109
Otsu, N. (1979). A threshold selection method from gray-level histograms. IEEE Trans. Syst. Man Cybern. 9, 62–66. doi: 10.1109/TSMC.1979.4310076
Ouyang, B., Dalgleish, F., Vuorenkoski, A., Britton, W., Ramos, B., and Metzger, B. (2013). Visualization and image enhancement for multistatic underwater laser line scan system using image-based rendering. IEEE J. Oceanic Eng. 38, 566–580. doi: 10.1109/JOE.2012.2229066
Passow, U., and Alldredge, A. L. (1995). Aggregation of a diatom bloom in a mesocosm: the role of transparent exopolymer particles (TEP). Deep Sea Res. Part II 42, 99–109. doi: 10.1016/0967-0645(95)00006-C
Peña, M. (2019). Mesopelagic fish avoidance from the vessel dynamic positioning system. ICES J. Mar. Sci. 76, 734–742. doi: 10.1093/icesjms/fsy157
Picheral, M., Guidi, L., Stemmann, L., Karl, D. M., Iddaoud, G., and Gorsky, G. (2010). The Underwater Vision Profiler 5: an advanced instrument for high spatial resolution studies of particle size spectra and zooplankton. Limnol. Oceanogr. 8, 462–473. doi: 10.4319/lom.2010.8.462
Proud, R., Handegard, N. O., Kloser, R. J., Cox, M. J., and Brierley, A. S. (2019). From siphonophores to deep scattering layers: uncertainty ranges for the estimation of global mesopelagic fish biomass. ICES J. Mar. Sci. 76, 718–733. doi: 10.1093/icesjms/fsy037
Prucnal, P. R., and Saleh, B. E. A. (1981). Transformation of image-signal-dependent noise into image-signal-independent noise. Opt. Lett. 6:316. doi: 10.1364/OL.6.000316
Robison, B. H., Sherlock, R. E., Reisenbichler, K. R., and McGill, P. R. (2020). Running the gauntlet: assessing the threats to vertical migrators. Front. Mar. Sci. 7:64. doi: 10.3389/fmars.2020.00064
Slade, W. H., Boss, E., and Russo, C. (2011). Effects of particle aggregation and disaggregation on their inherent optical properties. Opt. Express 19:7945. doi: 10.1364/OE.19.007945
St. John, M. A., Borja, A., Chust, G., Heath, M., Grigorov, I., Mariani, P., et al. (2016). A Dark Hole in our understanding of marine ecosystems and their services: perspectives from the mesopelagic community. Front. Mar. Sci. 3:31. doi: 10.3389/fmars.2016.00031
Steinberg, D. K., Goldthwait, S. A., and Hansell, D. A. (2002). Zooplankton vertical migration and the active transport of dissolved organic and inorganic nitrogen in the Sargasso Sea. Deep Sea Res. 49, 1445–1461. doi: 10.1016/S0967-0637(02)00037-7
Stemmann, L., and Boss, E. (2012). Plankton and particle size and packaging: from determining optical properties to driving the biological pump. Annu. Rev. Mar. Sci. 4, 263–290. doi: 10.1146/annurev-marine-120710-100853
Stemmann, L., Eloire, D., Sciandra, A., Jackson, G. A., Guidi, L., Picheral, M., et al. (2008). Volume distribution for particles between 3.5 to 2000 μm in the upper 200 m region of the South Pacific Gyre. Biogeosciences 5, 299–310.. doi: 10.5194/bg-5-299-2008
Stemmann, L., Jackson, G. A., and Ianson, D. (2004). A vertical model of particle size distributions and fluxes in the midwater column that includes biological and physical processes—Part I: model formulation. Deep Sea Res. 51, 865–884. doi: 10.1016/j.dsr.2004.03.001
Stemmann, L., Picheral, M., and Gorsky, G. (2000a). Diel variation in the vertical distribution of particulate matter (>0.15mm) in the NW Mediterranean Sea investigated with the Underwater Video Profiler. Deep Sea Res. Part I 47, 505–531. doi: 10.1016/S0967-0637(99)00100-4
Stemmann, L., Picheral, M., and Gorsky, G. (2000b). Vertical distribution of suspended aggregates at station DYNAPROC_PVM33. In supplement to: Stemmann, L et al. (2000): diel variation in the vertical distribution of particulate matter (>0.15 mm) in the NW Mediterranean Sea investigated with the Underwater Video Profiler. Deep Sea Res. Part I 47, 505–531. doi: 10.1016/S0967-0637(99)00100-4
Sullivan, J. M., Twardowski, M. S., Donaghay, P. L., and Freeman, S. A. (2005). Use of optical scattering to discriminate particle types in coastal waters. Appl. Opt. 44, 1667–1680. doi: 10.1364/AO.44.001667
Sullivan, J. M., Twardowski, M. S., Ronald, J., Zaneveld, V., and Moore, C. C. (2013). “Measuring optical backscattering in water,” in Light Scattering Reviews 7, (Berlin: Springer), 189–224. doi: 10.1007/978-3-642-21907-8_6
Taucher, J., Stange, P., Algueró-Muñiz, M., Bach, L. T., Nauendorf, A., Kolzenburg, R., et al. (2018). In situ camera observations reveal major role of zooplankton in modulating marine snow formation during an upwelling-induced plankton bloom. Prog. Oceanogr. 164, 75–88. doi: 10.1016/j.pocean.2018.01.004
Twardowski, M. S., Boss, E., Macdonald, J. B., Pegau, W. S., Barnard, A. H., and Zaneveld, J. R. V. (2001). A model for estimating bulk refractive index from the optical backscattering ratio and the implications for understanding particle composition in case I and case II waters. J. Geophys. Res. 106, 14129–14142. doi: 10.1029/2000JC000404
Twardowski, M. S., Dalgleish, F. R., Tonizzo, A., Vuorenkoski, D. A. K., and Strait, C. (2018). “Development and assessment of lidar modeling to retrieve IOPs,” in Ocean Sensing and Monitoring X, eds W. Hou and R. A. Arnone (Orlando, FL: SPIE), 32. doi: 10.1117/12.2309998
Urmy, S. S., Benoit-Bird, K. J., Ryan, J. P., and Horne, J. K. (2019). Mesopelagic predator-prey interactions revealed by joint passive and active acoustic observations. J. Acoust. Soc. Am. 146, 2899–2899. doi: 10.1121/1.5137058
Volk, T., and Hoffert, M. I. (2013). “Ocean carbon pumps: analysis of relative strengths and efficiencies in ocean-driven atmospheric CO2 changes,” in Geophysical Monograph Series, eds E. T. Sundquist and W. S. Broecker (Washington, DC: American Geophysical Union), 99–110. doi: 10.1029/GM032p0099
Yu, E.-F., Francois, R., Bacon, M. P., Honjo, S., Fleer, A. P., Manganini, S. J., et al. (2001). Trapping efficiency of bottom-tethered sediment traps estimated from the intercepted fluxes of 230Th and 231Pa. Deep Sea Res. Part I 48, 865–889. doi: 10.1016/S0967-0637(00)00067-4
Keywords: imaging lidar, mesopelagic, in-situ optics, image analysis, PSD, sound scattering layer
Citation: McKenzie T, Twardowski M, Briggs N, Nayak AR, Boswell KM and Dalgleish F (2020) Three-Dimensional Imaging Lidar for Characterizing Particle Fields and Organisms in the Mesopelagic Zone. Front. Mar. Sci. 7:558745. doi: 10.3389/fmars.2020.558745
Received: 04 May 2020; Accepted: 03 November 2020;
Published: 14 December 2020.
Edited by:
Alberto Basset, University of Salento, ItalyReviewed by:
Enrique Nogueira, Spanish Institute of Oceanography (IEO), SpainSergio M. Vallina, Spanish Institute of Oceanography (IEO), Spain
Gianfranco D’Onghia, University of Bari Aldo Moro, Italy
Copyright © 2020 McKenzie, Twardowski, Briggs, Nayak, Boswell and Dalgleish. This is an open-access article distributed under the terms of the Creative Commons Attribution License (CC BY). The use, distribution or reproduction in other forums is permitted, provided the original author(s) and the copyright owner(s) are credited and that the original publication in this journal is cited, in accordance with accepted academic practice. No use, distribution or reproduction is permitted which does not comply with these terms.
*Correspondence: Trevor McKenzie, dG1ja2VuemllQGZhdS5lZHU=