 Kyle M. J. Mayers1,2*
 Alex J. Poulton3
 Kay Bidle4
 Kimberlee Thamatrakoln4
 Brittany Schieler4
 Sarah L. C. Giering5
 Seona R. Wells6†
 Glen A. Tarran7
 Dan Mayor5
 Matthew Johnson8
 Ulf Riebesell9
 Aud Larsen2
 Assaf Vardi10
 Elizabeth L. Harvey11*
- 1Department of Ocean & Earth Sciences, University of Southampton, Southampton, United Kingdom
- 2Molecular Ecology, NORCE Norwegian Research Centre, Bergen, Norway
- 3The Lyell Centre for Earth and Marine Science and Technology, Heriot-Watt University, Edinburgh, United Kingdom
- 4Department of Marine and Coastal Sciences, Rutgers University, New Brunswick, NJ, United States
- 5Ocean Biogeochemistry and Ecosystems, National Oceanography Centre Southampton, Southampton, United Kingdom
- 6Institute of Biological and Environmental Sciences, University of Aberdeen, Aberdeen, United Kingdom
- 7Plymouth Marine Laboratory, Plymouth, United Kingdom
- 8Woods Hole Oceanographic Institution, Woods Hole, MA, United States
- 9GEOMAR Helmholtz Centre for Ocean Research Kiel, Kiel, Germany
- 10Department of Plant and Environmental Sciences, Weizmann Institute of Science, Rehovot, Israel
- 11Department of Biological Sciences, University of New Hampshire, Durham, NH, United States
Phytoplankton play a central role in the regulation of global carbon and nutrient cycles, forming the basis of the marine food webs. A group of biogeochemically important phytoplankton, the coccolithophores, produce calcium carbonate scales that have been hypothesized to deter or reduce grazing by microzooplankton. Here, a meta-analysis of mesocosm-based experiments demonstrates that calcification of the cosmopolitan coccolithophore, Emiliania huxleyi, fails to deter microzooplankton grazing. The median grazing to growth ratio for E. huxleyi (0.56 ± 0.40) was not significantly different among non-calcified nano- or picoeukaryotes (0.71 ± 0.31 and 0.55 ± 0.34, respectively). Additionally, the environmental concentration of E. huxleyi did not drive preferential grazing of non-calcified groups. These results strongly suggest that the possession of coccoliths does not provide E. huxleyi effective protection from microzooplankton grazing. Such indiscriminate consumption has implications for the dissolution and fate of CaCO3 in the ocean, and the evolution of coccoliths.
Introduction
Coccolithophores are small (2–20 μm), unicellular marine algae which form calcium carbonate (CaCO3) scales (coccoliths) that adorn their cells, making them a key player in the global production of CaCO3 and its export from the upper ocean to deep-sea sediments (Berelson et al., 2007; Broecker and Clark, 2009; Balch, 2018). The coccolithophore Emiliania huxleyi (Lohmann) Hay and Mohler, forms large-scale blooms that may span over 250,000 km2 (Holligan et al., 1993) and is considered one of the most widely distributed and globally abundant algae in the contemporary ocean (Winter et al., 1994; Read et al., 2013). Coccolithophores such as E. huxleyi have key roles in several biogeochemical cycles, through the ballasting of organic matter fluxes to the deep-sea (Bach et al., 2016), influencing air-sea CO2 exchange (Shutler et al., 2013), and atmospheric sulfur production (Simó, 2001). Within coccolithophore blooms, E. huxleyi can be responsible for >30% of organic carbon fixation (Poulton et al., 2013; Mayers et al., 2018). Thus, the factors that mediate the population abundance and distribution of E. huxleyi are of fundamental importance to marine biogeochemical cycling and global climate.
Despite numerous studies on coccolithophore ecology in the natural environment, the physiological or ecological function(s) for calcification remain poorly understood. Potential ecophysiological advantages for calcification and coccolith formation can be split into end-product benefits (i.e., precipitated coccoliths), as well as those involved in the process of calcification (Müller, 2019). These mechanisms include protection against calcium poisoning (Müller et al., 2015), to mitigate against stressful light and UV radiation (Xu et al., 2016), and also to reduce host susceptibility to viral infection (Johns et al., 2019). Monteiro et al. (2016) additionally suggested that protection from zooplankton predation could be a significant driver of calcification but acknowledged that additional benefits may exist and that there is little or no direct field data to support these hypotheses.
Microzooplankton (20 – 200 μm) are the primary consumers of small plankton, responsible for consuming up to 70% of daily primary production (Calbet and Landry, 2004; Schmoker et al., 2013). Prey selectivity by microzooplankton is mediated by a variety of factors including prey size, morphology, and chemical composition (Tillmann, 2004). Microzooplankton grazing studies on coccolithophores have revealed disparate results, from reduced grazing rates to enhanced grazer preference for calcified E. huxleyi cells (Hansen et al., 1996; Kolb and Strom, 2013; Harvey et al., 2015; Strom et al., 2017). Harvey et al. (2015) found that calcified E. huxleyi could slow the growth rate of the dinoflagellate predator, leading to a decline in grazing pressure. Calcified E. huxleyi cells typically only comprise 5–40% of total plankton biomass in mixed communities (Poulton et al., 2010, 2013, 2014; Mayers et al., 2018), and hence there is the potential for prey selection of non-calcified phytoplankton cells. Evidence for depression of community-level grazing rates does exist from E. huxleyi blooms (Fileman et al., 2002; Olson and Strom, 2002), however, studies that directly enumerate E. huxleyi cells rather than community-wide indices (e.g., chlorophyll concentration) find no evidence of a depression in grazing (Holligan et al., 1993; Mayers et al., 2018).
In order to clarify the role of calcification as a protective mechanism against grazing in E. huxleyi, we conducted a meta-analysis of 62 experiments designed to measure microzooplankton grazing rates, which were primarily performed during mesocosm experiments in Bergen, Norway over a period of 3 years. This meta-analysis was designed to: (1) examine the magnitude of microzooplankton grazing on E. huxleyi; (2) compare grazing rates on E. huxleyi with losses from other phytoplankton groups in the same community, including similarly sized (2–20 μm) but non-calcified nanoeukaryotes (haptophytes, cryptophytes, and chlorophytes) and small (<2 μm) non-calcified picoeukaryotes and cyanobacteria (Synechococcus); and (3) test for any evidence of selective (or non-selective) grazing on E. huxleyi in these mixed communities. Our results indicate significant microzooplankton grazing on E. huxleyi, with loss rates that are similar to other co-occurring phytoplankton groups, and no evidence of grazing avoidance of E. huxleyi. Our results present the first evidence from field populations that coccoliths do not directly protect against microzooplankton grazing, transforming our understanding of the ecological need for cell calcification and the biogeochemical fate of (ingested) coccolithophore CaCO3.
Materials and Methods
Mesocosm Set-Up
Mesocosm experiments were conducted at the Espegrend Marine Biological Station in the Raunefjord near Bergen, Norway (60°22.1′N, 5°28.1′E) (Table 1). In 2015, 9 floating KOSMOS (Kiel Off-Shore Mesocosms for Ocean Simulations; Riebesell et al., 2013) were set up and monitored for 50 days, 4 with altered CO2 concentrations (see Dörner et al., 2020 for further details). Experiments to estimate phytoplankton growth and microzooplankton grazing rates were conducted during days 19 to 31 of the experiment. In 2017, 12 bags were filled from the surrounding fjord, with 4 experimental treatments (3 bags each). These treatments were: replete inorganic nutrients (16:1 N:P as nitrate and phosphate added); shaded (nutrients as in the replete bags but with a shaded screen placed on day 10 of the experiment to reduce surface Photosynthetically Active Radiation (PAR) to 20%); low phosphorus (same nitrate as replete bags and minor phosphorus addition to a 75:1 N:P ratio); and ambient, which had no nutrient manipulation. Following nutrient additions to the relevant bags, all 12 bags were bubbled with ambient air for 2 days before air pumps were removed (see Whalen et al., 2019 for further details). In 2018, 4 bags were filled with unfiltered surrounding fjord water from a depth of ∼5 m and circulation was maintained throughout using airlift pumps (Castberg et al., 2001). Inorganic nutrients (as NaNO3 and K2HPO4) were added initially at a 16:1 N:P ratio. Additions were then adjusted based on nutrient concentrations with final total nutrient additions being 20.8 μM nitrate and 1 μM phosphate. Conditions for all mesocosm experiments are detailed in Table 1. Experiments to estimate phytoplankton growth and microzooplankton grazing rates were conducted every 2 days for 18 days in both 2015 and 2017, whereas in 2018 experiments were conducted every 2 days until an E. huxleyi bloom was evident, at which point frequency shifted to every day.
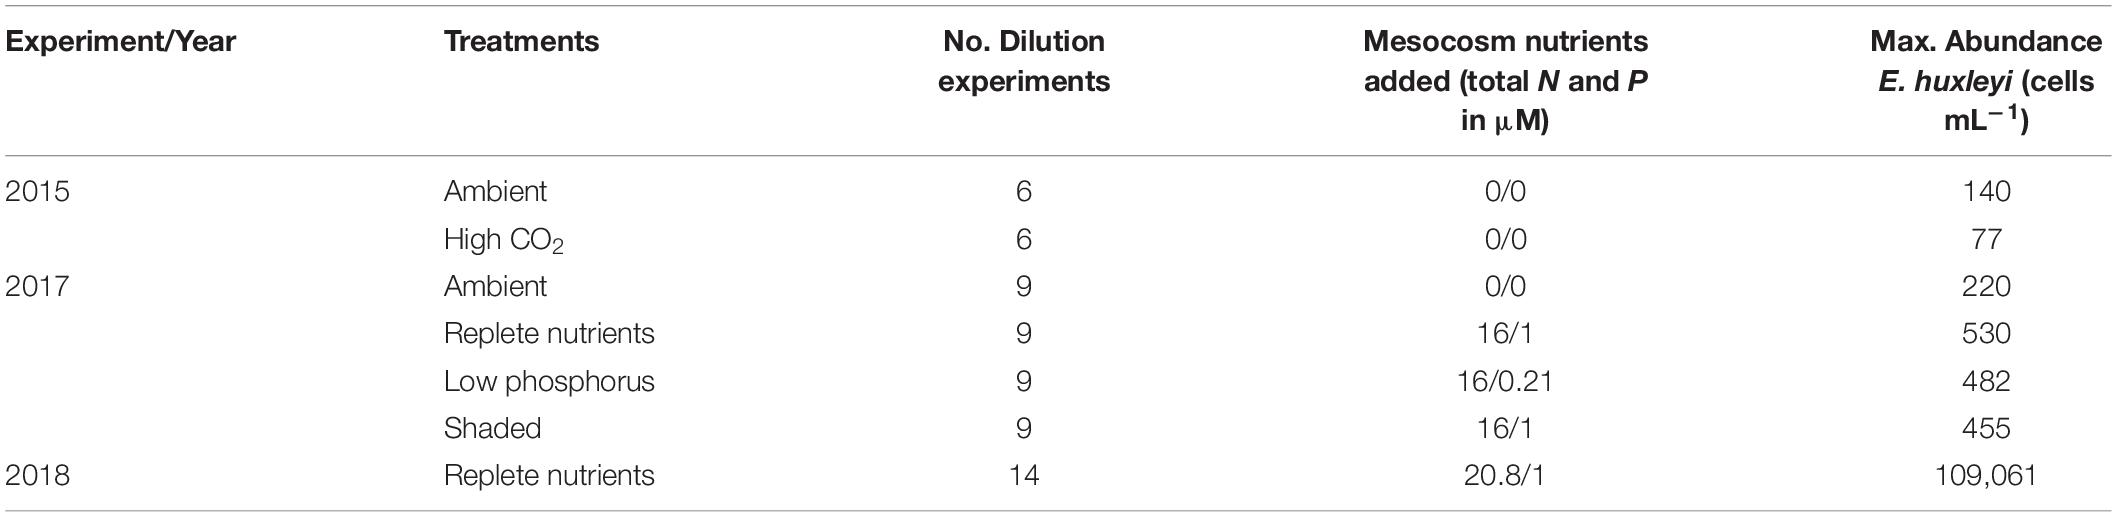
Table 1. Description of experimental treatments, number of dilution experiments, mesocosm nutrient additions and the maximum observed abundance of E. huxleyi within mesocosm experiments in 2015, 2017, and 2018.
Dilution Experiments
Phytoplankton growth and microzooplankton grazing rates were estimated using the dilution method (Landry and Hassett, 1982; Landry et al., 1995). The dilution technique measures the growth of a prey population at different dilutions with particle free water relative to an undiluted control over 24 h. The technique assumes that the growth rate is unaffected by dilution, but that the encounter rate between predator and prey is related to the proportion of dilution. The technique also assumes that the predator population is grazing non-selectively and does not always measure the grazer population, or account for trophic cascades (Calbet and Saiz, 2013). A slightly modified version of this method was used, with only one low dilution level (20%) and an undiluted treatment (Morison and Menden-Deuer, 2015, 2017). Rates calculated using this method are considered accurate compared with those using multiple dilution levels and a linear regression. Furthermore, any non-linear responses in grazing rates have been shown to not bias the reliability of the rate estimates (Morison and Menden-Deuer, 2017). All dilution experiments conducted in 2015, 2017, and 2018 had similar experimental set-ups.
During experiments conducted in 2015, water was collected using a depth-integrated water sampler (IWS, HYDRO-BIOS, Kiel). During 2017, water was collected from ∼1 m depth using a 10 L Niskin bottle, and equal volumes of water were pooled from the triplicate mesocosm bags. In 2018, water was collected using a peristaltic pump at ∼1 m depth. Equal volumes were pooled from the four mesocosm bags. During all years, larger mesozooplankton were removed from the collected seawater by screening all water through 200 μm Nitex mesh into clean carboys. The collected water was then shaded with black plastic and returned to shore. Mixing of the dilutions and partitioning into incubation bottles occurred in a temperature-controlled room, set to ambient water temperature (±2°C) which ranged from 11 to 16°C during all years. Grazer-free diluent (FSW) was prepared by gravity-filtering whole seawater (WSW) through a 0.45 μm inline filter (PALL AcropakTM Supor® membrane capsule) into a clean carboy. This filter pore size was utilized to ensure minimal losses of large and small-sized viruses. To the grazer-free diluent, WSW was added at a proportion of 20%. The 20% dilution and 100% WSW treatments were prepared in single carboys and then siphoned into triplicate 1 L NalgeneTM polycarbonate incubation bottles. To control for nutrient limitation, nutrients (10 μM nitrate and 1 μM phosphate) were added to all dilution bottles, aside from a no nutrient 100% WSW control. The 1-L incubation bottles were incubated for 24 h in an outdoor tank maintained at in situ surface temperatures through a flow-through system of ambient seawater. Bottles were allowed to freely float, and the seawater inflow caused gentle agitation throughout the 24 h period. A screen was used to mimic light conditions at ∼1 m depth, and this was verified using a HOBO data logger (Onset).
Phytoplankton Enumeration
Samples for phytoplankton enumeration and subsequent biomass estimation via flow cytometry were treated differently between mesocosm experiments conducted during 2015 and those in 2017 and 2018. In 2015, samples were enumerated using a BD AccuriTM flow cytometer with a C6 auto-sampler, and data was analyzed using the BD AccuriTM C6 software. Water samples for each bottle at the end of 24-h incubations (T24), and in triplicate from initial water during setup (T0) were pre-filtered through a 45-μm mesh and run for 6 to 7 min at a low flow rate (35 μL min–1). Events that triggered the forward scatter threshold value of 80,000 were recorded. The sample introduction probe was washed, and samples agitated between each sample run. All events with red autofluoresence (692 nm) above 3,000 (the background level of fluorescent particles present in de-ionized water and sheath fluid) were considered phytoplankton. Nanoeukaryotes (>2 μm) and picoeukaryotes (<2 μm) were determined based on their forward scatter signal relative to 3 μm calibration beads. Events that fell as picoeukaryotes but displayed orange fluorescence (585 nm) were defined as Synechococcus spp. (hereafter referenced as Synechococcus) and E. huxleyi was determined as events that fell into nanoeukaryotes but displayed an elevated side scatter (SSC) due to the presence of CaCO3 coccoliths. SpheroTM rainbow calibration beads (3 μm, 8-peak) were run as daily quality control. The gating strategy of calcified E. huxleyi was confirmed using naked and calcified cultures of strains DHB 607 and CCMP 374 during 2017 and of a natural fjord E. huxleyi bloom (∼3,000 cells mL–1) in 2018.
In 2017 and 2018, phytoplankton were enumerated on samples fixed in glutaraldehyde (<1% final concentration). In 2017, each bottle at T24, and in triplicate from T0, 5 mL of sample was taken and screened through a 40-μm mesh (to remove larger organisms and particles) into a cryovial and preserved in glutaraldehyde. Then, 250 μL of this preserved sample was added to a 96-well plate and run on a Guava EasyCyte HT (Millipore) flow cytometer. Samples were differentiated into 4 groups; picoeukaryotes, nanoeukaryotes, E. huxleyi, and Synechococcus. Picoeukaryotes and nanoeukaryotes were separated based on chlorophyll-a fluorescence and SSC signatures (to distinguish size and surface characteristics), with E. huxleyi being defined as displaying an elevated SSC relative to nanoeukaryotes due to the presence of CaCO3 coccoliths. Finally, Synechococcus was identified based on the presence of phycoerythrin which has orange fluorescence. In 2018, 1 mL of sample was taken into a cryovial and preserved in glutaraldehyde (<1% final concentration). The sample was flash-frozen after 30 minutes to 2 hours at 4°C in liquid nitrogen and stored at −80°C until analysis. Samples were thawed and analyzed on a FACSCalibur (Becton Dickinson) for 1 to 5 min, based on the number of events triggered per second.
Grazing and growth rates were calculated as in Eq. (4) and (5) of Morison and Menden-Deuer (2017). Grazing (g, d–1) rates were calculated as:
where kd is the average growth rate in the diluted (20% WSW) treatment, and x is the fraction of WSW, k1 + N is the growth rate in 100% WSW with added nutrients (i.e., the growth rate in the absence of nutrient-limited effects). Once grazing rates were calculated, the intrinsic growth rate (μ) was calculated as:
where k1 is the growth rate without nutrients added (the estimated true net growth rate).
Data Processing and Statistical Analysis
Our data set consists of 496 phytoplankton group-specific rate measurements of different phytoplankton groups. Similar to previous studies that compared a compilation of microzooplankton grazing rates (Calbet and Landry, 2004; Schmoker et al., 2013), negative grazing rates were adjusted to 0.00 d–1 (n = 54) and negative growth rates to 0.01 d–1 (n = 48) to avoid dividing by negative numbers. Grazing to growth rate ratios (g:μ) were calculated as a proxy for the fraction of production (growth) consumed for each phytoplankton group. The g:μ ratios were arctangent transformed, which reduces the impact of large ratios on averages and makes the data more normally distributed (as in Calbet and Landry, 2004). The arctangent medians and median absolute deviations were then converted back to percent consumed using the tangent function. Levene’s tests were used to assess for homogeneity of variance. In all tests, the data was found to not have a normal distribution, and therefore further analysis was done using non-parametric tests. To test for differences between growth and grazing rates, and in g:μ ratios between different phytoplankton groups, pairwise two-sided Kolmogorov-Smirnov tests were conducted using R (v. 3.3.2) (R Core Team, 2015). Model II linear regressions using ranged major axis were carried out in R using the lmodel2 package (Legendre, 2018).
Although this paper has experiments conducted under a variety of different environmental parameters and manipulations, by using large dataset comparisons, we can reduce the influence of potential biases due to environmental differences. Cell abundances from flow cytometry counts were converted to biomass using literature values for organic carbon (Tarran et al., 2006): for Synechococcus (8.58 fmol C cell–1), picoeukaryotes (36.67 fmol C cell–1) and nanoeukaryotes (0.76 pmol C cell–1). A conversion factor for the organic component of E. huxleyi was used (0.68 pmol C cell–1) (Harvey et al., 2015), assuming microzooplankton are not able to assimilate the inorganic carbon (calcite) fraction.
To determine whether a particular phytoplankton group was grazed preferentially, we used the Chesson-Manly (CM) selection index (Manly, 1974; Chesson, 1978, 1983). This index has been used in marine planktonic communities to investigate prey selectivity of copepods (Nejstgaard et al., 1997) and microzooplankton (Evans and Wilson, 2008; Löder et al., 2011). The CM selection index was calculated as:
where ri is the relative abundance of food in the diet (determined as g) and pi is the relative abundance of food in the environment (determined by flow cytometry). The α is a function of the forage ratio (ri/pi). The CM index assumes neutral grazing is 1/n, where n is the number of food groups present (which for this analysis is four from flow cytometry), a value of 0.25 therefore indicates neutral grazing pressure (i.e., grazing is dependent on abundance in the environment). We were unable to calculate a CM index for experiments where all groups displayed grazing rates which were negative or 0, however, this was only observed within three experiments.
To test for significant differences between values of the CM selection index a two-sided Kolmogorov-Smirnov test was calculated as above.
Results
Plankton Growth and Microzooplankton Grazing Rates
Dilution experiments were conducted during mesocosm experiments over three years to determine phytoplankton-group specific growth and microzooplankton grazing rates. By utilizing flow cytometry, we were able to distinguish specific rates for similarly sized phytoplankton groups (picoeukaryotes, nanoeukaryotes, Synechococcus spp., and E. huxleyi). The E. huxleyi group contained only cells with the presence of calcified scales. Non-calcified E. huxleyi may have also been present, but they are non-distinguishable from other similarly sized nanoeukaryotes. This experimental design allowed us to determine if certain features, such as size or the presence of coccoliths can affect microzooplankton grazing rates.
The highest median growth rates (± median absolute deviation) were observed for picoeukaryotes (0.39 ± 0.34 d–1) and E. huxleyi (0.25 ± 0.24 d–1), while Synechococcus and nanoeukaryotes appeared to grow at lower rates (0.17 ± 0.16 d–1, 0.14 ± 0.13 d–1, respectively (Figure 1). Growth rates were not statistically different between E. huxleyi, picoeukaryotes, and nanoeukaryotes [using a pairwise two-sided Kolmogorov-Smirnov test (KS, Supplementary Table 1)]. However, significant differences in growth rates were observed between E. huxleyi and Synechococcus (KS, p = 0.02) and picoeukaryotes and Synechococcus (KS, p < 0.01). Grazing rates were highest on nanoeukaryotes and E. huxleyi (0.25 ± 0.25 and 0.26 ± 0.26 d–1, respectively), closely followed by picoeukaryotes (0.22 ± 0.13 d–1) (Figure 1). The lowest grazing rates were exerted on Synechococcus (0.07 ± 0.07 d–1). Similar to growth rates, no significant differences (KS) in grazing rates were observed between E. huxleyi, picoeukaryotes, and nanoeukaryotes (Supplementary Table 2). Grazing on Synechococcus was significantly lower than on any other group (KS, p < 0.01). These mesocosm-derived growth and grazing rates compared well to similar measurements from a spring cruise in the Celtic Sea (Mayers et al., 2018), with ∼75% of field observations fitting within interquartile ranges (Figure 1).
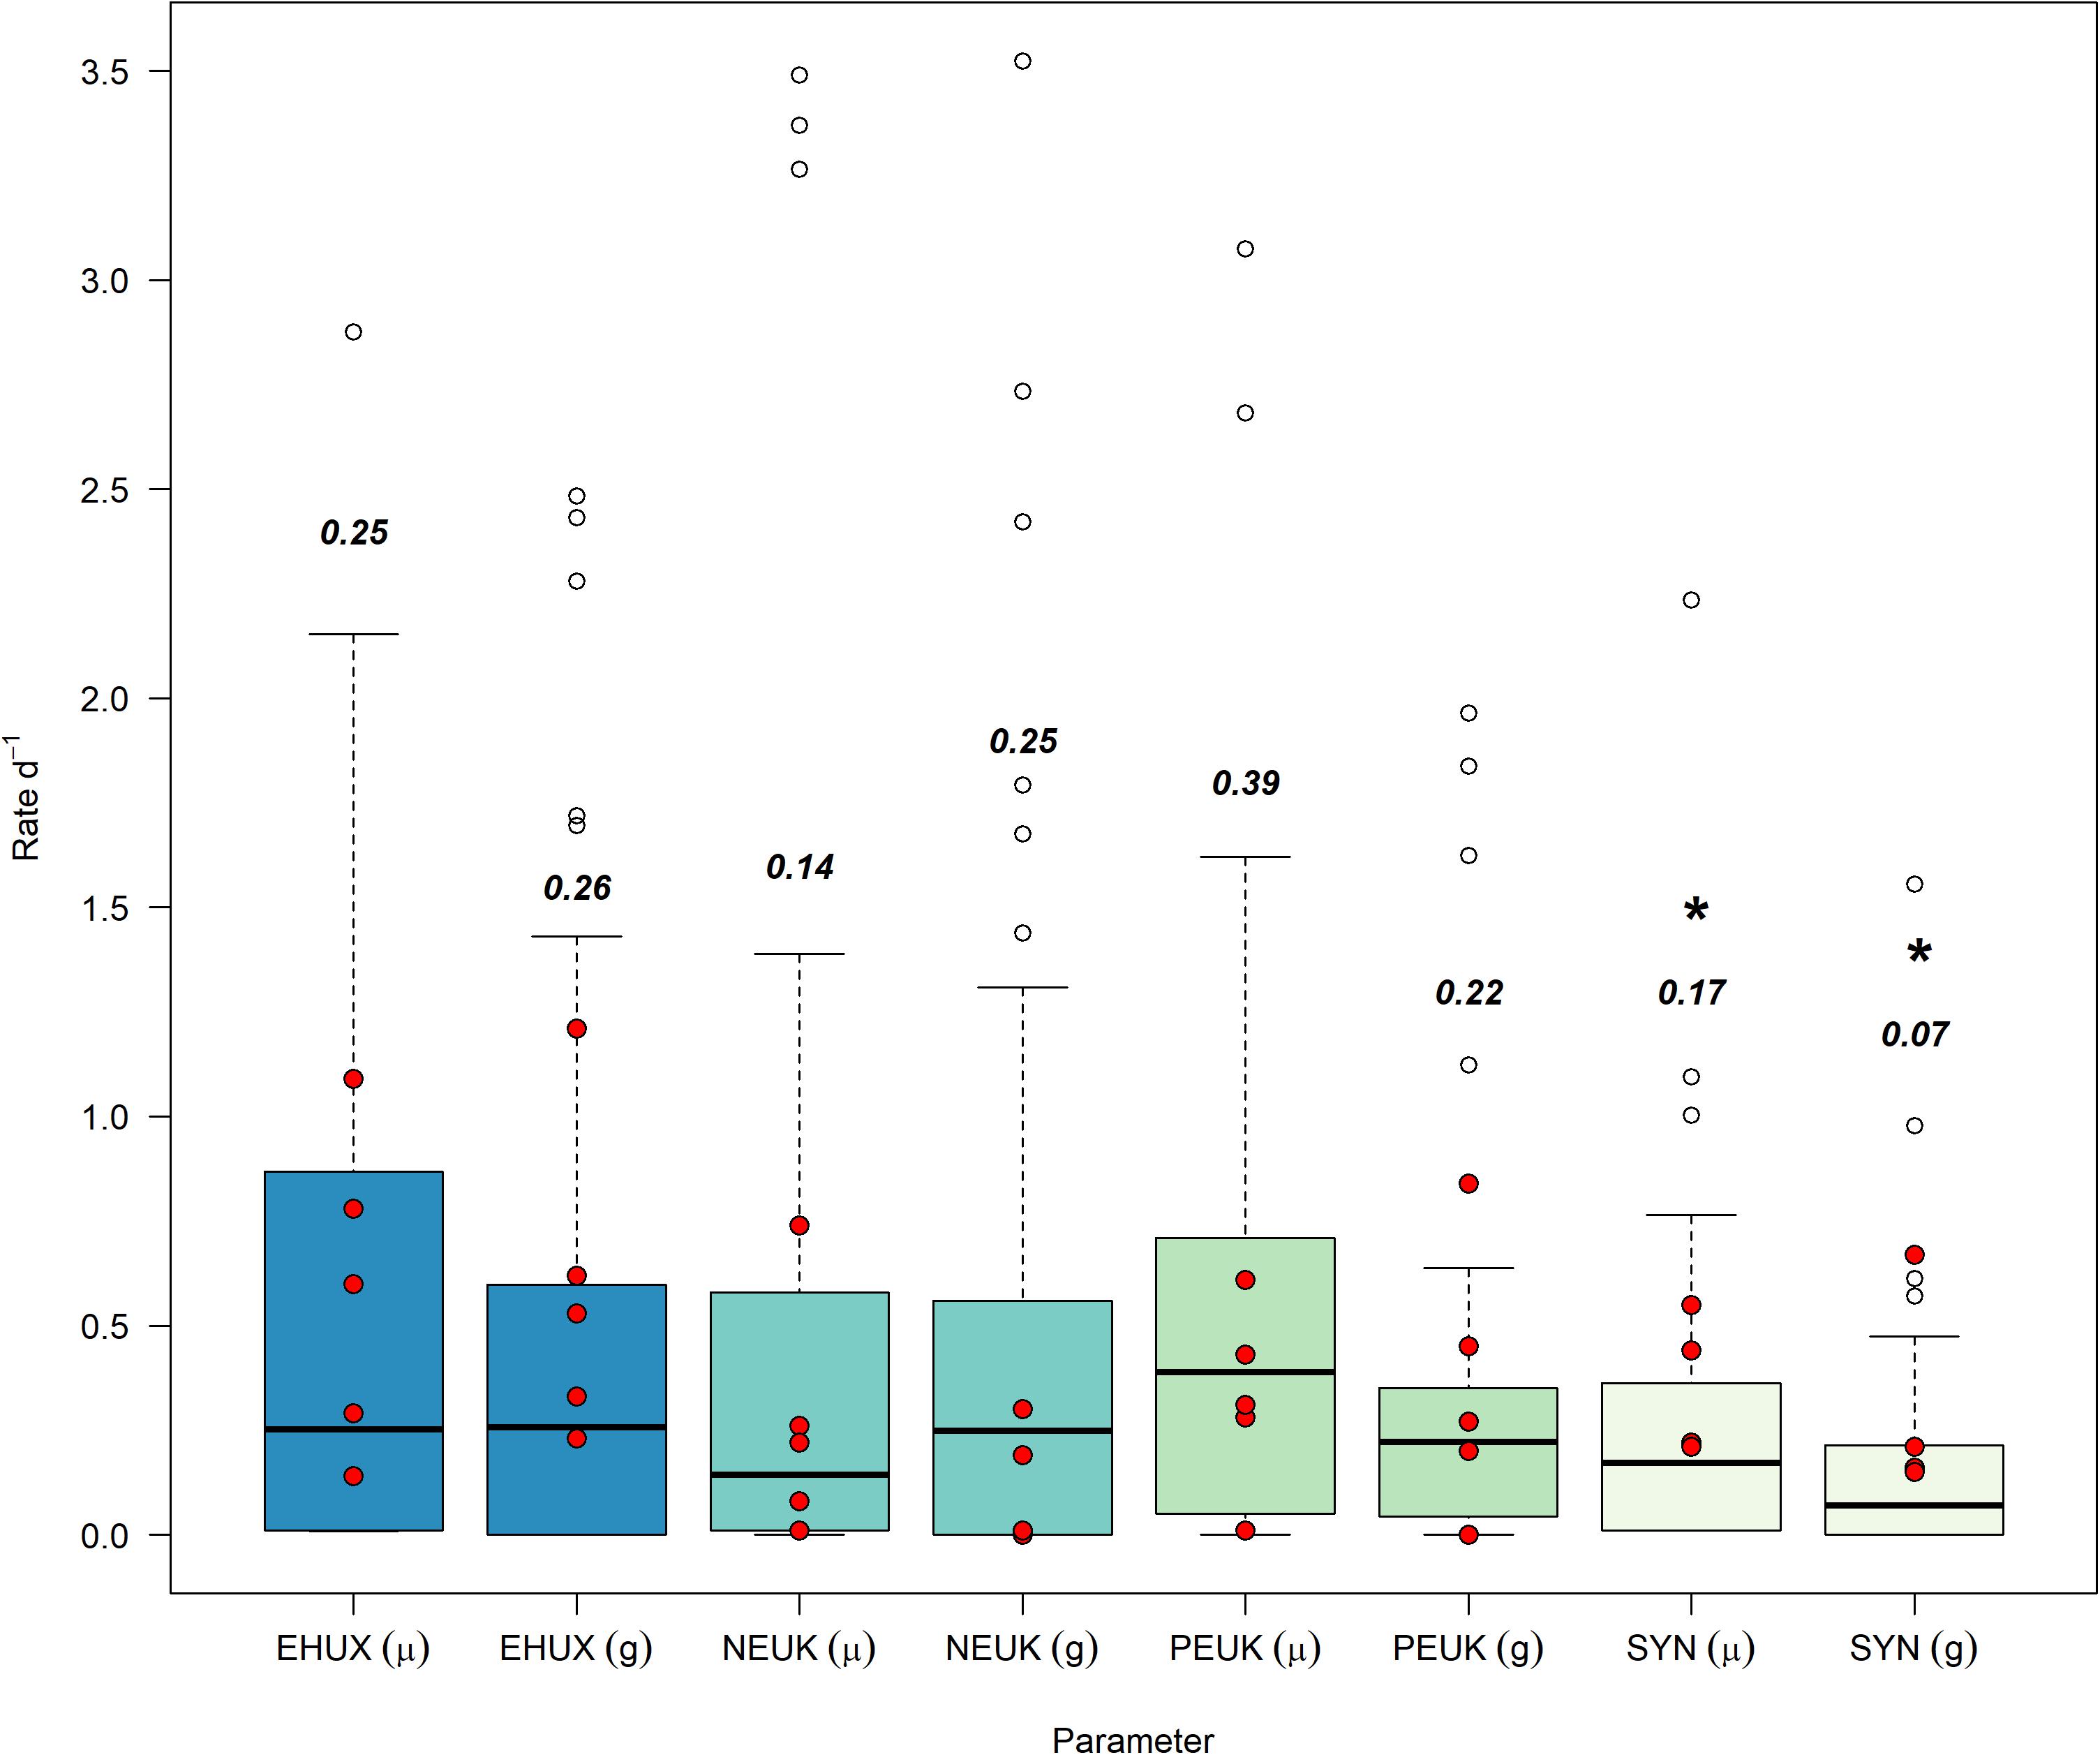
Figure 1. Growth (μ) and grazing (g) rates (d–1) from all mesocosm experiments, separated by analysis groups. Bold text represents the median values, unfilled points are outliers that are still included in data analysis, and asterisks (*) are groups that have rate distributions that are significantly different from E. huxleyi. Red overlaid dots are from non-mesocosm field experiments from Mayers et al. (2018) in the Celtic Sea (Northwest European Shelf). EHUX, E. huxleyi; NEUK, nanoeukaryotes; PEUK, picoeukaryotes; SYN, Synechococcus spp.
Although growth and grazing rates within the different phytoplankton groups varied widely we found a significant positive relationship between growth and mortality rates for all the phytoplankton groups combined (Model II linear equation, y = −0.01 + 0.83x, p < 0.001, n = 248, r2 = 0.59) (Supplementary Figure 1). The same trend was also observed for individual groups (Supplementary Figure 2), with nanoeukaryotes and Synechococcus spp. showing the most significant relationships (r2 = 0.71 and 0.72, respectively), and E. huxleyi and picoeukaryotes displaying the least (r2 = 0.55 and 0.46, respectively). For all groups p-values were <0.01.
Consumption of Plankton Production
Using the ratio of grazing (g) to growth (μ) allows us to look at the proportion of daily growth (and production) consumed by microzooplankton. The median g:μ was highest for nanoeukaryotes (0.71 ± 0.31), indicating the central tendency of the dataset is that ∼70% of daily nanoeukaryote production could be consumed by microzooplankton grazers (Figure 2). The median ratio was slightly lower for E. huxleyi (0.56 ± 0.40) and picoeukaryotes (0.55 ± 0.34), while Synechococcus (0.35 ± 0.33) had the lowest median of the group. There were no significant differences (KS) in the distributions of g:μ between E. huxleyi, nanoeukaryotes, and picoeukaryotes, though the distribution of g:μ for Synechoccocus was significantly different (p < 0.05) from all the other groups (Table 2).
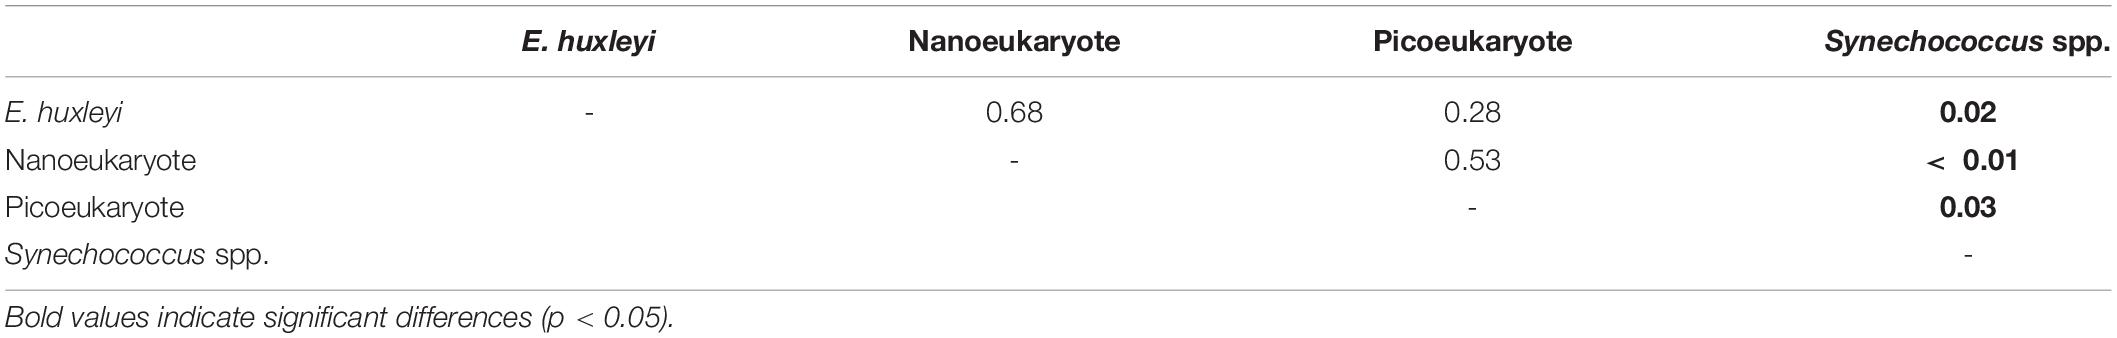
Table 2. p-values from a two-sided Kolmogorov-Smirnov test of g:μ ratios between different phytoplankton groups.
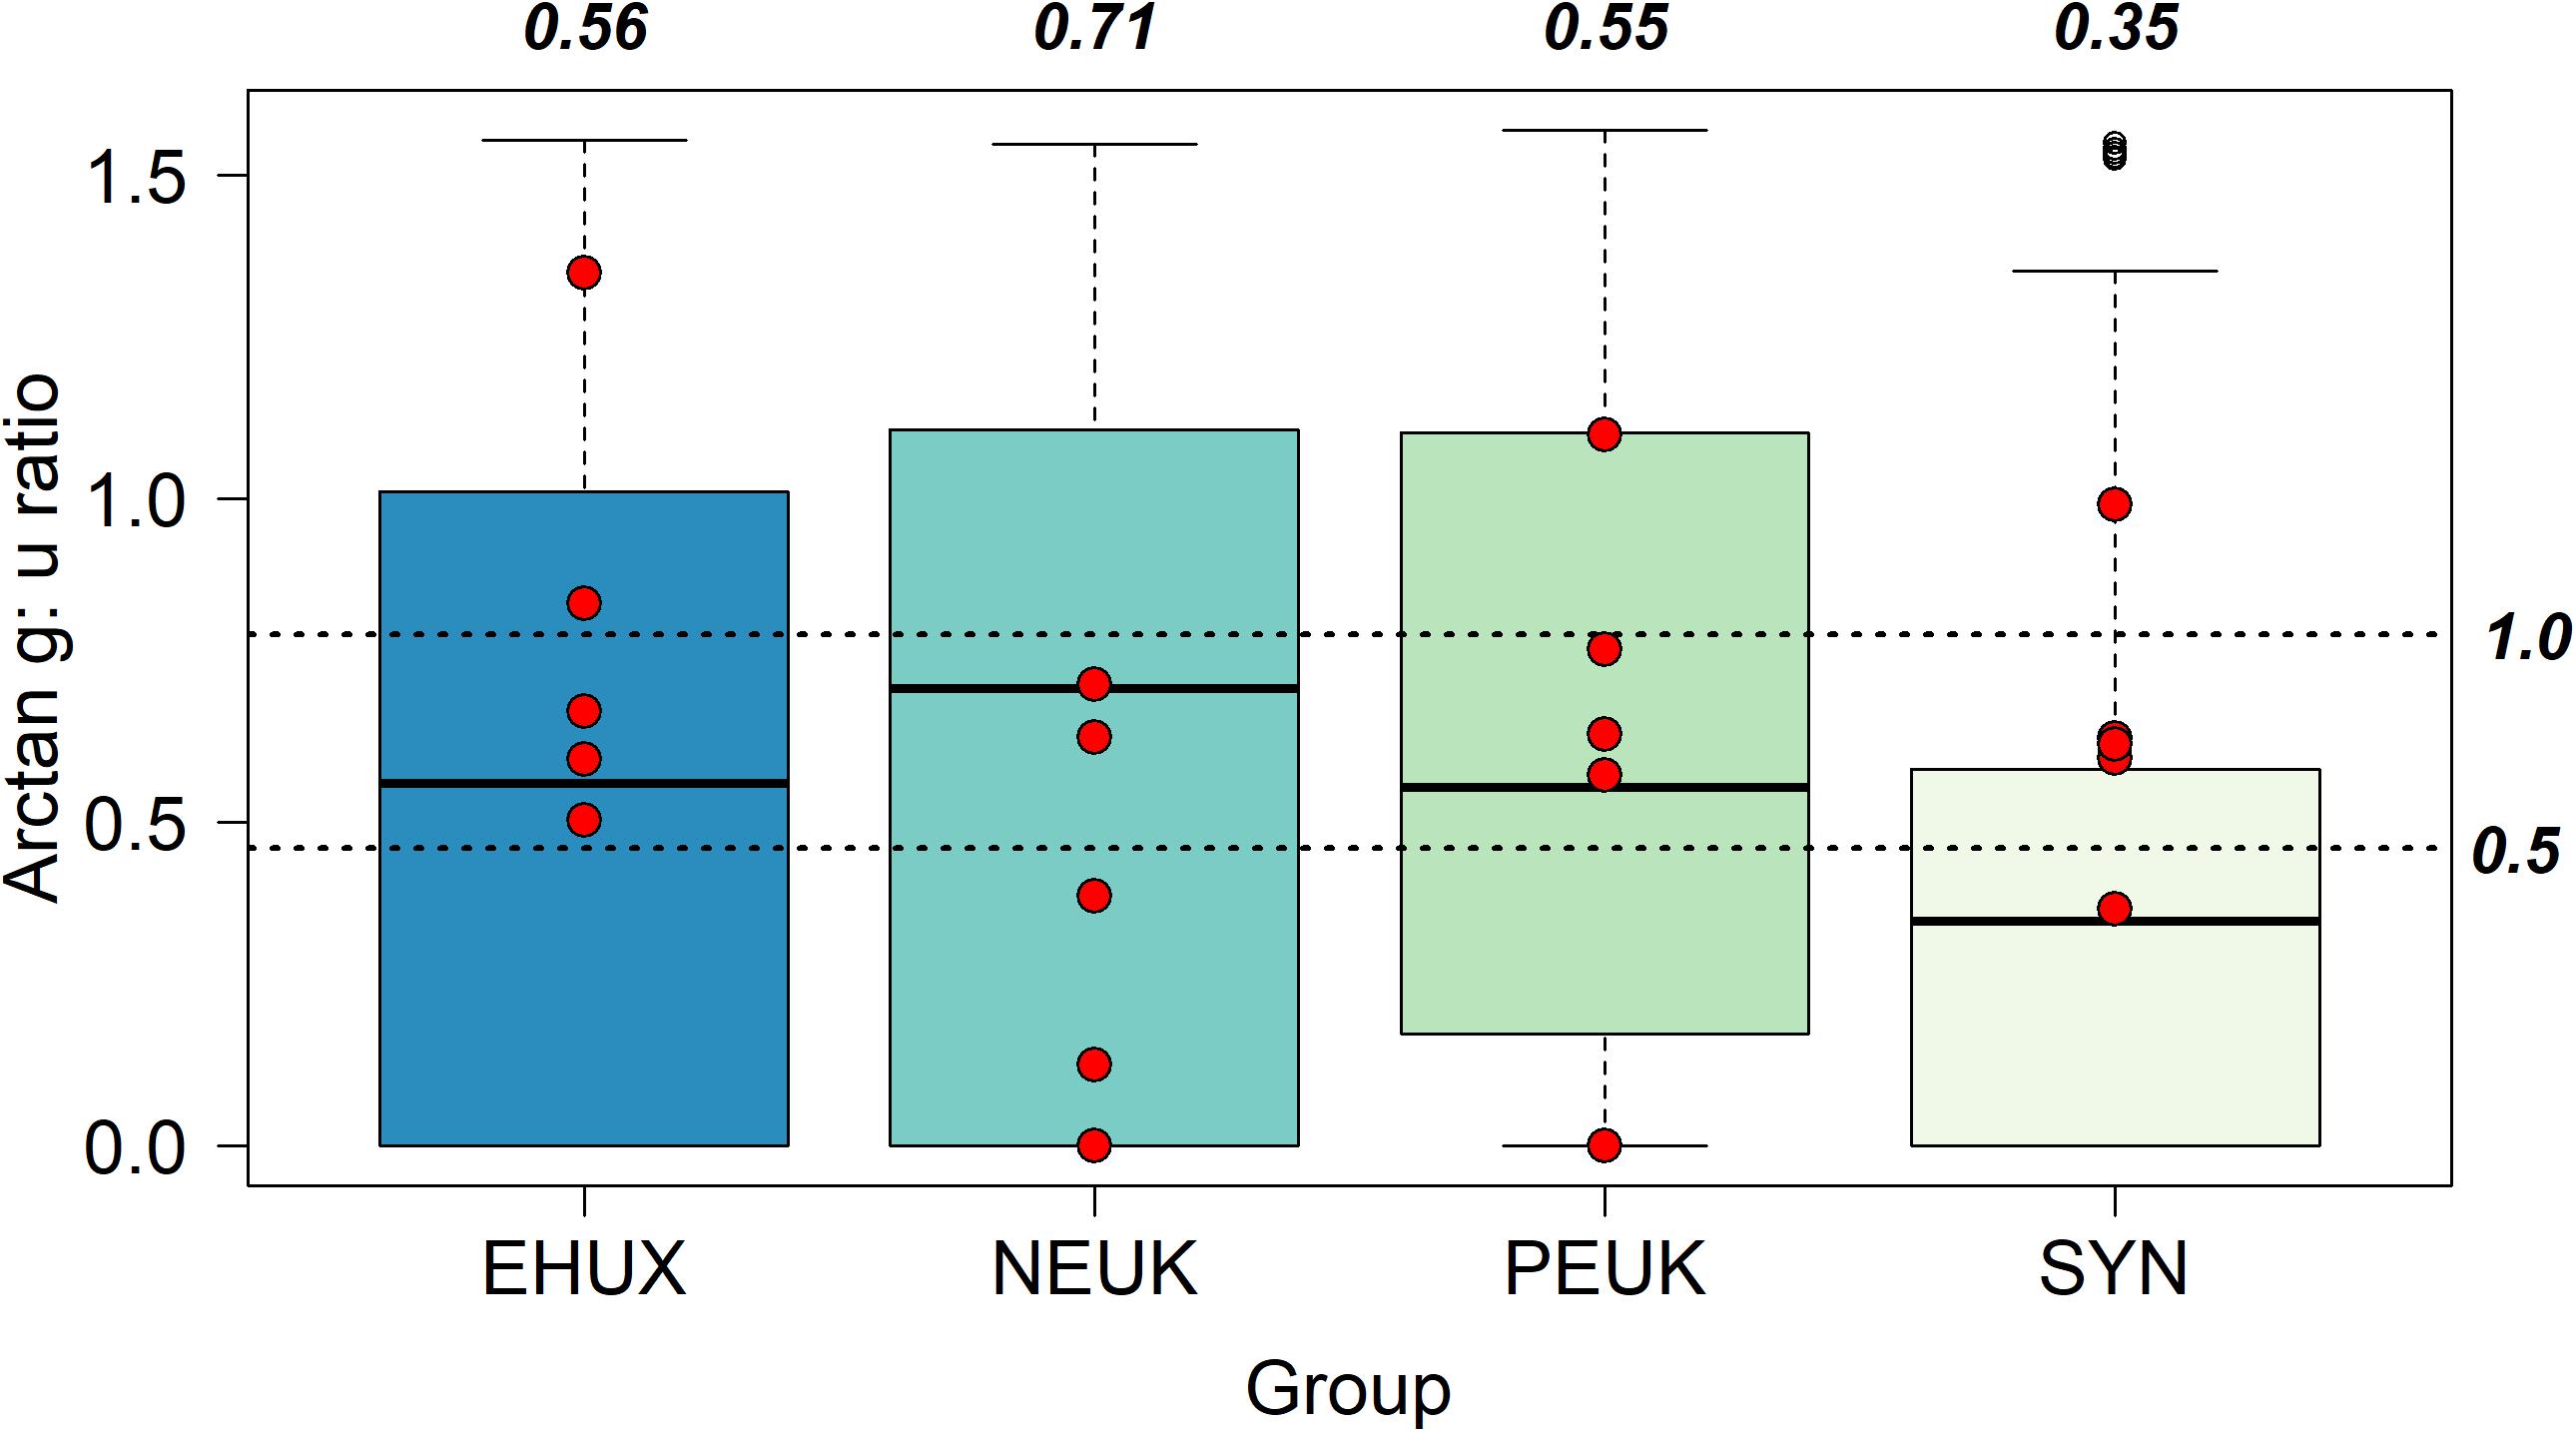
Figure 2. Box plots of arctangent grazing: growth ratios (g:μ) of different phytoplankton groups. Unfilled points represent outliers of the data set but are still included in data analysis. Dashed lines labeled as 1.0 and 0.5 represent 100 and 50% of daily growth consumed by grazers, respectively, of tangent (×) values. Bold italicized values are the median values converted back from arctangent values using the tangent (×) function. Red points are from non-mesocosm field experiments from Mayers et al. (2018) in the Celtic Sea (Northwest European Shelf).
Selective or Non-selective Grazing
In order to understand how E. huxleyi abundance may influence grazing dynamics, the proportion of E. huxleyi in the population, relative to the total number of nano- and pico-sized cells was compared to the proportion of E. huxleyi that was consumed by microzooplankton. Deviations from the 1:1 would indicate either grazing selectivity (higher proportion consumed), or grazing avoidance (smaller proportion consumed). The majority of data points fit close to the 1:1 line (Figure 3A), indicating that the consumption of E. huxleyi is directly related to its proportion within the environment. We observe a low (r2 = 0.14) but significant (p < 0.01) positive linear relationship between these two variables. Conversely, between the proportion of E. huxleyi and the proportion of nanoeukaryotes in microzooplankton diets exhibit a low (r2 = 0.24) but significant (p < 0.01) negative relationship, which suggests that when E. huxleyi dominates the community they comprise the majority of the consumption in this size group. A similar analysis for picoeukaryote and Synechococcus spp. composition of microzooplankton diets determined much weaker relationships (r2 = 0.03 and 0.09, respectively) with the proportion of E. huxleyi. For picoeukaryotes this was also observed to be non-significant (p = 0.11) (Supplementary Figure 3).
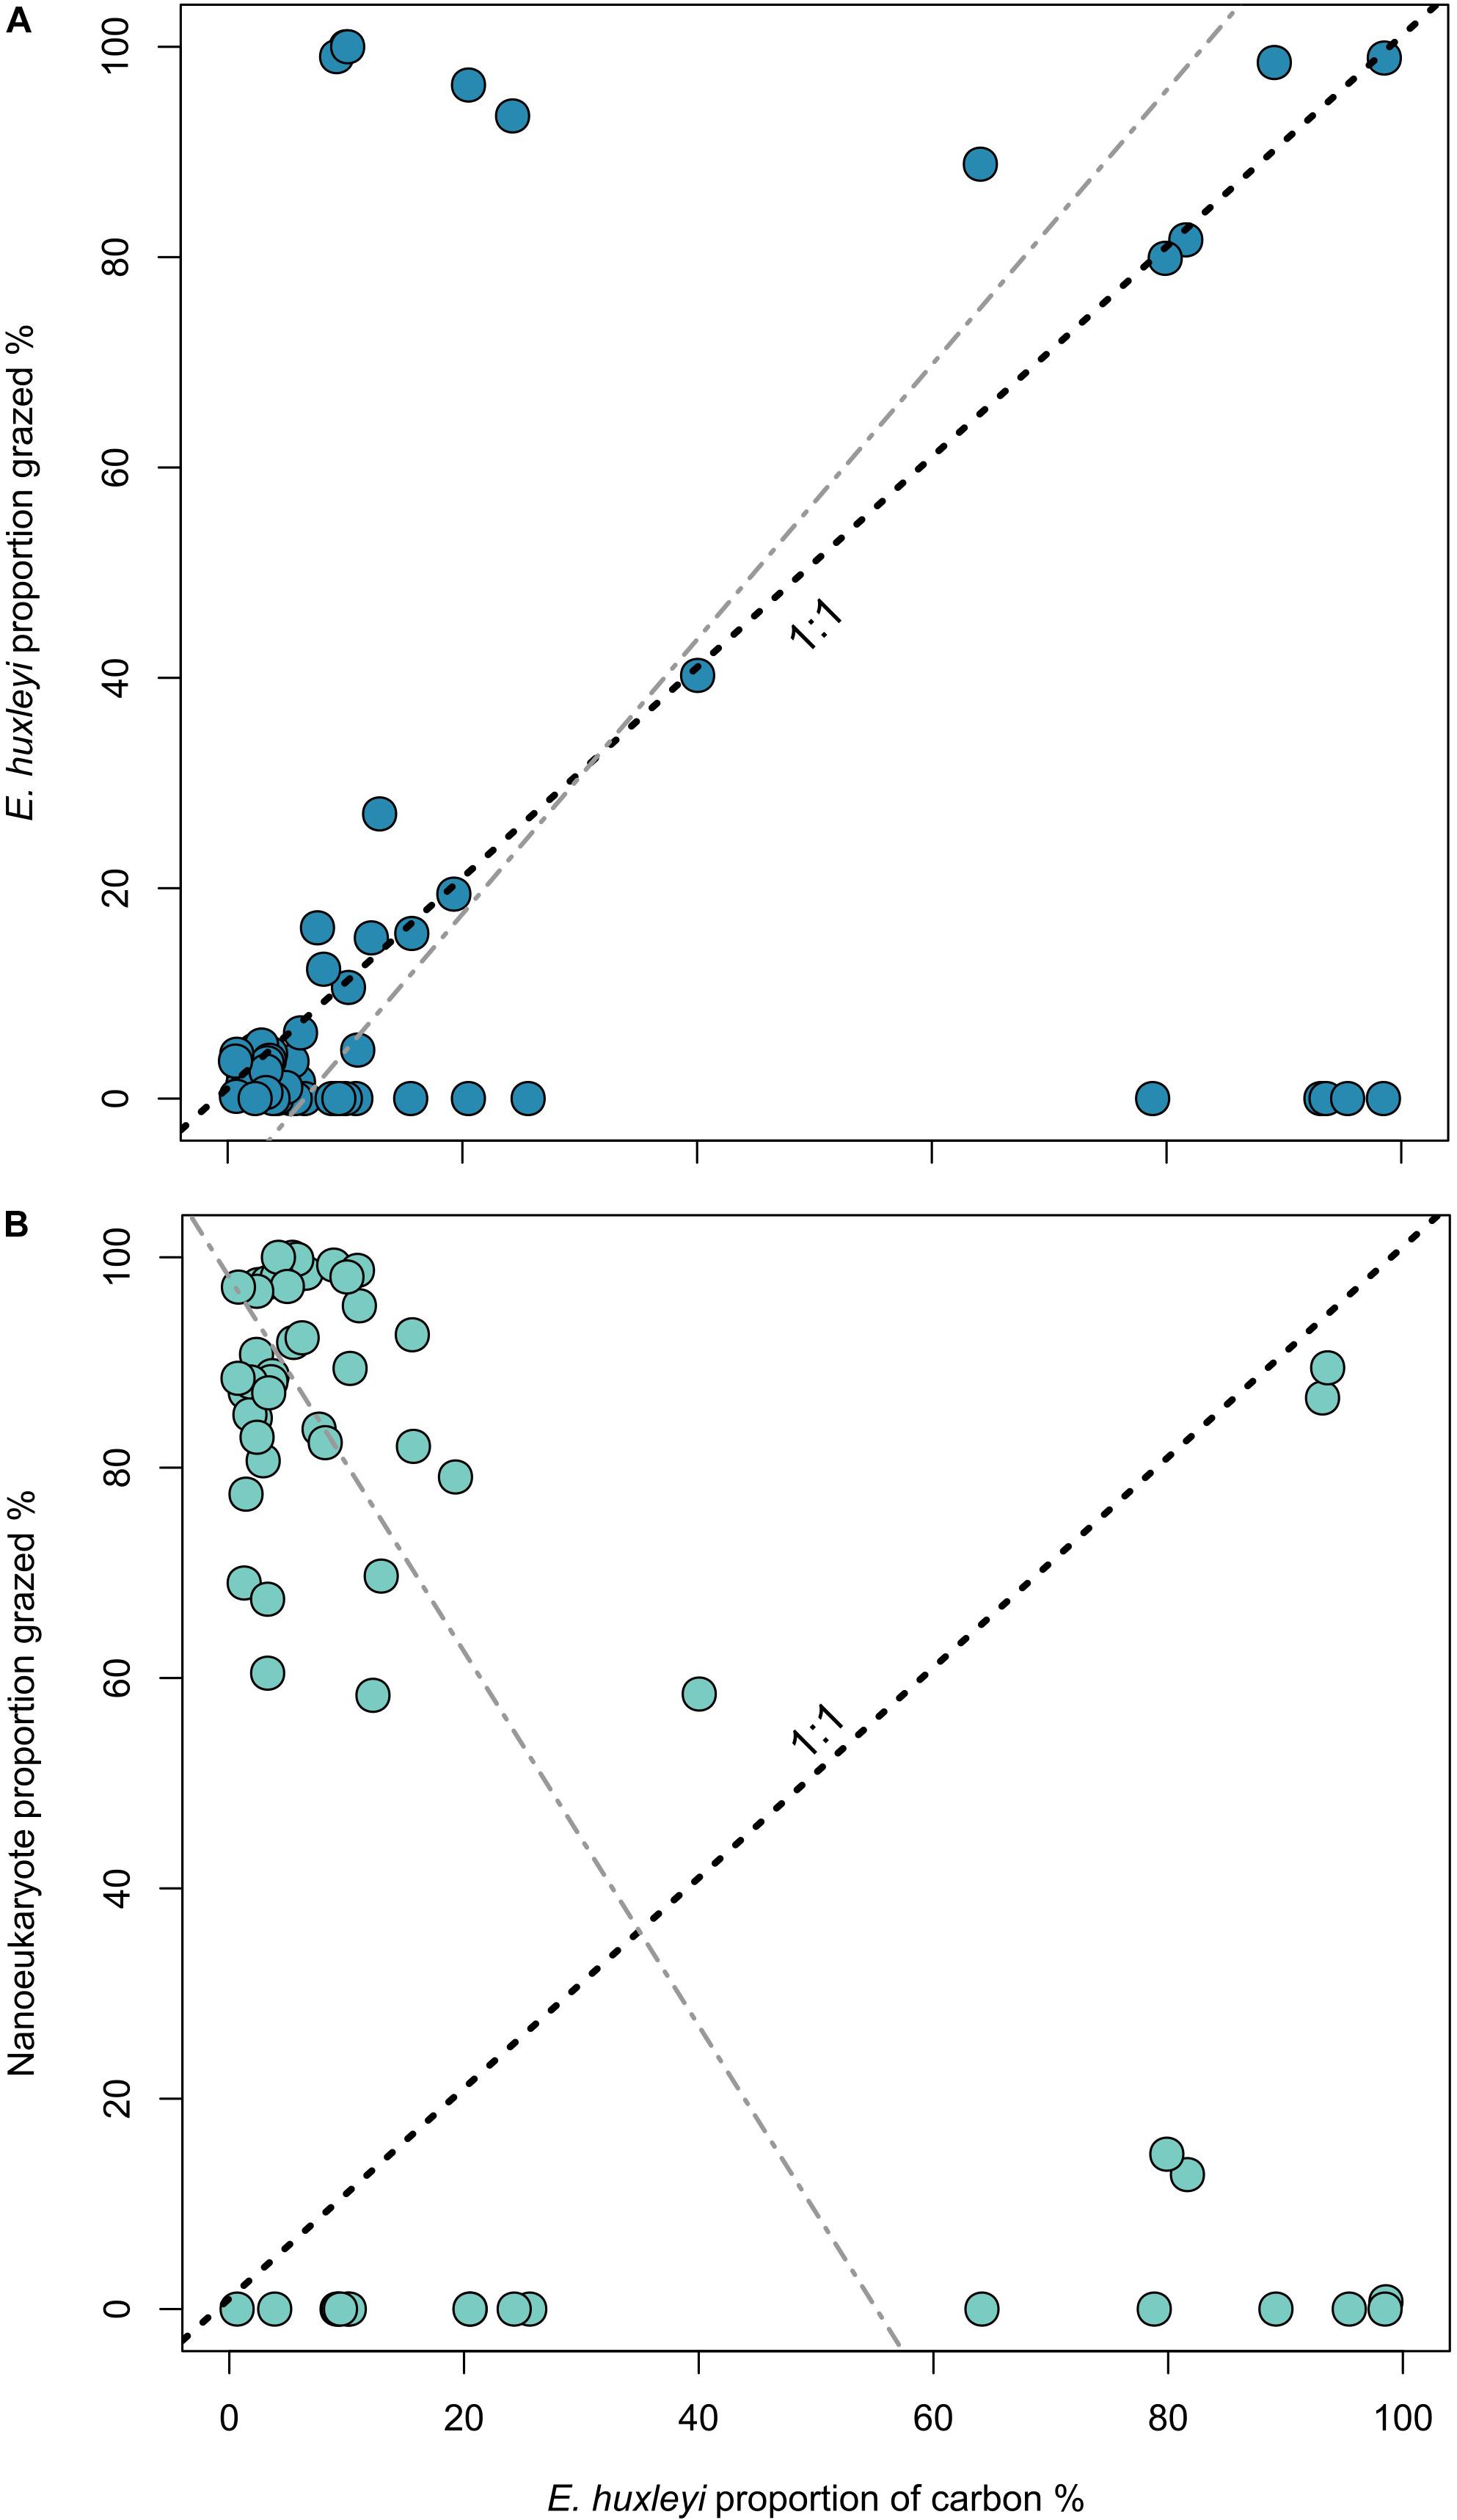
Figure 3. Proportion of E. huxleyi within the community (estimated from flow cytometry counts) against the proportion of E. huxleyi carbon consumed (A) and nanoeukaryote carbon consumed (B). Dashed line indicates the 1:1 line and gray line displays the Model II regression by reduced major axis. For (A) line equation is y = –8.57 + 1.31x, r2 = 0.14, and for (B) y = 98.09 – 1.78x, r2 = 0.24, for both p < 0.01.
Though E. huxleyi losses from microzooplankton grazing appear dependent on E. huxleyi relative abundance, there appears to be no negative affect on grazing rate when E. huxleyi abundance is high (i.e., we observe no reduced digestion). To further examine prey selection, we calculated the CM selection index α (see section “Materials and Methods”), which compares the proportion of food group grazed to the proportion of that food group observed in the environment (community). Values of α range from 0 (complete avoidance) to 1 (complete preference) with a value of 0.25 for our case (based on four potential prey groups) indicative of neutral grazing (i.e., grazing is directly proportional to relative abundance in the environment). Median values of α were highest for nanoeukaryotes (0.26 ± 0.21), similar for E. huxleyi and picoeukaryotes (0.24 ± 0.24 and 0.21 ± 0.15, respectively) and lowest for Synechococcus spp. (0.08 ± 0.08) (Figure 4). Significantly different distributions of α values were only observed between Synechococcus and all other phytoplankton groups (p < 0.001; Table 3). As median values for α were remarkably close to 0.25 for E. huxleyi, nanoeukaryotes, and picoeukaryotes, we can conclude that no preferential grazing occurred, and grazing losses were simply a function of their relative abundance in the environment. Results were not significantly different between mesocosm treatments for the selectivity index, apart from two exceptions. The first, between E. huxleyi and picoeukaryotes in ambient conditions, was only marginally significant (p = 0.05). The second, between E. huxleyi and nanoeukaryotes within high CO2 conditions (p = 0.03), which was only based on six samples, the lowest sample size in our analysis.
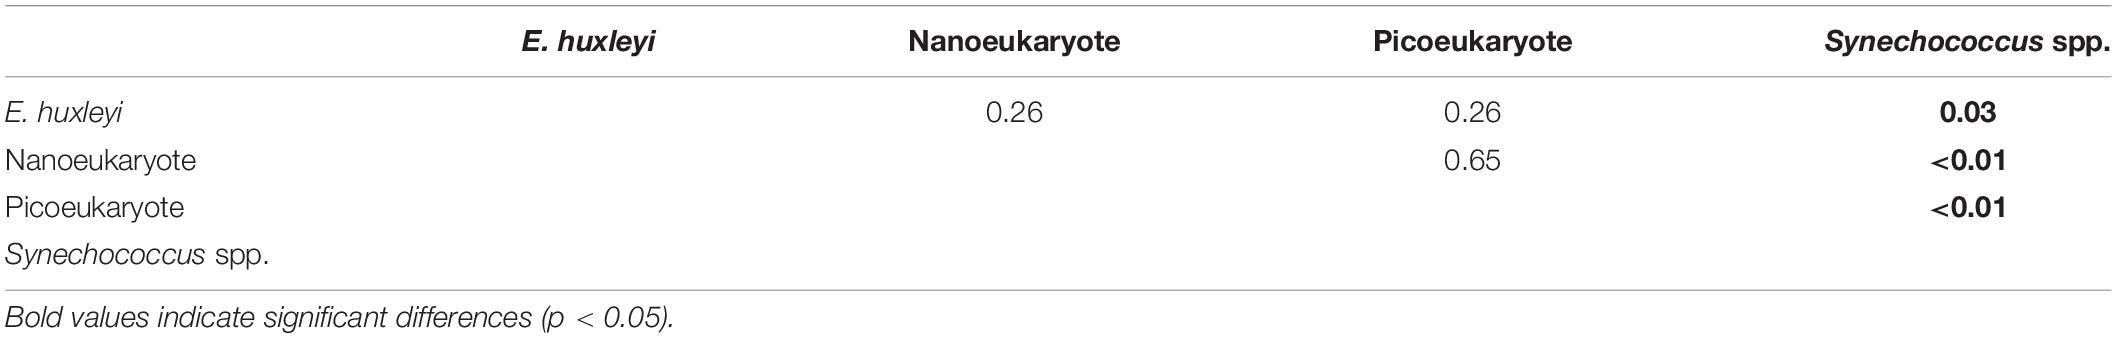
Table 3. p-values from a two-sided Kolmogorov-Smirnov test of Chesson-Manly index values between different phytoplankton groups.
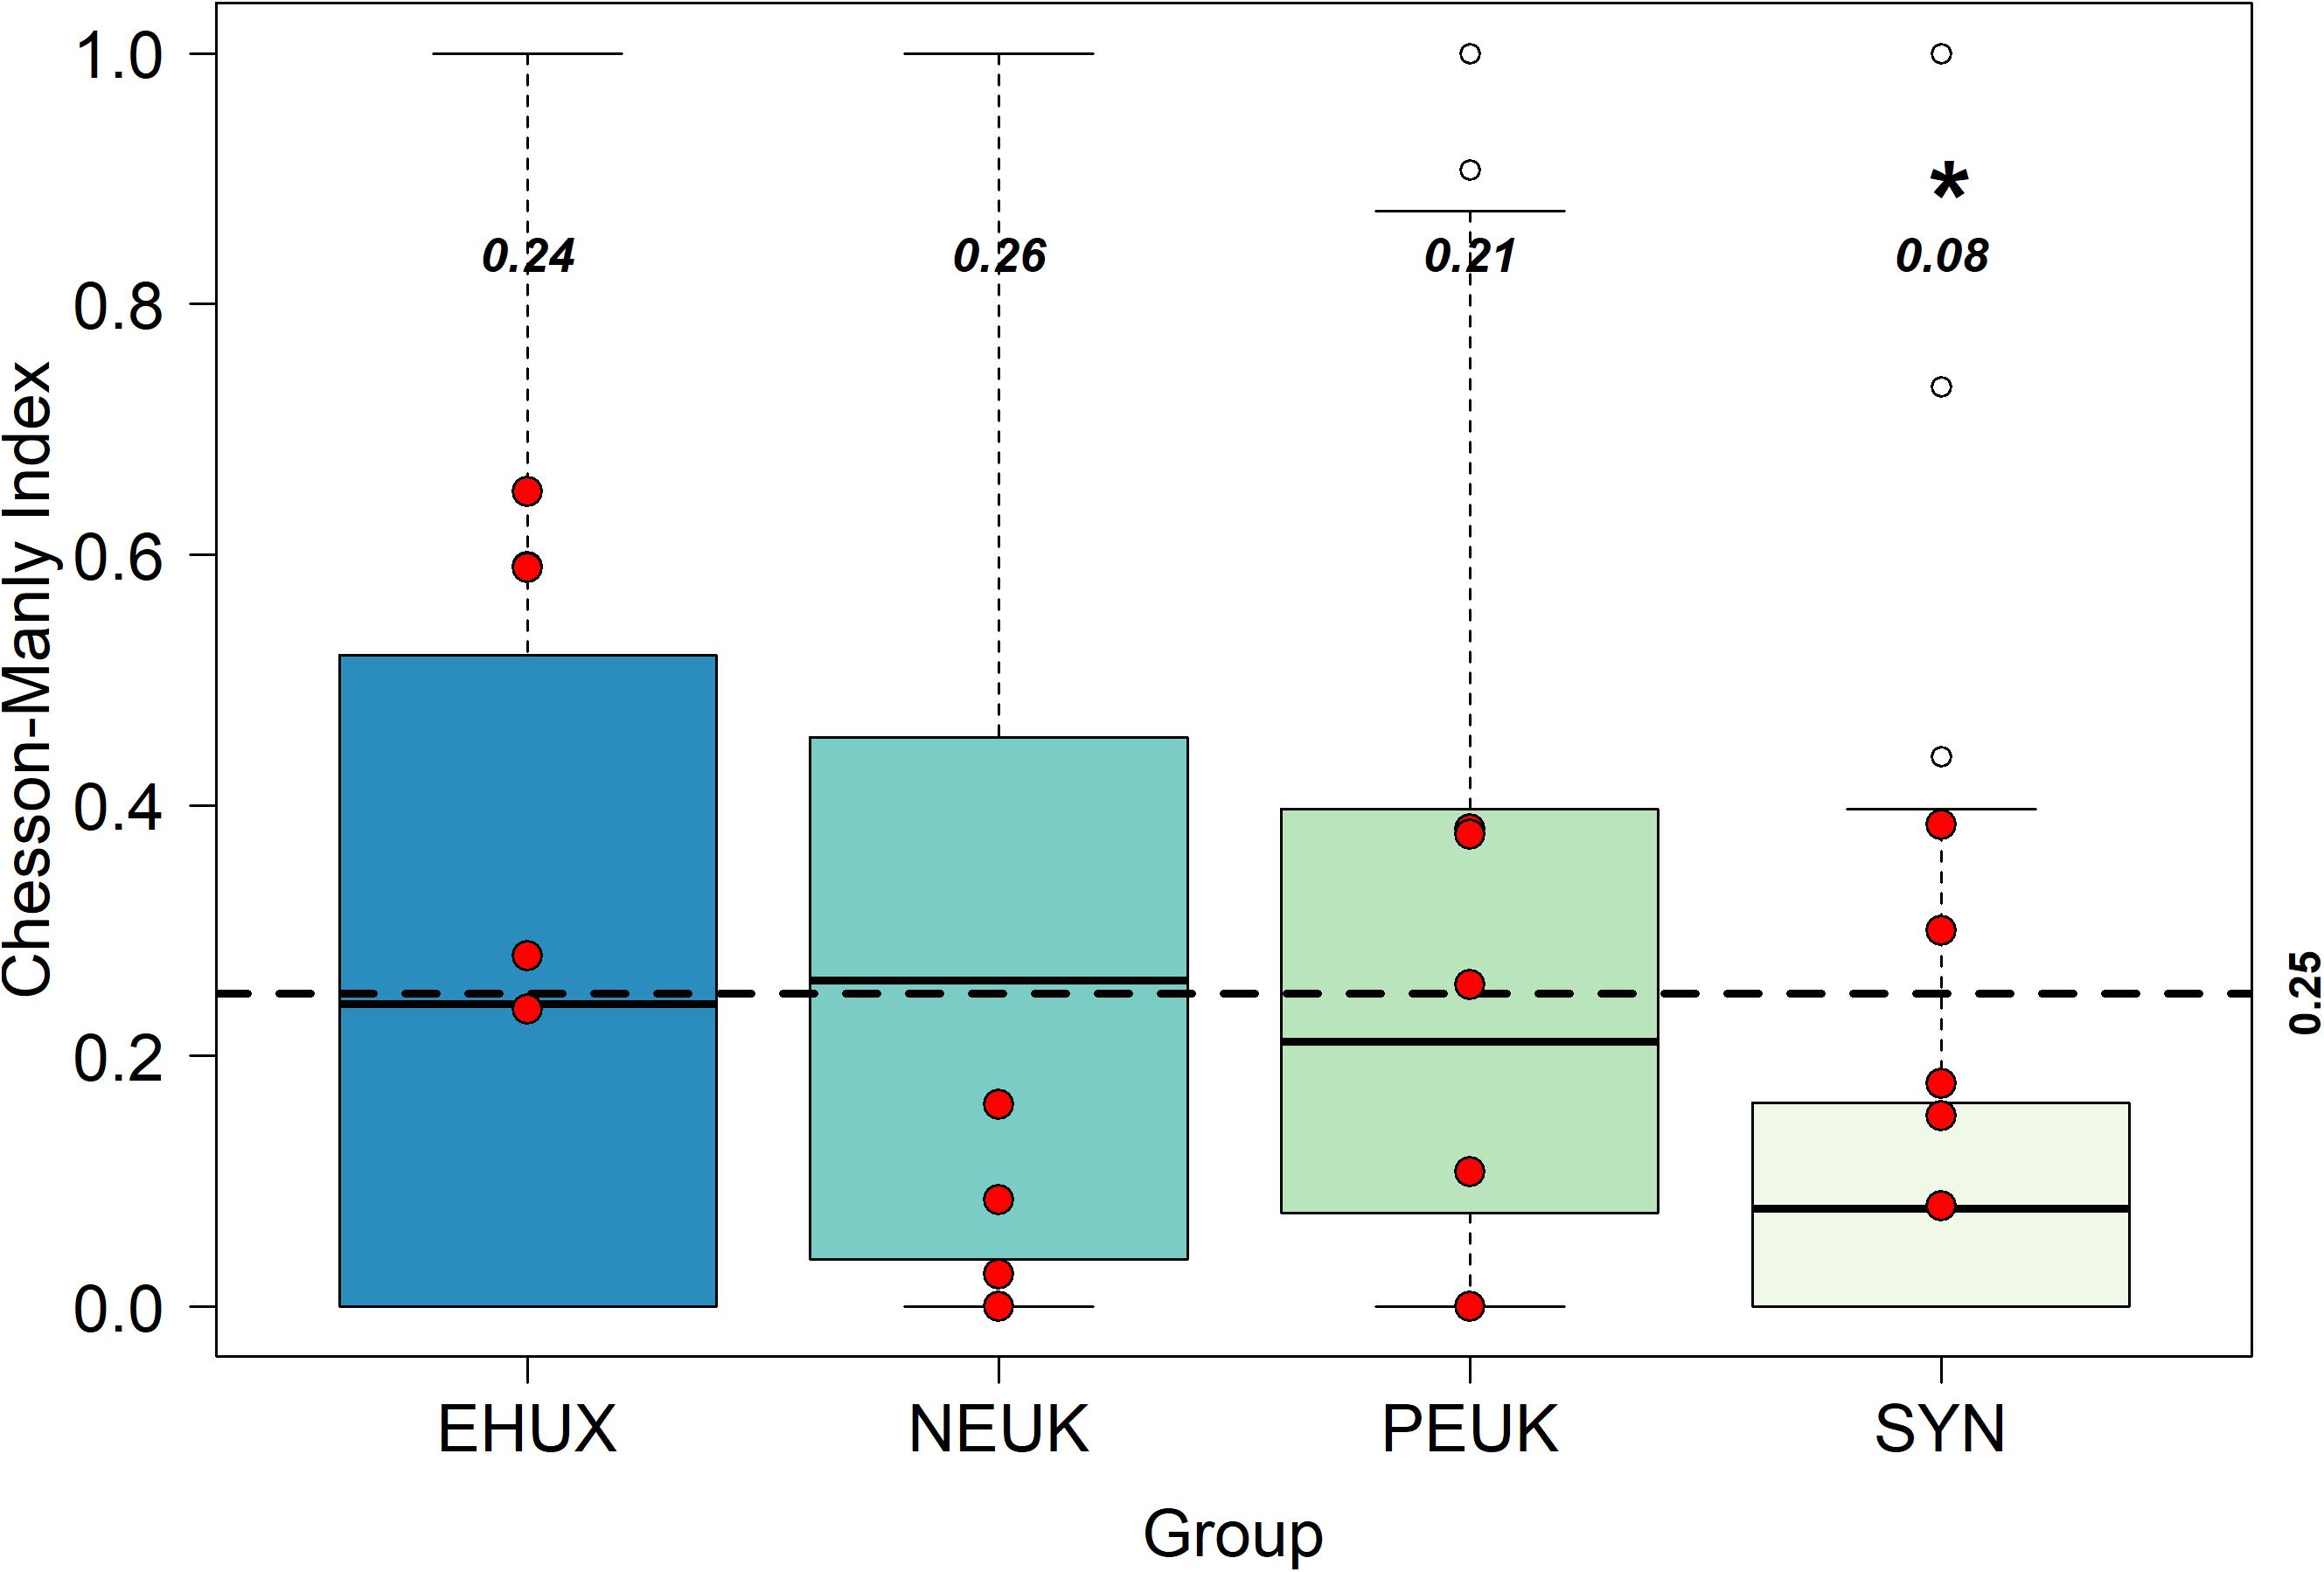
Figure 4. Box plots of the Chesson-Manly index for preferential grazing. The dashed horizontal line is the 0.25 value, which is the line of “neutral grazing preference” (Manly, 1974). Red points are field samples from Mayers et al. (2018). Unfilled data points represent outliers of the data set, values in bold italics are the median values for each phytoplankton group, * symbol indicates significantly different from E. huxleyi.
Discussion
Through consumption of phytoplankton, microzooplankton have the potential to drive shifts in plankton population dynamics as well as influence trophic cascades and nutrient cycling (Schmoker et al., 2013; Steinberg and Landry, 2017). The intensity of microzooplankton predation is based on a myriad of factors, including the ability to capture prey and prey palatability (Montagnes et al., 2008). The successful consumption of plankton is often made difficult for microzooplankton by chemical, behavioral, or morphological defenses (Tillmann, 2004). Indeed, for coccolithophores, coccoliths have been previously proposed to be such a morphological defense (Young, 1994; Jaya et al., 2016; Monteiro et al., 2016). However, the data presented here indicate that microzooplankton grazers readily consume E. huxleyi no differently than similarly sized, non-calcified pico- or nanoeukaryotes.
Similarities in the fraction of production lost to grazing among the phytoplankton groups examined, suggests that E. huxleyi presence does not decrease community-level growth or grazing rates. In fact, the CM index (α) suggests that microzooplankton grazing losses of different phytoplankton groups are a function of their abundance in the environment, with no group-specific selective grazing occurring (apart from Synechococcus). Additionally, no trends in growth rate, grazing losses, or prey selectivity based on the in situ density of E. huxleyi cells was observed, although grazer growth was not monitored in these experiments. This non-selectivity was observed irrespective of experimental condition, as the field-based dilution experiments utilized in the analyses were conducted under differential nutrient, CO2, and light conditions. In addition, these trends in grazing dynamics are observed despite the inherent variability in the composition and abundance of microzooplankton among the different mesocosm experiments sampled. Overall, these results argue against calcification and coccolith formation in E. huxleyi as protective traits against microzooplankton predation.
Strong microzooplankton control of E. huxleyi populations in the field, as evidenced by our results, brings into question the role of grazing in the formation of large-scale E. huxleyi blooms. Although community level metrics (chlorophyll-a) have estimated a reduction in grazing pressure during E. huxleyi blooms (Fileman et al., 2002; Olson and Strom, 2002), by directly enumerating E. huxleyi this effect is not observed. Additionally, it is not seen in studies using specific counting methods (Holligan et al., 1993; Mayers et al., 2018), supporting our findings that grazing is dependent on environmental abundance. Phytoplankton prey can employ a suite of predation avoidance mechanisms, such as morphological armament (e.g., coccoliths, silicified frustules and setae) or chemical-based avoidance (Kolb and Strom, 2013) that have been hypothesized to disrupt “normal” predator-prey dynamics and allow bloom formation (Irigoien et al., 2005). The data presented here suggest that coccoliths do not provide protection against ingestion, yet there are many other steps, including digestion and assimilation that are necessary for a “successful” grazing event (Montagnes et al., 2008). For example, Harvey et al. (2015) found a negative impact on microzooplankton growth upon consumption of calcified E. huxleyi, which would ultimately result in a decrease in grazing and an increase in E. huxleyi population growth. Further, E. huxleyi has a high level of genetic plasticity (Read et al., 2013), with variability in cell CaCO3 quotas having bloom-level impacts (Poulton et al., 2013), and strain-specificity in grazing interactions (Harvey et al., 2015; Strom et al., 2017). Therefore, we cannot discount that coccoliths may provide a protective function during grazing interactions outside of ingestion or that grazer selectivity against particular E. huxleyi strains or morphotypes (or ecotypes) could occur in the natural environment. Grazing selectivity at other points of the grazing interaction process could result in the suppression of microzooplankton growth, potentially aiding in the success of E. huxleyi bloom formation through reduced grazing pressure. However, we find no evidence of this supression in the data considered here or within field samples during a spring bloom in the Celtic Sea (Mayers et al., 2018).
Microzooplankton are not the only mortality factor of photosynthesizing plankton, larger mesozooplankton (e.g., copepods) can also exert strong grazing control on plankton populations, including microzooplankton. Previous experiments and field observations have demonstrated that copepods will ingest E. huxleyi cells and defecate coccolith-rich fecal material, though whether this is density-dependent, selective, non-selective, or has any negative influence on copepod physiology is unclear (Sikes and Wilbur, 1982; Harris, 1994; Nejstgaard et al., 1997, 2008). In our experiments, mesozooplankton were deliberately excluded in order to capture grazing pressure only from the microzooplankton. Previous mesocosm experiments with copepod addition have observed increases in photosynthetic nanoflagellate biomass (Zöllner et al., 2009; Pree et al., 2016), which may have included E. huxleyi (though they were not enumerated in these studies). This growth implies that mesozooplankton may actually release E. huxleyi populations from microzooplankton predation control.
The large E. huxleyi virus (EhV) is also an important mortality factor for E. huxleyi (e.g., Wilson et al., 2002). Strains with decreased calcification displayed higher rates of infection, even though highly calcified cells may have higher virus absorption coefficients (Johns et al., 2019), providing evidence that coccoliths may act to reduce virus-host interactions. Infected E. huxleyi cells in culture have been observed to be grazed preferentially compared with non-infected cells (Evans and Wilson, 2008). Thus, even if coccoliths do not protect against direct predation, overall E. huxleyi success is governed by a myriad of interactive mortality factors that either promote or suppress bloom formation.
Given no grazing selectivity against calcified cell ingestion, the fate of CaCO3 produced by E. huxleyi and then grazed by microzooplankton is currently unclear. The gut pH of microzooplankton food vacuoles is assumed to be ∼ 3 to 5 pH units in order to ensure enzymes associated with digestion work optimally (Nagata and Kirchman, 1992; Gonzalez et al., 1993). When the food vacuole pH is not buffered by high CaCO3 concentrations, microzooplankton grazing may drive a high proportion of CaCO3 production being dissolved within microzooplankton food vacuoles in the surface ocean. Previous studies highlighting relatively rapid (3–18 days) turnover of upper ocean CaCO3 stocks, both regionally (Balch et al., 1992; Poulton et al., 2006, 2007, 2013), and globally (Balch et al., 2005, 2007; Hopkins et al., 2019), as well as regional comparisons of CaCO3 production and export (Thomalla et al., 2008), are all supportive of this hypothesis. However, there is also evidence which suggests that grazer digestion would be influenced by a high influx of CaCO3. White et al. (2018) found that the gut of a copepod becomes increasingly buffered upon ingestion of E. huxleyi, limiting dissolution, though, it has not been established if similar dynamics occur for microzooplankton. Further investigation into the biogeochemical ramifications of CaCO3 ingestion and digestion by microzooplankton is necessary to allow better parameterization of models of oceanic carbon fluxes.
The question of why coccolithophores calcify continues to be of ecological and evolutionary importance and interest. Monteiro et al. (2016) suggest that up to 40% of the photosynthetic energy budget in coccolithophore cells is required to support cellular calcification and coccolith extrusion, which is a significant metabolic cost for a unicellular organism for which we cannot easily identify the benefit. Further, it was suggested that the benefits of calcification may vary regionally (Monteiro et al., 2016), complicating the process of identifying the mechanisms driving this process. Yet, despite this complexity, the results presented here demonstrate that microzooplankton grazing losses for E. huxleyi are not significantly different from similar-sized, but non-calcified plankton. Hence, calcification and coccolith formation within natural mixed communities does not appear to be a direct adaptive trait to deter microzooplankton ingesting E. huxleyi. However, our findings are specific to the bloom-forming coccolithophore E. huxleyi. Adaptive benefits of calcification can be species specific (Müller, 2019), and our results may thus not translate to other coccolithophore species. The inability of microzooplankton to discriminate against calcified cells provides a significant piece in the mechanistic framework for understanding coccolithophore bloom formation and persistence, the cycling of CaCO3 in the ocean, and the evolution of coccoliths.
Data Availability Statement
The raw data supporting the conclusions of this article are included in the article/Supplementary Material and will be made available by the authors, without undue reservation.
Author Contributions
KM, KB, KT, BS, SG, SW, GT, UR, AL, AV, and EH assisted with the set-up of mesocosm experiments and conducting dilution experiments in 2016, 2017, and 2018. KM, AP, DM, and EH were responsible for the design of the manuscript and the data analysis. All authors contributed toward the writing of the manuscript.
Funding
Mesocosm experiments in 2015 were supported by the Kiel Excellence Cluster “The Future Ocean” (CP1540) and the Leibniz Award to UR, in 2017 the MESOHUX experiment was supported by NSF (OCE-1559179) to KT and KB, NSF (OCE-1537951 and OCE-1459200) to KB, NSF (OCE-1459190, 1657808, and DBI-1624593) to EH, and in 2018 by AQUACOSM (EU H2020-INFRAIA-project No 731065). KM was supported by a NERC Doctoral Training Partnership (DTP) studentship as part of the Southampton Partnership for Innovative Training of Future Investigators Researching the Environment (SPITFIRE, grant number NE/L002531/1) and Research Council of Norway project (#280414) MIXsTRUCT.
Conflict of Interest
The authors declare that the research was conducted in the absence of any commercial or financial relationships that could be construed as a potential conflict of interest.
Acknowledgments
We thank the coordinator and staff of the Espegrend Marine Biological Station, in particular Jorun Egge, Tomas Sørlie, and Mette Hordnes. We also thank Sean Anderson, Thais Bittar, Patrick Duffy, and Karrie Bulski and the MESOHUX 2017 field crew for mesocosm set-up and assistance with dilution experiments. We also thank the two reviewers for their comments in improving this manuscript. The content of this manuscript has been published in part, as part of the thesis of Mayers (2019).
Supplementary Material
The Supplementary Material for this article can be found online at: https://www.frontiersin.org/articles/10.3389/fmars.2020.569896/full#supplementary-material
References
Bach, L. T., Larsen, A., Hildebrandt, N., Schulz, K. G., and Riebesell, U. (2016). Influence of plankton community structure on the sinking velocity of marine aggregates. Glob. Biogeochem. Cycles 30, 1145–1165. doi: 10.1002/2015GB005324
Balch, W., Drapeau, D., Bowler, B., and Booth, E. (2007). Prediction of pelagic calcification rates using satellite measurements. Deep Res. Part II 54, 478–495. doi: 10.1016/j.dsr2.2006.12.006
Balch, W. M. (2018). The ecology, biogeochemistry, and optical properties of Coccolithophores. Ann. Rev. Mar. Sci. 10, 71–98. doi: 10.1146/annurev-marine-121916-063319
Balch, W. M., Gordon, H. R., Bowler, B. C., Drapeau, D. T., and Booth, E. S. (2005). Calcium carbonate measurements in the surface global ocean based on moderate-resolution imaging Spectroradiometer data. J. Geophys. Res. C Ocean 110, 1–21. doi: 10.1029/2004JC002560
Balch, W. M., Holligan, P. M., and Kilpatrick, K. A. (1992). Calcification, photosynthesis and growth of the bloom-forming coccolithophore, Emiliania huxleyi. Cont. Shelf Res. 12, 1353–1374. doi: 10.1016/0278-4343(92)90059-s
Berelson, W. M., Balch, W. M., Najjar, R., Feely, R. A., Sabine, C., and Lee, K. (2007). Relating estimates of CaCO3 production, export, and dissolution in the water column to measurements of CaCO3 rain into sediment traps and dissolution on the sea floor: a revised global carbonate budget. Glob. Biogeochem. Cycles 21, 1–15. doi: 10.1029/2006GB002803
Broecker, W., and Clark, E. (2009). Ratio of coccolith CaCO3 to foraminifera CaCO3 in late Holocene deep sea sediments. Paleoceanography 24, 1–11. doi: 10.1029/2009PA001731
Calbet, A., and Landry, M. R. (2004). Phytoplankton growth, microzooplankton grazing, and carbon cycling in marine systems. Limnol. Oceanogr. 49, 51–57. doi: 10.4319/lo.2004.49.1.0051
Calbet, A., and Saiz, E. (2013). Effects of trophic cascades in dilution grazing experiments: from artificial saturated feeding responses to positive slopes. J. Plankton Res. 35, 1183–1191. doi: 10.1093/plankt/fbt067
Castberg, T., Larsen, A., Sandaa, R., Brussaard, C., Egge, J., Heldal, M., et al. (2001). Microbial population dynamics and diversity during a bloom of the marine coccolithophorid Emiliania huxleyi (Haptophyta). Mar. Ecol. Progr. Ser. 221, 39–46. doi: 10.3354/meps221039
Chesson, J. (1978). Measuring preference in the selective predation. Ecology 59, 211–215. doi: 10.2307/1936364
Chesson, J. (1983). The estimation and analysis of preference and its relationship to foraging models. Ecology 64, 1297–1304. doi: 10.2307/1937838
Dörner, I., Hauss, H., Aberle, N., Lohbeck, K., Spisla, C., Riebesell, U., et al. (2020). Ocean acidification impacts on biomass and fatty acid composition of a post-bloom marine plankton community. Mar. Ecol. Progr. Ser. 647, 49–64. doi: 10.3354/meps13390
Evans, C., and Wilson, W. H. (2008). Preferential grazing of Oxyrrhis marina on virus-infected Emiliania huxleyi. Limnol. Oceanogr. 53, 2035–2040. doi: 10.4319/lo.2008.53.5.2035
Fileman, E. S., Cummings, D. G., and Llewellyn, C. A. (2002). Microplankton community structure and the impact of microzooplankton grazing during an Emiliania huxleyi bloom, off the Devon coast. J. Mar. Biol. Assoc. UK 82, 359–368. doi: 10.1017/S0025315402005593
Gonzalez, J. M., Sherr, B. F., and Sherr, E. B. (1993). Digestive enzyme activity as a quantitative measure of protistan grazing: the acid lysozyme assay for bacterivory. Mar. Ecol. Prog. Ser. 100, 197–206. doi: 10.3354/meps100197
Hansen, F. C., Witte, H. J., and Passarge, J. (1996). Grazing in the heterotrophic dinoflagellate Oxyrrhis marina: size selectivity and preference for calcified Emiliania huxleyi cells. Aquat. Microb. Ecol. 10, 307–313. doi: 10.3354/ame010307
Harris, R. P. (1994). Zooplankton grazing on the coccolithophore Emiliania huxleyi and its role in inorganic carbon flux. Mar. Biol. 119, 431–439. doi: 10.1007/BF00347540
Harvey, E. L., Bidle, K. D., and Johnson, M. D. (2015). Consequences of strain variability and calcification in Emiliania huxleyi on microzooplankton grazing. J. Plankton Res. 37, 1137–1148. doi: 10.1093/plankt/fbv081
Holligan, P. M., Fernández, E., Aiken, J., Balch, W. M., Boyd, P., Burkill, P. H., et al. (1993). A biogeochemical study of the coccolithophore, Emiliania huxleyi, in the North Atlantic. Glob. Biogeochem. Cycles 7, 879–900. doi: 10.1029/93GB01731
Hopkins, J., Henson, S. A., Poulton, A. J., and Balch, W. M. (2019). Regional characteristics of the temporal variability in the global particulate inorganic carbon inventory. Glob. Biogeochem. Cycles 33, 1328–1338. doi: 10.1029/2019GB006300
Irigoien, X., Flynn, K. J., and Harris, R. P. (2005). Phytoplankton blooms: a “loophole” in microzooplankton grazing impact? J. Plankton Res. 27, 313–321. doi: 10.1093/plankt/fbi011
Jaya, B. N., Hoffmann, R., Kirchlechner, C., Dehm, G., Scheu, C., and Langer, G. (2016). Coccospheres confer mechanical protection: new evidence for an old hypothesis. Acta Biomater. 42, 258–264. doi: 10.1016/j.actbio.2016.07.036
Johns, C. T., Grubb, A. R., Nissimov, J. I., Natale, F., Knapp, V., Mui, A., et al. (2019). The mutual interplay between calcification and Coccolithovirus infection. Environ. Microbiol. 21, 1896–1915. doi: 10.1111/1462-2920.14362
Kolb, A., and Strom, S. (2013). An inducible antipredatory defense in haploid cells of the marine microalga Emiliania huxleyi (Prymnesiophyceae). Limnol. Oceanogr. 58, 932–944. doi: 10.4319/lo.2013.58.3.0932
Landry, M. R., and Hassett, R. P. (1982). Estimating the grazing impact of marine micro-zooplankton. Mar. Biol. 67, 283–288. doi: 10.1007/BF00397668
Landry, M. R., Kirshtein, J., and Constantinou, J. (1995). A refined dilution technique for measuring the community grazing impact of microzooplankton, with experimental tests in the central equatorial Pacific. Mar. Ecol. Prog. Ser. 120, 53–63. doi: 10.3354/meps120053
Löder, M. G. J., Meunier, C., Wiltshire, K. H., Boersma, M., and Aberle, N. (2011). The role of ciliates, heterotrophic dinoflagellates and copepods in structuring spring plankton communities at Helgoland Roads, North Sea. Mar. Biol. 158, 1551–1580. doi: 10.1007/s00227-011-1670-2
Manly, B. F. J. (1974). A model for certain types of selection experiments. Biometrics 30, 281–294. doi: 10.2307/2529649
Mayers, K. M. J. (2019). Probing Rates of Growth and Mortality Within Natural Coccolithophore Populations Doctoral thesis, University of Southampton, Southampton.
Mayers, K. M. J., Poulton, A. J., Daniels, C. J., Wells, S. R., Woodward, E. M. S., Tarran, G. A., et al. (2018). Growth and mortality of coccolithophores during spring in a temperate Shelf Sea (Celtic Sea, April 2015). Prog. Oceanogr. 177:24. doi: 10.1016/j.pocean.2018.02.024
Montagnes, D. J. S., Barbosa, A. B., Boenigk, J., Davidson, K., Jürgens, K., Macek, M., et al. (2008). Selective feeding behaviour of key free-living protists: avenues for continued study. Aquat. Microb. Ecol. 53, 83–98. doi: 10.3354/ame01229
Monteiro, F. M., Bach, L. T., Brownlee, C., Bown, P., Rickaby, R. E. M., Poulton, A. J., et al. (2016). Why marine phytoplankton calcify. Sci. Adv. 2, 1–14. doi: 10.1126/sciadv.1501822
Morison, F., and Menden-Deuer, S. (2015). Early spring phytoplankton dynamics in the subpolar north Atlantic: the influence of protistan herbivory. Limnol. Oceanogr. 60, 1298–1313. doi: 10.1002/lno.10099
Morison, F., and Menden-Deuer, S. (2017). Doing more with less? Balancing sampling resolution and effort in measurements of protistan growth and grazing rates. Limnol. Oceanogr. Methods 15, 794–809. doi: 10.1002/lom3.10200
Müller, M. N. (2019). On the genesis and function of Coccolithophore calcification. Front. Mar. Sci. 6:49. doi: 10.3389/fmars.2019.00049
Müller, M. N., Ramos, J. B., Schulz, K. G., Riebesell, U., Kaźmierczak, J., Gallo, F., et al. (2015). Phytoplankton calcification as an effective mechanism to alleviate cellular calcium poisoning. Biogeosciences 12, 6493–6501. doi: 10.5194/bg-12-6493-2015
Nagata, T., and Kirchman, D. L. (1992). Release of macromolecular organic complexes by heterotrophic marine flagellates. Mar. Ecol. Prog. Ser. 83, 233–240. doi: 10.3354/meps083233
Nejstgaard, J. C., Frischer, M. E., Simonelli, P., Troedsson, C., Brakel, M., Adiyaman, F., et al. (2008). Quantitative PCR to estimate copepod feeding. Mar. Biol. 153, 565–577. doi: 10.1007/s00227-007-0830-x
Nejstgaard, J. C., Gismervik, I., and Solberg, P. T. (1997). Feeding and reproduction by Calanus finmarchicus, and microzooplankton grazing during mesocosm blooms of diatoms and the coccolithophore Emiliania huxleyi. Mar. Ecol. Prog. Ser. 147, 197–217. doi: 10.3354/meps147197
Olson, M. B., and Strom, S. L. (2002). Phytoplankton growth, microzooplankton herbivory and community structure in the southeast Bering Sea: insight into the formation and temporal persistence of an Emiliania huxleyi bloom. Deep. Res. Part II 49, 5969–5990. doi: 10.1016/S0967-0645(02)00329-6
Poulton, A. J., Adey, T. R., Balch, W. M., and Holligan, P. M. (2007). Relating coccolithophore calcification rates to phytoplankton community dynamics: regional differences and implications for carbon export. Deep Sea Res. Part II 54, 538–557. doi: 10.1016/j.dsr2.2006.12.003
Poulton, A. J., Charalampopoulou, A., Young, J. R., Tarran, G. A., Lucas, M. I., and Quartly, G. D. (2010). Coccolithophore dynamics in non-bloom conditions during late summer in the central Iceland Basin (July-August 2007). Limnol. Oceanogr. 55, 1601–1613. doi: 10.4319/lo.2010.55.4.1601
Poulton, A. J., Painter, S. C., Young, J. R., Bates, N. R., Bowler, B., Drapeau, D., et al. (2013). The 2008 Emiliania huxleyi bloom along the patagonian shelf: ecology, biogeochemistry, and cellular calcification. Glob. Biogeochem. Cycles 27, 1023–1033. doi: 10.1002/2013GB004641
Poulton, A. J., Sanders, R., Holligan, P. M., Stinchcombe, M. C., Adey, T. R., Brown, L., et al. (2006). Phytoplankton mineralization in the tropical and subtropical Atlantic Ocean. Glob. Biogeochem. Cycles 20, 1–10. doi: 10.1029/2006GB002712
Poulton, A. J., Stinchcombe, M. C., Achterberg, E. P., Bakker, D. C. E., Dumousseaud, C., Lawson, H. E., et al. (2014). Coccolithophores on the north-west European shelf: calcification rates and environmental controls. Biogeosciences 11, 3919–3940. doi: 10.5194/bg-11-3919-2014
Pree, B., Larsen, A., Egge, J. K., Simonelli, P., Madhusoodhanan, R., Tsagaraki, T. M., et al. (2016). Dampened copepod-mediated trophic cascades in a microzooplankton-dominated microbial food web: a mesocosm study. Limnol. Oceanogr. 62, 1031–1044. doi: 10.1002/lno.10483
Read, B. A., Kegel, J., Klute, M. J., Kuo, A., Lefebvre, S. C., Maumus, F., et al. (2013). Pan genome of the phytoplankton Emiliania underpins its global distribution. Nature 499, 209–213. doi: 10.1038/nature12221
Riebesell, U., Gattuso, J. P., Thingstad, T. F., and Middelburg, J. J. (2013). Arctic ocean acidification: pelagic ecosystem and biogeochemical responses during a mesocosm study. Biogeosciences 10, 5619–5626. doi: 10.5194/bg-10-5619-2013
Schmoker, C., Hernandez-Leon, S., and Calbet, A. (2013). Microzooplankton grazing in the oceans: impacts, data variability, knowledge gaps and future directions. J. Plankton Res. 35, 691–706. doi: 10.1093/plankt/fbt023
Shutler, J. D., Land, P. E., Brown, C. W., Findlay, H. S., Donlon, C. J., Medland, M., et al. (2013). Coccolithophore surface distributions in the North Atlantic and their modulation of the air-sea flux of CO2 from 10 years of satellite Earth observation data. Biogeosciences 10, 2699–2709. doi: 10.5194/bg-10-2699-2013
Sikes, C. S., and Wilbur, K. W. (1982). Functions of coccolith formation. Limnol. Oceanogr. 27, 18–26. doi: 10.4319/lo.1982.27.1.0018
Simó, R. (2001). Production of atmospheric sulfur by oceanic plankton: biogeochemical, ecological and evolutionary links. Trends Ecol. Evol. 16, 287–294. doi: 10.1016/S0169-5347(01)02152-8
Steinberg, D. K., and Landry, M. R. (2017). Zooplankton and the ocean carbon cycle. Ann. Rev. Mar. Sci. 9, 413–444. doi: 10.1146/annurev-marine-010814-015924
Strom, S. L., Bright, K. J., Fredrickson, K. A., and Cooney, E. C. (2017). Phytoplankton defenses?: do Emiliania huxleyi coccoliths protect against microzooplankton predators? Limnol. Oceanogr. 63, 617–627. doi: 10.1002/lno.10655
Tarran, G. A., Heywood, J. L., and Zubkov, M. V. (2006). Latitudinal changes in the standing stocks of nano- and pico-eukaryotic phytoplankton in the Atlantic Ocean. Deep Res. Part II 53, 1516–1529. doi: 10.1016/j.dsr2.2006.05.004
Thomalla, S. J., Poulton, A. J., Sanders, R., Turnewitsch, R., Holligan, P. M., and Lucas, M. I. (2008). Variable export fluxes and efficiencies for calcite, opal, and organic carbon in the Atlantic Ocean: a ballast effect in action? Glob. Biogeochem. Cycles 22, 1–10. doi: 10.1029/2007GB002982
Tillmann, U. (2004). Interactions between planktonic microalgae and protozoan grazers. J. Eukaryot. Microbiol. 51, 156–168. doi: 10.1111/j.1550-7408.2004.tb00540.x
Whalen, K. E., Becker, J. W., Schrecengost, A. M., Gao, Y., Giannetti, N., and Harvey, E. L. (2019). Bacterial alkylquinolone signaling contributes to structuring microbial communities in the ocean. Microbiome 7:93. doi: 10.1186/s40168-019-0711-9
White, M. M., Waller, J. D., Lubelczyk, L. C., Drapeau, D. T., Bowler, B. C., Balch, W. M., et al. (2018). Coccolith dissolution within copepod guts affects fecal pellet density and sinking rate. Sci. Rep. 8:9758. doi: 10.1038/s41598-018-28073-x
Wilson, W. H., Tarran, G. A., Schroeder, D., Cox, M., Oke, J., and Malin, G. (2002). Isolation of viruses responsible for the demise of an Emiliania huxleyi bloom in the English Channel. J. Mar. Biol. Assoc. U.K. 82, 369–377. doi: 10.1017/s002531540200560x
Winter, A., Jordan, R. W., and Roth, P. H. (1994). “Biogeography of living coccolithophores in ocean waters,” in Coccolithophores, eds A. Winter and W. Siesser (Cambridge: Cambridge University Press), 161–177.
Xu, J., Bach, L. T., Schulz, K. G., Zhao, W., Gao, K., and Riebesell, U. (2016). The role of coccoliths in protecting Emiliania huxleyi against stressful light and UV radiation. Biogeosciences 13, 4637–4643. doi: 10.5194/bg-13-4637-2016
Young, J. R. (1994). “Functions of coccoliths,” in Coccolithophores, eds A. Winter and W. G. Siesser (Cambridge: Cambridge University Press), 63–82.
Keywords: coccolithophore, phytoplankton, microzooplankton, biomineralisation, predation, evolution
Citation: Mayers KMJ, Poulton AJ, Bidle K, Thamatrakoln K, Schieler B, Giering SLC, Wells SR, Tarran GA, Mayor D, Johnson M, Riebesell U, Larsen A, Vardi A and Harvey EL (2020) The Possession of Coccoliths Fails to Deter Microzooplankton Grazers. Front. Mar. Sci. 7:569896. doi: 10.3389/fmars.2020.569896
Received: 05 June 2020; Accepted: 22 October 2020;
Published: 02 December 2020.
Edited by:
Tilmann Harder, University of Bremen, GermanyReviewed by:
Marius Nils Müller, Federal University of Pernambuco, BrazilGlen Lee Wheeler, Marine Biological Association of the United Kingdom, United Kingdom
Copyright © 2020 Mayers, Poulton, Bidle, Thamatrakoln, Schieler, Giering, Wells, Tarran, Mayor, Johnson, Riebesell, Larsen, Vardi and Harvey. This is an open-access article distributed under the terms of the Creative Commons Attribution License (CC BY). The use, distribution or reproduction in other forums is permitted, provided the original author(s) and the copyright owner(s) are credited and that the original publication in this journal is cited, in accordance with accepted academic practice. No use, distribution or reproduction is permitted which does not comply with these terms.
*Correspondence: Kyle M. J. Mayers, a3ltYUBub3JjZXJlc2VhcmNoLm5v; Elizabeth L. Harvey, RWxpemFiZXRoLmhhcnZleUB1bmguZWR1
†Present address: Seona R. Wells, Marine Scotland Science, Aberdeen, United Kingdom