 Giulia Anderson
 Monal Lal1,3
 Brian Stockwell
 John Hampton
 Ciro Rico
- 1Molecular Analytics Laboratory (MOANA-LAB), School of Marine Studies, Faculty of Science, Technology and Environment, The University of the South Pacific, Suva, Fiji
- 2Oceanic Fisheries Programme (OFP), Pacific Community, Nouméa, New Caledonia
- 3Australian Centre for Pacific Islands Research, School of Science and Engineering, University of the Sunshine Coast, Maroochydore, QLD, Australia
- 4Instituto de Ciencias Marinas de Andalucía (ICMAN), Consejo Superior de Investigaciones Científicas, Puerto Real, Spain
Skipjack tuna (Katsuwonus pelamis) has historically been considered panmictic at the ocean basin scale because of the species’ life history and substantial absolute population size. However, recent advances in population genomics have enabled scientists to demonstrate population structure in other species that were likewise traditionally assumed to be panmictic. Accordingly, we used DArTseq, a proprietary platform of reduced-representation genome sequencing developed by Diversity Arrays Technology (DArTech) to genotype 222 skipjack tuna from 9 sample groups collected across 6 exclusive economic zones (EEZs) and over 6 years in the tropical Western and Central Pacific Ocean. This is one of the most fine-scale population genetics assessments of skipjack tuna to date. We found several statistically significant pairwise FST comparisons using purportedly neutral loci, but very little indication of structure based on observed and expected heterozygosity, effective population size, a Mantel test, AMOVA, numerous genetic clustering and population assignment tests, and exploration of correlation with oceanographic features. Significant pairwise FST values were often shallow and resulted in uncertainty about their biological significance. Furthermore, a test of the hypothesis that the geographic and temporal distribution of the potentially adaptive genetic diversity may depict cryptic fine scale structure using two different outlier detection methods, could not reject panmixia based on estimates of fixation indices and two clustering software. Our results support the presence of a single population of skipjack tuna in the tropical Western and Central Pacific Ocean, but highly recommend the expansion of the study area, in latitude, longitude, and seasonality, before drawing any global conclusions.
Introduction
As cosmopolitan fishes with large absolute population sizes and a remarkable propensity for trans-oceanic movement, tunas fit the life history of species that are not expected to show population structuring (Funk et al., 2012). A few species are widely recognized to function outside this model, particularly the three Bluefin tunas (Thunnus thynnus, T. orientalis, and T. maccoyii). Structure in Bluefin species is partly explained by a life history that includes structured breeding migrations (Richardson et al., 2016), which can produce cryptic reproductive subunits within an ostensibly mixed group. Bluefin tunas also suffer from previous or current overfishing (ISSF, 2017), which can cause population differentiation through fragmentation. However, the panmictic nature of other species is now also under increasing scrutiny. Growing evidence suggests that yellowfin tuna (Thunnus albacares) has the potential for genetic population structuring (Dammannagoda et al., 2008; Kunal et al., 2013; Grewe et al., 2015; Pecoraro et al., 2016), given their capacity for precise homing using a geomagnetic sensory organ (Walker et al., 1984), stronger than expected regional fidelity (Schaefer et al., 2007), and long-term coordinated movements of small groups (Klimley and Holloway, 1999) that may represent co-dispersal of kin (Anderson et al., 2019). There is even discussion of temporally variable population structure in albacore (Thunnus alalunga) in the Atlantic, given the regimented distribution of adults and juveniles, and separation of juveniles based on migratory routes (Duncan et al., 2018). In contrast, there is only limited discussion about the potential for population structure in skipjack tuna (Katsuwonus pelamis), and little evidence to merit its expectation.
Skipjack demonstrate many of the life history traits associated with panmixia. Skipjack in the Western Pacific grow to 35 cm in 6 months (Tanabe et al., 2003), can reach sexual maturity upon growing to a length of 40 cm (Ashida et al., 2008), produce 80,000–2,000,000 eggs (FAO, 2004) on a nightly basis (Hunter and Macewicz, 1986; Ashida et al., 2008), live only 6–8 years (Collette et al., 2011), and maintain a large absolute population size, estimated at roughly 4 MT (Vincent et al., 2019). It is logical to assume that high gene flow and lack of influence from genetic drift associated with the skipjack lifestyle would negate the possibility of intra-ocean population differentiation (Funk et al., 2012).
However, other evidence contradicts the simple assumption of panmixia in skipjack. Tagging and catch per unit effort studies confirm that populations in both the Western and Eastern Pacific migrate westward and to higher latitudes in the summer to feed (Fujino, 1996). Likewise, skipjack experience environmental stresses that drive coordinated movements within size-based subgroups that reflect age stratification (FAO, 2004). Because they lack the size and rete mirabile of other principle market tunas (Fudge and Stevens, 1996), skipjack are sensitive to temperature changes (Lehodey et al., 1997) and are spatially limited by the 15°C isotherm, with smaller fish preferring still warmer waters (FAO, 2004). Skipjack are likewise restricted by their high metabolism to oxygen-rich waters (Wild and Hampton, 1993; Essington, 2003), with young fish vertically separated from older generations in captivity in coordination with temperature and oxygen profiles (Barkley et al., 1978). Age-specific thermal and minimum oxygen demands are even incorporated in increasingly accurate predictive models of skipjack distribution (Senina et al., 2020). Size-based distribution within a larger population can serve as the basis for cryptic population structure.
Precedent also exists for acknowledging population structure among skipjack from a genetic perspective. Blood specimen analyses demonstrate an east-west cline among Pacific skipjack based on carboxylesterase and guanine deaminase allozymes (Richardson, 1983). As many as three semi-independent groups have been identified using esterase (Fujino, 1996), dividing the ocean basin into central-western, central-northeastern, and central-southeastern partitions. Mitochondrial studies also identified separation of skipjack populations between the Indian Ocean and the northwestern Pacific (Menezes et al., 2006), highlighting the capacity for more significant population structuring in the presence of semi-permeable oceanographic barriers like the Indonesian Throughflow (ITF). The ITF is an ocean current that serves as the upper branch of the global heat conveyor belt and it is known to limit dispersal of larvae from numerous pelagic species (Jackson et al., 2014). Finally, a size-specific discrepancy in esterase allozymes within New Zealand waters (Richardson and Habib, 1987) further supports the potential for cryptic population structure within any location.
Exploration of population genetics structure in all tuna species has benefited from the increased statistical power and reduced costs of analysis associated with next generation sequencing (NGS). Differentiation of yellowfin population within the Pacific has been revised from a tentative possibility supported by select allozymes (Ward et al., 1997), microsatellites (Diaz-Jaimes and Uribe-Alcocer, 2006), and mitochondrial regions (Li et al., 2015) that at best identified two populations, to a consistently demonstrated and increasingly fine scale phenomenon. Grewe et al. (2015) used 215 purportedly adaptive loci at Single Nucleotide Polymorphisms (SNP) and argued not only for separation of Eastern and Western Pacific yellowfin groups, but also for more shallow differentiation between Western and Central Pacific sub-populations. Genotyping by sequencing for the study was conducted by Diversity Arrays Technology (DArTech) using the NGS protocol DArTseq.
Given the success of next generation sequencing (NGS) studies to reveal novel genetic structure in similar tuna species, it is possible that skipjack tuna also experience currently unrecognized genetic structure. In fact, a recent and thorough review of genetic and non-genetic studies of skipjack structure in the Pacific explicitly highlights the lack of a comprehensive assessment of skipjack using NGS protocols as a knowledge gap (Moore et al., 2020b). It is especially important to explore the possibility of unrecognized structure in skipjack because the species supported a 3.0 MT fishery globally in 2018, 1.8 MT of which originated just from the western and central Pacific Ocean (WCPO) (WCPFC, 2019). Therefore, we analyzed 222 skipjack tuna from six EEZs and across 6 years in the tropical WCPO using the DArTseq protocol. We designed sample collections to uniquely control for spatial and temporal variation in structure. Specifically, three sample groups in three different countries were collected within 8 weeks of each other; likewise, four sample groups were collected within the Papua New Guinea EEZ in the same season but in different years. We calculated standard measures of population structure and SNP-optimized population assignment analyses using neutral loci (NL), and compared differences against both geographic and oceanographic features that might explain the observed patterns of subtle differentiation. Furthermore, we explored the hypothesis that the spatial and temporal distribution of potentially adaptive genetic diversity depicts fine scale structure by conducting a parallel analysis using loci under potential selection (LUPS).
Materials and Methods
Sample Collection
Fish specimens were selected for analysis from tissue samples archived in a tissue bank collection managed by the Pacific Community (SPC) under the auspices of the Western and Central Pacific Fisheries Commission (WCPFC), in Noumea, New Caledonia. Tissue samples consisted of muscle plug biopsies taken by scientists during research cruises. Tissue samples within the archive reflect an opportunistic sampling distribution, from which specimens for this study were selected based on catch location and date, such that all samples in a grouping were collected within 6 weeks of each other, and within an area of 3,400 km2 (radius of 330 km). When possible, samples were selected from archived tissue collected in the same EEZ and season, but from different years, for a uniquely controlled temporal comparison. Likewise, multiple sample groups from different countries were collected within the same 2-month period in order to produce a concisely controlled spatial comparison. Samples were accompanied by metadata including catch location, date, and catch event number, fish size, and a description of objects associated with the school of interest (Supplementary Table 1). Two hundred and fifty nine individuals from nine geographic locations were collected, representing five countries and spanning 6 years (Table 1 and Figure 1). Sample groups were collected in waters of the EEZ of the Federated States of Micronesia in 2008 (FM08), the Gilbert Islands of Kiribati in 2009 (GL09), Indonesia in 2009 (ID09), the Marshall Islands in 2009 (MH09), Papua New Guinea in 2007 (PG07), 2009 (PG09), 2011 (PG11), and 2012 (PG12), respectively, and Palau in 2008 (PW08) and ranged in size from 23 to 31 specimens (Table 1).
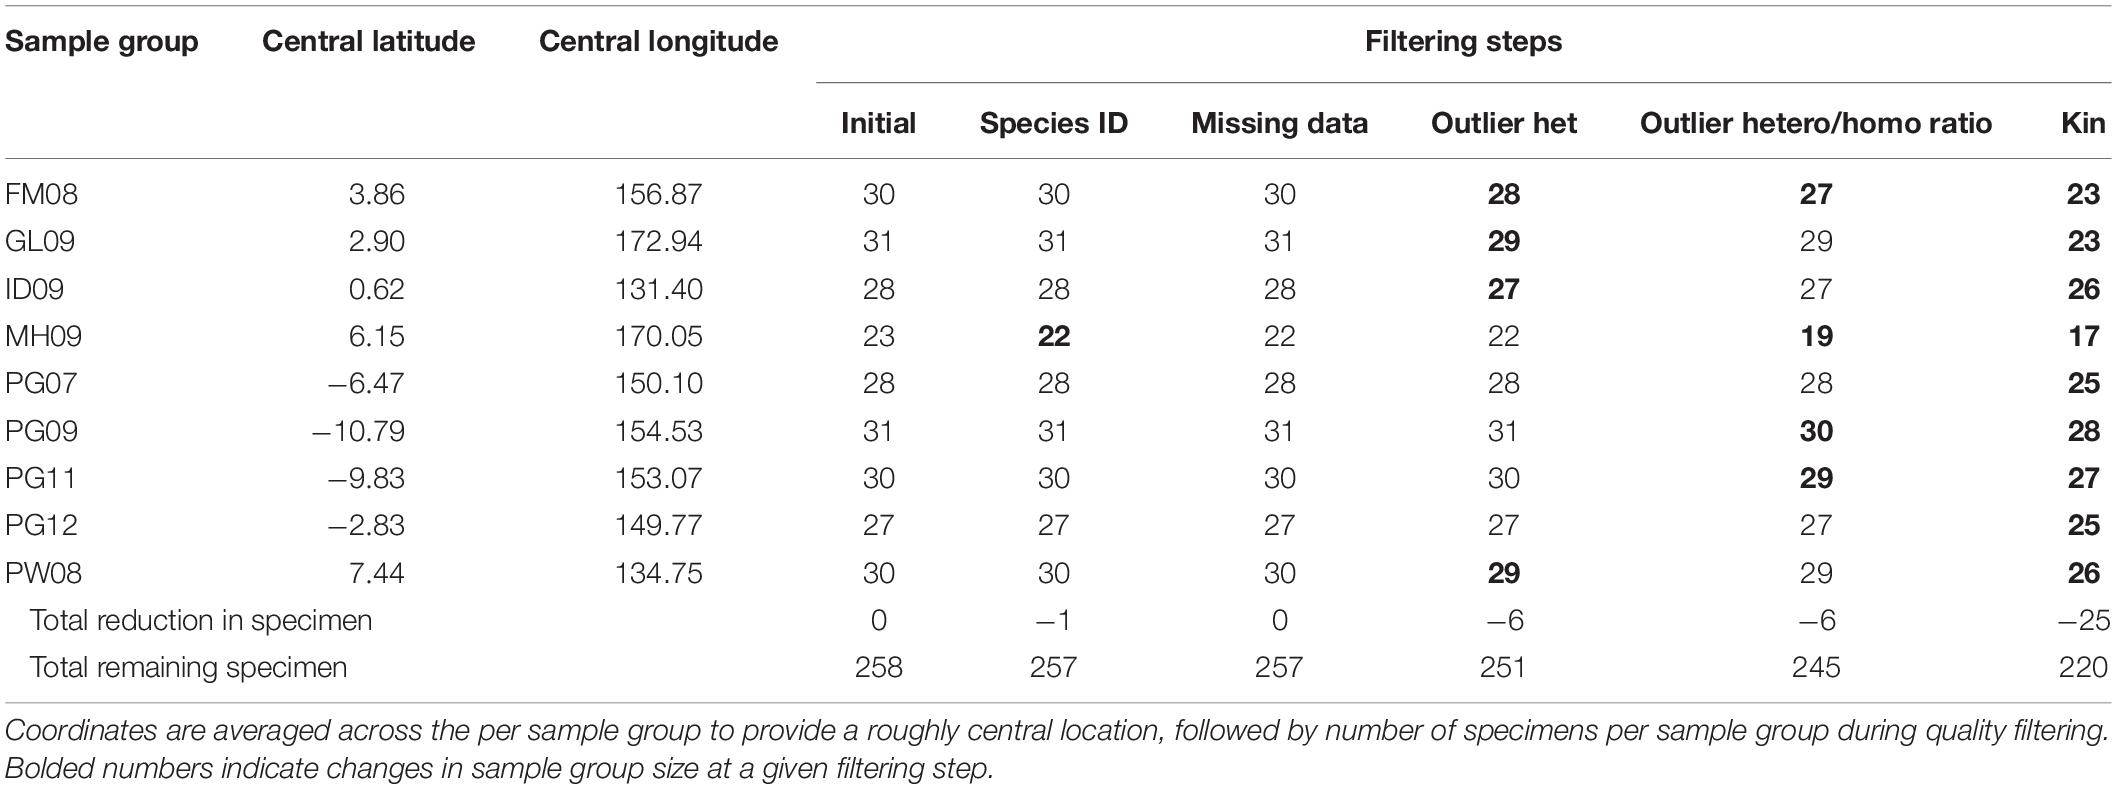
Table 1. Initial population parameters and extraction of individuals during quality filtering.
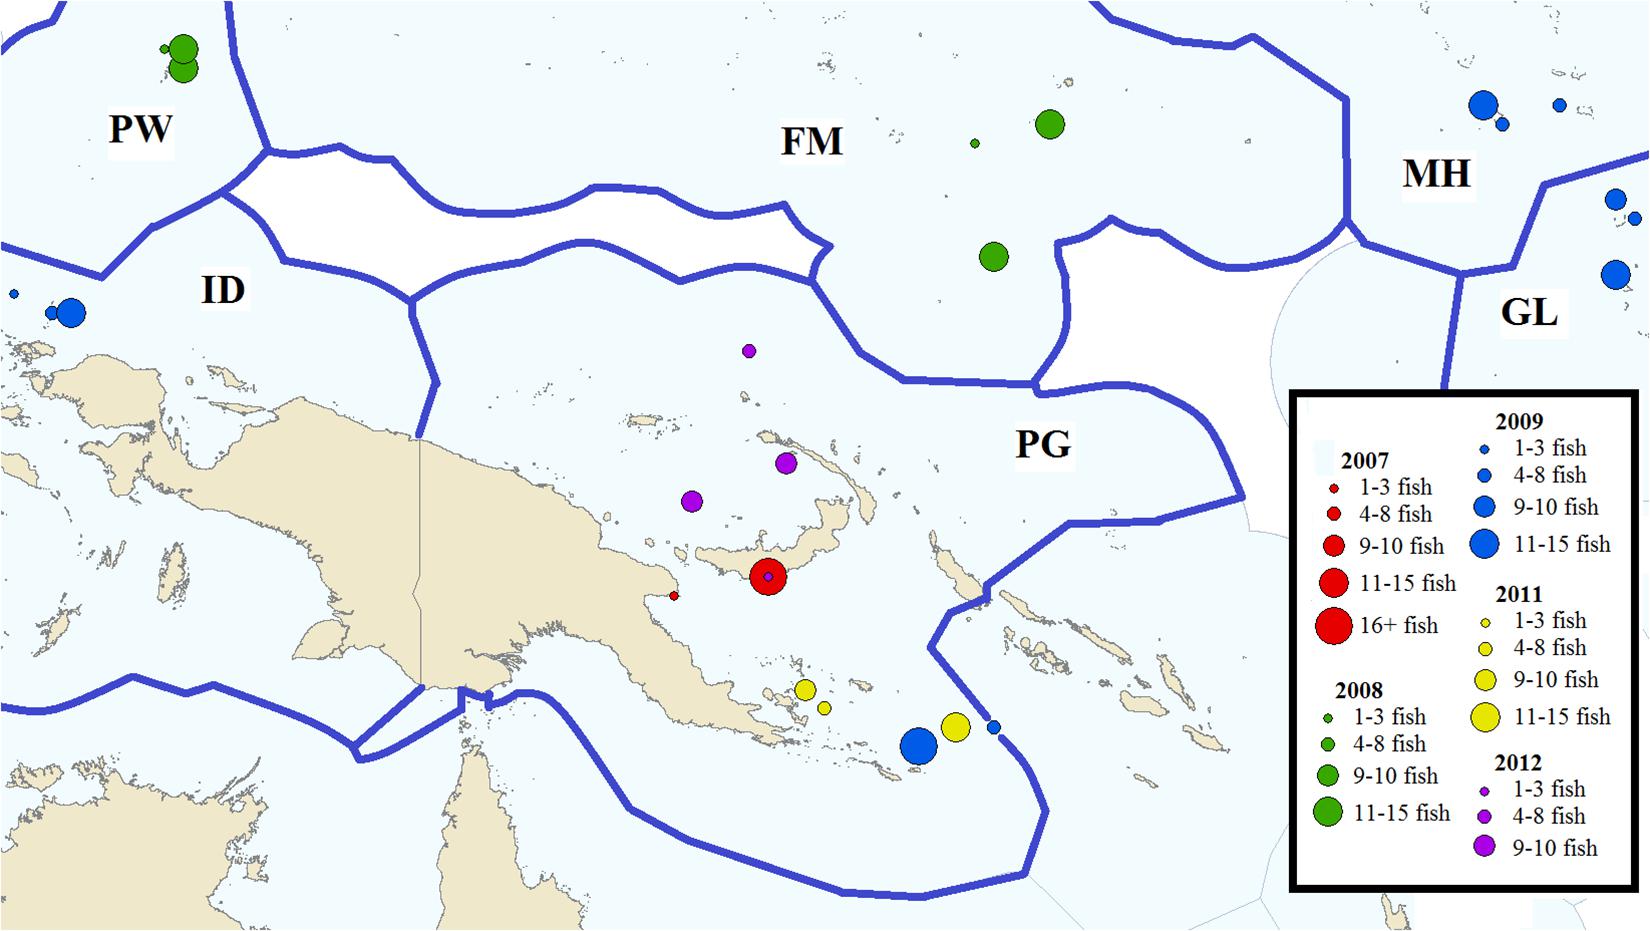
Figure 1. Map of sample site locations. Size of circle represents the number of fish caught.
DNA Extraction and Quality Filtering
Genomic DNA was extracted from muscle samples and processed for reduced representation library construction, sequenced, and genotyped by Diversity Arrays Technology (DArTech) using its patented protocol, DArTseq. DArTseqTM data has previously been used to demonstrate population genetic structure in yellowfin tuna (Thunnus albacares) (Grewe et al., 2015). Some of the procedures are proprietary knowledge, but reasonably detailed descriptions are available (Sansaloni et al., 2011; Kilian et al., 2012; Cruz et al., 2013; Ren et al., 2015). Briefly, DNA was extracted using a basic CTAB protocol in the DArTech laboratory. Purified DNA underwent genome complexity reduction with a double restriction digest using a PstI and SphI methylation-sensitive restriction enzyme combination. Highly methylated portions of the genome tend to be highly repetitive and uninformative in genomic structure analyses (Kilian et al., 2003). Adaptors that include variable barcode sequences and Illumina flowcell attachment sequences were ligated to fragments. PCR amplified only mixed fragments in a sequence of initial denaturation at 94°C for 1 min, followed by 30 cycles of 94°C for 20 s, 58°C for 30 s, and 72°C for 45 s. A final extension step took 7 min at 72°C. Libraries were sequenced on an Illumina HiSeq 2500 platform, and raw reads obtained following sequencing were processed using Illumina CASAVA v.1.8.2 software for initial assessment of read quality and sequence representation. The DArT PL proprietary software pipeline, DArTtoolbox, performed further filtering and variant calling, and generated final genotypes according to Kilian et al. (2012). Raw datasets are publicly available from the Open Science Framework under Digital Object Identifier DOI: 10.17605/OSF.IO/MPE5U
The species identification of all samples was confirmed using the COI barcoding gene. Samples were shipped to the Australian Genome Research Facility Ltd. (AGRF) wherein DNA was extracted and the COI gene was sequenced using the Fish COI primer set supplied by Carolina Biological Supplies. Sequences were then compared against the GenBank data set1 for species identification. One specimen from the MH09 sample group proved more compatible with the yellowfin database than skipjack, and it was removed from further analyses. Sequences are available on GenBank using accession numbers MT645970-MT645989.
Following preliminary filtering from DArTech, the genomic dataset consisted of 38,507 single nucleotide polymorphisms (SNPs). The dataset underwent three further rounds of quality filtering, first to delete individuals of suspect quality, then to filter SNPs using the refined sample groups and finally to isolate LUPS. The same thresholds were applied in all filtering efforts. SNP loci located on the same contig, which is metadata provided in the DArTech dataset, were removed except the locus with the highest call rate. Further locus quality filtering used thresholds of 99% for call rate, 7x for read depth, and 5% for minor allele frequency calculated across all samples. FST outliers were initially identified using Bayescan v. 2.01 (Foll and Gaggiotti, 2008) with an FDR of 10%. All FST outliers were extracted and the remaining neutral loci (NL) was further processed in PLINK v. 2 (Chang et al., 2015) for linkage disequilibrium greater than 70%, and Hardy Weinberg Equilibrium with a cut-off value of p < 0.0001 across all individually analyzed populations. Although a stricter p-value should have been used in filtering for HWE to accommodate for the high number of loci, we selected the most stringent available value.
At the end of the first round of filtering, individuals with outlier proportions (defined as three standard deviations above the average) of observed heterozygosity, missing data, or the ratio of heterozygous loci to homozygous loci, were deleted. All remaining individuals were further tested for genetic relatedness. The presence of kin groups in population samples can skew population structure results (Selwyn et al., 2016), but can also indicate contamination or duplication of DNA samples (Flickinger et al., 2015). COANCESTRY v 1.0.1.7 (Wang, 2011) established relatedness based on identity by descent using the TrioML algorithm assuming no inbreeding. COANCESTRY also generated 200 half-sibling dyads using the same allele frequencies as the final dataset. The lower 95% confidence interval of the coancestry coefficients from the simulated dyads was used as the cut-off value for related individuals in the empirical dataset. Twenty-eight dyads consisting of 53 individuals were identified as half- or full-siblings, the vast majority of which included individuals from neighboring wells on the sequencing plate. Further investigation is needed to explain the presence of purportedly related individuals. For analyzing structure, one individual from each dyad was removed from the final dataset.
After all suspect individuals were removed, the dataset was filtered a second time using the same filtering steps but without potential bias introduced by potentially cross-contaminated individuals. At the end of the second round of filtering, loci with observed heterozygosity greater than 0.5 were also extracted, as these loci have an elevated probability of including paralogs (O’Leary et al., 2018).
The data produced above is the primary dataset. A series of other data subsets were also produced to explore potential patterns that might be overwhelmed by noise in the full dataset. The majority of specimens taken in Palau in 2008 were small enough that they verge on juvenile status. In order to confirm that the presence of an anomalous group of juveniles did not mask other forms of population structure, a “non-juvenile dataset” extracted the PW08 sample group before secondary filtering of loci. Likewise, a “PG only” subset maximized loci selection for the four sample groups from Papua New Guinea in order to assess temporal structure, and a “PG-joined” dataset avoided potential skewing of analyses by selecting thirty individuals at random from across the four PG groups to represent the EEZ as a single group. Finally, to explore if the geographic and temporal distribution of the potentially adaptive genetic diversity may uncover cryptic fine-scale structure, we used two different software programs to identify candidate loci under selection or LUPS. First, BayeScan v.2.1 (Foll and Gaggiotti, 2008; Foll, 2012) was run again but with FDR threshold of 20% to increase the chances of detecting LUPS. Secondly, we used HacDivSel (Carvajal-Rodríguez, 2017). As these software packages employ different analytical approaches, their joint use increased the statistical confidence of FST outlier detection (White et al., 2010; Kovach et al., 2012; Pujolar et al., 2014).
Genetic Analyses
To validate the statistical power of the datasets to identify population structure, the number of loci, individuals, populations, and allele frequencies per locus from the primary dataset were replicated in POWSIM (Ryman and Palm, 2006) using recommended settings and run for 6, 15, and 30 generations. The resulting probability of successfully identifying structure was assessed for true differentiation values of 0.001, 0.0025, and 0.005.
Once adequate statistical power was confirmed, the primary dataset was used to calculate basic measures of genetic diversity. Sample size adjusted expected and observed heterozygosity (Hn.b. and Ho) were calculated using GENETIX v 4.05 (Belkir et al., 2004). Genetix also provides Hn.b. and Ho information per locus per sample group. T- and Mann Whitney tests for difference between Hn.b. and Ho at all loci within a sample group determined the statistical significance of any observed heterozygosity deficit or excess. The inbreeding coefficient FIS was calculated using commands “basic.stats” and “boot.ppfis” (1,000 permutations) in the R package hierfstat (Goudet, 2005). Ne was calculated using both a linkage disequilibrium and heterozygosity excess algorithm in NeEstimator v 2.01 (Do et al., 2014), assuming random mating. Values are reported at an α value of 0.01. The analysis was also re-run on all samples grouped into western and central Pacific regions, and as a single population. Pairwise FST (Weir and Cockerham, 1984) was analyzed in Arlequin v 3.5.2.1 (Excoffier and Lischer, 2010) using 10,000 permutations and adjusted using the Bonferroni correction. A mantel test using the command “mantel.rtest” from the R package ade4 (Dray and Dufour, 2007) checked for patterns of isolation by distance using Euclidean distances, which were measured between the average latitude and longitude of each sample group using the command “spDists” from R package “sp” (Pebesma and Bivand, 2005). As an alternative to a mantel test, a decomposed pairwise regression was attempted in R using the command “lm()” as described in Koizumi et al. (2006). A hierarchical AMOVA in Genodive v. 3.3 (Meirmans and van Tienderen, 2004) organized specimens first by catch events and then sample groups in order to check for school-level structure.
The dataset was also submitted to a four population clustering software programs with different methodologies. First, a discriminant analysis of principle components (DAPC, available in the R package adegenet; Jombart and Ahmed, 2011) uses a multivariate method to maximize variation between previously allocated sample groups given a user-determined number of principle components. The optimal number of principle components is determined by using the R command “a.score.optim” to identify the highest α-score produced by the lowest number of principle components. Second, network analyses carried out using the Netview R package (Neuditschko et al., 2012; Steinig et al., 2016) generate population networks based on a shared allele 1-identity-by-state (IBS) distance matrix. The IBS matrices and corresponding networks for the current dataset were constructed at various thresholds of the mk-NN value between 1 and 50, after which the optimal network for representation was selected based on cluster stability (Steinig et al., 2016). Individual networks are visualized and edited in the Cytoscape v.2.8.3 network construction package (Smoot et al., 2011).
Third, fastSTRUCTURE v. 1.0 (Raj et al., 2014) uses a variational Bayesian inference algorithm that builds on the STRUCTURE program to coerce individuals to a user-determined number of groups. The optimum number of distinct genetic clusters (k) into which individuals is arranged is determined by marginal likelihood. We ran samples using the full model and a logistic prior at each value of k between 1 and 10. ADMIXTURE v. 1.3.0 (Alexander et al., 2009) uses a similar approach to fastSTRUCTURE but draws conclusions based on maximum likelihood and compares the resulting amount of cross-validation error (CV) to recommend k. We ran ADMIXTURE for k between 1 and 10 and selected the result with the lowest associated CV.
To explore the impact of oceanographic as well as geographic mechanisms on skipjack structuring, Pearson correlations were also explored between pairwise FST values and either the difference in average monthly sea surface temperature (SST), or monthly average chlorophyll-a concentrations (chlor-a). SST and chlor-a were chosen based on previous acknowledgment of each measurement as effective predictors of skipjack distribution (Monllor-Hurtado et al., 2017; Zainuddin et al., 2017), using the logic that they might also prompt size- or competitiveness-specific movements that separate fish based on age. Remote sensing oceanographic data for this analysis was downloaded from the NASA Ocean Color website2. Data files originated from the SeaWiFS depository, and included all available daytime measurements of SST and chlor-a collected between 1st March 2007 and 14th March 2012 that included any part of the region between geographic coordinates 7°N and 11°S, and 131°E and 173°E. Measurements were taken at 9 km resolution. SST and chlor-a data from the location of each sample group were collected for 28 days prior to the sampling events, and averaged. The differences between average values for both oceanographic features were calculated between sample locations, as a foil for pairwise FST values. The two sets of values were measured for Pearson’s product-moment correlation using R command “cor.test ().”
Auxiliary datasets were assessed using appropriate subsets of analyses and the same methods as the primary dataset. The non-juvenile and PG-joined datasets were used to calculate heterozygosity, inbreeding, effective population size, AMOVA, pairwise FST, a Mantel test, and a DAPC. The PG-only dataset was submitted to an AMOVA, pairwise FST, a Mantel test, and a DAPC. The purportedly selectively neutral primary dataset generated following MAF filtering was used to identify additional outlier loci as described above. Screening for FST outlier loci identified markers potentially affected by selection, genetic drift, as well as hitch-hiking loci. BayeScan computations employed default settings (burn-in = 50,000, sample size = 5,000, total iterations = 100,000, pilot runs = 20 × 5,000) with FDRs = 0.001, 0.005, 0.01, 0.05, 0.1 and 0.2, and verification of loci detected at each FDR using QQ plots (data not shown). HacDivSel analyses employed the Extreme Outlier Set EOS test using a two-step heuristic algorithm (see Carvajal-Rodríguez, 2017 for further details). As HacDivSel is only able to make pairwise population comparisons, 36 pairwise runs were carried out. Genetic structure was estimated by calculating fixation indices as described above and visualized using a DAPC and fastSTRUCTURE with datasets containing all loci, neutral loci only and putative outliers only.
Finally, the filtered dataset (1,479 SNPs) generated earlier was used to create a population dendrogram to further explore if any genetic structure is present within the sample groups. Using the propShared function of the adegenet package in R (Lal et al., 2016; Kjeldsen et al., 2018), the 1-proportion of shared alleles distances (1-PSA) were computed and the resulting matrix was used to generate a neighbor-joining tree in MEGA6 (Tamura et al., 2013; Supplementary Figure S2).
Results
DNA Extraction and Quality Filtering
Quality filtering of individuals resulted in the extraction of 38 individuals and retained 220 in the primary dataset (Table 1). Sample group MH09 was reduced to 17 individuals, while all other sample groups have 23 or more members. The reduced sample size of MH09 requires extra precaution when drawing inferences about that group. Subsequent quality filtering for loci identified 1,373 neutral loci using the primary dataset, which consists of nine sample groups taken in the Federated States of Micronesia in 2008 (FM08), the Gilbert Islands of Kiribati in 2009 (GL09), Indonesia in 2009 (ID09), the Marshall Islands in 2009 (MH09), in Papua New Guinea in 2007, 2009, 2011, and 2012 (PG07, PG09, PG11, and PG12, respectively), and in Palau in 2008 (PW08).
A statistical power analysis using POWSIM confirmed that a dataset incorporating the number of samples, sample groups, loci, and allele distributions as the primary dataset would have a 100% probability of producing statistical significance at differentiation levels as low as FST = 0.0025, and a 96.8% chance of identifying structure at FST = 0.001.
Subdivision and re-filtering of the primary dataset produced four other data subsets of neutral loci, and one LUPS dataset. Number of neutral loci remaining after each quality-filtering step for primary dataset is listed in Table 2, while results for auxiliary datasets (i.e., no-juveniles, PG-only, PG-joined and LUPS) are presented in Supplementary Table S2. Comparisons of results from the same analyses run on the primary dataset and various data subsets helps guide confidence in the robustness of primary analyses. However, the result trends, if not absolute values, produced by alternative datasets including the analyses conducted using 453 LUPS are redundant to patterns in the primary dataset. These results are clearly illustrated by the FST values obtained with the neutral primary and LUPS datasets (Tables 3A,B) and the visualization of clustering patterns using DAPC (Figures 2A,B). Therefore, a comparison of results for duplicated analyses including figures and tables is available in Supplementary Tables S2–S7 and Supplementary Figure S1. Only informative observations will be highlighted directly in-text.
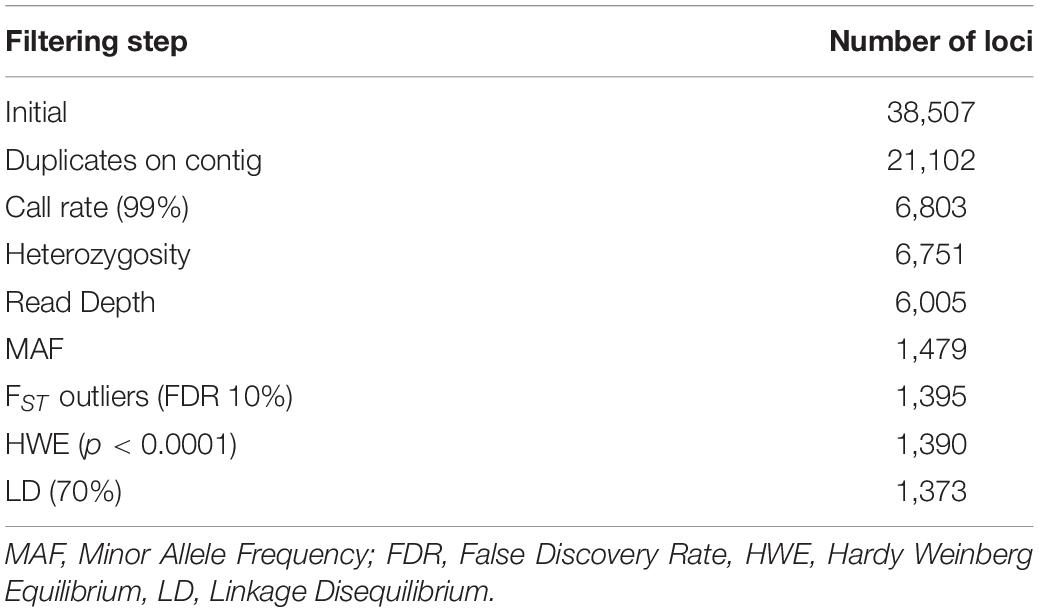
Table 2. Number of neutral loci remaining after each quality-filtering step for primary dataset.
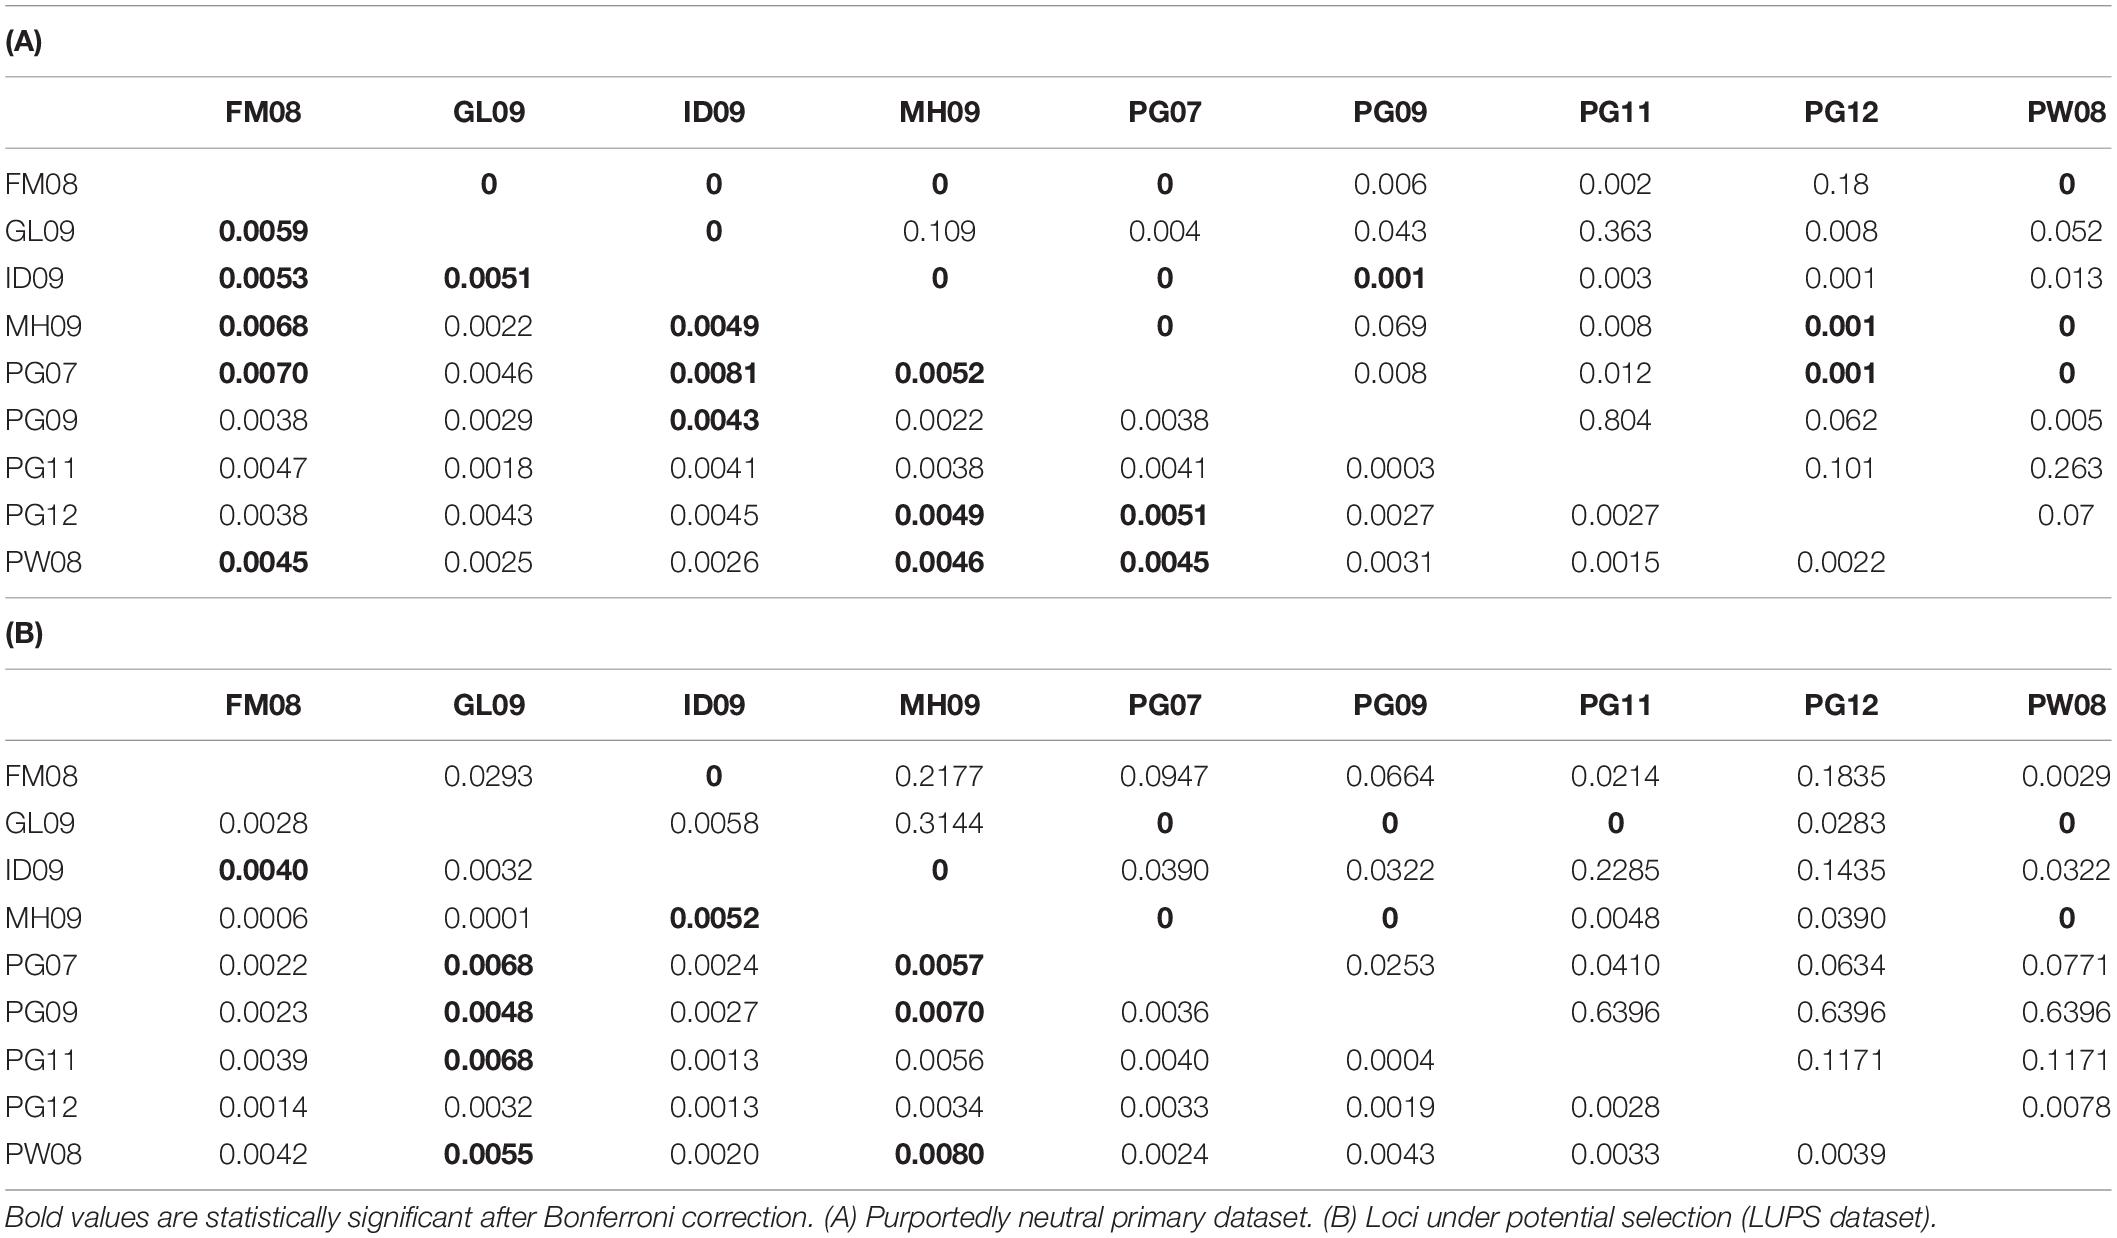
Table 3. Pairwise FST values (below diagonal) and associated p values (above diagonal) between population samples.
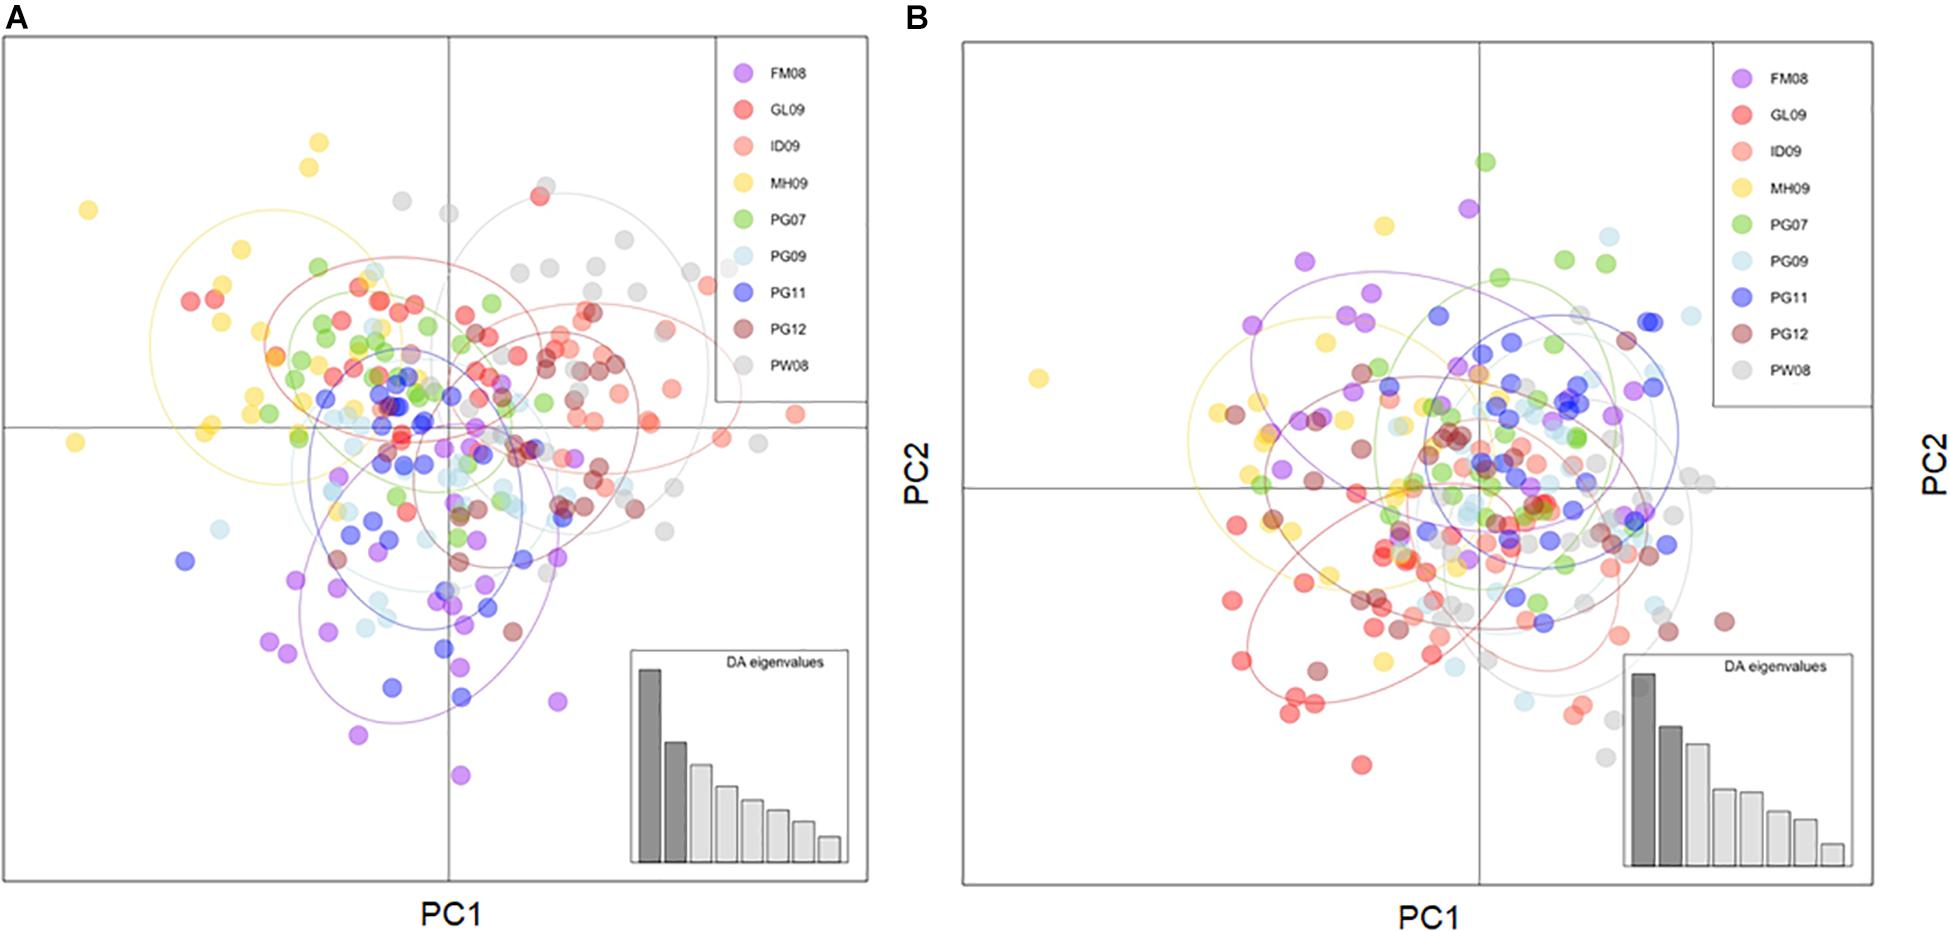
Figure 2. (A) DAPC using neutral loci from the primary dataset, 47 principle components, and 8 degrees of freedom. (B) DAPC using LUPS dataset, 34 principle components, and 8 degrees of freedom. Placement of individuals relative to each other reflects their genetic similarity and extent of genetic admixture irrespective of the purported neutrality of potential selectivity.
Genetic Analyses
Analyses using the primary dataset included standard measures of genetic diversity and differentiation. Sample size adjusted expected heterozygosity (Hnb) of the nine sample groups ranged from 0.233 (PG11) to 0.255 (ID09). Observed heterozygosity (HO) ranged from 0.211 (PG11) to 0.270 (ID09). The largest discrepancy between expected and observed heterozygosity was in PG11, with a significant difference in the form of a heterozygous deficit of 0.022 (p < 0.05) (Table 4). Significant heterozygosity deficits were found in all Papua New Guinea samples, while an excess was present in the fish collected in Indonesian waters (p < 0.05). Calculations of the inbreeding coefficient FIS were small or negative, ranging from −0.058 (ID09) to 0.095 (PG11) (Table 4). Effective population sizes (Ne) were estimated to range from 249 (95% confidence interval of 219–287; ID09) to 1,115 (confidence interval of 771–2003; PG11) based on linkage disequilibrium (Table 4). Ne values calculated using a heterozygosity-based algorithm are predictably less reliable than those assessed by linkage disequilibrium, and ranged from 14 (ID09) to infinite (multiple instances). When samples were amalgamated into Central and Western Pacific groups, Ne values calculated via the LD method jumped to 1,282 (range 1,012–1,750) in the Central Pacific and 1,585 (range 1,464–1,728) in the Western Pacific. A global analysis of Ne increased further to 1,751 (range 1,633–1,889). Finally, using the neutral primary dataset, 14 of 36 pairwise FST values, which represent the fixation indices and summarize the extent of allele frequency difference between two groups, were significant at a p-value of 0.05 after Bonferroni correction. Significant FST values ranged from 0.004 (between ID09 and PG09) to 0.008 (between ID09 and PG07) (Table 3A), with a mean value of 0.005. Similar trends in the results using the LUPS dataset were obtained (Table 3B). Only nine of 36 pairwise comparisons were significantly different after Bonferroni correction. Of these, only four correspond to the same sample pairs from the neutral primary dataset.
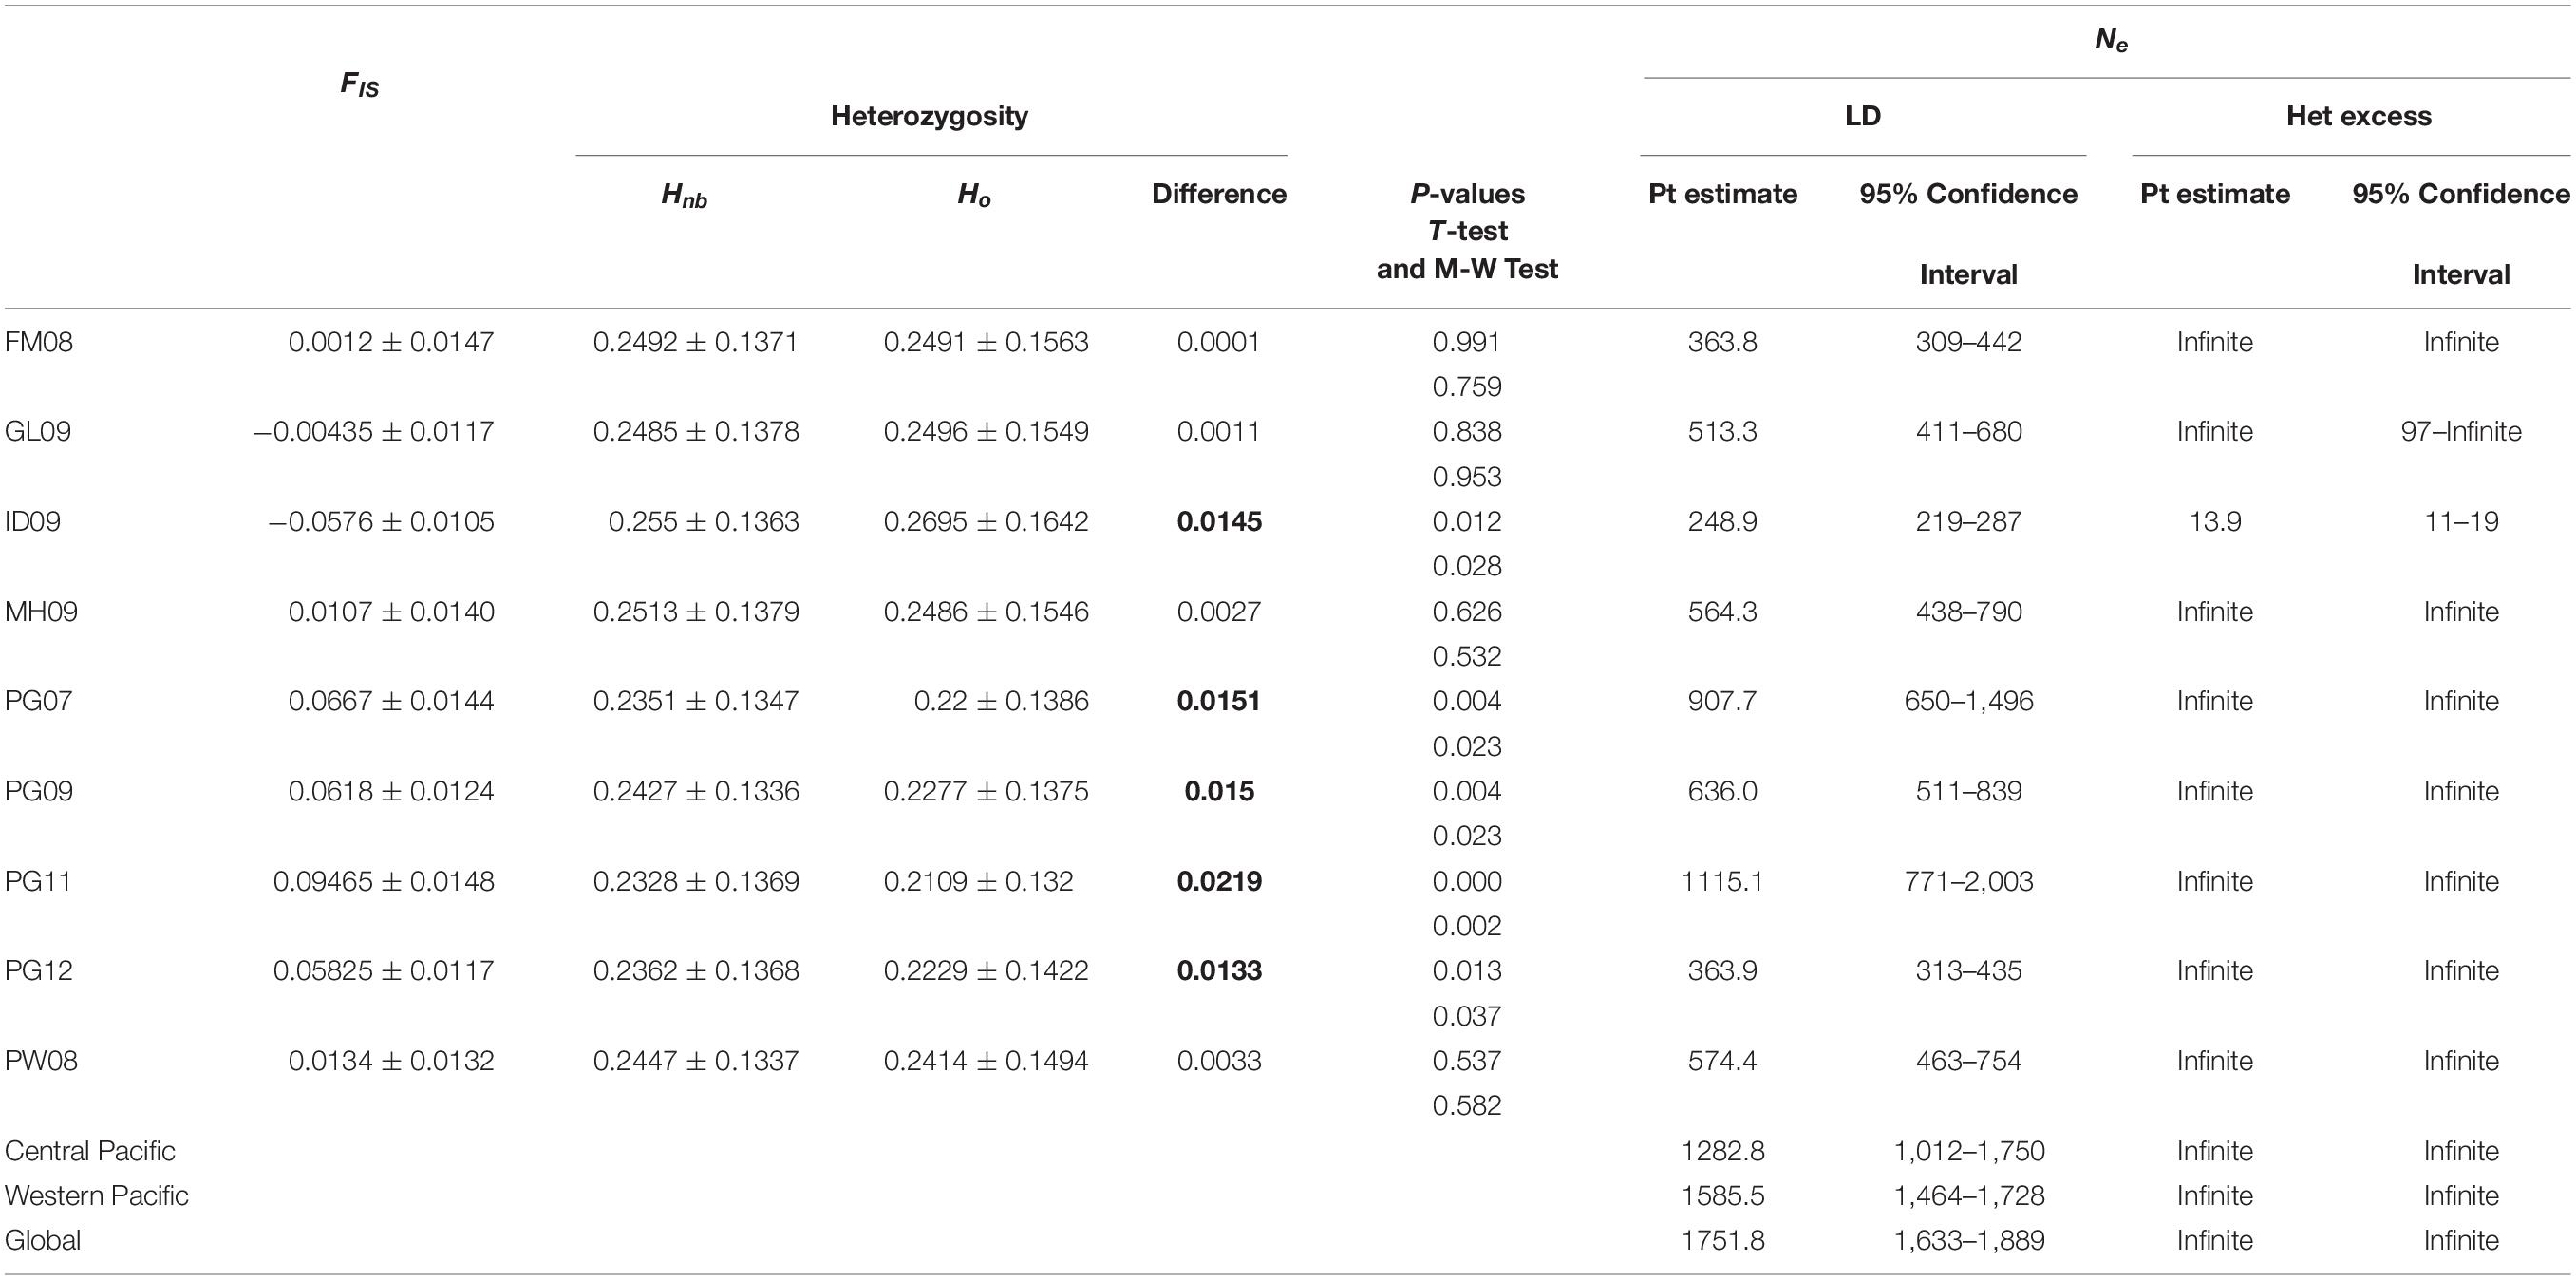
Table 4. Inbreeding coefficient (FIS), expected and observed heterozygosity (Hnb and Ho, respectively), p-values for significant differences between Hnb and Ho, p values for difference measured by T-test and Mann-Whitney Test (significant p-values in bold), and effective population size (Ne) calculated using the primary dataset.
A Mantel test comparing pairwise FST values against Euclidean distances showed a moderate and statistically significant association between distance and genetic differentiation (Supplementary Table S7), with an r2 value of 0.643 and associated p-value of 0.001. It should be noted, the PG-joined dataset was not statistically significant (r2 = 0.470, p = 0.123) in the same analysis. Alternatively, a decomposed pairwise regression found no indicator of outlier populations that might overshadow geographic patterns during analyses, which lends validity to the mantel test results. An AMOVA placed 0.04% of variation among catch events within sample groups, 0.5% among sample groups, and 99.2% within individuals, providing no evidence for hierarchical genetic sub-structuring.
Mantel and AMOVA results from data subsets provide helpful insight (Supplementary Tables S6, S7). No dataset allocated more than 1% of genetic variation to between sample groups. PG-joined was the most clearly structured at only 0.8%. However, all analyses produced significant p-values. The mantel test using the No Juveniles dataset improved the correlation between genetic and geographic distance compared to the primary dataset (r2 = 0.713, p = 0.001), while PG-joined lost statistical significance (r2 = 0.134, p = 0.301). Heterozygosity, FIS, Ne, and FST values all increased slightly in absolute values over the primary dataset, but maintained their relative trends.
Four software programs that have been engineered to describe sample clustering and population assignment using SNPs all produced concordant results using the neutral primary dataset. For the LUPS dataset, only DAPC and fastSTRUCTURE were used to explore the potential number of divergent samples and produced concordant results with the above analyses. A Discriminant Analysis of Principle Components (DAPC, Figure 2) uses multivariate analyses in order to maximize differentiation between user-defined sample groups and visually represents them through scatterplots. Alpha-optimization recommended the use of 47 out of 73 possible principle components for the neutral primary dataset, resulting in scatterplots that very marginally separated FM08 from other sample groups, and otherwise strongly overlapped all groups. Alpha-optimization recommended the use of 34 out of 73 possible principle components for the LUPS dataset, resulting also in scatterplots that strongly overlapped all sample groups and thus, confirmed broadscale admixture with an even stronger signal than with neutral loci.
Netview R uses cluster analysis to represent population structure, but produces population networks based on genetic similarity among individuals, without prior knowledge of sampling groups. Netview R displayed high levels of admixture among individuals in a single, large, diffuse cluster, suggesting a weak level of fine-scale genetic structure (Figure 3). Network patterns stabilized when using maximum number of nearest neighbor (mk-NN) values > 15, however, population networks constructed at a range of mk-NN values are presented in Supplementary Figure S2.
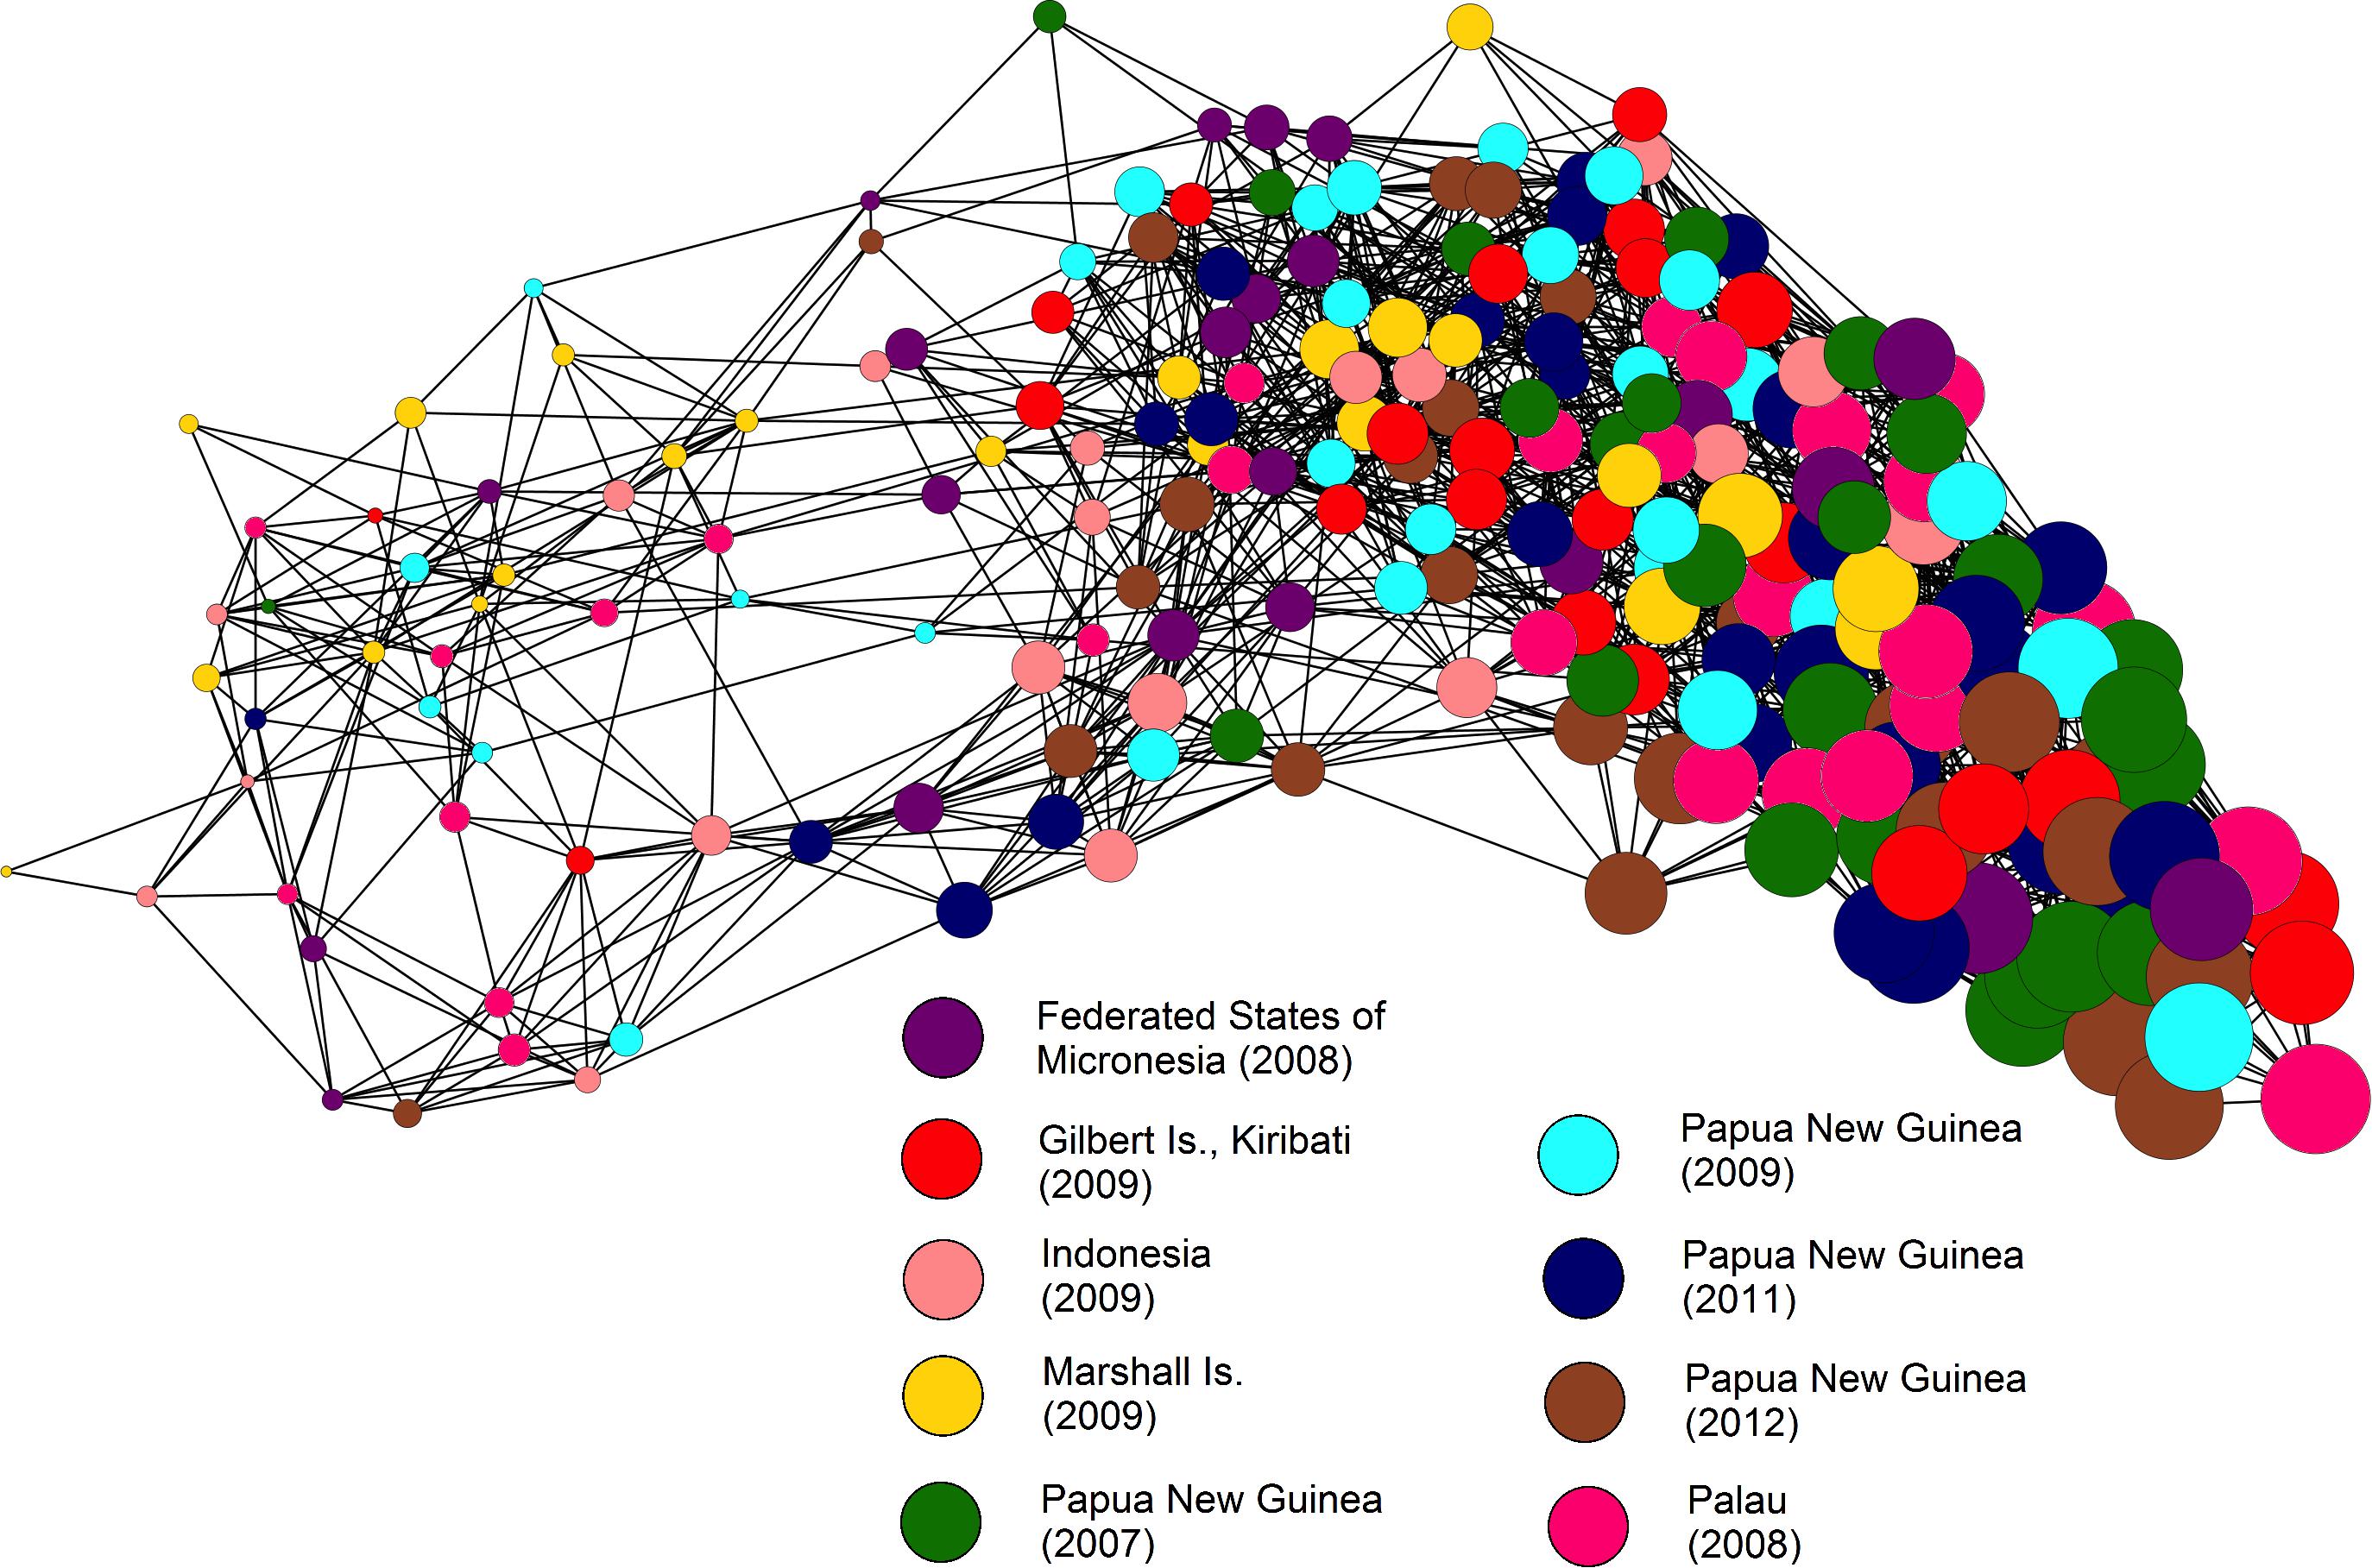
Figure 3. Fine-scale population genetic structure network analyzed using Netview R at mk-NN = 24. Node sizes displayed are mapped to the relatedness of individual fish, where larger node diameters denote higher levels of relatedness.
The software fastSTRUCTURE predicts k, the true number of distinct genetic clusters within a sample set, based on marginal likelihood. Both, the neutral primary and LUPS datasets functioned best at k = 1, indicating the presence of a single genetic cluster (Table 5). ADMIXTURE software uses a similar model to predict k, but selects the best number of clusters by attempting to minimize the cross-validation error. The inclusive dataset also performed best at k = 1 (Table 5).
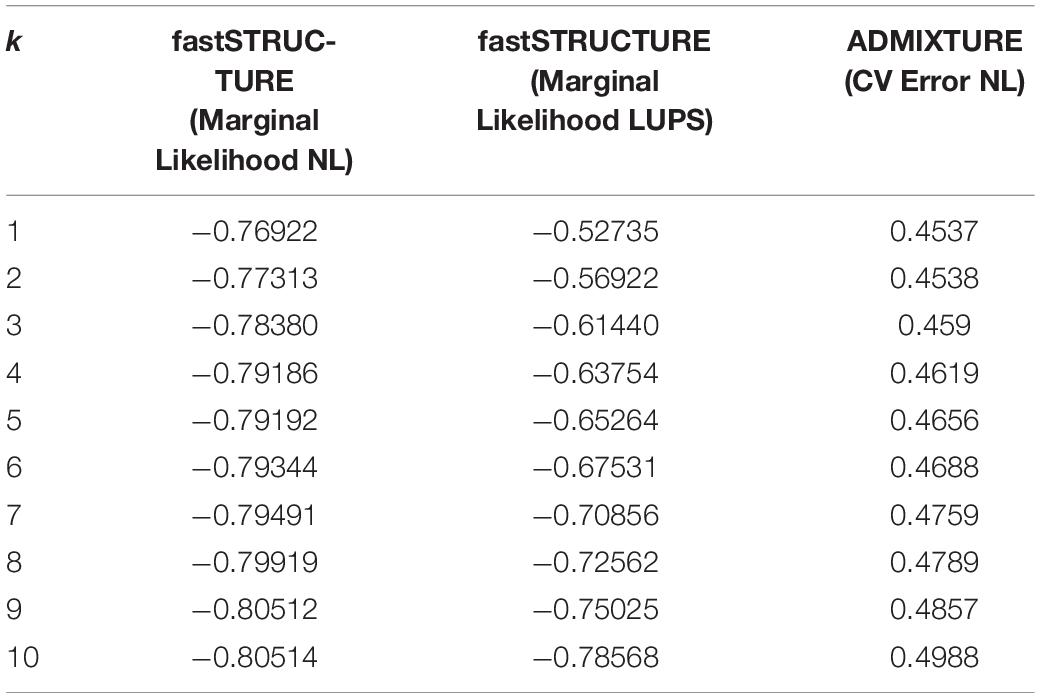
Table 5. fastSTRUCTURE and ADMIXTURE results associated with each possible k of 1–10.
Finally, while a phylogenetic analysis is outside the scope of the current assessment, as we are not exploring the longer-term evolutionary history of the observed population samples, we produced a dendrogram based on a 1-proportion of shared alleles distance matrix. The star-like topography obtained produces very similar distances among individuals providing no novel insights. It has been included in Supplementary Figure S3.
Pearson correlations between pairwise FST and the month-average daytime sea surface temperature (SST) were not significant (p = 0.250). The correlation with chlorophyll-a values was likewise uninformative (p = 0.953) That said, the average difference in SST was only 0.9°C (maximum 2.2°C), and the average difference in chlorophyll-a concentration was only 0.14 mg/m3 (maximum 0.35 mg/m3) (Table 6), which may be insufficient changes to prompt genetic differentiation or other stratification.
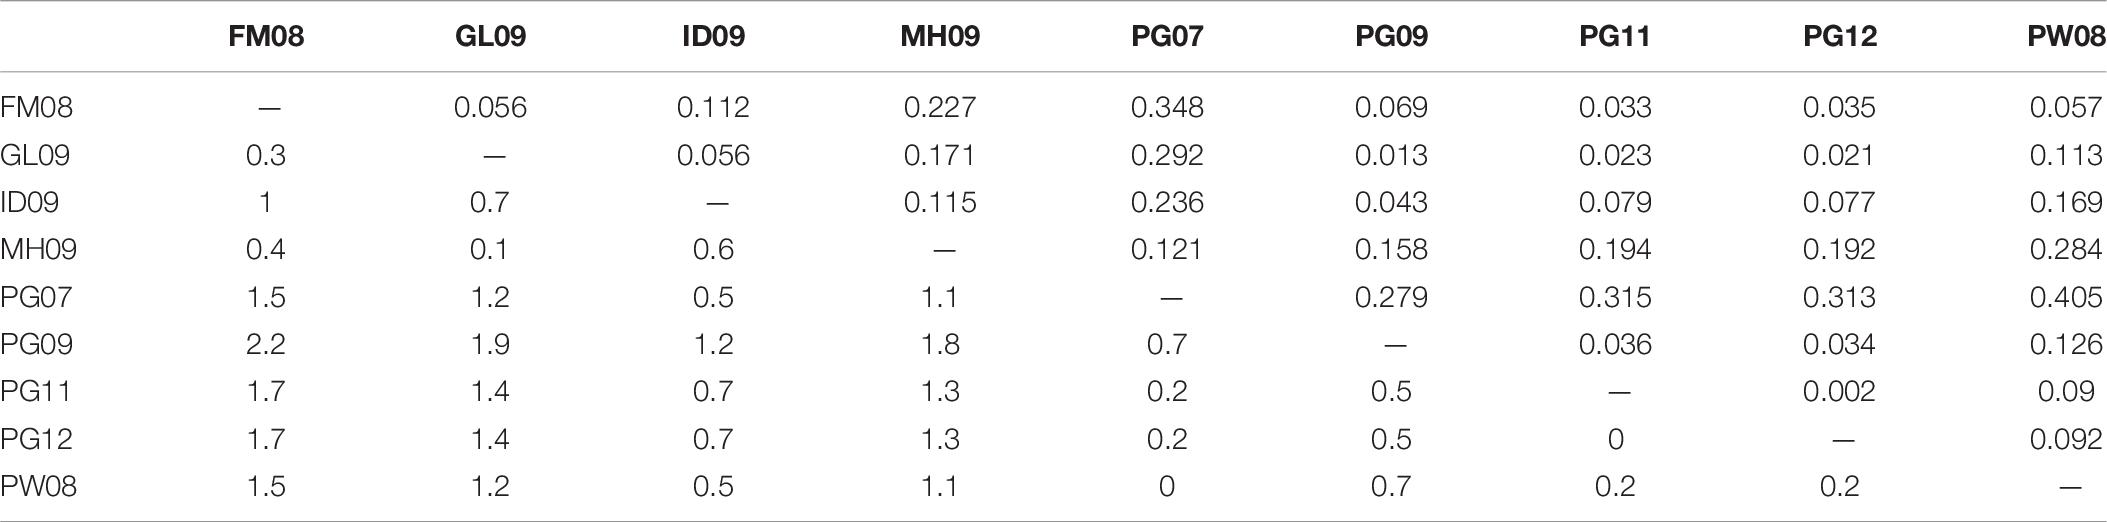
Table 6. Differences in SST (below diagonal, in °C) and chlorophyll-a concentrations (above diagonal, in mg/m3) between sample group locations.
BayeScan 2.1 computations identified eight loci at FRD 20% (i.e., three more than in the primary dataset), while HacDivSel runs identified 447 common SNPs among the 36 pairwise population comparisons. Two loci identified by BayeScan 2.1 were also detected by HacDivSel. Individual SNP FST values for HacDivSel-identified loci ranged from 0.0007 to 0.9902, with a median of 0.5117. The majority of putative outlier SNPs had an FST > 0.7 (n = 291). Using both approaches, 453 putative FST outlier loci were detected, and removal of these from the primary dataset generated a selectively neutral subset containing 1,026 SNPs. Significant population pairwise FST values for the new neutral dataset ranged from 0.002 (between ID09 and PW08) to 0.0063 (between PG12 and MH09) with a mean of 0.0035. Non-significant population pairwise comparisons were found between GL09 vs. MH09; PG07 vs. PG09; PG07 vs. PG11; PG09 vs. PG11; PG11 vs. PG12; and PG12 vs. PW08 Supplementary Table S8). Significant population pairwise FST values for the LUPS dataset ranged from 0.002 (between ID09 and PW08) to 0.0063 (between PG12 and MH09) with a mean of 0.0035. Non-significant population pairwise comparisons were found between GL09 vs. MH09; PG07 vs. PG09; PG07 vs. PG11; PG09 vs. PG11; PG11 vs. PG12; and PG12 vs. PW08 (Table 3B).
Discussion
Current analyses suggest that geographical distribution of the neutral genetic diversity among skipjack tuna in the WCPO is homogenous, and accordingly there is little need to revise extant general assumptions of the population’s health. Comparisons of results between the primary and No Juvenile dataset that excludes very small fish from PW08 show no change in overall trends, minimizing concern for overt age- or size-specific population structure. Likewise, the consistency between PG07, PG09, and PG12 in both the primary and PG-only datasets support a general rule of temporal stability in genetic structure. Furthermore, the distribution of the potentially adaptive divergence shows no change in the trends supporting the null hypothesis of panmixia (Figure 2B). There was also a small, but significant indication of heterozygote deficits or inbreeding in the primary dataset for all samples collected in Papua New Guinea, which may serve as an indicator of undetected sub-structuring at the local level through the Wahlund effect (Garnier-Gere and Chikhi, 2013) or other context that reduces skipjack’s ability to reproduce with genetically dissimilar fish. Collectively, heterozygosity and inbreeding coefficients give little indication of anomalies that could be linked to population structure for both neutral and potentially adaptive loci.
Two exceptions exist that challenge inferences of panmixia from diversity statistics. First, ID09 demonstrates a slight but significant heterozygosity excess that is retained across all datasets, in conjunction to a negative FIS value. Of all sample locations, Indonesia is the most westerly and positioned at the edge of the ITF, which is a known semi-permeable barrier to multiple marine species (Jackson et al., 2014). It is entirely feasible that the Indonesian skipjack experience slight but significant interbreeding with fish from a distinct, Indian Ocean stock. Second, PG samples carry inbreeding coefficients that are significantly different from zero compared to other sample groups, especially PG11. It is possible that the presence of increased land masses around sample locations in the Bismarck Sea and Solomon Sea, and the consequential high propensities for eddies (Steinberg et al., 2006), insulate the observed region. Significant heterozygous deficits can be due to genotyping artifacts, selection, non-random mating, inbreeding, small effective population sizes, migration and admixture. Fisheries overexploitation has also been associated with heterozygous deficits. For example, Hoarau et al. (2005) found that populations of plaice (Pleuronectes platessa) examined between 1924 and 1960 were in HWE, whereas populations examined after a fisheries peak in the 1970’s were not. The authors were able to attribute the significant heterozygote deficiencies found from 1970 onward to inbreeding and overexploitation. Unfortunately, we do not have access to archived samples to verify if the analyzed skipjack populations were in HWE before the major expansion of tuna fisheries after WWII. Genotyping artifacts are unlikely to be a major cause because the quality filtering steps used in this study are quite stringent and only five loci deviated from HWE in the primary dataset (e.g., Kilian et al., 2012; Lal et al., 2017). Furthermore, specimens from PG sample groups proved fairly robust during quality filtering. Two or three specimens were deleted, compared to seven or eight individuals from FM08 and GL09, respectively. Diversifying selection is unlikely to explain this result because in spite of having detected up to 453 putative Fst outlier loci as potentially adaptive, no evidence of population genetic structure was evident. Finally, the uneven extraction of highly heterozygous and potentially related individuals from sample groups might impact the remaining patterns of diversity. However, without a means to explicitly reject the possibility of sample cross contamination, retaining the suspect specimens would risk introducing severe artifacts into results (Selwyn et al., 2016). The potential presence of kin deserves further exploration.
Interpretations of effective population size are more debatable. Of the available algorithms for calculating Ne, the LD approach is popular because it is precise and does not require temporal resampling to be accurate (Wang et al., 2016b). However, the presence of non-random mating or population structure can skew results. Excluding individuals with excessively close relatives (ECR), like those filtered out prior to locus filtering in the current study, is known to artificially inflate Ne calculated using the LD approach (Waples and Anderson, 2017). However, there is ongoing debates about whether it is more appropriate to refrain from manipulating datasets based on ECR and risk underestimating Ne (Waples and Anderson, 2017), or extract suspect individuals and possibly lose biologically significant population structure while simultaneously overestimating Ne (Wang, 2018). To sidestep the issue in present analyses, samples were also assessed for Ne using the heterozygosity excess method, which is characteristically less accurate but carries different assumptions and vulnerabilities (Wang et al., 2016b).
The current range of Ne values, from roughly 250 to 1100 using the linkage disequilibrium algorithm, could either function as red flags for conservation in Indonesia and the Federated States of Micronesia, or further support robustness of the skipjack population within the WCPO. The basic 50/500 rule (that a population with an Ne under 50 is in immediate danger of diversity loss through inbreeding, and an Ne under 500 is susceptible to long-term loss of evolutionary adaptability and extinction; Franklin, 1980) is a simplified but functional guideline for studies of terrestrial species. If applied to the current results, such parameters would merit management concerns about fishery pressure in at least two EEZs. However, mating dynamics in the ocean are very different to those in terrestrial environments. While a majority of genetically assessed terrestrial species utilize internal fertilization (Baur, 1994), skipjack and other pelagic species rely on broadcast spawning (Hutchings et al., 2002). Among other implications for marine species’ life history, broadcast spawning can produce a distinctive pattern of variable reproductive success described as sweepstakes reproduction (Waples, 2016). In this mechanism, small sub-units of fish broadcast spawn in tandem and in close proximity, producing thousands to millions of larvae that are either half- or full-siblings (Hedgecock and Pudovkin, 2011). Meanwhile, fish that are not effectively positioned or timed to partake in such an event produce no offspring. Consequently, the larger population is made up of many semi-independent cohorts, each of which is derived from only a few parents and has a drastically low Ne. In this context, the Ne values produced by skipjack tuna are far from exceptional. The rationality of a reproductive sweepstakes interpretation is further supported by discrepancy between our Ne estimates and independent calculations of the WCPO’s available spawning stock, which most recently was gauged at roughly 2 MT (Vincent et al., 2019).
In fact, current Ne values further emphasize the limited substructure evident among the skipjack sample groups. Long-term co-dispersal of cohorts produced under reproductive sweepstake conditions creates chaotic genetic patchiness, a very subtle and temporally unstable form of population structure that retains the signature of small Ne per cohort (Broquet et al., 2013), with values as low as 40 in the Pacific oyster, Crasssostrea gigas, in Washington state, United States (Hedgecock, 1994). The more cohorts produced by different parents mix, the larger the local Ne values will become. In the current study, Ne values generated for PG11 epitomize the trend; the sample group with the largest variance in fish length (340–690 mm) produced the largest Ne value regardless of a high inbreeding coefficient. More generally, all sample groups were assigned values at least a magnitude higher than C. gigas values, despite behaviors that would be sufficient to produce a similar pattern of chaotic genetic patchiness. Namely, skipjack express prolific schooling habits (Hilborn, 1991), and mating behaviors that have been observed to include extensive mating displays prior to synchronized gamete release between as few as two fish (Matsumoto et al., 1984). Although it is reasonable to argue that skipjack experience reproductive sweepstakes, this does not translate to a lifelong maintenance of chaotic genetic patchiness.
The results of an AMOVA, which placed effectively 100% of variation between individuals, rather than catch events or sample groups, further substantiate skipjack admixture. Therefore, even a shallow pattern of structure like chaotic genetic patchiness does not effectively describe skipjack tuna’s neutral population genetic dynamics. Mantel tests using two of four purportedly neutral datasets produced significant results, which supports an isolation by distance pattern of structure. However, the strength of the correlation is artificially bolstered by the five statistically not significant pairwise FST values among Papua New Guinea sample groups. The PG-joined dataset overcomes the skew in sample distribution, and fails to support isolation by distance.
Other analyses do little to change the trend. Pairwise FST analyses, on both neutral and potentially adaptive loci, to indicate potential population differentiation show statistical significance but low absolute values. The relationship between statistical and biological relevance of FST values is increasingly disconnected as studies continue to use more loci to explore population differentiation, with yellowfin studies now using up to 11,000 loci (Mullins et al., 2018). The improved genomic sample size lends statistical significance to lower FST values, independent of whether they carry implications for population structure. Failure to find significant structure through an AMOVA and population clustering and assignment algorithms (DAPC, Netview R, fastSTRUCTURE, and ADMIXTURE) supports the possibility of pairwise FST irrelevance. Alternatively, there is also precedent for low pairwise FST values proving relevant. Knutsen et al. (2011) identified similar neutral FST values, as low as 0.003, in Atlantic cod. In that species, statistical differentiation aligns with population structure inferred from tag-recapture trends. Strong evidence of adaptive variation through chromosome inversion along the same geographic delineations further supports Knutsen et al.’s neutral observations (Kirubakaran et al., 2016). However, coastal cod are well recognized for their site fidelity (Knutsen et al., 2011), whereas skipjack are notoriously mobile and must swim more than 60 km per day just to facilitate respiration (Sharp, 1978; Wild and Hampton, 1993). It is not clear if the same, already tentative significance can be applied to a species with a different life history.
Incomplete migration offers one possible explanation for the evident but potentially uninformative genetic differentiation found in skipjack. Large-scale movements in Pacific skipjack are neither well documented nor ubiquitous and predictable (Wang et al., 2016a). Based on otolith analyses, some Pacific fish remain residents of the tropics their entire lives, while others make repeated trips into subtropical water (Arai et al., 2005). No consensus exists on what determines which fish leave the tropics, but the large-scale movement can produce stochastic population structure through asynchronous spawning. Since skipjack breed year-round in the tropics (FAO, 2004), when migrating fish are and are not present, cohorts spawned during the different seasons may carry different genetic signatures. Simultaneously, fish that migrate as far north as Japan enter more productive hunting waters and, accordingly, experience a 6.5-fold increase in energy consumption in conjunction to reduced energy output over tropical residents, which creates energy excess to invest in growth and reproduction (Aoki et al., 2017). The resulting advantage likely carries some implication for the distribution of parental input in tropical cohorts produced during and between migrations, regardless of whether it represents biologically relevant population structure.
There is a long tradition of failing to find neutral population structure in skipjack tuna. Ely et al. (2005) failed to find structure on a global scale using mitochondrial haplotypes and RFLPs, and Menezes et al. (2008) concluded that the Indian Ocean was panmictic using microsatellites. While both of these studies use very few loci and acknowledge the possibility that population structure exists in unsampled genomic regions, the current study provides significantly better genomic resolution without challenging the same conclusion. However, it also assesses a much smaller geographical region than either of the mentioned studies. More specific to the region of interest, models of skipjack individual movements continue to emphasize high mobility within Western and Central Pacific regions (Scutt Phillips et al., 2018). In contrast, Menezes et al. (2006) argues for a division in populations between the Indian and Western Pacific Oceans using RFLPs in the mitochondrial D-loop region, and Richardson and Habib (1987) even recommends differentiating between New Zealand and Western Pacific stocks using purportedly neutral allozymes. Likewise, Fujino (1996) specifically recommended the Marshall and Gilbert Islands archipelagos as a semi-permeable barrier to skipjack that move from the Eastern to the Central Pacific during their own summer feeding migration. Again, the current study does not incorporate sample locations that would test the proposed stock boundaries; instead, it is focused strictly in the tropical Western and Central Pacific, which is a smaller sample range than almost any other skipjack genetic study. Although this study represents one of the most thorough population genetic assessments of skipjack to date using a battery of genome wide SNP markers, the high resolution collection strategy was more appropriate to capture fine-scale meta population structure than oceanic level genomic divisions. Moore et al. (2020a) provides an in-depth discussion of considerations when designing sample strategies for genetic assessments of tuna. In short, the current lack of neutral structure determined thorough exploration of the skipjack genome should be extended to a larger study area prior to deriving any regional or global interpretation.
Conclusion
The current study represents the most thorough population genomics assessment of skipjack tuna in their most productive fishing grounds, the tropical Western and Central Pacific Ocean, to date, and fails to demonstrate overt neutral genetic structure. Although we do observe subtle cues of structure, the biological significance is debatable. We recommend broader sampling that applies high-resolution genomic assessment to geographic regions that have previously been highlighted as potentially genetically distinct. Primary candidate locations include the tropical eastern Pacific and the Indian Ocean side of the Indonesian Throughflow. In short, while we show functionally insignificant population structure using high-resolution genomic coverage, we need further studies with larger geographical range before we completely dispel the concept of biologically relevant population sub-structuring of skipjack tuna within the Pacific Ocean.
Data Availability Statement
Raw datasets are publicly available from the Open Science Framework under Digital Object Identifier DOI: 10.17605/OSF.IO/MPE5U. mtDNA sequences are available from GenBank under accession numbers MT645970-MT645989.
Ethics Statement
Ethical review and approval was not required for the animal study because samples were taken from a pre-existing tissue bank and did not involve contact with live animals.
Author Contributions
CR wrote the project proposal and obtained funding from The University of the South Pacific. CR and GA designed the study. GA performed the research, analyzed the data, and wrote the manuscript. BS independently confirmed species identification and analyzed data. ML reviewed data quality and analyzed the data. JH, SN, and NS, as agents of the Secretariat of the Pacific Community (SPC), critically assessed the results from a fisheries perspective. SPC was also responsible for sample collection, facilitated sample access, and prepared Figure 1. All authors contributed in the preparation of the final manuscript.
Funding
The genomic analyses in this work were funded by The University of the South Pacific Strategic Research Themes intramural program project number F1006-R1001-71502-622. Funding for the tuna tissue bank is currently provided by the WCPFC as part of Project 35b.
Conflict of Interest
The authors declare that the research was conducted in the absence of any commercial or financial relationships that could be construed as a potential conflict of interest.
Acknowledgments
We gratefully acknowledge all the fisheries observers and research staff who collected tissue bank samples, and Simon Nicol and Valerie Allain for establishing the tissue bank; Sylvain Caillot, as an agent of SPC, for preparing Figure 1; Maria Ines Rico and Francois Roupsard for technical assistance with sample preparation; Anthony Beeching and Feleti P. Teo from the Western and Central Pacific Fisheries Commission (WCPFC) for facilitating and granting access to the Tissue Bank.
Supplementary Material
The Supplementary Material for this article can be found online at: https://www.frontiersin.org/articles/10.3389/fmars.2020.570760/full#supplementary-material
Supplementary Figure 1 | DAPCs using neutral loci from the primary (47 principle components, 8 degrees of freedom) and auxiliary datasets after excluding PW08 (no Juveniles; 42 principle components, 7 degrees of freedom), after disregarding all samples except those from Papua New Guinea (PG-only; 25 principle components, 3 degrees of freedom), and after replacing the four PG sample groups with a single subset picked from across all four PG sample groups (PG-joined; 36 principle components, 5 degrees of freedom). Placement of individuals relative to each other reflects their genetic similarity and extent of genetic structure resulting in scatterplots that strongly overlapped all sample groups and thus, confirmed broadscale admixture irrespective of sample selection.
Supplementary Figure 2 | Population genetic structure network analyzed using Netview R at mk-NN = 6–30. Node sizes displayed are mapped to the relatedness of individual fish, where larger node diameters denote higher levels of relatedness.
Supplementary Figure 3 | Population dendrogram based on 1-psa genetic distance matrix and NJ approach.
Supplementary Table 1 | Catch data for sampled individuals, available as spreadsheet “Supplement Sample metadata.xlsx.”
Supplementary Table 2 | Number of neutral and potentially adaptive loci remaining after each quality-filtering step for auxiliary datasets (i.e., no-juveniles, PG-only, PG-joined and LUPS). MAF, Minor Allele Frequency; FDR, False Discovery Rate; HWE, Hardy Weinberg Equilibrium; LD, Linkage Disequilibrium.
Supplementary Tables 3–7 | Comparison of basic genetic analyses between the primary dataset and neutral subsets that were filtered after excluding PW08 (no Juveniles), after disregarding all samples except those from Papua New Guinea (PG-only), and after replacing the four PG sample groups with a single subset picked from across all four PG sample groups (PG-joined).
Supplementary Table 8 | FST from auxiliary neutral dataset.
Footnotes
References
Alexander, D. H., Novembre, J., and Lange, K. (2009). Fast Model-based estimation of ancestry in unrelated individuals. Genome Res. 19, 1655–1664. doi: 10.1101/gr.094052.109
Anderson, G., Lal, M., Hampton, J., Smith, N., and Rico, C. (2019). Close kin proximity in yellowfin tuna (Thunnus albacares) as a driver of population genetic structure in the tropical western and central pacific ocean. Front. Mar. Sci. 6:341. doi: 10.3389/fmars.2019.00341
Aoki, Y., Kitagawa, T., Kiyofuji, H., Okamoto, S., and Kawamura, T. (2017). Changes in energy intake and cost of transport by Skipjack Tuna (Katsuwonus Pelamis) during northward migration in the northwestern pacific ocean. Deep Sea Res. Part II: Top. Stud. Oceanography 140, 83–93. doi: 10.1016/J.DSR2.2016.05.012
Arai, T., Kotake, A., and Kayama, S. (2005). Movements and life history patterns of the skipjack tuna katsuwonus pelamis in the Western Pacific, as revealed by otolith sr: ca ratios. J. Mar. Biol. Assoc. U K. 2005, 1211–1216. doi: 10.1017/s0025315405012336
Ashida, H., Tanabe, T., Suzuki, N., Fukui, A., and Tanaka, S. (2008). Spawning frequency and batch fecundity of skipjack tuna katsuwonus pelamis in the tropical west-central pacific ocean. Nippon Suisan Gakkaishi 74, 802–808. doi: 10.2331/suisan.74.802
Barkley, R., Neill, W., and Gooding, R. (1978). Skipjack tuna, katsuwonus pelamis, habitat based on temperature and oxygen requirements. Fish. Bull. 76, 653–662.
Baur, B. (1994). Parental care in terrestrial gastropods. Experientia 50, 5–14. doi: 10.1007/BF01992042
Belkir, L., Borsa, P., Chikhi, L., Raufaste, N., and Bonhomme, F. (2004). 1996-2004 GENETIX 4.05 Logiciel Sous Windows TM Four La Genetique Des Populations. Laboratoire Genome, Populations, Interactions. Montpellier: Universite de Montpellier.
Broquet, T., Viard, F., and Yearsley, J. M. (2013). Genetic drift and collective dispersal can result in chaotic genetic patchiness. Evolution 67, 1660–1675. doi: 10.1111/j.1558-5646.2012.01826.x
Carvajal-Rodríguez, A. (2017). HacDivSel: two new methods (haplotype-based and outlier-based) for the detection of divergent selection in pairs of populations. PLoS One 12:e0175944. doi: 10.1371/journal.pone.0175944
Chang, C. C., Chow, C. C., Tellier, L. C., Vattikuti, S., Purcell, S. M., and Lee, J. J. (2015). Second-Generation PLINK: rising to the challenge of larger and richer datasets. Gigascience 4:7. doi: 10.1186/s13742-015-0047-48
Collette, B., Acero, A., Amorim, A., and Boustany, A. (2011). Katsuwonus pelamis. IUCN Red List Threatened Species 2011:e.T170310A6739812. doi: 10.2305/IUCN.UK.2011-2.RLTS.T170310A6739812.en
Cruz, V. M., Kilian, A., and Dierig, D. A. (2013). Development of DArT marker platforms and genetic diversity assessment of the U.S. collection of the new oilseed crop lesquerella and related species. Edited by Matthew E. Hudson. PLoS One 8:e64062. doi: 10.1371/journal.pone.0064062
Dammannagoda, S. T., Hurwood, D. A., and Mather, P. B. (2008). Evidence for fine geographical scale heterogeneity in gene frequencies in Yellowfin Tuna (Thunnus Albacares) from the North Indian Ocean around Sri Lanka. Fish. Res. 90, 147–157. doi: 10.1016/j.fishres.2007.10.006
Diaz-Jaimes, P., and Uribe-Alcocer, M. (2006). Spatial differentiation in the Eastern Pacific Yellowfin Tuna Revealed by microsatellite variation. Fish. Sci. 72, 590–596.
Do, C., Waples, R. S., Peel, D., Macbeth, G. M., Tillett, B. J., and Ovenden, J. R. (2014). NeEstimator v2: re-implementation of software for the estimation of contemporary effective population size (Ne) from genetic data. Mol. Ecol. Resources 14, 209–214. doi: 10.1111/1755-0998.12157
Dray, S., and Dufour, A. B. (2007). The Ade4 package: implementing the duality diagram for ecologists. J. Statistical Software 22, 1–20. doi: 10.18637/jss.v022.i04
Duncan, R., Brophy, D., and Arrizabalaga, H. (2018). Otolith shape analysis as a tool for stock separation of albacore tuna feeding in the Northeast Atlantic. Fish. Res. 200, 68–74. doi: 10.1016/J.FISHRES.2017.12.011
Ely, B., Viñas, J., Bremer, J. A., Black, D., Lucas, L., Covello, K., et al. (2005). Consequences of the historical demography on the global population structure of two highly migratory cosmopolitan marine fishes: the Yellowfin Tuna (Thunnus Albacares) and the Skipjack Tuna (Katsuwonus Pelamis). BMC Evol. Biol. 5:19. doi: 10.1186/1471-2148-5-19
Essington, T. E. (2003). Development and sensitivity analysis of bioenergetics models for skipjack tuna and albacore: a comparison of alternative life histories. Trans. Am. Fish. Soc. 132, 759–770. doi: 10.1577/T02-094
Excoffier, L., and Lischer, H. (2010). Arlequin Suite Ver 3.5: a new series of programs to perform population genetics analyses under linux and windows. Mol. Ecol. Resources 10, 564–567. doi: 10.1111/j.1755-0998.2010.02847.x
FAO (2004). Katsuwonus Pelamis. FAO Species Fact Sheet. FAO Fisheries and Aquaculture Department Online. Rome: FAO.
Flickinger, M., Jun, G., Abecasis, G. R., Boehnke, M., and Kang, H. M. (2015). Correcting for sample contamination in genotype calling of DNA sequence data. Am. J. Hum. Genet. 97, 284–290. doi: 10.1016/j.ajhg.2015.07.002
Foll, M., and Gaggiotti, O. (2008). A genome-scan method to identify selected loci appropriate for both dominant and codominant markers: a bayesian perspective. Genetics 180, 977–993. doi: 10.1534/genetics.108.092221
Franklin, I. R. (1980). “Evolutionary change in small populations,” in Conservation Biology: An Evolutionary-Ecological Perspective, eds M. E. Soule and B. A. Wilcox (Sunderland, MA: Sinauer Associates), 135–150.
Fudge, D. S., and Stevens, E. D. (1996). The Visceral Retia Mirabilia of Tuna and Sharks: An Annotated Translation and Discussion of the Eschricht and Müller 1835 Paper and Related Papers. Guelph Ichthyology Reviews. Canada: University of Guelph, Axelrod Institute of Ichthyology.
Fujino, K. (1996). Genetically distinct skipjack tuna subpopulations appeared in the central and the Western Pacific Ocean. Fish. Sci. 62, 189–195.
Funk, C., McKay, J., Hohenlohe, P., and Allendorf, P. (2012). Harnessing genomics for delineating conservatino units. Trends Ecol. Evol. 27, 489–496.
Garnier-Gere, P., and Chikhi, L. (2013). “Population subdivision, hardy-weinberg equilibrium and the wahlund effect,” in eLS (Atlanta, GA: American Cancer Society; John Wiley & Sons, Ltd). doi: 10.1002/9780470015902.a0005446.pub3
Goudet, J. (2005). Hierfstat, a library for R to compute and test hierarchical F-Statistics. Mol. Ecol. Notes 5, 184–186. doi: 10.111/j.1471-8286-2004.00828.x
Grewe, P., Feutry, P., Hill, P., Gunasekera, R., Schaefer, K., et al. (2015). Evidence of discrete Yellowfin Tuna (Thunnus Albacares) populations demands rethink of management for this globally important resource. Sci. Rep. 5:16916. doi: 10.1038/srep16916
Hedgecock, D. (1994). “Does variance in reproductive success limit effective population sizes of marine organisms?,” in Genetic and Evolution of Aquatic Organisms, ed. A. Beaumont (London: Chapman and Hall), 122–133.
Hedgecock, D., and Pudovkin, A. (2011). sweepstakes reproductive success in highly fecund marine fish and shellfish: a review and commentary. Bull. Mar. Sci. 87, 971–1002. doi: 10.5343/bms.2010.1051
Hilborn, R. (1991). Modeling the stability of fish schools: exchange of individual fish between schools of Skipjack Tuna (Katsuwonus Pelamis). Can. J. Fish. Aquacult. Sci. 48, 1081–1091.
Hoarau, G., Boon, E., Jongma, D. N., Ferber, S., Palsson, J., Van der Veer, H. W., et al. (2005). Low effective population size and evidence for inbreeding in an overexploited flatfish, plaice (Pleuronectes platessa L.). Proc. R. Soc. B-Biological Sci. 272, 497–503. doi: 10.1098/rspb.2004.2963
Hunter, J., and Macewicz, B. (1986). The spawning frequency of skipjack tuna, katsuwonus pelamis, from the South Pacific. Fish. Bull. 84, 895–903.
Hutchings, L., Beckley, L. E., Griffiths, M. H., Roberts, M. J., Sundby, S., and Van der Lingen, C. (2002). Spawning on the edge: spawning grounds and nursery areas around the southern african coastline. Mar. Freshwater Res. 53, 307–318. doi: 10.1071/MF01147
ISSF (2017). Status of the World Fisheries for Tuna. Feb 2017. Washington D.C: ISSF. ISSF Technical Report 2017-02.
Jackson, A. M., Erdmann, M. V., Toha, A., Stevens, L. A., and Barber, P. H. (2014). Phylogeography of commercial tuna and mackerel in the indonesian archipelago. Bull. Mar. Sci. 90, 471–492. doi: 10.5343/bms.2012.1097
Jombart, T., and Ahmed, I. (2011). Adegenet 1.3-1: new tools for the analysis of genome-wide SNP Data. Bioinformatics 27, 3070–3071. doi: 10.1093/bioinformatics/btr521
Kilian, A., Huttner, E., Wenzl, P., Jaccoud, D., Carling, J., Caig, V., et al. (2003). “The fast and the cheap: SNP and DArT-Based whole genome profiling for crop improvement,” in Proceedings of the International Congress “In the Wake of the Double Helix: From the Green Revolution to the Gene Revolution, (Bologna: Avenue Media), 443–461.
Kilian, A., Wenzl, P., Huttner, E., Carling, J., Xia, L., Blois, H., et al. (2012). Diversity arrays technology: a generic genome profiling technology on open platforms. Data Production Anal. Populat. Genom. 888, 67–89.
Kirubakaran, T. G., Grove, H., Kent, M. P., Sandve, S. R., Baranski, M., Nome, T., et al. (2016). Two adjacent inversions maintain genomic differentiation between migratory and stationary ecotypes of atlantic cod. Mol. Ecol. 25, 2130–2143. doi: 10.1111/mec.13592
Kjeldsen, S. R., Raadsma, H. W., Leigh, K. A., Tobey, J. R., Phalen, D., Krockenberger, A., et al. (2018). Genomic comparisons reveal biogeographic and anthropogenic impacts in the koala (Phascolarctos cinereus): a dietary-specialist species distributed across heterogeneous environments. Heredity 122, 525–544. doi: 10.1038/s41437-018-0144-4
Klimley, A., and Holloway, C. (1999). School fidelity and homing synchronicity of Yellowfin Tuna, Thunnus Albacares. Mar. Biol. 133, 307–317.
Knutsen, H., Olsen, E. M., Jorde, P. E., Espeland, S. H., André, C., and Stenseth, N. C. (2011). Are low but statistically significant levels of genetic differentiation in marine fishes ‘biologically meaningful’? a case study of coastal atlantic cod. Mol. Ecol. 20, 768–783. doi: 10.1111/j.1365-294X.2010.04979.x
Koizumi, I., Yamamoto, S., and Maekawa, K. (2006). Decomposed pairwise regression analysis of genetic, and geographic distances reveals a metapopulation structure of stream-dwelling Dolly Varden charr. Mol. Ecol. 15, 3175–3199. doi: 10.1111/j.1365-294X.2006.03019.x
Kovach, R. P., Gharrett, A. J., and Tallmon, D. A. (2012). Genetic change for earlier migration timing in a pink salmon population. Proc. R. Soc. B: Biol. Sci. 279, 3870–3878. doi: 10.1098/rspb.2012.1158
Kunal, S. P., Kumar, G., Menezes, M. R., and Meena, R. M. (2013). Mitochondrial DNA analysis reveals three stocks of Yellowfin Tuna Thunnus Albacares (Bonnaterre, 1788) in Indian Waters. Conservation Genet. 14, 205–213. doi: 10.1007/s10592-013-0445-443
Lal, M. M., Southgate, P. C., Jerry, D. R., Bosserelle, C., and Zenger, K. R. (2017). Swept away: ocean currents and seascape features influence genetic structure across the 18,000 km Indo-Pacific distribution of a marine invertebrate, the black-lip pearl oyster Pinctada margaritifera. BMC Genom. 18:66. doi: 10.1186/s12864-016-3410-y
Lal, M. M., Southgate, P. C., Jerry, D. R., and Zenger, K. R. (2016). Fishing for divergence in a sea of connectivity: the utility of ddRADseq genotyping in a marine invertebrate, the black-lip pearl oyster Pinctada margaritifera. Mar. Genom. 25, 57–68. doi: 10.1016/j.margen.2015.10.010
Lehodey, P., Bertignac, M., Hampton, J., Lewis, A., and Picaut, J. (1997). El Nino southern oscillation and tuna in the Western Pacific. Nature 389, 715–718. doi: 10.1038/39575
Li, W., Chen, X., Xu, Q., Zhu, J., Dai, X., and Xu, L. (2015). Genetic population structure of thunnus albacares in the central pacific ocean based on MtDNA COI gene sequences. Biochem. Genet. 53, 8–22. doi: 10.1007/s10528-015-9666-9660
Matsumoto, W. M., Skiliman, R. A., and Dizon, A. E. (1984). Synopsis of biological data on skipjack tuna, katsuwonus pelamis. NOAA Tech. Rep. NMFS Circular 451:94.
Meirmans, P., and van Tienderen, P. (2004). GENOTYPE and GENODIVE: two programs for the analysis of genetic diversity of asexual organisms. Mol. Ecol. Notes 4, 792–794. doi: 10.1111/j.1471-8286.2004.00770.x
Menezes, M., Ikeda, M., and Taniguchi, N. (2006). Genetic variation in skipjack tuna Katsuwonus Pelamis (L.) using PCR-RFLP analysis of the mitochondrial DNA D-Loop region. J. Fish Biol. 68, 156–161. doi: 10.1111/j.1095-8649.2006.00993.x
Menezes, M., Noguchi, D., Nakajima, M., and Taniguchi, N. (2008). Microsatellite Development and survey of genetic variation in skipjack tuna katsuwonus pelamis. J. Fish Biol. 73, 463–473. doi: 10.1111/j.1095-8649.2008.01912.x
Monllor-Hurtado, A., Pennino, M. G., and Sanchez-Lizaso, J. L. (2017). Shift in tuna catches due to ocean warming. PLoS One 12:e0178196. doi: 10.1371/journal.pone.0178196
Moore, B. R., Adams, T., Allain, V., Bell, J., Bigler, M., Bromhead, D., et al. (2020a). Defining the stock structures of key commercial tunas in the pacific ocean ii: sampling considerations and future directions. Fish. Res. 230:105525.
Moore, B. R., Bell, J., Evans, K., Farley, J., Grewe, P., Hampton, J., et al. (2020b). Defining the stock structures of key commercial tunas in the pacific ocean i: current knowledge and main uncertainties. Fish. Res. 230:105525. doi: 10.1016/j.fishres.2020.105525
Mullins, R. B., Mckeown, N. J., Sauer, W., and Shaw, P. W. (2018). Genomic analysis reveals multiple mismatches between biological and management units in Yellowfin Tuna (Thunnus Albacares). ICES J. Mar. Sci. 75, 2145–2152. doi: 10.1093/icesjms/fsy102
Neuditschko, M., Khatkar, M. S., and Raadsma, H. W. (2012). NetView: a high-definition network-visualization approach to detect fine-scale population structures from genome-wide patterns of variation. PLoS One 7:e48375. doi: 10.1371/journal.pone.0048375
O’Leary, S., Puritz, J. B., Willis, S., Hollenbeck, C., and Portnoy, D. (2018). These aren’t the loci you’re looking for: principles of effective snp filtering for molecular ecologists. Mol. Ecol. 27, 3193–3206. doi: 10.1111/mec.14792
Pebesma, E. J., and Bivand, R. S. (2005). Classes and methods for spatial data in R. R News 5, 9–13.
Pecoraro, C., Zudaire, I., Bodin, N., Murua, H., Taconet, P., Díaz-Jaimes, P., et al. (2016). Putting all the pieces together: integrating current knowledge of the biology, ecology, fisheries status, stock structure and management of Yellowfin Tuna (Thunnus Albacares). Rev. Fish Biol. Fish. 27, 811–841. doi: 10.1007/s11160-016-9460-z
Pujolar, J. M., Jacobsen, M. W., Als, T. D., Frydenberg, J., Munch, K., Jónsson, B., et al. (2014). Genome-wide single-generation signatures of local selection in the panmictic European eel. Mol. Ecol. 23, 2514–2528. doi: 10.1111/mec.12753
Raj, A., Stephens, M., and Pritchard, J. K. (2014). FastSTRUCTURE: variational inference of population structure in large SNP data sets. Genetics 197, 573–589. doi: 10.1534/genetics.114.164350
Ren, R., Ray, R., Li, P., Xu, J., Zhang, M., Liu, G., et al. (2015). Construction of a high-density DArTseq SNP-Based genetic map and identification of genomic regions with segregation distortion in a genetic population derived from a cross between feral and cultivated-type watermelon. Mol. Genet. Genom. 290, 1457–1470. doi: 10.1007/s00438-015-0997-997
Richardson, B. J. (1983). Distribution of protein variation in Skipjack Tuna (Katsuwonus Pelamis) from the central and south-western pacific. Aus. J. Mar. Freshwater Resources 34, 231–251.
Richardson, B. J., and Habib, G. (1987). A genetic study of the origins and structuring of the skipjack tuna population exploited by the New Zealand fishery. N Z. J. Mar. Freshwater Res. 21, 109–116. doi: 10.1080/00288330.1987.9516205
Richardson, D. E., Marancik, K. E., Guyon, J. R., Lutcavage, M. E., Galuardi, B., Lam, C. H., et al. (2016). Discovery of a spawning ground reveals diverse migration strategies in Atlantic Bluefin Tuna (Thunnus Thynnus). Proc. Natl. Acad. Sci. U S A. 113, 3299–3304. doi: 10.1073/pnas.1525636113
Ryman, N., and Palm, S. (2006). POWSIM: a computer program for assessing statistical power when testing for genetic differentiation. Mol. Ecol. Notes 6, 600–602. doi: 10.1111/j.1471-8286.2006.01378.x
Sansaloni, C., Petroli, C., Jaccoud, D., Carling, J., Detering, F., Grattapaglia, D., et al. (2011). Diversity Arrays Technology (DArT) and next-Generation sequencing combined: genome-wide, high throughput, highly informative genotyping for molecular breeding of eucalyptus. BMC Proc. 5:54. doi: 10.1186/1753-6561-5-s7-p54
Schaefer, K. M., Fuller, D. W., and Block, B. A. (2007). Movements, behavior, and habitat utilization of Yellowfin Tuna (Thunnus Albacares) in the Northeastern Pacific Ocean, ascertained through archival tag data. Mar. Biol. 152, 503–525. doi: 10.1007/s00227-007-0689-x
Scutt Phillips, J., Gupta, A. S., Senina, I., van Sebille, E., Lange, M., Lehodey, P., et al. (2018). An individual-based model of Skipjack Tuna (Katsuwonus Pelamis) movement in the tropical pacific ocean. Prog. Oceanography 164, 63–74. doi: 10.1016/j.pocean.2018.04.007
Selwyn, J., Hogan, J., Downey-Wall, A., Gurski, L., Portnoy, D., and Heath, D. (2016). Kin-Aggregations explain chaotic genetic patchiness, a commonly observed genetic pattern, in a marine fish. PLoS One 11:e0153381. doi: 10.1371/journal.pone.0153381
Senina, I., Lehodey, P., Sibert, J., and Hampton, J. (2020). Integrating tagging and fisheries data into a spatial population dynamics model to improve its predictive skills. Can. J. Fish. Aquatic Sci. 77, 576–593. doi: 10.1139/cjfas-2018-470
Sharp, G. (1978). “Behavior and physiological properties of tunas and their effects on vulnerability to fishing gear,” in The Physiological Ecology of Tunas, eds G. D. Sharp and A. E. Dizon (New York, NY: Academic Press), 397–450.
Smoot, M. E., Ono, K., Ruscheinski, J., Wang, P. L., and Ideker, T. (2011). Cytoscape 2.8: new features for data integration and network visualization. Bioinformatics 27, 431–432. doi: 10.1093/bioinformatics/btq675
Steinberg, C. R., Choukroun, S. M., Slivkoff, M. M., Mahoney, M. V., and Brinkman, R. M. (2006). Currents in the Bismarck Sea and Kimbe Bay, Papua New Guinea. Australian Institute of Marine Science and The Nature Conservancy. Brisbane: The Nature Conservancy. TNC Pacific Island Countries Report No 6/06.
Steinig, E. J., Neuditschko, M., Khatkar, M. S., Raadsma, H. W., and Zenger, K. R. (2016). Netview p: a network visualization tool to unravel complex population structure using genome-wide SNPs. Mol. Ecol. Resources 16, 216–227. doi: 10.1111/1755-0998.12442
Tamura, K., Stecher, G., Peterson, D., Filipski, A., and Kumar, S. (2013). MEGA6: molecular evolutionary genetics analysis version 6.0. Mol. Biol. Evol. 30, 2725–2729. doi: 10.1093/molbev/mst197
Tanabe, T., Kayama, S., and Ogura, M. (2003). “Precise age determination of young to adult Skipjack Tuna (Katsuwonus Pelamis) with validation of otolith daily increment,” in Proceedings of the 16th Meeting of the Standing Commitee on Tuna and Billfish, (Mooloolaba, Aus).
Vincent, M., Pilling, G., and Hampton, J. (2019). Stock Assessment of Skipjack Tuna in the Western and Central Pacific Ocean. London: Pohnpei.
Walker, M., Kirschvink, J., Chang, S., and Dizon, A. (1984). A candidate magnetic sense organ in the Yellowfin Tuna. Thunnus Albacares. Sci. 224, 751–753. doi: 10.1126/science.224.4650.751
Wang, J. (2011). Coancestry: a program for simulating, estimating and analysing relatedness and inbreeding coefficients. Mol. Ecol. Resources 11, 141–145. doi: 10.1111/j.1755-0998.2010.02885.x
Wang, J. (2018). Effects of sampling close relatives on some elementary population genetics analyses. Mol. Ecol. Resources 18, 41–54.
Wang, J., Chen, X., and Chen, Y. (2016a). Spatio-Temporal distribution of skipjack in relation to oceanographic conditions in the west-central pacific ocean. Int. J. Remote Sens. 37, 6149–6164. doi: 10.1080/01431161.2016.1256509
Wang, J., Santiago, E., and Caballero, A. (2016b). Prediction and estimation of effective population size. Heredity 117, 193–206. doi: 10.1038/hdy.2016.43
Waples, R. S. (2016). Tiny estimates of the ne/n ratio in marine fishes: are they real? J. Fish Biol. 89, 2479–2504. doi: 10.1111/jfb.13143
Waples, R. S., and Anderson, E. C. (2017). Purging putative siblings from population genetic data sets: a cautionary view. Mol. Ecol. 26, 1211–1224. doi: 10.1111/mec.14022
Ward, R., Elliott, N., Innes, B., Smolenski, A., and Grewe, P. (1997). Global population structure of yellowfin tuna, thunnus albacares, inferred from allozyme and mitochondrial DNA variation. Fish. Bull. 95, 566–575.
Weir, B., and Cockerham, C. (1984). Estimating F-Statistics for the analysis of population structure. Evolution 38, 1358–1370. doi: 10.1111/j.1558-5646.1984.tb05657.x
White, T. A., Stamford, J., and Rus Hoelzel, A. (2010). Local selection and population structure in a deep-sea fish, the roundnose grenadier (Coryphaenoides rupestris). Mol. Ecol. 19, 216–226. doi: 10.1111/j.1365-294X.2009.04446.x
Wild, A., and Hampton, J. (1993). “A review of the biology and fisheries for Skipjack Tuna, Katsuwonus Pelamis,” in The Pacific Ocean” in Interactions of Pacific Tuna Fisheries. Papers on Bilogy and Fisheries, eds R. Shomura and J. Majkowski (Rome: FAO Fisheries Dept).
Keywords: Katswonus pelamis, skipjack tuna, population genetic structure, DArTseq, SNPs, Western Pacific, functional panmixia
Citation: Anderson G, Lal M, Stockwell B, Hampton J, Smith N, Nicol S and Rico C (2020) No Population Genetic Structure of Skipjack Tuna (Katsuwonus pelamis) in the Tropical Western and Central Pacific Assessed Using Single Nucleotide Polymorphisms. Front. Mar. Sci. 7:570760. doi: 10.3389/fmars.2020.570760
Received: 08 June 2020; Accepted: 23 November 2020;
Published: 18 December 2020.
Edited by:
Rodrigo Vidal, University of Santiago, ChileReviewed by:
Asaduzzaman Md, Chittagong Veterinary and Animal Sciences University, BangladeshClaudia Junge, Institute of Marine Research (IMR), Norway
Binh THuy Dang, Nha Trang University, Vietnam
Copyright © 2020 Anderson, Lal, Stockwell, Hampton, Smith, Nicol and Rico. This is an open-access article distributed under the terms of the Creative Commons Attribution License (CC BY). The use, distribution or reproduction in other forums is permitted, provided the original author(s) and the copyright owner(s) are credited and that the original publication in this journal is cited, in accordance with accepted academic practice. No use, distribution or reproduction is permitted which does not comply with these terms.
*Correspondence: Giulia Anderson, Z2l1bGlhYUBzcGMuaW50; Z2l1YW5kZXJzQGdtYWlsLmNvbQ==