 Pierre-Yves Hernvann1,2*
 Didier Gascuel2
 Arnaud Grüss3,4
 Jean-Noël Druon5
 Dorothée Kopp1
 Ilan Perez2,6
 Chiara Piroddi5
 Marianne Robert1
- 1Ifremer, STH, Lorient, France
- 2ESE, Ecology and Ecosystem Health, Institut Agro, INRAE, Rennes, France
- 3National Institute of Water and Atmospheric Research, Evans Bay Parade, Greta Point, Wellington, New Zealand
- 4School of Aquatic and Fishery Sciences, University of Washington, Seattle, WA, United States
- 5European Commission, Joint Research Centre (JRC), Ispra, Italy
- 6MARBEC, Univ. Montpellier, CNRS, Ifremer, IRD, S te, France
Both trophic structure and biomass flow within marine food webs are influenced by the abiotic environment and anthropogenic stressors such as fishing. The abiotic environment has a large effect on species spatial distribution patterns and productivity and, consequently, spatial co-occurrence between predators and prey, while fishing alters species abundances and food-web structure. In order to disentangle the impacts of the abiotic environment and fishing in the Celtic Sea ecosystem, we developed a spatio-temporal trophic model, specifically an Ecopath with Ecosim with Ecospace model, for the period 1985–2016. In this model, particular attention was paid to the parameterization of the responses of all trophic levels to abiotic environmental changes. Satellite remote sensing data were employed to determine the spatial distribution and annual fluctuations of primary production (PP). Spatial and temporal changes in the habitat favorable for zooplankton were predicted with a novel ecological-niche approach using daily detection of productivity fronts from satellite ocean color. Finally, functional responses characterizing the effect of several abiotic environmental variables (including, among others, temperature, salinity and dissolved oxygen concentration, both at the surface and at the bottom) on fish species groups’ habitat suitability were produced from the predictions of statistical habitat models fitted to presence-absence data collected by multiple fisheries-independent surveys. The dynamic component of our model (Ecosim) was driven by time-series of fishing effort, PP, zooplankton habitat suitability and abiotic environmental variables, and was fitted to abundance and fisheries catch data. The spatial component of our model (Ecospace) was constructed, for specific years of the period 1985–2016 with contrasted abiotic environmental conditions, to predict the variable distribution of the biomass of all functional groups. We found that fishing was the main driver of observed ecosystem changes in the Celtic Sea over the period 1985–2016. However, the integration of the environmental variability into the model and the subsequent improvement of the fit of the dynamic Ecosim component highlighted (i) the control of the overall pelagic production by PP and (ii) the influence of temperature on the productivity of several trophic levels in the Celtic Sea, especially on trophic groups with warm and cold water affinities. In addition, Ecospace predictions indicated that the spatial distributions of commercial fish species may have substantially changed over the studied period. These spatial changes mainly appeared to be driven by temperature and may, therefore, largely impact future fisheries given the continuity of climatic changes.
Introduction
Food webs govern the structure and functioning of marine ecosystems (Libralato et al., 2014) and are, therefore, typically modeled using trophodynamic models. However, marine ecosystems are far from being spatially homogeneous and the productivity of species at the base of the trophic network and prey-predator interactions can vary largely over space (Polis et al., 1997). This spatial variability determines the characteristics of food webs, including their stability and persistence (Huxel and McCann, 1998; Melian and Bascompte, 2002; Gravel et al., 2011).
The main driver of the spatial heterogeneity in prey-predator interactions in marine ecosystems is the abiotic environment (hereafter simply referred to as the “environment”). Environmental variables such as salinity, temperature and chlorophyll-a govern species distributions by defining their “environmental niche” (Hutchinson, 1957; Chase and Leibold, 2003). Hence, by regulating the degree of overlap between species niches, the environment largely influences species interactions and shapes communities and food-web structure along gradients (Pellissier et al., 2013; Kortsch et al., 2019). In addition, topography and the structural habitat play an essential role in the spatial variability of marine food webs. In particular, water depth greatly influences exchanges between the pelagic and benthic compartments of ecosystems through food accessibility (Giraldo et al., 2017; Agnetta et al., 2019). Seabed features (including substrate composition) and water column characteristics also mediate species interactions within marine ecosystems by influencing the accessibility of potential prey items to predators (Gardner, 1981), by providing refugia to the prey (e.g., Menge and Lubchenco, 1981) or by facilitating predation through aggregation (Le Fèvre, 1987).
The complexity of marine food webs is enhanced by the responses of predators to their prey, and by competition (Hunsicker et al., 2011). The feeding rate of any predator on a given prey depends on the abundance of that prey (Holling, 1959) and the relative preference of the predator for other co-occurring prey items (Murdoch, 1969). The spatial distribution of a predator can be substantially affected by the spatial distribution of its potential prey (Logerwell and Hargreaves, 1996; Torres et al., 2008), and vice versa (Barnett and Semmens, 2012), as well as by the spatial distribution of the other predators that compete for those prey (Hansson, 1984; Ward et al., 2001). Therefore, identifying the relative role of the drivers of the structure and functioning of marine ecosystems and their changes requires spatially-explicit ecosystem models where the spatial patterns of species biomass depend on both a specific environment and trophic interactions.
Spatially-explicit ecosystem models such as Atlantis (Fulton et al., 2004; Audzijonyte et al., 2019), OSMOSE (Shin and Cury, 2001) and Ecopath with Ecosim and Ecospace (Pauly et al., 2000; Christensen et al., 2014) simulate food-web functioning while representing the spatial distribution patterns of all ecosystem components. These spatially-explicit ecosystem models are powerful tools to disentangle the intricate effects of trophic relationships, the environment and anthropogenic stressors, e.g., fishing, on species distribution patterns and biomass flows within marine ecosystems. In the context of climate change, spatially-explicit food-web models that integrate predictions from statistical habitat or niche modeling approaches are particularly useful to predict how ecosystems may respond to future modifications in environmental conditions (Pellissier et al., 2013; Moullec et al., 2019a). However, such spatial food-web models are currently relatively scarce and these models have often difficulty to comprehensively represent heterogeneous spatial processes.
The Celtic Sea represents a large portion of the Western European continental shelf, and extends from the Western English Channel to the Celtic break delimiting Porcupine Sea Bight and the South-West of Ireland (Figure 1). This ecosystem has a complex spatial organization since it encompasses a broad range of depths and a diversity of substrate types, resulting in a variety of benthic habitats that host a wide diversity of species assemblages (Le Danois, 1948; Ellis et al., 2013, 2002; Martinez et al., 2013). This diversity of species assemblages is conducive to complex trophic interactions (Trenkel et al., 2005). In addition, the Celtic Sea is located at the interface of the Lusitanian and Boreal provinces, therefore defining the northern or southern limit of the distribution range of many species (Dinter, 2001). The presence of pelagic mesoscale structures such as productivity fronts (Pingree, 1980; Pingree et al., 1982) is another source of spatial heterogeneity in the Celtic Sea ecosystem. Ultimately, spatial heterogeneity in Celtic Sea fish communities is reflected by the highly mixed fisheries that operate in the Celtic Sea region (Sharples et al., 2013; Mateo et al., 2017; Dolder et al., 2018; Moore et al., 2019). Fishing has been identified as the primary driver of changes in the Celtic Sea ecosystem since 1950 and this pressure has culminated in the late 1990s (Gascuel et al., 2016; Hernvann and Gascuel, 2020; Mérillet et al., 2020). Nonetheless, long-term variability in hydro-climatic conditions has also largely affected the Celtic Sea ecosystem (Beaugrand et al., 2000; Hernvann and Gascuel, 2020) and the ongoing climate change may greatly impact the basal ecosystem production (McGinty et al., 2011), fish populations (Brunel and Boucher, 2007), and entire communities (ter Hofstede et al., 2010; Simpson et al., 2011) of the Celtic Sea.
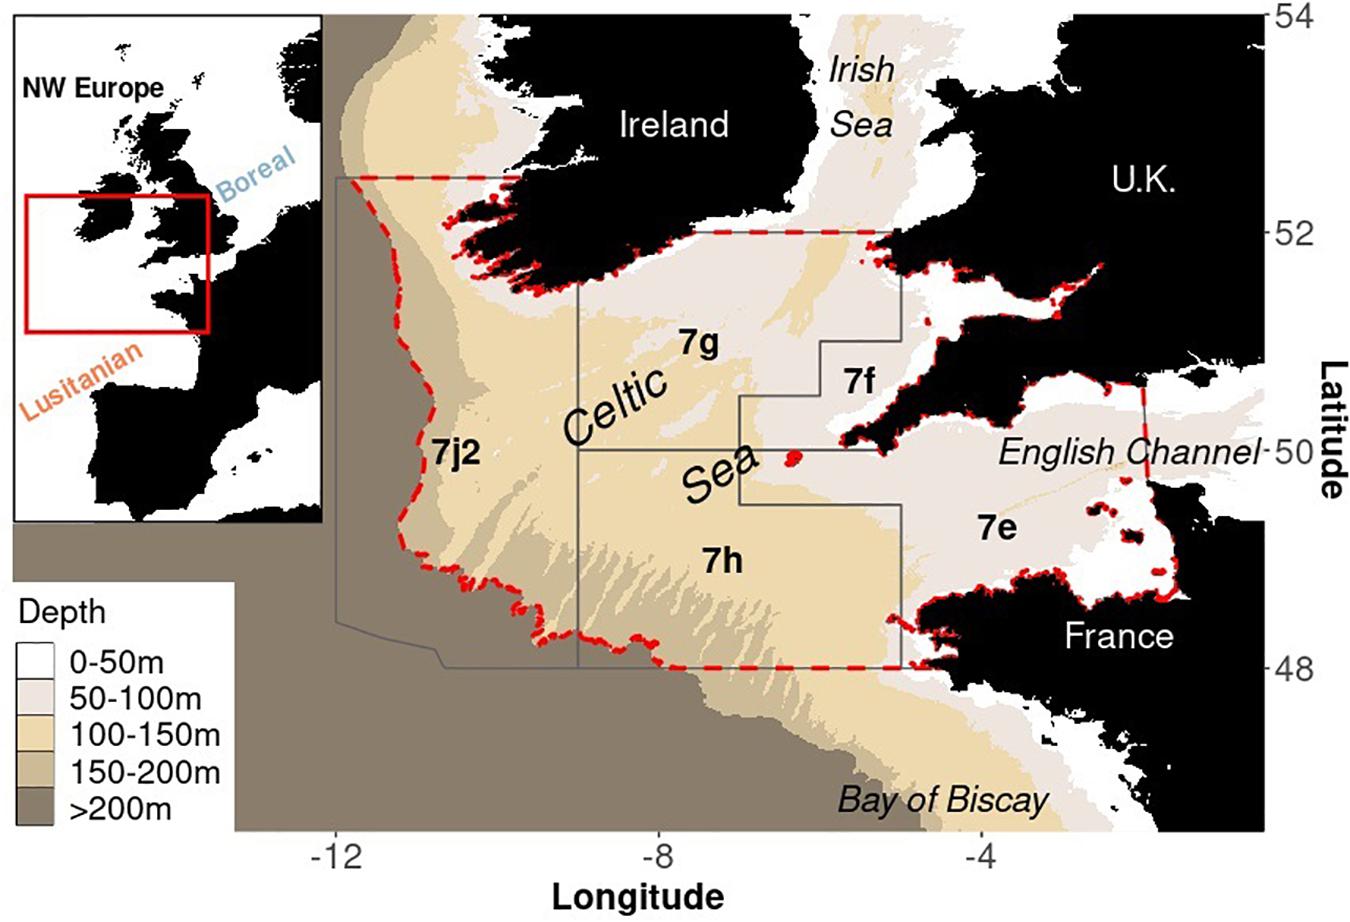
Figure 1. General location of the Celtic Sea (top left corner) and delimitation of the study area regarding physical and management boundaries. The Celtic Sea is located at the border between Lusitanian and Boreal provinces. The Celtic Sea EwE and Ecospace model (red dashed contour) is developed for the shelf area shallower than 200 m depth matching ICES divisions (polygons) 7.e (Western English Channel), 7.f (Bristol Channel), 7.g (Celtic Sea North), 7.h (Celtic South) and 7.j.2 (Southwest of Ireland- East belonging to the NE Atlantic Fisheries Commission regulatory area).
In this study, we analyzed the interdependent impacts of fishing and climate change on the structure and functioning of marine ecosystems using the Celtic Sea as a regional case study. We developed a spatially-explicit trophic model for the Celtic Sea to represent the effects of the environment on the distribution and productivity of functional groups, from phytoplankton to top predators. Multiple data types were considered for this aim. Spatio-temporal dynamics of plankton groups were represented in the spatially-explicit trophic model using the predictions of remote sensing based models. The responses of higher trophic level functional groups to changes in the environment were represented using the predictions of statistical habitat models, which were fitted to data from large scale survey and environmental databases. This overall information was used to calibrate the trophic model and determine how changes in primary production, zooplankton habitat and temperature may have interacted with fishing to shape the Celtic Sea food-web dynamics over the period 1985–2016. Then, the spatial structure and functioning of the Celtic Sea food web were analyzed for contrasted years in terms of environmental conditions to better understand the processes of changes in the Celtic Sea ecosystem over the studied decades.
Materials and Methods
The EwE Framework in a Nutshell and General Approach to Model the Trophic Functioning of the Celtic Sea
The EwE Modeling Framework in a Nutshell
Our approach relies on the Ecopath with Ecosim (EwE) framework (Pauly et al., 2000; Christensen and Walters, 2004). Hereafter, we only briefly summarize the EwE modeling steps since more details about the EwE framework and its main equations can be found in Christensen and Walters (2004) and are summed up in Supplementary Appendix SA.
Ecopath is the basal component of EwE, and provides a snapshot of the ecosystem of interest for a given period, i.e., generally a specific year. Ecopath represents the ecosystem of interest through functional groups (i.e., groups of species/taxa that have similar trophic and ecological niches and life-history characteristics) that exchange matter and energy through trophic relationships while the mass balance between the production of each functional group and all consumptions is assumed.
Ecosim is the dynamic module of EwE that allows for hindcast or forecast of changes in functional group biomasses. Ecosim predator-prey dynamics (under top-down or bottom-up control) are determined based on the foraging arena theory (Ahrens et al., 2012) whereby vulnerability coefficients modulate the proportion of prey biomass accessible to predators by altering predator consumption rates. Vulnerability coefficients can be estimated by fitting Ecosim to observed biomass, abundance or catch time-series. The response of the ecosystem to stressors can be simulated in Ecosim: (1) time-series of fishing effort or fishing mortalities can, respectively, drive exploited groups dynamics through top-down processes; (2) time-series of primary production can drive phytoplankton dynamics controlling bottom-up the food-web; and (3) environmental time-series can affect the consumption rates of predators according to linear response of following specific user-defined functional responses.
Ecospace is the spatial component of EwE, which predicts the spatial distribution of functional group biomasses over a horizontal 2-D grid (Walters, 1999; Pauly et al., 2000). The most recent version of Ecospace includes an habitat foraging capacity model that determines the suitability of each model grid cell for a functional group as the relative proportion of the cell over which the group can feed (Christensen et al., 2014). Each grid cell’s capacity is calculated as the product of functions that reflect the preferences of the group of interest for specific environmental parameter values.
General Approach of Integrated Trophic Modeling in the Celtic Sea
The Celtic Sea ecosystem was previously modeled by Moullec et al. (2017) using the Ecopath and Ecosim modules of EwE to represent its dynamics and fishing impact between 1980 and 2013. However, this model relied on a limited amount of fieldwork data and did not investigate the effect of any environmental driver and their spatial heterogeneity on ecosystem structure and functioning over this period. To improve the ecological realism of the Celtic Sea food-web model, we develop an integrated trophic modeling approach consisting in successively (i) updating the Ecopath model and integrating local trophic data to define trophic relationships, (ii) exploring spatio-temporal changes in the dynamic of plankton groups, (iii) investigating the environmental drivers of high trophic levels, including temperature, and studying their spatio-temporal changes, and (iv) integrating fishing and changes in temporal variation in environmental drivers of functional groups in the fit of the Ecosim model over the period 1985–2016 and using their spatial distribution to build the Ecospace model. The different steps of this integrated trophic modeling framework are displayed in Figure 2.
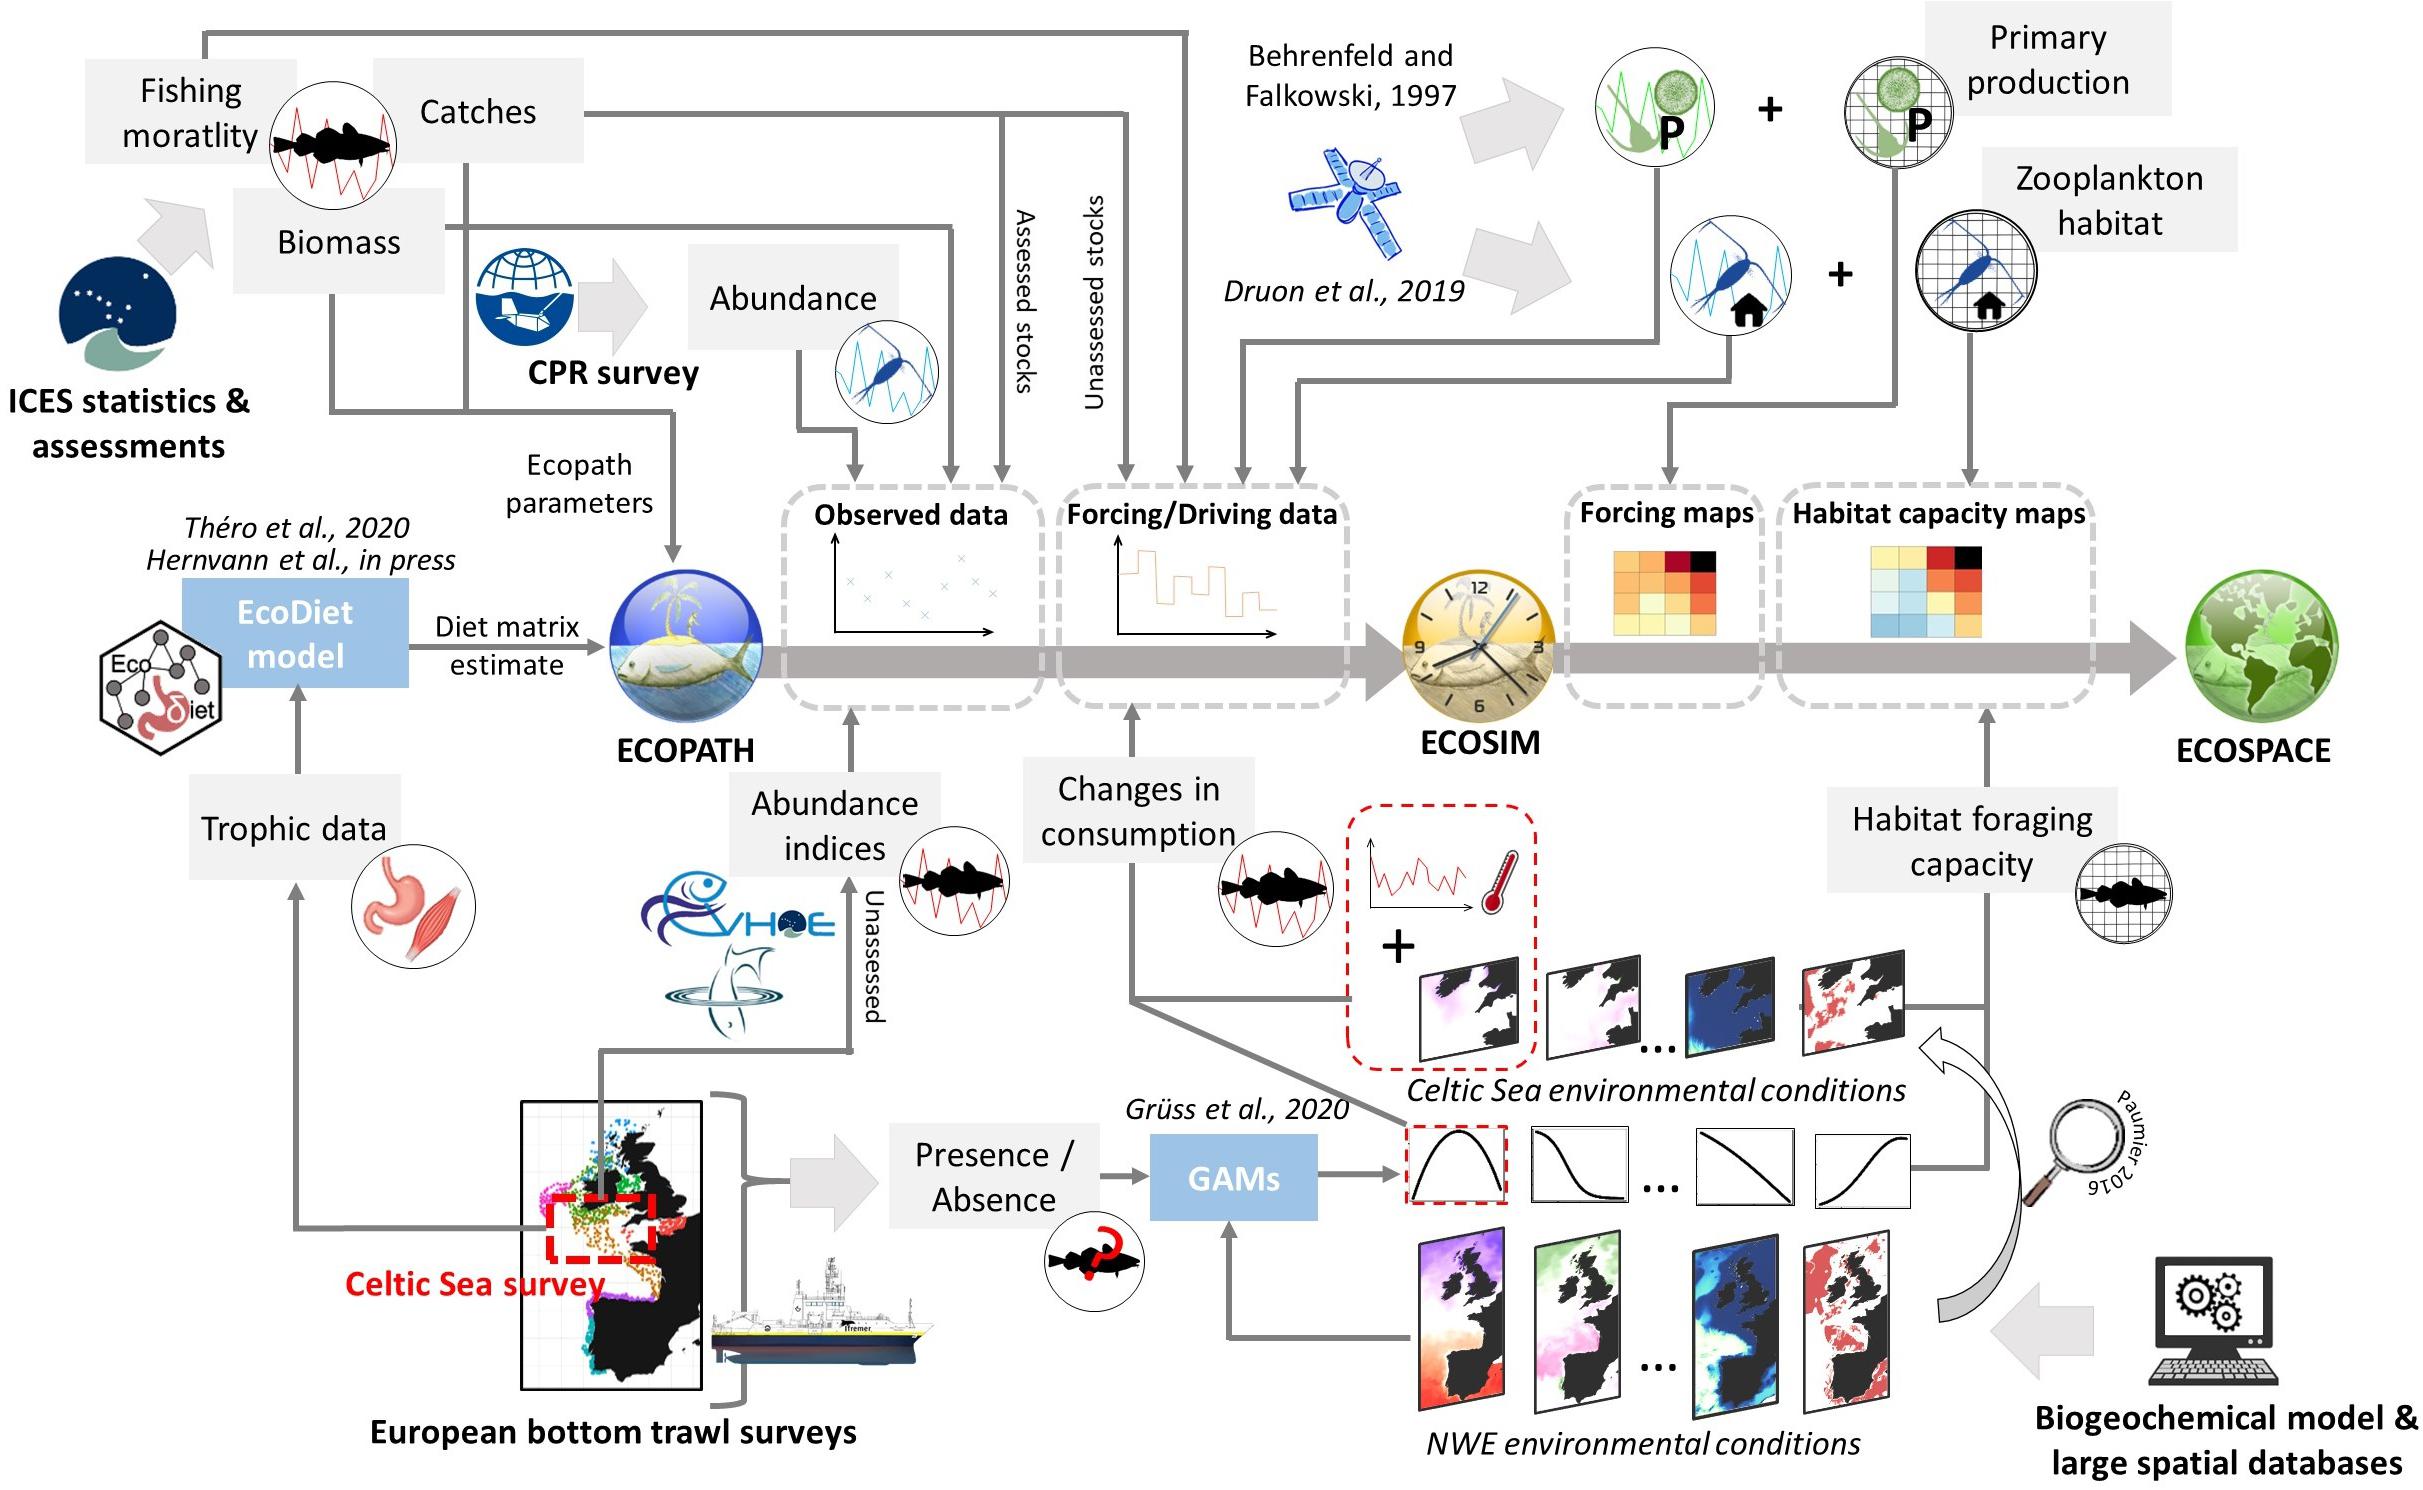
Figure 2. Schematic of the data integration framework used to build and calibrate the Ecopath with Ecosim (EwE) with Ecospace model. Gray rectangles represent data or EwE input. Blue rectangles correspond to statistical model runs to estimate EwE inputs from data.
Updating and Improving the Pre-existing Celtic Sea Ecopath Model
We updated the pre-existing Ecopath models for 2013 and 1980 (Moullec et al., 2017) and built a new Celtic Sea Ecopath model for the year 1985. The species composition of a few functional groups was refined for a greater coherence in the diet of the species they contain (see details in Supplementary Appendix SB). A major upgrade of the Celtic Sea model was the provision of a new diet matrix for the Ecopath model, estimated using the Bayesian integrated model “EcoDiet” and its R package implementation (Hernvann et al., in press; Théro et al., 2020)1 ,2. EcoDiet allows to simultaneously estimate diet proportions of all functional groups by integrating multiple data types, i.e., stomach content analyses, biotracer analyses and literature knowledge. Here, EcoDiet was applied to trophic analyses conducted on fish collected in the Celtic Sea during a fisheries-independent survey as part of the EATME project (Issac et al., 2017; Rault et al., 2017; Day et al., 2019), and information from an updated bibliographic search. The new model comprised a total of 50 single and multispecies functional groups, including exploited fishes and invertebrates, non-commercial benthic invertebrates (five groups), zoo- and phyto- plankton (four and two groups, respectively), and mammals and seabirds (four groups). Some of these functional groups were further split into younger and older life-stage groups (cod Gadus morhua, hake Merluccius merluccius, and anglerfish Lophius sp.) based on onthogenetic changes in diet identified by stomach content analyses (Issac et al., 2017; Day et al., 2019). Details on the Celtic Sea Ecopath model, its parameters, and the species it represents can be found in Supplementary Appendix SB. The validity of the 1985 Ecopath model was analyzed using the standard PREBAL diagnostics (Link, 2010; Supplementary Appendix SB).
Representing the Dynamics of Plankton Groups
Spatial-temporal changes in the production of phytoplankton groups (primary production, PP) were taken from the Vertically Generalized Production Model (VGPM, Behrenfeld and Falkowski, 1997) for the period 1998–2016, and from a regional application of hydrodynamic-biogeochemical NEMO-ERSEM to the European shelf (Baretta et al., 1995; Madec, 2008; Edwards et al., 2012; UK Met Office3 ) for the period 1985–1997. The VGPM model uses remote-sensed chlorophyll-a data collected by SeaWiFS and MODIS-Aqua to quantify PP over the entire water column (Morel and Berthon, 1989). PP is one of the direct outputs of the NEMO-ERSEM model and was extracted over the entire water column to align with the VGPM outputs. Data products were obtained from the Ocean Productivity website4 and the E.U. Copernicus Marine Environment Monitoring Service5 (eu), respectively. Time-series of PP in the Celtic Sea were used to force the productivity of phytoplankton groups in Ecosim (Christensen et al., 2009; Mackinson et al., 2009) while annual maps of primary productivity were used in Ecospace (Steenbeek et al., 2013). PP maps averaged by 5-year periods are provided in Supplementary Appendix SC.
The spatio-temporal changes of the suitable feeding habitat of zooplankton (small and large mesozooplankton, macrozooplankton) were estimated for the 1998–2016 period using a niche model of mesozooplankton in the North Atlantic (Druon et al., 2019). This zooplankton suitable habitat (ZSH) model relies on the identification of productivity fronts at mesoscale. Because these fronts persist long enough in the pelagic realm (at least 3 to 4 weeks), they allow the production of elevated biomass of mesozooplankton which, in turn, can sustain higher trophic level organisms. The mesozooplankton habitat model is fitted to data of the Continuous Plankton Recorder (CPR) and relies on remotely-sensed horizontal gradients of chlorophyll-a (SeaWiFS and MODIS-Aqua sensors). This habitat model only results of the daily observation of productivity fronts by satellite sensors, therefore the ZSH model is an algorithm that translates chlorophyll-a distribution directly into a daily habitat value. Seasonal maps of ZSH in the Celtic Sea are provided in Supplementary Appendix SC.
Linking the Dynamics of Higher Trophic Level Organisms to Environment
To characterize the response of higher trophic level organisms to environment, we determined functional relationships for 38 Ecopath groups (over 45 high trophic level groups, excluding mammals and birds, and benthic meiofauna) using the statistical habitat modeling approach developed by Grüss et al. (2020, 2018). This approach involved the following steps: (1) the construction of fisheries-independent survey and environmental databases; (2) the development of generalized additive models (GAMs); and (3) the use of the GAMs to estimate functional relationships.
Construction of Survey and Environmental Databases
For each functional group, presence/absence (encounter/non-encounter) data were collected by 13 International Bottom Trawl Surveys (IBTS; Cronne, 2016) conducted between 1987 and 2017 in European waters (Supplementary Appendix SD; ICES database)6. We allocated presence/absence data, collected by the surveys (only 3 surveys for 4 low TL benthic invertebrates groups; Supplementary Appendix SD), to a 0.125° spatial grid to address the issue of heterogeneity in sampling schemes (Grüss et al., 2020). A set of environmental variables were compiled for all of these grid cells. These environmental variables included time-invariant topographic and habitat variables: bathymetry, distance to the coast, and percentages of seabed substrate types. The environmental variables also included hydro-climatic time-varying variables: surface (first 10 m) and bottom sea temperature, salinity and dissolved oxygen concentration, and surface phytoplankton concentration. Spatial-temporal estimates of these variables for each grid cell at a monthly resolution were obtained from the General Bathymetric Chart of the Oceans (GEBCO)7, the European Marine Observation and Data Network (EMODnet)8, and the Copernicus platform. More details are provided in Supplementary Appendix SD.
GAM Fitting
The literature was screened to determine which of the variables included in the environmental database may influence the spatial distribution patterns of each functional group. This list was reduced through a collinearity analysis to avoid the selection of variables that are strongly correlated with one another together or with eastings and northings (longitude and latitude expressed in UTM coordinates) (Grüss et al., 2018). Then, for each functional group, we fitted binomial GAMs of the following form to the presence/absence data from the survey database (“mgcv” package in the R environment Wood, 2017):
where η is the probability of presence of the functional group; g is the logit link function between η and each predictor; te(X,Y) is a tensor product smooth fitted to eastings and northings that accounts for spatial autocorrelation at broad scale; x1, x2,…, xn are the predictors from the environmental database; s is a thin plate regression spline fitted to a given predictor and limited to four degrees of freedom for interpretability; and Survey and Year are treated as fixed-effect factors (Farmer and Karnauskas, 2013; Grüss et al., 2018). Only predictors with a significant effect (statistical criteria detailed in Supplementary Appendix SE) were kept in the GAMs, and the models were evaluated using the interactive cross-validation procedure described in Grüss et al. (2018). More details can be found in Supplementary Appendix SE.
Production of Preference Functions
Fitted GAMs were utilized to produce preference functions (also called functional reponses below) expressing for the preferences of each functional group for specific environmental parameter values. For each environmental variable i integrated in a GAM, predictions were made with the GAM over a vector of values ranging between the minimum and maximum values of environmental variable i in the Celtic Sea, while: (1) setting eastings X and northings Y at their values at the barycenter of the Celtic Sea; (2) keeping the other variables at their mean value from the GAM modeled dataset; and (3) setting the Survey and Year factors at their mode from the GAM modeled dataset. GAM predictions were then rescaled to provide preferences functions ranging between 0 and 1, which account for the relative effects of each environmental variable on the probability of presence of the functional group of interest. The procedure for rescaling follows Grüss et al., 2018 and is described in Supplementary Appendix SE.
Fitting Ecosim and Building Ecospace
Ecosim
The Ecosim model was first fitted to observed biomasses from available ICES stock assessments, abundance indices from scientific surveys for fish (EVHOE; Duhamel et al., 2018; UK-WCGFS, CEFAS), the CPR survey9 for plankton (Johns, 2019), and catch time-series (Statlant)10. Time-series of fishing mortality (for assessed stocks) or catch (for non-assessed stocks) were used as forcing functions. A summary of the time-series used is provided in Supplementary Appendix SF. Ecosim calibration was conducted using the stepwise fitting procedure implemented into EwE by Scott et al. (2016) and following the protocol found in Bentley et al. (2019) to determine the most suitable number of predator-prey dynamics parameters (vulnerabilities Vs) to estimate. To assess the relative impacts of fishing and environment on the ecosystem, we adopted an approach similar to the one developed by Mackinson (2014). We applied the fitting procedure, integrating fishing forcing functions only, then integrating the environmental drivers of plankton and fish dynamics, first separately and then simultaneously. PP and zooplankton suitable habitat (ZSH) time-series drove the production of phytoplankton groups (see Christensen et al., 2009) and the consumption of zooplankton (small and large mesozooplankton, macrozooplankton), respectively. More specifically, ZSH time-series were used as multiplier of the arena area for zooplankton-phytoplankton interactions, of zooplankton vulnerability for fish-zooplankton interactions, and of both parameters for zooplankton-zooplankton interactions (see Supplementary Appendix SF; Dahood et al., 2019). Temperature variations and corresponding preference functions to the model drove the consumption of fish groups (foraging environmental response; see Bentley et al., 2017; Serpetti et al., 2017; Corrales et al., 2018). In order to avoid any potential confounding effects with temperature-induced changes, that we precisely wanted to quantify in this study, we chose to not use the available information on recruitment anomalies (e.g., from stock assessments) as forcing function of the dynamics of functional groups represented by multiple life-stages. To quantify the relative contribution of each driver, the various fits of the models were compared using the sum of squares between observed and predicted time-series and the bias-corrected Akaike information criterion (AICc) of the model (Akaike, 1974). We addressed the uncertainty in Ecopath input parameters in Ecosim outputs through the Monte Carlo uncertainty routine based on confidence intervals determined from Pedigrees (Heymans et al., 2016; Steenbeek et al., 2018). More details on the fitting procedure can be found in Supplementary Appendix SF.
Ecospace
The fitted Ecosim scenario was run over the period 1985–2016, and the “Ecopath model from Ecosim” plug-in (Steenbeek et al., 2016) was employed to generate 6 Ecopath models corresponding to mean conditions over successive 5-year periods (from 1985–1989 to 2005–2010, and 2011–2016 for the last period). Ecospace models were built for each of the 5-year periods to facilitate the comparison of spatial distributions through time and run over a spin-up period of 5 years. The Ecospace models integrated the average maps of PP to force its distribution, those of ZSH to feed the distribution of habitat foraging capacity for zooplankton, and those of environmental variables employed in the GAMs and the associated preference functions of higher TL groups to spatially distribute fish habitat foraging capacities (Coll et al., 2016; Grüss et al., 2018, 2016). Trophic and diversity indicators (Table 1) were projected based on functional groups’ distributions, partly using the ECOIND plug-in (Coll and Steenbeek, 2017). This approach decoupling temporal and spatial changes will be further discussed in the Discussion section. Parameters of the Ecospace model are given in Supplementary Appendix SG.
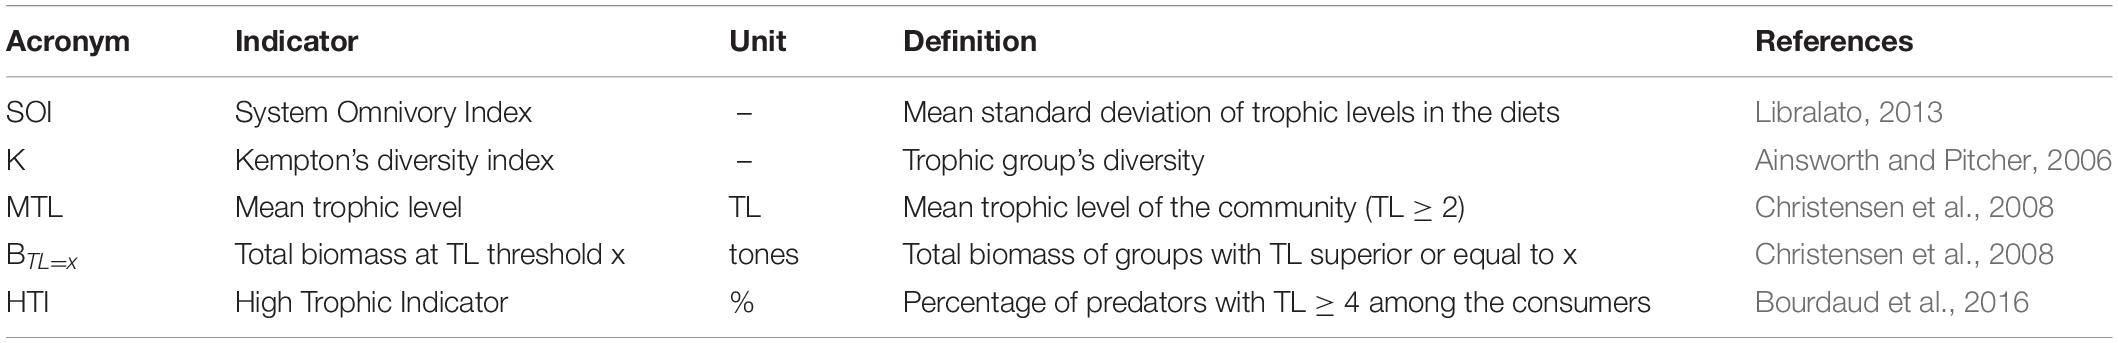
Table 1. Indicators used to analyze spatial changes in the Celtic Sea structure over the period 1985–2016.
Results
Improvement of Ecosim Model Fit and Relative Importance of Ecosystem Drivers
The statistically best model was obtained when trophic interactions, fishing, and environment were included together in the model fitting (SS = 340 and AICc = −3365, Table 2), hence improving the model fit by 86%. The proportions of each driver in the Sum of Square SS reduction suggest that fishing was the main driver of ecosystem changes, followed by trophic interactions and, with much lower but significant contributions, the environment (Table 2 and Figure 3). Temperature effects on higher trophic levels and overall changes in low trophic levels productivity had similar weight in the fit. Integrated independently from plankton data, temperature forcing especially increased the hindcast quality for species with thermal preferenda at outside the temperature ranged covered in the Celtic Sea (warmer or colder, Figure 3B). Conversely, PP and ZHS integration essentially led to a better fit for functional groups belonging to the pelagic pathway.
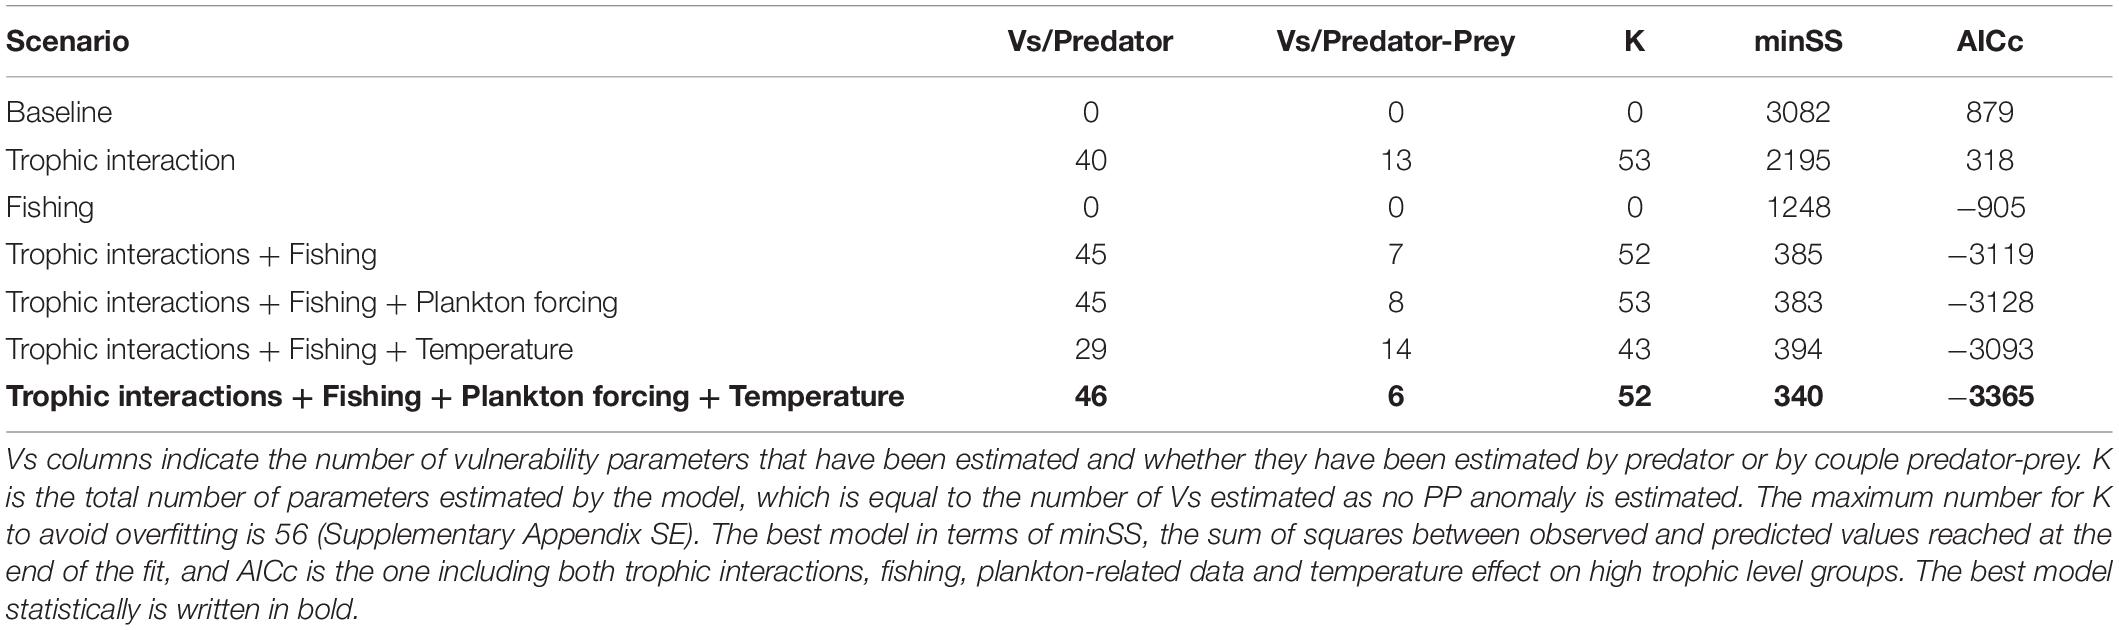
Table 2. Results of the Ecosim fitting procedure.
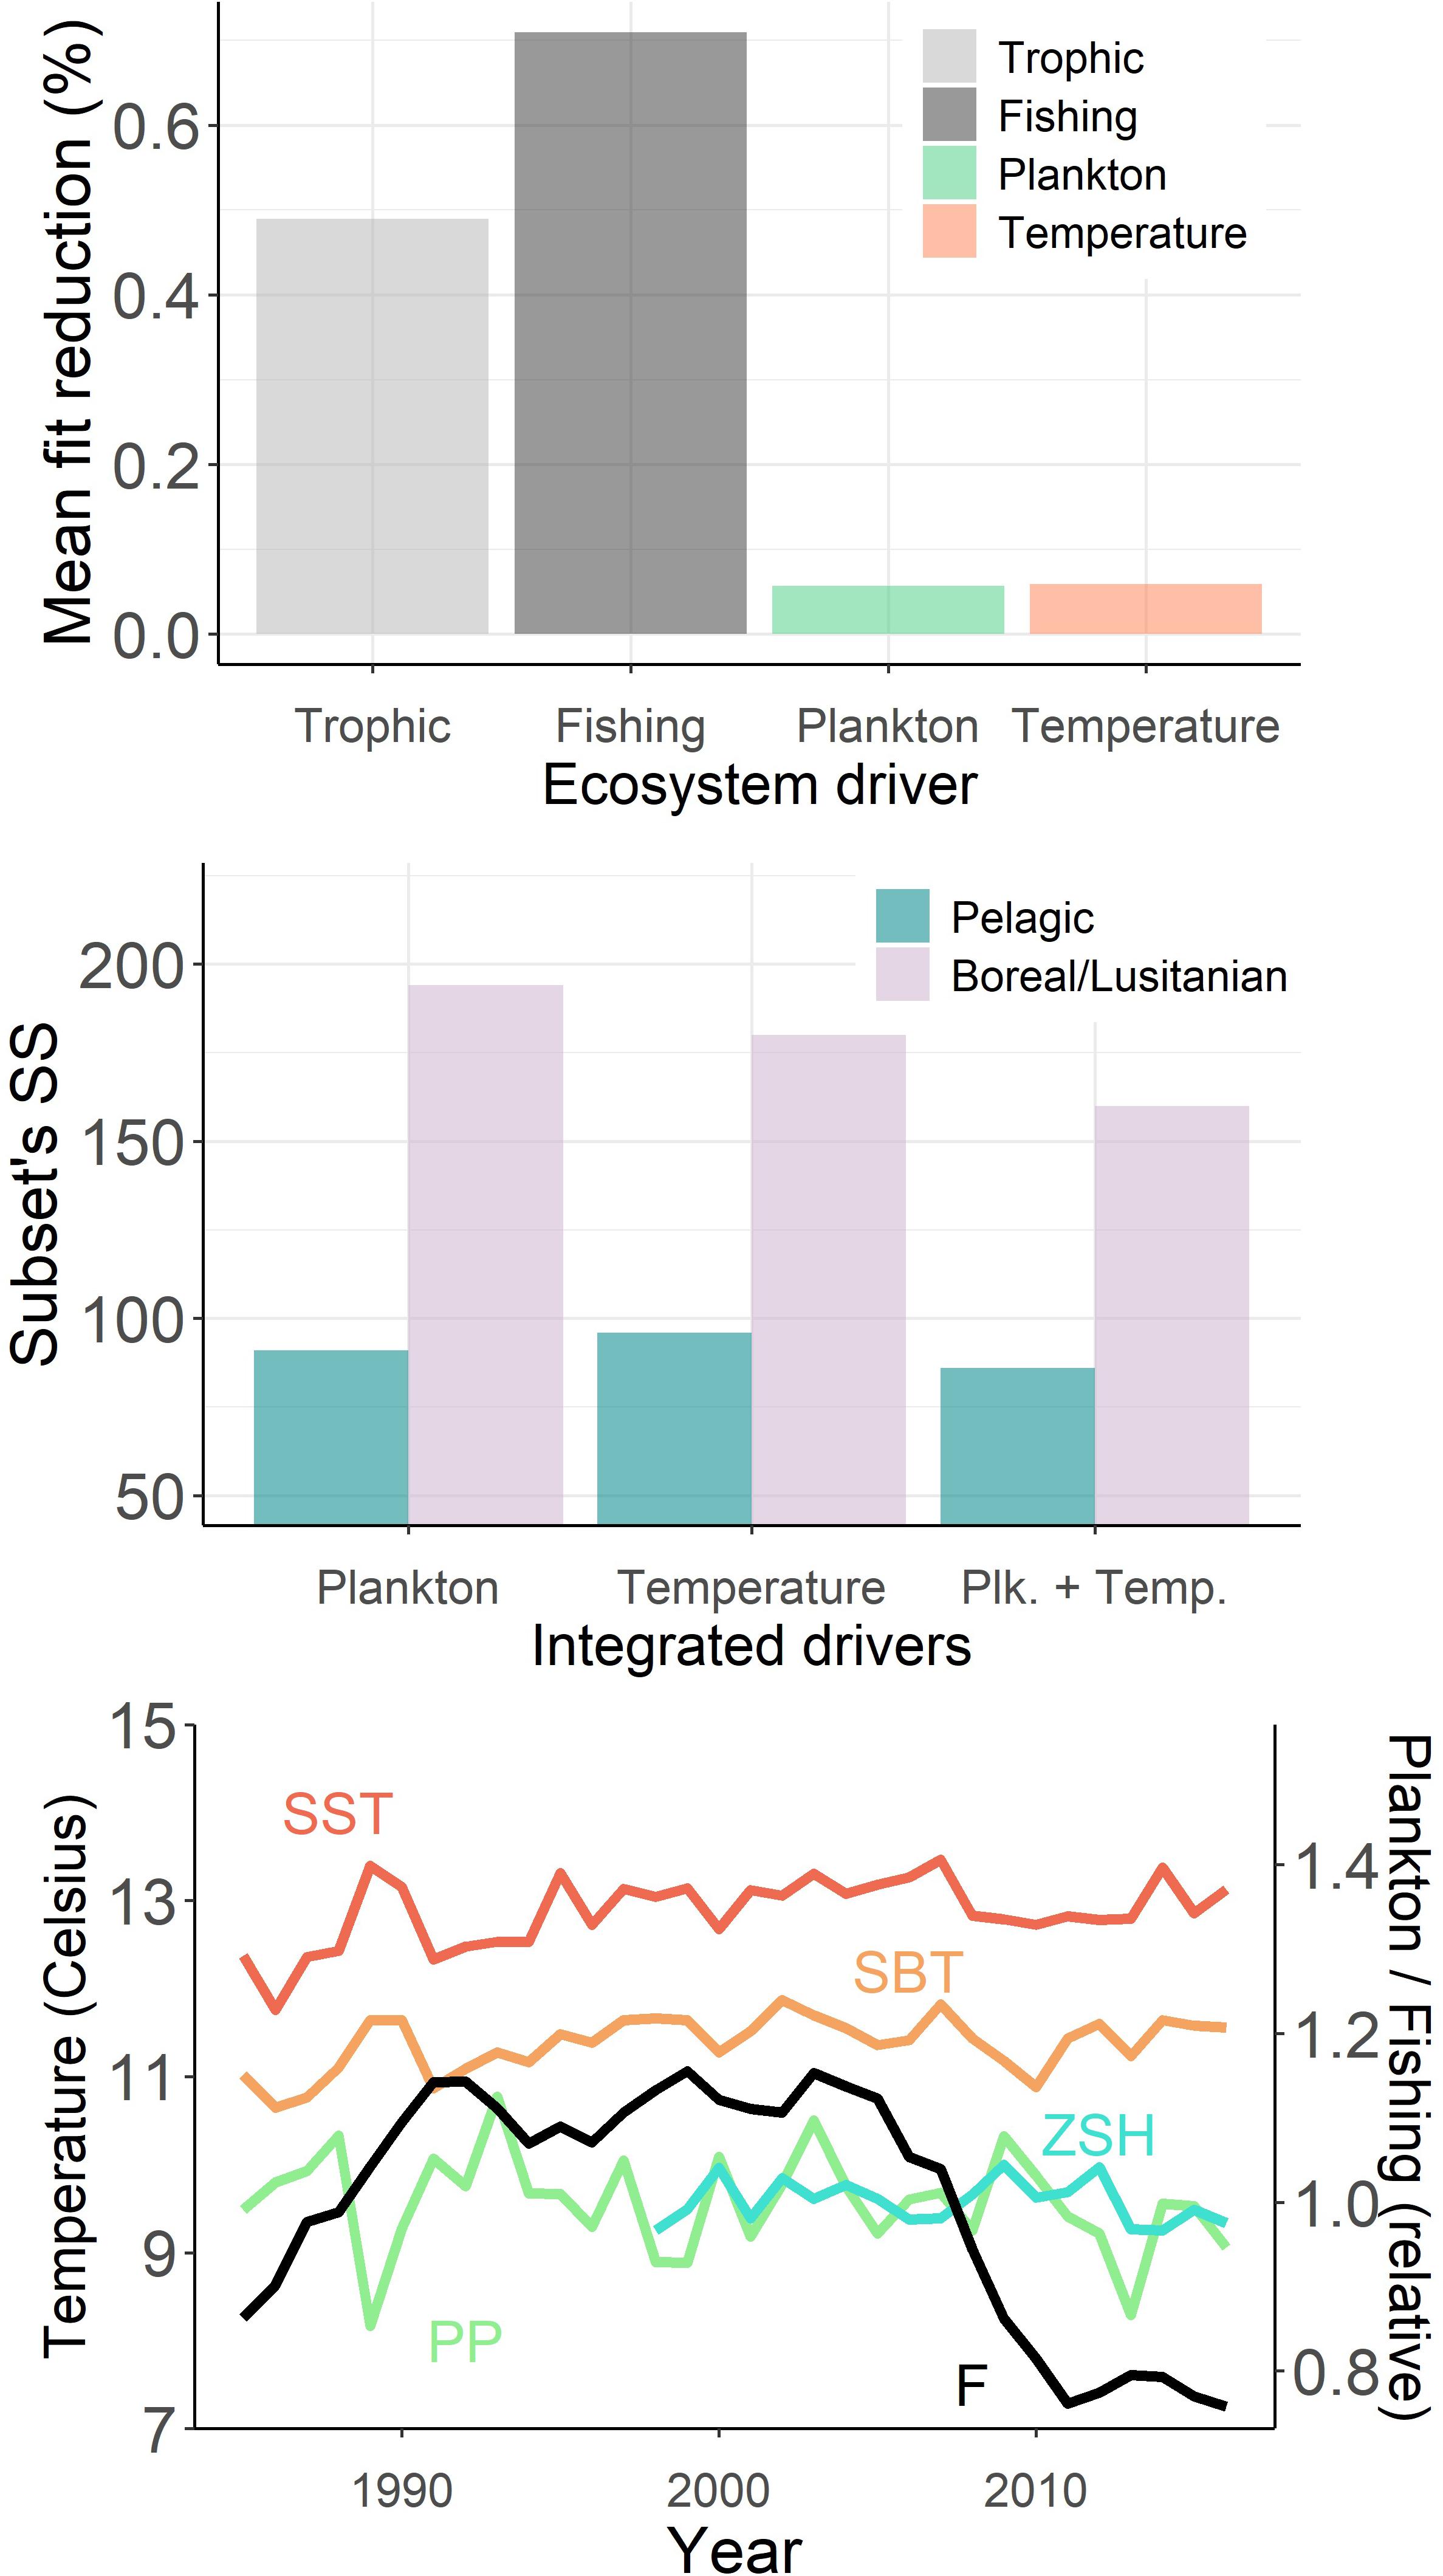
Figure 3. Changes in the temporal fit of the Ecosim model: (A) mean gain in the Sum of Square (SS) when integrating each driver in the fitting procedure: “Trophic” when estimating the vulnerabilities, “Fishing” when integrating fishing mortality time-series and forced catches, “Plankton” when integrating primary production (PP) and zooplankton suitable habitat (ZSH), “Temperature” when integrating sea surface temperature (SST) and sea bottom temperature (SBT) – Plankton and Temperature data were integrated only in the models accounting for Trophic interactions and Fitting;. (B) Changes in the SS for pelagic species and species with temperature optimum outside the Celtic Sea temperature range according to the different environmental drivers integrated in the fit. (C) Trends in the forcing variables – F is the mean fishing mortality time-series for stocks under assessment.
Predicted Historical Trends for Functional Groups Abundance
Low Trophic Levels
With regard to the basal productivity in the Celtic Sea ecosystem, no clear trend was apparent in the Ecosim model over the period 1985–2016. Despite this relative stability, some differences can be observed in CPR time-series within the phytoplankton community. Most significant changes in observed phytoplankton data occurred during the late 1980s when the abundance of large phytoplankton (diatoms and dinoflagellates) dropped whereas the one of small phytoplankton increased (Figure 4). However, the trends for both large phytoplankton and small phytoplankton were not correctly captured by Ecosim and remained overall constant over the entire period 1985–2016 in the model.
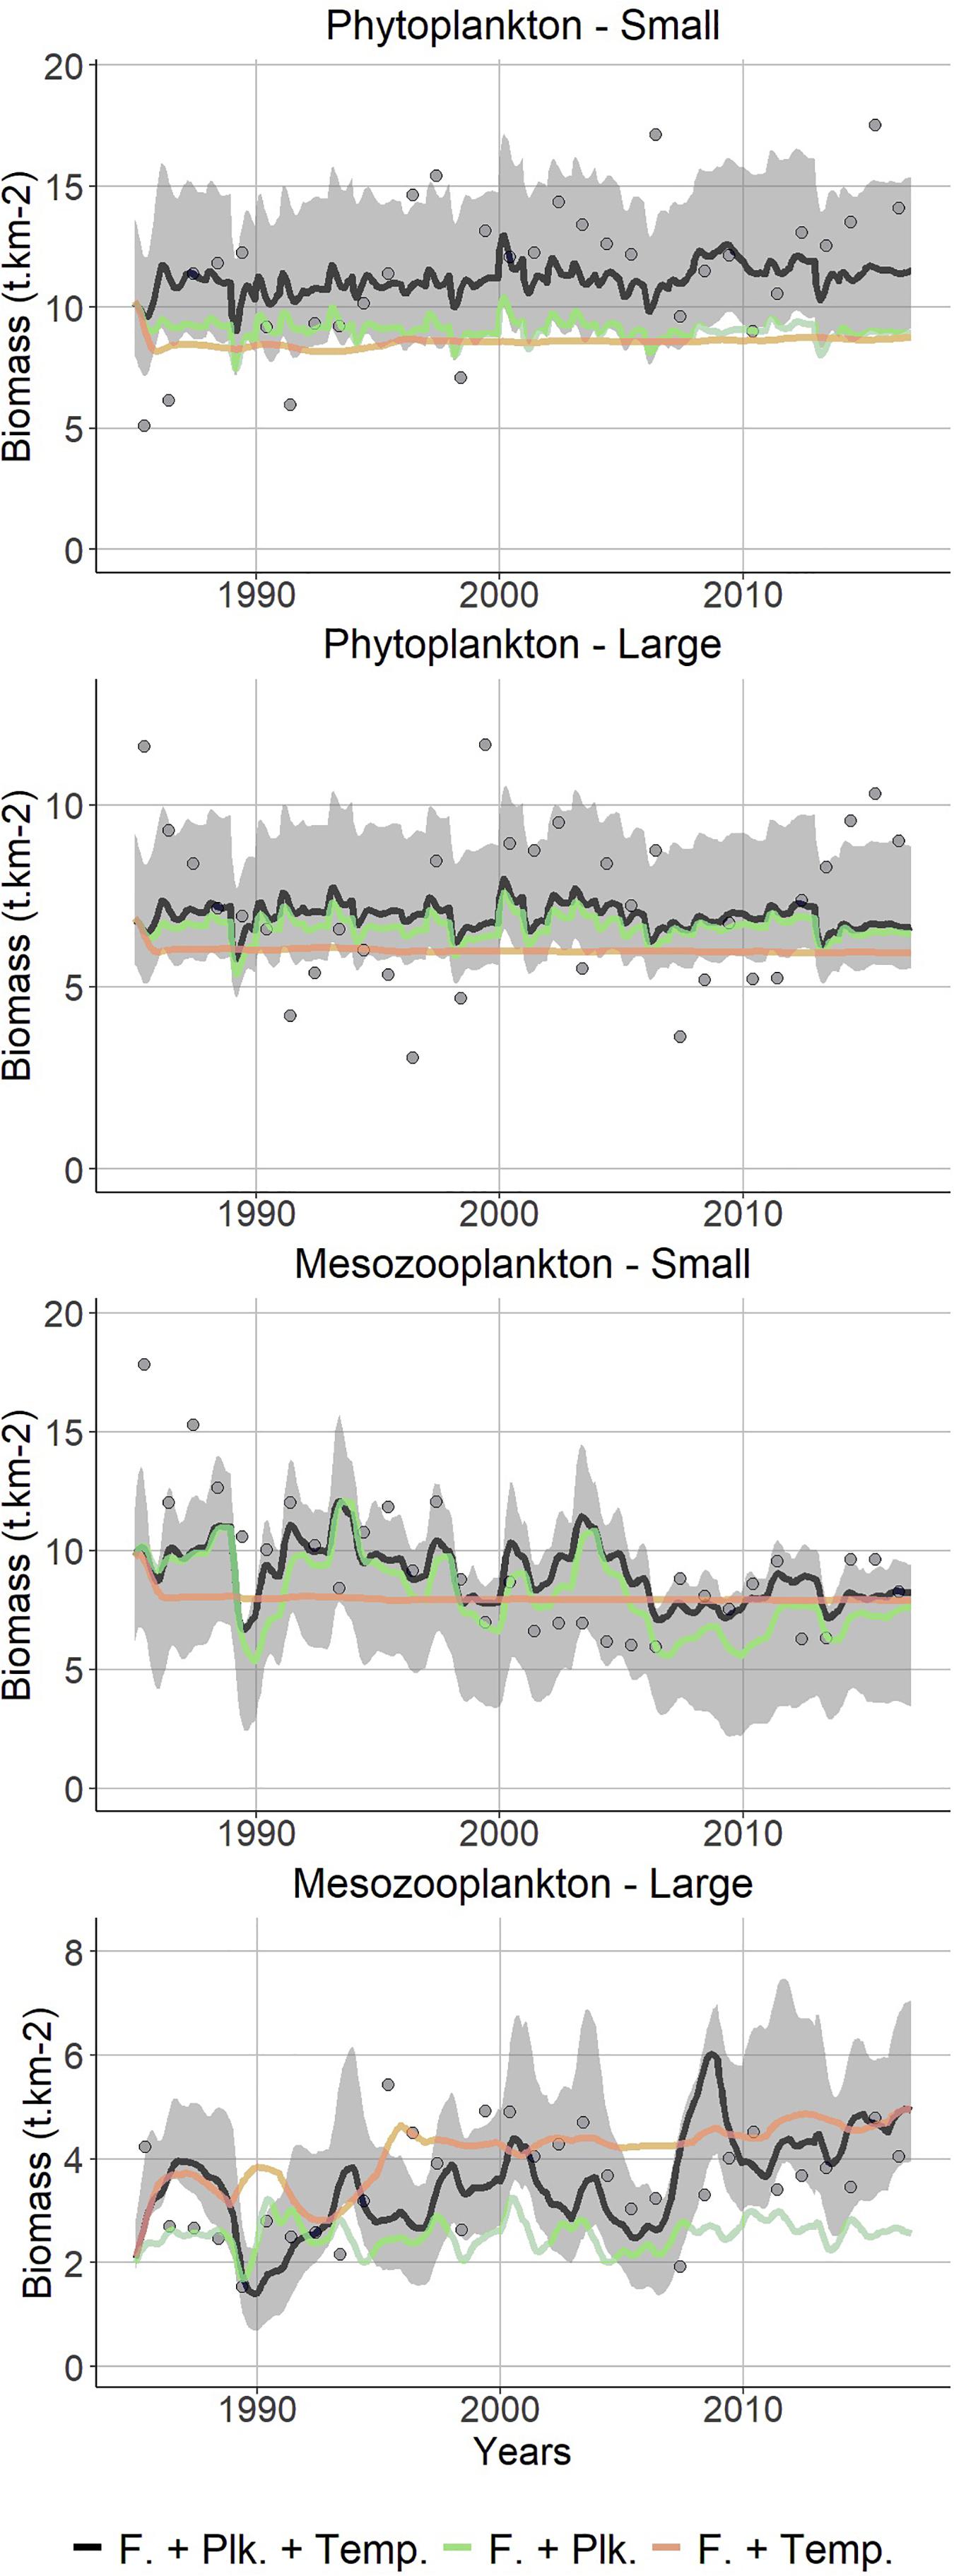
Figure 4. Observed (points; CPR) vs. predicted (lines; Ecosim) changes in the plankton community of the Celtic Sea over the period 1985–2016. Black line: best fitted model, including trophic interactions, fishing, PP, ZSH and temperature; green line: with integration of PP and ZSH but without temperature forcing; orange line: with integration of temperature forcing but without PP and ZSH. The gray shaded area is delimited by the 95% intervals of the Monte Carlo runs that propagate the uncertainty on Ecopath input parameters to Ecosim. The points correspond to observed time-series used during Ecosim calibration.
Similarly to PP, the ZSH remained stable over the study period, yet, looking at the data, substantial changes were observed within the zooplankton community, mostly during the late 1980s. When PP and ZSH were integrated, Ecosim reproduced the overall observed trend in small mesozooplankton abundance, which substantially declined before 1990 and was still decreasing until the mid-2000s. By contrast, large mesozooplankton abundance tended to increase over the period 1985–2016. Again for this zooplankton group, the trend predicted by Ecosim correctly matched observations both in terms of trend and of amplitude of variations. Both trends and interannual variability in zooplankton abundance were not captured when PP and ZSH were not included in the fit (Figure 4). The stability in the predicted phytoplankton time-series precludes us from linking changes in mesozooplankton abundance with changes in primary productivity in the Celtic Sea between 1985 and 2016. Although Ecosim was able to correctly predict the overall zooplankton abundance level over the study period, the predictions did not perfectly match the observed patterns, especially at the beginning of the time-series.
Higher Trophic Levels
The observed time-series of biomass, abundance and catch of most of high trophic level groups were satisfactorily reproduced by Ecosim. Overall, Ecosim predictions were better for those single-species groups for which stock assessments are carried out than for multispecific fish groups, and they were less consistent for exploited invertebrate groups.
In 1985, main target species such as large Gadiformes [e.g., hake, cod, whiting (Merlangius merlangus), haddock (Melanogrammus aeglefinus)], large flatfish species [i.e., sole (Solea solea), plaice (Pleuronectes platessa)], anglerfish, megrim (Lepidorhombus whiffiagonis), sea bass (Dicentrarchus labrax), other large piscivorous demersal fish [e.g., saithe (Pollachius virens), ling (Molva molva), pollock (Pollachius pollachius), turbot (Psetta maxima), conger (Conger conger)] and forage fish [i.e., herring (Clupea harengus), mackerel (Scomber scombrus), horse mackerel (Trachurus trachurus)] were already subject to high fishing mortality that far exceeded natural losses. Driven by an increase in fishing mortality, the biomass of most of these groups declined between 1985 and the mid-2000s while their catches simultaneously stabilized or decreased. In 2005, their fishing mortality decreased and Ecosim predicted a stabilization of their abundance that preceded a progressive recovery from 2010 onward (Figure 5).
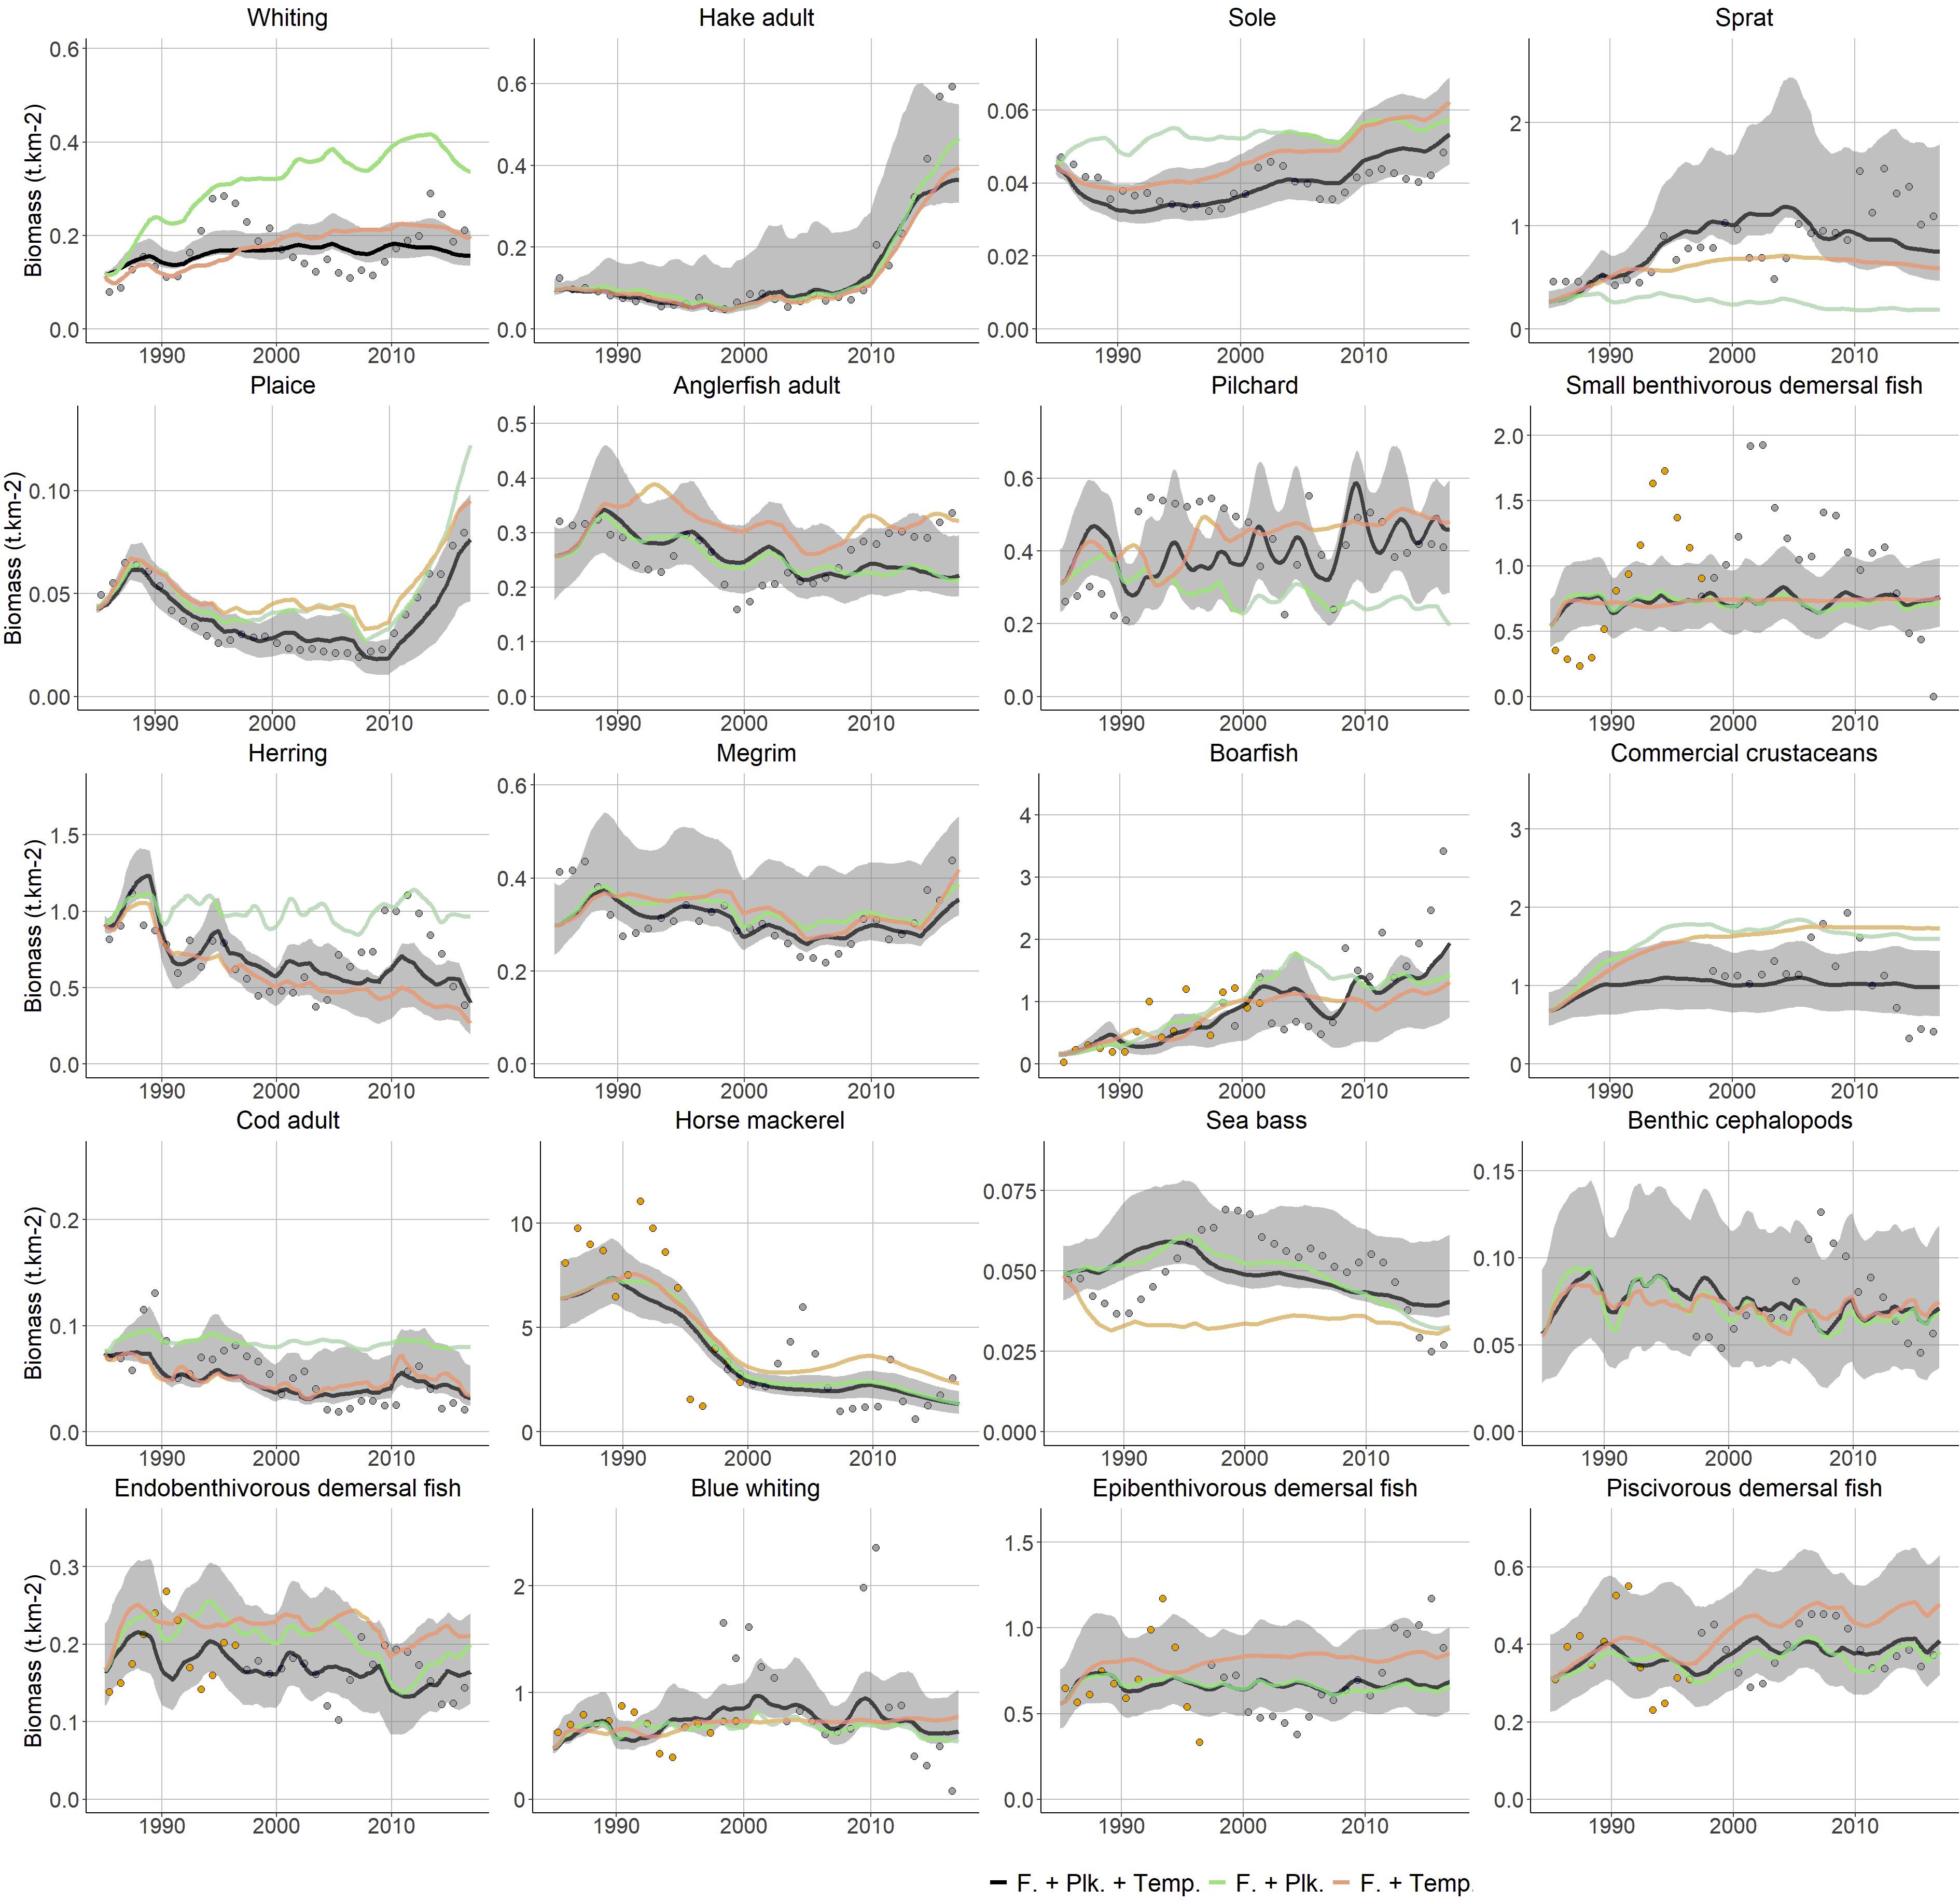
Figure 5. Fitted biomass trends from the Ecosim model for a selection of demersal and pelagic fish species. Black line: best fitted model, including trophic interactions, fishing, PP, ZSH and temperature; green line: with integration of PP and ZSH but without temperature forcing; orange line: with integration of temperature forcing but without PP and ZSH. The gray shaded area is delimited by the 95% intervals of the Monte Carlo runs that propagate the uncertainty on Ecopath input parameters to Ecosim. The color points indicate the different time-series of observed data during Ecosim calibration.
The pressure exerted on species that were initially less exploited such as smaller flatfish (i.e., endobenthivorous), medium demersal fish (i.e., epibenthivorous), or cephalopods increased after 1985. Concomitantly, the natural mortality exerted on these species decreased as a result of the depletion of highly commercial groups such as large predatory fish (e.g., hake, cod, whiting, megrim). The predicted biomass trends of lower TL fish and invertebrates varied according to their exploitation patterns (Figure 5). Dramatic changes in the composition of the pelagic community were also predicted by Ecosim. In parallel to horse mackerel depletion, the biomass of pelagic fishes that feed upon similar ressources such as suprabenthivorous fish, sprat (Sprattus sprattus) or boarfish (Capros aper) increased, while these pelagic fishes were initially almost absent from the Celtic Sea ecosystem.
The recovery of commercial species in the 2010s is noticeable, particularly the large increases in the biomasses of large predators, including hake (whose biomass increased 5-fold) and a few other species. According to the model, these species recoveries translated into an increase in predation pressure from large predators and a decline in the abundance of cephalopods, small pelagic and small demersal fish.
The rising temperatures resulting from climate forcing had various effects on the different species represented in the model, and they mainly impacted fish productivity during the mid-1990, when a substantial increase in both surface and bottom temperatures was observed. As highlighted by the comparison of model’s fit on observed data according to scenarios (Figures 3B, 5), the integration of temperature forcing allowed to better capture the overall trends in the abundance of Boreal and Lusitanian species. The foraging ability of Boreal species, including cod, plaice, whiting, herring and endobenthivorous demersal fish, dropped at the same time that fishing mortality increased, and this accentuated the depletion of the above-mentioned species. Conversely, for Lusitanian species that have warmer thermal preferences, such as sardine, boarfish, hake and cephalopods, increased productivity in the Celtic Sea ecosystem in the 1990s acted antagonistically to the increasing fishing pressure and synergistically with decreasing competition pressure. The differential trends in the productivity of warm and cold water affinity species between the start and the end of the study period were responsible for differences in the recovery capacities of commercial groups in the 2010s. For instance, cod biomass remains quite stable when temperature is not driving productivity, and plaice recovers much slower from fishing pressure release. Conversely, sole depletion in the first part of the time-series is stronger as its recovery is strengthened (Figure 5). These variations triggered changes in the fish assemblages. Interannual variability in high trophic level abundance was better reproduced when incorporating PP and ZSH data, especially for pelagic species (Figure 5).
Predicted Spatial Distribution of Food-Web Components in the Celtic Sea
Habitat Projection for the Celtic Sea
Evaluation tests suggested that GAMs (Supplementary Appendix SE) were good enough to produce yearly foraging habitat maps for the 38 higher trophic level functional groups (year 2016, Supplementary Appendix SE). The tests also indicated that GAM fits and predictive capacities were better for monospecific groups than for heterogeneous multispecies groups. The fit was also lower when the sampling gear employed during the surveys was not adapted to a given functional group (e.g., benthic invertebrates). The type of environmental predictors retained in final GAMs varied across functional groups, as their number, ranging from 3 for the non-commercial invertebrate groups to 9 for hake. The preference functions estimated from fitted GAMs exhibited diverse shapes. The retained predictors often included bathymetry (32 groups) and temperature (surface or bottom; 35 groups), two variables of importance in shaping the Celtic Sea environment. Depth in the Celtic Sea drove marked northeast-southwest gradients, while surface temperature led to pronounced latitudinal gradients and bottom temperature resulted in two opposed pools of warm and cold waters in the English and Bristol Channel and in southern Ireland.
Salinity functional responses quantify habitat suitability in the riverine-influenced Bristol Channel. When they were retained in final GAMs, seabed substrate variables resulted in patchy predicted habitats for demersal species. In those instances, it was possible to make a clear distinction between restricted areas of rocky or mixed substrate and large irregular strands of muddy, sandy or coarse sediments. The other environmental variables considered in the present study were less frequently retained in final GAMs. Habitat foraging capacity maps for the period 1985–1989 are provided in Supplementary Appendix SE.
Predicted Biomass Distributions
The Ecospace model predicted the biomass distribution of all components of the ecosystem, from the phytoplankton to top predators. The biomass distributions of functional groups reflected the overall habitat foraging capacities of these groups, hence their ecological niche, but were also influenced by their trophic interactions with prey, predators and competitors (Figure 6).
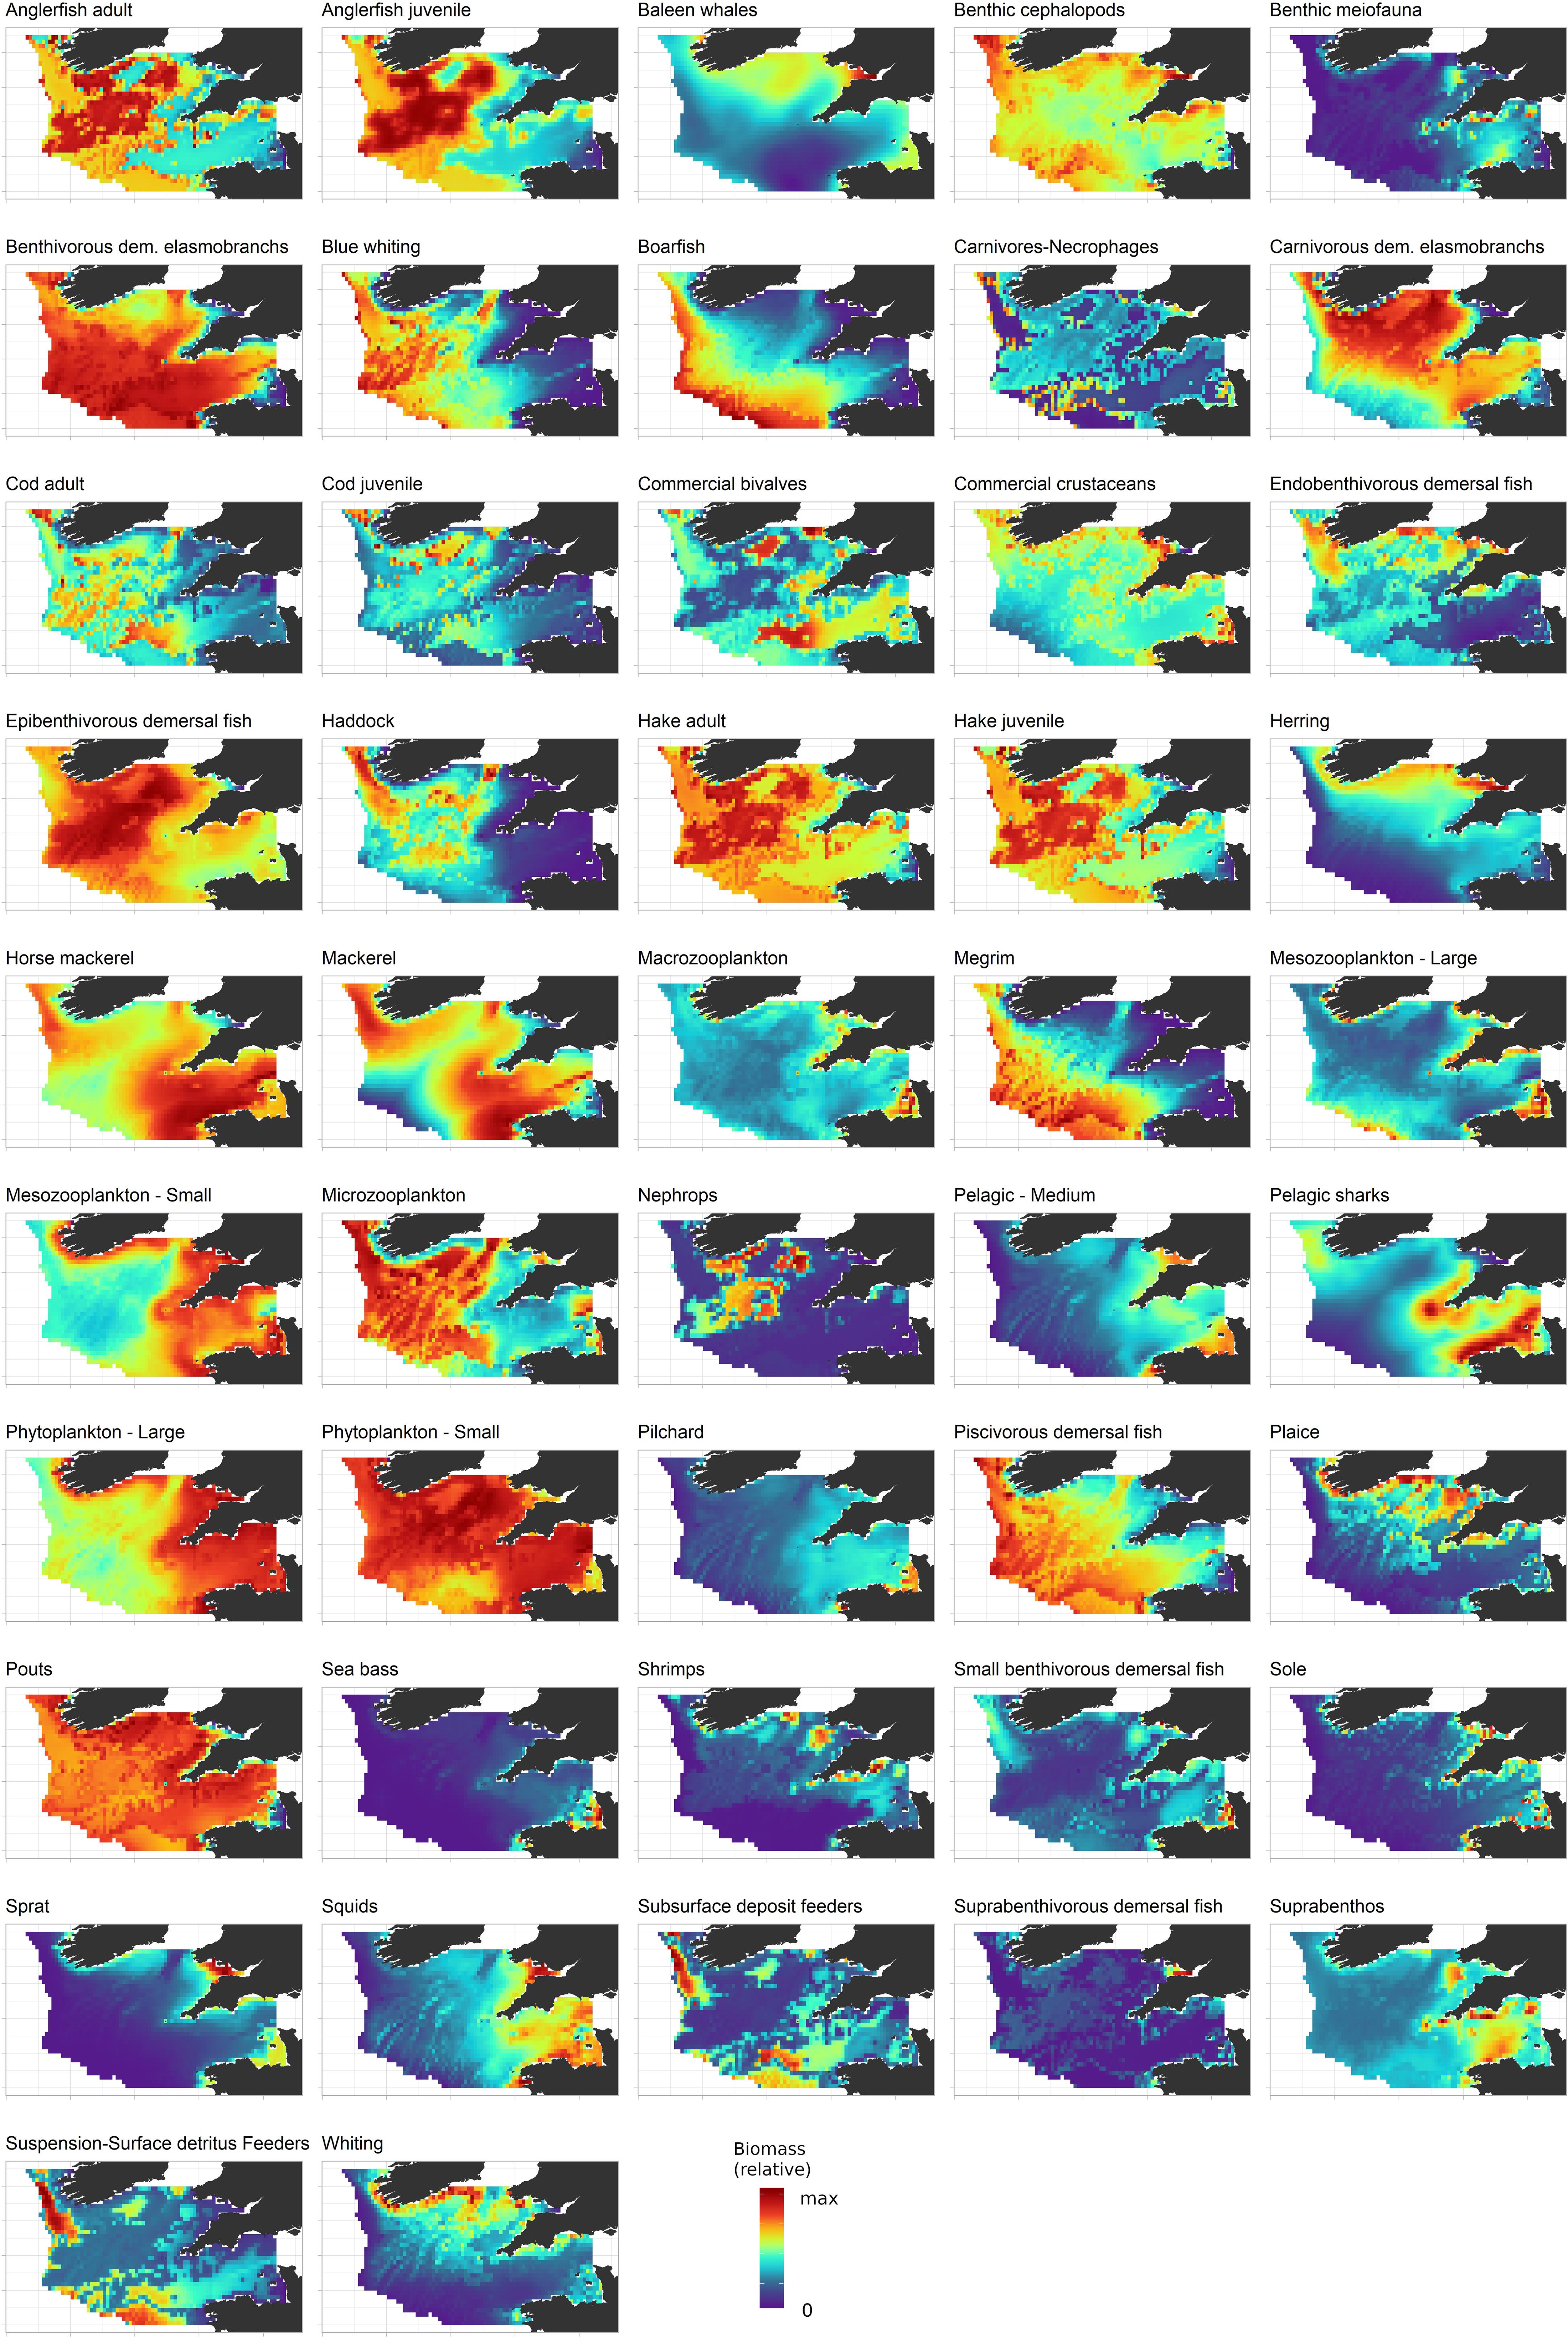
Figure 6. Predicted biomass distribution in 2016 for functional groups for which statistical habitat models (generalized additive models) were developed. Biomass is represented in relative units, i.e., scaled on the highest density predicted in the Celtic Sea. The color scale represents the relative abundance of the considered group, from zero (blue) to the maximum (red).
The distributions of those functional groups for which no GAM was developed were estimated by Ecospace only according to their feeding relationships (birds, mammals, bacteria, benthic meiofauna, large pelagic fish). A wide variety of spatial patterns were exhibited by the functional groups represented in Ecospace. Due to their high mobility in the water column and their eurythermic characteristics, horse mackerel and mackerel were predicted to be the most widely distributed monospecific groups in the Celtic Sea ecosystem (Figure 6). Other fish groups that were predicted to occupy a large fraction of the Celtic Sea were multispecific groups such as benthivorous elasmobranchs, epibenthivorous demersal fish, pouts (Trisopterus minutus and T. luscus) and benthic cephalopods, which are all made of several species and, therefore, display a broader, composite ecological niche. By contrast, some species were predicted to occupy only a relatively small fraction of the Celtic Sea ecosystem. This was particularly the case for benthic groups, which are highly dependent on the seabed substrate. For instance, the distribution of Norway lobster (Nephrops norvegicus) was restricted to muddy patches in the western part of the central Celtic Sea where the species can more easily bury in mud. Ecospace modeling allowed us to distinguish between groups that have similar trophic niches but different environmental niches. Thus, sole and plaice have similar diets but showed limited spatial overlap because of their, respectively, warm and cold water affinities; the same was observed for sardine (Sardina pilchardus) and herring. Species that are taxonomically close such as the gadoids cod, haddock and whiting were shown to regularly coexist in the same areas but could also have substantially different distributions: whiting inhabited shallower areas than cod and haddock; both haddock and cod had affinities for muddy areas, but haddock also frequented sandy substrates whereas cod preferred coarse sediments. The distributions of adults and juveniles for hake, anglerfish and cod were comparable yet exhibited some differences (i.e., juveniles showed a greater affinity for muddy substrates), which highlighted the relevance of representing multiple stanzas for some species in Ecospace to better simulate changes in spatial distribution and predation pressure over fish life cycle and the potential for cannibalism.
Species Assemblages
The distribution of functional groups provided a view on fish community assemblages in the Celtic Sea ecosystem. Very coastal areas and bays around Ireland, United Kingdom and France and the inner Bristol Channel were found to be inhabited by functional groups tolerant to low salinities, such as large concentrations of benthic invertebrates, small benthivorous organisms and, upper in the surface, suprabenthivorous and small epipelagic fish (i.e., herring, sardine, sprat). Higher trophic levels in these areas were mainly represented by whiting and sea bass. Also, intense primary and secondary pelagic production took place in these areas. Areas next to the shelf edge, located from the tip of Brittany to southwestern Ireland, were characterized by deeper waters with a steeper slope. Here, abundant populations of megrim, hake, anglerfish and other piscivorous demersal fish were found together with widely distributed pelagic fish species such as boarfish, blue whiting (Micromesistius poutassou), mackerel and horse mackerel. Benthic invertebrates in these areas were mainly deposit and suspension feeders. Primary production was observed limited in these areas, but the pelagic habitat was favorable to zooplankton development. In the cold central and northwestern Celtic Sea, the mix of sediment types and the moderate depth was favorable to diverse demersal species, including epibenthivorous demersal fish, hake, anglerfish and three gadoid species, cod, haddock and whiting. Mackerel and horse mackerel were the dominant pelagic species in this area. The density of benthic carnivores and necrophageous invertebrates was especially high in this area. Finally, the Western English Channel and the outer Bristol Channel differed from the other regions of the Celtic Sea by their relatively warm waters and coarse substrate and their higher plankton productivity sustained by mesoscale structures. The Western English Channel and the outer Bristol Channel were characterized by the presence of small benthivorous fish, epibenthivorous fish, pouts, flatfish (plaice and sole), commercial invertebrates (crustaceans and bivalves), cephalopods species, some gadoid species, and a mix of pelagic species including mainly horse mackerel and mackerel but also small epipelagic species.
Temporal Changes in Functional Groups’ Distributions
Overall, relative habitat capacity was constant for most functional groups over the study period. Most changes in relative habitat capacity occurred between the late 1980s and the mid-1990s (Figure 7). The intensity of changes was variable across functional groups and can be related to the water temperature preferences of functional groups. The fitted GAMs indeed highlighted that temperature, which is the variable most affected by climatic changes in the area, was an ecological niche descriptor common to almost all components of the ecosystem. Thus, changes in the modeled habitats over the studied period were observed for those functional groups with most extreme thermal preferences in the Celtic Sea such as pilchard (Sardina pilchardus), sea bass, medium pelagic fish and squids (mainly or exclusively composed of Lusitanian species), as well as cod, haddock, sprat, herring, endobenthivorous fish and whiting (mainly or exclusively composed of Boreal species).
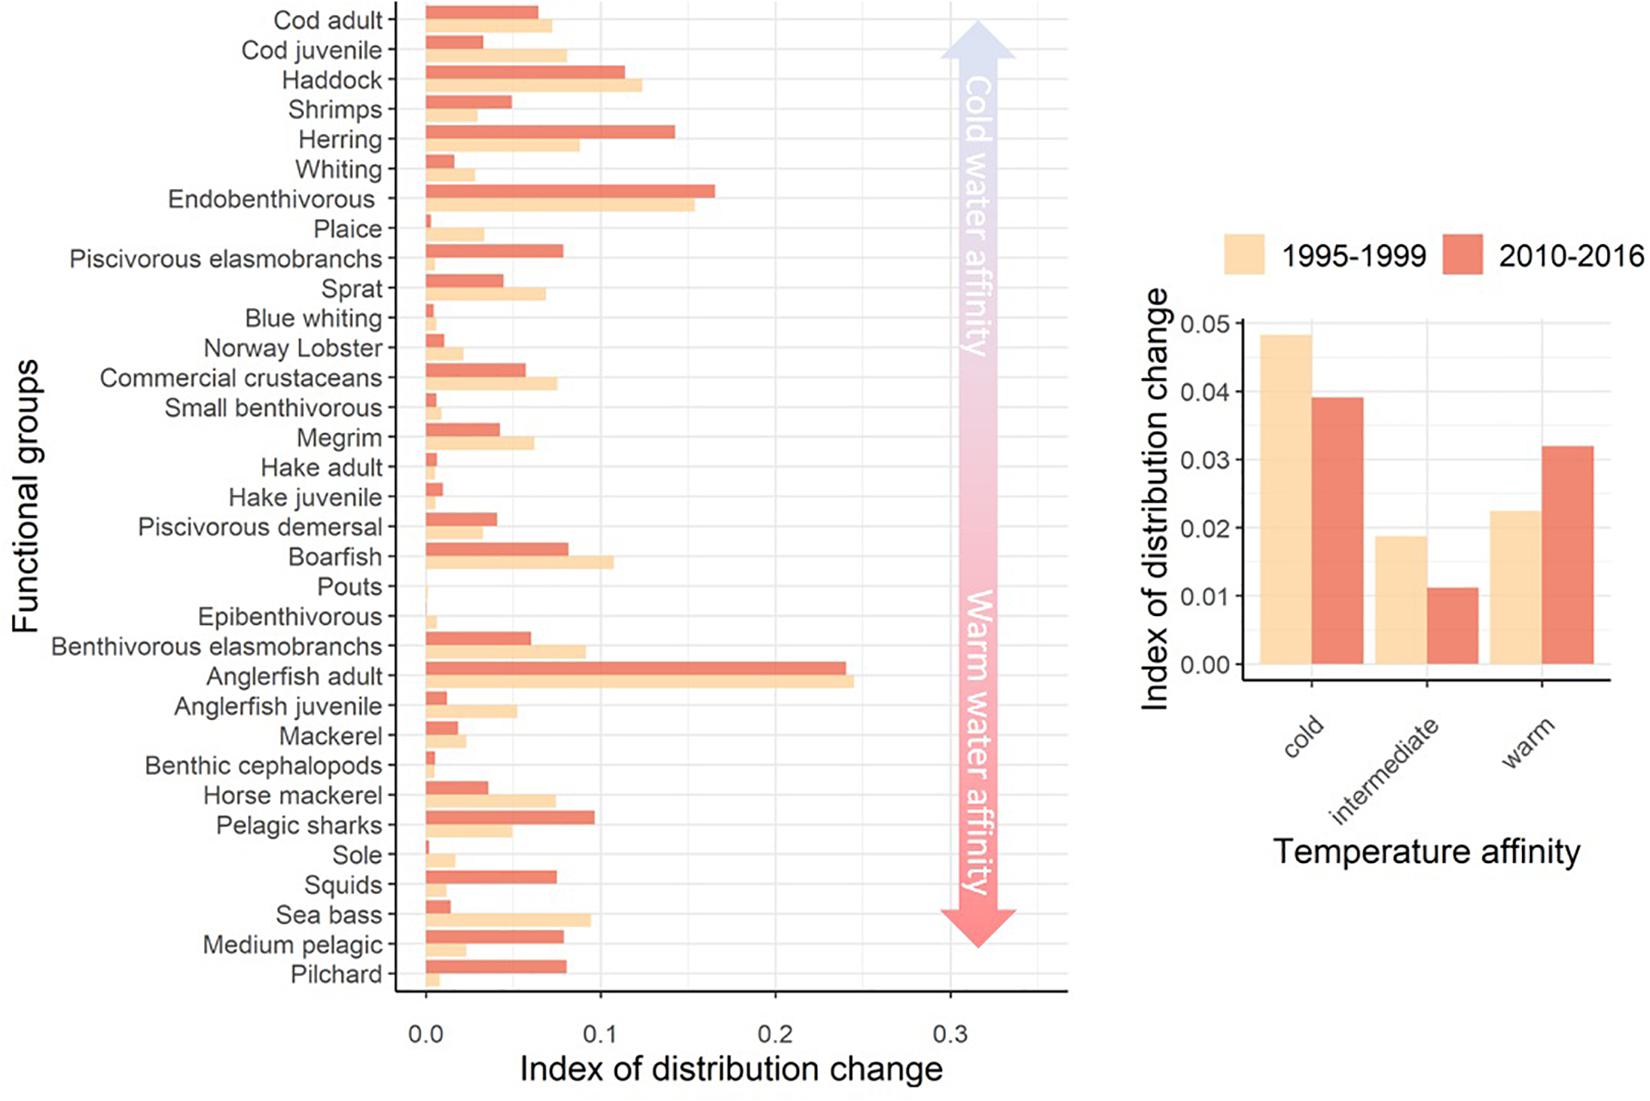
Figure 7. Index of change in the spatial distribution of functional groups’ habitat in relation to their thermal preferences between the 1985–1989 and 1995–1999 periods and between the 1985–1989 and 2010–2016 periods: Left: Values by functional group and averages over functional groups according to their temperature preferenda (cold, warm and intermediary corresponding to groups with thermal preferendum lower than, higher than, or within the range of temperatures in the Celtic Sea, respectively). The index is the absolute difference between 1 and the slope of the linear regression between Ecospace model cells’ values of relative habitat for the 1985–1989 period and the two other periods. Right: mean index per group of thermal affinity, “cold,” “intermediate,” and “warm” for species with thermal preferendum, respectively, inferior, within, and superior to the temperature range covered in the Celtic Sea over 1985–2016.
Functional groups dominated by Boreal species illustrate biomass distribution changes related to environment (Figure 8). Most changes in the distribution of species that prefer cold waters occurred early in the study period, with a slight contraction of the area occupied by these species in the eastern and southwestern Celtic Sea in response to the more intense warming of already warm bottom waters in those areas. For the remainder of the study period, the relative distribution of biomass of Boreal species remained relatively stable.
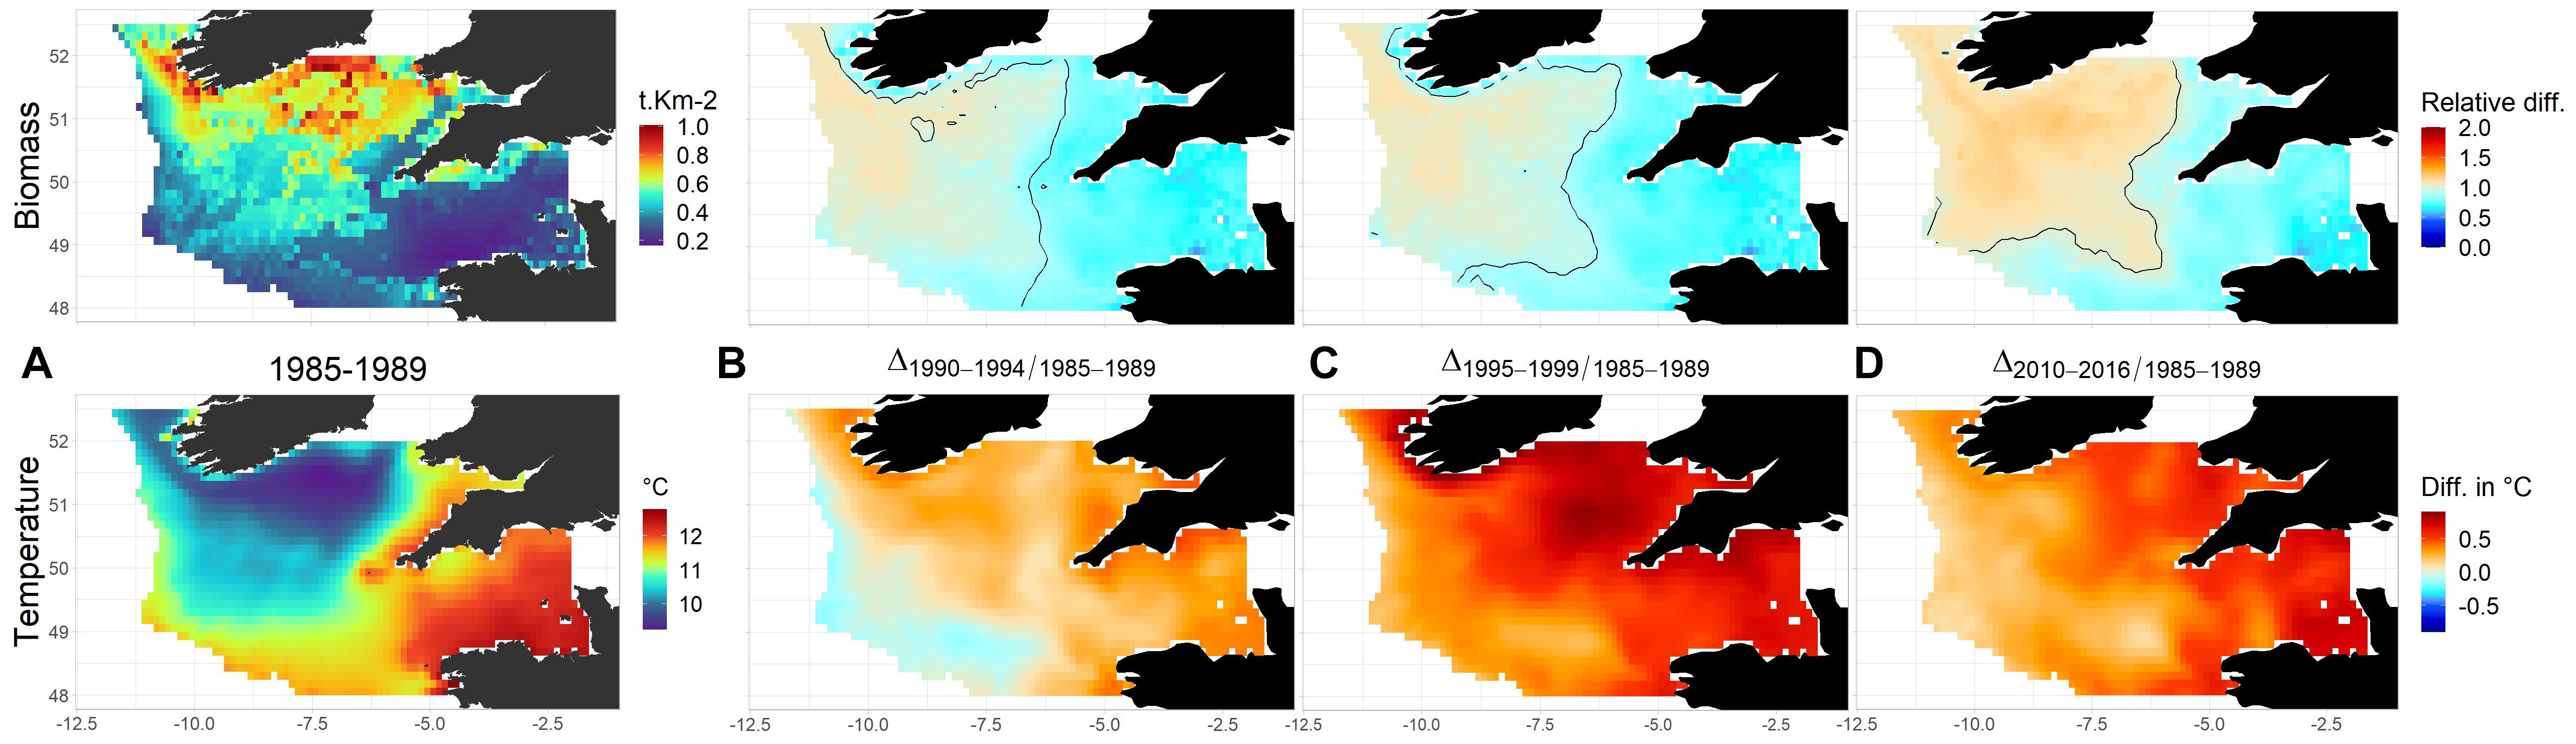
Figure 8. Predicted changes in the total biomass of Boreal demersal species. (A) Mean biomass distribution (t.km– 2) for the period 1985–1989 and temperature (°C) for the same period. Relative changes of Boreal demersal species biomass are displayed in (B) 1990–1994; (C) 1995–1999; (D): 2010–2016 and calculated as the ratio between these selected periods and the initial biomass. In (B–D) the colors correspond to the ratio of absolute biomass between the predicted biomass and biomass for 1985–1989. The black lines delimit areas for which the fraction in the total Celtic Sea Boreal demersal species biomass increased (“+” area) and decrease (“–” area) compared to 1985–1989.
Ecosystem Indicators
Primary production in the Celtic Sea (Figure 9A) was essentially located in coastal areas, from the southern coast of Ireland to the Western English Channel and western Brittany, and along the southern part of the Celtic Sea shelf break. Differences in primary production between the lowest and the highest productive areas never exceed a factor of four. The biomass of secondary producers (i.e., zooplankton and benthic invertebrates that not carnivorous; Figure 9B) was more spread over the shelf and did not display similarly high densities in the center of the Western English Channel. The total biomass of high trophic level groups (i.e., TL ≥ 3; Figure 9C) was less variable over space and more patchy. The biomass of primary and secondary producers in the Celtic Sea was concentrated around particular areas, mainly around the coasts and in the English Channel, and this available production is efficiently transferred to higher trophic levels and then likely spread horizontally.
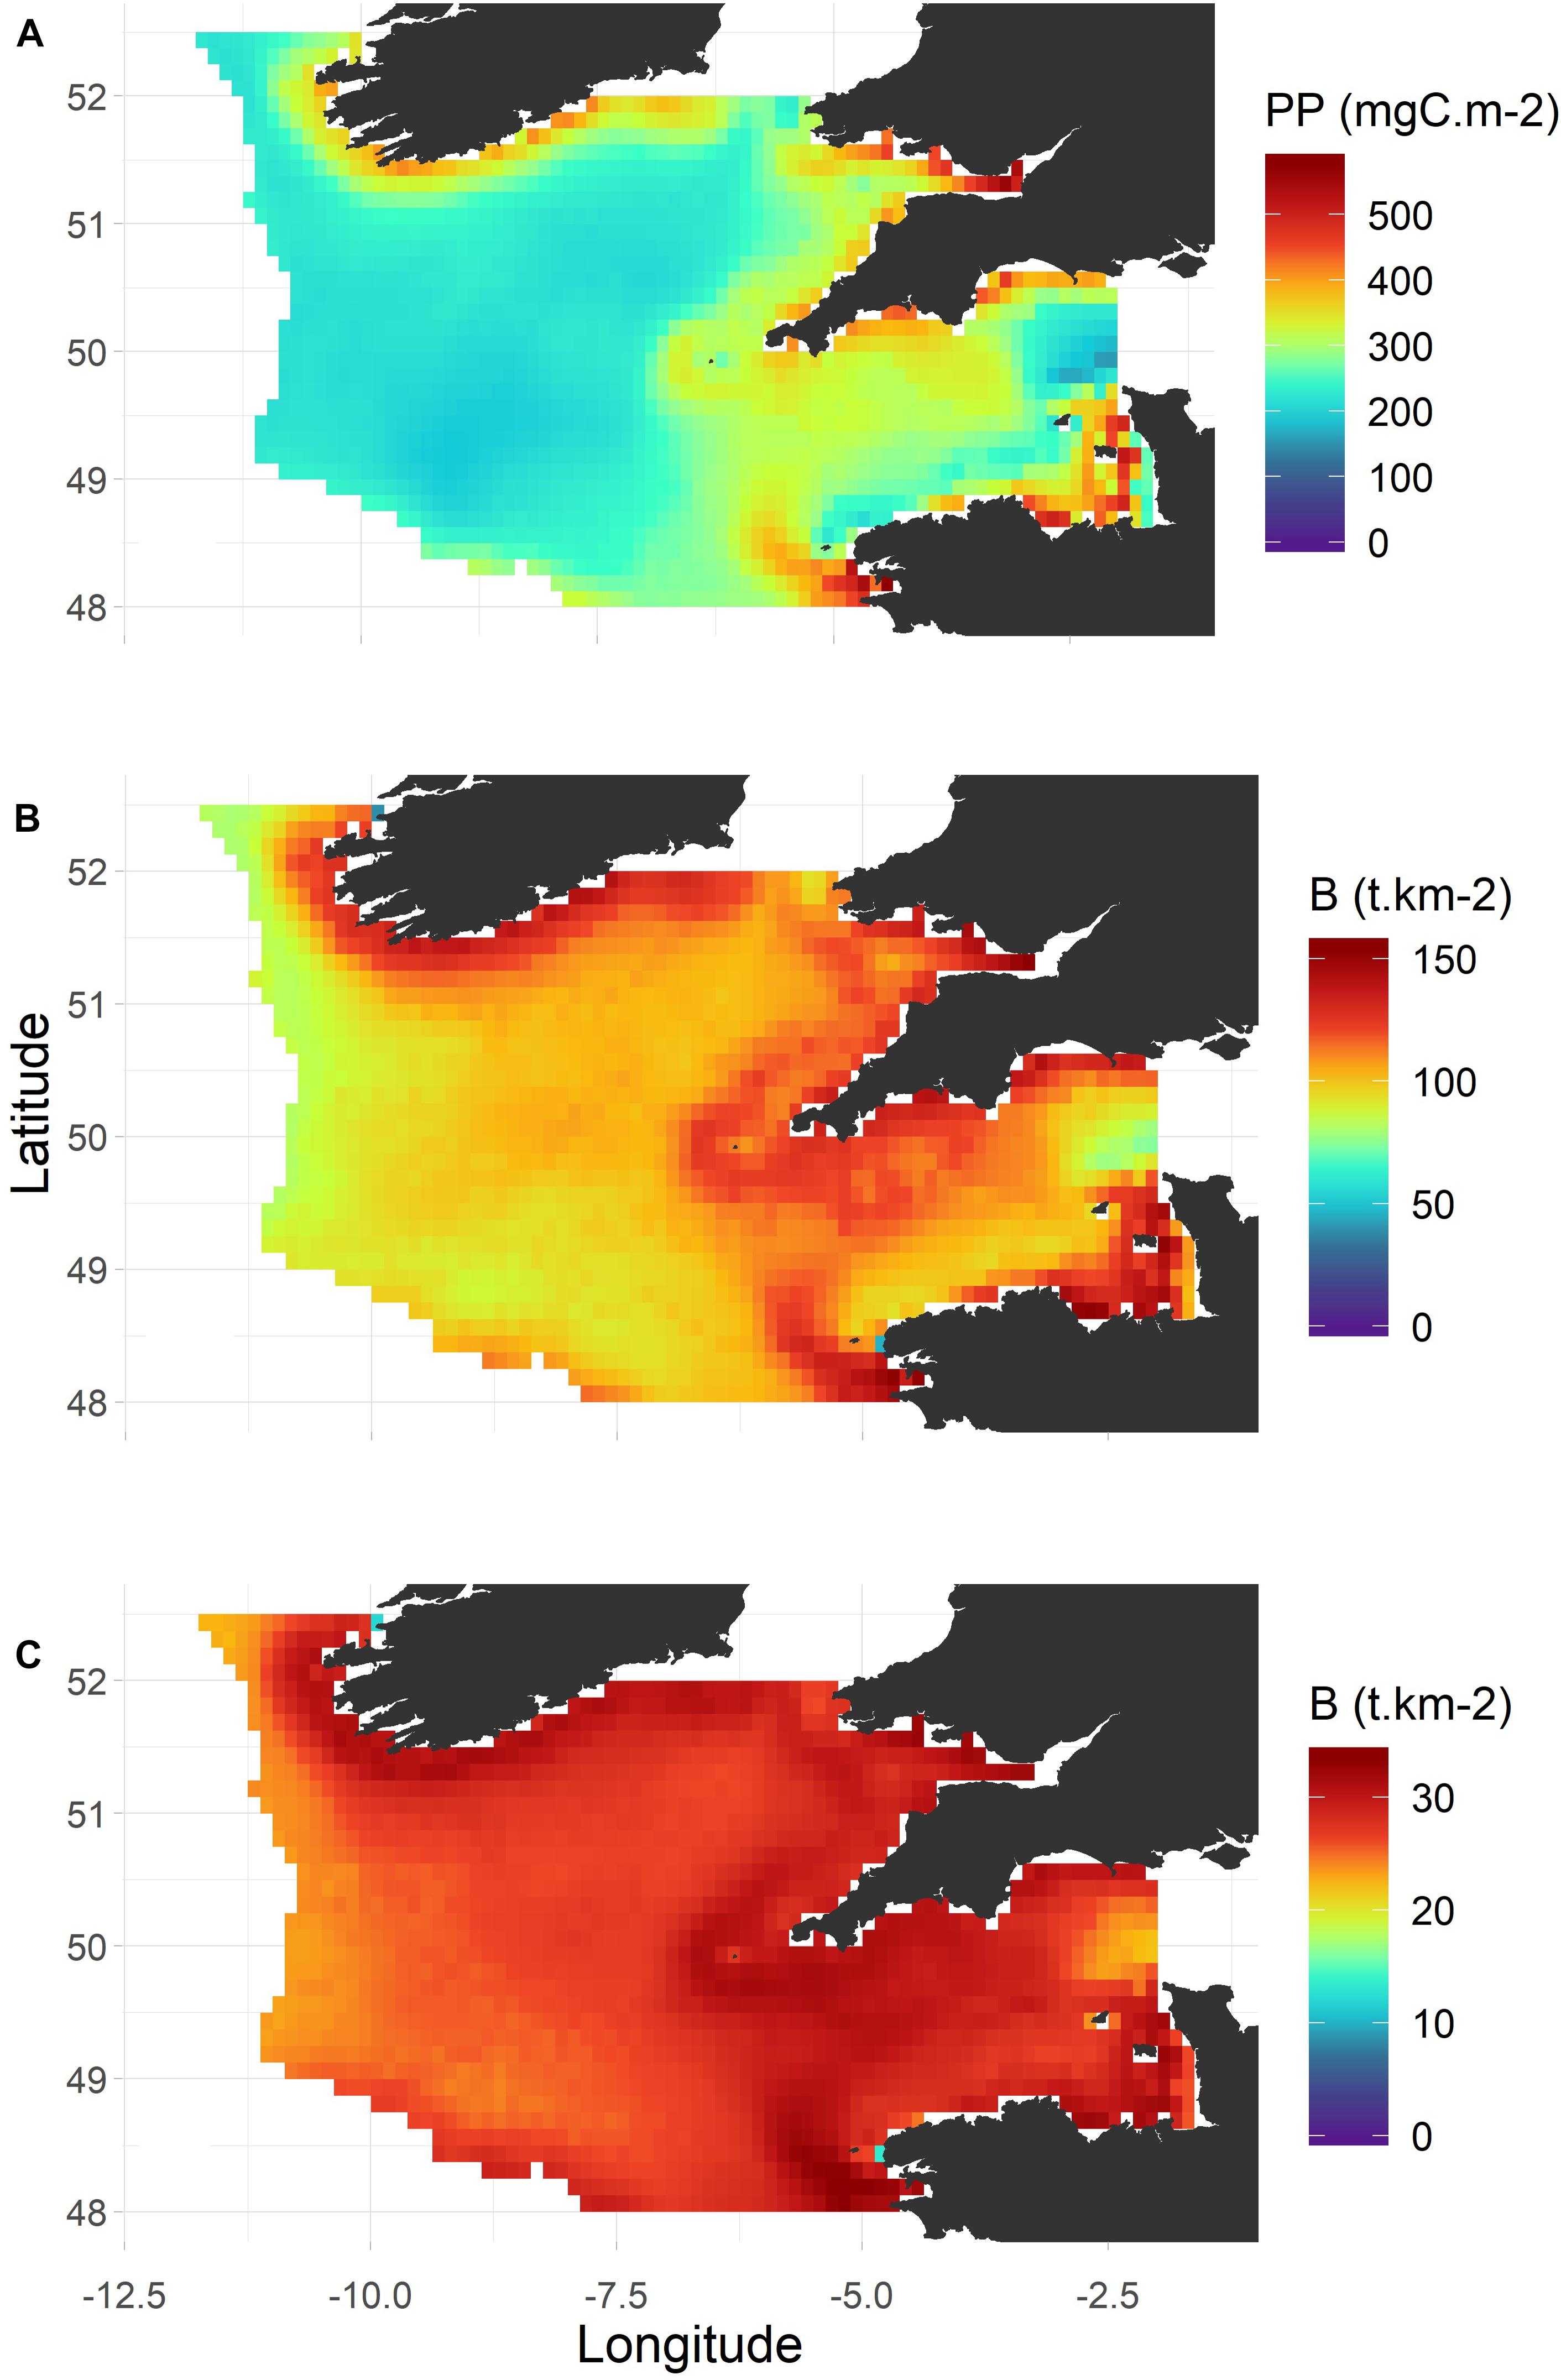
Figure 9. Primary production in the Celtic Sea and biomass for trophic levels 2–3.5 and greater than 3.5 in 1985. (A) Primary production; (B) total biomass for trophic levels 2–3.5; (C) total biomass for tropic levels greater than 3.
The spatialized mean trophic level (MTL) and high trophic index (HTI) highlighted that higher trophic levels were mainly located in the western Celtic Sea. In particular, high values of the MTL were concentrated in the northwestern Celtic Sea, whereas the HTI is higher in deeper areas along the shelf-break (Figure 10, left panel). Areas associated with a high MTL were those areas that were occupied by many medium to large demersal functional group including epibenthivorous and piscivorous fish, elasmobranchs, gadoids, anglerfish and hake. Areas characterized by a high HTI were those where the biomasses of hake, megrim and anglerfish were high. In the eastern part of the Celtic Sea, the MTL was lower, due the large abundance of small demersal fish species feeding on benthic invertebrates (e.g., sole, plaice, small benthivorous fish) in this area, particularly medium and epipelagic species, which dominate in the Western English Channel. In the eastern part of the Celtic Sea, top-predators were mainly represented by large pelagic sharks and sea bass.
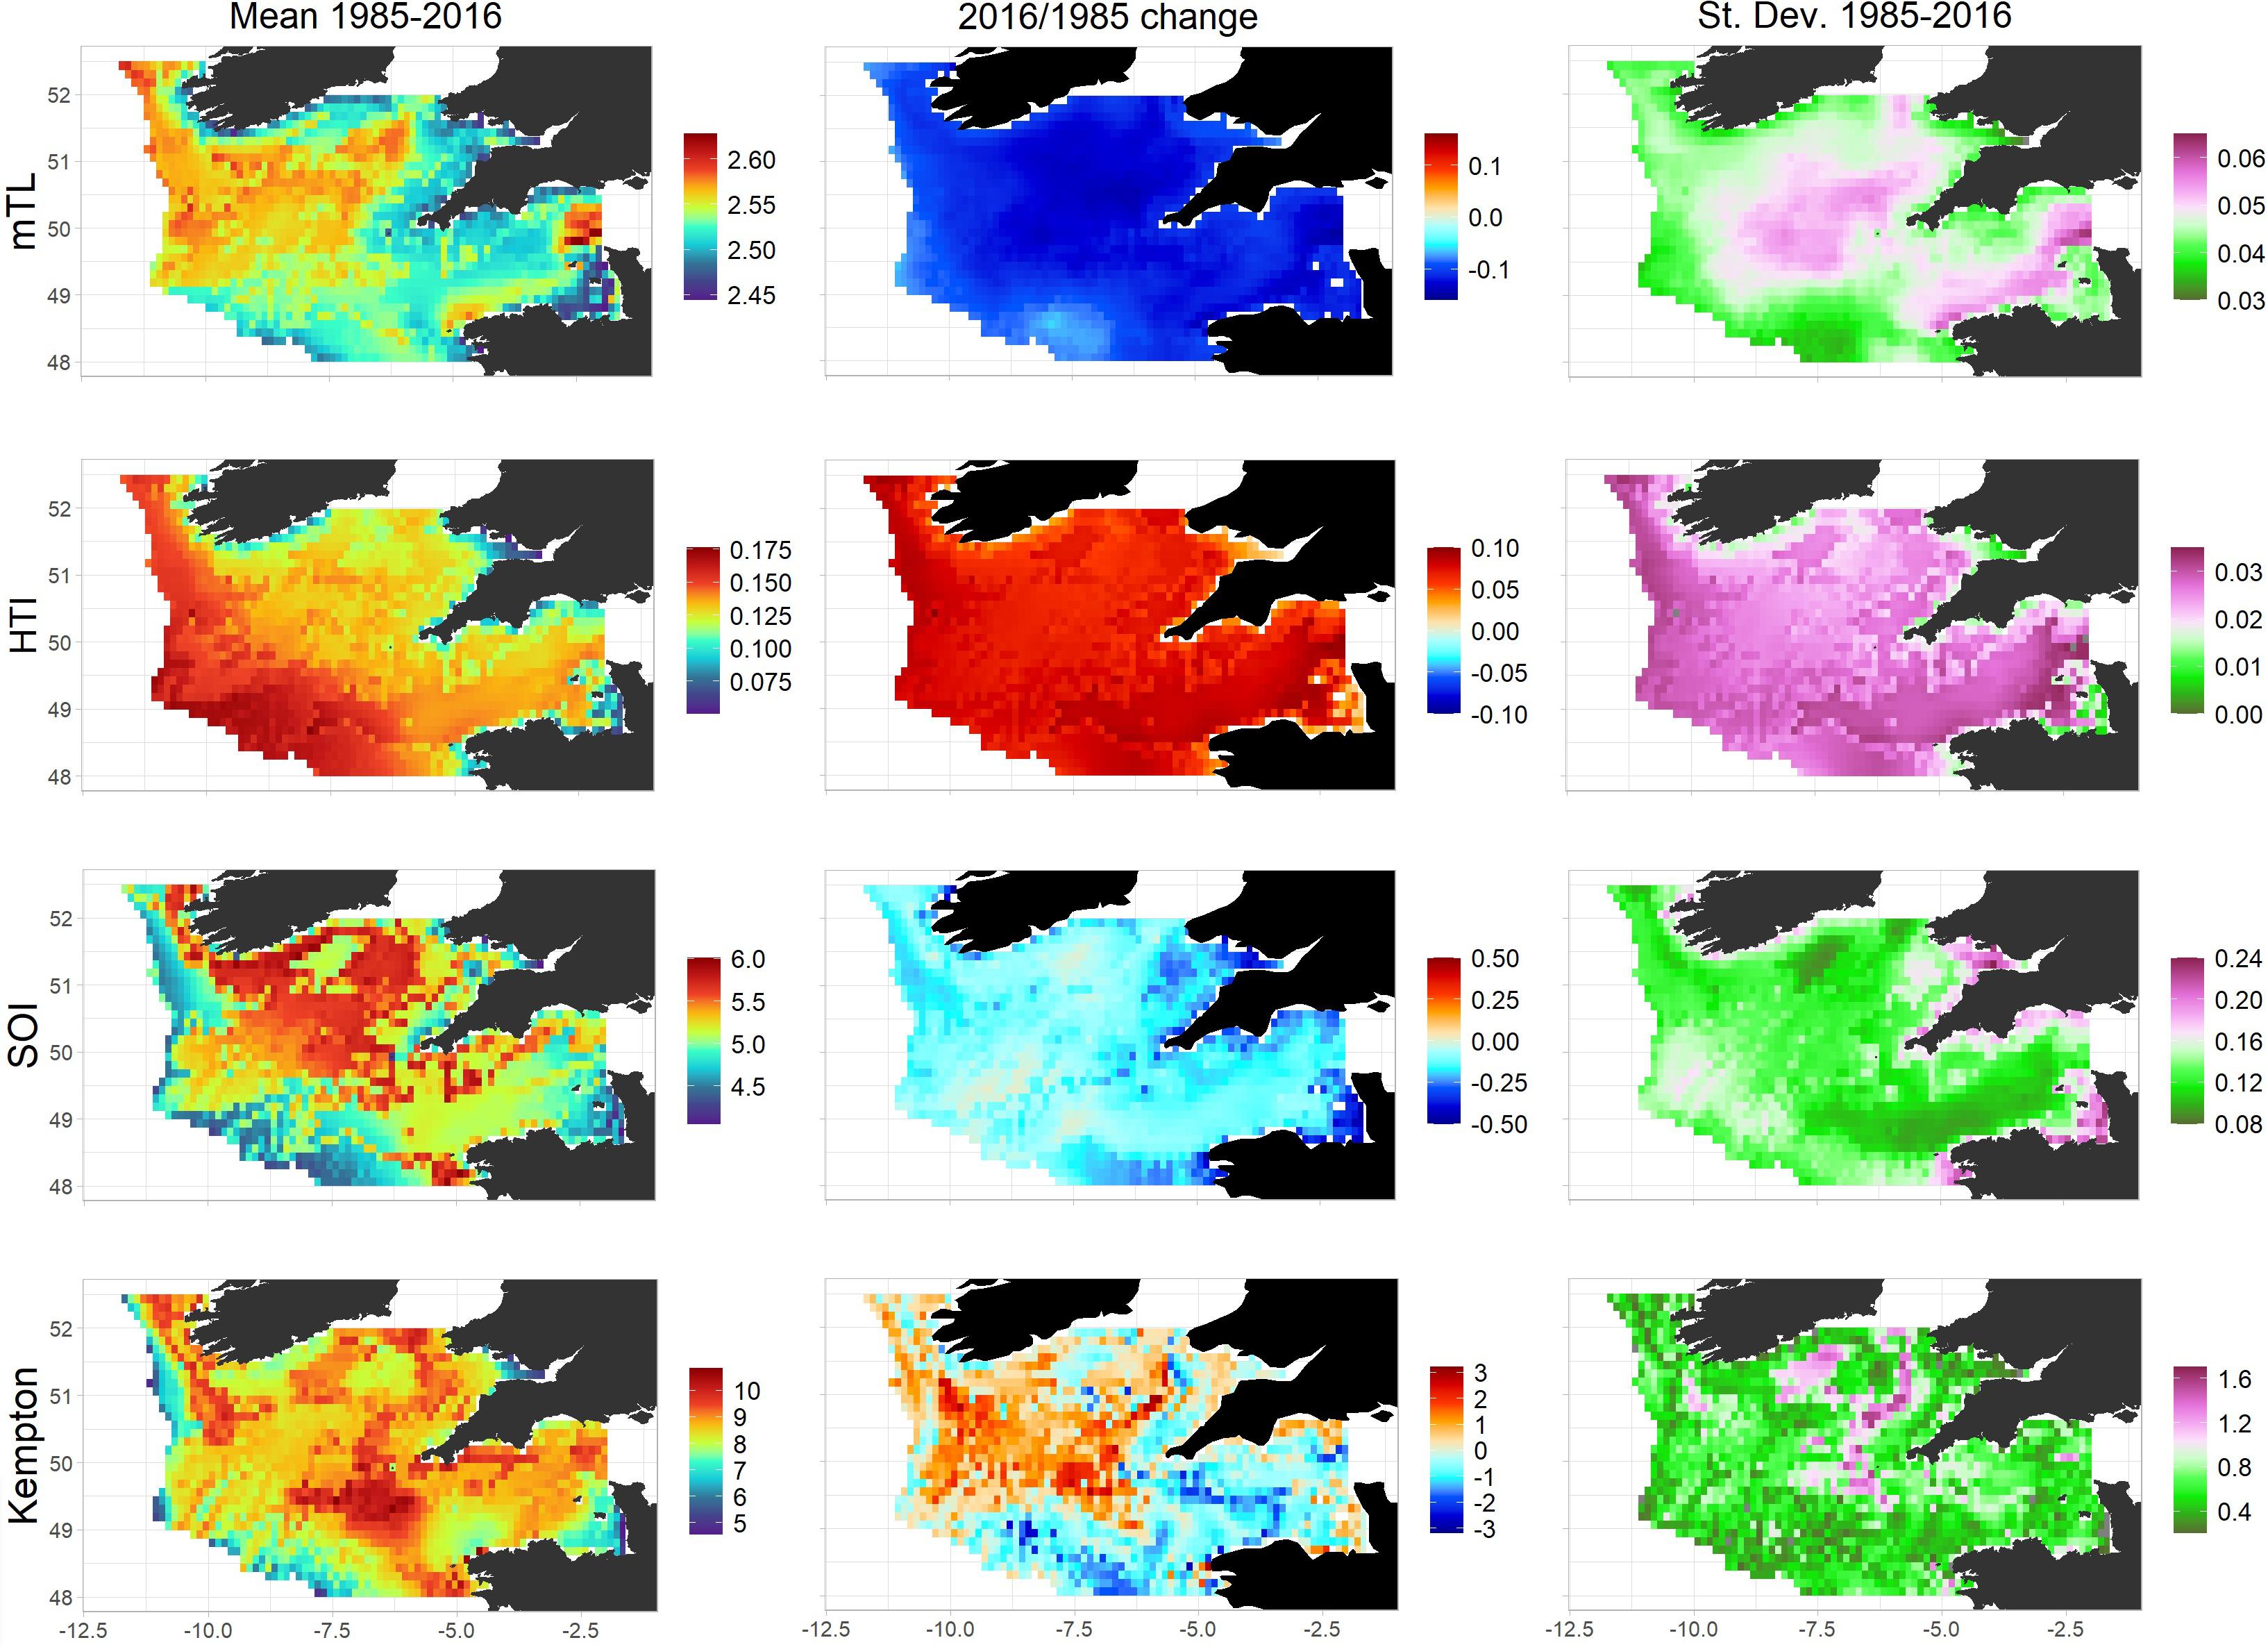
Figure 10. Mean values, change and variability in four ecosystem indicators in the Celtic Sea over the period 1985–2016. Mean trophic level MTL (1st line), high trophic index HTI (2nd line), system omnivory index SOI (3rd line) and Kempton’s diversity index (4th line) as spatialized in Ecospace, (left panels), their change (difference) between 1985 and 2016 (middle panels), and their standard deviation calculated over the period 1985–2016 (right panels).
The Kempton’s index highlighted spatial patterns in functional group diversity. Spatial patterns in functional group diversity were independent from that of biomass levels. For instance, mean values of Kempton’s index were found in areas with either low total biomass (shelf-break) or high total biomass (fronts and muddy areas) densities. Functional group diversity was found to be particularly high at the border between the main Celtic Sea regions identified previously. The SOI was similar but not identical to the Kempton’s diversity index. It was highest in the northwestern part of the central Celtic Sea, which was inhabited by generalist species and species that can feed on both benthic invertebrates and fish, including gadoids and anglerfish, but not hake which primarily feeds on medium-sized pelagic fish.
All the indicators displayed measurable variations over time and space (Figure 10, middle panels). The trends in the HTI and MTL were in opposed directions, which means that the ratio of low trophic level biomass to total biomass increased overall but that, in parallel, the proportion of species with a TL greater than 4 increased. These results were mainly driven by the dramatic changes in horse mackerel and hake abundances that occurred over the study period, while, after a deep depletion, the abundance of most mesopredator in the 2000s returned to levels similar to the 1980s. For the HTI and MTL, the direction of the change was the same among Ecospace cells, partly because the species driving observed changes were widely distributed in the Celtic Sea region. Trophic diversity declined overall over the whole Celtic Sea, especially in coastal areas. While functional groups diversity also declined in the southern Celtic Sea and the English Channel, it increased in the northwestern part of the central Celtic Sea. The standard deviations of the four indices (Figure 10, right panels) highlighted a measurable modification of the whole structure of the Celtic Sea ecosystem over the period 1985–2016, yet some specific areas were more affected than others. In particular, the food-web structure of the central Celtic Sea displayed substantial changes between 1985 and 2016, which were reflected by both an increase in MTL and a decrease in HTI and SOI. The standard deviation of spatial indices relative to their mean value also suggests a greater amplitude of changes occurred in the Kempton index.
Discussion
Integrating Multiple Data Types for More Ecological Realism in Trophic Models
The data types integrated in the Celtic Sea EwE model significantly improved its ability to represent the functioning of the Celtic Sea ecosystem by providing a more relevant picture of the food-web structure and by depicting more realistically the drivers that rule its dynamics, and notably the environmental drivers.
Improving the Description of Food-Web Components and Interactions
To ensure that a food-web model correctly represents the temporal and spatial dynamics of an ecosystem, trophic relationships have to be defined as accurately as possible, through the combined use of classical and novel analyses (Pethybridge et al., 2018; McCormack et al., 2019). In this study, the use of outputs of the EcoDiet model (Hernvann et al., in press) applied to the stomach contents and biotracers compiled within the recent and extensive EATME project was advantageous to provide a reliable diet matrix to Ecopath, in better agreement with local data than by the use of literature alone. Additionally, the substantial collection of data compiled for the present study [115 time-series versus 62 in Moullec et al. (2017)] provided new insights on the abundance trends of some food-web components, hence allowing the Celtic Sea EwE model to better capture ecosystem dynamics. Though the integration of abundance time-series for multispecific groups in EwE was informative, the dynamic of these groups remained poorly understood compared to the dynamic groups under stock assessment. Gathering relevant time-series of fishing effort for the period 1985–2016 for multispecific groups would greatly improve the hindcast. However, the large diversity of gears and métiers from many countries operating in the Celtic Sea makes this endeavor particularly challenging.
Primary and Secondary Production
The integration of primary and secondary production related data in EwE only slightly improved the fit of the Ecosim model. The reason for such a low improvement was the absence of clear variation of primary and secondary production in the time-series. This suggested a relative stability of the hydro-climatic conditions in the Celtic Sea between 1985 and 2016 as the main driver of plankton development. PP and ZHS integration allowed a better hindcast for pelagic functional groups, especially for zooplankton and some planktivorous fish, both for trends and interannual fluctuations, while trends in phytoplankton abundance were poorly reproduced. This poor fit for phytoplankton groups illustrates the difficulty to represent plankton prey-predator interactions and zooplankton grazing pressure in EwE models and the consequence this may have on the prediction of higher trophic levels. Here, high productivity and biomass levels of phytoplankton prevent their control by top-down process and limit their variation in abundance to a very low amplitude. Despite this lack of realism on the dynamic of phytoplankton, the information brought on the bottom-up impact of PP and the development conditions for zooplankton well complemented the insight on top-down impact exerced by higher trophic levels on these secondary producers.
Remote sensing data have been increasingly utilized over the last two decades in marine ecology studies (Chassot et al., 2011). The use of satellite-derived PP estimates is relatively common in marine ecosystem modeling (Christensen et al., 2009; Abdou et al., 2016; Grüss et al., 2016) and has the potential to become a routine procedure in new generations of ecosystem models (Lowerre-Barbieri et al., 2019). The main advantages of satellite-derived PP estimates are that they derived from a direct observation and they are accessible at high spatial resolution, given that regional biogeochemical models are not always locally available. However, satellite-derived PP estimates are only available for recent past (the past two decades) and, so far, they have not been calibrated to provide values for different size classes of phytoplankton (Kramer et al., 2018). In particular, CPR data suggested that the phytoplankton community went through measureable changes in the Celtic Sea over the period 1982–2016: The PCI index, proxy of the total standing biomass, increased, while no significant trend was detected in the diatom and dinoflagellate (both included in large phytoplankton group) counts, which suggested an increase in the biomass of nano-phytoplankton between 1985 and 2016.
Despite the relatively short temporal availability of the mesozooplankton niche model of Druon et al. (2019), the endeavor of integrating it in the food-web model turned out to be particularly promising. In particular, estimates from the mesozooplankton niche model allowed us to highlight areas of the Celtic Sea that are favorable to primary production but not to secondary production, and to identify regions with lower food availability for high trophic levels or where the grazing pressure exerted on zooplankton is important. Since the early 2000s, several end-to-end ecosystem models have coupled low and high trophic level models (i.e., have implemented on-line two-way coupling), hence allowing for a better representation of bottom-up and top-down controls within marine ecosystems (Travers et al., 2009, 2007). However, only a few ecosystem modelers have managed to implement an on-line two-way coupling, and it has been more common to develop alternative ways to link low trophic level and high trophic level dynamics (Libralato and Solidoro, 2009; Piroddi et al., 2017), such as forcing the high trophic level model with outputs from a biogeochemical model (e.g., Halouani et al., 2016). In this context, forcing future ecosystem models by observation-based primary productivity and zooplankton habitat would represent a valuable and conservative alternative approach.
Habitat Modeling
The habitat modeling framework adopted in this study that relied on GAMs was used to assess and predict the response of almost all high trophic level groups to warming and to project the abundance and distribution of each group in the Celtic Sea. The habitat-derived functional response to temperature significantly improved the fit of the Ecosim model. Here again, the improvement of model fit was relatively low, as surface and bottom temperatures appeared to be stable over a substantial fraction of the study period. Still, this improvement was substantial for those functional groups that can cope with extreme temperatures, i.e., which have their temperature optimum outside out of the range of temperature values occuring in the Celtic Sea ecosystem (e.g., plaice, cod and sardine).
Despite their interest in predicting past, current, and future species distributions, habitat modeling approaches have still been rarely coupled to ecosystem models (Grüss et al., 2016; Coll et al., 2019; Moullec et al., 2019b). In this study, we successfully integrated the outputs of a statistical habitat model into a spatial trophic model. The limited complexity of the GAM smoothers employed here, together with the choice of modeling probabilities of presence and not abundances with the GAMs, are in line with the ecological niche theory (Citores et al., 2020). The European IBTS survey data employed in this study encompassed a large range of environmental values, hence providing insights into the potential response of species groups to the warmer conditions that could become the norm in the Celtic Sea by the end of the century. The European IBTS survey dataset recently proved to be highly valuable to study species distributions (Baudron et al., 2020; Moriarty et al., 2020) and characterize ecosystem functioning (Maureaud et al., 2019). The methodology developed by Grüss et al. (2018, 2020) can integrate as many variables as desired (e.g., variables measured at different locations of the water column, percentages of different substrate types) and can be applied to any particular representation of functional groups, including multistanza groups. Thus, the approach of Grüss et al. (2020, 2018) is an interesting alternative to the classical and less flexible automatic approach used in Ecospace (Steenbeek et al., 2016) that imports information from AquaMaps (aquamaps.org), with more limited and much less accurate information (Jones et al., 2012).
Note, however, that habitat models quality remained acceptable but limited for multispecies benthic invertebrate groups, for which presence/absence data was limited here to a few French surveys due to the lack of availability and homogeneity for other surveys. This also stresses the need for improving large scale sampling for these compartments.
Are we Still Missing Something?
While calibrating the Ecosim model, several periods of time with a poorer fit were identified for different functional groups. Early changes in phytoplankton and zooplankton abundances were hardly reproduced by the Ecosim model. Ecosim failed to catch the great decline in small mesozooplankton abundance at the beginning of the time-series, as well as the decline in diatom and dinoflagellate abundances and the increase in nanophytoplankton abundance. Although it could be due to wrong trends in PP estimated by the biogeochemical model in the absence of satellite-derived data, this could also be due to uncaptured environmental effects. This would be expected as our study period starts in 1985, only a few years before the occurrence of abrupt changes in the state of the Celtic Sea ecosystem (e.g., in terms of turbulence, temperature, salinity and plankton abundance) that were identified in a previous study (Hernvann and Gascuel, 2020), and as Ecosim is not capable of tackling such ecosystem regime shift dynamics (Walters et al., 1997; Tomczak et al., 2012). As the stability in the plankton-related time-series did not allow us to explain their dynamics, the oceanographic conditions limiting phytoplankton and zooplankton production may not be the main factors of the regime shift. Several hypotheses have been proposed for identifying the main drivers of the severe drop in mesozooplankton abundance that occurred in the Celtic Sea, including climate drivers or changes in ocean circulation, but the mechanisms responsible for these changes (mediating factor of phytoplankton-zooplankton interactions, direct mortality factor of zooplankton, changes in zooplankton species composition, changes in phytoplankton composition, etc.) remain elusive (Pitois and Fox, 2006). In this context, EwE modeling exercises that estimate artificial “primary production anomalies” may improve the fit of our Ecosim model (Mackinson et al., 2009; Araújo and Bundy, 2012; Bentley et al., 2019). The application of this specific procedure to the Celtic Sea EwE model provided an anomaly time-series significantly correlated to the North Atlantic Oscillation (NAO) index. Nevertheless, these developments were not included in this study as: (i) they did not allow us to better reproduce patterns in plankton abundance in the early years of the period 1985–2016; (ii) they may be confounded with environmental factors that may improve, for instance, fish recruitment; and (iii) they did not provide any indications on the mechanisms at stake.
From Temporal and Spatial to a Fully Spatio-Temporal
Note that a novel spatio-temporal framework, that integrates both temporal and spatial dimensions, has been developed by Steenbeek et al. (2013) and included into the EwE software. The present approach relies on the sequential development of temporal rather than spatial food-web model and does not treat both aspects simultaneously in the same framework. Thus, the changes in functional group abundance predicted temporally do not account for eventual mismatch between prey and predators spatial distribution. The consequences on the overall model predictions may remain limited here due to very limited changes in the distribution of functional groups. However, such novel version of Ecopath spatio-temporal framework should be considered to predict long-term changes in the Celtic Sea in a context of climate change, which would imply substantial shifts in species distributions at various rates according to the functional groups.
Spatial Patterns of Species Assemblages and Trophic Functioning in the Celtic Sea
Heterogeneity in Biological Production Influenced by Oceanography
The Ecospace model highlighted the heterogeneous spatial patterns of biological production in the Celtic Sea that are mainly driven by contrasting water mixing conditions over the study region. In coastal areas, inner Bristol and English Channel, well-mixed waters allow for early phytoplankton blooms in spring and high primary production during the year depending on nutrient influx/recycling (Pingree et al., 1976; Pingree, 1980; Jordan and Joint, 1984). The seasonally mixed waters spreading over the shelf of the Celtic Sea lead to lower primary production, which occurs later there and at a lower level than in coastal areas (Pingree, 1980; Hickman et al., 2012; Giering et al., 2019). Note however, that PP can be locally enhanced offshore by the combined effects of topography and tidally-induced vertical mixing (through internal waves at the shelf break; Sharples et al., 2007 and water current shear stress in shallow waters of the shelf). The resulting shelf-break front is well developed in South-West Celtic Sea and finer along the western shelf (Holligan and Groom, 1986; Druon et al., 2001; Joint et al., 2001). In shallower waters, the Ushant front (Pingree et al., 1982) occurs at the interface between the well-mixed and stratified waters of the shelf from the Brittany tip to the Western Channel while the Celtic Sea front (Simpson, 1976) lies between the Bristol Channel and the Irish Sea. According to literature, the most productive areas, and especially productivity fronts, were predicted to concentrate biomass over several trophic levels up to top-predators (Pade et al., 2009; Scales et al., 2014; Druon et al., 2019). Specific functional groups inhabiting the water column displayed aggregated biomass at their location such as mesozooplankton, mackerel and pelagic sharks, as observed at the Ushant front. As about 80% (upwelling) to 90% (oceanic waters) of the PP is transferred to detritus (Raymont, 1980; Joint and Williams, 1985; Parker, 1991), spatial patterns in PP would also affect benthic compartments. The low level of information on benthos in the present study however, prevents any conclusions about these aspects.
The spatial structuration induced by primary production was shown to propagate through the food web. However, except for the above-mentioned functional groups, the spatial contrast in productivity in the Celtic Sea generally dampens with increasing trophic level. The mismatch between higher trophic level species niche and highest primary productivity areas is more important for predators than for prey. In other words, trophic flows progressively operate a biomass transfer from restricted productive areas to lower productive areas in the Celtic Sea. Biomass transfers across the shelf are mainly operated through functional groups characterized by wide ecological niches and large dispersal rates (one input parameter of Ecospace; Romagnoni et al., 2015) such as medium pelagic species mackerel, horse mackerel, pouts and large piscivorous predators in the Celtic Sea. For such functional groups, Ecospace enables the representation of locally enhanced biomass production due to a higher availability of resources when accounting for dispersal toward more suitable environments (Christensen et al., 2014). Thus, through this modeling framework, we highlighted that high fish densities could be maintained in low productive areas of the Celtic Sea through subsidization by prey and predators movements (Polis et al., 1997, 1996) and transport through residual tidal currents.
Spatial Variation in Functional Groups Assemblages
In agreement with previous in situ studies, the functional groups’ distributions predicted by the Ecospace model highlighted the existence of different species assemblages in the Celtic Sea. The species assemblages of the inner Bristol Channel and coastal areas corresponded to those described by Ellis et al. (2000); Kaiser et al. (2004) and Martinez et al. (2013), and these assemblages included herring and sprat as dominant pelagic species, flatfish [plaice, sole, dab (Limanda limanda)], gadoids whiting and pouts, demersal sharks and rays (e.g., catshark Scyliorhinus canicula, rays Raja sp.), gurnards (Eutrigla sp.), small fish (e.g., dragonets Callionymus sp.), large crustaceans (e.g., Maja squinado) and small crabs, pagurids and shrimps. The central Celtic Sea assemblages identified in this study match those reported in Ellis et al. (2013) and Martinez et al. (2013) and are characterized by many gadoid species, including whiting, haddock, pouts and cod, as well as by shrimps. As the present study, Ellis et al. (2013) and Martinez et al. (2013) also characterized the demersal assemblage of the Celtic Sea shelf-edge as being comprised of hake, megrim, anglerfish, pouts, mesopelagic species such as Argentina sp., and benthic cephalopods. The large abundances of pelagic species such as mackerel, horse mackerel, boarfish and blue whiting on the Celtic Sea shelf-edge that were also predicted in this study are consistent with the findings of Reid (2001) and Trenkel et al. (2014).
In agreement with Rees (1999), we found that the Western English Channel displays a particularly diverse benthic assemblage that includes large crustaceans and commercial bivalves [Kaiser et al., 1998; e.g., king scallop (Pecten maximus), queen scallop (Aequipecten opercularis)], as well as suprabenthos (Vallet and Dauvin, 1998). The preponderant community of pelagic species in the Western English Channel has been carefully screened for decades (Southward et al., 1988; Hawkins et al., 2003). The spatial patterns of abundance of most demersal species predicted in this study were consistent with those derived from English Celtic Sea groundfish survey data (Warnes and Jones, 1995; Tidd and Warnes, 2006), even though the latter were not employed for statistical habitat modeling in this study.
Heterogeneous Species Assemblages Result in Different Local Food Webs
The different species assemblages of the Celtic Sea identified in this study provided some new insights to the possible spatial structure of the food web in the Celtic Sea region. While some functional groups are widely distributed, some others are only present in some specific areas of the Celtic Sea and their absence or negligible biomass at particular locations may be interpreted as reflecting local reorganizations of the food web. Thus, the complex Celtic Sea food-web structure could be interpreted as a meta food web made of local, environmentally-driven, food webs connected through space by functional groups with larger dispersion capacities (Kortsch et al., 2019, 2015). Ecospace reveals to be a useful tool to understand the spatial structure of food webs as a complement to more qualitative approaches for characterizing the trophic structure of marine ecosystems (Albouy et al., 2014; Pellissier et al., 2018; Kortsch et al., 2019). Spatial indicators can be produced with Ecospace to determine the spatial structure of the food web in relation to the environment. Our results suggest that shallowest and least saline (affected by rivers) waters of the Celtic Sea, together with the deepest waters of the region, are characterized by a low number of compartments and groups with relatively low variability in terms of TL. The two above-mentioned areas are, however, radically different in terms of functioning. The latter is dominated by a specific trophic pathway where top-predators (i.e., hake, megrim) in high density feed on abundant pelagic species (i.e., blue whiting, boarfish). The former, in deeper environments, is essentially represented by low trophic level benthic and pelagic functional groups with non-diversified diets. The distinction made between the two areas does not exclude the existence of important benthic-pelagic coupling in both areas, but this coupling may be due to the reliance on pelagic primary production rather than to exchanges between upper trophic level species. Intermediate-depth areas of the Celtic Sea were found to be dominated by pelagic functional groups, yet they displayed large concentrations of benthopelagic fish feeding on the benthos and pelagos. Finally, the central Celtic Sea was found to be dominated by predatory and generalist functional groups that feed on both pelagic and benthic compartments, which may render this specific area more stable than the rest of the Celtic Sea. Spatialized indicators highlighted that boundaries between these different areas constituted ecotones, characterized by higher functional group and trophic diversity as they suited to a wider range of species.
The Limited Perception of the Mean Annually-Averaged Ecosystem Functioning
The spatio-temporal dynamic model of this study represents the trophic functioning of the Celtic Sea ecosystem averaged over a year. We proceeded this way because of data availability for model calibration (i.e., survey-derived abundance indices, stock assessment products, and catch statistics). Averaging trophic interactions can be questionable, as trophic functioning over the year is strongly related to seasonal variations in plankton production. These variations are mainly associated with hydrographic features and water mixing processes. In addition, seasonal movements, and subsequent changes in spatial distributions and local abundances have been highlighted for both pelagic [widely distributed pelagic fish (Trenkel et al., 2014) and coastal to a lower degree (Brophy, 2002)] and demersal communities (Dunn and Pawson, 2002; Persohn et al., 2009; Neat et al., 2014). These movements can notably be related to feeding, spawning and overwintering.
Seasonal changes in distributions would explain the variability of fish diets in the Celtic Sea reported in Trenkel et al. (2005) and Chassot et al. (2008). For instance, large Celtic Sea predators consume more blue whiting during the summer and more mackerel during the winter, whereas the consumption of horse mackerel is relatively constant throughout the year. However, modeling changes in fish spatial distributions at a finer temporal scale remains a challenging issue given the data that are available to us.
More Insights Into the Dynamic of a Shelf Ecosystem Under Multiple Environmental and Anthropogenic Pressures
The Celtic Sea Ecosim model best explained the food-web dynamics when it integrated trophic interactions, fishing, environmental conditions controlling plankton production, and warming as a driver of the productivity of higher trophic level groups. The way the Ecosim model fitted to data when different data types were integrated provided a better understanding of the relative impacts of fishing and environmental changes on the Celtic Sea ecosystem during the three last decades.
Fishing on the Frontline
Previous work based on catch and effort reconstruction highlighted the large impacts that fishing has had on the Celtic Sea ecosystem since 1950 (Pinnegar et al., 2002; Guénette and Gascuel, 2012; Hernvann and Gascuel, 2020). In particular, the dramatic increase in fishing pressure that has occurred in the Celtic Sea region over several decades may have drastically reduced the biomass of large predators and may have triggered the deep alteration of the food-web structure through trophic cascades (Hernvann and Gascuel, 2020). The impacts of fishing in the Celtic Sea ecosystem suggested by the present study concur with the conclusions of previous EwE modeling works in the ecosystem by Bentorcha et al. (2017) and Moullec et al. (2017). At the beginning of our study period, in 1985, the biomass of main large bentho-demersal fish and predator species had already been severely impacted by fishing and pelagic and invertebrate fisheries started developing in the Celtic Sea region. Then, between 1985 and 2016, fishing kept on severely impacting the Celtic Sea ecosystem. Despite the integration of environmental variability in the Ecosim model, our findings suggest that fishing had more profound impacts on the Celtic Sea ecosystem than environmental changes.
Compared to previous versions of the Celtic Sea EwE model, the present Ecosim predictions were more accurate due to the use of new survey data (EVHOE and UK-WCGFS) which allowed for a better description of the indirect effects of fishing in the Celtic Sea EwE model. The divergent abundance time-series for smaller and larger fish groups, which increased and decreased, respectively, over the period 1985–2016, were better identified in this study than in the studies that employed previous versions of the Celtic Sea EwE model. The analysis of the mortality estimates suggested that the driving factor of trends in mortality was predation release on smaller species, due to both the continuously increasing pressure exerted on large predatory fish and the reallocation of fishing effort on medium fish in response to the depletion of to large predators. These results concur with the hypotheses formulated in community size-structure studies (Blanchard et al., 2005; Shephard et al., 2012, 2011). Though this phenomenon was only described for demersal species, the large decline in the biomass of horse mackerel in the beginning of the 1990s predicted in this study (a 6-fold decline within only a 10-year time frame resulting from a large increase in fishing effort on horse mackerel) may have also contributed to the increasing biomass of smaller species. This may probably be the case (horse mackerel leaving a vacant niche) for other small pelagic species, such as boarfish to boom in the early 2000s, as observed by Blanchard and Vandermeirsch (2005) and Coad (2012) and also correlated to changes in the temperature. Thus, fishing appears as the main driver of changes in species assemblages in the Celtic Sea, especially leading to a decrease in the diversity of diets and a general decline in the mean trophic level in the area.
Finally, the biomass recoveries initiated in the Celtic Sea over the recent period were particularly noticeable, and these biomass recoveries seemed to allow for a progressively increasing dominance of demersal species in the Celtic Sea ecosystem and a rise of the predation pressure exerted on smaller demersal fish, crustaceans, and cephalopods as highlighted by the biomass decline of the latter and the increase in the HTI index.
Climate Change in Ambush
The importance of the fishing driver in the Celtic Sea contributed to mask the impacts of environmental changes on the ecosystem. Indeed, many abundance trends of exploited groups reflected stock depletions and recoveries independently of warming effects. The dominance of the fishing driver in observed time series is consistent with the lack of evidence of any warming effect in the Celtic Sea from studies that analyzed species biomass trends or community size-structure (Genner et al., 2004; Blanchard et al., 2005). However, through the use of GAM predictions and temperature forcing, we were able to account for the cumulative impacts of fishing and environment changes in EwE and to disentangle the relative contributions of these different drivers of change. The mid-1990s were characterized by a net warming of the Atlantic Ocean that was attributed to a shift of the Atlantic Multidecadal Oscillation (AMO) from a negative to a positive phase, which was likely amplified by anthropogenic climate change (Ting et al., 2009). As a response to this large-scale warming events, both sea surface and bottom temperatures in the Celtic Sea increased. The Celtic Sea EwE with Ecospace model suggests that these temperature changes led to a decrease in the productivity of most of Boreal species, including herring, sprat, cod, whiting and haddock, and to an increase in the productivity of functional groups with warm water affinity, particularly species with extreme thermal preferenda such as sardine, sea bass, mixed medium pelagic fish [mainly anchovy (Engraulis encrasicolus)] and cephalopods, and to a lesser extent, widely distributed pelagic species such as mackerel, horse mackerel and boarfish. In future years, these trends in species productivity may impair the recovery of some current commercially important species (i.e., gadoids) and oblige fishers to target less exploited warm-water species. Additionally, the species distributions predicted by Ecospace indicated a relative concentration of Boreal species’ biomasses in a smaller area around the mid-1990s. This modification of Boreal functional groups’ distributions persisted until the end of the study period and resulted from a contraction of these groups’ niches induced by warming. If the scale of these changes was limited, it confirmed the response of these species to climate change, which was barely detectable in temporal trends. The niche contraction of demersal Boreal species in the south of the Celtic Sea was associated to an increase in functional groups diversity, related to the largest proportion of biomass represented by species with warmer water affinities. The latter, the trophic diversity declined in response to change in assemblage, being mainly benthivorous and of low trophic level.
These responses of functional groups’ productivity and distribution to ocean warming predicted in this study were consistent with the findings of multiple fish community studies that were conducted across Europe for a large proportion of both demersal and pelagic species. In such studies, species were shown to respond to warming in the 1990s (Simpson et al., 2011; Montero-Serra et al., 2015). Changes were mostly correlated to species’ preferred temperature and central latitude of their range so that the abundance or recruitment of cold water species decreased while that of warm water, widely distributed species increased (Poulard and Blanchard, 2005; Simpson et al., 2011; Auber et al., 2017, 2015; Bentley et al., 2020). If no homogeneous poleward shifts of the communities were highlighted over the European shelf (Dulvy et al., 2008; Simpson et al., 2011), the spatial distribution of numerous species was affected by warming (Baudron et al., 2020), some displaying displacements of their center of distribution and others showing migration to deeper waters (Dulvy et al., 2008; Punzón et al., 2016). The potential changes in the distribution of species located south of the Celtic Sea or already present in low abundance in the Celtic Sea are responsible for the increase in species diversity observed by Hiddink and ter Hofstede (2008) and ter Hofstede et al. (2010).
The Relative Stability of the Celtic Sea Ecosystem
When spatializing fish communities’ responses to warming over the European shelf, Simpson et al. (2011) pointed out that the Celtic Sea was less impacted than the neighboring areas. This result may be linked to the lower variability of Celtic Sea thermal conditions after the mid-1990s that resulted from the particular hydrographic situation of the Celtic Sea (i.e., Gulf Stream influence, Hughes et al., 2017; Tinker et al., 2020). However, the amplitude of warming in the mid-1990s suggested that local thermal conditions were not the only reason for the weaker response of the Celtic Sea ecosystem to warming compared to neighboring ecosystems. Ecospace results suggest that the greater stability of Celtic Sea communities may be due to the complex spatial structuration and high biodiversity of the Celtic Sea ecosystem. According to various theoretical and modeling studies, the meta-community organization of food webs may act as a stabilizer of trophic dynamics (McCann et al., 2005; Gravel et al., 2011; Mougi and Kondoh, 2016). The spatial arrangement of environmental gradients in the Celtic Sea is complex compared to other ecosystems where gradients are more correlated together (e.g., the Bay of Biscay, the North Sea). Additionally, though they are developed from collated data from multiple origins, harmonized seabed maps at the European scale indicate that substrate patchiness is higher than in neighboring ecosystems (e.g., the North Sea, the Eastern English Channel). The spatial structuration of the Celtic Sea ecosystem may favor a stable meta-community organization and allow for more resistance to the impacts of environmental changes. The complex spatial structure of the Celtic Sea may also reduce the probability of co-occurrence of “autochtonous” and a “allochtonous” species in the ecosystem, hence lowering the risks of competition between these two types of species if they have similar trophic niches. Finally, the substantial contribution of both benthic and pelagic pathways to matter flows in the Celtic Sea ecosystem may also participate in the stability of the ecosystem (Rooney et al., 2006; Blanchard et al., 2011).
We also found that the Celtic Sea is relatively stable in terms of basal productivity. As reflected by biogeochemical models and satellite-derived time-series, the oceanographic conditions favoring phytoplankton and zooplankton abundances over the study period remained overall constant. This may be due to the mechanisms involved in the production of mesoscale structures in the Celtic Sea that favor plankton production. Indeed, a substantial part of total primary production in the Celtic Sea is due to the tidally-induced semi-permanent mixing fronts that occur in the central part of the eastern Celtic shelf, i.e., the Ushant Front and the Celtic Sea Front. Contrary to other ecosystems in which productivity fronts are largely dependent on climatic conditions, tidal mixing fronts in the Celtic Sea can form simply under the mechanical action of wave activity, resulting in a more regular production in the Celtic Sea region, which is consistent with the production of mesozooplankton (Druon et al., 2019).
A Step Further Toward Ecosystem-Based Management?
This new EwE with Ecospace model of the Celtic Sea ecosystem represents a significant step forward in the integration of ecological realism in trophic modeling of the Celtic Sea ecosystem (Guénette and Gascuel, 2009; Bentorcha et al., 2017; Moullec et al., 2017). In the Celtic Sea, highly mixed-species fisheries catch a large diversity of fish assemblages and employ a large diversity of fishing techniques and strategies (Moore et al., 2019) that can result in highly different catch compositions for the same location over time (Martinez et al., 2013; Dolder et al., 2018). In this context, resource mapping and optimization of fishing practices in time and space have been identified as a critical need to reduce the ecosystem impacts of fishing in the Celtic Sea, e.g., by reducing unwanted catch (Dolder et al., 2018; Calderwood et al., 2019; Reid et al., 2019; Robert et al., 2019). The Celtic Sea Ecospace model reproduced the patterns observed during fisheries-independent surveys but also clearly identified the spatial structuration and species assemblages that were identified in some spatial studies of fisheries catch, based on logbooks and vessel monitoring systems (Gerritsen et al., 2012; Mateo et al., 2017).
The EwE with Ecospace model developed in this study represents a valuable tool for the spatial management of fishing activities in the Celtic Sea. In future studies, the Celtic Sea Ecospace model could be employed to produce multiple spatial food-web indicators to describe ecosystem status as part of ecosystem-based management (Tam et al., 2017), or to identify critical areas of the Celtic Sea in terms of diversity and functionalities (Babcock et al., 2005). As other ecosystem models, our EwE with Ecospace model could be also used to inform spatial zoning in the Celtic Sea (e.g., Kaplan et al., 2012; Abdou et al., 2016; Halouani et al., 2016) and other management regulations (e.g., relative to discarding practices, Pennino et al., 2020). Such framework can therefore provide great support to policies such as the Common Fisheries Policy (e.g., spatial fishing capacities) and the Marine Strategy Framework Directive (e.g., descriptor D3 commercially exploited fish, D4 food webs, e.g., Piroddi et al., 2015; Piroddi et al., submitted).
Although fishing appeared to be the main driver of changes in the Celtic Sea ecosystem over the three last decades, this may likely not be the case anymore in the future. While fishing pressure in the Celtic Sea region has been substantially reduced over the recent years and is still currently (slowly) declining, the relative stability of environmental conditions observed over the last two decades may likely not hold; projections of coupled physical and biogeochemical models under various CO2 emission scenarios predict a global increase in surface and bottom temperatures and a decline in primary production in the Celtic Sea ecosystem (Kay et al., 2018). In this context, similarly to previous temporal or spatio-temporal ecosystem modeling studies (Serpetti et al., 2017; Corrales et al., 2018; Moullec et al., 2019a), the calibrated the Celtic Sea Ecospace model would be a powerful tool to project the potential impacts of climate change on the regional living resources and the fisheries that these resources support.
Data Availability Statement
The original contributions presented in the study are included in the article/Supplementary Material, further inquiries can be directed to the corresponding author. The Celtic Sea Ecopath model at the core of this study can be accessed from EcoBase, the open-access database of Ecopath with Ecosim (EwE) models published worldwide in the scientfic literature. EcoBase is an information repository of EwE models freely accessible online at http://ecobase.ecopath.org/ or via the EwE software.
Author Contributions
P-YH designed the study, performed the main statistical analyses, and built and ran the ecosystem model. P-YH, J-ND, MR, DG, and IP provided and gathered the data used in the study. AG, J-ND, CP, and DG helped to and participated in designing and applying the habitat and trophic modeling approaches integrated in the present modeling framework. DG, MR, and DK contributed to the design of the integrated modeling framework. DG, MR, DK, AG, J-ND, CP, and IP contributed to results analysis and interpretation. This work was part of a Ph.D. project designed by DG, MR, and DK. P-YH led the drafting of the manuscript with the contributions and revisions from all the authors. All authors contributed to the article and approved the submitted version.
Funding
This work was part of a Ph.D. funded by the Région Bretagne and the French Institute for the Exploitation of the Sea (IFREMER). The temporary stay of the principal investigator at the Joint Research Center of the European Commission as part of this research project was funded by an international mobility grant from IFREMER.
Conflict of Interest
The authors declare that the research was conducted in the absence of any commercial or financial relationships that could be construed as a potential conflict of interest.
Acknowledgments
We are particularly grateful to the Joint Research Center of the European Commission who hosted the main investigator during his international mobility. We thank the CPR survey and David Jones for providing access to the plankton data. We also thank Dr. John Pinnegar (CEFAS) and Dr. Verena Trenkel (IFREMER) for access to the UK-WCGFS survey data.
Supplementary Material
The Supplementary Material for this article can be found online at: https://www.frontiersin.org/articles/10.3389/fmars.2020.578717/full#supplementary-material
Footnotes
- ^ https://github.com/pyhernvann/EcoDiet
- ^ https://cran.r-project.org/web/packages/EcoDiet/index.html
- ^ https://www.metoffice.gov.uk/
- ^ http://sites.science.oregonstate.edu/ocean.productivity/
- ^ https://marine.copernicus.eu/
- ^ https://www.ices.dk/data/data-portals/Pages/DATRAS.aspx
- ^ https://www.gebco.net/
- ^ https://www.emodnet-seabedhabitats.eu/
- ^ https://www.cprsurvey.org/
- ^ https://www.ices.dk/data/dataset-collections/Pages/Fish-catch-and-stock-assessment.aspx
References
Abdou, K., Halouani, G., Hattab, T., Romdhane, M. S., Frida Ben, and Le Loc’h, F. (2016). Exploring the potential effects of marine protected areas on the ecosystem structure of the Gulf of Gabes using the Ecospace model. Aquat. Living Resour. 29:202. doi: 10.1051/alr/2016014
Agnetta, D., Badalamenti, F., Colloca, F., D’Anna, G., Di Lorenzo, M., Fiorentino, F., et al. (2019). Benthic-pelagic coupling mediates interactions in Mediterranean mixed fisheries: an ecosystem modeling approach. PLoS One 14:e0210659. doi: 10.1371/journal.pone.0210659
Ahrens, R. N. M., Walters, C. J., and Christensen, V. (2012). Foraging arena theory: foraging arena theory. Fish Fish. 13, 41–59. doi: 10.1111/j.1467-2979.2011.00432.x
Ainsworth, C., and Pitcher, T. (2006). Modifying Kempton’s species diversity index for use with ecosystem simulation models. Ecol. Indic. 6, 623–630. doi: 10.1016/j.ecolind.2005.08.024
Akaike, H. (1974). A new look at the statistical model identification. IEEE Trans. Automatic Control 19, 716–723. doi: 10.1109/TAC.1974.1100705
Albouy, C., Velez, L., Coll, M., Colloca, F., Le Loc’h, F., Mouillot, D., et al. (2014). From projected species distribution to food-web structure under climate change. Glob. Change Biol. 20, 730–741. doi: 10.1111/gcb.12467
Araújo, J., and Bundy, A. (2012). Effects of environmental change, fisheries and trophodynamics on the ecosystem of the western Scotian Shelf, Canada. Mar. Ecol. Prog. Ser. 464, 51–67. doi: 10.3354/meps09792
Auber, A., Gohin, F., Goascoz, N., and Schlaich, I. (2017). Decline of cold-water fish species in the Bay of Somme (English Channel, France) in response to ocean warming. Estuar. Coast. Shelf Sci. 189, 189–202. doi: 10.1016/j.ecss.2017.03.010
Auber, A., Travers-Trolet, M., Villanueva, M. C., and Ernande, B. (2015). Regime shift in an exploited fish community related to natural climate oscillations. PLoS One 10:e0129883. doi: 10.1371/journal.pone.0129883
Audzijonyte, A., Pethybridge, H., Porobic, J., Gorton, R., Kaplan, I., and Fulton, E. A. (2019). Atlantis: a spatially explicit end-to-end marine ecosystem model with dynamically integrated physics, ecology and socio-economic modules. Methods Ecol. Evol. 10, 1814–1819. doi: 10.1111/2041-210X.13272
Babcock, E. A., Pikitch, E. K., McAllister, M. K., Apostolaki, P., and Santora, C. (2005). A perspective on the use of spatialized indicators for ecosystem-based fishery management through spatial zoning. ICES J. Mar. Sci. 62, 469–476. doi: 10.1016/j.icesjms.2005.01.010
Baretta, J. W., Ebenhöh, W., and Ruardij, P. (1995). The European regional seas ecosystem model, a complex marine ecosystem model. Neth. J. Sea Res. 33, 233–246. doi: 10.1016/0077-7579(95)90047-0
Barnett, A., and Semmens, J. M. (2012). Sequential movement into coastal habitats and high spatial overlap of predator and prey suggest high predation pressure in protected areas. Oikos 121, 882–890. doi: 10.1111/j.1600-0706.2011.20000.x
Baudron, A. R., Brunel, T., Blanchet, M., Hidalgo, M., Chust, G., Brown, E. J., et al. (2020). Changing fish distributions challenge the effective management of European fisheries. Ecography 43, 494–505. doi: 10.1111/ecog.04864
Beaugrand, G., Ibañez, F., and Reid, P. (2000). Spatial, seasonal and long-term fluctuations of plankton in relation to hydroclimatic features in the English Channel, Celtic Sea and Bay of Biscay. Mar. Ecol. Prog. Ser. 200, 93–102. doi: 10.3354/meps200093
Behrenfeld, M. J., and Falkowski, P. G. (1997). Photosynthetic rates derived from satellite-based chlorophyll concentration. Limnol. Oceanogr. 42, 1–20. doi: 10.4319/lo.1997.42.1.0001
Bentley, J., Serpetti, N., Fox, C. J., Reid, D. G., and Heymans, J. J. (2019). Modelling the Food Web in the Irish Sea in the Context of a Depleted Commercial Fish Community. Part 2: ICES Ecopath with Ecosim Key Run. Oban: Scottish Association for Marine Science. doi: 10.13140/RG.2.2.15136.12809
Bentley, J. W., Serpetti, N., Fox, C. J., Heymans, J. J., and Reid, D. G. (2020). Retrospective analysis of the influence of environmental drivers on commercial stocks and fishing opportunities in the Irish Sea. Fish. Oceanogr. 29, 415–435. doi: 10.1111/fog.12486
Bentley, J. W., Serpetti, N., and Heymans, J. J. (2017). Investigating the potential impacts of ocean warming on the Norwegian and Barents Seas ecosystem using a time-dynamic food-web model. Ecol. Model. 360, 94–107. doi: 10.1016/j.ecolmodel.2017.07.002
Bentorcha, A., Gascuel, D., and Guénette, S. (2017). Using trophic models to assess the impact of fishing in the Bay of Biscay and the Celtic Sea. Aquat. Living Resour. 30:7. doi: 10.1051/alr/2017006
Blanchard, F., and Vandermeirsch, F. (2005). Warming and exponential abundance increase of the subtropical fish Capros aper in the Bay of Biscay (1973–2002). C. R. Biol. 328, 505–509. doi: 10.1016/j.crvi.2004.12.006
Blanchard, J. L., Dulvy, N. K., Jennings, S., Ellis, J. R., Pinnegar, J. K., Tidd, A., et al. (2005). Do climate and fishing influence size-based indicators of Celtic Sea fish community structure? ICES J. Mar. Sci. 62, 405–411. doi: 10.1016/j.icesjms.2005.01.006
Blanchard, J. L., Law, R., Castle, M. D., and Jennings, S. (2011). Coupled energy pathways and the resilience of size-structured food webs. Theor. Ecol. 4, 289–300. doi: 10.1007/s12080-010-0078-9
Bourdaud, P., Gascuel, D., Bentorcha, A., and Brind’Amour, A. (2016). New trophic indicators and target values for an ecosystem-based management of fisheries. Ecol. Indic. 61(Part 2), 588–601. doi: 10.1016/j.ecolind.2015.10.010
Brophy, D. (2002). Tracing populations of Atlantic herring (Clupea harengus L.) in the Irish and Celtic Seas using otolith microstructure. ICES J. Mar. Sci. 59, 1305–1313. doi: 10.1006/jmsc.2002.1304
Brunel, T., and Boucher, J. (2007). Long-term trends in fish recruitment in the north-east Atlantic related to climate change. Fish. Oceanogr. 116: 16 336–349. doi: 10.1111/j.1365-2419.2007.00435.x
Calderwood, J., Robert, M., Pawlowski, L., Vermard, Y., Radford, Z., Catchpole, T. L., et al. (2019). Hotspot mapping in the Celtic Sea: an interactive tool using multinational data to optimise fishing practices. Mar. Policy 116: 103511. doi: 10.1016/j.marpol.2019.103511
Chase, J. M., and Leibold, M. A. (2003). Ecological Niches: Linking Classical and Contemporary Approaches, Interspecific Interactions. Chicago, IL: University of Chicago Press.
Chassot, E., Bonhommeau, S., Reygondeau, G., Nieto, K., Polovina, J. J., Huret, M., et al. (2011). Satellite remote sensing for an ecosystem approach to fisheries management. ICES J. Mar. Sci. 68, 651–666. doi: 10.1093/icesjms/fsq195
Chassot, E., Rouyer, T., Trenkel, V. M., and Gascuel, D. (2008). Investigating trophic-level variability in Celtic Sea fish predators. J. Fish Biol. 73, 763–781. doi: 10.1111/j.1095-8649.2008.01938.x
Christensen, V., Coll, M., Steenbeek, J., Buszowski, J., Chagaris, D., and Walters, C. J. (2014). Representing variable habitat quality in a spatial food web model. Ecosystems 17, 1397–1412. doi: 10.1007/s10021-014-9803-3
Christensen, V., and Walters, C. J. (2004). Ecopath with Ecosim: methods, capabilities and limitations. Ecol. Model. 172, 109–139. doi: 10.1016/j.ecolmodel.2003.09.003
Christensen, V., Walters, C. J., Ahrens, R., Alder, J., Buszowski, J., Christensen, L. B., et al. (2009). Database-driven models of the world’s large marine ecosystems. Ecol. Model. 220, 1984–1996. doi: 10.1016/j.ecolmodel.2009.04.041
Christensen, V., Walters, C. J., and Pauly, D. (2008). Ecopath with Ecosim version 6 user guide. Lenfest Ocean Futures Project 2008. Vancouver: University of British Columbia.
Citores, L., Ibaibarriaga, L., Lee, D.-J., Brewer, M. J., Santos, M., and Chust, G. (2020). Modelling species presence–absence in the ecological niche theory framework using shape-constrained generalized additive models. Ecol. Model. 418:108926. doi: 10.1016/j.ecolmodel.2019.108926
Coad, J. O. (2012). Boom in Boarfish Abundance: Insight from Otolith Analysis. Available online at: http://ices.dk/products/CMdocs/CM-2012/J/J1012.pdf
Coll, M., Pennino, M. G., Steenbeek, J., Sole, J., and Bellido, J. M. (2019). Predicting marine species distributions: complementarity of food-web and Bayesian hierarchical modelling approaches. Ecol. Model. 405, 86–101. doi: 10.1016/j.ecolmodel.2019.05.005
Coll, M., and Steenbeek, J. (2017). Standardized ecological indicators to assess aquatic food webs: the ECOIND software plug-in for Ecopath with Ecosim models. Environ. Model. Softw. 89, 120–130. doi: 10.1016/j.envsoft.2016.12.004
Coll, M., Steenbeek, J., Sole, J., Palomera, I., and Christensen, V. (2016). Modelling the cumulative spatial–temporal effects of environmental drivers and fishing in a NW Mediterranean marine ecosystem. Ecol. Model. 331, 100–114. doi: 10.1016/j.ecolmodel.2016.03.020
Corrales, X., Coll, M., Ofir, E., Heymans, J. J., Steenbeek, J., Goren, M., et al. (2018). Future scenarios of marine resources and ecosystem conditions in the Eastern Mediterranean under the impacts of fishing, alien species and sea warming. Sci. Rep. 8:14284. doi: 10.1038/s41598-018-32666-x
Cronne, L. (2016). SISP 15 - manual of the IBTS North Eastern Atlantic surveys. Ser. ICES Surv. Protoc. SISP 15:92. doi: 10.17895/ices.pub.3519
Dahood, A., Watters, G. M., and de Mutsert, K. (2019). Using sea-ice to calibrate a dynamic trophic model for the Western Antarctic Peninsula. PLoS One 14:e0214814. doi: 10.1371/journal.pone.0214814
Day, L., Kopp, D., Robert, M., and Le Bris, H. (2019). Trophic ecology of large gadiforms in the food web of a continental shelf ecosystem. Prog. Oceanogr. 175, 105–114. doi: 10.1016/j.pocean.2019.03.007
Dinter, W. P. (2001). Biogeography of the OSPAR Maritime Area: A Synopsis and Synthesis of Biogeographical Distribution Patterns Described for the North East Atlantic. Bonn: Federal Agency for Nature Conservation.
Dolder, P. J., Thorson, J. T., and Minto, C. (2018). Spatial separation of catches in highly mixed fisheries. Sci. Rep. 8:13886. doi: 10.1038/s41598-018-31881-w
Druon, J.-N., Hélaouët, P., Beaugrand, G., Fromentin, J.-M., Palialexis, A., and Hoepffner, N. (2019). Satellite-based indicator of zooplankton distribution for global monitoring. Sci. Rep. 9:4732. doi: 10.1038/s41598-019-41212-2
Druon, J. N., Langlois, G., and Le Fèvre, J. (2001). Simulating vertical mixing in a shelf-break region: addition of a shear instability model, accounting for the overall effect of internal tides, on top of a one-dimensional turbulence closure mixed layer model. Cont. Shelf Res. 21, 423–454. doi: 10.1016/S0278-4343(00)00090-X
Duhamel, E., Pawlowski, L., and Garren, F. (2018). EVHOE 2018 cruise, Thalassa R/V. Available online at: https://campagnes.flotteoceanographique.fr/campagnes/18000518/ (accessed July 1, 2020).
Dulvy, N. K., Rogers, S. I., Jennings, S., Stelzenmller, V., Dye, S. R., and Skjoldal, H. R. (2008). Climate change and deepening of the North Sea fish assemblage: a biotic indicator of warming seas. J. Appl. Ecol. 45, 1029–1039. doi: 10.1111/j.1365-2664.2008.01488.x
Dunn, M. R., and Pawson, M. G. (2002). The stock structure and migrations of plaice populations on the west coast of England and Wales. J. Fish Biol. 61, 360–393. doi: 10.1111/j.1095-8649.2002.tb01571.x
Edwards, K. P., Barciela, R., and Butenschön, M. (2012). Validation of the NEMO-ERSEM operational ecosystem model for the North West European Continental Shelf. Ocean Sci. 8, 983–1000. doi: 10.5194/os-8-983-2012
Ellis, J. R., Lancaster, J. E., Cadman, P. S., and Rogers, S. I. (2002). “The marine fauna of the Celtic Sea,” in Marine Biodiversity in Ireland and Adjacent Waters, ed. J. D. Nuun (Belfasts: Ulster Museum), 45–46.
Ellis, J. R., Martinez, I., Burt, G. J., and Scott, B. E. (2013). Epibenthic assemblages in the Celtic Sea and associated with the Jones Bank. Prog. Oceanogr. 117, 76–88. doi: 10.1016/j.pocean.2013.06.012
Ellis, J. R., Rogers, S. I., and Freeman, S. M. (2000). Demersal Assemblages in the Irish Sea, St George’s Channel and Bristol Channel. Estuar. Coast. Shelf Sci. 51, 299–315. doi: 10.1006/ecss.2000.0677
Farmer, N. A., and Karnauskas, M. (2013). Spatial distribution and conservation of speckled hind and warsaw grouper in the Atlantic Ocean off the southeastern US. PloS one, 8:e78682. doi: 10.1371/journal.pone.0078682
Fulton, E. A., Parslow, J. S., Smith, A. D. M., and Johnson, C. R. (2004). Biogeochemical marine ecosystem models II: the effect of physiological detail on model performance. Ecol. Model. 173, 371–406. doi: 10.1016/j.ecolmodel.2003.09.024
Gardner, M. B. (1981). Effects of turbidity on feeding rates and selectivity of bluegills. Trans. Am. Fish. Soc. 110, 446–450. doi: 10.1577/1548-8659(1981)110<446:eotofr>2.0.co;2
Gascuel, D., Coll, M., Fox, C., Guénette, S., Guitton, J., Kenny, A., et al. (2016). Fishing impact and environmental status in European seas: a diagnosis from stock assessments and ecosystem indicators. Fish Fish. 17, 31–55. doi: 10.1111/faf.12090
Genner, M. J., Sims, D. W., Wearmouth, V. J., Southall, E. J., Southward, A. J., Henderson, P. A., et al. (2004). Regional climatic warming drives long–term community changes of British marine fish. Proc. R. Soc. Lond. Ser. B Biol. Sci. 271, 655–661. doi: 10.1098/rspb.2003.2651
Gerritsen, H. D., Lordan, C., Minto, C., and Kraak, S. B. M. (2012). Spatial patterns in the retained catch composition of Irish demersal otter trawlers: high-resolution fisheries data as a management tool. Fish. Res. 129–130, 127–136. doi: 10.1016/j.fishres.2012.06.019
Giering, S. L. C., Wells, S. R., Mayers, K. M. J., Schuster, H., Cornwell, L., Fileman, E. S., et al. (2019). Seasonal variation of zooplankton community structure and trophic position in the Celtic Sea: a stable isotope and biovolume spectrum approach. Prog. Oceanogr. 177:101943. doi: 10.1016/j.pocean.2018.03.012
Giraldo, C., Ernande, B., Cresson, P., Kopp, D., Cachera, M., Travers-Trolet, M., et al. (2017). Depth gradient in the resource use of a fish community from a semi-enclosed sea. Limnol. Oceanogr. 62, 2213–2226. doi: 10.1002/lno.10561
Gravel, D., Canard, E., Guichard, F., and Mouquet, N. (2011). Persistence increases with diversity and connectance in trophic metacommunities. PLoS One 6:e19374. doi: 10.1371/journal.pone.0019374
Grüss, A., Babcock, E. A., Sagarese, S. R., Drexler, M., Chagaris, D. D., Ainsworth, C. H., et al. (2016). Improving the spatial allocation of functional group biomasses in spatially-explicit ecosystem models: insights from three Gulf of Mexico models. Bull. Mar. Sci. 92, 473–496. doi: 10.5343/bms.2016.1057
Grüss, A., Chagaris, D. D., Babcock, E. A., and Tarnecki, J. H. (2018). Assisting ecosystem-based fisheries management efforts using a comprehensive survey database, a large environmental database, and generalized additive models. Trans. Am. Fish. Soc. 10, 40–70. doi: 10.1002/mcf2.10002
Grüss, A., Rose, K. A., Justiæ, D., and Wang, L. (2020). Making the most of available monitoring data: a grid-summarization method to allow for the combined use of monitoring data collected at random and fixed sampling stations. Fish. Res. 229:105623. doi: 10.1016/j.fishres.2020.105623
Guénette, S., and Gascuel, D. (2009). “Considering Both Fishing and Climate in a model of the Celtic Sea and the Bay of Biscay: what do we learn?” in Proceedings of the International Council for the Exploration of the Sea, Annual Science Conference, Berlin.
Guénette, S., and Gascuel, D. (2012). Shifting baselines in European fisheries: the case of the Celtic Sea and Bay of Biscay. Ocean Coast. Manage. 70, 10–21. doi: 10.1016/j.ocecoaman.2012.06.010
Halouani, G., Ben Rais, Lasram, F., Shin, Y.-J., Velez, L., Verley, P., et al. (2016). Modelling food web structure using an end-to-end approach in the coastal ecosystem of the Gulf of Gabes (Tunisia). Ecol. Model. 339, 45–57. doi: 10.1016/j.ecolmodel.2016.08.008
Hansson, S. (1984). Competition as a Factor Regulating the Geographical Distribution of Fish Species in a Baltic Archipelago: a neutral model analysis. J. Biogeogr. 11, 367–381. doi: 10.2307/2844802
Hawkins, S. J., Southward, A. J., and Genner, M. J. (2003). Detection of environmental change in a marine ecosystem—evidence from the western English Channel. Sci. Total Environ. Detect. Environ. Change 310, 245–256. doi: 10.1016/S0048-9697(02)00645-9
Hernvann, P.-Y., and Gascuel, D. (2020). Exploring the impacts of fishing and environment on the Celtic Sea ecosystem since 1950. Fish. Res. 225:105472. doi: 10.1016/j.fishres.2019.105472
Heymans, J. J., Coll, M., Link, J. S., Mackinson, S., Steenbeek, J., Walters, C., et al. (2016). Best practice in Ecopath with Ecosim food-web models for ecosystem-based management. Ecol. Model. 331, 173–184. doi: 10.1016/j.ecolmodel.2015.12.007
Hickman, A., Moore, C., Sharples, J., Lucas, M., Tilstone, G., Krivtsov, V., et al. (2012). Primary production and nitrate uptake within the seasonal thermocline of a stratified shelf sea. Mar. Ecol. Prog. Ser. 463, 39–57. doi: 10.3354/meps09836
Hiddink, J. G., and ter Hofstede, R. (2008). Climate induced increases in species richness of marine fishes. Glob. Change Biol. 14, 453–460. doi: 10.1111/j.1365-2486.2007.01518.x
Holligan, P. M., and Groom, S. B. (1986). Phytoplankton distributions along the shelf break. Proc. R. Soc. Edinb. Sect. B Biol. Sci. 88, 239–263. doi: 10.1017/S0269727000004589
Holling, C. S. (1959). The components of predation as revealed by a study of small-mammal predation of the european pine sawfly. Can. Entomol. 91, 293–320. doi: 10.4039/Ent91293-5
Hughes, S. L., Tinker, J., and Dye, S. (2017). Temperature. MCCIP Science Review 2017. MCCIP Science Review 2017. 22–41. Available online at: http://www.mccip.org.uk/media/1750/2017arc_sciencereview_003_tem.pdf (accessed July 1, 2020).
Hunsicker, M. E., Ciannelli, L., Bailey, K. M., Buckel, J. A., Wilson White, J., Link, J. S., et al. (2011). Functional responses and scaling in predator-prey interactions of marine fishes: contemporary issues and emerging concepts. Ecol. Lett. 14, 1288–1299. doi: 10.1111/j.1461-0248.2011.01696.x
Hutchinson, G. E. (1957). Concluding Remarks. Cold Spring Harb. Symp. Quant. Biol. 22, 415–427. doi: 10.1101/SQB.1957.022.01.039
Huxel, G. R., and McCann, K. (1998). Food web stability: the influence of trophic flows across habitats. Am. Nat. 152, 460–469. doi: 10.1086/286182
Issac, P., Robert, M., Le Bris, H., Rault, J., Pawlowski, L., and Kopp, D. (2017). Investigating feeding ecology of two anglerfish species, Lophius piscatorius and Lophius budegassa in the Celtic Sea using gut content and isotopic analyses. Food Webs 13, 33–37. doi: 10.1016/j.fooweb.2017.08.001
Johns, D. (2019). Monthly Averaged Data for Diatoms, Dinoflagellates, Small Copepods, Large Copepods, and Various Taxonomic Groups of Zooplankton in the D4 CPR Standard Area 1958–2016 as Recorded by the Continuous Plankton Recorder Survey. Plymouth, MA: CPR survey. doi: 10.7487/2019.150.1.1197
Joint, I., Wollast, R., Chou, L., Batten, S., Elskens, M., Edwards, E., et al. (2001). Pelagic production at the Celtic Sea shelf break. Deep Sea Res. Part II Top. Stud. Oceanogr. 48, 3049–3081. doi: 10.1016/S0967-0645(01)00032-7
Joint, I. R., and Williams, R. (1985). Demands of the herbivore community on phytoplankton production in the Celtic Sea in August. Mar. Biol. 87, 297–306. doi: 10.1007/BF00397809
Jones, M. C., Dye, S. R., Pinnegar, J. K., Warren, R., and Cheung, W. W. L. (2012). Modelling commercial fish distributions: prediction and assessment using different approaches. Ecol. Model. 225, 133–145. doi: 10.1016/j.ecolmodel.2011.11.003
Jordan, M. B., and Joint, I. R. (1984). Studies on phytoplankton distribution and primary production in the western English Channel in 1980 and 1981. Cont. Shelf Res. 3, 25–34. doi: 10.1016/0278-4343(84)90041-4
Kaiser, M. J., Armstrong, P. J., Dare, P. J., and Flatt, R. P. (1998). Benthic communities associated with a heavily fished scallop ground in the english channel. J. Mar. Biol. Assoc. U.K. 78, 1045–1059. doi: 10.1017/S0025315400044313
Kaiser, M. J., Bergmann, M., Hinz, H., Galanidi, M., Shucksmith, R., Rees, E. I. S., et al. (2004). Demersal fish and epifauna associated with sandbank habitats. Estuar. Coast. Shelf Sci. 60, 445–456. doi: 10.1016/j.ecss.2004.02.005
Kaplan, I. C., Horne, P. J., and Levin, P. S. (2012). Screening California Current fishery management scenarios using the Atlantis end-to-end ecosystem model. Prog. Oceanogr. 102, 5–18. doi: 10.1016/j.pocean.2012.03.009
Kay, S., Anderson, H., Eilola, K., Wehde, H., Ramirez-Romero, E., Jordà, G., et al. (2018). Climate Change and European Aquatic RESources - Deliverable D1.3 Projections of Physical and Biogeochemical Parameters and Habitat Indicators for European Seas, Including Synthesis of Sea Level Rise and Storminess. Plymouth: Plymouth Marine Laboratory (PML).
Kortsch, S., Primicerio, R., Aschan, M., Lind, S., Dolgov, A. V., and Planque, B. (2019). Food-web structure varies along environmental gradients in a high-latitude marine ecosystem. Ecography 42, 295–308. doi: 10.1111/ecog.03443
Kortsch, S., Primicerio, R., Fossheim, M., Dolgov, A. V., and Aschan, M. (2015). Climate change alters the structure of arctic marine food webs due to poleward shifts of boreal generalists. Proc. R. Soc. B Biol. Sci. 282:20151546. doi: 10.1098/rspb.2015.1546
Kramer, S. J., Roesler, C. S., and Sosik, H. M. (2018). Bio-optical discrimination of diatoms from other phytoplankton in the surface ocean: evaluation and refinement of a model for the Northwest Atlantic. Remote Sens. Environ. 217, 126–143. doi: 10.1016/j.rse.2018.08.010
Le Danois, E. (1948). Les Profondeurs de la mer; Trente ans de Recherches sur la Faune Sous-Marine au Large des Côtes de France. Paris: Payot.
Le Fèvre, J. (1987). Aspects of the biology of frontal systems. Adv. Mar. Biol. 23, 163–299. doi: 10.1016/S0065-2881(08)60109-1
Libralato, S. (2013). “System Omnivory Index,” in Encyclopedia of Ecology, ed. B. Fath (Amsterdam: Elsevier), 481–486. doi: 10.1016/B978-0-12-409548-9.00605-9
Libralato, S., Pranovi, F., Stergiou, K., and Link, J. (2014). Trophodynamics in marine ecology: 70 years after Lindeman. Mar. Ecol. Prog. Ser. 512, 1–7. doi: 10.3354/meps11033
Libralato, S., and Solidoro, C. (2009). Bridging biogeochemical and food web models for an End-to-End representation of marine ecosystem dynamics: the Venice lagoon case study. Ecol. Model. 220, 2960–2971. doi: 10.1016/j.ecolmodel.2009.08.017
Link, J. S. (2010). Adding rigor to ecological network models by evaluating a set of pre-balance diagnostics: a plea for PREBAL. Ecol. Model. 221, 1580–1591. doi: 10.1016/j.ecolmodel.2010.03.012
Logerwell, E. A., and Hargreaves, N. B. (1996). The distribution of sea birds relative to their fish prey off Vancouver Island: opposing results at large and small spatial scales. Fish. Oceanogr. 5, 163–175. doi: 10.1111/j.1365-2419.1996.tb00115.x
Lowerre-Barbieri, S. K., Catalán, I. A., Frugård Opdal, A., and Jørgensen, C. (2019). Preparing for the future: integrating spatial ecology into ecosystem-based management. ICES J. Mar. Sci. 76, 467–476. doi: 10.1093/icesjms/fsy209
Mackinson, S. (2014). Combined analyses reveal environmentally driven changes in the North Sea ecosystem and raise questions regarding what makes an ecosystem model’s performance credible? Can. J. Fish. Aquat. Sci. 71, 31–46. doi: 10.1139/cjfas-2013-0173
Mackinson, S., Daskalov, G., Heymans, J. J., Neira, S., Arancibia, H., Zetina-Rejón, M., et al. (2009). Which forcing factors fit? Using ecosystem models to investigate the relative influence of fishing and changes in primary productivity on the dynamics of marine ecosystems. Ecol. Model. 220, 2972–2987. doi: 10.1016/j.ecolmodel.2008.10.021
Martinez, I., Ellis, J. R., Scott, B., and Tidd, A. (2013). The fish and fisheries of Jones Bank and the wider Celtic Sea. Prog. Oceanogr. 117, 89–105. doi: 10.1016/j.pocean.2013.03.004
Mateo, M., Pawlowski, L., and Robert, M. (2017). Highly mixed fisheries: fine-scale spatial patterns in retained catches of French fisheries in the Celtic Sea. ICES J. Mar. Sci. 74, 91–101. doi: 10.1093/icesjms/fsw129
Maureaud, A., Hodapp, D., van Denderen, P. D., Hillebrand, H., Gislason, H., Spaanheden Dencker, T., et al. (2019). Biodiversity–ecosystem functioning relationships in fish communities: biomass is related to evenness and the environment, not to species richness. Proc. R. Soc. B Biol. Sci. 286:20191189. doi: 10.1098/rspb.2019.1189
McCann, K. S., Rasmussen, J. B., and Umbanhowar, J. (2005). The dynamics of spatially coupled food webs: spatially coupled food webs. Ecol. Lett. 8, 513–523. doi: 10.1111/j.1461-0248.2005.00742.x
McCormack, S. A., Trebilco, R., Melbourne-Thomas, J., Blanchard, J. L., Fulton, E. A., and Constable, A. (2019). Using stable isotope data to advance marine food web modelling. Rev. Fish Biol. Fish. 29, 277–296. doi: 10.1007/s11160-019-09552-4
McGinty, N., Power, A. M., and Johnson, M. P. (2011). Variation among northeast Atlantic regions in the responses of zooplankton to climate change: not all areas follow the same path. J. Exp. Mar. Biol. Ecol. 400, 120–131. doi: 10.1016/j.jembe.2011.02.013
Melian, C. J., and Bascompte, J. (2002). Food web structure and habitat loss. Ecol. Lett. 5, 37–46. doi: 10.1046/j.1461-0248.2002.00280.x
Menge, B. A., and Lubchenco, J. (1981). Community organization in temperate and tropical rocky intertidal habitats: prey refuges in relation to consumer pressure gradients. Ecol. Monogr. 51, 429–450. doi: 10.2307/2937323
Mérillet, L., Kopp, D., Robert, M., Mouchet, M., and Pavoine, S. (2020). Environment outweighs the effects of fishing in regulating demersal community structure in an exploited marine ecosystem. Glob. Change Biol. 26, 2106–2119. doi: 10.1111/gcb.14969
Montero-Serra, I., Edwards, M., and Genner, M. J. (2015). Warming shelf seas drive the subtropicalization of European pelagic fish communities. Glob. Change Biol. 21, 144–153. doi: 10.1111/gcb.12747
Moore, C., Davie, S., Robert, M., Pawlowski, L., Dolder, P., and Lordan, C. (2019). Defining métier for the Celtic Sea mixed fisheries: a multiannual international study of typology. Fish. Res. 219:105310. doi: 10.1016/j.fishres.2019.105310
Morel, A., and Berthon, J.-F. (1989). Surface pigments, algal biomass profiles, and potential production of the euphotic layer: relationships reinvestigated in view of remote-sensing applications. Limnol. Oceanogr. 34, 1545–1562. doi: 10.4319/lo.1989.34.8.1545
Moriarty, M., Sethi, S. A., Pedreschi, D., Smeltz, T. S., McGonigle, C., Harris, B. P., et al. (2020). Combining fisheries surveys to inform marine species distribution modelling. ICES J. Mar. Sci. 77, 539–552. doi: 10.1093/icesjms/fsz254
Mougi, A., and Kondoh, M. (2016). Food-web complexity, meta-community complexity and community stability. Sci. Rep. 6:24478. doi: 10.1038/srep24478
Moullec, F., Barrier, N., Drira, S., Guilhaumon, F., Marsaleix, P., Somot, S., et al. (2019a). An end-to-end model reveals losers and winners in a warming mediterranean sea. Front. Mar. Sci. 6:345. doi: 10.3389/fmars.2019.00345
Moullec, F., Velez, L., Verley, P., Barrier, N., Ulses, C., Carbonara, P., et al. (2019b). Capturing the big picture of Mediterranean marine biodiversity with an end-to-end model of climate and fishing impacts. Prog. Oceanogr. 178, 102179. doi: 10.1016/j.pocean.2019.102179
Moullec, F., Gascuel, D., Bentorcha, K., Guénette, S., and Robert, M. (2017). Trophic models: What do we learn about Celtic Sea and Bay of Biscay ecosystems? J. Mar. Syst. 172, 104–117. doi: 10.1016/j.jmarsys.2017.03.008
Murdoch, W. W. (1969). Switching in general predators: experiments on predator specificity and stability of prey populations. Ecol. Monogr. 39, 335–354. doi: 10.2307/1942352
Neat, F. C., Bendall, V., Berx, B., Wright, P. J., Ó Cuaig, M., Townhill, B., et al. (2014). Movement of Atlantic cod around the British Isles: implications for finer scale stock management. J. Appl. Ecol. 51, 1564–1574. doi: 10.1111/1365-2664.12343
Pade, N. G., Queiroz, N., Humphries, N. E., Witt, M. J., Jones, C. S., Noble, L. R., et al. (2009). First results from satellite-linked archival tagging of porbeagle shark, Lamna nasus: area fidelity, wider-scale movements and plasticity in diel depth changes. J. Exp. Mar. Biol. Ecol. 370, 64–74. doi: 10.1016/j.jembe.2008.12.002
Parker, R. A. (1991). Eddy diffusion of phytoplankton and nutrients: estimating coefficients from simulated and observed vertical distributions. J. Plankton Res. 13, 815–830. doi: 10.1093/plankt/13.4.815
Pauly, D., Christensen, V., and Walters, C. (2000). Ecopath, Ecosim, and Ecospace as tools for evaluating ecosystem impact of fisheries. ICES J. Mar. Sci. 57, 697–706. doi: 10.1006/jmsc.2000.0726
Pellissier, L., Albouy, C., Bascompte, J., Farwig, N., Graham, C., Loreau, M., et al. (2018). Comparing species interaction networks along environmental gradients: Networks along environmental gradients. Biol. Rev. 93, 785–800. doi: 10.1111/brv.12366
Pellissier, L., Rohr, R. P., Ndiribe, C., Pradervand, J.-N., Salamin, N., Guisan, A., et al. (2013). Combining food web and species distribution models for improved community projections. Ecol. Evol. 3, 4572–4583. doi: 10.1002/ece3.843
Pennino, M. G., Bevilacqua, A. H., Torres, M. A., Bellido, J. M., Sole, J., Steenbeek, J., et al. (2020). Discard ban: a simulation-based approach combining hierarchical Bayesian and food web spatial models. Mar. Policy 116:103703. doi: 10.1016/j.marpol.2019.103703
Persohn, C., Lorance, P., and Trenkel, V. M. (2009). Habitat preferences of selected demersal fish species in the Bay of Biscay and Celtic Sea, North-East Atlantic. Fish. Oceanogr. 18, 268–285. doi: 10.1111/j.1365-2419.2009.00515.x
Pethybridge, H. R., Choy, C. A., Polovina, J. J., and Fulton, E. A. (2018). Improving marine ecosystem models with biochemical tracers. Annu. Rev. Mar. Sci. 10, 199–228. doi: 10.1146/annurev-marine-121916-063256
Pingree, R. D. (1980). “Chapter 13 Physical Oceanography of the Celtic Sea and English Channel,” in Elsevier Oceanography Series, eds F. T. Banner, M. B. Collins, and K. S. Massie (Amsterdam: Elsevier), 415–465. doi: 10.1016/S0422-9894(08)71358-8
Pingree, R. D., Holligan, P. M., Mardell, G. T., and Head, R. N. (1976). The influence of physical stability on spring, summer and autumn phytoplankton blooms in the Celtic Sea. J. Mar. Biol. Assoc. U.K. 56, 845–873. doi: 10.1017/S0025315400020919
Pingree, R. D., Mardell, G. T., Holligan, P. M., Griffiths, D. K., and Smithers, J. (1982). Celtic Sea and Armorican current structure and the vertical distributions of temperature and chlorophyll. Cont. Shelf Res. 1, 99–116. doi: 10.1016/0278-4343(82)90033-4
Pinnegar, J. K., Jennings, S., O’Brien, C. M., and Polunin, N. V. C. (2002). Long-term changes in the trophic level of the Celtic Sea fish community and fish market price distribution. J. Appl. Ecol. 39, 377–390. doi: 10.1046/j.1365-2664.2002.00723.x
Piroddi, C., Coll, M., Liquete, C., Macias, D., Greer, K., Buszowski, J., et al. (2017). Historical changes of the Mediterranean Sea ecosystem: modelling the role and impact of primary productivity and fisheries changes over time. Sci. Rep. 7:44491. doi: 10.1038/srep44491
Piroddi, C., Teixeira, H., Lynam, C. P., Smith, C., Alvarez, M. C., Mazik, K., et al. (2015). Using ecological models to assess ecosystem status in support of the European Marine Strategy Framework Directive. Ecol. Indic. 58, 175–191. doi: 10.1016/j.ecolind.2015.05.037
Pitois, S. G., and Fox, C. J. (2006). Long-term changes in zooplankton biomass concentration and mean size over the Northwest European shelf inferred from Continuous Plankton Recorder data. ICES J. Mar. Sci. 63, 785–798. doi: 10.1016/j.icesjms.2006.03.009
Polis, G. A., Anderson, W. B., and Holt, R. D. (1997). Toward an integration of landscape and food-web ecology: the dynamics of spatially subsidized food webs. Annu. Rev. Ecol. Syst. 28, 289–316. doi: 10.1146/annurev.ecolsys.28.1.289
Polis, G. A., Holt, R. D., Menge, B. A., and Winemiller, K. O. (1996). “Time, space, and life history: influences on food webs,” in Food Webs, eds G. A. Polis and K. O. Winemiller (Boston, MA: Springer), 435–460. doi: 10.1007/978-1-4615-7007-3_38
Poulard, J.-C., and Blanchard, F. (2005). The impact of climate change on the fish community structure of the eastern continental shelf of the Bay of Biscay. ICES J. Mar. Sci. 62, 1436–1443. doi: 10.1016/j.icesjms.2005.04.017
Punzón, A., Serrano, A., Sánchez, F., Velasco, F., Preciado, I., González-Irusta, J. M., et al. (2016). Response of a temperate demersal fish community to global warming. J. Mar. Syst. 161, 1–10. doi: 10.1016/j.jmarsys.2016.05.001
Rault, J., Le Bris, H., Robert, M., Pawlowski, L., Denamiel, M., and Kopp, D. (2017). Diets and trophic niches of the main commercial fish species from the Celtic Sea. J. Fish Biol. 91, 1449–1474. doi: 10.1111/jfb.13470
Raymont, J. E. G. (1980). Plankton & Productivity in the Oceans, Second Edn. Oxford: Pergamon Press Ltd. doi: 10.1016/C2009-0-10951-0
Rees, H. (1999). A comparison of benthic biodiversity in the North Sea, English Channel, and Celtic Seas. ICES J. Mar. Sci. 56, 228–246. doi: 10.1006/jmsc.1998.0438
Reid, D. G. (2001). SEFOS-shelf edge fisheries and oceanography studies: an overview. Fish. Res. 50, 1–15. doi: 10.1016/S0165-7836(00)00238-1
Reid, D. G., Calderwood, J., Afonso, P., Bourdaud, P., Fauconnet, L., González-Irusta, J. M., et al. (2019). “The Best Way to Reduce Discards Is by Not Catching Them!,” in The European Landing Obligation, eds S. S. Uhlmann, C. Ulrich, and S. J. Kennelly (Cham: Springer), 257–278. doi: 10.1007/978-3-030-03308-8_13
Robert, M., Calderwood, J., Radford, Z., Catchpole, T., Reid, D. G., and Pawlowski, L. (2019). Spatial distribution of discards in mixed fisheries: species trade-offs, potential spatial avoidance and national contrasts. Rev. Fish Biol. Fish. 29, 917–934. doi: 10.1007/s11160-019-09581-z
Romagnoni, G., Mackinson, S., Hong, J., and Eikeset, A. M. (2015). The Ecospace model applied to the North Sea: evaluating spatial predictions with fish biomass and fishing effort data. Ecol. Model. 300, 50–60. doi: 10.1016/j.ecolmodel.2014.12.016
Rooney, N., McCann, K., Gellner, G., and Moore, J. C. (2006). Structural asymmetry and the stability of diverse food webs. Nature 442, 265–269. doi: 10.1038/nature04887
Scales, K. L., Miller, P. I., Hawkes, L. A., Ingram, S. N., Sims, D. W., and Votier, S. C. (2014). REVIEW: on the Front Line: frontal zones as priority at-sea conservation areas for mobile marine vertebrates. J. Appl. Ecol. 51, 1575–1583. doi: 10.1111/1365-2664.12330
Scott, E., Serpetti, N., Steenbeek, J., and Heymans, J. J. (2016). A Stepwise Fitting Procedure for automated fitting of Ecopath with Ecosim models. SoftwareX 5, 25–30. doi: 10.1016/j.softx.2016.02.002
Serpetti, N., Baudron, A. R., Burrows, M. T., Payne, B. L., Helaouët, P., Fernandes, P. G., et al. (2017). Impact of ocean warming on sustainable fisheries management informs the Ecosystem Approach to Fisheries. Sci. Rep. 7:13438. doi: 10.1038/s41598-017-13220-7
Sharples, J., Ellis, J. R., Nolan, G., and Scott, B. E. (2013). Fishing and the oceanography of a stratified shelf sea. Prog. Oceanogr. 117, 130–139. doi: 10.1016/j.pocean.2013.06.014
Sharples, J., Tweddle, J. F., Mattias Green, J. A., Palmer, M. R., Kim, Y.-N., Hickman, A. E., et al. (2007). Spring-neap modulation of internal tide mixing and vertical nitrate fluxes at a shelf edge in summer. Limnol. Oceanogr. 52, 1735–1747. doi: 10.4319/lo.2007.52.5.1735
Shephard, S., Fung, T., Houle, J. E., Farnsworth, K. D., Reid, D. G., and Rossberg, A. G. (2012). Size-selective fishing drives species composition in the Celtic Sea. ICES J. Mar. Sci. 69, 223–234. doi: 10.1093/icesjms/fsr200
Shephard, S., Reid, D. G., and Greenstreet, S. P. R. (2011). Interpreting the large fish indicator for the Celtic Sea. ICES J. Mar. Sci. 68, 1963–1972. doi: 10.1093/icesjms/fsr114
Shin, Y., and Cury, P. (2001). Exploring fish community dynamics through size-dependent trophic interactions using a spatialized individual-based model. Aquat. Living Resour. 14, 65–80. doi: 10.1016/S0990-7440(01)01106-8
Simpson, J. H. (1976). A boundary front in the summer regime of the Celtic Sea. Estuar. Coast. Mar. Sci. 4, 71–81. doi: 10.1016/0302-3524(76)90008-6
Simpson, S. D., Jennings, S., Johnson, M. P., Blanchard, J. L., Schön, P.-J., Sims, D. W., et al. (2011). Continental Shelf-Wide Response of a Fish Assemblage to Rapid Warming of the Sea. Curr. Biol. 21, 1565–1570. doi: 10.1016/j.cub.2011.08.016
Southward, A. J., Boalch, G. T., and Maddock, L. (1988). Fluctuations in the herring and pilchard fisheries of devon and cornwall linked to change in climate since the 16th century. J. Mar. Biol. Assoc. U.K. 68, 423–445. doi: 10.1017/S0025315400043320
Steenbeek, J., Buszowski, J., Christensen, V., Akoglu, E., Aydin, K., Ellis, N., et al. (2016). Ecopath with Ecosim as a model-building toolbox: source code capabilities, extensions, and variations. Ecol. Model. 319, 178–189. doi: 10.1016/j.ecolmodel.2015.06.031
Steenbeek, J., Coll, M., Gurney, L., Mélin, F., Hoepffner, N., Buszowski, J., et al. (2013). Bridging the gap between ecosystem modeling tools and geographic information systems: driving a food web model with external spatial–temporal data. Ecol. Model. 263, 139–151. doi: 10.1016/j.ecolmodel.2013.04.027
Steenbeek, J., Corrales, X., Platts, M., and Coll, M. (2018). Ecosampler: a new approach to assessing parameter uncertainty in Ecopath with Ecosim. SoftwareX 7, 198–204. doi: 10.1016/j.softx.2018.06.004
Tam, J. C., Link, J. S., Rossberg, A. G., Rogers, S. I., Levin, P. S., Rochet, M.-J., et al. (2017). Towards ecosystem-based management: identifying operational food-web indicators for marine ecosystems. ICES J. Mar. Sci. 74, 2040–2052. doi: 10.1093/icesjms/fsw230
ter Hofstede, R., Hiddink, J., and Rijnsdorp, A. (2010). Regional warming changes fish species richness in the eastern North Atlantic Ocean. Mar. Ecol. Prog. Ser. 414, 1–9. doi: 10.3354/meps08753
Théro, H., Rivot, E., Robert, M., Guitton, J., Kopp, D., Gascuel, D., et al. (2020). EcoDiet. R package version 1.0.0.0. doi: 10.5281/zenodo.4081537
Tidd, A. N., and Warnes, S. (2006). Species Distributions from English Celtic Sea Groundfish Surveys, 1992–2003 (Science Series Technical Report). Lowestoft: Cefas.
Ting, M., Kushnir, Y., Seager, R., and Li, C. (2009). Forced and internal twentieth-century SST trends in the North Atlantic. J. Clim. 22, 1469–1481. doi: 10.1175/2008JCLI2561.1
Tinker, J. P., Howes, E. L., Wakelin, S., Menary, M., Kent, E., Berry, D., et al. (2020). The impacts of climate change on temperature (air and sea), relevant to the coastal and marine environment around the UK. MCCIP Sci. Rev. 2020, 1–30. doi: 10.14465/2020.ARC01.TEM
Tomczak, M. T., Niiranen, S., Hjerne, O., and Blenckner, T. (2012). Ecosystem flow dynamics in the Baltic Proper—Using a multi-trophic dataset as a basis for food–web modelling. Ecol. Model. 230, 123–147. doi: 10.1016/j.ecolmodel.2011.12.014
Torres, L. G., Read, A. J., and Halpin, P. (2008). Fine-scale habitat modeling of a top marine predator: Do prey data improve predictive capacity? Ecol. Appl. 18, 1702–1717. doi: 10.1890/07-1455.1
Travers, M., Shin, Y.-J., Jennings, S., and Cury, P. (2007). Towards end-to-end models for investigating the effects of climate and fishing in marine ecosystems. Prog. Oceanogr. 75, 751–770. doi: 10.1016/j.pocean.2007.08.001
Travers, M., Shin, Y.-J., Jennings, S., Machu, E., Huggett, J. A., Field, J. G., et al. (2009). Two-way coupling versus one-way forcing of plankton and fish models to predict ecosystem changes in the Benguela. Ecol. Model. 220, 3089–3099. doi: 10.1016/j.ecolmodel.2009.08.016
Trenkel, V., Pinnegar, J., Dawson, W., Du Buit, M., and Tidd, A. (2005). Spatial and temporal structure of predator-prey relationships in the Celtic Sea fish community. Mar. Ecol. Prog. Ser. 299, 257–268. doi: 10.3354/meps299257
Trenkel, V. M., Huse, G., MacKenzie, B. R., Alvarez, P., Arrizabalaga, H., Castonguay, M., et al. (2014). Comparative ecology of widely distributed pelagic fish species in the North Atlantic: implications for modelling climate and fisheries impacts. Prog. Oceanogr. 129, 219–243. doi: 10.1016/j.pocean.2014.04.030
Vallet, C., and Dauvin, J.-C. (1998). Composition and diversity of the benthic boundary layer macrofauna from the english channel. J. Mar. Biol. Assoc. U.K. 78, 387–409. doi: 10.1017/S0025315400041527
Walters, C. (1999). Ecospace: prediction of mesoscale spatial patterns in trophic relationships of exploited ecosystems, with emphasis on the impacts of marine protected areas. Ecosystems 2, 539–554. doi: 10.1007/s100219900101
Walters, C., Christensen, V., and Pauly, D. (1997). Structuring dynamic models of exploited ecosystems from trophic mass-balance assessments. Rev. Fish Biol. Fish. 7, 139–172. doi: 10.1023/A:1018479526149
Ward, T., Hoedt, F., McLeay, L., Dimmlich, W., Jackson, G., Rogers, P., et al. (2001). Have recent mass mortalities of the sardine Sardinops sagax facilitated an expansion in the distribution and abundance of the anchovy Engraulis australis in South Australia? Mar. Ecol. Prog. Ser. 220, 241–251. doi: 10.3354/meps220241
Warnes, S., and Jones, B. W. (1995). Species Distributions from English Celtic Sea Groundfish Surveys, 1984 to 1991 (Fisheries Research Technical Report). Lowestoft: MAFF Directorate of Fisheries Research.
Keywords: Celtic Sea, ecosystem modeling, habitat model, environment, Ecopath with Ecosim and Ecospace, primary production, fishing impact
Citation: Hernvann P-Y, Gascuel D, Grüss A, Druon J-N, Kopp D, Perez I, Piroddi C and Robert M (2020) The Celtic Sea Through Time and Space: Ecosystem Modeling to Unravel Fishing and Climate Change Impacts on Food-Web Structure and Dynamics. Front. Mar. Sci. 7:578717. doi: 10.3389/fmars.2020.578717
Received: 01 July 2020; Accepted: 03 November 2020;
Published: 08 December 2020.
Edited by:
Alida Bundy, Bedford Institute of Oceanography (BIO), CanadaReviewed by:
Júlio Neves De Araújo, Agência Paulista de Tecnologia dos Agronegócios (APTA), BrazilSamuel Shephard, Inland Fisheries Ireland, Ireland
Copyright © 2020 Hernvann, Gascuel, Grüss, Druon, Kopp, Perez, Piroddi and Robert. This is an open-access article distributed under the terms of the Creative Commons Attribution License (CC BY). The use, distribution or reproduction in other forums is permitted, provided the original author(s) and the copyright owner(s) are credited and that the original publication in this journal is cited, in accordance with accepted academic practice. No use, distribution or reproduction is permitted which does not comply with these terms.
*Correspondence: Pierre-Yves Hernvann, cGllcnJlLnl2ZXMuaGVybnZhbm5AZ21haWwuY29t