 Melissa K. Drown
 Amanda N. DeLiberto
 Douglas L. Crawford
 Marjorie F. Oleksiak
- School of Marine and Atmospheric Science, University of Miami Rosenstiel, Miami, FL, United States
Metabolic rate is often measured as a phenotype in evolutionary genetics, among other fields including many facets of physiology, behavior, and ecology, because it impacts organismal fitness, is repeatable and heritable, and is responsive to numerous environmental variables. Aquatic respirometry, a method used to measure metabolic rate, has allowed key questions in these fields to be investigated, namely: (1) why do individuals from the same population exhibit up to 3-fold differences in metabolic rate, (2) how does metabolic rate change during an individual’s lifetime, and (3) what metabolic rate is advantageous in a specific environment? Current respirometry studies often suffer from small sample sizes and rely on low throughput approaches to measure metabolic rate, making it difficult to answer these and other relevant ecological and evolutionary questions due to lack of power, failure to capture true biological variation, and confounding variables, like time, that are introduced due to limitations in methodology. Here we describe a scalable high-throughput intermittent flow respirometer (HIFR) design and use it to measure the metabolic rates of 19 aquatic animals in one night while reducing equipment costs and time by more than 50%.
Introduction
Metabolic rate is often measured as a phenotype in evolutionary genetics, among other fields including many facets of physiology, behavior, and ecology, because it impacts organismal fitness, is repeatable and heritable, and is responsive to numerous environmental variables (Christoffersen et al., 2007; Nespolo and Franco, 2007; Norin and Malte, 2011; Schulte, 2015; Pettersen et al., 2018). The relationship between metabolic rate and a variable of interest, such as temperature, oxygen availability, or toxicant exposure, has been investigated frequently, which has led to a rich literature on metabolic rates in many species (Nespolo et al., 2003; Everett and Crawford, 2010; Burton et al., 2011; Gaitan-Espitia et al., 2013; Gaitan-Espitia and Nespolo, 2014). Aquatic respirometry, a method used to measure metabolic rate, has allowed key questions in these fields to be investigated, namely: (1) why do individuals from the same population exhibit up to 3-fold differences in metabolic rate, (2) how does metabolic rate change during an individual’s lifetime, and (3) what metabolic rate is advantageous in a specific environment (Burton et al., 2011)? Although some studies have investigated these questions (see Brown et al., 2004; Norin and Malte, 2011; Norin and Gamperl, 2018; Pettersen et al., 2018; Christensen et al., 2020), an increase in the use of high-throughput approaches for aquatic respirometry would allow researchers to readily achieve the large sample sizes needed to address these and other questions by increasing power, accurately capturing the biological variation present in wild populations, and reducing the effects of confounding variables (like age, body condition, population genetics), which can change over time (Crawford and Oleksiak, 2007; Christensen et al., 2019).
Flow through respirometry, intermittent-flow respirometry (IFR), and closed respirometry are techniques used to measure metabolic rates in aquatic organisms (Steffensen, 1989). Flow through respirometry is achieved by measuring the amount of oxygen entering and leaving a chamber relative to the flow rate of air or water through the chamber (Svendsen et al., 2016b). In IFR the respirometer cycles between open and closed periods. During open periods the chamber is flushed to remove waste and oxygen is replenished, and during closed periods the animal is using oxygen sealed in the chamber (Figure 1; Rosewarne et al., 2016; Svendsen et al., 2016b). Closed respirometry places an organism in a sealed chamber of known volume and measures oxygen or carbon dioxide partial pressures at multiple time points throughout the trial. The sealed chamber during closed respirometry may result in the accumulation of nitrogenous waste and carbon dioxide, which can increase stress, and may cause loss of equilibrium (LOE) in aquatic organisms (Snyder et al., 2016).
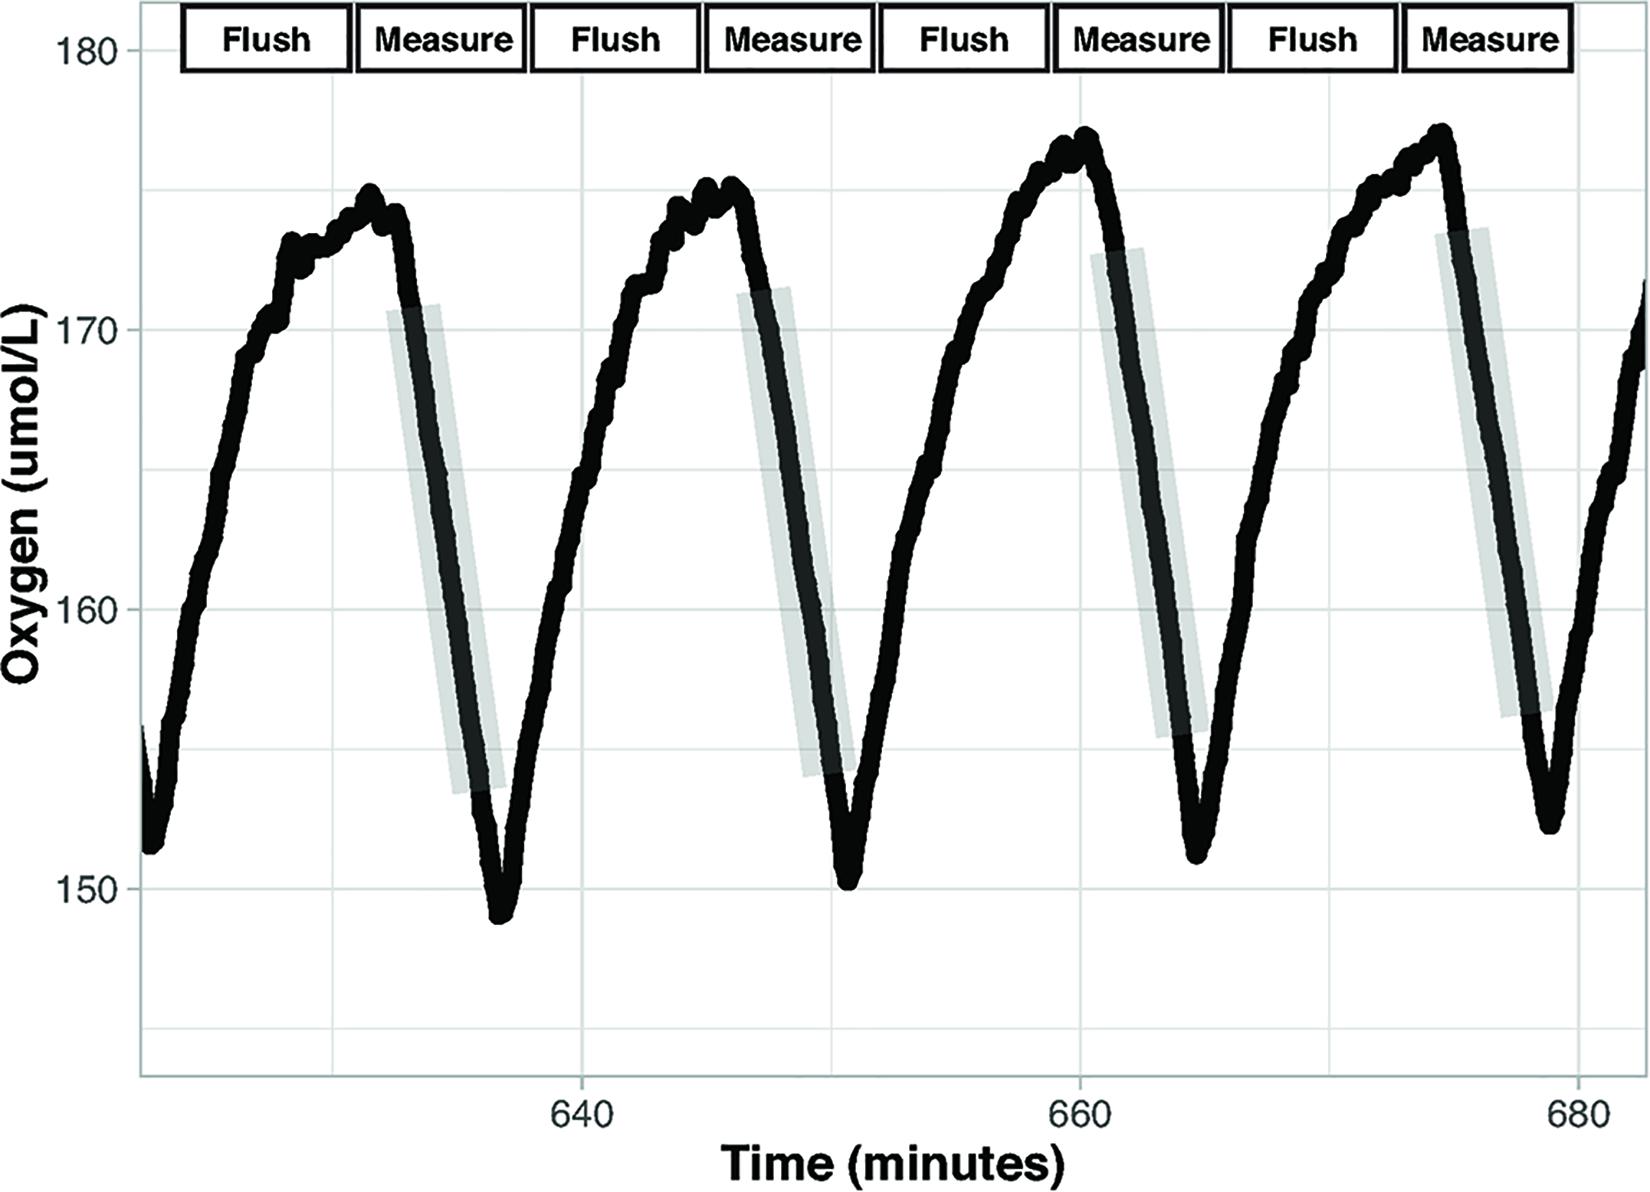
Figure 1. Intermittent flow respirometry. Oxygen concentration over time in a chamber during intermittent flow respirometry. There are two period types: Measurement and Flush. Measurement periods (gray shading) occur when the chamber is sealed, and the decrease in oxygen concentration reflects oxygen consumption by the organism. The slopes of the lines (oxygen vs. time) during the measurement periods are used to calculate metabolic rate. Flush periods are when the rapid increase in oxygen occurs as fully oxygenated water is pumped into the chamber. Data displayed are from the setup described here.
Flow-through respirometry and IFR methods may be applied to measure standard, resting, or maximum metabolic rate. In contrast, closed respirometry uses a single closed period and yields an average metabolic rate based on oxygen consumption at multiple time points as oxygen declines in the chamber (Tomlinson et al., 2018). Standard metabolic rate (SMR) is measured when an animal is at rest and in a post-absorptive state (i.e., fasting) (Chabot et al., 2016). Routine metabolic rate (RMR) includes spontaneous activity in animals that do not have a motionless rest cycle (Chabot et al., 2016). Maximum metabolic rate (MMR) is the highest maintainable metabolic rate an individual can achieve (Rosewarne et al., 2016).
To measure metabolic rate, swim tunnels or respirometers can be purchased. Both are widely available with a variety of oxygen sensing technologies and software packages. Typically, these swim tunnels or respirometers are designed to house one organism at a time for several hours or days in order to achieve a precise measure of metabolic rate, and they are often expensive to purchase as a complete measurement system (∼$20,000). Some companies additionally offer high-throughput versions (up to 8 chambers) for small animals; however, the cost remains high (>$2,000 per chamber when including software and oxygen sensing technology, e.g.,: Loligo complete mini chamber system) with variable cost depending on the size of the chambers desired. While some authors have indicated that they have the capacity to measure 8 or more individuals simultaneously and report measuring dozens of individuals (Killen et al., 2015; Norin et al., 2016, 2018), details of procedures and methods used as well as cost effectiveness are not publicly available. These restrictions make it challenging to measure metabolic rate rapidly for a large number of individuals without introducing time bias as the first and last individual may be measured weeks or months apart depending on sample size. With little known about the way metabolic rate changes within an individual’s lifetime (although see Norin and Gamperl, 2018), it is difficult to know how much variation among individuals is due to time vs. physiological differences in experiments entailing weeks to months between the first and last individual measurements (Burton et al., 2011). The limitation on throughput additionally prevents questions relevant to ecology and evolution from being answered as these questions often require a much larger sample size to achieve the necessary statistical power, which can be quite costly with current available methodologies. Given the high interindividual variation in metabolic rate, characterizing ten or twenty individuals at a given life stage or under specific treatment conditions may not capture the scope and shape of the physiological response to various stressors within a population or species and would inhibit the discovery of broad patterns across taxa (Burton et al., 2011; Pettersen et al., 2018). Additionally, due to the plasticity of metabolic rates in some species, measuring metabolic rate at one time point in one environment may not reflect an ecologically relevant trait (Norin et al., 2016). Thus, our ability to understand variation in metabolic rate will be limited until we are able to reasonably measure larger sample sizes for species or populations of interest or to obtain repeated measures of the same individuals across various timepoints and in various environments. Here we describe a scalable high-throughput intermittent flow respirometer (HIFR) design (high-throughput in sample size) and use it to measure the metabolic rate of 19 small teleost fish, Fundulus heteroclitus often used to address questions in physiology and genetics, in one night (Burnett et al., 2007).
Materials and Equipment
The custom HIFR system is a large water bath with a PVC rack that holds 20 glass chambers. Each chamber has tubing and pumps to flush the chamber and re-circulate water that passes by an oxygen sensor (Figure 2A). This design consists of 10 sets of paired chambers, where each pair uses one oxygen sensor, and electrical relays and one-way valves are used to control pump motion and water flow allowing a single chamber to be measured while the other is flushed (Figure 2B). This reduces the number of oxygen sensors (and oxygen meter channels) needed to measured a set of individuals, and reduces overall system costs.
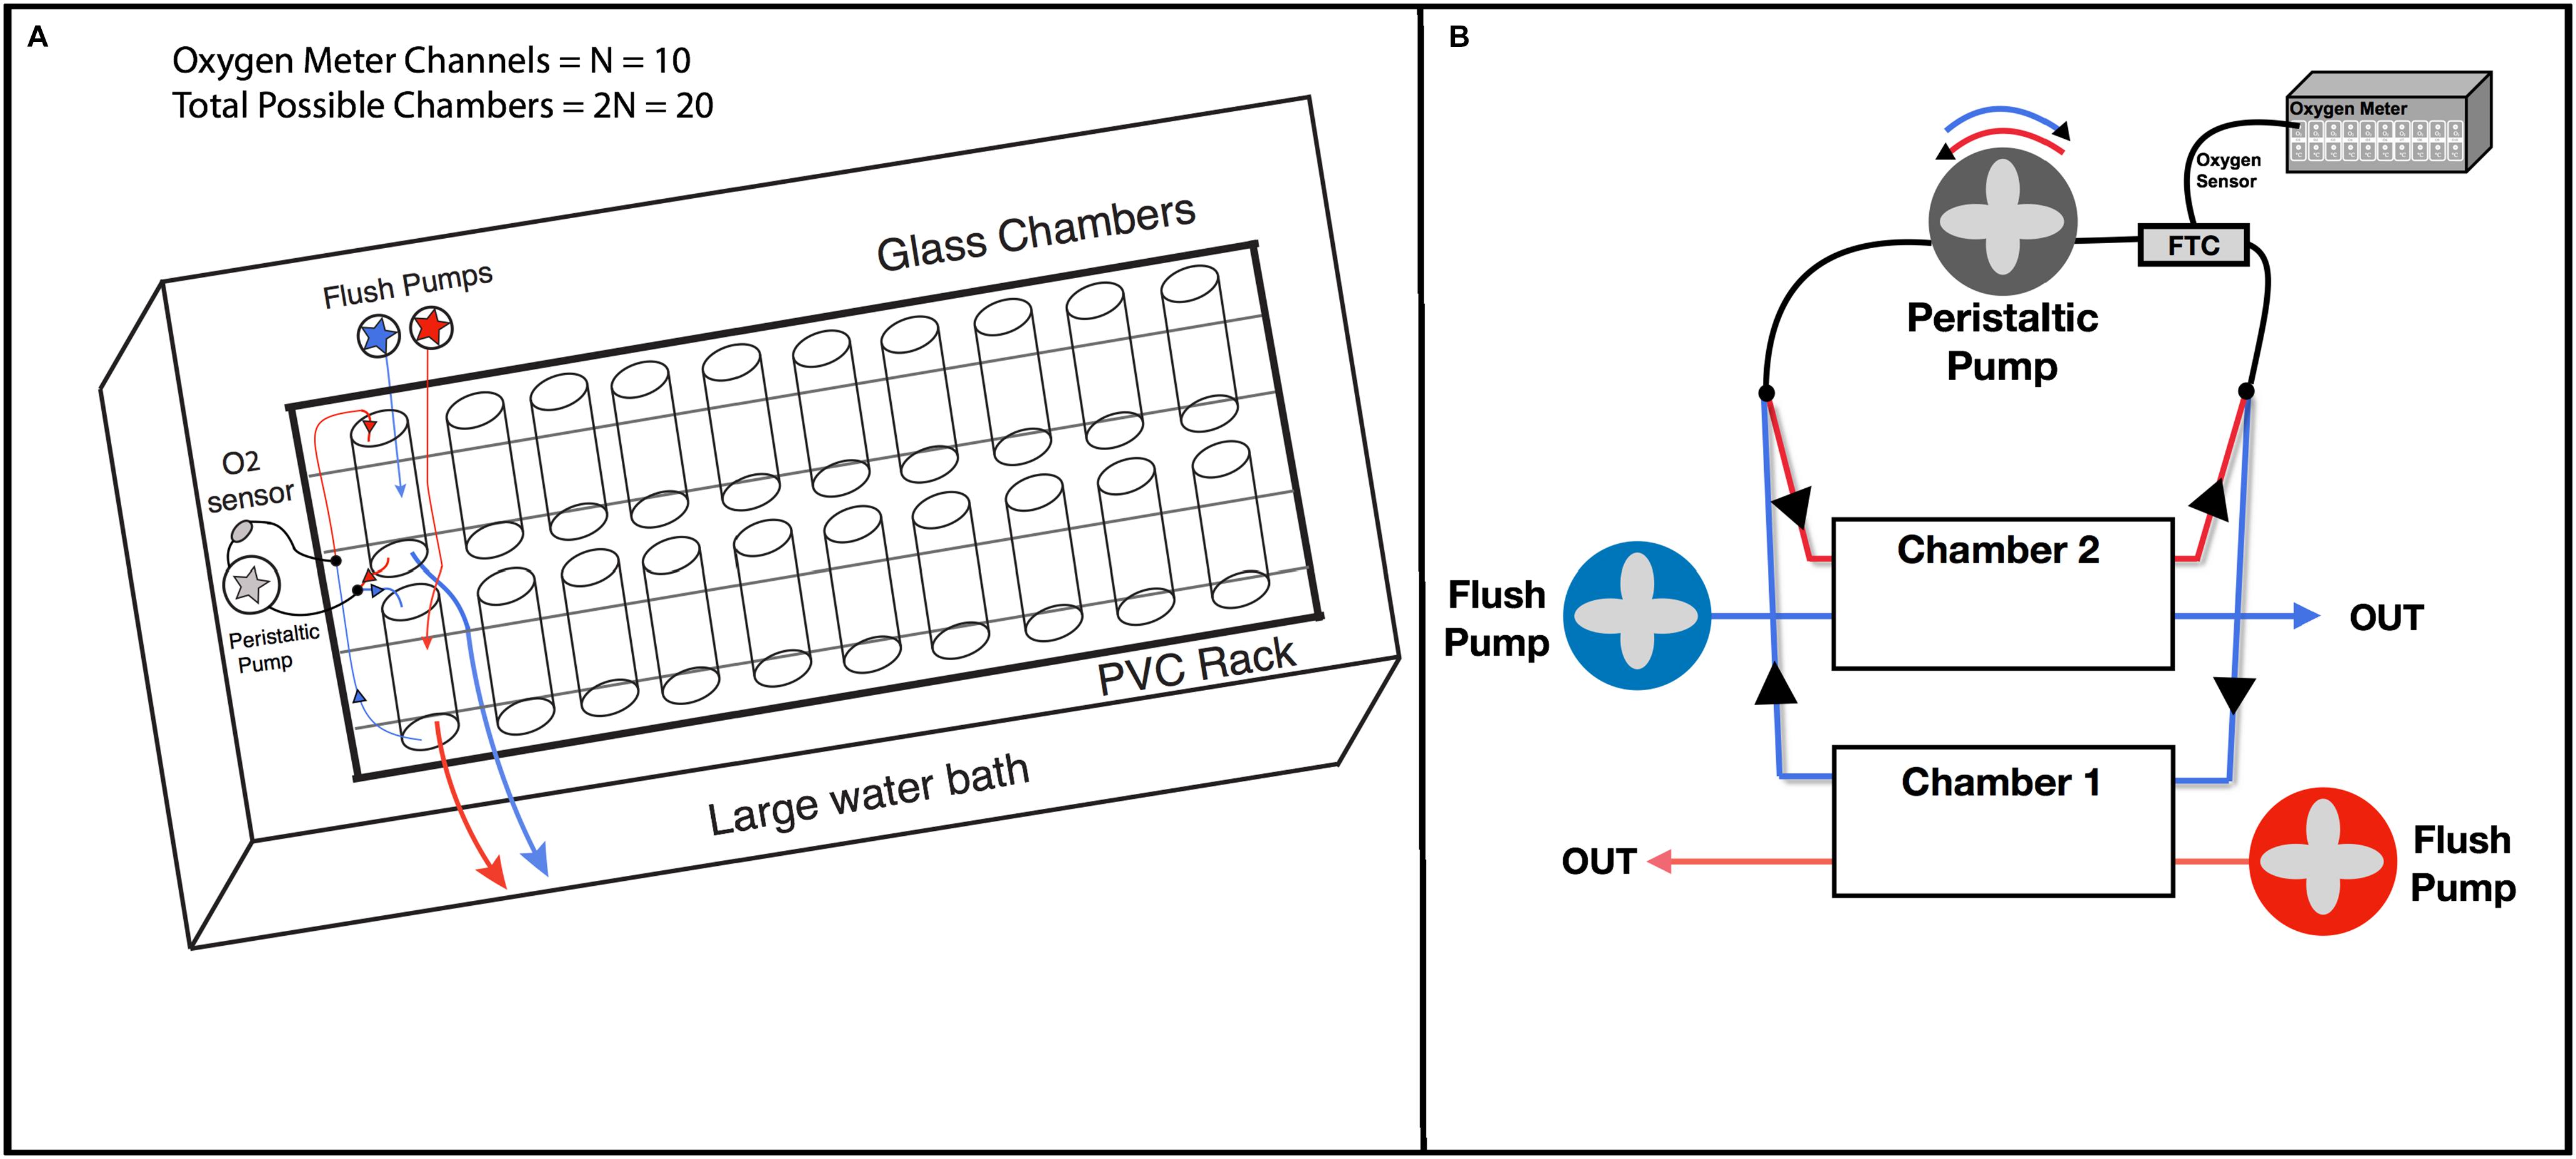
Figure 2. Pumping circuits. (A) Overall schematic of HIFR. The basic design is a PVC rack that holds and secures glass chambers with their rubber stoppers, which is placed in a large water bath. Each chamber is connected to flush pumps and re-circulating pumps with oxygen sensors. Throughput is limited by the number of channels on the oxygen meter (N) with this design able to measure 2N individuals in one night. (B) Pairs of chambers in the high-throughput intermittent flow respirometer. Circuit 1 (red), circuit 2 (blue). One-way values (black arrows) control flow direction. By changing the polarity of the peristaltic pump motor, the peristaltic pump direction changes.
The large water bath (1.2 m long, 1.1 m wide, 0.3 m deep) was constructed out of 0.635 cm thick plexiglass and sealed with plastic weld and silicone glue to prevent leaking. A PVC rack with twenty slots separated by small PVC pieces was placed in the water bath, and a 0.300 L glass chamber was placed in each slot and sealed with two rubber stoppers. Each rubber stopper had two 0.635 cm stainless steel tubes to attach flexible tubing connected to pumps. Glass chambers were then paired and attached to one adjustable peristaltic pump (60 mL/minute) and two separate adjustable flush pumps with flow directed to 10 chambers each (300 mL/minute per chamber). A flow-through-cell with an oxygen sensor with a fiber optic cable (FTC) was placed in line with the peristaltic pump. The use of fiber optic oxygen sensors (rather than galvanic or polarographic) reduces technical variation with little drift in sensors over time, does not consume oxygen during the experiment, and provides rapid response time (Klimant et al., 1995; Svendsen et al., 2016a). The fiber optic oxygen sensor was attached to a 10-channel oxygen meter (PreSens Precision Sensing, Regensburg Germany). A separate PT-100 temperature probe was placed in the large water bath (PreSens Precision Sensing, Regensburg Germany). The water bath housing the twenty chambers was continuously recirculating with an aquarium system containing a biofilter of nitrogen fixing bacteria to reduce ammonium load and a built-in heating unit that kept the water bath at the desired temperature (±1°C). PreSens Measurement Studio 2.0 software was used to record oxygen over time as the peristaltic pump recirculated water through the FTC and past the oxygen sensor then back to the chamber.
An Arduino Uno with a 5 V relay and a set of double pole double throw relays was used to control the direction the peristaltic pump turned and the power to the flush pumps. One-way valves were used to control the flow path to and from the peristaltic pump such that when the pump rotated clockwise, it would draw water from one chamber past the FTC, and when the pump rotated counter-clockwise, it would draw water from a second chamber (Figure 2B). Thus, all the odd numbered chambers would be measured while the even numbered chambers were being flushed and vice versa. The one-way values also prevented the back-flux of water so that water was not mixed between sets of chambers. In this way the ten peristaltic pumps with FTCs were used to measure oxygen levels in 10 of the 20 chambers at one time and would oscillate between sets of 10 by changing the polarity of the peristaltic pump motor. Altering flow between the ten FTC and the flush circuit allowed the 10-channel oxygen meter to measure the twenty respirometers housed in the temperature-controlled water bath. A detailed list of materials and costs for building a HIFR can be found in Supplementary Table S1, and a schematic of the electric circuit used to control and power pumps is depicted in Supplementary Figure S1.
Methods
Animal Care and Use
F. heteroclitus were caught in live traps along the east coast of the United States in New Jersey and transported live to the University of Miami where they were housed according to the institutional animal care and use committee guidelines (Animal Use Protocol No: 16-127-adm04). F. heteroclitus were collected on public lands and do not require a permit for non-profit use. To compensate for differences in food availability or seasons among populations fish were common gardened at 20°C 15 ppt for greater than 6 weeks on a summer light cycle (14 h daylight, 10 h dark), then overwintered at 10°C and 15 ppt (5 h daylight, 19 h dark) for 4 weeks. The initial 20°C acclimation allowed all fish a healthy diet in preparation of 10°C pseudo-winter, which brought all fish into common season. Fish were finally acclimated to 28°C 15ppt on a summer light cycle. Fish were fed pelleted food to saturation once daily and fasted for 24 h prior to metabolic rate determination.
To identify individuals, all fish had unique visual implant elastomer (VIE) tags. Metabolic rates were measured after at least 4 weeks of acclimation to 28°C.
Calculations and Statistical Analysis
Metabolic Rate Calculation
A random set of 19 fish was measured in the HIFR, each in three different chambers over the course of 1 week (Monday, Wednesday, and Friday nights). Individuals were measured overnight where they were left undisturbed for at least 14 h. Fish were identified then immediately placed in a chamber between 16:30 and 17:30 h, and the first replicate measurement period used to calculate RMR began after midnight, allowing a minimum of 6.5 h of acclimation to the chamber. Each measurement period lasted 6 min followed by a 6 min flush period to prevent oxygen levels from dropping below 80% in any given chamber and to fully replenish oxygen levels in the chamber between replicate measurements.
Data files exported from PreSens measurement studio were analyzed in R (version 1.1.383). From each 6 min measurement, the first 1 min and last 30 s were excluded as a buffer between the flush pump turning off and the measurement period starting. An R-Markdown script detailing the processing of raw data files is available on github1.
The slope of oxygen levels over time (μmol O2l–1min–1) was extracted using a linear model for each replicate measurement period, and MO2 in μmol O2min–1 was calculated using the equation y = KV then converted to mg O2h–1 for comparability with other studies using this species, where y = MO2 (μmol O2min–1), K = slope (μmol O2l–1min–1), V = volume of the respirometer (including tubing) minus volume of the organism (liters) (Rosewarne et al., 2016). Any data collected while the lights were on in the room (before 23:00 or after 06:30 h) or a slope with an R2 value less than 0.9 were excluded from the analysis. The metabolic rates measured after the lights turned on were not significantly different than the previous 5 h of measurement, however, data collected after the lights turned on were excluded as this was a secondary disturbance, which could alter the behavior of the fish. Between midnight and 06:30 h at least 25 measurement periods were completed for each individual, of those at least 20 were used for analysis after exclusion based on R2 value. The lower 10th percentile values from the cumulative frequency distribution (CFD) of all replicates from that individual were used to estimate routine metabolic rate (RMR). Using the lower 10th percentile value from the cumulative frequency distribution did not average the lowest two metabolic rate measures. Rather, the cumulative distribution curve is generated from a continuous function where a single value for each individual is the 10th percentile value of this distribution. This lower 10th percentile value captures the time period when the fish were most at rest during measurement and excludes the lowest tail of the data distribution, which may be sensitive to outliers (Steffensen et al., 1994; Roche et al., 2013; Chabot et al., 2016; Figure 3).
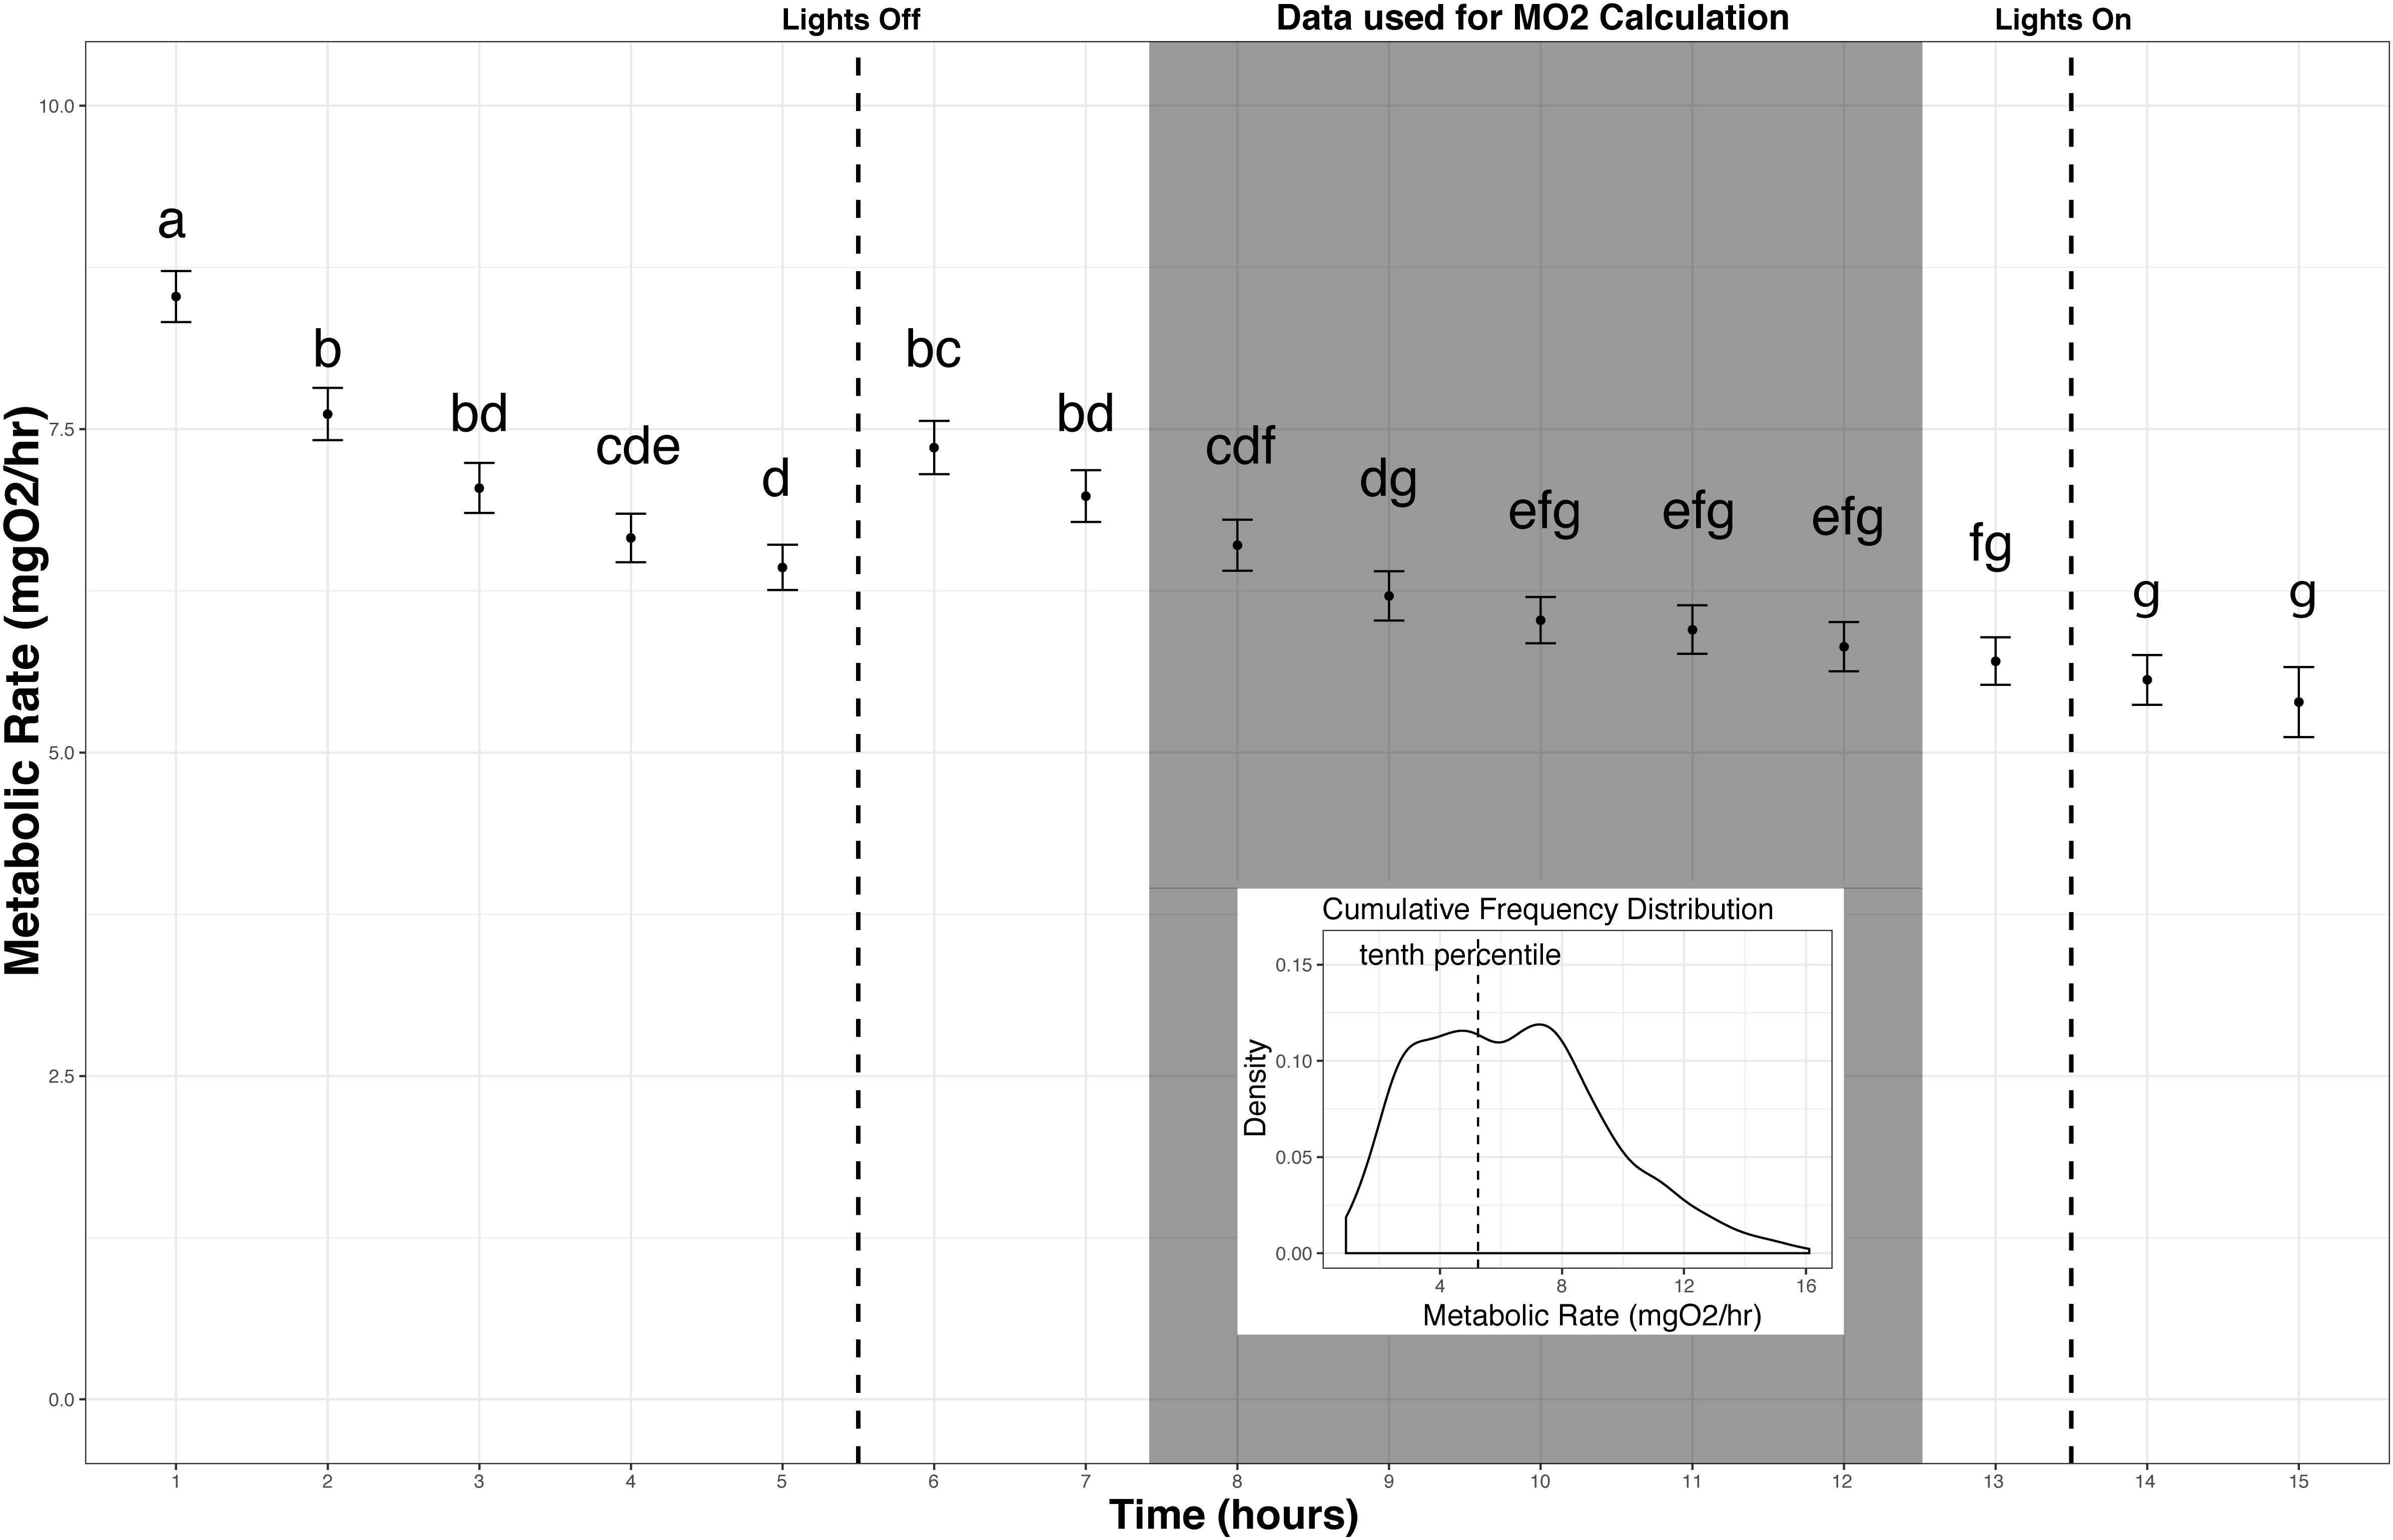
Figure 3. Metabolic Rate measurement over time. Metabolic rate vs. time since fish were added to the chambers (mean and standard error across all individuals on an hourly basis). Fish reached a resting state in the chamber between 3 and 4 h when left undisturbed. Replicates used in calculating metabolic rate (MO2) are indicated (shaded box). Letters indicate significant differences among time points (ANOVA, α = 0.05). Inset: The lower 10th percentile values from the cumulative frequency distribution of this subset of replicates were used to estimate standard metabolic rate for each individual.
Body Mass Correction
To compare metabolic rates among individuals that varied in size, metabolic rates were corrected for body mass. Fish were weighed to the nearest 0.1 g the day of metabolic rate measurement. After calculating RMR the residuals of the model metabolic rate (log transformed) vs. body mass (log transformed) were used as the body mass corrected RMR (Beamish, 1964).
Background Respiration
In order to correct for oxygen used by bacteria and other microorganisms in the HIFR, blank runs were completed in between each use of the HIFR and average background respiration subtracted from the MO2 of each fish (Eq. 1).
Where MO2 was the minimum metabolic rate of each fish as previously described and background respiration was a chamber specific value calculated by averaging the oxygen consumption over time in each empty chamber across three replicate blank runs. An empty chamber was additionally run in parallel each night, and the background respiration did not change over the course of the night validating the decision to not use a time corrected value, where the background respiration changes depending on time course of the experiment, of background respiration.
System Design and Testing
Water at 28°C (±1°C) and 15 ppts was used to fill the custom water bath and recirculated with an aquarium system to maintain temperature and reduce ammonium load. To validate that the flush period was long enough to fully replenish oxygen empty chambers were filled with water at a low oxygen concentration [∼60% air saturation (a.s.)], achieved by bubbling in nitrogen, and flushed for over 8 min. Between 4 and 5 min after turning on the flush pump the oxygen level in the chamber exceeded 99% a.s. (Supplementary Figure S2). Using the equation for steady-state transformation data show that with a flush rate of 300 mL/min and a chamber that is 300 mL in volume, water should reach 99% replacement after 4.61 min [t(99%) = −ln(1 − 0.99) × 300 mL/300 mL/min = 4.61 min, (Steffensen, 1989)].
To test system leak, one chamber in a pair was filled with water with an oxygen concentration equal to ∼50% a.s., and the other chamber in the pair was sealed with the flush pump running (Stevens, 1992). A model of oxygen vs. log10(time) from 75% a.s. to 89% a.s. (maximum oxygen reached) was used to derive an equation that can be used to predict the amount of leak at a specific time point: slope (% a.s. per minute) = 7.4916/time (minutes) (Supplementary Figure S3). Note that this equation can be applied from the time when 75% a.s. was reached (16.5 min) and extrapolated to determine time to reach 100% a.s. (144.5 min) but not used to predict oxygen concentration at previous time points not included in the model. Leak did not exceed 0.5% a.s. per minute from 80 to 89% a.s. and decreased as the oxygen concentration in the chamber increased. At 85% a.s. or higher, leak would not exceed 0.14% a.s per minute. Thus from 100% a.s. down to 85% a.s. leak would be negligibly low (below 6% of typical MO2). Below 85% a.s. leak would increase, however, the portion of the slope used to calculate MO2, as described above (see metabolic rate calculation), would exclude the time period where oxygen levels would drop this low limiting the overall system leak. Leak could be reduced further by using material less permeable to oxygen to seal the chambers, although the cost of these materials may be higher (Stevens, 1992).
Statistical Analysis
Metabolic rate measured over the course of the night were compared using an ANOVA of metabolic rate over time, where time was binned and used as a categorical variable. This allowed measurement periods that did not significantly differ from one another to be grouped to determine when fish reached a minimum metabolic rate. To compare individuals that varied in size, the residuals of the model metabolic rate (log transformed) vs. body mass (log transformed) were used for analysis of repeatability. An ANOVA of the body mass residuals vs. individual fish identity using data from all 3 days of measurement was used to determine variation within and among individuals. The sum of squares from the ANOVA of body mass residuals vs. individual fish identity was used in calculating repeatability. To measure repeatability (R) directly: R = s2a/(s2a + s2w) where s2a equals the difference in the mean sum of squares among and within individuals divided by the number of measures per individual and s2w equals the mean sum of squares within individuals (Lessells and Boag, 1987; Nakagawa and Schielzeth, 2010).
Results and Discussion
Repeatability
To assess repeatability, log RMR was regressed against log body mass (y = 2.66 + 1.08x, R2 = 0.59, N = 57, Figure 4A), and a body mass correction was calculated as described above. The mean coefficient of variation (CV) within an individual was 18.03% (Figure 4B). RMR is repeatable (Figure 4C), and the variance for each individual for three RMR measured in three different chambers is much smaller than the variance among individuals (ratio of variance in group means/mean of within individual variance = 74.54:1). To calculate repeatability (see statistical analysis) the mean sum of squares among and within individuals was taken from the ANOVA (within = 0.0108, among = 0.8050), and 3 measures per individual a repeatability of the tenth percentile value of metabolic rate, used here to represent RMR, was 0.96.
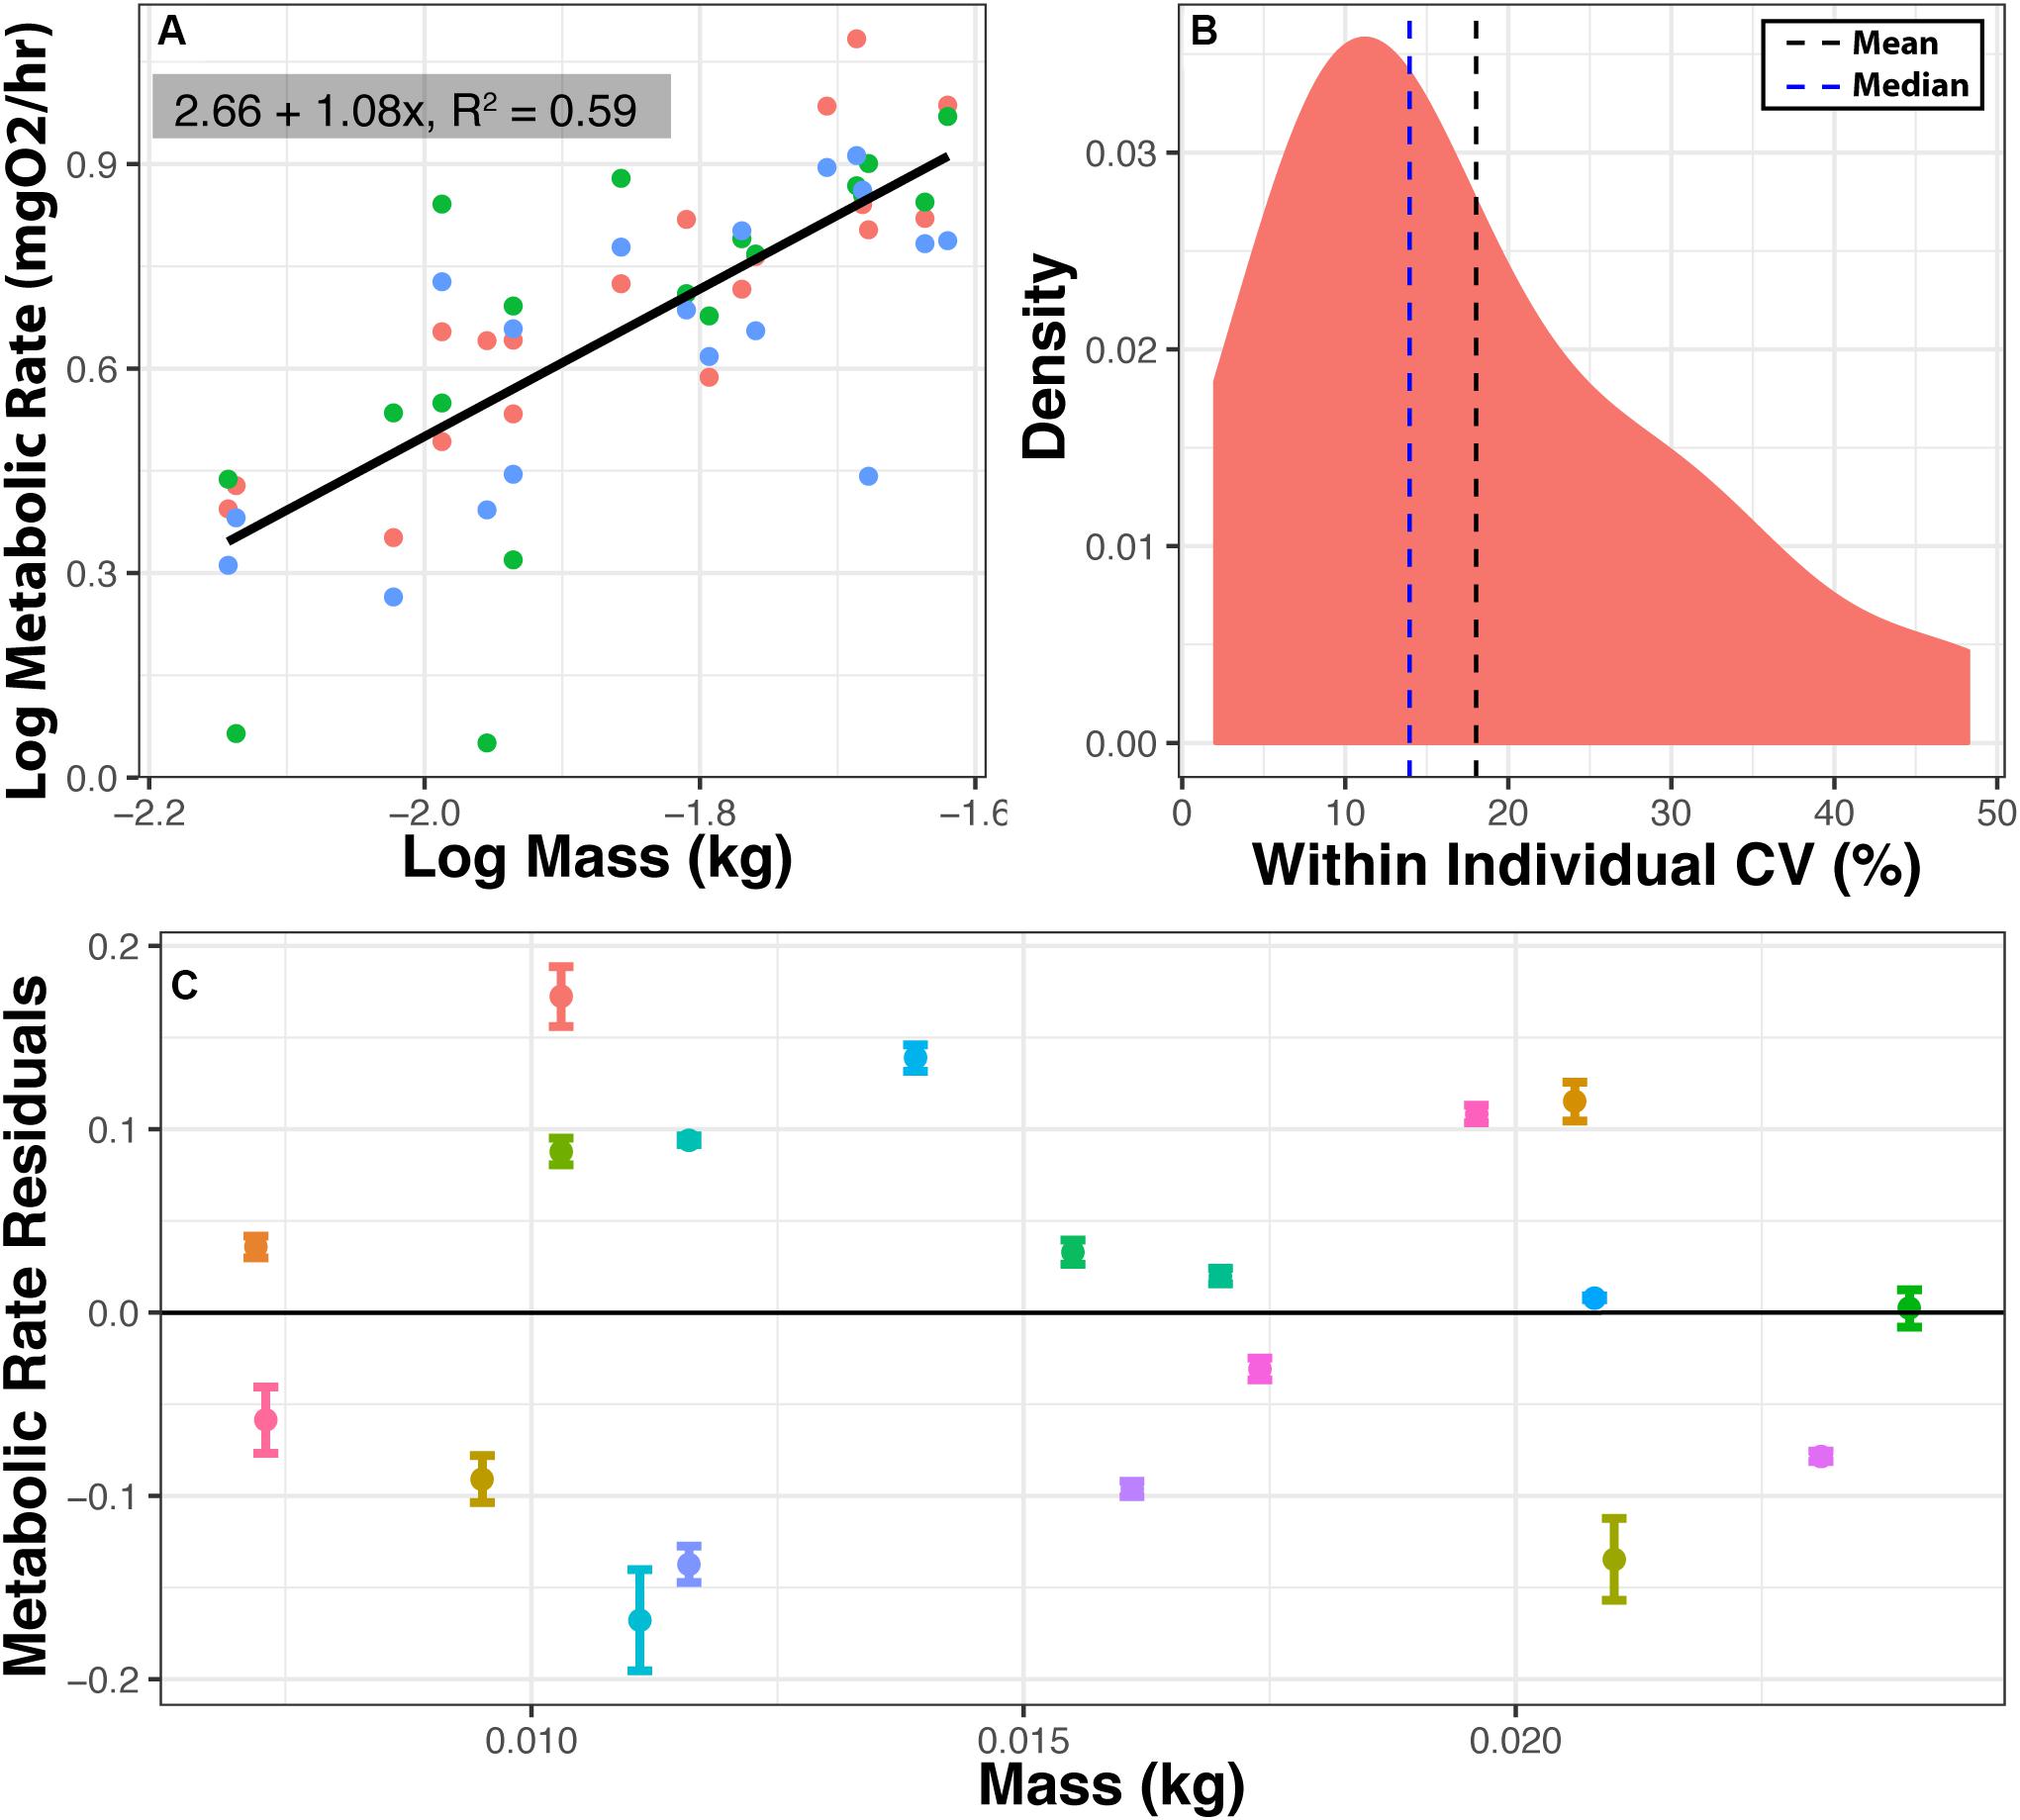
Figure 4. Repeatability of metabolic measurements. Metabolic rate was measured three times for 19 individuals in three different chambers within 1 week. (A) Log metabolic rate (MgO2/h) vs. log body mass regression. Values are corrected for background respiration. (B) Distribution of coefficient of variation (CV) in minimum metabolic rate within an individual. CV = 100*(standard deviation/mean). (C) Mean and standard error for RMR residuals among 19 individuals. Means are residuals from log-log body mass regression. Thus, positive values indicate that an individual had a higher than expected metabolic rate based on mass, and negative values indicate that an individual had lower than expected metabolic rate based on mass. Ratio of variance between to variance within = 74.82:1. Repeatability = 0.96.
Metabolic rates measured in HIFR are comparable with values from previously reported metabolic rate values for F. heteroclitus (±5%) and other teleost fish (±40%) further validating the methods described here (Healy and Schulte, 2012; Blewett et al., 2013; Chabot et al., 2016). To determine this, the metabolic rates reported for F. heteroclitus or other species acclimated to various temperatures were used to interpolate metabolic rate for an 8-g individual at 28°C. Differences between values reported from our HIFR and other studies using F. heteroclitus may also be due to the type of metabolic rate (i.e., SMR, RMR, MMR) being measured and the environmental parameters (acclimation vs. acute temperature or hypoxia exposure, maximum vs. standard metabolic rate, etc.). The 18.03% CV within individuals for RMR is similar to previous studies that reported 12–14% CV in SMR, MMR, and aerobic scope of brown trout (Norin and Malte, 2012).
HIFR Costs and Considerations
Depending on the oxygen sensing technology and software, a single respirometer (including the cost of oxygen sensing technology and software) may cost between $2,000 and $4,000, a significant investment especially considering that they are designed to measure one individual at a time, which may take hours or days. Some companies additionally offer high-throughput versions (up to 8 chambers) for small animals; however, the cost remains high (>$2,000 per chamber). The HIFR presented here was assembled using basic materials and a moderately priced oxygen meter and oxygen sensors. Including the cost of the meter, sensors, and materials, HIFR costs $855.50 per chamber to assemble, a 57% reduction in cost per respirometer compared to purchasing a Loligo high-throughput system.
Costs could be cut further by using less expensive peristaltic pumps or a different water bath than described here. However, the lifespan of a given pump varies greatly depending on the quality of the motor and the tubing. Several peristaltic pumps ranging from $3 to $50 were tested to determine the appropriate tubing material and motor design that could withstand frequent long-term use and alternation of motor polarity without rapidly burning out. Generally, it is recommended to use a peristaltic pump that has a brushed motor and tygon tubing and to determine the tubing size based on the desired flow rate. While there are large peristaltic pumps available it should be noted that depending on chamber size this may not provide enough mixing to prevent the stratification of water in the chamber (Rodgers et al., 2016). The addition of a closed loop mixing pump could mitigate this problem and provide adequate mixing, although this has not been tested here. Including the mixing pump would increase the total setup cost, and without it the size of the chambers (and organisms) that can be measured with this system will be limited to those that can be adequately mixed with only a peristaltic pump.
Flexibility of Design
The HIFR can run up to 20 respirometers overnight, greatly reducing the total time needed to achieve a large sample size, which holds value far beyond monetary savings. For example, within a 1 week period at least 100 individuals could be run under the same experimental conditions introducing little variation due to time and requiring only 5 nights of respirometry set up with daily background respiration measures. The flexibility of the HIFR offers the additional advantage of allowing organisms of various sizes to be measured. By changing the size of the glass chambers and altering the flow rate of peristaltic pumps and flush pumps by changing the tubing size the system can easily be adapted to fit the desired organism (Svendsen et al., 2016b). This further decreases costs for groups who may wish to measure a single species at various ages and stages of life or different species that may vastly differ in size (Killen et al., 2007). Other high-throughput respirometry systems, which have been used by other researchers to achieve large sample sizes also offer the benefit of flexibility, with the main considerations being the respirometer-to-fish ratio and thorough mixing of water in the chamber to prevent stratification (Svendsen et al., 2016b). For example, depending on fish size, a 35 or 110 ml chamber volume was used for respirometry of anemones and anemone fish in an 8-chamber high-throughput respirometer, although it is unclear if different sized chambers were used in a single experimental run (Norin et al., 2018).
The plexiglass tank served as a water bath for the chambers and could be replaced with a cheaper alternative as long as it could hold the appropriate volume of water needed to maintain a stable temperature. Due to the size of the water bath and the available equipment, the most practical solution to maintaining a constant temperature in the water bath was to recirculate the water through a temperature-controlled aquaria system. This made it possible to pump the HIFR water bath into the same system the fish had been housed in prior to measuring metabolic rate so the temperature along with pH and salinity were not variable between the HIFR and the acclimation conditions (Fry, 1971). It would also need to be large enough to hold the desired number of chambers of a specific size. In general, the respirometer volume should be 20 to 50 times larger than the organism to achieve a measurable decrease in oxygen over a reasonable period of time (several minutes) (Steffensen, 1989; Svendsen et al., 2016a,b). If the respirometer volume does not fit within this ratio for a given organism the measurement period length can be adjusted to allow for the appropriate drop in oxygen (above 80% O2 saturation) as long as routine movements are not inhibited by chamber size (Steffensen, 1989; Svendsen et al., 2016b). If variation in body mass of individuals is large, adjusting the measurement period to prevent low O2 levels for larger individuals may mean that smaller individuals do not have a large enough O2 decrease to get a reliable slope measurement. Using the HIFR design it is possible to use chambers of various sizes within a single run as long as pump flow rates were adjusted (tubing sizes) to accommodate this change. This allows for added flexibility of using different sized respirometry chambers in a single run. The oxygen sensing technology used here is comparable in quality to other commercially available equipment (e.g., Pyroscience Firesting), which could be readily used in place of the Presens equipment described here. The temperature-controlled aquaria system used to maintain constant temperature could also be replaced with a flow through system using a header tank with a submersible heating coil (with adequate mixing to prevent unequal heating, ∼$20) or a benchtop recirculating water bath depending on the volume of water being heated.
Conclusion
The throughput of this design is limited by the number of channels available on the oxygen meter. Any flow through oxygen sensing cells can be interchanged for the ones used here; however, the oxygen meter needs N channels (one per sensor) to allow measurement of 2 N individuals at once. If an oxygen meter were available with 20 channels, for example, it is feasible that this design could be scaled to measure 40 individuals over the course of one night. An oxygen meter with fewer channels could be used to design a similar HIFR with fewer individual respirometers. Additionally, a HIFR could be built to measure ten individuals with ten channels by eliminating the double pole double throw relays and using an Arduino to turn the flush pump on and off. This approach would be similar to other high-throughput respirometry designs (see Killen et al., 2015; Norin et al., 2016, 2018), which could use existing software (e.g., Aquaresp, University of Copenhagen).
We believe that the design and technology presented here is relatively simple, and that our explicit description of the HIFR system will make it highly accessible to, and easily used by, researchers with little previous experience with aquatic respirometry systems.
The ability to precisely measure metabolic rates in a high-throughput manner without significantly increasing the necessary effort has application for physiologists, ecologists, geneticists, and comparative biologists alike. This method reduced the total system cost from ∼$2,000 per respirometer to ∼$900 per respirometer including the cost of the FTC, oxygen sensor, and oxygen meter. The HIFR also greatly reduced the effort needed to measure metabolic rate in a large sample size making it possible to answer questions relevant to ecological and evolutionary biology.
Data Availability Statement
The datasets presented in this study can be found in online repositories. The names of the repository/repositories and accession number(s) can be found below: https://github.com/mxd1288/FunHe_Genomics/blob/master/Drown_HIFR_Raw_Data.csv.
Ethics Statement
The animal study was reviewed and approved by the University of Miami Institutional Animal Care and Use Committee.
Author Contributions
MD and AD: HIFR design and testing and experimental design. MD: data collection and analysis. MD, DC, and MO: writing of the manuscript and production of figures. All authors contributed to the article and approved the submitted version.
Funding
This research was supported by the NSF/IOS 1556396 and NSF/IOS 1754437 to MO and DC.
Conflict of Interest
The authors declare that the research was conducted in the absence of any commercial or financial relationships that could be construed as a potential conflict of interest.
Acknowledgments
We thank Dr. Chris Langdon for his advice and assistance in construction and Moritz Ehrlich for constructive discussion and HIFR testing. We additionally thank the reviewers and editor for their thoughtful comments that improved the manuscript. This manuscript has been released as a pre-print at BixRxiv (Drown et al., 2020).
Supplementary Material
The Supplementary Material for this article can be found online at: https://www.frontiersin.org/articles/10.3389/fmars.2020.581104/full#supplementary-material
Footnotes
References
Beamish, F. W. H. (1964). Respiration of fishes with special emphasis on standard oxygen consumption. II. Influence of weight and temperature on respiration of several species. Can. J. Zool. 42, 177–188. doi: 10.1139/z64-016
Blewett, T. A., Robertson, L. M., Maclatchy, D. L., and Wood, C. M. (2013). Impact of environmental oxygen, exercise, salinity, and metabolic rate on the uptake and tissue-specific distribution of 17alpha-ethynylestradiol in the euryhaline teleost Fundulus heteroclitus. Aquat. Toxicol. 138–139, 43–51. doi: 10.1016/j.aquatox.2013.04.006
Brown, H. J., Gillooly, F. J., Allen, P. A., Savage, M. V., and West, B. G. (2004). Toward a metabolic theory of ecology. Ecology 85, 1771–1789. doi: 10.1890/03-9000
Burnett, K. G., Bain, L. J., Baldwin, W. S., Callard, G. V., Cohen, S., Di Giulio, R. T., et al. (2007). Fundulus as the premier teleost model in environmental biology: opportunities for new insights using genomics. Comp. Biochem. Physiol. Part D Genom. Proteom. 2, 257–286. doi: 10.1016/j.cbd.2007.09.001
Burton, T., Killen, S. S., Armstrong, J. D., and Metcalfe, N. B. (2011). What causes intraspecific variation in resting metabolic rate and what are its ecological consequences? Proc. R. Soc. Lond. B Biol. Sci. 278, 3465–3473. doi: 10.1098/rspb.2011.1778
Chabot, D., Steffensen, J. F., and Farrell, A. P. (2016). The determination of standard metabolic rate in fishes. J. Fish Biol. 88, 81–121. doi: 10.1111/jfb.12845
Christensen, E. A. F., Stieglitz, J. D., Grosell, M., and Steffensen, J. F. (2019). Intra-specific difference in the effect of salinity on physiological performance in European perch (Perca fluviatilis) and its ecological importance for fish in estuaries. Biol. Basel. 8:89. doi: 10.3390/biology8040089
Christensen, E. A. F., Svendsen, M. B. S., and Steffensen, J. F. (2020). The combined effect of body size and temperature on oxygen consumption rates and the size-dependency of preferred temperature in European perch Perca fluviatilis. J. Fish Biol. 97, 794–803. doi: 10.1111/jfb.14435
Christoffersen, B. O., Grand, N., Golozoubova, V., Svendsen, O., and Raun, K. (2007). Gender-associated differences in metabolic syndrome-related parameters in Gottingen minipigs. Comp. Med. 57, 493–504.
Crawford, D. L., and Oleksiak, M. F. (2007). The biological importance of measuring individual variation. J. Exp. Biol. 210, 1613–1621. doi: 10.1242/jeb.005454
Drown, M. K., DeLiberto, A. N., Crawford, D. L., and Oleksiak, M. F. (2020). An innovative setup for high-throughput respirometry of small aquatic animals. bioRxiv [Preprint]. doi: 10.1101/2020.01.20.912469
Everett, M. V., and Crawford, D. L. (2010). Adaptation versus allometry: population and body mass effects on hypoxic metabolism in Fundulus grandis. Physiol. Biochem. Zool. 83, 182–190. doi: 10.1086/648482
Fry, F. E. J. (1971). “The effect of environmental factors on the physiology of fish,” in Fish Physiology, Vol. 6, eds W. S. Hoar and D. J. Randall (New York, NY: Academy Press), 1–98. doi: 10.1016/s1546-5098(08)60146-6
Gaitan-Espitia, J. D., Bruning, A., Mondaca, F., and Nespolo, R. F. (2013). Intraspecific variation in the metabolic scaling exponent in ectotherms: testing the effect of latitudinal cline, ontogeny and transgenerational change in the land snail Cornu aspersum. Comp. Biochem. Physiol. A Mol. Integr. Physiol. 165, 169–177. doi: 10.1016/j.cbpa.2013.03.002
Gaitan-Espitia, J. D., and Nespolo, R. (2014). Is there metabolic cold adaptation in terrestrial ectotherms? Exploring latitudinal compensation in the invasive snail Cornu aspersum. J. Exp. Biol. 217(Pt 13), 2261–2267. doi: 10.1242/jeb.101261
Healy, T. M., and Schulte, P. M. (2012). Thermal acclimation is not necessary to maintain a wide thermal breadth of aerobic scope in the common killifish (Fundulus heteroclitus). Physiol. Biochem. Zool. 85, 107–119. doi: 10.1086/664584
Killen, S. S., Gamperl, A. K., and Brown, J. A. (2007). Ontogeny of predator-sensitive foraging and routine metabolism in larval shorthorn sculpin, Myoxocephalus scorpius. Mar. Biol. 152, 1249–1261. doi: 10.1007/s00227-007-0772-3
Killen, S. S., Reid, D., Marras, S., and Domenici, P. (2015). The interplay between aerobic metabolism and antipredator performance: vigilance is related to recovery rate after exercise. Front. Physiol. 6:111. doi: 10.3389/fphys.2015.00111
Klimant, I., Meyer, V., and Kuhl, M. (1995). Fiber-optic oxygen microsensors, a new tool in aquatic biology. Am. Soc. Limnol. Oceanogr. 40, 1159–1165. doi: 10.4319/lo.1995.40.6.1159
Lessells, C. M., and Boag, P. T. (1987). Unrepeatable repeatabilities - a common mistake. Auk 104, 116–121. doi: 10.2307/4087240
Nakagawa, S., and Schielzeth, H. (2010). Repeatability for gaussian and non-gaussian data: a practical guide for biologists. Biol. Rev. Camb. Philos. Soc. 85, 935–956.
Nespolo, R. F., and Franco, M. (2007). Whole-animal metabolic rate is a repeatable trait: a meta-analysis. J. Exp. Biol. 210(Pt 11), 2000–2005.
Nespolo, R. F., Lardies, M. A., and Bozinovic, F. (2003). Intrapopulational variation in the standard metabolic rate of insects: repeatability, thermal dependence and sensitivity (Q10) of oxygen consumption in a cricket. J. Exp. Biol. 206(Pt 23), 4309–4315.
Norin, T., and Gamperl, A. K. (2018). Metabolic scaling of individuals vs. populations: evidence for variation in scaling exponents at different hierarchical levels. Funct. Ecol. 32, 379–388.
Norin, T., and Malte, H. (2011). Repeatability of standard metabolic rate, active metabolic rate and aerobic scope in young brown trout during a period of moderate food availability. J. Exp. Biol. 214(Pt 10), 1668–1675.
Norin, T., and Malte, H. (2012). Intraspecific variation in aerobic metabolic rate of fish: relations with organ size and enzyme activity in brown trout. Physiol. Biochem. Zool. 85, 645–656.
Norin, T., Malte, H., and Clark, T. D. (2016). Differential plasticity of metabolic rate phenotypes in a tropical fish facing environmental change. Funct. Ecol. 30, 369–378.
Norin, T., Mills, S. C., Crespel, A. P. L., Cortese, D., Killen, S. S., and Beldade, R. (2018). Anemone bleaching increases the metabolic demands of symbiont anemonefish. Proc. R. Soc. Biol. Sci. Ser. B 285:20180282.
Pettersen, A. K., Marshall, D. J., and White, C. R. (2018). Understanding variation in metabolic rate. J. Exp. Biol. 221:jeb166876.
Roche, D. G., Binning, S. A., Bosiger, Y., Johansen, J. L., and Rummer, J. L. (2013). Finding the best estimates of metabolic rates in a coral reef fish. J. Exp. Biol. 216, 2103–2110.
Rodgers, G. G., Tenzing, P., and Clark, T. D. (2016). Experimental methods in aquatic respirometry: the importance of mixing devices and accounting for background respiration. J. Fish Biol. 88, 65–80.
Rosewarne, P. J., Wilson, J. M., and Svendsen, J. C. (2016). Measuring maximum and standard metabolic rates using intermittent-flow respirometry: a student laboratory investigation of aerobic metabolic scope and environmental hypoxia in aquatic breathers. J. Fish Biol. 88, 265–283.
Schulte, P. M. (2015). The effects of temperature on aerobic metabolism: towards a mechanistic understanding of the responses of ectotherms to a changing environment. J. Exp. Biol. 218(Pt 12), 1856–1866.
Snyder, S., Nadler, L. E., Bayley, J. S., Svendsen, M. B., Johansen, J. L., Domenici, P., et al. (2016). Effect of closed v. intermittent-flow respirometry on hypoxia tolerance in the shiner perch Cymatogaster aggregata. J. Fish Biol. 88, 252–264.
Steffensen, J. F. (1989). Some errors in respirometry of aquatic breathers - how to avoid and correct for them. Fish Physiol. Biochem. 6, 49–59.
Steffensen, J. F., Bushnell, P. G., and Schurmann, H. (1994). Oxygen consumption in four species of teleosts from Greenland: no evidence of metabolic cold adaptation. Pol. Biol. 14, 49–54.
Stevens, E. D. (1992). Use of plastic materials in oxygen-measuring systems. J. Appl. Physiol. 72, 801–804.
Svendsen, M. B. S., Bushnell, P. G., Christensen, E. A. F., and Steffensen, J. F. (2016a). Sources of variation in oxygen consumption of aquatic animals demonstrated by simulated constant oxygen consumption and respirometers of different sizes. J. Fish Biol. 88, 51–64.
Svendsen, M. B. S., Bushnell, P. G., and Steffensen, J. F. (2016b). Design and setup of intermittent-flow respirometry system for aquatic organisms. J. Fish Biol. 88, 26–50.
Keywords: Fundulus heteroclitus, evolutionary analysis, routine metabolic rate, aquatic physiology, respirometry
Citation: Drown MK, DeLiberto AN, Crawford DL and Oleksiak MF (2020) An Innovative Setup for High-Throughput Respirometry of Small Aquatic Animals. Front. Mar. Sci. 7:581104. doi: 10.3389/fmars.2020.581104
Received: 07 July 2020; Accepted: 25 September 2020;
Published: 20 October 2020.
Edited by:
Rui Rosa, University of Lisbon, PortugalReviewed by:
David J. McKenzie, Université Montpellier 2, FranceTheresa Joan Grove, Valdosta State University, United States
Emil Chrisrensen, University of Glasgow, United Kingdom
Brad Seibel, University of Rhode Island, United States
Copyright © 2020 Drown, DeLiberto, Crawford and Oleksiak. This is an open-access article distributed under the terms of the Creative Commons Attribution License (CC BY). The use, distribution or reproduction in other forums is permitted, provided the original author(s) and the copyright owner(s) are credited and that the original publication in this journal is cited, in accordance with accepted academic practice. No use, distribution or reproduction is permitted which does not comply with these terms.
*Correspondence: Melissa K. Drown, bXhkMTI4OEBtaWFtaS5lZHU=