 Ga Hun Boo1,2,3*
 Mayalen Zubia4
 Jeffery R. Hughey5Alison R. Sherwood6Mutue T. Fujii1
 Sung Min Boo2Kathy Ann Miller3
- 1Nucleus for Research in Phycology, Institute of Botany, São Paulo, Brazil
- 2Department of Biology, Chungnam National University, Daejeon, South Korea
- 3University Herbarium, University of California, Berkeley, Berkeley, CA, United States
- 4UMR EIO (UPF-IRD-ILM-IFREMER), Université de la Polynésie Française, Labex Corail, Faa’a, French Polynesia
- 5Division of Mathematics, Science, and Engineering, Hartnell College, Salinas, CA, United States
- 6School of Life Sciences, University of Hawai‘i at Mānoa, Honolulu, HI, United States
Although complete mitogenomic data have been widely applied in human and other animal population studies, they are extremely limited for florideophycean red algal populations. Gelidiella fanii is a recently described rhodophyta, previously misidentified as G. acerosa, a cosmopolitan agar-yielding species from tropical to subtropical waters. To decipher patterns in genetic diversity and geographic distribution for G. fanii, we obtained 10 complete mitogenomes including two outgroups, G. acerosa and G. flabella. The mitogenomes ranged in size from 25,223 to 25,281 bp and had 48 genes, which are similar in general structure, gene order and content, and presence of a group II intron. Phylogenomic analysis revealed that G. fanii was monophyletic and clearly separate from G. acerosa. The range of G. fanii was extended from Southeast Asia and northern Australia to Eritrea, Juan de Nova Island, and Kenya in the west, and to Hawai‘i and Tetiaroa Atoll to the east. Haplotype network analysis of cox1 revealed seven geographically structured groups: Southeast Asia, Kenya/Juan de Nova Island, Indonesia, northern Australia, the Philippines, Tetiaroa Atoll, and Hawai‘i. This regional structure has likely resulted from the separation and isolation of an ancient widespread population during the Pleistocene. This study demonstrates that mitogenome sequencing is a powerful genotyping tool for studies of genetic diversity, biogeography, and conservation of economically valuable marine algal species.
Introduction
In red algae, the mitochondrial genome (mitogenome) comprises circular, maternally inherited chromosomes with fast evolving genes (Hughey et al., 2014; Yang et al., 2015). First sequenced from Chondrus crispus Stackhouse (Leblanc et al., 1995), mitogenomes have improved our knowledge of evolution, genetics and the taxonomy of red algae. Hughey et al. (2014) was the first to analyze mitogenomes from archival type specimens of bangiophycidean Pyropia species, and proposed a genome-based metric for distinguishing species. Yang et al. (2015) analyzed the mitogenomes of representatives of all five subclasses in the Florideophycidae. They documented the rapid radiation of the class, but concluded that gene synteny in these phylogenetically diverse red algae was highly conserved. In a review of 16 mitogenomes among 30 datasets publicly available at that time, Salomaki and Lane (2016) reported that red algal mitogenomes were more highly conserved than previously reported. Boo et al. (2016a) analyzed 10 mitogenomes from type specimens of species in the order Gelidiales and proposed that, of 23 protein-coding genes (PCGs) present, six PCGs with low non-synonymous (Ka)/synonymous (Ks) ratios were suitable markers for species identification. Mitogenomes have also been used for the purpose of merging morphological species, describing new species and genera, and identifying introduced species (Hughey and Boo, 2016; Suzuki et al., 2016; Song et al., 2017; Gabrielson et al., 2018; Boo and Hughey, 2019; Bustamante et al., 2019). However, red algal mitogenomes have yet to be analyzed from a population perspective.
Gelidiella fanii S.-M.Lin (Gelidiellaceae) is one of 15 species in the widespread genus Gelidiella Feldmann and Hamel, found on coral reefs and intertidal rocky shores in tropical to subtropical waters (Abbott, 1999; Costa et al., 2002; Boo et al., 2015; Huisman et al., 2018). Gelidiella fanii is morphologically similar to G. acerosa (Forsskål) Feldmann and Hamel, a cosmopolitan species yielding high-grade bacteriological and pharmaceutical agarose, as well as agar for food (Rioux and Turgeon, 2015). Gelidiella fanii is a recently described species from Taiwan that was previously misidentified as G. acerosa (Lin and Freshwater, 2008). It has been shown to be clearly distinct using mitochondrial cox1 and plastid rbcL DNA sequences, as well as by morphology. Thalli are iridescent under water and have downward curved branches with slender unilateral branchlets, numerous surface hairs on the distal end of branches and branchlets, and smaller tetrasporangia (Lin and Freshwater, 2008; Wiriyadamrikul et al., 2010). There have been no reports of sexual reproduction in G. fanii (Lin and Freshwater, 2008; Wiriyadamrikul et al., 2010; Boo et al., 2016c; Huisman et al., 2018), a characteristic common in other species of Gelidiella. Molecular analyses have confirmed the presence of G. fanii in Indonesia, Japan, the Philippines, Thailand, Vietnam, and northern Australia, in addition to Taiwan (Lin and Freshwater, 2008; Wiriyadamrikul et al., 2010; Boo et al., 2016c; Huisman et al., 2018). However, the taxonomy and distribution of G. fanii remains understudied outside of Southeast Asia and northern Australia because of its morphological similarity to G. acerosa, a species that is recorded globally and is morphologically variable depending on habitat.
To date, 40 individual gene sequences of G. fanii are publicly available in GenBank; 23 mitochondrial cox1, and 14 plastid rbcL, two psaA, and one psbA from Southeast Asia and northern Australia (Lin and Freshwater, 2008; Wiriyadamrikul et al., 2010; Boo et al., 2016b,c; Huisman et al., 2018). These data have been used for taxonomic studies and analyses of the biogeographical structure of cox1 haplotype networks in Southeast Asia. However, limited taxon sampling and individual gene datasets are insufficient for full molecular characterization of the populations of this presumably widespread species. We wished to determine how complete mitogenomes vary among geographically isolated populations of G. fanii, and which individual genes have useful resolution at the population level. The aims of this study were i) to obtain complete mitogenomes using High Throughput Sequencing (HTS) techniques, ii) to investigate the utility of intergenic spacer regions as well as PCGs for population studies, and iii) to establish haplotype networks of cox1 to understand the distribution of G. fanii in the Indo-Pacific Ocean.
Materials and Methods
Habitat and Collection of Specimens
Like G. acerosa, G. fanii occurred on subtidal coral reefs and/or intertidal rocky reefs in the Indo-Pacific regions; however, G. fanii was very rare compared with G. acerosa. Specimens were mostly typical of the species, but they sometimes displayed fewer unilateral branchlets. All specimens collected in this study were vegetative or tetrasporic; and neither spermatangial (male) nor cystocarpic (female) plants were found.
Fresh specimens were collected in Hawai‘i, Juan de Nova Island in the Mozambique Channel, Tetiaroa Atoll in French Polynesia, the Philippines, Taiwan and Vietnam, and were placed in individual bags with silica gel until processed. Specimens were identified based on morphological observation as well as analyses using mitochondrial cox1 and plastid rbcL sequences. In addition, herbarium specimens identified as G. acerosa were studied on loan from University of California at Berkeley, United States. Voucher specimens are housed in the Natural History Museum, Chungnam National University, Korea (CNUK) and the herbarium of the University of French Polynesia, Tahiti (UPF). Information on all specimens used in this investigation is provided in Supplementary Table S1.
DNA Extraction and Genome Sequencing
Eight Gelidiella fanii individuals were selected to represent the species’ broad geographic distribution in the Indo-Pacific Ocean and the topology of the cox1 phylogeny (below). DNA was extracted from ∼5 mg of dried tissue using NucleoSpin Plant II Kit (Macherey-Nagel, Düren, Germany) according to the manufacturer’s protocol or DNeasy Blood and Tissue Kit (Qiagen, Valencia, California, USA) following Boo et al. (2016a). Two genomic DNAs extracted in the previous studies (Wiriyadamrikul et al., 2010; Huisman et al., 2018), one from the Philippines (CNU026931) and the other from northern Australia (CNU066493), were also used for genome sequencing. Two outgroup species, G. acerosa and G. flabella G.H.Boo and L.Le Gall, were included for HTS. Library preparation and HTS were performed by Genotech Co. (Daejeon, Korea) with Illumina platforms, HiSeq2500 or HiSeqX, using 100 bp or 150 bp paired-end library constructions, respectively.
Genome Assembly and Annotation
The raw reads were assembled using a combination of approaches, NOVOPlasty 3.5 (Dierckxsens et al., 2016), SPAdes assembler 3.13.0 (Nurk et al., 2013) and MEGAHIT (Li et al., 2015). Assembled contigs were sorted and reassembled using Geneious Prime 2019.2.31 to construct consensus mitochondrial genome sequences. To confirm the accuracy of the assembly, raw reads were mapped to the draft mitochondrial genomes using Bowtie2 in Geneious Prime.
Mitochondrial genomes were annotated using BlastX and NCBI ORFfinder. Transfer RNA (tRNA) genes were predicted by tRNAscan-SE v. 2.0 (Lowe and Chan, 2016) with default settings and the “Mold/Protozoan Mito” model, RNAweasel server2, and Aragorn v.1.2.38 (Laslett and Canback, 2004). Only tRNA positions supported by at least two programs were retained for further analysis. Ribosomal RNA (rDNA) genes were predicted by RNAmmer 1.2 server (Lagesen et al., 2007).
Comparison of Mitogenome Structure and Phylogenetic Analysis
The physical map of the mitogenome was prepared for visualization using OrganellarGenomeDRAW (OGDraw) (Lohse et al., 2013). Locally collinear blocks (LCBs) alignments were generated using ProgressiveMauve (Darling et al., 2004) with a seed of 21 for the mitochondrial alignments and the ‘Use seed families’ option selected. CREx (Bernt et al., 2007) was performed to compare the gene order and their rearrangement events (e.g., inversion, transpositions, reverse transpositions, and tandem-duplication-random-loss [TDRL]) using heuristic pairwise comparisons with the common interval measurement in the genus Gelidiella. Twenty-three PCGs were translated into amino acid sequences and aligned using MAFFT 7.450 (Katoh and Standley, 2013) under the default setting in Geneious Prime. The alignment was manually adjusted and the ambiguous sites were deleted by GBlocks v.0.19b (Castresana, 2000). The phylogenetic tree of the concatenated dataset of 23 PCGs was reconstructed using Maximum Likelihood (ML) and Bayesian inference (BI). For the ML analysis, the best-fitting partitioning schemes and models of molecular evolution were inferred by using ModelFinder (Kalyaanamoorthy et al., 2017). Based on the Bayesian information criterion (BIC), ModelFinder identified two partitions: mtVer + F + I + G4 for atp4 + atp8 + rpl16 + rps3 + rps11 + sdh3 + sdhD + tatC and mtVer + F + I + G4 for atp6 + atp9 + cob + cox1 + cox2 + cox3 + nad1 + nad2 + nad3 + nad4 + nad4L + nad5 + nad6 + rps12 + sdh2. The ML analyses were performed using the W-IQ-tree webserver (Trifinopoulos et al., 2016) with 1,000 ultrafast bootstrap (BS) replicates. For the BI analysis, PartitionFinder v.2.1.1 (Lanfear et al., 2016) was used to select the best-fitting partitioning schemes and models of molecular evolution using the greedy algorithm with unlinked branch lengths. The PartitionFinder identified three partitions: CPREV + I + G for nad2 + nad5 + nad3 + nad4 + sdh2 + rps12 + nad6 + rpl16 + atp8 + rps11 + rps3 + atp4, MTMAM + I + G for cox1 + atp9 + cob + cox2 + cox3 + atp6 + nad1 + nad4L, and MTMAM + I + G for tatC + sdh3 + sdhD. The BI was performed with MrBayes v.3.2.1 (Ronquist et al., 2012) using the Metropolis-coupled Markov Chain Monte Carlo (MC3) with the models selected by PartitionFinder. For each matrix, four million generations of two independent runs were performed with four chains and sampling trees every 100 generations. The burn-in period was identified graphically by tracking the likelihoods at each generation to determine when they reached a plateau. Twenty-five percent of saved trees were removed, and the remaining trees used to calculate the Bayesian posterior probabilities (BPP).
Genetic diversities, in mitogenomes, PCGs, and intergenic spacer levels, were calculated by DnaSP v.5.10.1 (Librado and Rozas, 2009). To test the selection pressure of mitochondrial PCGs, ratios of non-synonymous (Ka) versus synonymous substitutions (Ks) were measured using DnaSP. Pairwise genetic distances were computed to assess the divergences of G. fanii, G. acerosa and G. flabella. Haplotype networks were constructed from PCGs and intergenic spacer regions with PopART v.1.7 (Leigh and Bryant, 2015) using the median-joining networks (MJN) (Bandelt et al., 1999).
Molecular Analyses of Mitochondrial cox1 and Plastid rbcL
DNA extractions, polymerase chain reaction (PCR) amplification, and sequencing followed Boo et al. (2016b). The primers used for amplifying and sequencing were F7, F645, R753, and RrbcS start for rbcL (Freshwater and Rueness, 1994; Lin et al., 2001; Gavio and Fredericq, 2002), and COXI43F and COXI1549R for cox1 (Geraldino et al., 2006). When large fragments of the analyzed loci could not be amplified in one herbarium specimen (UC1461694, collected in 1962), we were able to amplify and sequence 237 bp of rbcL using primers F577, F993, and R753 (Freshwater and Rueness, 1994). Sequences of the forward and reverse strands were determined for all taxa, and the electropherograms were edited using MEGA7 (Kumar et al., 2016) and checked manually. Newly generated sequences were deposited in GenBank. Sequences were aligned using the MUSCLE algorithm in MEGA7 with default parameters and the alignment was manually adjusted.
Phylogenies of individual datasets were reconstructed with Maximum Likelihood (ML) analysis using the W-IQ-tree webserver. The best-fitting substitution model was determined with the model test option (auto), followed by the ML tree search, and 1,000 ultrafast bootstrap replicates. Haplotype network of mitochondrial cox1 was constructed with PopART v.1.7 using the median-joining networks (MJN). Haplotype diversity (h) and nucleotide diversity (π) were calculated for each population and at the species level using DnaSP v.5.1. Non-hierarchical and hierarchical analyses of molecular variance (AMOVA) was performed using Arlequin v.3.5 (Excoffier and Lischer, 2010) with Φ-statistics to quantify the proportion of total genetic variance, with significance of fixation indices tested using 10,000 permutations. The hierarchical partition was set to seven groups (I–VII) based on the phylogeny and haplotype network of cox1.
Results
Gelidiella Mitogenomes
Ten complete mitogenomes were sequenced using HTS; eight from Gelidiella fanii and one of each from G. acerosa and G. flabella (Table 1). The sequences of Gelidiella mitogenomes showed 91.5% identity in most regions relative to G. fanii. Pairwise divergences of mitogenomes within G. fanii were in a range of 2.4 ± 0.8% (between Hawai‘i and northern Australia). Interspecific pairwise divergences were 14.4 ± 0.1% between G. fanii and G. acerosa and 18.0 ± 0.08% between G. fanii with G. flabella.
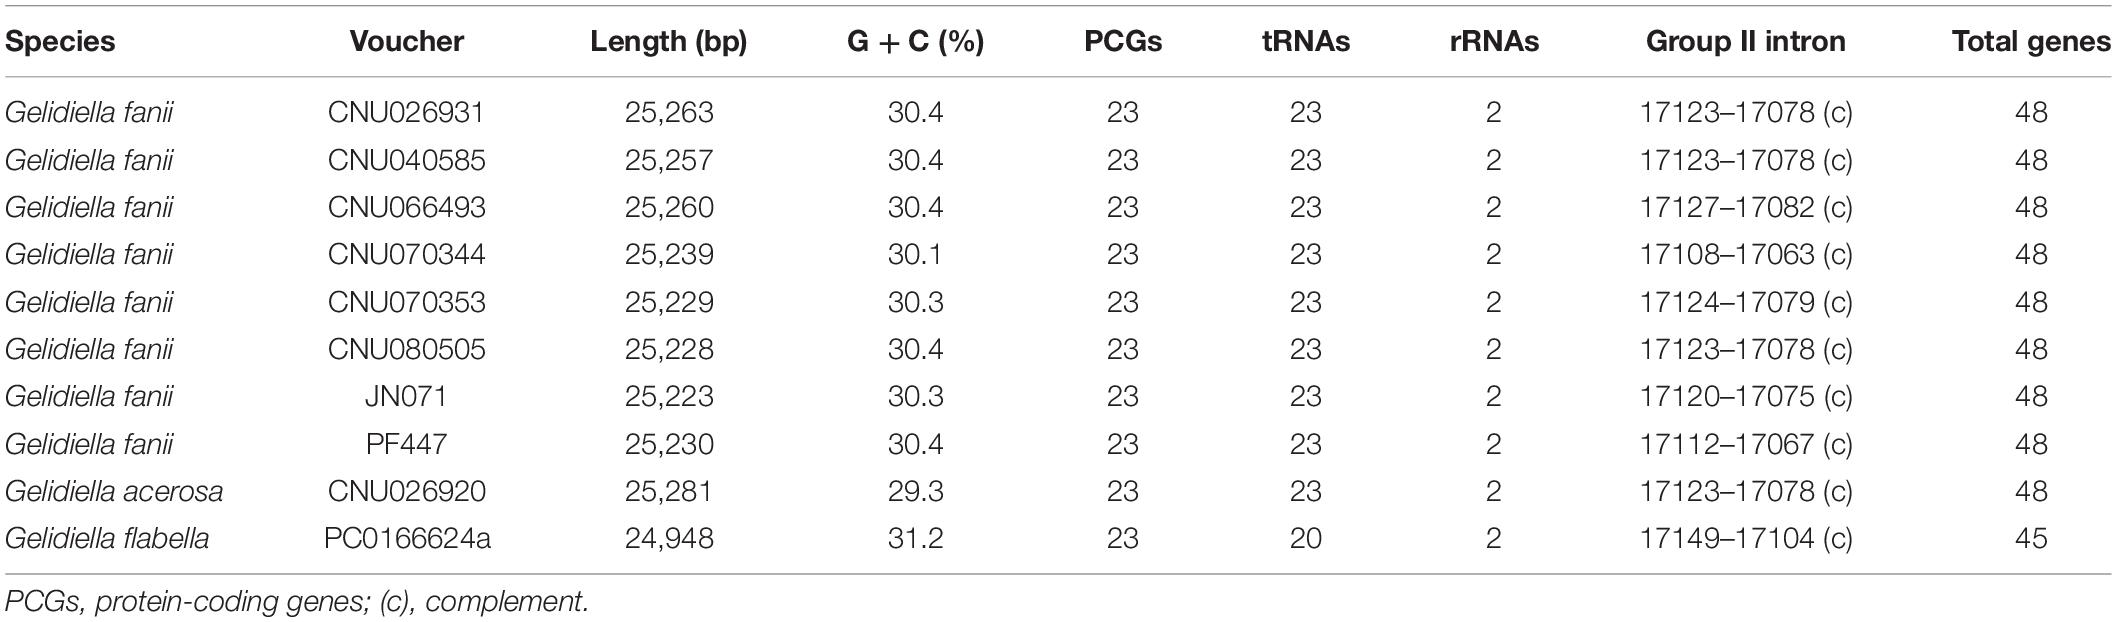
Table 1. Characteristics of 10 complete mitogenomes of Gelidiella fanii, G. acerosa, and G. flabella.
The mitogenomes of G. fanii ranged in size from 25,223 bp (JN071, Juan de Nova Island) to 25,263 bp (CNU026931, the Philippines), with highly conserved gene synteny (Table 1 and Supplementary Figure S1). The GC content was in a range of 30.3 ± 0.1%. The mitogenomes contained 48 genes, consisting of 23 PCGs, 23 tRNAs, and 2 rRNA subunits, a result similar to the publicly available mitogenomes of Gelidium J.V.Lamouroux and Pterocladiella B.Santelices and Hommersand (Boo et al., 2016a), which were included in our phylogenomic analysis. All eight G. fanii mitogenomes had a group II intron between the nad5 and nad4 genes. Three types of tRNAs were found between the trnA and trnN regions (Figure 1A). TYPE1 (trnY-trnR-trnS insertion) was found in most G. fanii and G. acerosa samples. TYPE2 (trnS-trnR-trnY inversion) was present in G. fanii from northern Australia (CNU066493). This tRNA inversion rearrangement was inferred from the putative ancestral state of G. acerosa (trnY-trnR-trnS). TYPE3 (lacking trnY-trnR-trnS) was most common in the Gelidiales and Gelidiella flabella (Figure 1A and Supplementary Table S2).
Figure 1. (A) The tRNA insertion and inversion rearrangement of trnY-trnR-trnS region in Gelidiales. (B) Maximum likelihood phylogeny of Gelidiella using 23 protein-coding genes generated in this study and previously published data of the Gelidiales. Both ML bootstrap values (≥ 50%) and Bayesian posterior probabilities (≥ 0.9) are indicated near branches. Bold letter indicates newly generated sequences in this study. Red bar indicates tRNA inversion rearrangement inferred by CREx analysis.
Phylogenomics and Gene Characteristics
The concatenated dataset of 23 PCGs (5,555 amino acid positions) from 23 mitogenomes, including 13 previously published mitogenomes (nine Gelidium and four Pterocladiella), was used for phylogenetic analysis. Because the topologies of ML and BI were identical, we show the ML tree with branch supports of MLBS and BPP. Mitochondrial phylogenomics revealed that the three species of Gelidiella formed a fully supported clade. Gelidiella fanii was monophyletic (BS: 100, BPP: 1.0) and clearly segregated from G. acerosa and G. flabella (Figure 1B). Two G. fanii mitogenomes from the Philippines clustered with full support with those from Tetiaroa Atoll (BS: 100, BPP: 1.0) and those formed a moderately supported clade with Hawai‘i (BS: 79, BPP: 0.97). Gelidiella fanii from Taiwan formed a clade (BS: 100, BPP: 1.0) with Vietnam, and was sister to Juan de Nova Island.
The characteristics of the 23 PCGs are provided in Table 2. The mean value of the ratio of non-synonymous (Ka) versus synonymous substitutions (Ks) for 23 PCGs was in a range of 0.0000–0.2827 (Supplementary Figure S2). The value was low in atp9 (0.0000), cox1 (0.0189), cob (0.0258), cox2 (0.0416), cox3 (0.0519), and nad4L (0.0538) compared to the other PCGs. The number of haplotypes for 23 PCGs is provided in Table 2. The haplotype networks of six genes with a low Ka/Ks ratio are shown in Supplementary Figure S3.
Table 2. A comparison of 23 protein-coding and two ribosomal genes in Gelidiella fanii.
Intergenic spacers, mostly less than 100 bp in size, were detected in 46 regions (Table 3). Six spacer regions were > 100 bp in size: 144 bp in trnA-trnY, 145 bp in rps11-nad3, 158 bp in cox2-cox3, 247 bp in trnM-rns, 409 bp in trnW-trnA, and 526 bp in nad4-nad5. Of these, five regions contained six to seven haplotypes (Figure 2 and Table 3), except the trnA-trnY region in northern Australian sequences, which was excluded due to an inversion rearrangement (Table 3).
Table 3. A comparison of intergenic spacers in Gelidiella fanii.
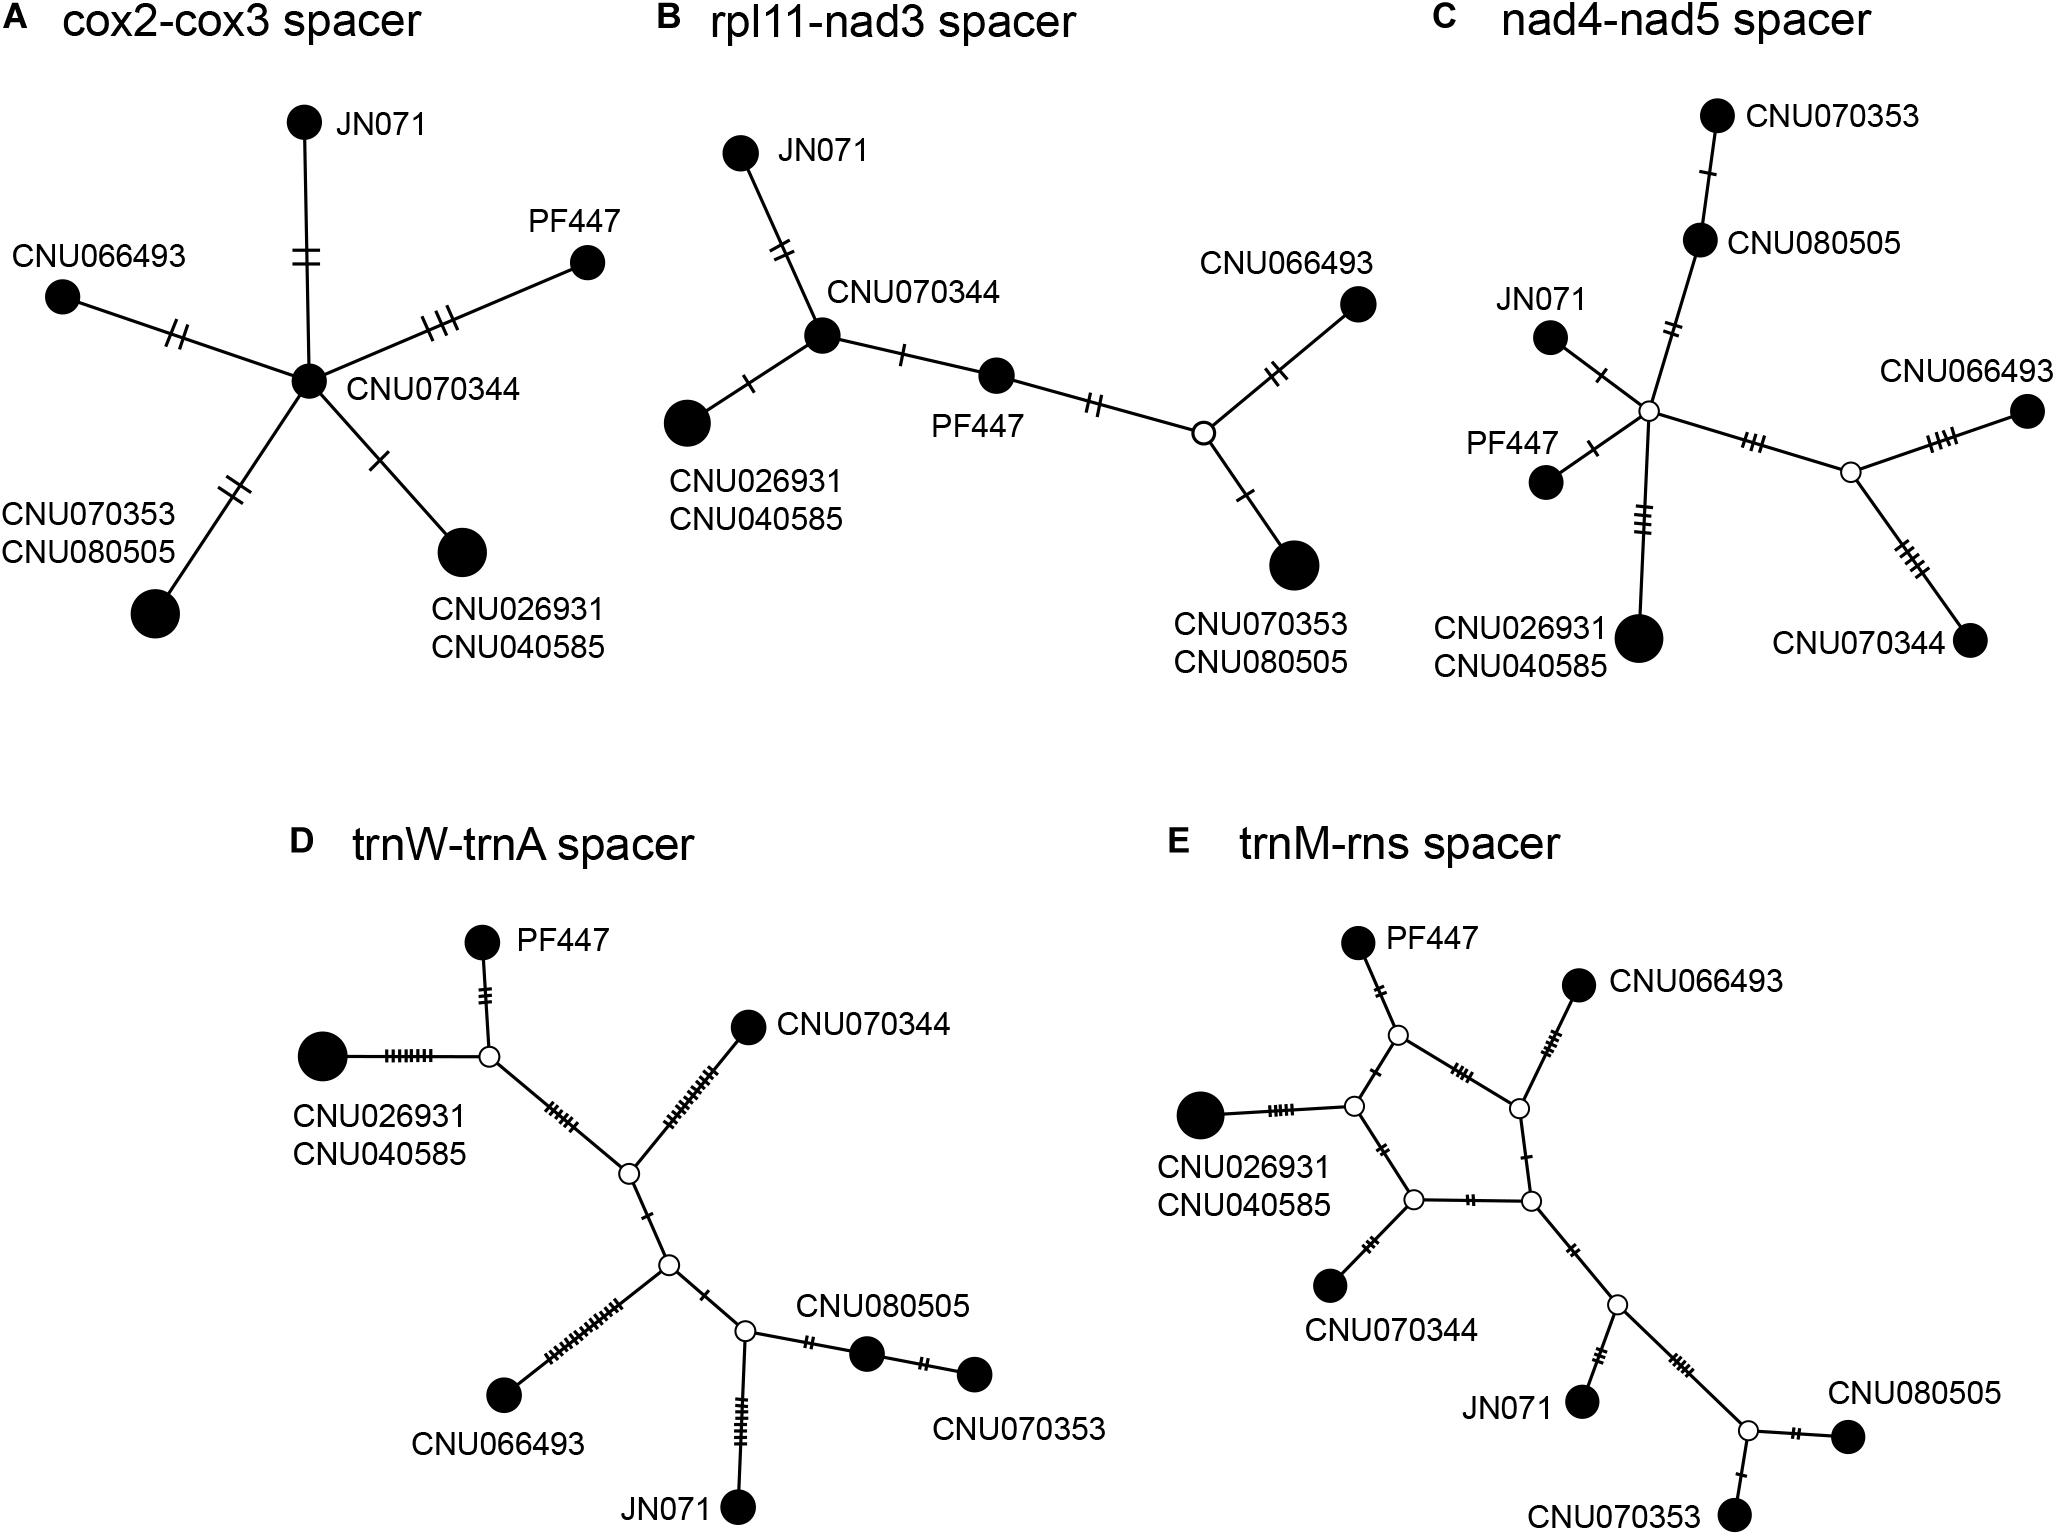
Figure 2. Haplotype networks of five intergenic spacer regions: cox2-cox3 (A), rpl11-nad3 (B), nad4-nad5 (C), trnW-trnA (D), and trnM-rns (E). The size of circle is proportional to haplotype frequencies in each network. Each connecting line indicates one mutation step between haplotypes.
Phylogeny of Mitochondrial cox1 and Plastid rbcL
Both markers newly confirmed the occurrence of G. fanii in Kenya, Juan de Nova Island, and Tetiaroa Atoll; rbcL sequences confirmed its presence in Eritrea (Supplementary Figure S4). The unrooted phylogeny of G. fanii based on 47 cox1 sequences, including 21 newly generated sequences, consisted of seven groups (I–VII) (Figure 3); I from Southeast Asia (Taiwan, Thailand, the Philippines, Vietnam, Japan), II from Eastern Africa (Juan de Nova Island, Kenya), III from Indonesia, IV from northern Australia, V from the Philippines, VI from Tetiaroa Atoll, and VII from Hawai‘i. Groups III and IV formed a strongly supported clade (BS: 94); groups V and VI were clustered with moderate support (BS: 84).
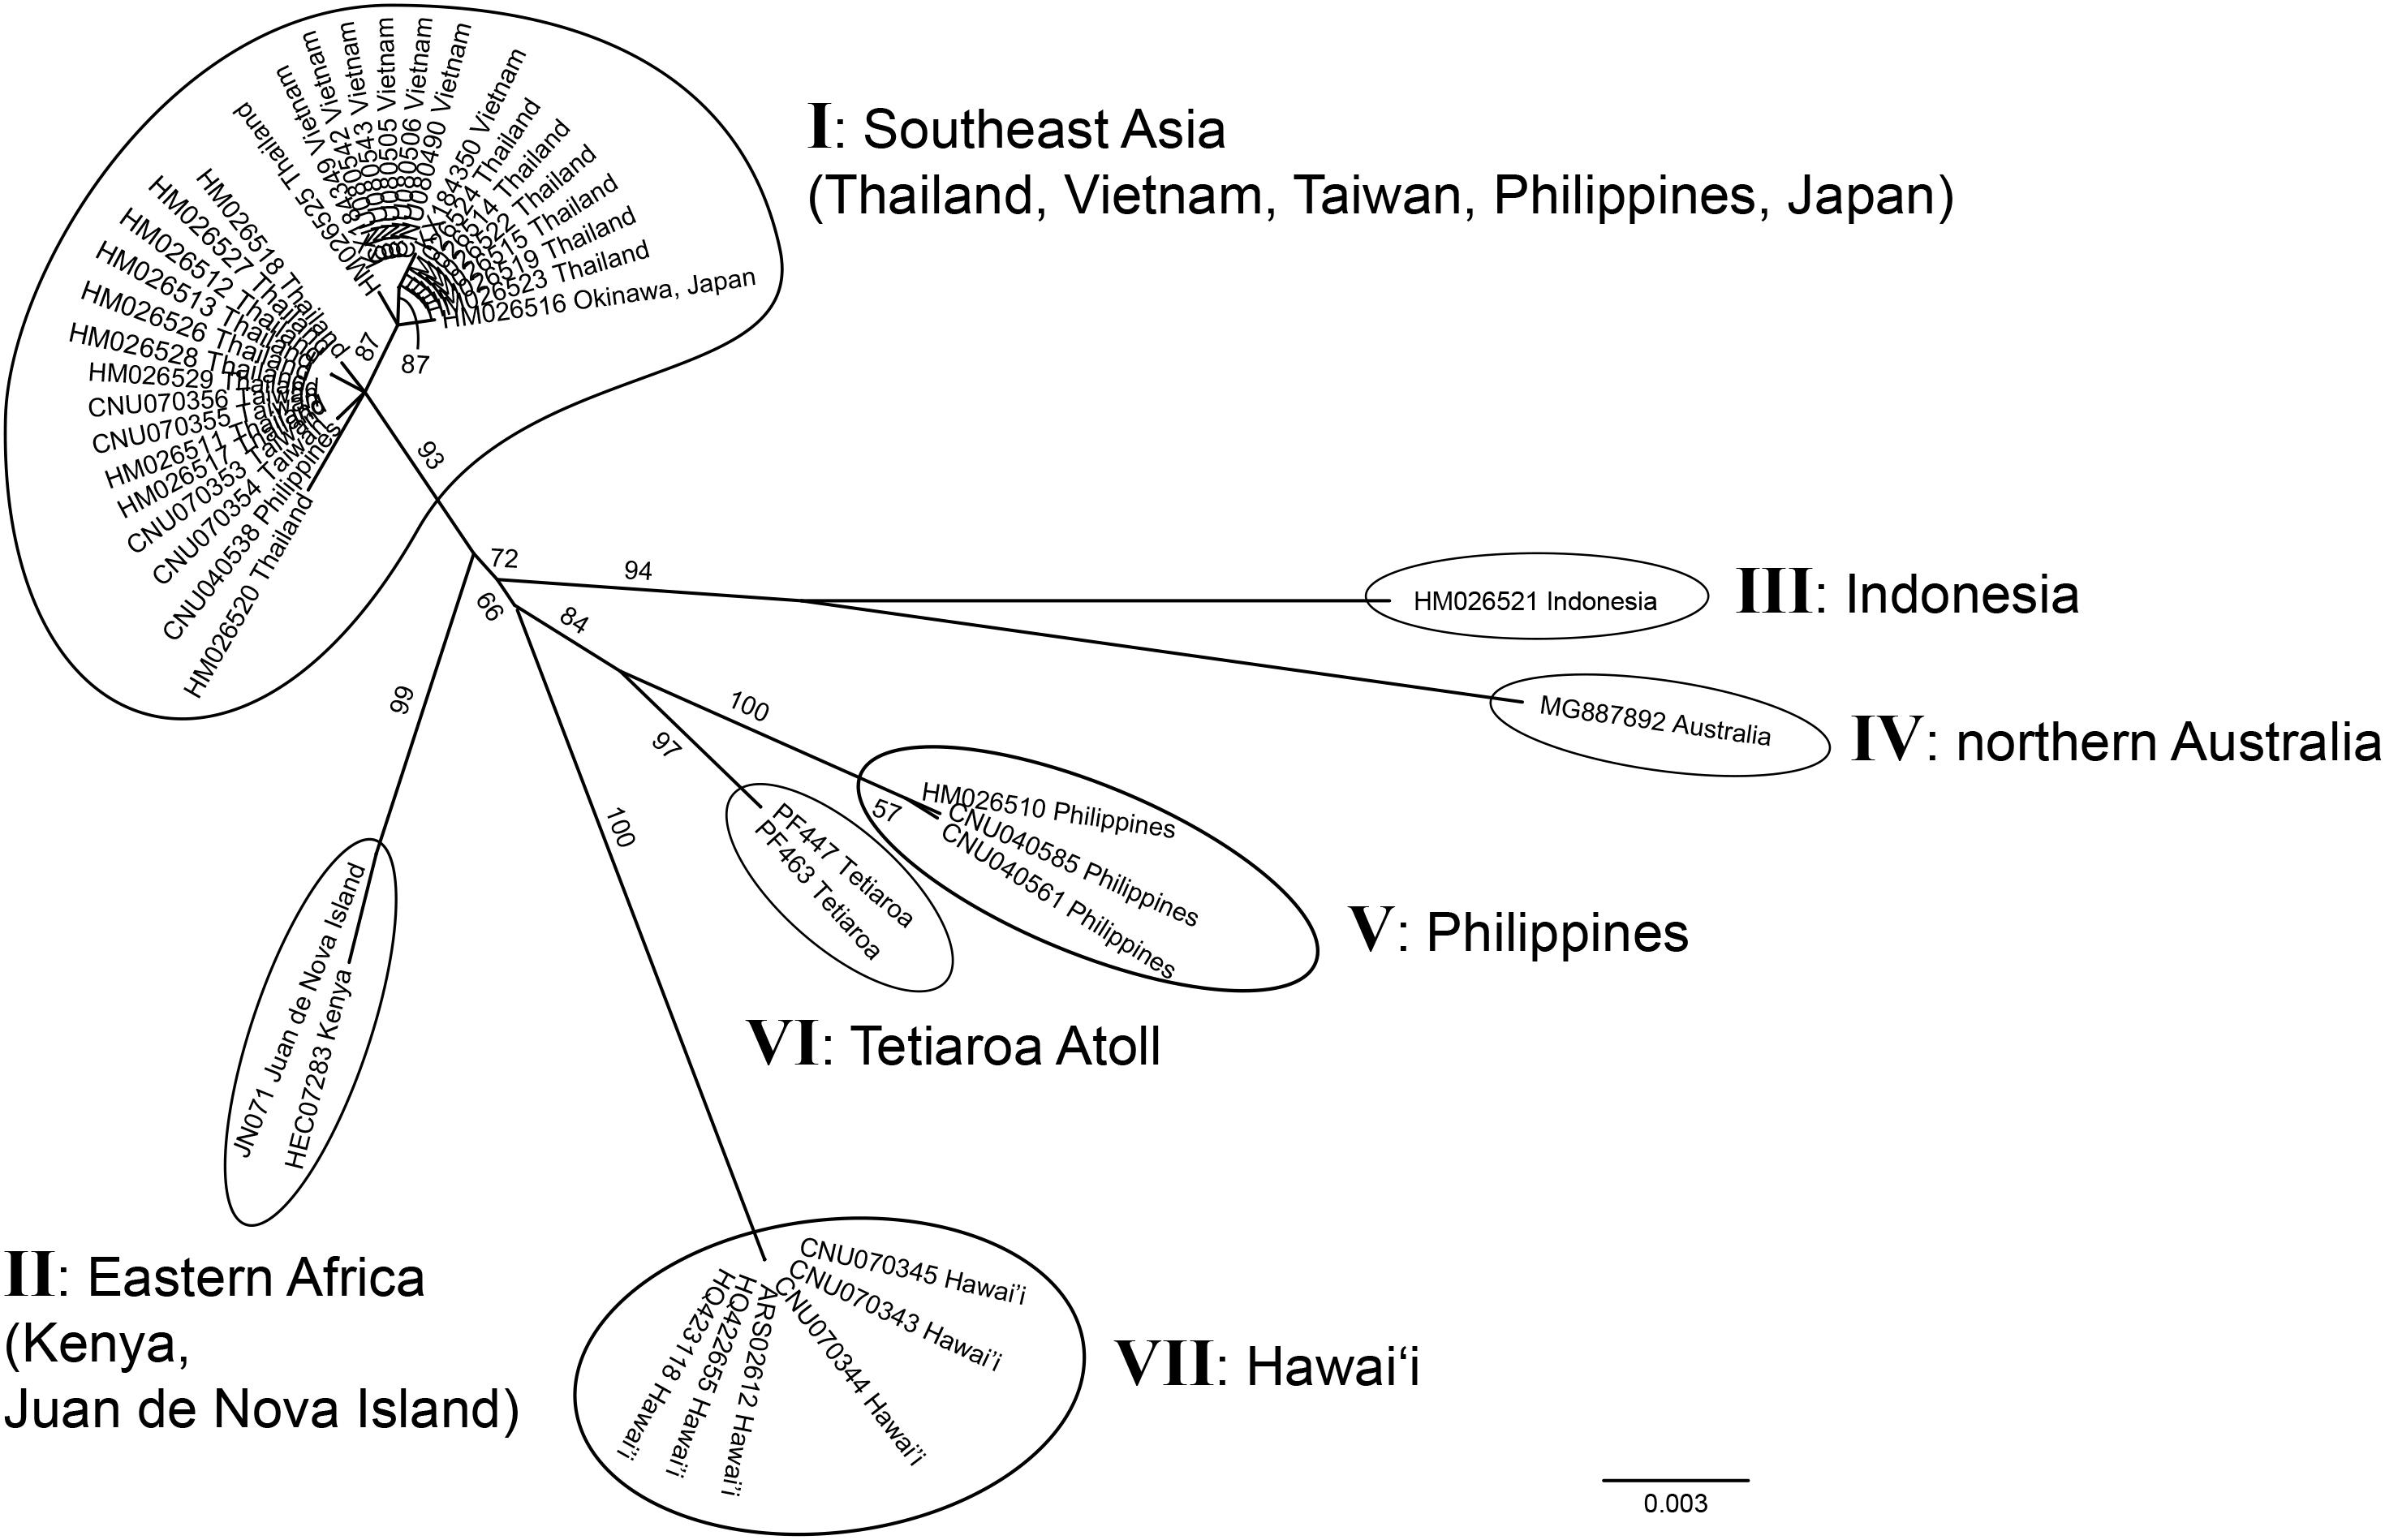
Figure 3. Unrooted phylogeny of Gelidiella fanii obtained by maximum-likelihood inference of mitochondrial cox1 sequences. ML bootstrap values (≥ 50%) are indicated near branches. Seven genetic groups are marked from I to VII.
Of a total of 23 rbcL sequences from G. fanii, 10 were generated in this study. The short rbcL sequences (237 bp) were successfully amplified from the herbarium specimen from Eritrea (UC1461694, as G. acerosa) that we identified as G. fanii. It differed by 0 to 1 bp (0–0.4%) from all other G. fanii specimens (Supplementary Table S3), but was 6 bp (2.5%) different from G. acerosa and 16 bp (6.8%) from G. flabella. The unrooted phylogeny of rbcL was similar to that of cox1 (Supplementary Figure S4), except that the Hawaiian sequences grouped with Kenya and Juan de Nova Island.
Genetic Diversity, Haplotype Network, and Population Structure of Mitochondrial cox1
The cox1 dataset revealed high estimates of haplotype diversity (h = 0.931) and nucleotide diversity (π = 0.00951), indicating genetic heterogeneity within the species. The median-joining network consisted of 19 haplotypes in seven groups, connected by many missing haplotypes related to the geographical distances between sampling locations (Figure 4). Haplotypes from Indonesia (C13) and northern Australia (C14) were distantly related (32 missing haplotypes) while Southeast Asian haplotypes (C1–C10) were connected by 1–3 missing haplotypes. Two haplotypes from Taiwan shared sequences with Thailand (C2) and the Philippines (C6), respectively. Haplotypes from the Philippines were separated into two groups: one was restricted to Cebu (C15–C17), while the other (C6), shared with Taiwan, clustered with Southeast Asian haplotypes. The Indonesian haplotype (C13) was distantly connected to those from Southeast Asia. Haplotypes from northern Australia (C14), Tetiaroa Atoll (C18), and Hawai‘i (C19) were also isolated.
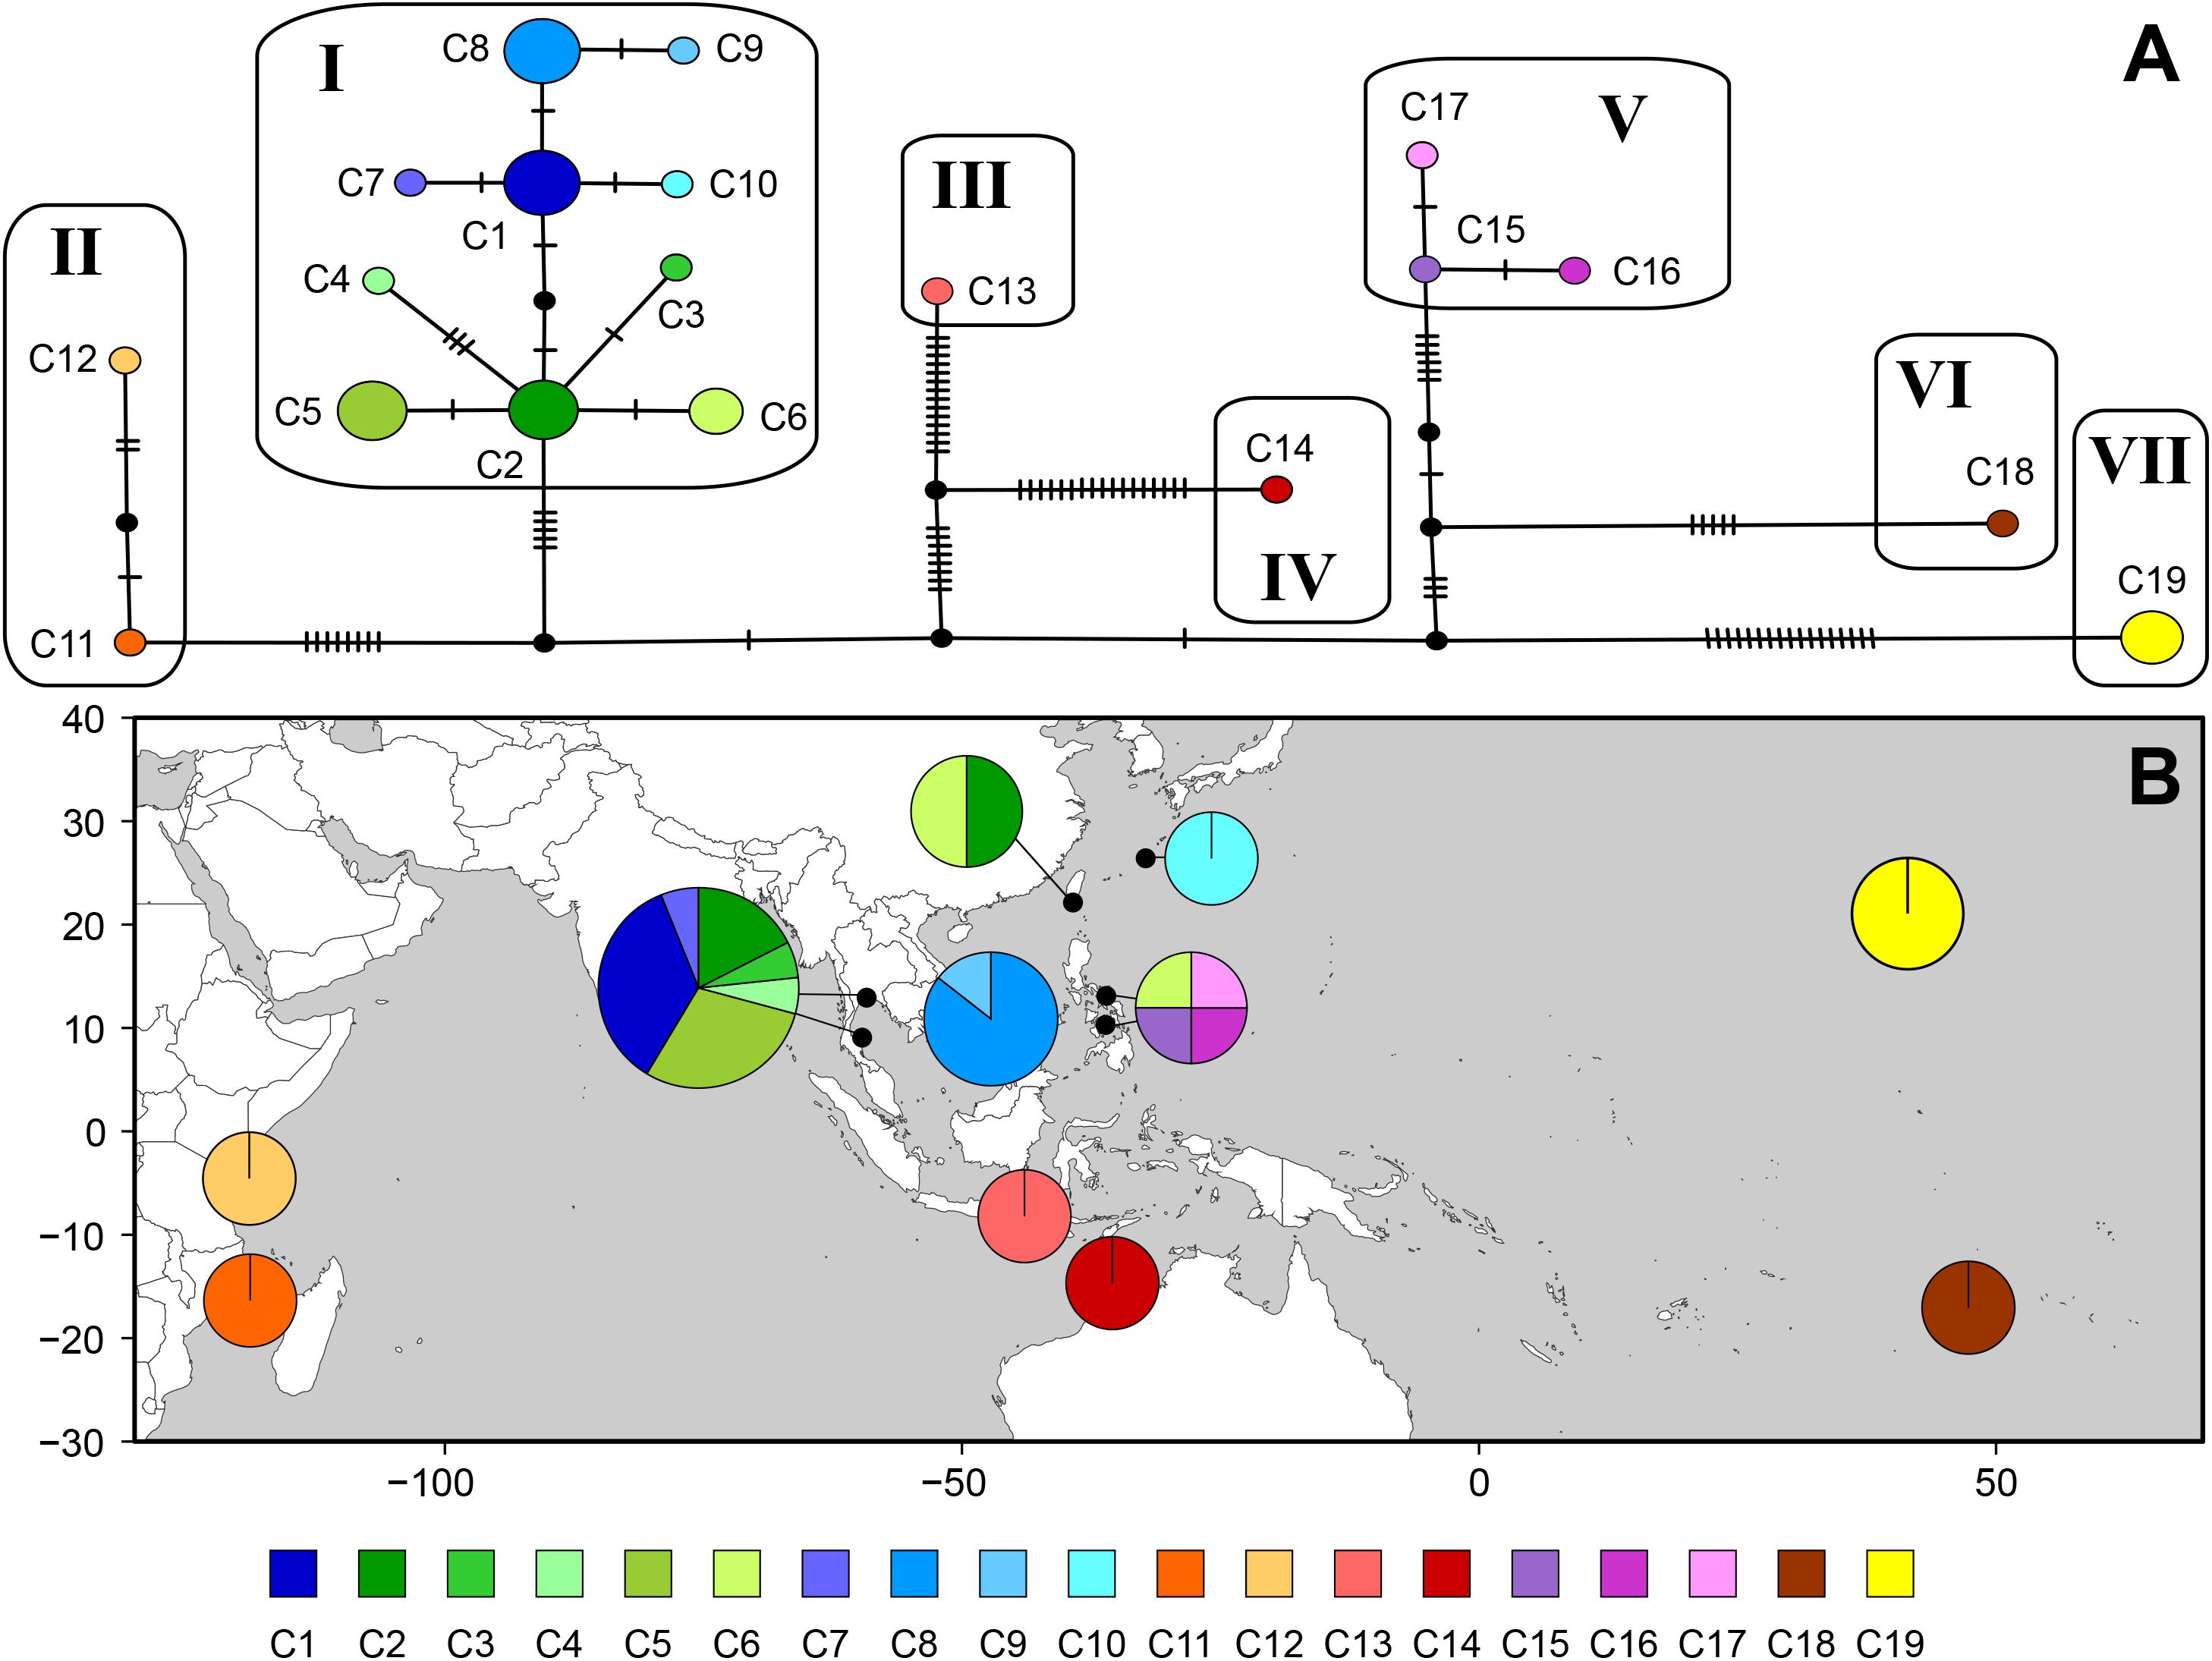
Figure 4. Haplotype network (A) and geographic distribution of haplotypes (B) based on mitochondrial cox1 for Gelidiella fanii. (A) Each circle denotes a single haplotype with size proportional to frequency. Each connecting line indicates one mutation step between haplotypes. Filled circle indicates inferred unsampled or extinct haplotypes. (B) Pie chart denotes the proportion of haplotypes present in each population. Haplotype is colored as shown in the key.
Non-hierarchical AMOVA showed that most of the cox1 variation within species was found among populations (85.36%; Table 4), while a smaller amount of genetic variation was found within populations (14.64%). Genetic subdivision was highly significant among populations (ΦST = 0.85, P < 0.001). The hierarchical AMOVA indicated the total genetic variance was mainly explained by the variance among groups (88.16%, ΦCT = 0.88, P < 0.001); the variances among populations within groups (6.23%, ΦSC = 0.53, P < 0.001) and within populations (5.62%, ΦST = 0.94, P < 0.001) were much lower (Table 4).
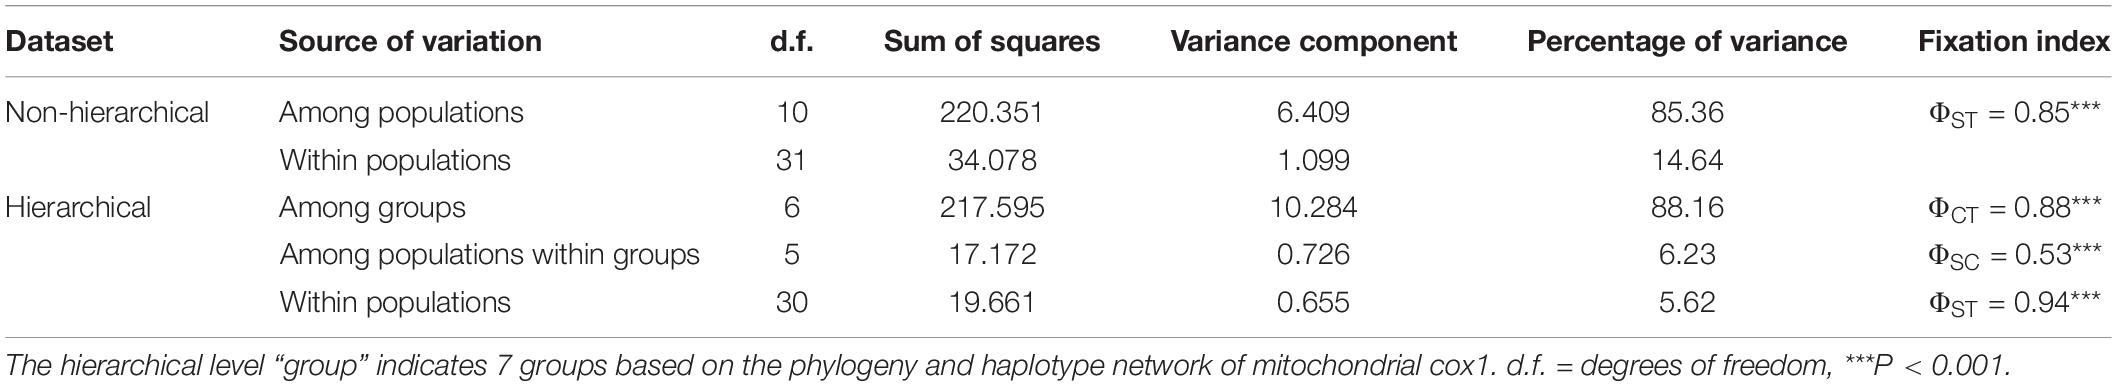
Table 4. Non-hierarchical and hierarchical analyses of molecular variance (AMOVA) of mitochondrial cox1 from Gelidiella fanii.
Discussion
We sequenced eight complete mitogenomes of Gelidiella fanii and two outgroup species, G. acerosa and G. flabella. Gene content and organization in the newly determined Gelidiella mitogenomes are similar to published reports for Gelidium and Pterocladiella. However, the Gelidiella mitogenome is slightly larger (45–48 genes and 25,223–25,281 bp) than those (43–44 genes and 24,901–24,970 bp) of Gelidium and Pterocladiella (Yang et al., 2015; Boo et al., 2016a; Boo and Hughey, 2019). The differences are due to the addition of three tRNA genes centrally positioned in the tRNA track between atp6-tatC of all three species of Gelidiella. The three tRNAs are tyrosine, arginine, and serine, which are located between arginine and asparagine. Interestingly, an insertion of tRNA track, trnY-trnR-trnS (TYPE1) was characteristic of G. fanii and G. acerosa, supporting their close relationship compared to G. flabella and other species in the Gelidiales. The Australian G. fanii differs, however, by having an inversion, trnS-trnR-trnY (TYPE2).
The pairwise divergences in mitogenome data ranged from 0.07 to 3.4% within G. fanii, which is higher than that in Pterocladiella capillacea (S.G.Gmelin) Santelices and Hommersand from the Galápagos Islands and Pacific Mexico (Boo et al., 2016a). However, pairwise divergence in rbcL was 0–0.5%, a value lower than interspecific divergences (0.8–0.9%) in the Gelidiales, with the exception of a closely related sibling species (Boo et al., 2014). The pairwise divergences in rbcL fell within the large range of reported rhodomelacean divergences, e.g., 0.4–1% in Symphyocladiella dendroidea (Montagne) D.Bustamante, B.Y.Won, S.C.Lindstrom and T.O.Cho, and 0.3–0.7% in Melanothamnus harveyi (Bailey) Díaz-Tapia and Maggs (Díaz-Tapia et al., 2018).
Pairwise divergence within or between species is a relative value rather than an absolute criterion for species recognition. The Australian G. fanii, differed by 2.4–2.8% in cox1 and 0.3–0.5% in rbcL from other populations of G. fanii, may represent a closely related sibling species. This hypothesis may be supported by the unique tRNA inversion. However, because the Long Reef specimen was used in its entirety for the molecular analyses, additional material was not available for further morphological examination to determine whether it is a closely related cryptic species or not (Huisman et al., 2018).
Phylogenomic analyses corroborate the monophyly of G. fanii and its independence from outgroup species. The close relationship of G. fanii with G. acerosa and G. flabella has been supported by previous multigene phylogenies (Boo et al., 2016b,c). Gelidiella fanii is sympatric with G. acerosa in Juan de Nova Island, Tetiaroa Atoll, and Vietnam (this study) as well as Southeast Asia (Lin and Freshwater, 2008; Wiriyadamrikul et al., 2010). Because asexual propagation via tetrasporangia or fragmentation is apparently the only means of reproduction in the genus Gelidiella, we speculate that G. fanii may have arisen by sympatric asexual speciation from an ancestor of the G. acerosa complex. Alternatively, it is possible that sexual reproduction was lost in the genus after speciation, reinforcing the isolation of populations.
The mitogenome and cox1 sequences demonstrate the widespread distribution of G. fanii from Kenya and Juan de Nova Island (Mozambique Channel) to Hawai‘i and Tetiaroa Atoll (this study) as well as in northern Australia and Southeast Asia (Lin and Freshwater, 2008; Wiriyadamrikul et al., 2010; Boo et al., 2016c; Huisman et al., 2018). Its occurrence in Eritrea is confirmed by a short, conserved region of rbcL from an archival herbarium specimen. We found several archival herbarium specimens from Samoa and Tonga housed in UC that were morphologically similar to G. fanii; however, our efforts to isolate genomic data from those specimens were unsuccessful.
The broad range of G. fanii, spanning the east and west margins of the Indo-Pacific Ocean, is part of an interesting biogeographical story. In contrast, recent molecular studies have revealed that many so-called widespread species are introduced, misidentified species, or consisted of a complex of local cryptic species (Won et al., 2009; Sherwood et al., 2010; Boo et al., 2018; Díaz-Tapia et al., 2018; Leliaert et al., 2018). That said, this and previous studies have recently distinguished G. fanii from its very similar and widespread congener, G. acerosa, with which it has been long confused.
The phylogeny and haplotype network of Gelidiella fanii detected strong signals of genetic differentiation into seven geographical groups; i) Southeast Asia, ii) Kenya/Juan de Nova Island, iii) Indonesia, iv) northern Australia, v) the Philippines, vi) Tetiaroa Atoll, and vii) Hawai‘i. The origin of these groups may be interpreted via two scenarios. One hypothesis is that ancient populations of G. fanii were widely distributed in the Tethys Ocean and the local populations accumulated genetic changes at the geographical periphery. Subsequently, local populations have likely been geographically isolated by changes in sea level and other oceanographic conditions during the Pleistocene epoch (2.6 Ma – 11.7 ka), which experienced many glacial-interglacial cycles (Herzschuh et al., 2016). A similar hypothesis has been proposed for Gelidiophycus G.H.Boo, J.K.Park and S.M.Boo and Mazzaella G.De Toni (Montecinos et al., 2012; Boo et al., 2019). This hypothesis is supported by low dispersal capacity of G. fanii, a small species lacking flotation and with asexual reproduction. Our second hypothesis is that Southeast Asia, rich in haplotypes, was the center of origin of G. fanii. Populations may have subsequently migrated to marginal regions of the Indo-Pacific Ocean. This hypothesis has been proposed for Portieria Zanardini species (Gigartinales) that originated in the Central Indo-Pacific and then dispersed in all directions, although the origins of species in remote islands were uncertain (Leliaert et al., 2018). Additional sampling in more regions is necessary to differentiate the two hypotheses, but the logistics of sampling are currently difficult. It is unlikely that G. fanii has recently spread via introductions because of the paucity of shared haplotypes among the seven groups. The many missing haplotypes also indicate deep history.
The mitochondrial genome is a significant source of molecular markers at different levels of resolution. The cox1 gene, with the lowest Ka/Ks ratio (0.0189), is considered a good marker at the population level and has a high degree of resolution at the species level (Boo et al., 2016b). The large size (1,602 bp) of cox1 also provides evolutionarily important information with many singletons (58) and haplotypes (8). Its utility as a population marker has been demonstrated for Gelidiophycus species (Boo et al., 2019). COI-5P (∼664 bp), a conserved part of cox1 gene, is the well-known DNA barcoding marker for identifying red algal species and populations (e.g., Saunders, 2005; Sherwood et al., 2010; Hu et al., 2015; Freshwater et al., 2017; Leliaert et al., 2018). The haplotype number (7) and nucleotide diversity (0.0175 ± 0.0026) of COI-5P are similar to those of cox1 gene, supporting its utility in population studies. Both cox2 and cox3 can also be useful markers; cox2 (783 bp) contained 31 singletons and six haplotypes, and cox3 (819 bp) contained 36 singletons and seven haplotypes. The cytochrome b gene (cob, 1,146 bp), with 47 singletons and seven haplotypes, has been used as a DNA barcode at the species and population levels (Saunders and Moore, 2013; Yoon et al., 2014).
Five intergenic spacers described in this study are candidates for markers to distinguish populations. The cox2-cox3 (158 bp) contained six haplotypes with a nucleotide diversity of 0.0204 ± 0.0036. This spacer region (∼350–400 bp including flanking parts) has been used to identify red algal species and populations (e.g., Zuccarello et al., 1999; Lim et al., 2013; Kamiya and West, 2014; Pezzolesi et al., 2019). Rps11-nad3 (145 bp) may be a suitable marker with its six haplotypes and nucleotide diversity of 0.0235 ± 0.0037. Nad4-nad5, trnW-trnA, and trnM-rns contained seven haplotypes; however, nucleotide diversity was higher in trnW-trnA (0.0422 ± 0.0050) and trnM-rns (0.0483 ± 0.0046) than nad4-nad5 (0.0131 ± 0.0024). Suitable primers for amplifying the above spacer regions have yet to be designed and tested for their practical use in population studies.
Conservation and Conclusion
This study, a detailed characterization of the phylogeography of G. fanii using data from the mitogenomes of eight populations, reveals significant genetic structure correlated with geographic distribution. The continued persistence of G. fanii is unclear, considering its rarity and close association with G. acerosa, with which it likely competes for substrate, nutrients and light. There is a critical shortage of gelidioid biomass for the production of high-grade bacteriological and pharmaceutical agar (Callaway, 2015; Santos and Melo, 2018). The harvest of Gelidiella is possible due to the higher productivity of populations in tropical waters compared to those of temperate species of Gelidium (Ganzon-Fortes, 1994; Santos and Melo, 2018). Commercial harvest of G. acerosa for agar impacts G. fanii and, because it is rare, population reduction over time is probable. Minimizing the loss of genetic diversity is a key factor for conserving economically important marine species. Populations with distinct haplotypes can be recognized and managed as independent conservation units. Populations could also be protected within marine reserves or marine protected areas. Systematic management of natural populations can improve biomass yields for the agar industry. Ecological and phenological studies will be needed in the future to detect changes in population sizes and shifts in geographical ranges due to overharvesting and anticipated oceanographic climate change.
Mitogenome data are currently unavailable for population studies of florideophycean red algae, a large and diverse group comprising 7,000 species. Our results represent a new path toward a mitogenomic picture of the evolution and biogeography of widespread red algal species. This study is the first to describe and analyze complete mitogenomes from the family Gelidiellaceae and to test their utility for population-level studies. We have extended the range of G. fanii from Southeast Asia and northern Australia to the eastern and western margins of the Indo-Pacific Ocean, and have suggested that the observed patterns of genetic groups may have resulted from sea level fluctuations or other environmental changes that occurred during the Pleistocene. On the basis of our mitogenome sequences, we propose that intergenic spacer regions as well as PCGs can be explored as suitable markers at the population level for red algae. Markers derived from mitogenomic analyses are important tools for tracking species ranges and developing future conservation strategies for ecologically and economically important red algal species.
Data Availability Statement
The datasets generated for this study can be found in GenBank under the accession numbers, MT742595–MT742604 for mitogenomes, MT758387–MT758400 for mitochondrial cox1, and MT758377–MT758386 for plastid rbcL sequences.
Author Contributions
GHB, MTF, SMB, and KAM conceived and designed the study. GHB, MZ, ARS, SMB, and KAM performed the collections and provided samples. GHB and JRH performed laboratory work and the data analyses. All authors participated in the interpretation of the data and writing the manuscript.
Funding
This study was supported by Basic Science Research Program through the National Research Foundation of Korea (NRF) by the Ministry of Education (2018R1A6A3A03012648), the São Paulo Research Foundation (FAPESP) for Bolsas Concedidas como Itens Orçamentários em Auxílios/BCO – Pós-Doutorado (2019/16956-2), and postdoctoral funding from the Silva Center for Psychological Documentation, University Herbarium, University of California at Berkeley to GHB; BIORECIE program with the financial support of the Institut National des Sciences de l’Univers (INSU), the Institut de Recherche pour le Developpement (IRD), the Agence des Aires Marines Protegées (AAMP), the Fondation pour la Recherche sur la Biodiversite (FRB), and the TAAF (“Terres Australes et Antarctiques Françaises”) to MZ; the U.S. National Science Foundation (DEB-1754117) to ARS; and the Fundação de Amparo à Pesquisa do Estado de São Paulo (FAPESP 2016/50370-7) and the Conselho Nacional de Desenvolvimento Científico e Tecnológico – CNPq for the Productivity Fellowship (304899/2017-8) to MTF.
Conflict of Interest
The authors declare that the research was conducted in the absence of any commercial or financial relationships that could be construed as a potential conflict of interest.
Acknowledgments
The authors thank Olivier de Clerck, Eric Coppejans, John Huisman, Paul Geraldino, Line Le Gall, Shao-Lun Liu, and Tu van Nguyen for providing materials or help with collection trips. The authors also thank Tetiaroa Society for the logistical support in Tetiaroa atoll sampling.
Supplementary Material
The Supplementary Material for this article can be found online at: https://www.frontiersin.org/articles/10.3389/fmars.2020.583957/full#supplementary-material
Footnotes
- ^ https://www.geneious.com
- ^ https://megasun.bch.umontreal.ca/cgi-bin/RNAweasel/RNAweaselInterface.pl
References
Bandelt, H. J., Forster, P., and Röhl, A. (1999). Median-joining networks for inferring intraspecific phylogenies. Mol. Biol. Evol. 16, 37–48. doi: 10.1093/oxfordjournals.molbev.a026036
Bernt, M., Merkle, D., Ramsch, K., Fritzsch, G., Perseke, M., Bernhard, D., et al. (2007). CREx: inferring genomic rearrangements based on common intervals. Bioinformatics 23, 2957–2958. doi: 10.1093/bioinformatics/btm468
Boo, G. H., and Hughey, J. R. (2019). Phylogenomics and multigene phylogenies decipher two new cryptic marine algae from California, Gelidium gabrielsonii and Gelidium kathyanniae (Gelidiales, Rhodophyta). J. Phycol. 55, 160–172. doi: 10.1111/jpy.12802
Boo, G. H., Hughey, J. R., Miller, K. A., and Boo, S. M. (2016a). Mitogenomes from type specimens, a genotyping tool for morphologically simple species: ten genomes of agar-producing red algae. Sci. Rep. 6:e35337. doi: 10.1038/srep35337
Boo, G. H., Le Gall, L., Miller, K. A., Freshwater, D. W., Wernberg, T., Terada, R., et al. (2016b). A novel phylogeny of the Gelidiales (Rhodophyta) based on five genes including nuclear CesA, with descriptions of Orthogonacladia gen. nov. and Orthogonacladiaceae fam. nov. Mol. Phylogenet. Evol. 101, 359–372. doi: 10.1016/j.ympev.2016.05.018
Boo, G. H., Nguyen, T. V., Kim, J. Y., Le Gall, L., Rico, J. M., Bottalico, A., et al. (2016c). A revised classification of the Gelidiellaceae (Rhodophyta) with description of three new genera: Huismaniella, Millerella, and Perronella. Taxon 65, 965–979. doi: 10.12705/655.2
Boo, G. H., Kim, K. M., Nelson, W. A., Riosmena-Rodríguez, R., Yoon, K. J., and Boo, S. M. (2014). Taxonomy and distribution of selected species of the agarophyte genus Gelidium (Gelidiales, Rhodophyta). J. Appl. Phycol. 26, 1243–1251. doi: 10.1007/s10811-013-0111-7
Boo, G. H., Le Gall, L., Rousseau, F., de Reviers, B., Coppejans, E., Anderson, R., et al. (2015). Phylogenetic relationships of Gelidiella (Gelidiales, Rhodophyta) from Madagascar with a description of Gelidiella incrassata sp. nov. Cryptogam. Algol. 36, 219–237. doi: 10.7872/crya.v36.iss2.2015.219
Boo, G. H., Qui, Y.-X., Kim, J. Y., Ang, P. O., Bosch, S., De Clerck, O., et al. (2019). Contrasting patterns of genetic structure and phylogeography in the marine agarophytes Gelidiophycus divaricatus and G. freshwateri (Gelidiales, Rhodophyta) from East Asia. J. Phycol. 55, 1319–1334. doi: 10.1111/jpy.12910
Boo, G. H., Robledo, D., Andrade-Sorcia, G., and Boo, S. M. (2018). Genetic discontinuity of Digenea (Rhodomelaceae, Rhodophyta) from Mexico supports recognition of two new species, D. mexicana and D. rafaelii. Algae 33, 231–241. doi: 10.4490/algae.2018.33.8.20
Bustamante, D. E., Calderon, M. S., and Hughey, J. R. (2019). Conspecificity of the Peruvian Corallina ferreyrae with C. caespitosa (Corallinaceae, Rhodophyta) inferred from genomic analysis of the type specimen. Mitochondrial DNA B Resour. 4, 1285–1286. doi: 10.1080/23802359.2019.1591203
Callaway, E. (2015). Lab staple agar hit by seaweed shortage. Nature 528, 171–172. doi: 10.1038/528171a
Castresana, J. (2000). Selection of conserved blocks from multiple alignments for their use in phylogenetic analysis. Mol. Biol. Evol. 17, 540–552. doi: 10.1093/oxfordjournals.molbev.a026334
Costa, O. S., Attrilla, M. J., Pedrinib, A. G., and De-Paulab, J. C. (2002). Spatial and seasonal distribution of seaweeds on coral reefs from Southern Bahia, Brazil. Bot. Mar. 45, 346–355. doi: 10.1515/BOT.2002.035
Darling, A. C. E., Mau, B., Blattner, F. R., and Perna, N. T. (2004). Mauve: multiple alignment of conserved genomic sequence with rearrangements. Genome Res. 14, 1394–1403. doi: 10.1101/gr.2289704
Díaz-Tapia, P., Maggs, C. A., Macaya, E. C., and Verbruggen, H. (2018). Widely distributed red algae often represent hidden introductions, complex of cryptic species or species with strong phylogeographic structure. J. Phycol. 54, 829–839. doi: 10.1111/jpy.12778
Dierckxsens, N., Mardulyn, P., and Smits, G. (2016). NOVOPlasty: de novo assembly of organelle genomes from whole genome data. Nucleic Acids Res. 45:e18. doi: 10.1093/nar/gkw955
Excoffier, L., and Lischer, H. E. L. (2010). Arlequin suite ver. 3.5: a new series of programs to perform population genetics analyses under Linux and Windows. Mol. Ecol. Res. 10, 564–567. doi: 10.1111/j.1755-0998.2010.02847.x
Freshwater, D. W., Idol, J. N., Parham, S. L., Fernández-García, C., Léon, N., Gabrielson, P. W., et al. (2017). Molecular assisted identification reveals hidden red algae diversity from the Burica Peninsula, Pacific Panama. Diversity 9:e19. doi: 10.3390/d9020019
Freshwater, D. W., and Rueness, J. (1994). Phylogenetic relationships of some European Gelidium (Gelidiales, Rhodophyta) species, based on rbcL nucleotide sequence analysis. Phycologia 33, 187–194. doi: 10.2216/i0031-8884-33-3-187.1
Gabrielson, P. W., Hughey, J. R., and Díaz-Pulido, G. (2018). Genomics reveals abundant speciation in the coral reef building alga Porolithon onkodes (Corallinales, Rhodophyta). J. Phycol. 54, 429–434. doi: 10.1111/jpy.12761
Ganzon-Fortes, E. T. (1994). “Gelidiella,” in Biology of Economic Algae, ed. I. Akatsuka (The Hague: SPB Academic Publishing), 149–184.
Gavio, B., and Fredericq, S. (2002). Grateloupia turuturu (Halymeniaceae, Rhodophyta) is the correct name of the nonnative species in the Atlantic known as Grateloupia doryphora. Eur. J. Phycol. 37, 349–359. doi: 10.1017/S0967026202003839
Geraldino, P. J. L., Yang, E. C., and Boo, S. M. (2006). Morphology and molecular phylogeny of Hypnea flexicaulis (Gigartinales, Rhodophyta) from Korea. Algae 21, 417–423. doi: 10.4490/algae.2006.21.4.417
Herzschuh, U., Birks, H. J. B., Laepple, T., Andreev, A., Melles, M., and Brigham-Grette, J. (2016). Glacial legacies on interglacial vegetation at the Pliocene-Pleistocene transition in NE Asia. Nat. Commun. 7:11967. doi: 10.1038/ncomms11967
Hu, Z. M., Li, J. J., Sun, Z. M., Oak, J. H., Zhang, J., Fresia, P., et al. (2015). Phylogeographic structure and deep lineage diversification of the red alga Chondrus ocellatus Holmes in the northwest Pacific. Mol. Ecol. 24, 5020–5033. doi: 10.1111/eva.12455
Hughey, J. R., and Boo, G. H. (2016). Genomic and phylogenetic analysis of Ceramium cimbricum (Ceramiales, Rhodophyta) from the Atlantic and Pacific oceans supports the naming of a new invasive Pacific entity Ceramium sungminbooi sp. nov. Bot. Mar. 59, 211–222. doi: 10.1515/bot-2016-0036
Hughey, J. R., Gabrielson, P. W., Rohmer, L., Tortolani, J., Silva, M., Miller, K. A., et al. (2014). Minimally destructive sampling of type specimens of Pyropia (Bangiales, Rhodophyta) recovers complete plastid and mitochondrial genomes. Sci. Rep. 4:5113. doi: 10.1038/srep05113
Huisman, J. M., Boo, G. H., and Boo, S. M. (2018). “Gelidiales,” in Algae of Australia: Marine Benthic Algae of North-Western Australia, 2. Red Algae, ed. J. M. Huisman (Canberra: ABRS & CSIRO), 245–264.
Kalyaanamoorthy, S., Minh, B. Q., Wong, T. K. F., von Haeseler, A., and Jermiin, L. S. (2017). ModelFinder: fast model selection for accurate phylogenetic estimates. Nat. Meth. 14, 587–589. doi: 10.1038/nmeth.4285
Kamiya, M., and West, J. A. (2014). Cryptic diversity in the euryhaline red alga Caloglossa ogasawaraensis (Delesseriaceae, Ceramiales). Phycologia 53, 374–382. doi: 10.2216/13-242.1
Katoh, K., and Standley, D. M. (2013). MAFFT multiple sequence alignment software version 7: improvements in performance and usability. Mol. Biol. Evol. 30, 772–780. doi: 10.1093/molbev/mst010
Kumar, S., Stecher, G., and Tamura, K. (2016). MEGA7: molecular evolutionary genetics analysis version 7.0 for bigger datasets. Mol. Biol. Evol. 33, 1870–1874. doi: 10.1093/molbev/msw054
Lagesen, K., Hallin, P., Rødland, E. A., Staerfeldt, H.-H., Rognes, T., and Ussery, D. W. (2007). RNAmmer: consistent and rapid annotation of ribosomal RNA genes. Nucleic Acids Res. 35, 3100–3108. doi: 10.1093/nar/gkm160
Lanfear, R., Frandsen, P. B., Wright, A. M., Senfeld, T., and Calcott, B. (2016). PartitionFinder 2: new methods for selecting partitioned models of evolution for molecular and morphological phylogenetic analyses. Mol. Biol. Evol. 34, 772–773. doi: 10.1093/molbev/msw260
Laslett, D., and Canback, B. (2004). ARAGORN, a program to detect tRNA genes and tmRNA genes in nucleotide sequences. Nucleic Acids Res. 32, 11–16. doi: 10.1093/nar/gkh152
Leblanc, C., Boyen, C., Richard, O., Bonnard, G., Grienenberger, J. M., and Kloaereg, B. (1995). Complete sequence of the mitochondrial DNA of the rhodophyte Chondrus crispus (Gigartinales). Gene content and genome organization. J. Mol. Biol. 250, 484–495. doi: 10.1006/jmbi.1995.0392
Leigh, J. W., and Bryant, D. (2015). PopART: full-feature software for haplotype network construction. Methods Ecol. Evol. 6, 1110–1116. doi: 10.1111/2041-210X.12410
Leliaert, F., Payo, D. A., Gurgel, C. F. D., Schils, T., Draisma, S. G. A., Saunders, G. W., et al. (2018). Patterns and drivers of species diversity in the Indo-Pacific red seaweed Portieria. J. Biogeogr. 45, 2299–2313. doi: 10.1111/jbi.13410
Li, D., Liu, C. M., Luo, R., Sadakane, K., and Lam, T. W. (2015). MEGAHIT: an ultra-fast single-node solution for large and complex metagenomics assembly via succinct de Bruijn graph. Bioinformatics 31, 1674–1676. doi: 10.1093/bioinformatics/btv033
Librado, P., and Rozas, J. (2009). DnaSP v5: a software for comprehensive analysis of DNA polymorphism data. Bioinformatics 25, 1451–1452. doi: 10.1093/bioinformatics/btp187
Lim, P.-E., Tan, J., Phang, S. M., Nikmatullah, A., Hong, D. D., Sunarpi, H., et al. (2013). Genetic diversity of Kappaphycus Doty and Eucheuma J. Agardh (Solieriaceae, Rhodophyta) in Southeast Asia. J. Appl. Phycol. 26, 1253–1272. doi: 10.1007/s10811-013-0197-y
Lin, S.-M., Fredericq, S., and Hommersand, M. H. (2001). Systematics of the Delesseriaceae (Ceramiales, Rhodophyta) based on large subunit rDNA and rbcL sequences, including the Phycodryoideae subfam. nov. J. Phycol. 37, 881–899. doi: 10.1046/j.1529-8817.2001.01012.x
Lin, S.-M., and Freshwater, D. W. (2008). The red algal genus Gelidiella (Gelidiales, Rhodophyta) from Taiwan, including Gelidiella fanii sp. nov. Phycologia 47, 168–176. doi: 10.2216/07-30.1
Lohse, M., Drechsel, O., Kahlau, S., and Bock, R. (2013). OrganellarGenomeDRAW – a suite of tools for generating physical maps of plastid and mitochondrial genomes and visualizing expression data sets. Nucleic Acids Res. 41, W575–W581. doi: 10.1093/nar/gkt289
Lowe, T. M., and Chan, P. P. (2016). tRNAscan-SE On-line: search and contextual analysis of transfer RNA genes. Nucleic Acids Res. 44, W54–W57. doi: 10.1093/nar/gkw413
Montecinos, A., Broitman, B. R., Faugeron, F., Haye, P. A., Tellier, F., and Guillemin, M. L. (2012). Species replacement along a linear coastal habitat: phylogeography and speciation in the red alga Mazzaella laminarioides along the south east Pacific. BMC Evol. Biol. 12:97. doi: 10.1186/1471-2148-12-97
Nurk, S., Bankevich, A., Antipov, D., Gurevich, A. A., Korobeynikov, A., Lapidus, A., et al. (2013). Assembling single-cell genomes and mini-metagenomes from chimeric MDA products. J. Comput. Biol. 20, 714–737. doi: 10.1089/cmb.2013.0084
Pezzolesi, L., Peña, V., Le Gall, L., Gabrielson, P. W., Kaleb, S., Hughey, J. R., et al. (2019). Mediterranean Lithophyllum strictiforme (Corallinales, Rhodophyta) is a genetically diverse species complex: implications for species circumscription, biogeography and conservation of coralligenous habitats. J. Phycol. 55, 473–492. doi: 10.1111/jpy.12837
Rioux, L., and Turgeon, S. L. (2015). “Seaweed carbohydrates,” in Seaweed Sustainability: Food and Non-Food Applications, eds B. J. Tiwari and D. J. Troy (London: CRC Press), 141–192. doi: 10.1016/b978-0-12-418697-2.00007-6
Ronquist, F., Teslenko, M., van Der Mark, P., Ayres, D., Darling, A., Hohna, S., et al. (2012). MrBayes 3.2: efficient Bayesian phylogenetic inference and model choice across a large model space. Syst. Biol. 61, 539–542. doi: 10.1093/sysbio/sys029
Salomaki, E. D., and Lane, C. E. (2016). Red algal mitochondrial genomes are more complete than previously reported. Genome Biol. Evol. 9, 48–63. doi: 10.1093/gbe/evw267
Santos, R., and Melo, R. A. (2018). Global shortage of technical agars: back to basics (resource management). J. Appl. Phycol. 30, 2463–2473. doi: 10.1007/s10811-018-1425-2
Saunders, G. W. (2005). Applying DNA barcoding to red macroalgae: a preliminary appraisal holds promise for future applications. Philos. Trans. R. Soc. B 360, 1879–1888. doi: 10.1098/rstb.2005.1719
Saunders, G. W., and Moore, T. E. (2013). Refinements for the amplification and sequencing of red algal DNA barcode and RedToL phylogenetic markers: a summary of current primers, profiles and strategies. Algae 28, 31–43. doi: 10.4490/algae.2013.28.1.031
Sherwood, A. R., Sauvage, T., Kurihara, A., Conklin, K. Y., and Presting, G. G. (2010). The Hawaiian Rhodophyta biodiversity survey (2006-2010): a summary of principal findings. BMC Plant Biol. 10:258. doi: 10.1186/1471-2229-10-258
Song, S. L., Yong, H. S., Lim, P. E., and Phang, S. M. (2017). Complete mitochondrial genome of Gracilaria changii (Rhodophyta: Gracilariaceae). J. Appl. Phycol. 29, 2129–2134. doi: 10.1007/s10811-017-1100-z
Suzuki, M., Segawa, T., Mori, H., Akiyoshi, A., Ootsuki, R., Kurihara, A., et al. (2016). Next-generation sequencing of an 88-year-old specimen of the poorly known species Liagora japonica (Nemaliales, Rhodophyta) supports the recognition of Otohimella gen. nov. PLoS One 11:e0158944. doi: 10.1371/journal.pone.0158944
Trifinopoulos, J., Nguyen, L.-T., von Haeseler, A., and Minh, B. Q. (2016). W-IQ-TREE: a fast online phylogenetic tool for maximum likelihood analysis. Nucleic Acids Res. 44, W232–W235. doi: 10.1093/nar/gkw256
Wiriyadamrikul, J., Park, J. K., Khan, W., and Boo, S. M. (2010). Additional records of Gelidiella fanii (Gelidiales, Rhodophyta) from the southeast Pacific based on morphology, rbcL and cox1 analyses. Bot. Mar. 53, 343–350. doi: 10.1515/BOT.2010.037
Won, B. Y., Cho, T. O., and Fredericq, S. (2009). Morphological and molecular characterization of species of the genus Centroceras (Ceramiaceae, Rhodophyta), including two new species. J. Phycol. 45, 227–250. doi: 10.1111/j.1529-8817.2008.00620.x
Yang, E. C., Kim, K. M., Kim, S. Y., Lee, J. M., Boo, G. H., Lee, J.-H., et al. (2015). Highly conserved mitochondrial genomes among multicellular red algae of the Florideophyceae. Genome Biol. Evol. 7, 2394–2406. doi: 10.1093/gbe/evv147
Yoon, K. J., Kim, K. M., Boo, G. H., Miller, K. A., and Boo, S. M. (2014). Mitochondrial cox1 and cob sequence diversities in Gelidium vagum (Gelidiales, Rhodophyta) in Korea. Algae 29, 15–25. doi: 10.4490/algae.2014.29.1.015
Keywords: agar-yielding algae, biogeography, Gelidiales, haplotype lineages, mitogenomes, widespread species
Citation: Boo GH, Zubia M, Hughey JR, Sherwood AR, Fujii MT, Boo SM and Miller KA (2020) Complete Mitochondrial Genomes Reveal Population-Level Patterns in the Widespread Red Alga Gelidiella fanii (Gelidiales, Rhodophyta). Front. Mar. Sci. 7:583957. doi: 10.3389/fmars.2020.583957
Received: 16 July 2020; Accepted: 22 September 2020;
Published: 08 October 2020.
Edited by:
Zhijun Dong, Yantai Institute of Coastal Zone Research (CAS), ChinaReviewed by:
Xiubao Li, Hainan University, ChinaJuan E. Uribe, Smithsonian National Museum of Natural History (SI), United States
Copyright © 2020 Boo, Zubia, Hughey, Sherwood, Fujii, Boo and Miller. This is an open-access article distributed under the terms of the Creative Commons Attribution License (CC BY). The use, distribution or reproduction in other forums is permitted, provided the original author(s) and the copyright owner(s) are credited and that the original publication in this journal is cited, in accordance with accepted academic practice. No use, distribution or reproduction is permitted which does not comply with these terms.
*Correspondence: Ga Hun Boo, Z2FodW5ib29AZ21haWwuY29t