 Fabio Falsone1
 Danilo Scannella1*
 Michele Luca Geraci1,2
 Vita Gancitano1
 Sergio Vitale1
 Fabio Fiorentino1
- 1Consiglio Nazionale delle Ricerche, Istituto per le Risorse Biologiche e le Biotecnologie Marine, Mazara del Vallo, Italy
- 2Laboratorio di Biologia Marina e Pesca di Fano (PU), Dipartimento di Scienze Biologiche, Geologiche ed Ambientali (BiGeA), Universitá di Bologna, Bologna, Italy
The silver scabbardfish Lepidopus caudatus is a mesopelagic species living on the shelf and slope down to 600 m in temperate seas all around the world. In the Mediterranean, the species is caught mainly by longlines with a marked seasonality. In the early 90s in the Strait of Sicily (Central Mediterranean Sea), a new fishery targeting L. caudatus was developed. This fishery uses an ad hoc pelagic trawl gear called “spatolara.” Vessels using spatolara have increased from 1 in 1993 to 10 in 2007 with a growth of catches of up to 1,200 tons in 2011. Development of this fishery was not regulated by any specific management measures and, due to the progressive reduction of catch to 169 tons, only one vessel was active in 2018. The availability of catch and biomass indices from trawl survey since the beginning of trawling exploitation allowed providing the first assessment of the state of L. caudatus stock in the Central Mediterranean (GFCM Geographical Sub-Area 16) by using data-limited methods. Catch-Maximum Sustainable Yield (CMSY) and Bayesian State Space Schaefer model (BSM) were fitted to landings and abundance indices (2004–2018). The Abundance-Maximum Sustainable Yield model (AMSY) was also applied to survey data from 1994 (1 year after the start of the spatolara fishery) to 2018 to further corroborate the results. BSM prediction of biomass levels was just above 50% of BMSY, whereas AMSY estimated the current stock levels below 50% of BMSY. The BSM was used for forecasting B/BMSY and catches under different fishing scenarios. Although current exploitation was very close to FMSY, more than a decade would be needed to rebuild the stock to biomass levels producing MSY. A faster rebuilding could be achieved by fishing at least 80% of FMSY, with minimal loss in yield over the next 5–8 years. Following the development of a new fishery since the beginning, the study provides a further example of how unregulated exploitation leads to a heavy overfished state of stock and collapse of fishing activities.
Introduction
The Silver scabbardfish, Lepidopus caudatus, is a mesopelagic species distributed in warm waters of all oceans and in the Mediterranean Sea. The species occurs both on the continental shelf and slope (Nakamura and Parin, 1993) from 100 m to more than 400 m, on sandy and muddy bottoms (Whitehead et al., 1986). The bathymetric distribution varies according to season, the species being more common on the continental shelf in winter time, and moving to deeper zones in other seasons (Demestre et al., 1993). L. caudatus forms schools and migrates vertically from bottom to the water column during night (Figueiredo et al., 2015). Despite its cosmopolitan distribution, knowledge on the biology of this species is poor and limited to growth (Molí et al., 1990; Demestre et al., 1993; D'Onghia et al., 2000) and reproductive cycle (Karlovac and Karlovac, 1976; Orsi Relini et al., 1989; Demestre et al., 1993; D'Onghia et al., 2000).
L. caudatus has a moderate commercial value and is caught mainly as commercial bycatch in several countries worldwide, i.e., Italy, Morocco, New Zealand, Portugal, and Spain, by bottom trawler, pelagic trawler, and longline fisheries (Robertson, 1980; Tuset et al., 2006; Figueiredo et al., 2015, Torre et al., 2019). To the best of our knowledge, only in New Zealand is the species sporadically caught as target by pelagic trawling in August–October off the west coast of the Island (Bentley et al., 2014).
In the Mediterranean Sea, only large specimens of L. caudatus have an economic value and are landed as commercial catch in Italy, Spain, Albania, and Tunisia, whereas small individuals are rejected (Demestre et al., 1993; D'Onghia et al., 2000; FAO., 2018). In Italy, the longline fishery catches only large individuals while bottom trawling fishery captures mainly small and immature specimens (D'Onghia et al., 2000). In the Mediterranean region, the capture production of silver scabbardfish reached a peak of almost 5,000 tons in 2011 and then slowly declined (Torre et al., 2011). In 2018, in the same area, the total capture production reached 1,675 tons with the 88% of the total catches belonging to Italy (FAO Fisheries aquaculture software., 2016). In spite of the amount of landings, the stock status of the species was never assessed in the Mediterranean. In this region, there is no targeted fishery for this species with exception of the Strait of Sicily (Central Mediterranean Sea), where the filets of the silver scabbardfish are sold in local markets up to 20 euro per kilo. In this area, until the early 90s, silver scabbardfish was mainly captured using longlines while it was a marginal bycatch from bottom trawlers.
At the beginning of the 1980s, the catch of L. caudatus on the entire Sicilian coasts amounted to 544 tons, out of which more than 90% was captured by longline (Cingolani et al., 1986). In the early 1990s, some fishers of Sciacca (south Sicily) developed a new pelagic trawl net locally called “spatolara” starting a new fishery for L. caudatus. The number of vessels using spatolara has progressively increased from 1 in 1993 to 10 in 2007, with a contextual increase of the catches up to 1,200 tons in 2011 and a shift in proportion of catch origin, with over 70% due to spatolara and the remaining 30% to bottom trawling, longline, and purse seine. The development of the spatolara fishery was not regulated by any specific management measures and, due to the progressive reduction of catch to 169 tons, only one vessel was using spatolara in 2018.
The present study provides the first assessment of the state of L. caudatus in the Mediterranean basin and more precisely in the Strait of Sicily (Geographical Sub-Area 16, GSA16 according to the FAO General Fisheries Commission for the Mediterranean), in which the most productive L. caudatus fishery of the region takes place (Supplementary Figure 1). Owing to the limited amount of data available, the stock status and exploitation rate of L. caudatus were evaluated using a data-poor approach by means of a suite of surplus production models (SPMs) based on commercial landing and abundance indices from trawl surveys. This stock assessment should be considered as baseline information for future sustainable fisheries management that could prevent a new collapse of L. caudatus fishery. Finally, on the basis of knowledge on biology and fishery L. caudatus and similar species, some management options for improving the sustainability of the species exploitation were discussed.
Materials and Methods
Data Source
Two different data sources were used for the stock assessment: (i) commercial landings data by gear from 2004 to 2018 collected within the EU data collection framework (DCF), and (ii) stock biomass index from 1994 to 2018 obtained by MEDITS survey (Mediterranean International Trawl Survey, Anonymous., 2017) carried out in GSA 16. MEDITS is carried out annually during late spring/summer in several areas of the Mediterranean Sea using a standardized sampling methodology (Spedicato et al., 2019). MEDITS surveys are conducted during daytime according to a stratified random sampling design with allocation of trawl stations proportional to strata extension (depth strata: 10–50 m, 51–100 m, 101–200 m, 201–500 m, 501–800 m). The same trawl stations were sampled each year in May–July using a GOC 73 trawl net characterized by a vertical opening ranging between 2.4 and 2.9 m and a 20-mm stretched mesh size at cod end (Fiorentini et al., 1999). Although L. caudatus was not a target species of the MEDITS surveys, its biomass indices were considered representative of the standing stock at sea due both to the high vertical opening of the GOC 73 trawl net and to the bento-pelagic behavior of the species (Figueiredo et al., 2015).
Stock-Assessment Models
SPMs were chosen for estimating the stock status and exploitation rate of L. caudatus as they need less input data compared to age-based models to estimate maximum sustainable yield (MSY) and related reference points for fishery management, i.e., biomass and fishing mortality at MSY (BMSY and FMSY) (Hilborn and Walters, 1992; Punt, 2003). Specifically, the stock status was evaluated by using (i) the Monte Carlo method Catch-Maximum Sustainable Yield (CMSY) based on catch data and (ii) the Bayesian State Space Schaefer model (BSM), using catch and biomass index (Froese et al., 2017, 2018). In addition, considering that the time series of MEDITS trawl survey started in 1994, just 1 year after the beginning of the spatolara fishery, stock status was also assessed by Abundance-Maximum Sustainable Yield (AMSY), based on biomass index from scientific surveys (Froese et al., 2020).
In comparison with other data-limited stock assessment methods, the requirements of the selected methods appear very parsimonious with our available information. For example, the COMSIR (Catch-Only-Model with Sampling-Importance-Resampling) method (Vasconcellos and Cochrane, 2005) requires catch, priors for r and k, relative bioeconomic equilibrium, and increase in harvest rate over time as inputs to assess the stock status. Then the DCAC (Depletion-Corrected Average Catch) method (MacCall, 2009) needs information on catch, relative depletion, natural mortality (M), and FMSY/M as inputs. On the other hand, the DB-SRA (Depletion-Based Stock Reduction Analysis) method (Dick and MacCall, 2011) wants catch, relative depletion, M, FMSY/M, BMSY/Bvirgin, and age at maturity as inputs. The SSCOM (State-Space Catch-Only Model) method (Thorson et al., 2013) requires catch, priors for unexploited biomass, initial effort, and parameters of an effort-dynamics model. Additionally, SS-DL (Stock Synthesis Data-Limited) method (Cope, 2013), in the catch data configuration, requires several additional basic biological and selectivity assumptions compared to CMSY.
CMSY and BSM Models
The CMSY model relies on catch time series, an assumed value of intrinsic population growth rate (r; “resilience”), how close the biomass is to carrying capacity (k), and qualitative information on stock status at the beginning and the end of the time series. The model allows the estimation of the biomass that can produce MSY (BMSY) and related fishery reference points such as relative stock size (B/BMSY), exploitation (F/FMSY), intrinsic growth rate of a population (r), and carrying capacity (k) (Froese et al., 2017, 2018).
The BSM, included in the CMSY R-code, needs further relative abundance data (e.g., biomass index) as input (Froese et al., 2017, 2018) to estimate the same parameters of CMSY.
Both models are based on the dynamic formula of the Schaefer SPMs, namely:
where, Bt+1 is the exploited biomass in year t + 1, Bt is the biomass in year t, r is the intrinsic rate of population increase, k is the carrying capacity (i.e., the mean unexploited stock size), and Ct is the catch in year t.
However, when the stock size is severely depleted (Bt/k < 0.25), Equation (1) is modified adding the term 4Bt/k to account for linear decline of recruitment below half of the biomass that is capable of producing MSY (Myers et al., 1995) as shown in Equation (2):
Given a time series of catches and qualitative stock status information, probable ranges of parameters r and k are filtered with a Monte Carlo algorithm on the basis of three hypotheses: (i) compatible with the catch time series, (ii) compatible with assumed priors on biomass reductions, and (iii) occur within prior ranges of r and k, corresponding to viable r–k pairs (Froese et al., 2017).
The biological plausible values of r were based on the classification of resilience reported by FishBase and ranging from 0.27 to 0.6 (Froese and Pauly, 2019). The prior ranges for k were derived by Equations (3 and 4) for stocks with low and high prior biomass at the end of the time series, respectively.
where klow and khigh are the lower and upper bounds of the prior range of k, max(C) is the maximum catch in the time series, and rlow and rhigh are the lower and upper bounds of r range to be explored by the Monte Carlo routine of the CMSY.
Both models can incorporate three uniform priors range for depletion in terms of B/k at the beginning and end of the time series, and optionally also in an intermediate year.
To detect the effect of the Bstart/k and Bend/k on B/BMSY estimations, a sensitivity analysis was performed. For this purpose, the deviations from the “original” value of B/BMSY estimated by reference model were expressed as percentage calculated as follows:
where B/BMSY s.a. is the value estimated by sensitive analysis.
CMSY was run considering the landing data from the European Data Collection Framework for time series 2004–2018, while BSM was run using the same landing data and the biomass index coming from MEDITS for time series 2004–2018. For both models, the prior for relative biomass B/k was set to 0.2–0.6 (medium) for the start year (Bstart/K) and to 0.15–0.4 (small) for the last year (Bend/K), while the middle prior was set as default according to the rules provided by Froese et al. (2017). The choice of these priors was supported by knowledge of fishers and by the survey biomass index trend for the times series 1994–2018.
AMSY Model
The AMSY is a new data-limited method that estimates fisheries reference points (F/FMSY, B/BMSY) when no catch data are available, using time series of catch rate from commercial fisheries or scientific surveys combined with prior estimates of resilience (Froese et al., 2020). In addition to these data, AMSY needs a prior for relative stock size (B/k, ranging between 0 and 1) for one of the years in the time series. AMSY uses this information and tests a high number of combinations of resilience (r) and carrying capacity (k) for their compatibility with these inputs. All r–k combinations that are compatible with time series of plausible (never negative, never much too high) predicted that catches are identified by a Monte Carlo approach. A detailed description of the theory and equations behind AMSY is provided by Froese et al. (2020). The AMSY model was performed by using biomass index from MEDITS for the time series 1994–2018. For resilience, the same prior used in CMSY and BSM was set.
Given that only one spatolara vessel targeting L. caudatus was active in 1994, the prior for relative biomass B/k in the initial year was set ranging between 0.7 and 1. As for CMSY and BSM, a sensitivity analysis was performed to investigate the effect of the prior (Bstart/k) on the B/BMSY estimation, and the deviation from the original value was calculated applying (Equation 5).
Forecast
The dynamics of the stock biomass and catch were predicted applying the dynamic Schaefer model in terms of B/BMSY and FMSY. Specifically, as reported by Froese et al. (2018), two different equations were implemented in the model, namely:
where Equation (6) was used to predict next year's status if current biomass was equal to or higher than half of BMSY, while Equation (7) was applied if biomass was lower than half of BMSY.
Stock trajectories from 2019 to 2030 were predicted considering the stock status estimated by BSM for 2018 and applying the following four scenarios based on Froese et al. (2018):
(i) 0.5 scenario: relative fishing impact of 0.5FMSY is considered if the stock size is equal to or larger than half of BMSY. On the other hand, no fishing is considered if the biomass is less than half of BMSY.
(ii) 0.6 scenario: relative fishing impact of 0.6FMSY is considered if the stock size was equal to or larger than half of BMSY. If the stock size was lower than half of BMSY, the relative fishing impact is linearly reduced to zero (Freduced) with decrease in biomass as shown in the following equation:
(iii) 0.8 scenario: as the ii scenario but it considered a relative fishing impact of 0.8FMSY.
(iv) Fcurrent scenario: as the ii scenario but it considered Fcurrent/FMSY estimation of the last year of the temporal series. This scenario is very close to the 0.95FMSY one proposed by Froese et al. (2018).
For the forecast scenarios, an ad hoc script based on the modified methodology proposed by Froese et al. (2018) was applied. Specifically, the script was modified to calculate the prediction of B/BMSY and catches for just a single stock. As in the methodology of Froese et al. (2018), the uncertainty was calculated by means Monte Carlo simulations based on 1,000 samples expressed as 90% of the confidence interval.
Results
Main Features of Fisheries
Figure 1 shows the landing trend by fishery for the time series from 2004 to 2018. In the investigated period, L. caudatus was exploited mainly by spatolara fishery accounting for about 68% of the total landing, followed by bottom trawler and other fisheries (longliners and purse seiners) with about 22 and 10%, respectively. Overall, the total landings increased from 2004 to 2011 with a maximum of 1,150 tons, followed by a progressive reduction reaching 168 tons in 2018. The fishing effort of spatolara, expressed as the number of days at the sea, highlighted a similar dome-shaped pattern with the highest value in 2007. In addition, some information on the spatolara fishery and gear features are shown in Supplementary Table 1.
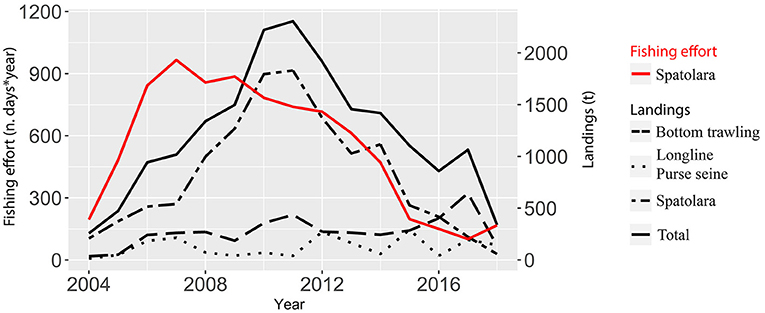
Figure 1. The left y-axis indicates the value of fishing effort expressed as the number of days at sea per year whereas the right y-axis indicates the landings by fishery typologies expressed in tons. Specifically, fishery typologies are graphically indicated as follows: bottom trawling (long dash black line), longline and purse seine (dotted black line), and spatolara (two dashed black line). The solid black line and solid red line represent the total landing and spatolara fishing effort, respectively.
CMSY and BSM Results
The outputs of CMSY and BSM were very similar (Table 1) in terms of r and k estimations, stock size trend, and exploitation rate (Figure 2). Both models estimated an overexploited level for stock size (B/BMSY < 1) since 2011 and an overfishing condition (F/FMSY > 1) since 2009, although in the last year, the F/FMSY value dropped below 1 (Table 1 and Figure 2). The estimated stock size (0.54 and 0.63 for BMS and CMSY, respectively, Table 1) indicated an overfished condition of the stock according to Palomares et al. (2018) (Supplementary Table 2). Moreover, the Kobe plot based on BSM estimations showed a probability of 44.8 and 55.1% that the status stock fell in the overfished (red part) or recovering status (yellow part) of the graph, respectively (Figure 2).
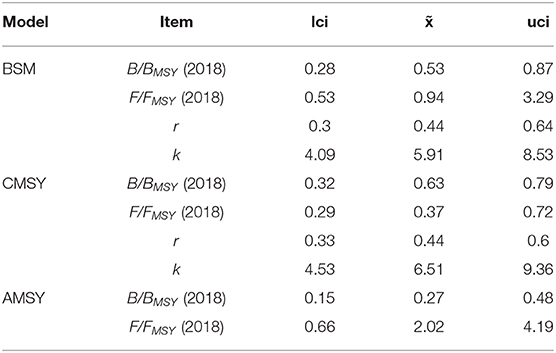
Table 1. Main output of three models in terms of stock size (B/BMSY), exploitation rate (F/FMSY), and r-k prior. Median value (x~), lower (lci), and upper (uci) confidential interval are shown.
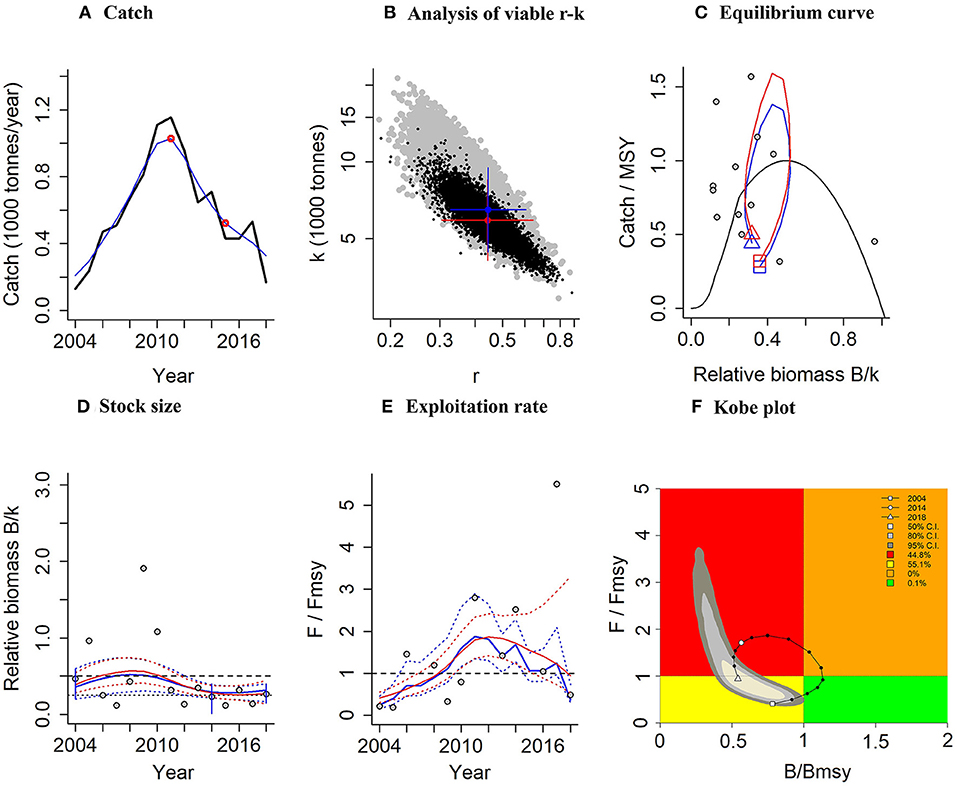
Figure 2. Graphical output of the CMSY (blue lines) and BSM (red lines): (A) catch; (B) Monte Carlo simulations of the best combination of r and k; (C) Equilibrium curve estimated through Schaefer model, where square and triangle symbols represent the estimates of initial and final years, respectively; (D) stock size (dashed lines indicate confidence interval); (E) exploitation rate (dashed lines indicate confidence interval); (F) Kobe plot showing B/BMSY against F/FMSY ratios estimated by BSM. In the Kobe plot, shaded areas indicate the confidence interval at 50% (light gray), 80% (gray), and 95% (dark gray) and quadrants are color-coded, i.e., green (not overfished, no overfishing), red quadrant (overfished and overfishing), or yellow (recovering status).
AMSY Results
Outputs of the AMSY model are shown in Supplementary Figure 2 and Table 1. The biomass index from 1994 to 2018 showed a decreasing trend (Supplementary Figure 2) even if in 2009 a peak of biomass, due likely to a good recruitment, was recorded, as confirmed by the highest density index and lower average weight in the time series (Supplementary Figure 3). The model outputs (Supplementary Figure 2 and Table 1) underlined that the stock is both overfished (F/FMSY > 1) and, according to Palomares et al. (2018), “grossly overexploited” (B/BMSY < 0.5) from 2012 to 2018, with the stock productivity being severely impaired (0.5 ≤ C/CMSY < 1). The reference point of the last year of the time series was 0.27 for B/BMSY (95% CI 0.15–0.49) and 2.02 (95% CI 0.66–4.18) for F/FMSY.
The overall dynamics of the stock, showed by the Kobe plot (Supplementary Figure 2), outlined a progressive worsening of the stock status from 1994 to 1998, followed by a high exploitation level associated to a low standing stock biomass for most of the examined period, with the exception of 2008, 2009, and 2010, during which a recovery of the stock occurred.
Sensitivity Analysis
The sensitivity analysis showed that the B/BMSY estimations were more affected by Bend/k prior variation for both CMSY and BSM. Conversely, Bstart/k influenced mostly the B/BMSY estimation of the AMSY model (Supplementary Table 2). In light of the above, to perform trusted estimations of stock size by CMSY and BSM, a reliable prior of biomass range at end of time series is crucial. On the other side, for AMSY, the choice of biomass range relative to unexploited biomass at the start of the time series is of paramount importance.
Forecast Results
B/BMSY and the predicted cumulative catches of L. caudatus under the different exploitation scenarios of F are shown in Figure 3. By reducing the relative fishing impact to 0.5, 0.6, and 0.8 of FMSY, L. caudatus stock could reach the BMSY level over a period between 5 and 8 years. While maintaining the F current, which is very close to the FMSY estimated by BSM, the stocks need 12 years to reach a value of 0.94 B/BMSY (Figure 3).
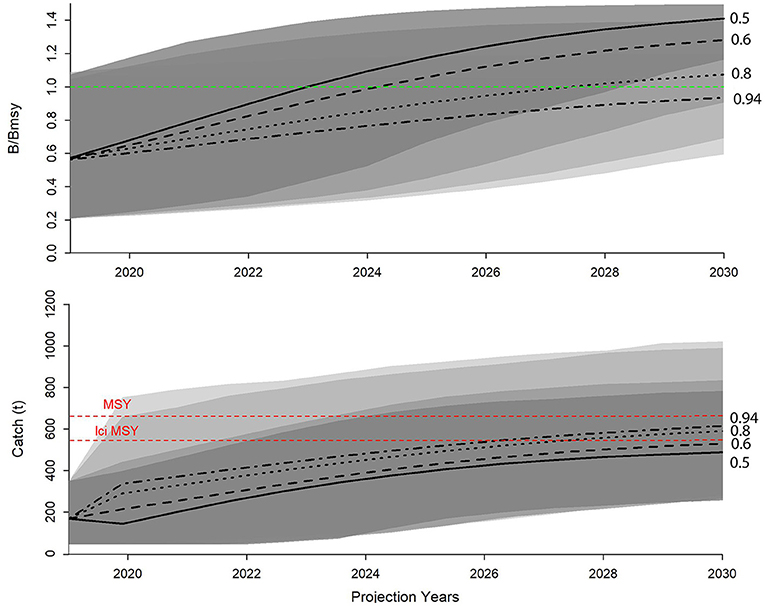
Figure 3. In the upper panel, B/BMSY trends, while in the lower panel, the predictive catch trends (expressed in tons) both under four different exploitation F scenarios: 0.5 (solid line), 0.6 (long dash line), 0.8 (dotted line), and 0.94 (two dashed black line). The shaded areas indicate the range of uncertainty. The dashed green line represents B/BMSY equal to 1 and the dashed red lines represent the value of MSY and its lower confidence interval (lci MSY).
An increasing trend of catches throughout the years for all considered scenarios was predicted, with only the scenario 0.5 showing a catch decrease in the first year (Figure 3). Overall, an average increase of catches of about three times more than those of 2018 was expected according to all scenarios. The highest values of catches were predicted for the scenarios 0.8 and Fcurrent with about 555 and 617 tons, respectively. However, both predicted B/BMSY and catches showed a high uncertainty.
Discussion
Unlike other Mediterranean areas, in the Strait of Sicily, the spatolara fishery, a specific midwater trawl fishery targeted to L. caudatus, has been developed from the early 90s. This fishery started in Sciacca harbor and proved a sudden increase in yield and fishing effort followed by a progressive decline through time. The trend in yield and fishing effort was followed, with a shift of about 4 years, by the reaction of stock in terms of biomass, which declined considerably after 2011.
According to Palomares et al. (2018), who classified the fish stock status basing on B/BMSY in the final year of a time series, results of BSM and CMSY suggested an overfished status of L. caudatus stock of the Strait of Sicily, while AMSY indicated a condition of “grossly overfished” (0.2–0.5), being close to “collapsed” (<0.20). The stock size estimations by the three models highlighted a very similar trend, even if the AMSY depicts a more severe overfished condition (Supplementary Figure 4). The differences between AMSY and the other two models might be due to the different periods analyzed. Indeed, the decrease of biomass index from trawl surveys that have occurred from 1994 to 2004 further stresses the importance of having an independent estimate of stock abundance since the beginning of fisheries exploitation. The estimated stock size was below BMSY since the end of the 1990s, with the exception of the years 2009 and 2010, during which signals of strong recruitment events were recorded (Supplementary Figure 3). Likewise, the BSM and CMSY estimated a similar trend of B/BMSY for the same period of AMSY, 2004–2018 (Supplementary Figure 4).
The results of the sensitivity analysis showed that Bstart/k prior setting for BSM and CMSY affected poorly the B/BMSY estimation, ranging from 0.50 to 0.63. Conversely, Bend/k prior setting showed the biggest effect on the outcome of B/BMSY, ranging from 0.21 to 0.79.
The only configuration tested for AMSY (Bstart/k ranging for 0.4–0.8) indicated a collapsed condition of the stock according to Palomares et al. (2018). However, this last assessment could be neglected because that high initial biomass (0.7–1 nearly unexploited) was deemed highly reliable on the basis that in the first year of the biomass index, only one spatolara vessel was active and the fishery was not yet fully developed.
Regarding the exploitation rates, high differences among the models were recognized. Specifically, although at different level, CMSY and BSM depicted a no overfishing condition (F/FMSY < 1) in the last year, with the fishing pressure lower than that giving the maximum sustainable yield. Conversely, AMSY estimated a condition of high overfishing even in the last year, with the F/FMSY being equal to 2.02. In this regard, it should be recalled that estimation of exploitation by AMSY should be used with caution since this method does not use the information on catch or fishing effort. Conversely, relative stock size could be considered suitable for management advice (Froese et al., 2020).
According to the forecast model, the stock depletion is so heavy that the recovery of stock biomass to level compatible with MSY is expected in 2030 if the fishing effort is maintained at the 2018 level, which is very close to FMSY. The scenarios 0.5 and 0.6 provide fast rebuilding of the stock reaching a value of biomass higher to that maximum sustainable yield but providing the lowest levels of catches. Although with high uncertainty in model estimation, a good compromise between production and conservation objectives is provided by the scenario reducing fishing mortality at 80% of FMSY. This scenario produces the fastest rebuilding of the stock and a minimal loss in catch in a period of 5–8 years.
Although the data input used to run the models are from official statistics, the estimation provided in this study may have some uncertainty due to the lack of discard data. Indeed, no studies on discard for this species are available in the investigated area.
Across the Mediterranean Sea, the knowledge on discarding of L. caudatus is scattered and scarce (e.g., Sánchez et al., 2004; Tzanatos et al., 2007; Soykan et al., 2016; Carbonnel and Mallol 2012). The discard rates are affected by gears, target species, fishing ground depth, as well as the request of the local market. Tzanatos et al. (2007) in the Aegean Sea and Sánchez et al. (2004) in the Catalan Sea reported that the whole catch of L. caudatus was discarded by gillnet and by trawlers, respectively. Conversely, Carbonell and Mallol (2012) provided discard rate estimation by trawlers of 7% in Catalonia waters and 100% in Balearic island, while Soykan et al. (2016) estimated a discard rate of about 30% in Turkish waters.
Considering the lack of discard data in the investigated area, the CMSY and BSM assessments were performed using only official landing data. This might affect the stock status estimation, giving a more optimistic state of the exploited stock. However, the absence of discard does not affect the stock perception by the AMSY, which used only fishery independent data and showed a clear overfished and overfishing condition of the L. caudatus stock.
The described pattern of the spatolara fishery, together with the modeled trajectories of the biomass and the exploitation rate, reflect the typical phases of development of an uncontrolled fishery (Hilborn and Walters, 1992). The fast decline of the stock has been due to the development of specific gear, the spatolara net, which likely increased the fishery catchability together with a rapid increase of the fishing effort. These features ensured high catches and revenues in the short term but, on the other side, resulted in a progressive decrease in fish abundance and, finally, fishery collapse. All this happened within a context of lack of specific management measures for L. caudatus fishery in terms of catch or fishing effort quota and technical measures such as the establishment of a minimum conservation reference size. In the near future, due to its monospecific nature, it would be advisable to implement the spatolara fishery management measures based on the Total Allowable Catches (TAC). A management based on TAC was quite successful in the recovery and maintenance of the North-East Atlantic stocks (Cardinale et al., 2017) such as the similar species Aphanopus carbo (ICES., 2020). The effectiveness of management measure based on TAC for L. caudatus has also been demonstrated in New Zealand as described by (Bentley et al., 2014).
Considering that the juveniles of silver scabbardfish represent an abundant fraction caught by trawling (D'Onghia et al., 2000), a further management measure to ensure the recovery of silver scabbardfish could concern the development and adoption of more selective trawling net, including the use of devices able to improve the size at first capture of this species.
Eventually, the present study provides a further example on how the absence of adequate management measures can lead to a rapid depletion of the resource and, consequently, unprofitable fishery. Learning from the history of L. caudatus fishery in the Strait of Sicily, it would be important to monitor both stock size and fishery pressure and to adopt a multiannual species-specific management plan to guarantee the fishery sustainability according to the United Nations sustainable development goals (United Nations., 2015).
Data Availability Statement
The raw data supporting the conclusions of this article will be made available by the authors, without undue reservation.
Ethics Statement
Ethical review and approval was not required for the animal study because no tests or experiments were performed on vertebrate animals.
Author Contributions
FFi and SV: conceptualization and validation. FFa and VG: formal analysis. FFa, DS, MG, and VG: data curation and data collection and figures. FFi and FFa: writing—original draft. FFi, FFa, DS, MG, SV, and VG: writing—review and editing. All authors contributed to the article and approved the submitted version.
Funding
This work was supported by European Data Collection Framework (DCF)–Transversal Variables and MEDITS survey modules funded by the European Union and the Italian Ministry for Agricultural, Food and Forestry Policies.
Conflict of Interest
The authors declare that the research was conducted in the absence of any commercial or financial relationships that could be construed as a potential conflict of interest.
Acknowledgments
This study was carried out within the framework of Italian National Programs developed according to the European Data Collection Framework. The authors warmly thank all the technical staff of the CNR of Mazara del Vallo who collected data during the MEDITS trawl surveys. A special thank you to Henning Winker (Department of Statistical Sciences, University of Cape Town) for his help in developing the modified script and also for his useful advice.
Supplementary Material
The Supplementary Material for this article can be found online at: https://www.frontiersin.org/articles/10.3389/fmars.2020.584601/full#supplementary-material
Supplementary Figure 1. Map showing the study area.
Supplementary Figure 2. Graphical output of the AMSY model: (A) Biomass index; (B) Monte-Carlo simulations of the best combination of r and k, (C) Catch/MSY (dashed lines indicate confidence interval); (D) F/FMSY trend (dashed lines indicate confidence interval); (E) B/BMSY trend (dashed lines indicate confidence interval), (F) Kobe plot showing B/BMSY against F/FMSY ratios. In the Kobe plot shaded areas indicate the confidence interval at 50% (light grey), 80% (grey) and 95% (dark grey) and quadrants are color-coded i.e. green (not overfished, no overfishing), red quadrant (overfished and overfishing) or yellow (recovering status).
Supplementary Figure 3. The left y-axis indicates density index expressed as number of fish caught on square kilometres (grey line) whereas the right y-axis indicates the average weight of fish caught per year expressed in grams (black line).
Supplementary Figure 4. Stock size (B/BMSY) trends estimated applying AMSY (blue), BSM (red) and CMSY (green). The coloured areas represent the confidence interval for each model.
References
Anonymous. (2017). MEDITS Handbook, Version n. 9. MEDITS Working Group, 106. Available online at: http://www.sibm.it/MEDITS%202011/principaledownload.htm (accessed July 30, 2020).
Bentley, N., Kendrick, T. H., and MacGibbon, D. J. (2014). Fishery Characterisation and Catch-per-unit-effort Analyses for Sea Perch (Helicolenus Spp.) in New Zealand, 1989–90 to 2009–10. Wellington: Ministry for Primary Industries.
Carbonell, A., and Mallol, S. (2012). Differences between demersal fisheries discards: high and low productivity zones of the Northwestern Mediterranean Sea. Boll. Soc. Hist. Nat. Balears, 55, 25–45.
Cardinale, M., Osio, G. C., and Scarcella, G. (2017). Mediterranean Sea: a failure of the European fisheries management system. Front. Mar. Sci. 4, 72. doi: 10.3389/fmars.2017.00072
Cingolani, N., Coppola, S. R., and Mortera, J. (1986) Studio di fattibilitr un sistema di rilevazione campionaria delle statistiche della pesca (PESTAT). Parte II – Statistiche di cattura e sforzo di pesca. Quad. Ist. Ric. Pesca Marittima. Ancona
Cope, J. M. (2013). Implementing a statistical catch-at-age model (Stock Synthesis) as a tool for deriving overfishing limits in data-limited situations. Fish. Res. 142, 3–14. doi: 10.1016/j.fishres.2012.03.006
Demestre, M, Moli, B, Recasens, L, and Sánchez, P. (1993). Life history and fishery of Lepidopus caudatus (Pisces: Trichiuridae) in the Catalan Sea (Northwestern Mediterranean). Mar. Biol. 115, 23–32. doi: 10.1007/BF00349382
Dick, E. J., and MacCall, A. D. (2011). Depletion-based stock reduction analysis: a catch-based method for determining sustainable yields for data-poor fish stocks. Fish. Res. 110, 331–341. doi: 10.1016/j.fishres.2011.05.007
D'Onghia, G., Mastrototaro, F., and Maiorano, P. (2000). Biology of silver scabbard fish, Lepidopus caudatus (Trichiuridae), from the Ionian Sea (Eastern-central Mediterranean). Cybium 24,249–262.
FAO Fisheries and aquaculture software. (2016). “FishStatJ - Software for Fishery and Aquaculture Statistical Time Series,” in FAO Fisheries and Aquaculture Department. Rome. Avaiolable onlibe at: http://www.fao.org/fishery/ (accessed April 12, 2020)
FAO. (2018). The State of Mediterranean and Black Sea Fisheries. General Fisheries Commission for the Mediterranean. Rome: FAO, 172.
Figueiredo, C., Diogo, H., Pereira, J. G., and Higgins, R. M. (2015). Using information-based methods to model age and growth of the silver scabbardfish, Lepidopus caudatus, from the mid-Atlantic Ocean. Mar. Biol. Res. 11, 86–96. doi: 10.1080/17451000.2014.889307
Fiorentini, L., Cosimi, G., Sala, A., Leonori, I., and Palombo, V. (1999). Efficiency of the bottom trawl used for Mediterranean international trawl survey (MEDITS). Aquat. Living Resour. 12, 187–205. doi: 10.1016/S0990-7440(00)88470-3
Froese, R., Demirel, N., Coro, G., Kleisner, K. M., and Winker, H. (2017). Estimating fisheries reference points from catch and resilience. Fish Fish. 18, 506–526. doi: 10.1111/faf.12190
Froese, R., and Pauly, D. (2019). FishBase. World Wide Web electronic publication. www.fishbase.org.
Froese, R., Winker, H., Coro, G., Demirel, N., Tsikliras, A. C., Dimarchopoulou, D., et al. (2018). Status and rebuilding of European fisheries. Mar. Policy 93, 159–170. doi: 10.1016/j.marpol.2018.04.018
Froese, R., Winker, H., Coro, G., Demirel, N., Tsikliras, A. C., Dimarchopoulou, D., et al. (2020). Estimating stock status from relative abundance and resilience. ICES J. Mar. Sci. 77, 527–538. doi: 10.1093/icesjms/fsz230
Hilborn, R., and Walters, C. J. (1992). Quantitative Fisheries Stock Assessment. Choice, Dynamics and Uncertainty. New York, NY: Springer Science & Business Media. doi: 10.1007/978-1-4615-3598-0
ICES. (2020). “Black scabbardfish (Aphanopus carbo) in subareas 1, 2, 4–8, 10, and 14, and divisions 3.a, 9.a, and 12.b (Northeast Atlantic and Arctic Ocean),” in Report of the ICES Advisory Committee, 2020 (ICES Advice 2020, bsf.27.nea).
Karlovac, J., and Karlovac, O. (1976). Apparition de Lepidopus caudatus (Euphr.) dans totutes les phases de sa vie en Adriatique. Rapp. P. V. Comm. Int. Explor. Scient. Mer Médit. 23, 67–68.
MacCall, A. D. (2009). Depletion-corrected average catch: a simple formula for estimating sustainable yields in data-poor situations. ICES J. Mar. Sci. 66, 2267–2271. doi: 10.1093/icesjms/fsp209
Molí, R., Lombarte, A., and Morales-Nin, B. (1990). Age and growth of Lepidopus caudatus on the Northwestern Mediterranean Sea. Rapp. Comm. int. Mer Médit. 32:269.
Myers, R. A., Barrowman, N. J., Hutchings, J. A., and Rosenberg, A. A. (1995). Population dynamics of exploited fish stocks at low population levels. Science 269, 1106–1108. doi: 10.1126/science.269.5227.1106
Nakamura, I., and Parin, N. V. (1993). FAO Species Catalogue. Snake Mackerels and Cutlassfishes of the World (Families Gempylidae and Trichiuridae). Kyoto: FAO Fish. Synop.
Orsi Relini, L., Fida, B., and Palandri, G. (1989). Osservazioni sulla riproduzione di Lepidopus caudatus (Euphrasen, 1788), Osteichthyes, Trichiuridae, del mar Ligure. Oebalia 15, 715–723.
Palomares, M. L. D., Froese, R., Derrick, B., Nöel, S.-L., Tsui, G., Woroniak, J., et al. (2018). A Preliminary Global Assessment of the Status of Exploited Marine Fish and Invertebrate Populations. A Report Prepared by the Sea Around Us for OCEANA. Vancouver, BC: The University of British Columbia.
Punt, A. E. (2003). Extending production models to include process error in the population dynamics. Can. J. Fish. Aquat. Sci. 60, 1217–1228. doi: 10.1139/f03-105
Robertson, D. A. (1980). Spawning of the frostfish, Lepidopus caudatus (Pisces: Trichuridae), in New Zealand waters. New Zealand J. Mar. Freshwater Res. 14, 129–136. doi: 10.1080/00288330.1980.9515853
Sánchez, P., Demestre, M., and Martin, P. (2004). Characterisation of the discards generated by bottom trawling in the northwestern Mediterranean. Fish. Res., 67, 71–80. doi: 10.1016/j.fishres.2003.08.004
Soykan, O. Z. A. N., Akgül, S. A., and Kinacigil, H. T. (2016). Catch composition and some other aspects of bottom trawl fishery in Sigacik Bay, central Aegean Sea, eastern Mediterranean. J. Appl. Ichthyol, 32, 542–547. doi: 10.1111/jai.13042
Spedicato, M. T., Massut,í, E., Mérigot, B., Tserpes, G., Jadaud, A., and Relini, G. (2019). The MEDITS trawl survey specifications in an ecosystem approach to fishery management. Sci. Mar. 83, 9–20. doi: 10.3989/scimar.04915.11X
Thorson, J. T., Minto, C., Minte-Vera, C. V., Kleisner, K. M., and Longo, C. (2013). A new role for effort dynamics in the theory of harvested populations and data-poor stock assessment. Can. J. Fish. Aquat. Sci. 70, 1829–1844. doi: 10.1139/cjfas-2013-0280
Torre, M., Kallianiotis, A., Sicuro, B., and Tsavalou, V. (2011). Geographical and bathymetric distribution of silver scabbardfish Lepidopus caudatus in North Aegean Sea. Int. Aquat. Res. 3, 217–226.
Torre, M., Sicuro, B., and Kallianiotis, A. (2019). Diet of Silver scabbardfish Lepidopus caudatus (Euphrasen, 1788) in the Northern Aegean Sea. Cah. Biol. Mar. 60, 31–40. doi: 10.21411/CBM.A.4C45C5BD
Tuset, V., González, J. A., Santana, J. I., Lopez, A. M., and Diaz, M. G. (2006). Reproductive pattern and growth in Lepidopus caudatus (Osteichthyes, Trichiuridae) from the Canary islands (Eastern-Central Atlantic). Electron. J. Ichthyol. 1, 26–37.
Tzanatos, E., Somarakis, S., Tserpes, G., and Koutsikopoulos, C. (2007). Discarding practices in a Mediterranean small-scale fishing fleet (Patraikos Gulf, Greece). Fish. Manag. Ecol. 14, 277–285. doi: 10.1111/j.1365-2400.2007.00556.x
United Nations. (2015). Historic New Sustainable Development Agenda Unanimously Adopted by 193 UN Members.
Vasconcellos, M., and Cochrane, K. (2005). “Overview of world status of data-limited fisheries: inferences from landing statistics,” in Fisheries Assessment and Management in Data-limited Situations. eds G. H. Kruse, V. F. Gallucci, D. E. Hay, R. I. Perry, R. M. Peterman, T. C. Shirley, P. D. Spencer, B. Wilson, and D. Woodby (Alaska Sea Grant Programme; University of Alaska Fairbanks), 1–20. doi: 10.4027/famdls.2005.01
Keywords: stock assessment, surplus production models, data poor approach, CMSY, BSM, AMSY
Citation: Falsone F, Scannella D, Geraci ML, Gancitano V, Vitale S and Fiorentino F (2021) How Fishery Collapses: The Case of Lepidopus caudatus (Pisces: Trichiuridae) in the Strait of Sicily (Central Mediterranean). Front. Mar. Sci. 7:584601. doi: 10.3389/fmars.2020.584601
Received: 17 July 2020; Accepted: 11 December 2020;
Published: 20 January 2021.
Edited by:
Natalie Anne Dowling, Oceans and Atmosphere (CSIRO), AustraliaReviewed by:
Claudio Vasapollo, Italian National Research Council (CNR), ItalyDimitrios K. Moutopoulos, University of Patras, Greece
Copyright © 2021 Falsone, Scannella, Geraci, Gancitano, Vitale and Fiorentino. This is an open-access article distributed under the terms of the Creative Commons Attribution License (CC BY). The use, distribution or reproduction in other forums is permitted, provided the original author(s) and the copyright owner(s) are credited and that the original publication in this journal is cited, in accordance with accepted academic practice. No use, distribution or reproduction is permitted which does not comply with these terms.
*Correspondence: Danilo Scannella, ZGFuaWxvLnNjYW5uZWxsYUBpcmJpbS5jbnIuaXQ=