 Tyler A. Helble1*†
 Regina A. Guazzo1†
 Gabriela C. Alongi2
 Cameron R. Martin1
 Stephen W. Martin2
 E. Elizabeth Henderson1
- 1Naval Information Warfare Center Pacific, San Diego, CA, United States
- 2National Marine Mammal Foundation, San Diego, CA, United States
Male fin whales sing by producing 20 Hz pulses in regular patterns of inter-note intervals. While singing, fin whales may also alternate the frequency ranges of their notes. Different song patterns have been observed in different regions of the world's oceans. New song patterns suddenly emerging in an area have been hypothesized to either be indicators of new groups of whales in the area or signs of cultural transmission between groups. Since the status of fin whales around Hawaii is unknown and visual surveys are expensive and difficult to conduct in offshore areas, passive acoustic monitoring has been proposed as a way to monitor these whales. We used passive acoustic recordings from an array of 14 hydrophones to analyze the song patterns of 115 fin whale encounters made up of 50,034 unique notes off Kauai, Hawaii from 2011 to 2017. Fin whale singing patterns were more complicated than previously described. Fin whales off Hawaii sang in five different patterns made of two 20 Hz note types and both singlet and doublet inter-note interval patterns. The inter-note intervals present in their songs were 28/33 s for the lower frequency doublet, 30 s for the lower frequency singlet, 17/24 s for the higher frequency doublet, 17 s for the higher frequency singlet, and 12/20 s for the doublet that alternated between both note types. Some of these song patterns were unique to these fin whales in Hawaiian waters, while others were similar to song patterns recorded from fin whales off the U.S. west coast. Individual fin whales often utilized several different song patterns which suggests that multiple song patterns are not necessarily indicators of different individuals or groups. The dominant song pattern also changed over these years. Cultural transmission may have occurred between fin whales in Hawaiian waters and off the U.S. west coast, which has resulted in similar songs being present at both locations but on lagged timescales. Alternatively, groups occupying the Hawaiian waters could shift over time resulting in different song patterns becoming dominant. This work has implications for the population structure and behavior of Hawaii fin whales.
1. Introduction
Fin whales (Balaenoptera physalus) produce a low-frequency call sequence that is thought to be a male song and has been recorded in every ocean basin (e.g., Watkins, 1981; Watkins et al., 1987; Croll et al., 2002). The notes, sometimes called 20 Hz notes, are categorized as two different types. The B or classic notes are approximately 1 s long and are downswept in frequency ranging from 42 to 15 Hz (Watkins et al., 1987; Thompson et al., 1992; Nieukirk et al., 2004). The A or backbeat notes are slightly shorter and lower in frequency (Clark et al., 2002). Previous research has not established a clear cutoff between the two note types, but when both note types are present, the B note is defined as the note with a higher frequency than the A note. The measured source levels (SLs) of these note types are 160–190 dB re 1 μPa at 1 m (Watkins et al., 1987; Charif et al., 2002; Širović et al., 2007; Weirathmueller et al., 2013) with the A note being 3–7 dB lower in amplitude (Clark et al., 2002; Weirathmueller et al., 2013). These notes are very intense and have the potential to be detected at great distances, but Watkins (1981) observed that most fin whales only vocalized when they were within approximately 15–20 km of another whale, so the intended communication range for these notes is still unknown. Since they are so short, these notes are often referred to as pulses.
The individual pulses that make up fin whale song occur at regular inter-note intervals (INIs). These INIs have been observed in singlet patterns (constant INI), doublet patterns (alternating long and short INIs), and triplet patterns (a repeated series of three INIs, at least two of which are unique) (Watkins, 1981; Watkins et al., 1987; Thompson et al., 1992; Delarue et al., 2013; Širović et al., 2017). These song patterns can occur between the same note type or can have a pattern of note types that coincides with the INI pattern. Singlet songs have only been observed with single note types.
Longer gaps between notes also occur in a fin whale's song. The songs have regular breaks that average 120–150 s in duration every 10–15 min (Watkins et al., 1987; McDonald et al., 1995; Nieukirk et al., 2004). These pauses have been observed to coincide with the whale surfacing (Watkins et al., 1987). Other longer gaps sometimes occur and last between 20 and 120 min and may be related to joining with another fin whale or disturbance from a nearby source (Watkins et al., 1987). The notes immediately before and after these gaps seem to be lower in SL (Watkins et al., 1987).
In the North Pacific, several different fin whale song INI patterns have been recorded within the past 20 years. Oleson et al. (2014) and Širović et al. (2017) reported similar doublet song patterns in the Bering Sea, in the Southern California Bight, and off Hawaii from 2000 to 2006. This song pattern seemed to follow a seasonal pattern with approximate INIs of 20/26 s in October, 24/30 s in December, and 28/33 s in February (Oleson et al., 2014; Širović et al., 2017). Singlet patterns were occasionally intermingled in these doublet patterns with one of the INIs being repeated multiple times (Oleson et al., 2014; Širović et al., 2017). Similar INIs were observed off the coast of Oregon and Washington from fall 2003 to spring 2004, with INIs of 25/30 s for the doublet song (Soule and Wilcock, 2013; Weirathmueller et al., 2013) and 25–30 s for the singlet song, which was observed until 2012 (Soule and Wilcock, 2013; Weirathmueller et al., 2013, 2017). Archer et al. (2019) also reported similar doublet and singlet patterns in Hawaiian waters. In the spring of 2007 and 2008 they recorded a doublet pattern with INIs of approximately 25/35 s and in the fall of 2007 they recorded a singlet pattern with INIs of just over 20 s (Archer et al., 2019). In the Southern California Bight from 2006 to 2012, a different doublet pattern was dominant with INIs that increased gradually over the years from 10/17 to 17/22 s (Širović et al., 2017). In the Gulf of California, triplet song patterns were primary with INIs of 6/6/20 and 5/10/10 s from 2004 to 2009 (Širović et al., 2017). In the Bering and Chuckchi Seas, different triplet song patterns were observed in 2007 and 2010 with INIs of approximately 8/15/19 s (Delarue et al., 2013). From 2009 to 2013, a doublet song similar to that observed in the Southern California Bight was prominent off Oregon, Washington, and Northern California with INIs of 10/15 s (Weirathmueller et al., 2017). Song patterns from fin whales in the Northwest Pacific were analyzed from the fall and spring of 2011 and 2012 and appeared to share some song patterns that were similar to song patterns from the Northeast Pacific (Archer et al., 2019).
These inter-note intervals have been observed to change over years both suddenly and gradually. From 2003 to 2013 off Oregon and Washington, the INIs increased gradually over time with the singlet INI increasing at 0.5 s/year, the doublet longer INI increasing by 0.7 s/year, and the doublet shorter INI increasing by 0.9 s/year (Weirathmueller et al., 2017). The doublet song INI observed in the Southern California Bight from 2006 to 2012 also gradually increased over time (Širović et al., 2017). Besides these gradual changes, new songs suddenly emerged and previous songs became rare in areas where long-term monitoring occurred. For example, in the Southern California Bight, the primary song pattern switched from the longer INI pattern which was dominant until 2003 to the shorter INI pattern which became dominant in 2006, and in the Gulf of California, the primary song pattern switched from one triplet song pattern to another from winter to summer 2005 (Širović et al., 2017). Cultural transmission has been suggested as a possible explanation, with song patterns being exchanged between different groups of fin whales in shared feeding areas (Weirathmueller et al., 2017). Another possibility is that the different song patterns are produced by different stocks or populations and different song patterns are signs of different groups in the area at different times (Thompson et al., 1992; Hatch and Clark, 2004; Delarue et al., 2009; Castellote et al., 2012; Širović et al., 2017; Pereira et al., 2020). The cultural transmission hypothesis suggests that fin whales can learn new song patterns throughout their lives, while the hypothesis that songs are unique to groups suggests that fin whales learn the local song and do not change their song substantially over their lifetimes. Very little is known about the fin whale population structure or migration patterns, however, and these hypotheses have been hard to test without additional information from other techniques such as genetic sampling or photo identification (Širović et al., 2017).
The Pacific Missile Range Facility (PMRF) is a U.S. Navy training and testing area off Kauai, Hawaii that is also part of the habitat of many marine mammals including fin whales. Fin whale vocalizations have been recorded in Hawaiian waters year-round with seasonal pulses and the greatest numbers of vocalizations in the winter (Thompson and Friedl, 1982; McDonald and Fox, 1999). The fin whales around the Hawaiian Islands are managed as their own stock under the Marine Mammal Protection Act (Carretta et al., 2018). The total number of fin whales in Hawaiian waters is unknown as surveys have not been conducted during the time of the peak acoustic presence in the winter, but 154 fin whales were estimated to be present from 13 August to 1 December 2010 (Bradford et al., 2017).
In contrast to visual surveys which are more limited by time, expense, and coverage area, passive acoustic monitoring is a way to continuously determine the presence of marine mammal species in a region and potentially calculate abundance. Since visual surveys are expensive and oftentimes difficult to conduct in offshore areas, there is a vested interest to monitor fin whales acoustically. Harris et al. (2018) demonstrated that the density or abundance of fin whales can be calculated if a cue rate (animal vocalization rate) is known. Stimpert et al. (2015) tagged fin whales in August–October in the Southern California Bight and reported calling rates of 24 calls/hour/whale for four actively calling whales and 4.8 calls/hour/whale for all 10 tagged whales (including those that were silent) and all call types (using only DTAG3 data). Varga et al. (2018) tracked singing fin whales in the Southern California Bight and reported vocalization rates of 114 notes/hour/whale for four whale tracks. We recorded fin whale song and tracked singing individuals over 6.5 years on PMRF, allowing us to quantify fin whale cue rates over time and for a larger sample of whales in an area important to the Navy. The ability to track whales using multiple recorders allows for the along-track cue rate to be calculated, which is an important first step in determining cue rate variability. We also compared fin whale singing behavior off Hawaii with patterns observed in the past and in other parts of the North Pacific. This paper summarizes the song patterns and vocalization rates from 115 individual fin whale tracks, reports the measured changes over time, and compares these observations to other song patterns recorded in the North Pacific.
2. Methods
2.1. Study Area and Data Description
The PMRF hydrophones are to the northwest of the island of Kauai in the Hawaiian Islands. Acoustic recordings at 96 kHz sampling rate were made for approximately four days a month from January 2011 to July 2017. Additional recordings at 6 kHz sampling rate and approximately 10 days in duration were added intermittently on the same hydrophones starting in 2014. For this analysis, the data sampled at 96 kHz were down-sampled to 6 kHz so that all data had a 6 kHz sampling rate. No U.S. Navy training exercises were conducted during the time periods of these recordings, and little to no other local anthropogenic sources of noise were present in the recordings. The number of hydrophones in the array has changed over the years, but from January 2011 to July 2017, the 14 broadband hydrophones used for this analysis remained the same. These hydrophones were at depths of 3,150–4,700 m and formed a rectangular grid approximately 20 km to the east/west and 60 km to the north/south (Figure 1). The hydrophones were divided into four subarrays of a center hydrophone and four corner hydrophones. We used an automated detector and localizer to identify fin whale notes in the recordings and then grouped those notes into tracks using a semi-automated tracker. Fin whale tracks were observed in fall, winter, and spring of every recording year, and no tracks were observed in the summer months of any year. The monthly recording effort (in hours) and the number of acoustic localizations that made up validated fin whale tracks are plotted in Figure 2.
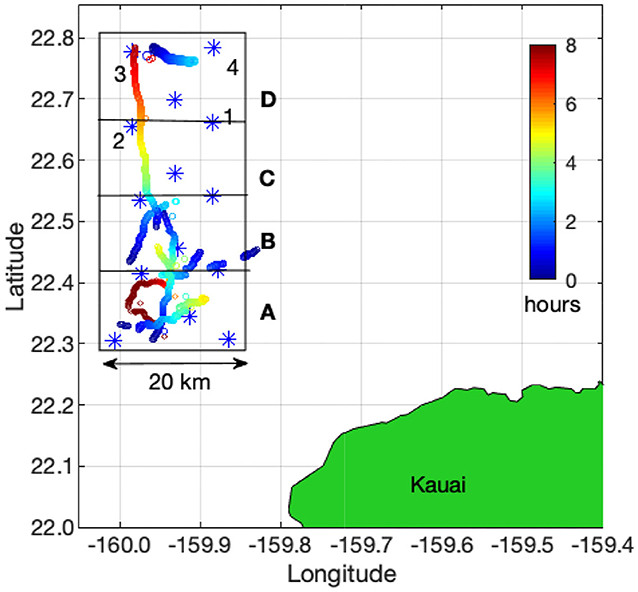
Figure 1. Map of the approximate positions of the U.S. Navy's Pacific Missile Range Facility hydrophones illustrating subarrays A–D (marked with boxes). Each subarray contains five hydrophones with a center hydrophone and four corner hydrophones (marked 1–4 for subarray D). These corner hydrophones are shared with the adjacent subarray to the north or south. The large box outlining all 14 hydrophones shows the approximate boundaries for the area that is defined as being within the array. Nine example whale tracks are shown with colored points to represent the duration and scale of typical tracks. These tracks are plotted together even though they did not all overlap in time. The location of each point is the location of the whale when a note was produced and the color of the point indicates the elapsed number of hours since the track started.
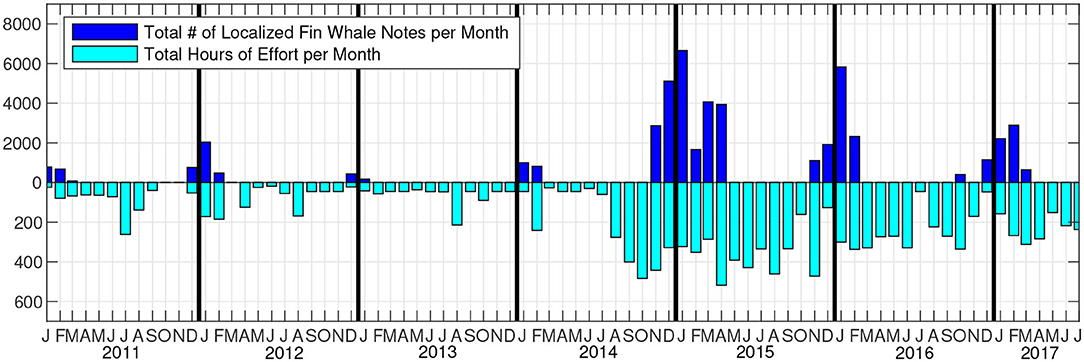
Figure 2. Recording effort in hours per month (light blue) and number of localized and tracked fin whale notes per month (dark blue). To be included, fin whale acoustic tracks had to contain at least 100 localizations, 50 of which had to be within the study area.
Previous researchers have used various terminology to label the notes in the fin whale song sequence, but in this manuscript, we refer to the wider bandwidth note as a B note and the lower frequency, narrower bandwidth note as an A note. In an A-B doublet song, the shorter INI is the A-B interval and the longer INI is the B-A interval. Both doublet and singlet song can occur with a repeated note type such as A-A and B-B. Triplet song can also include either single or multiple note types, but was not observed in these recordings and so will not be discussed further. This naming convention is similar to that used by Thompson et al. (1992) and Weirathmueller et al. (2017), where Thompson et al. (1992) defined notes before the shorter interval in a doublet sequence as A notes and those after the longer interval as B notes and Weirathmueller et al. (2017) defined lower frequency notes as A notes and higher frequency notes as B notes (which also were before shorter and longer intervals, respectively). We decided to refer to these notes as A and B notes instead of backbeat and classic, for example, because the term “backbeat” implies a certain function and we wanted to remain neutral. In addition, A notes often occurred in fin whale song without B notes and therefore were not a “backbeat.” Different researchers have used different approaches to define A and B notes. These two note types were clearly different in this dataset and were defined according to the rules set in section 2.3.
2.2. Detection, Localization, and Tracking of Fin Whale Notes
Locations of singing fin whales were estimated by detecting their notes and extracting the signal features, cross-correlating these features to measure the time difference of arrivals (TDOAs) of the notes at each hydrophone, and comparing these TDOAs with theoretical TDOAs from across the search area to determine the most likely location of the whale. These methods are described in detail in other publications using vocalizations from humpback whales (Megaptera novaeangliae) (Helble et al., 2015; Guazzo et al., 2020), Bryde's whales (Balaenoptera edeni) (Helble et al., 2016), and minke whales (Balaenoptera acutorostrata) (Helble et al., 2020), and so are only outlined in this paper.
Notes and any other transient signals with frequency content between 10 and 50 Hz were detected using the generalized power-law (GPL) detector (Helble et al., 2012) on the recordings from each hydrophone. The GPL detector identified the start and end time of each signal and created a template of that signal by subtracting the background noise in each frequency band from the detection, leaving the spectral content of the signal. These templates were then cross-correlated across hydrophones and the peaks of the correlations were used to calculate TDOAs. The GPL templates were created using 4,096-point fast Fourier transforms (FFTs) with a Hamming window and an overlap of 512 points. The resulting spectral bins had a duration of 85.3 ms and spectral width of 1.46 Hz.
The hydrophones were divided into four subarrays (A,B,C,D) to localize fin whale notes (Figure 1). This subarray configuration was such that a direct-path solution existed for any whale location within the hydrophone array search area, therefore the TDOA value was limited to the direct-path propagation time between pairs of hydrophones. Notes were localized if they were detected on all the hydrophones in a subarray.
Single note templates, instead of sequences of detections as described in section 2 of Helble et al. (2015), were cross-correlated to estimate the TDOA of the note between pairs of hydrophones. This method was also used for calculating the locations of minke whales (Helble et al., 2020) and Bryde's whales (Helble et al., 2016) because a precise location can be calculated for each vocalization produced. These localizations have positional standard deviations of <60 m [Figure 4 of Helble et al. (2015)], and singing whales separated by greater than these distances can be distinguished from each other.
Localized fin whale notes were grouped into tracks using a semi-automatic tracker (Klay et al., 2015), which allowed us to analyze singing behavior on an individual whale basis. Whales were tracked well outside the 20 × 60 km array boundary, but only notes within the boundary were included in our analysis. As notes were assigned to tracks, recursive examination of their times and locations ensured that these tracks followed swimming and singing patterns expected from fin whales. To this end, successive localizations were required to be within 3 km and 40 min of each other. Singing fin whales usually vocalize every few seconds during a song bout, but these bouts are separated by gaps and rests of 2–120 min (Watkins et al., 1987). Setting a maximum allowable distance and time of 3 km and 40 min kept notes grouped together that were most likely from a single whale, while avoiding joining tracks that were from two separate whales. Manual verification of maps of every track and acoustic records also ensured that tracks appeared continuous. Tracks were only considered for this analysis if they contained at least 100 localizations with at least 50 localizations within the 20×60 km grid of the array. Restricting the tracks to these boundaries allowed for automatic localization of nearly every note within a track over all observed noise conditions. Limiting the tracks to the boundaries of the study area also ensured that nearly all notes had sufficient signal-to-noise ratios (SNRs) to allow for accurate calculations of note attributes and note emission times. The total number of tracks included in this study is an estimate of the number of individual fin whale encounters.
2.3. Fin Whale Song Analysis
Time of note emission (TOE) was calculated for each note in a track using
where TOA is the time of arrival of the note on the center hydrophone in the subarray, r is the slant range between the whale's location and the hydrophone with the whale assumed to be at 30 m depth, and c is the assumed sound speed which in this case was 1,500 m/s. The INIs between successive notes in a track were calculated by subtracting their TOEs. The TOA was determined automatically by the GPL processor, and its accuracy for measuring the start time of a variety of calls in various noise environments and SNRs was reported in Table 4 of Helble et al. (2012). According to Helble et al. (2012), arrival time accuracies are on the order of 100 ms or better, and using the previously discussed localization accuracy of at least 60 m, r/c accuracies are 40 ms or better. Combining the two terms, the TOE is expected to be accurate within 140 ms, and therefore not a significant source of error in the INIs presented here, which are rounded to the nearest second.
All tracks were manually validated to consist of downswept notes that met the description of previously documented fin whale type A or B notes. Other baleen whales, such as sei whales (Balaenoptera borealis), are known to vocalize in the same frequency band (Rankin and Barlow, 2007), but the downsweeps have slightly different signal characteristics and sei whales have also not been documented to sing or call in the Pacific in regular repeated patterns like those observed here (but have been observed to call in repeated patterns in the North Atlantic, e.g. Tremblay et al., 2019). Therefore, we assume that the A and B notes recorded are associated with fin whales throughout this paper. For each track, an analyst looked at a map of localizations, the INIs, and the note templates and classified that track as being fin or not fin. An automated classifier categorized each localized signal in the 10–50 Hz band as either an A or B note depending on how much energy was in the different frequency bins. Specifically, the GPL template of the note was summed separately over the length of the note for the 10–23 Hz band, and the 10–50 Hz band. If the ratio of energy in the lower band exceeded 83% of the total, then the note was categorized as an A note, otherwise the note was categorized as B. In practice, there was little ambiguity between the two note types and this empirically-determined classifier agreed well with analysts' manual annotations. A histogram showing the energy ratio with the 83% threshold separating the two note types can be seen in Figure 3. Empirically, the A notes (right-hand side of Figure 3) followed an exponential probability density function. Subtracting this exponential fit from the histogram revealed the remaining distribution of presumed B notes, which must be positive. The zero-point crossing for this remaining distribution occurred at the 83% energy ratio, making this an appropriate choice for separating the two note types. Using the energy ratio as a note classifier was preferable to using a peak frequency statistic as in Weirathmueller et al. (2017), because the peak frequencies of the two note types at PMRF sometimes overlapped. However, the A notes had a much smaller bandwidth, and most of the energy of the note was below 23 Hz, while the B notes had a wider bandwidth with most energy above 23 Hz. Using these methods, only 0.6% of the notes were reclassified by the analyst during the track review process. The reclassification was only necessary when two whales vocalized at the same time and the two overlapping notes created a misclassification.
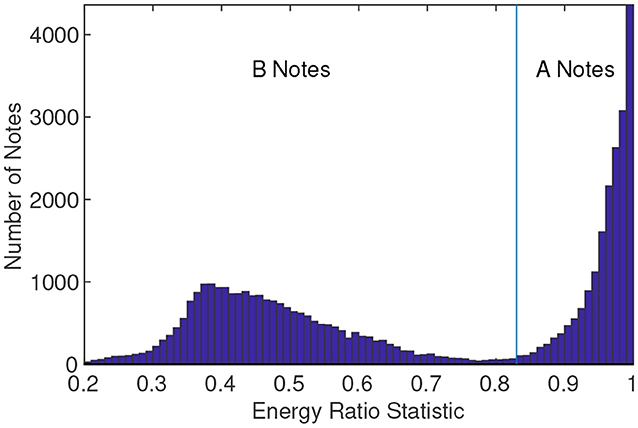
Figure 3. Histogram of the energy ratio used to automatically classify fin whale A notes and B notes. The ratio is the summation of the energy of the GPL spectral template in the 10–23 Hz band divided by the summation of the GPL spectral template in the 10–50 Hz band. The 83% threshold marks the separation of the two note types.
The detections for each fin whale track were imported into the Raven Pro software package (Center for Conservation Bioacoustics, 2019) as selection tables. Analysts manually validated the notes in the track, focusing on the period of time that the whale was within the array area. The automatically localized notes were marked with boxes in the spectrograms of the raw acoustic data for each of the four center hydrophone channels. Signals from the same track had the same delay pattern across these four channels. Any notes that were visible on the spectrogram, but were not localized, were manually added, false detections were removed, and misclassifications were changed to the correct note type. In practice, the automated detection, localization, and classification process performed well, and few adjustments were needed by the analysts (missed detections, false detections, and incorrect classifications were all <1%, missed localizations were <6%). When more than one whale was singing at the same time, the signal arrival time patterns were used across the channels to associate the missed note with the appropriate tracked whale. In a few instances, associating missed notes to the correct whale track was too difficult, in which case the track was eliminated from the study. A small number of automatically generated tracks looked like they could have been produced by more than one whale because the whale source location was irregularly changing position and/or because the notes in the raw data were overlapping each other in time. These tracks were not included in subsequent analyses so that the tracks included were most likely produced by single whales.
All vocalizations were limited to the 20×60 km study area, allowing for the center hydrophone of each subarray to always be within 10 km of the vocalizing whale, and the farthest hydrophone in the subarray to be 20 km or closer. The center hydrophone for each subarray was used to measure the TOA and the note attributes. Due to the high SLs of the 20 Hz notes and close proximity of the whales to the center hydrophones, nearly all notes had high SNRs. The only notes with low SNRs were those that occurred during presumed surfacing events (also described as rests or gaps in a track), in which faint notes could sometimes be detected. Watkins et al. (1987) reported that notes immediately following or preceding rests or gaps had lower SLs. We detected and usually localized these lower SL notes, in addition to even fainter notes that occurred during the “gap.” These notes are likely missed by monitoring systems with less dense coverage than PMRF. Aside from these presumed surfacing event notes, nearly all missed notes were manually added to each track, so the along-track cue rate and INI could be determined for each whale track.
Automatic positions were not calculated for missed notes, and so the TOE for each missed note was calculated using the last known position of the whale. In practice, fin whales vocalize often and few successive notes were missed by the automated software, allowing for accurate TOEs to be calculated for the missed notes. Notes were sometimes localized by more than one subarray, creating duplicate entries. These entries were eliminated by searching for TOEs with INIs <4 s, and retaining only the detection from the closer subarray.
The INI for each note type pairing (A-A, A-B, B-A, B-B) was calculated by measuring the time between the start of the first note and the start of the subsequent note. Intervals between subsequent notes were only counted as INIs if the value was ≤60 s. The INIs of each pairing and the percentage of each pairing type were recorded for each of the fin whale tracks.
INIs for fin whale pulses often follow regular patterns. The peak INIs for each of the note pairings within a track were determined by fitting a Gaussian model to the distribution of INIs, binned in 1 s bins. The Gaussian model was either a single-term model for a single INI peak or a two-term model for two INI peaks and is given by
where n is either 1 or 2 for a single-term or two-term model, a is the amplitude, b is the centroid location, and c controls the width of the peak. The model with the least uncertainty was selected. First, the 95% confidence interval widths were determined for each of the coefficients in each model. These widths were averaged across the coefficients for the single Gaussian peak in the single-term model and the two Gaussian peaks separately in the two-term model. Next, the average for the single-term model was compared with the average for the peak in the two-term model that had the greatest confidence interval (most uncertainty). Finally, the model that had the smallest 95% confidence interval width was selected for each note type pairing in each track. This method resulted in smoothed curves that matched the distribution of the observed INIs (Figure 4). The spread of the INIs was quantified by measuring the width of each INI peak at half of its height. Peak INIs were only calculated for tracks that had at least 20 instances of that note type pairing. The one- and two-term models allowed for an automatic and consistent way of determining if a track contained singlet (single peak) or doublet (two peak) singing patterns for each note pairing. The Matlab code for calculating INI peaks is provided in the Supplementary Material.
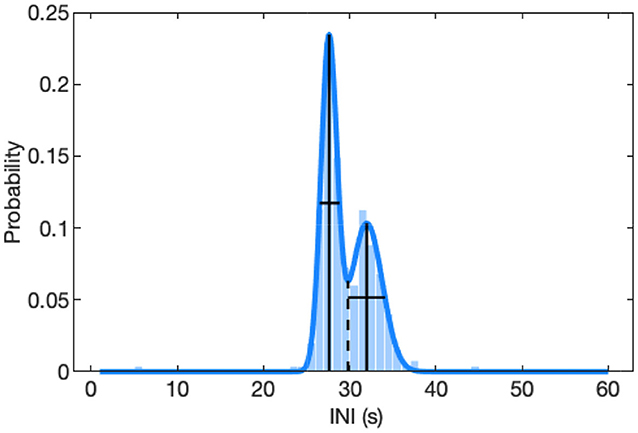
Figure 4. Distribution of inter-note intervals (INIs) for an example A-A doublet track from 09-Feb-2015. The true distribution with 1-s INI bins is plotted in the background and the two-term Gaussian model that was fit to this distribution is plotted as the curved blue line. The INI peaks are shown as solid vertical lines and have values of 28 and 32 s. The spread of the distributions are shown as solid horizontal lines at y-values of half the peak height and have values of 2.3 and 4.3 s. The dashed vertical line at the local minimum of the fitted curve divides the two peaks.
To determine whether the observed INIs for each of the note pairings changed over time, the slopes of the peak INIs were calculated. Slopes were significantly different from zero if their 95% confidence intervals did not include zero. Slopes were calculated separately for the singlet and doublet patterns of each note pairing.
Cue rates were calculated for each track by dividing the total number of unique notes in a track by the total elapsed time. The along-track cue rate is the vocalization rate of an individual whale while it is vocally active and is in units of notes/hour. This cue rate is not the total population cue rate which would include non-calling whales and times when whales were not vocally active.
Intervals between notes that were >60 s were logged for each track, and both the interval length and the time between each interval were noted. These intervals were likely due to surfacing events based on the observations in Watkins et al. (1987). The notes between long gaps are defined as a bout.
For all A and B notes recorded within the study area, we calculated the received note peak frequency and 3 dB bandwidth. Methods for calculating peak frequency and 3 dB bandwidth are described by Crane and Lashkari (1996). The peak frequency of a note has the greatest amplitude in the note spectrum (amplitude as a function of frequency) and the 3 dB bandwidth is the width of that peak measured 3 dB down from the peak amplitude. To ensure accurate measurements, only notes with 5 dB or greater SNR were reported, where SNR is defined as:
where RLdB is received level and NLdB is noise level, both in units of dB re 1 μPa. The GPL processor automatically measures the RL and NL for each detection, as defined in section II C of Guazzo et al. (2020). An nFFT of 4,096, an overlap of 87.5%, a sampling frequency fs of 6 kHz, and frequency range of f1 = 10 Hz to fn = 50 Hz were used in the calculations for RL and NL (Equations (1) and (2) from section II C of Guazzo et al. (2020). The measurements were examined over SNRs ranging from 5 to 30 dB in order to determine if SNR had a significant effect on the measurements.
3. Results
Between January 2011 and July 2017, a total of 571 days were analyzed on each hydrophone. During this time, 115 fin whale tracks containing 50,034 unique A and B notes passed through the PMRF study area. The median duration of all tracks was 2.3 h. This duration is a minimum song duration as fin whales may be singing before they enter and after they leave the study area. Tracks were only present from late fall to early spring each year, even though there was recording effort year-round. Non-song calling may occur at other times of the year, but did not occur regularly enough to form tracks. Nine of the 115 tracks are mapped in Figure 1 to illustrate typical fin whale track duration and movement in the study area. Fin whales sang in five different patterns made up of A and B note type pairings in both singlet and doublet INI patterns. These song patterns will be called A-B doublet, A-A singlet, A-A doublet, B-B singlet, and B-B doublet for the remainder of the paper. Each song pattern name contains the note pairing (A-A, B-B, or A-B) and the INI pattern (singlet or doublet). Forty-five tracks contained two or more song patterns. Most often these song patterns were interspersed along the track, but occasionally there was a sudden shift between song patterns. The subset of tracks with two or more song patterns had a median duration of 3.5 h.
A track with primarily A-B doublet song occurred on 24-Jan-2015, and is shown as an example in Figure 5. The upper-left plot shows the coordinates for the track, the lower plot shows a representative 80 s spectrogram of the note types in the track, and the upper-right plot shows the INIs for the 4 note pairings. The INI variability is not due to missed notes along the track since all tracks were manually validated and missed notes were added, but is instead a result of whale singing behavior. The peak INI for the A-B pairing was 11 s and the peak INI for the B-A pairing was 19 s. This fin whale was tracked for a total duration of 12.5 h. The track contained 2,430 notes and was composed of approximately 44% A-B pairings, 44% B-A pairings, 11% B-B pairings, and 1% A-A pairings.
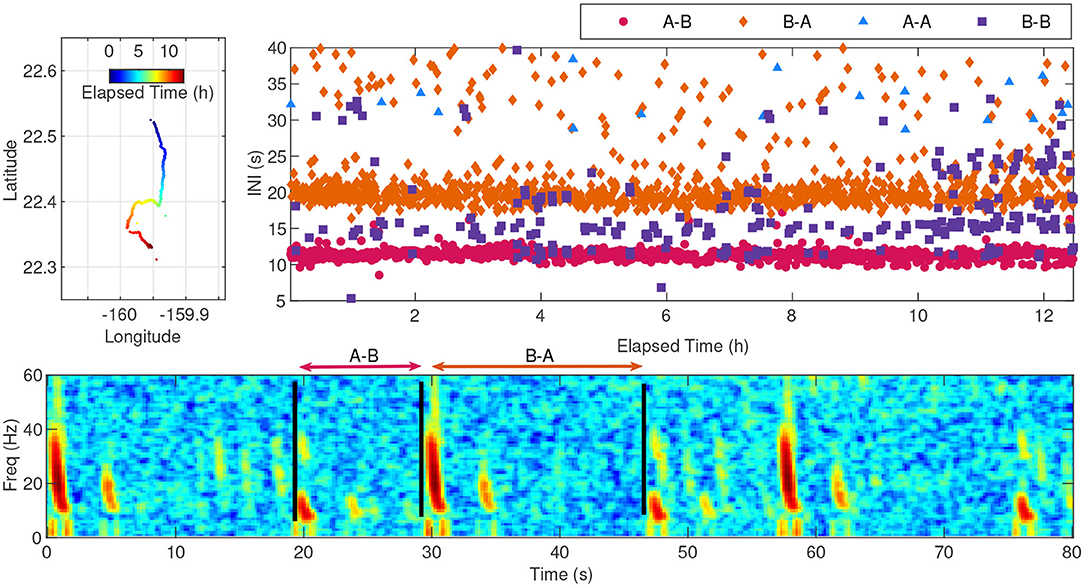
Figure 5. A typical fin whale track with dominant A-B doublet song starting at 06:09:49 UTC on 24-Jan-2015. The upper-left plot shows the coordinates of the track with the color indicating the elapsed time since the start of the track. The whale transited a distance of 27.6 km from north to south over 12.3 h. The spectrogram shown in the lower plot illustrates a typical 80 s segment of the track, with an INI measurement example shown for the A-B and B-A 20 Hz note pairings. A multipath arrival can also be seen for each direct path arrival, appearing approximately 3.5 s after the first arrival with weaker intensity. The notes were recorded at a 6 kHz sampling rate. A 4,096-point fast Fourier transform (FFT) with a Hanning window and 87.5% overlap was used to create the spectrogram. The INI for each note along the track is shown in the upper-right plot, with each pairing type noted by color and shape.
The INI peaks from the fitted Gaussian distributions were calculated and averaged for each of the note type pairings across the 115 tracks (Figure 6, Table 1). For singlet patterns, the median INIs were 30 s for A-A pairings and 17 s for B-B pairings. The median INIs for the A-B doublet pattern were 12 s for A-B pairings and 20 s for B-A pairings. The A-A doublet pattern had median INIs of 28 s for the shorter INI and 33 s for the longer INI. The B-B doublet pattern had median INIs of 17 s for the shorter INI and 24 s for the longer INI. A few of these song patterns had INIs that significantly changed over time. A-B and B-A doublet INIs increased over time at rates of 0.6 s/year (95% CI[0.3,0.9]) and 1.0 s/year (95% CI[0.4,1.6]), respectively, and A-A singlet INIs increased at a rate of 1.3 s/year (95% CI[0.4,2.2]).
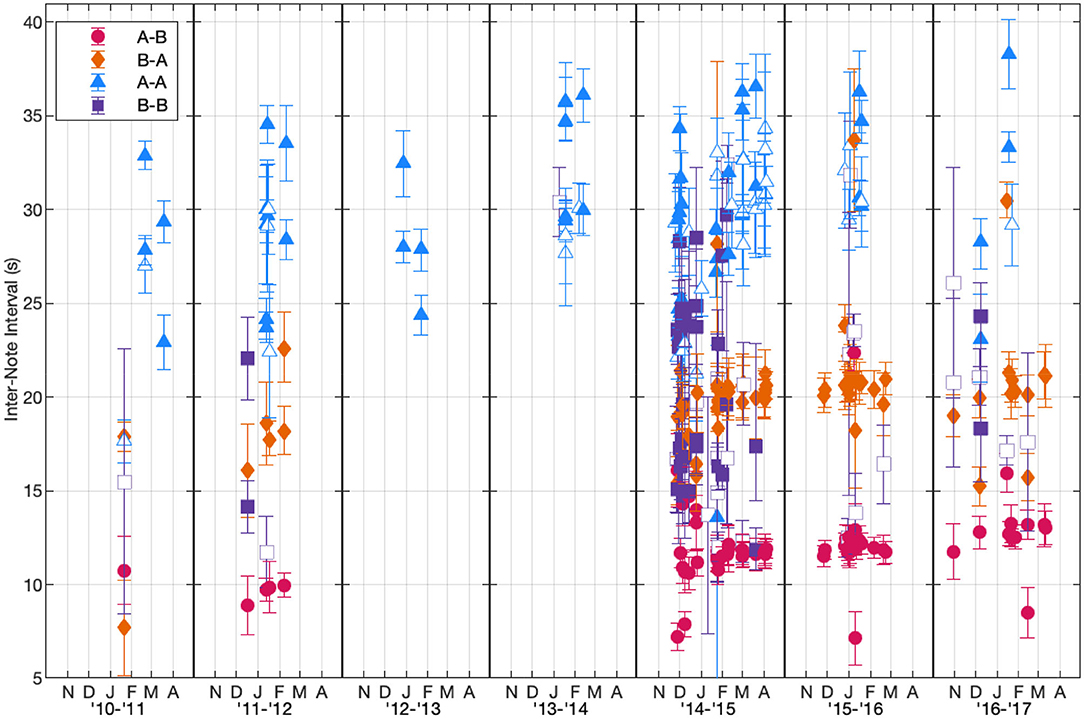
Figure 6. Peak inter-note interval (INI) values for each note pairing type in each track based on the fitted Gaussian models plotted for each track with the width of each INI peak shown as error bars. Each season is plotted from October to May based on the earliest and latest fin whale detections. The INI values are plotted as a function of when each track started. Points were only plotted if the track had at least 20 pairs of those note types in the song sequence. Filled-in markers indicate that the song pattern occurred as a doublet while open markers indicate that the song pattern occurred as a singlet. INIs <4 s and >60 s were not included in these calculations. Y-axis was restricted based on the range of observed INIs.
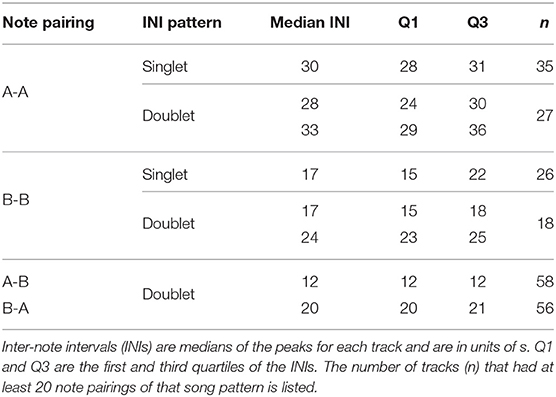
Table 1. Fin whale song patterns observed on the Navy's Pacific Missile Range Facility off Kauai, Hawaii.
The percentages of note type pairings for each of the 115 fin whale tracks were calculated and are shown in Figure 7. Although the recording effort and the subsequent number of fin whale tracks was low between 2011–2014, the most dominant note pairing during that time was A-A. The A-B doublet song became the dominant note pairing from the 2014–2015 season on, with intermixed A-A and B-B note pairings in both singlet and doublet forms. On many occasions, a tracked whale changed its song patterns throughout its track. For example, the track that started on 13-Jan-2012 began with A-A doublet song, but changed midway through the track to B-B singlet song and interspersed A-B doublet song (Figure 8, upper). When multiple song patterns were interspersed within a track, there was no clear break between song patterns and instead the note patterns and spacings changed within the bouts. This track contained approximately 47% A-A pairings, 18% B-B pairings, 17% A-B pairings, and 17% B-A pairings. Another track on 20-Mar-2015 had a more abrupt change in song patterns, with the track starting as A-A doublet song and then abruptly changing to A-B doublet and B-B doublet song in the middle of a bout (Figure 8, middle and lower). These song pattern changes are not simply the result of a whale adding or subtracting a new note. In this example, the spacing from one A note to the next A note in the A-B doublet is constant (32 s) while the INIs between A notes in the A-A doublet alternated between two different intervals (31 and 37 s). This track contained approximately 31% A-A pairings, 22% B-B pairings, 24% A-B pairings, and 24% B-A pairings. The total number of note pairings was also calculated for all 50,034 unique notes in all 115 tracks, resulting in approximately 25% A-A pairings, 27% B-B pairings, 24% A-B pairings, and 24% B-A pairings.
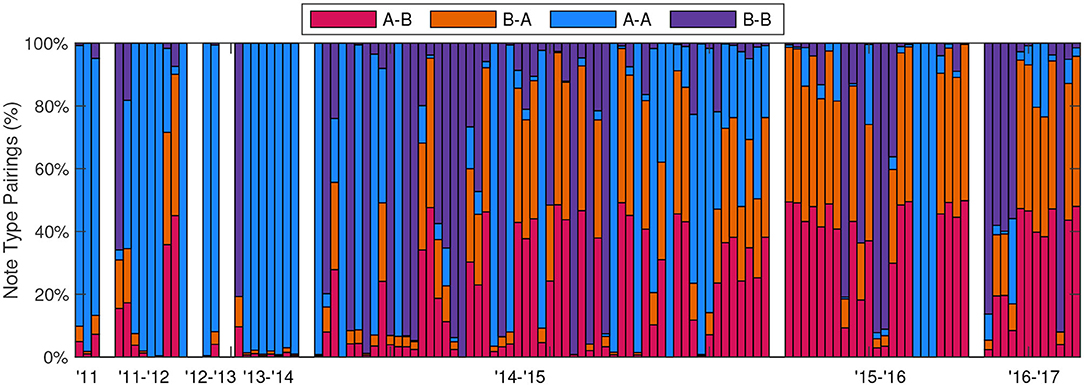
Figure 7. Percentage of different note pairings for each of the 115 fin whale tracks, spanning 2011–2017. Doublet and singlet songs are not differentiated in this plot as A-A and B-B pairings can be grouped in either singlet or doublet INI patterns. The tracks were seasonal and only occurred from October to April, white bars mark each of these seasons.
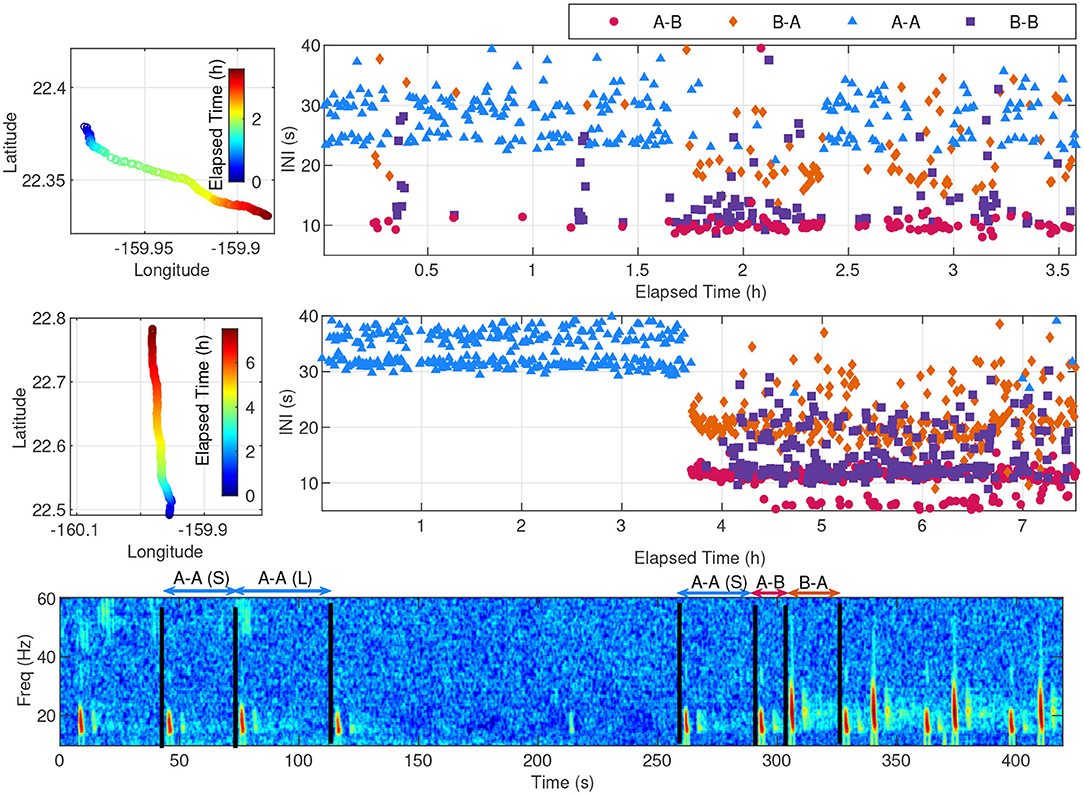
Figure 8. Two examples of fin whale tracks exhibiting a mixture of song patterns while acoustically localized on PMRF. The upper-left plot shows a fin whale transiting a distance of 11.5 km from north to south on 13-Jan-2012 at 07:11:20 UTC. The middle-left plot shows a fin whale transiting a distance of 32.7 km from south to north on 20-Mar-2015 12:05:17 UTC. Neither of these tracks occurred at the same time as another fin whale singing on PMRF. The corresponding INIs are shown to the right of each track, with each pairing type noted by color and shape. The spectrogram corresponds to the middle track and shows the transition period from A-A doublet song to A-B doublet song starting at 3.6 h into the track. Example A-A INIs are labeled as (S) for short and (L) for long and A-B and B-A INIs are also labeled. The gap in the middle shows a presumed surfacing interval with a low SNR A note at 215 s.
The along-track cue rate was calculated for each fin whale track (Figure 9). The median along-track cue rate for all 115 tracks was 131 notes/hour (Q1 = 100, Q3 = 166). The median and variance of the along-track cue rate was lower when the A-A pairing dominated from January 2011 to March 2014 [median = 102 notes/hour, variance = 562 (notes/hour)2] compared to when the doublet song dominated from November 2014 to March 2017 [148 notes/hour, variance = 1,860 (notes/hour)2]. These increases were significant at the p = 0.001 significance level (one-sided Wilcoxon rank-sum test and one-sided Ansari-Bradley test).
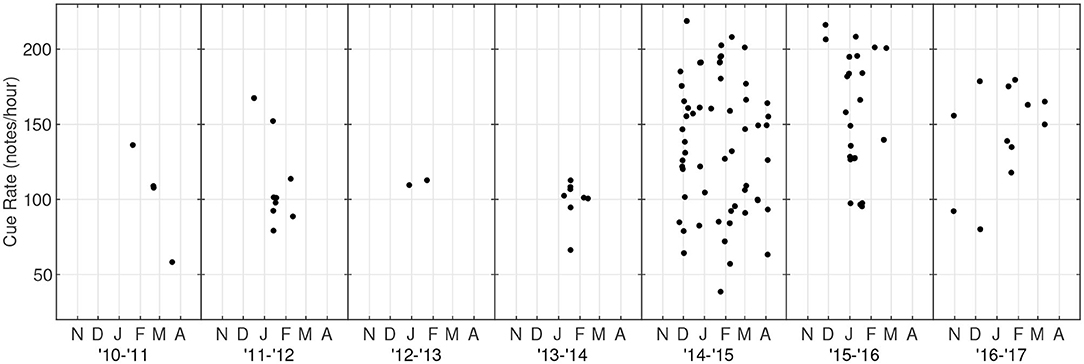
Figure 9. Along-track cue rate for fin whales at PMRF as a function of time. Cue rate was calculated as number of notes in a track divided by the total elapsed time of the track and is in units of notes/hour. Each season is plotted from October to May based on the earliest and latest fin whale detections.
Singing gaps >60 s regularly occurred during the fin whale tracks. Example INIs without separation for note types can be seen in Figure 10, representing the same track shown in Figure 5. The y-axis upper limit is 200 s to illustrate the longer pauses in the fin whale song. There are a total of 45 occurrences of INIs greater than 60 s, and these regular pauses likely represent surfacing events. The median time between the start of one surfacing event to the start of the next event for this track was 18.6 min (Q1 = 15.1, Q3 = 20.2), with median presumed surfacing duration of 121 s (Q1 = 98, Q3 = 134). Combining all occurrences of INIs >60 s for all 115 tracks resulted in 1,811 potential surfacing events. The median time between all presumed surfacing events was 11.5 min (Q1 = 5.4, Q3 = 16.9) and the median duration of all presumed surfacing events was 116 s (Q1 = 87, Q3 = 154).
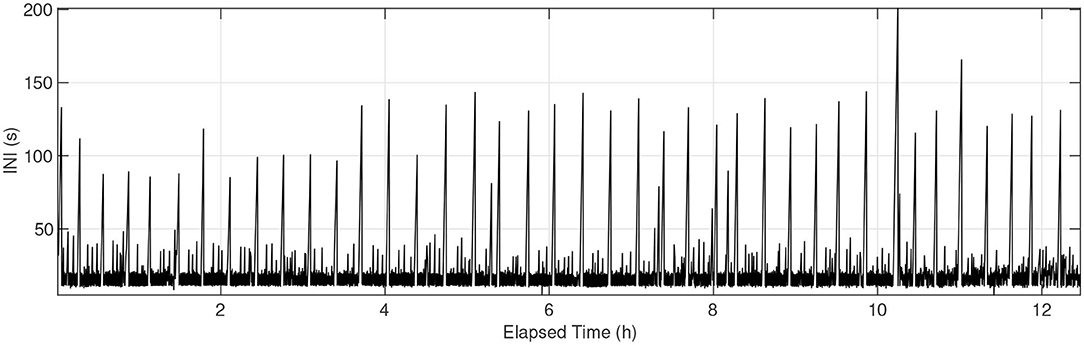
Figure 10. INIs for the same fin whale track as shown in Figure 5, without separation for note type pairings. There are 45 occurrences of INIs >60 s, which likely indicate surfacing events. The median time between presumed surfacing events for this track was 18.6 min, with median duration of 121 s.
A total of 19,233 A notes and 23,334 B notes had an SNR of at least 5 dB, and the median SNR for all measured notes was 18 dB. The median peak frequency for all A notes with an SNR of at least 5 dB was 16 Hz (Q1 = 16, Q3 = 16), with a 3 dB bandwidth of 6 Hz (Q1 = 5, Q3 = 7). The median peak frequency for all B notes with an SNR of at least 5 dB was 23 Hz (Q1 = 20, Q3 = 26), with a 3 dB bandwidth of 13 Hz (Q1 = 11, Q3 = 16). Both peak frequency and the 3 dB bandwidth were measured as a function of SNR. Over the SNR range of 5–30 dB, the measured peak frequency of A notes increased slightly at a rate of 0.02 Hz/dB (95% CI[0.01,0.02]) and the measured 3 dB bandwidth also increased at 0.1 Hz/dB (95% CI[0.1,0.1]). The measured peak frequency of B notes also increased slightly over the SNR range at a rate of 0.14 Hz/dB (95% CI[0.12,0.13]) and the measured 3 dB bandwidth increased at 0.2 Hz/dB (95% CI[0.2,0.2]).
4. Discussion
The vocalization behavior of singing fin whales on PMRF was more complex than previously reported for the Hawaii region. In prior research, fin whale song was often hand-picked from time periods in which the song was the most clear and thought to be from an individual whale. Aggregating the INIs and choosing the peaks using that method may oversimplify the song complexity, as less dominant peaks may be missed. Additionally, if not enough data are analyzed, less prevalent note pairings may be missed. Archer et al. (2019) recorded 421 fin whale notes in Hawaiian waters between 2007 and 2008 and reported that Hawaii was one of the most homogeneous regions the researchers analyzed, with song sequences composed entirely of A-A note pairings with relatively long INIs. Our larger sample size (50,034 notes) revealed that only 36 of the 115 fin whale tracks analyzed contained over 50% A-A note pairings. This pairing was more dominant from the winter of 2011 to the spring of 2014, but became less common in more recent years. It is also possible that notes between 2007 and 2008 were indeed homogeneous, and the years analyzed at PMRF could indicate a somewhat rare transition period in which the whales sing multiple songs as a new song replaces the older song.
Some of the song patterns recorded on PMRF were similar to others reported in the Northeast Pacific, but the dominant song patterns were delayed compared to what was observed in other regions. The A-A doublets recorded here with median INIs of approximately 28/33 s have similar INIs to the song sequences described in Hawaiian waters (2000–2001, 2005–2006), the Southern California Bight (2000–2003), off the U.S. northwest coast (2003–2006), and in the Bering Sea (2000–2002, 2005–2006) (Weirathmueller et al., 2013; Oleson et al., 2014; Širović et al., 2017; Archer et al., 2019). However, in previous datasets, the two notes in this A-A doublet pattern were sometimes described as two different note types (Oleson et al., 2014; Širović et al., 2017), while we observed a single note type for this doublet as did Archer et al. (2019). In our dataset, fin whale songs seemed to depend on both the patterns of INIs and note frequencies. The A-A doublet pairing became rare in the Southern California Bight after 2003 and has not been reported off the Washington coast since 2006, but remained the dominant pairing in our dataset until 2014. We did not record enough examples of fin whales singing A-A doublet patterns to confirm whether whales on PMRF were increasing their INIs from fall to spring as observed by Oleson et al. (2014) and Širović et al. (2017).
The A-A singlet pattern recorded at PMRF with a median INI of approximately 30 s could be the same pattern as other patterns previously reported across the northeast Pacific (Weirathmueller et al., 2013, 2017; Oleson et al., 2014; Širović et al., 2017; Archer et al., 2019), accounting for INIs changing over seasons and steadily increasing through the years. When this pattern was observed, it was the dominant A-A pairing in a track and not as part of an A-A doublet pattern [which is how it was usually observed in Oleson et al. (2014) and Širović et al. (2017)]. The INIs for the A-A singlet pattern recorded at PMRF increased over time similar to how the INIs increased over time off the U.S. northwest coast (Weirathmueller et al., 2017). The A-A singlet song was observed off the U.S. northwest coast from 2003 to 2012 and became rare in the Southern California Bight after 2003, but was present for the full duration of our dataset (2011–2017).
The A-B doublet recorded at PMRF with INIs of approximately 12/20 s might be the same song pattern observed in the Southern California Bight starting in 2006 and off the U.S. northwest coast becoming prominent in 2009 (Širović et al., 2017; Weirathmueller et al., 2017). Similar INIs were also observed in Monterey Bay, the Gulf of Alaska, and the Chukchi Sea in non-continuous recordings between 2001 and 2011 (Archer et al., 2019). These INIs from the west coast do not match the A-B doublet recorded off Hawaii exactly, but previously recorded doublet INIs increased over time with a different slope for the A-B interval than the B-A interval (Weirathmueller et al., 2017). The A-B/B-A intervals recorded at PMRF were also increasing over time. It is interesting, however, that although this doublet pattern was prominent off the west coast before these recordings at PMRF began, it didn't become the dominant song at PMRF until the 2014–2015 season. In addition, when it became the dominant song, the INIs measured at PMRF were the most similar to U.S. west coast INIs prior to 2010.
The B-B singlet and doublet patterns observed at PMRF have not been described previously for North Pacific fin whales. The B-B singlet pattern had an INI of approximately 17 s and the B-B doublet pattern had INIs of approximately 17/24 s. These B-note patterns did not show a significant trend over time. These song patterns were not rare, as 26 tracks out of 115 consisted of more than 50% B-B note pairings. Perhaps these B-B song patterns are unique to fin whales in Hawaiian waters, or perhaps they are present in other locations, but have not been reported previously because this song pattern formed a less dominant peak when analyzing songs based on INI alone.
The frequency of the notes differentiate the two pulse types and seem to be an important component of the fin whale song structure. Some previous work about fin whale song patterns focused solely on the INIs between notes and did not consider the frequencies of the notes when classifying song (e.g., Oleson et al., 2014; Širović et al., 2017). Geographical variation in the frequencies of the A and B notes might also exist as the B notes recorded in Hawaiian waters appear to have a greater bandwidth than those recorded along the U.S. west coast (based on spectrograms in Širović et al., 2017; Weirathmueller et al., 2017) and were more similar to those recorded in the Gulf of California (Thompson et al., 1992; Širović et al., 2017). However, comparing note types across studies is very difficult and should be approached with caution. The methods used to measure note characteristics can vary from study to study, and differences in recording equipment can also influence the note measurements. Additionally, the acoustic transmission properties of the different study areas can distort and attenuate the notes differently as they propagate from the whale to the receiver. Oftentimes, as shown in the work here, the measured signal properties can change as a function of the SNR. Sometimes the note characteristics are truly different at varying SNR, while in other cases the SNR influences the measurement process itself. For example, if higher SNR notes also have higher SLs, these higher SL notes could have inherently different attributes which might be related to the size and vocal intensity of the whale. However, higher SNR notes can also appear to have a greater bandwidth, longer duration, and different center frequency than lower SNR notes even if these notes were identical when they were produced. There is some evidence that the center frequencies and bandwidth of the A and B notes changed slightly over the 7-year study period at PMRF. However, due to the confounding factors mentioned previously, results were not presented because it is difficult to determine if the measured differences were true changes in signal characteristics or simply measurement differences associated with changing SNR. Weirathmueller et al. (2017) observed a frequency decrease off Oregon and Washington for A notes in the singlet pattern, but not for B notes. In the future, collaboration amongst colleagues and establishing best measurement practices will help determine if these trends can be corroborated. To begin, including both the note type and INI will be important in future work describing the singing behavior of fin whales.
Vocalization gaps >60 s aligned with the timing and duration of surfacing events observed by other researchers during focal follows. These breaks in singing occurred every 11.5 min on average and lasted approximately 116 s. The average duration of these presumed surfacing events was slightly shorter than the 120–150 s averages that have been previously reported, but they were spaced within the previously reported intervals of 10–15 min (Watkins et al., 1987; McDonald et al., 1995; Nieukirk et al., 2004). The notes before and after these presumed surfacing events had lower RLs. It is unknown if the lower measured RLs during surfacing events were caused by lower SLs of the animal as was reported by Watkins et al. (1987), or if acoustic transmission loss between the animal and the hydrophones was higher when the whales were nearer to the surface.
Some researchers have proposed that INI patterns are unique to specific populations and/or stocks (e.g., Thompson et al., 1992; Hatch and Clark, 2004; Delarue et al., 2009; Širović et al., 2017), while others have suggested that INI patterns can change as a result of cultural transmission (Weirathmueller et al., 2017). The results presented here suggest that the same group of fin whales may use multiple note pairings and INIs in their song. The strongest support for multiple singing patterns being employed by a single group is evidenced by numerous individuals (45) that changed or switched between song patterns within a track. For example, the whales tracked in Figure 8 transitioned between three distinct note pairings with unique INIs and even exhibited multiple patterns simultaneously. These transitions often occurred within a song bout (Figure 8 spectrogram). Although we do not know the fin whale population structure, the ability for individual whales to change their primary singing pattern within a track suggests that a variety of song patterns are sung by individual populations and that these different song patterns do not indicate new whales entering the area, but instead are part of normal individual song variability.
Based on available evidence, it is most likely that multiple song patterns within a track are produced by individual whales and not multiple whales coordinating their singing in a tight group. Song patterns along a track often switched even within a song bout, and there was no evidence of overlapping song along the tracks. Therefore, high coordination between multiple males in very close proximity would need to occur in order to appear to the analyst as a single singing animal. For some tracks, the song patterns changed more distinctly mid-track. In this situation, it might be possible that one singing animal ceased to vocalize and a nearby animal began to vocalize concurrently. However, the density of fin whale tracks on the range was very low. Of the 115 tracks, only 15 tracks occurred within the boundaries of the study area at the same time as another singing fin whale. Therefore, it is unlikely that two tracks would be combined in this manner, unless the movement between the singing whales was highly coordinated since the localization methods have such high accuracy and precision. Previous researchers have reported that singing fin whales were separated by distances much greater than our localization method precision (e.g., Watkins, 1981, observed that singing fin whales were separated by at least 1 km). In addition, the subset of tracks that contained multiple song patterns had median durations of 3.5 h. If the multiple song patterns are from coordinated singing animals in tight groups, and song pattern is population-specific as has been suggested previously (e.g., Thompson et al., 1992; Hatch and Clark, 2004; Delarue et al., 2009; Širović et al., 2017), then the results presented here suggest that males from separate populations are interacting in unprecedented coordination over several hours. Although it would not be impossible for these tracks with multiple song patterns to be produced by multiple whales, it seems improbable, and the more probable explanation is that single whales were utilizing multiple song patterns in their repertoire. A visual-acoustic study would need to be conducted in order to determine the correct explanation.
Fin whales might engage in vocal learning and change their song over time. The fin whales at PMRF sang with many of the same song patterns as whales recorded on the west coast, however, their songs were not in sync over these years as previously reported (Oleson et al., 2014). Notably, the A-B doublet pattern did not become the dominant song in the fin whales recorded at PMRF until 5–8 years after it was reported as the dominant song off the U.S. west coast (Širović et al., 2017; Weirathmueller et al., 2017). In addition, the INI pattern of the A-B doublet song pattern did not align with the trends observed off the U.S. west coast. For example, in 2011–2012, the fin whales in the Southern California Bight were singing with INIs of approximately 16/21 s (Širović et al., 2017), while the A-B INIs recorded at PMRF were about 5 s lower. Since the fin whale songs were not in sync, the fin whales in Hawaiian waters appear to be somewhat separated from the fin whales off of the U.S. west coast, supporting the division of this population into separate stocks (Carretta et al., 2018). This singing behavior is different from that of North Pacific humpback whales which share overlapping summer feeding areas and go to separate wintering areas, but sing similar songs across these wintering areas (Winn et al., 1981; Barlow et al., 2011). If vocal learning in fin whales is similar to humpback whales, then the delay in fin whale song adoption suggests that whales from these groups are not interacting regularly on shared feeding areas (as suggested by Weirathmueller et al., 2017). This delayed adoption of singing patterns from the U.S. west coast might be evidence of cultural transmission. Humpbacks, for example, have been shown to adopt the song of a small number of immigrant whales (Noad et al., 2000) and cultural transmission of song patterns has rippled across the South Pacific (Garland et al., 2011). Perhaps small numbers of male fin whales occasionally immigrate between the North Pacific regions and bring new songs with them as they travel.
Alternatively, different populations of fin whales might enter the Hawaiian waters at different times. These movements may be driven by environmental fluctuations [as described for Mediterranean fin whales by Notarbartolo di Sciara et al. (2016)]. Individual populations may utilize multiple song patterns in their repertoire and cause sudden shifts in observed song types. However, since the song patterns observed here were not synchronized with song patterns reported elsewhere it is unlikely that whales are coming to this area from fin whale populations previously recorded and described. An exception to this argument is the A-A song patterns which seem to have INIs that are continuations of the trends observed off the U.S. west coast (e.g., Weirathmueller et al., 2017). But these A-A song patterns sometimes occurred in tracks that also had A-B doublet song patterns that were not in sync with those observed off the U.S. west coast (e.g., see Figure 8). Unfortunately, no other published recordings completely overlap in time and many areas of the North Pacific are undersampled. To fully test these two hypotheses and assess how the song patterns used by fin whales in Hawaiian waters compare with those used at the same time throughout the North Pacific, simultaneous recordings of fin whales throughout the North Pacific are needed. In addition, more work is required to better understand the movements and population structure of fin whales in the North Pacific, and a repertoire of song patterns (in contrast to a single song pattern) could be one method of distinguishing different groups at any given time.
The along-track cue rate at PMRF provides some insight into the feasibility of using acoustic cue counting as a method for estimating density or abundance of fin whales. If individual notes are used as the acoustic cue, the cue rate would likely need to be adjusted for song patterns, year, and season. For example, if an acoustic cue was first derived from the dominant A-A doublet song in 2011–2014, it would no longer be accurate as the fin whales transitioned to the dominant A-B doublet song present from 2014 to 2017. Additionally, most song patterns observed on PMRF had an INI that lengthened over time, indicating that annually fewer notes were produced per hour. The cue rate of singing fin whales was significantly greater than that of non-singing fin whales (Stimpert et al., 2015). An acoustic cue does not have to be limited to counting individual notes. For example, counting song bouts, surface intervals, or the number of tracks are viable cue options. While it may be more difficult to count surface intervals using single-fixed hydrophones, the metric may be more stable over time than counting individual notes, as the breathing requirements of the whale likely remain unchanged over time. The ability to localize and track whales at PMRF allows for the number of tracks to be counted on the range. However, even in this ideal scenario it is difficult to determine how many individual fin whales utilize the range. The percentage of time that males are vocally active and the percentage of vocally active whales within the total population are still unknown. Additionally, it is difficult to determine if tracks that are separated by hours or days are made by unique fin whales or from the same individual returning to the range.
In conclusion, fin whales in Hawaiian waters sang songs that were more complex in note choice and rhythm than previously reported in other regions. INI alone is not enough to distinguish populations since individual whales sang songs with multiple INI patterns. Even though some singing patterns overlapped between fin whales in Hawaiian waters and fin whales off the U.S. west coast, since the songs in Hawaiian waters were not in sync with songs recorded off the U.S. west coast, these groups of whales seem to be separated. The delay in adoption of the A-B doublet for fin whales in Hawaiian waters may indicate that cultural transmission occurs through low numbers of individuals immigrating between regions. Alternatively, groups occupying the Hawaiian waters could shift over time resulting in different song patterns becoming dominant. More work is needed to understand the behavior, life history, and abundance of fin whales in Hawaiian waters.
Data Availability Statement
The original contributions presented in the study are included in the article/Supplementary Material, further inquiries can be directed to the corresponding author/s.
Ethics Statement
Ethical review and approval was not required for the animal study because research was conducted through passive listening of whales in their natural environment.
Author Contributions
CM, SM, and EH collected the data. GA processed the data. CM and SM developed the tracking algorithm. TH and RG validated and analyzed the data and wrote the draft manuscript. TH, RG, GA, CM, SM, and EH discussed the results and contributed to the final manuscript. All authors contributed to the article and approved the submitted version.
Funding
This research was supported by Commander, U.S. Pacific Fleet (Code N465JR, Award Number N0007020WR0EP8F) and tool development necessary for this analysis was supported by the U.S. Navy's Living Marine Resources Program (Award Number N0002520WR0141R).
Conflict of Interest
The authors declare that the research was conducted in the absence of any commercial or financial relationships that could be construed as a potential conflict of interest.
Acknowledgments
The authors would like to thank Glenn Ierley, Ana Širović, and Peter Dugan for their feedback which helped improve this manuscript.
Supplementary Material
The Supplementary Material for this article can be found online at: https://www.frontiersin.org/articles/10.3389/fmars.2020.587110/full#supplementary-material
References
Archer, F. I., Rankin, S., Stafford, K. M., Castellote, M., and Delarue, J. (2019). Quantifying spatial and temporal variation of North Pacific fin whale (Balaenoptera physalus) acoustic behavior. Mar. Mamm. Sci. 36, 224–245. doi: 10.1111/mms.12640
Barlow, J., Calambokidis, J., Falcone, E. A., Baker, C. S., Burdin, A. M., Clapham, P. J., et al. (2011). Humpback whale abundance in the North Pacific estimated by photographic capture-recapture with bias correction from simulation studies. Mar. Mamm. Sci. 27, 793–818. doi: 10.1111/j.1748-7692.2010.00444.x
Bradford, A. L., Forney, K. A., Oleson, E. M., and Barlow, J. (2017). Abundance estimates of cetaceans from a line-transect survey within the U.S. Hawaiian Islands Exclusive Economic Zone. Fish. Bull. 115, 129–142. doi: 10.7755/FB.115.2.1
Carretta, J. V., Forney, K. A., Oleson, E. M., Weller, D. W., Lang, A. R., Baker, J., et al. (2018). U.S. Pacific Marine Mammal Stock Assessments: 2017. NOAA Technical Memorandum NMFS-SWFSC-602, U.S. Department of Commerce.
Castellote, M., Clark, C. W., and Lammers, M. O. (2012). Fin whale (Balaenoptera physalus) population identity in the western Mediterranean Sea. Mar. Mamm. Sci. 28, 325–344. doi: 10.1111/j.1748-7692.2011.00491.x
Center for Conservation Bioacoustics (2019). Raven Pro: Interactive Sound Analysis Software (Version 1.6.1). Ithaca, NY: The Cornell Lab of Ornithology. Available online at: http://ravensoundsoftware.com/
Charif, R. A., Mellinger, D. K., Dunsmore, K. J., Fristrup, K. M., and Clark, C. W. (2002). Estimated source levels of fin whale (Balaenoptera physalus) vocalizations: adjustments for surface interference. Mar. Mamm. Sci. 18, 81–98. doi: 10.1111/j.1748-7692.2002.tb01020.x
Clark, C. W., Borsani, J. F., and Notarbartolo-Di-Sciara, G. (2002). Vocal activity of fin whales, Balaenoptera physalus, in the Ligurian Sea. Mar. Mamm. Sci. 18, 286–295. doi: 10.1111/j.1748-7692.2002.tb01035.x
Crane, N. L., and Lashkari, K. (1996). Sound production of gray whales, Eschrichtius robustus, along their migration route: a new approach to signal analysis. J. Acoust. Soc. Am. 100, 1878–1886. doi: 10.1121/1.416006
Croll, D. A., Clark, C. W., Acevedo, A., Tershy, B., Flores, S., Gedamke, J., et al. (2002). Only male fin whales sing loud songs. Nature 417:809. doi: 10.1038/417809a
Delarue, J., Martin, B., Hannay, D., and Berchok, C. L. (2013). Acoustic occurrence and affiliation of fin whales detected in the northeastern Chukchi Sea, July to October 2007-10. Arctic 66, 159–172. doi: 10.14430/arctic4287
Delarue, J., Todd, S. K., Van Parijs, S. M., and Di Iorio, L. (2009). Geographic variation in Northwest Atlantic fin whale (Balaenoptera physalus) song: implications for stock structure assessment. J. Acoust. Soc. Am. 125, 1774–1782. doi: 10.1121/1.3068454
Garland, E. C., Goldizen, A. W., Rekdahl, M. L., Constantine, R., Garrigue, C., Hauser, N. D., et al. (2011). Dynamic horizontal cultural transmission of humpback whale song at the ocean basin scale. Curr. Biol. 21, 687–691. doi: 10.1016/j.cub.2011.03.019
Guazzo, R. A., Helble, T. A., Alongi, G. C., Durbach, I. N., Martin, C. R., Martin, S. W., et al. (2020). Lombard effect: humpback whale song source levels increase as ambient ocean noise levels increase. J. Acoust. Soc. Am. 148, 542–555. doi: 10.1121/10.0001669
Harris, D. V., Miksis-Olds, J. L., Vernon, J. A., and Thomas, L. (2018). Fin whale density and distribution estimation using acoustic bearings derived from sparse arrays. J. Acoust. Soc. Am. 143, 2980–2993. doi: 10.1121/1.5031111
Hatch, L. T., and Clark, C. W. (2004). “Acoustic differentiation between fin whales in both the North Atlantic and North Pacific Oceans, and integration with genetic estimates of divergence,” in Paper SC/56/SD8 Presented to the International Whaling Commission Scientific Committee (Sorrento).
Helble, T. A., Guazzo, R. A., Martin, C. R., Durbach, I. N., Alongi, G. C., Martin, S. W., et al. (2020). Lombard effect: minke whale call source levels vary with natural variations in ocean noise. J. Acoust. Soc. Am. 147, 698–712. doi: 10.1121/10.0000596
Helble, T. A., Henderson, E. E., Ierley, G. R., and Martin, S. W. (2016). Swim track kinematics and calling behavior attributed to Bryde's whales on the Navy's Pacific Missile Range Facility. J. Acoust. Soc. Am. 140, 4170–4177. doi: 10.1121/1.4967754
Helble, T. A., Ierley, G. R., D'Spain, G. L., and Martin, S. W. (2015). Automated acoustic localization and call association for vocalizing humpback whales on the Navy's Pacific Missile Range Facility. J. Acoust. Soc. Am. 137, 11–21. doi: 10.1121/1.4904505
Helble, T. A., Ierley, G. R., D'Spain, G. L., Roch, M. A., and Hildebrand, J. A. (2012). A generalized power-law detection algorithm for humpback whale vocalizations. J. Acoust. Soc. Am. 131, 2682–2699. doi: 10.1121/1.3685790
Klay, J., Mellinger, D. K., Moretti, D. J., Martin, S. W., and Roch, M. A. (2015). Advanced Methods for Passive Acoustic Detection, Classification, and Localization of Marine Mammals. Technical report, Office of Naval Research, Arlington, VA (accessed January 22, 2020). doi: 10.21236/ADA616403
McDonald, M. A., and Fox, C. G. (1999). Passive acoustic methods applied to fin whale population density estimation. J. Acoust. Soc. Am. 105, 2643–2651. doi: 10.1121/1.426880
McDonald, M. A., Hildebrand, J. A., and Webb, S. C. (1995). Blue and fin whales observed on a seafloor array in the Northeast Pacific. J. Acoust. Soc. Am. 98, 712–721. doi: 10.1121/1.413565
Nieukirk, S. L., Stafford, K. M., Mellinger, D. K., Dziak, R. P., and Fox, C. G. (2004). Low-frequency whale and seismic airgun sounds recorded in the mid-Atlantic ocean. J. Acoust. Soc. Am. 115, 1832–1843. doi: 10.1121/1.1675816
Noad, M. J., Cato, D. H., Bryden, M. M., Jenner, M., and Jenner, K. C. S. (2000). Cultural revolution in whale songs. Nature 408:537. doi: 10.1038/35046199
Notarbartolo di Sciara, G., Castellote, M., Druon, J.-N., and Panigada, S. (2016). Chapter three - Fin whales, Balaenoptera physalus: at home in a changing Mediterranean Sea? Adv. Mar. Biol. 75–101. doi: 10.1016/bs.amb.2016.08.002
Oleson, E. M., Širović, A., Bayless, A. R., and Hildebrand, J. A. (2014). Synchronous seasonal change in fin whale song in the North Pacific. PLoS ONE 9:e115678. doi: 10.1371/journal.pone.0115678
Pereira, A., Harris, D., Tyack, P., and Matias, L. (2020). Fin whale acoustic presence and song characteristics in seas to the southwest of Portugal. J. Acoust. Soc. Am. 147, 2235–2249. doi: 10.1121/10.0001066
Rankin, S., and Barlow, J. (2007). Vocalizations of the sei whale Balaenoptera borealis off the Hawaiian Islands. Bioacoustics 16, 137–145. doi: 10.1080/09524622.2007.9753572
Širović, A., Hildebrand, J. A., and Wiggins, S. M. (2007). Blue and fin whale call source levels and propagation range in the Southern Ocean. J. Acoust. Soc. Am. 122, 1208–1215. doi: 10.1121/1.2749452
Širović, A., Oleson, E. M., Buccowich, J., Rice, A., and Bayless, A. R. (2017). Fin whale song variability in southern California and the Gulf of California. Sci. Rep. 7:10126. doi: 10.1038/s41598-017-09979-4
Soule, D. C., and Wilcock, W. S. D. (2013). Fin whale tracks recorded by a seismic network on the Juan de Fuca Ridge, Northeast Pacific Ocean. J. Acoust. Soc. Am. 133, 1751–1761. doi: 10.1121/1.4774275
Stimpert, A. K., DeRuiter, S. L., Falcone, E. A., Joseph, J., Douglas, A. B., Moretti, D. J., et al. (2015). Sound production and associated behavior of tagged fin whales (Balaenoptera physalus) in the Southern California Bight. Anim. Biotelem. 3:23. doi: 10.1186/s40317-015-0058-3
Thompson, P. O., Findley, L. T., and Vidal, O. (1992). 20-Hz pulses and other vocalizations of fin whales, Balaenoptera physalus, in the Gulf of California, Mexico. J. Acoust. Soc. Am. 92, 3051–3057. doi: 10.1121/1.404201
Thompson, P. O., and Friedl, W. A. (1982). A long term study of low frequency sounds from several species of whales off Oahu, Hawaii. Cetology 45, 1–19.
Tremblay, C. J., Van Parijs, S. M., and Cholewiak, D. (2019). 50 to 30-Hz triplet and singlet down sweep vocalizations produced by sei whales (Balaenoptera borealis) in the western North Atlantic Ocean. J. Acoust. Soc. Am. 145, 3351–3358. doi: 10.1121/1.5110713
Varga, L. M., Wiggins, S. M., and Hildebrand, J. A. (2018). Behavior of singing fin whales Balaenoptera physalus tracked acoustically offshore of Southern California. Endanger. Species Res. 35, 113–124. doi: 10.3354/esr00881
Watkins, W. A. (1981). Activities and underwater sounds of fin whales. Sci. Rep. Whales Res. Inst. 33, 83–117.
Watkins, W. A., Tyack, P., Moore, K. E., and Bird, J. E. (1987). The 20-Hz signals of finback whales (Balaenoptera physalus). J. Acoust. Soc. Am. 82, 1901–1912. doi: 10.1121/1.395685
Weirathmueller, M. J., Stafford, K. M., Wilcock, W. S. D., Hilmo, R. S., Dziak, R. P., and Tréhu, A. M. (2017). Spatial and temporal trends in fin whale vocalizations recorded in the NE Pacific Ocean between 2003-2013. PLoS ONE 12:e0186127. doi: 10.1371/journal.pone.0186127
Weirathmueller, M. J., Wilcock, W. S. D., and Soule, D. C. (2013). Source levels of fin whale 20 Hz pulses measured in the Northeast Pacific Ocean. J. Acoust. Soc. Am. 133, 741–749. doi: 10.1121/1.4773277
Keywords: fin whale (Balaenoptera physalus), inter-pulse interval (IPI), calling rate, cue rate, bioacoustics, passive acoustic monitoring (PAM), marine ecology, inter-note interval (INI)
Citation: Helble TA, Guazzo RA, Alongi GC, Martin CR, Martin SW and Henderson EE (2020) Fin Whale Song Patterns Shift Over Time in the Central North Pacific. Front. Mar. Sci. 7:587110. doi: 10.3389/fmars.2020.587110
Received: 24 July 2020; Accepted: 07 October 2020;
Published: 29 October 2020.
Edited by:
Rebecca Dunlop, The University of Queensland, AustraliaReviewed by:
Denise Risch, Scottish Association for Marine Science, United KingdomManuel Castellote, Alaska Fisheries Science Center, United States
Erin M. Oleson, Pacific Islands Fisheries Science Center (NOAA), United States
Copyright © 2020 Helble, Guazzo, Alongi, Martin, Martin and Henderson. This is an open-access article distributed under the terms of the Creative Commons Attribution License (CC BY). The use, distribution or reproduction in other forums is permitted, provided the original author(s) and the copyright owner(s) are credited and that the original publication in this journal is cited, in accordance with accepted academic practice. No use, distribution or reproduction is permitted which does not comply with these terms.
*Correspondence: Tyler A. Helble, dHlsZXIuaGVsYmxlQG5hdnkubWls
†These authors have contributed equally to this work