 Yao Xiao1†
 Ting Xu1,2†
 Jin Sun1
 Yan Wang1
 Wai Chuen Wong1Yick Hang Kwan1
 Chong Chen3
 Jian-Wen Qiu2*
 Pei-Yuan Qian1*
- 1Department of Ocean Science and Hong Kong Branch of the Southern Marine Science and Engineering Guangdong Laboratory (Guangzhou), The Hong Kong University of Science and Technology, Hong Kong, China
- 2Department of Biology, Hong Kong Baptist University, Hong Kong, China
- 3X-STAR, Japan Agency for Marine-Earth Science and Technology (JAMSTEC), Yokosuka, Japan
Shinkaia crosnieri (Decapoda: Munidopsidae) is a squat lobster that dominates both deep-sea hydrothermal vent and methane seep communities in the Western Pacific. Previous studies comparing S. crosnieri living in these two types of habitats have suffered from methodological and/or sample size limits. Here, using transcriptome-wide single nucleotide polymorphisms (SNPs) markers from 44 individuals of S. crosnieri, we reveal the extent of genetic connectivity between a methane seep population in the South China Sea and a hydrothermal vent population in the Okinawa Trough, as well as their signatures of local adaptation. Analysis of differentially expressed genes (DEGs) between these two populations and population-specific genes (PSGs) revealed that a large number of unigenes, such as cytochrome P450 (CYP), glutathione S-transferase (GST) and peroxiredoxin 6 (Prdx6) related to oxidoreductase, and sulfur dioxygenase (ETHE1) and chondroitin 4-sulfotransferase 11 (CHST11) related to sulfur metabolism, showed opposite expression patterns in these two populations. Data subsampling in this study revealed that at least five individuals of S. crosnieri per site are required to generate reliable results from the differential gene expression analysis. Population genetic analyses based on 32,452 SNPs revealed clear genetic differentiation between these two populations with an FST value of 0.07 (p < 0.0005), and physical oceanographic modeling of the ocean currents in middle and deep layers also suggests a weak connection between these two sites. Analysis of outlier SNPs revealed 345 unigenes potentially under positive selection, such as sarcosine oxidase/L-pipecolate oxidase (PIPOX), alanine-glyoxylate transaminase/serine-glyoxylate transaminase/serine-pyruvate transaminase (AGXT), and Cu-Zn superoxide dismutase (SOD1). Among the differentially expressed genes and genes with amino acid substitutions between the two sites are those related to oxidation resistance and xenobiotic detoxification, indicating local adaptation to the specific environmental conditions of each site. Overall, exploring the population structure of S. crosnieri using transcriptome-wide SNP markers resulted in an improved understanding of its molecular adaptation and expression plasticity in vent and seep ecosystems.
Introduction
Deep-sea hydrothermal vents, often distributed along active mid-ocean ridges and back-arc spreading centers, are well known for discharging sulfur-rich geofluids into the water column (Corliss et al., 1979; German et al., 2000). Methane seeps, usually found along the continental margins and in trenches, typically release methane-rich geofluids from the seabed more slowly (Van Dover et al., 2002). These two types of ecosystems share some similar features, such as lack of light to support photosynthesis, high pressure, and high concentration of chemically reduced compounds as well as heavy metals (Levin, 2005; German et al., 2011). Nevertheless, a great number of macrobenthos flourish in these ‘extreme’ environments, forming high-biomass hotspots powered by chemosynthesis in the deep ocean. Over 700 species of macrobenthos have been recorded in the global hydrothermal vents and more than 600 in the methane seeps (German et al., 2011). However, only a small fraction of them inhabit both hydrothermal vents and methane seeps (Watanabe et al., 2010; Vrijenhoek, 2013), indicating that thriving in both types of environments requires specific adaptation and gene expression (Watanabe et al., 2010).
The Western Pacific is an ideal region for a comparative study of vent and seep populations due to their close proximity and the presence of 20% of all the recorded macrobenthos in both types of habitats (Watanabe et al., 2010). Kiel (2016) reported the Western Pacific as having the highest number of active, sedimentary back-arc vents in the world, which might provide a vital biogeographic link between vent and seep animals. Previous population genetic studies of deep-sea macrobenthos in the Western Pacific have mainly focused on macrobenthos with a planktotrophic larval stage, such as bathymodioline mussels (Kyuno et al., 2009; Miyazaki et al., 2010; Xu et al., 2017, 2018) and the deep-sea limpet Shinkailepas myojinensis (Yahagi et al., 2017). In this study, we aim to understand the population connectivity and local environmental adaptation of the squat lobster Shinkaia crosnieri (Decapoda: Munidopsidae), whose larvae are lecithotrophic and likely have a limited dispersal ability (Nakajima et al., 2018). Shinkaia crosnieri was initially discovered on the Edison Seamount vent field in the Bismarck Archipelago (Baba and Williams, 1998), and was later found in methane seeps in the South China Sea (SCS) and hydrothermal vents in the Okinawa Trough (OT), with a known bathymetric range between 700 and 2,200 m (Chan et al., 2000; Watanabe et al., 2010; Miyazaki et al., 2017a). The distribution pattern of S. crosnieri in terms of both habitat types and life-history trait makes it a suitable model for studies of population divergence and local adaptation under different environmental conditions.
Previous studies of S. crosnieri using the mitochondrial cytochrome c oxidase submit I (COI) gene (Yang et al., 2016) or three mitochondrial genes (COI, cytochrome b gene (Cytb), and 16S rRNA) (Shen et al., 2016) have revealed clear genetic differentiation between a methane seep population in the SCS and hydrothermal vent populations in the OT. Nevertheless, due to limited genomic coverage, a single to a few gene markers can hardly reflect the population divergence at the genome level and do not allow for the effective discovery of signatures of natural selection. Genome-wide single-nucleotide polymorphism (SNP) markers have the potential to resolve these issues (Xu et al., 2012). Recently, Cheng et al. (2020) obtained 12,963 genome-wide SNPs using restriction site associated DNA sequencing (RAD-Seq). By using these markers, they also revealed clear genetic divergence between a seep population of S. crosnieri in the SCS and a vent population in the OT. Nevertheless, RAD-Seq can only capture a reduced representation of the genome, and numerous SNP markers are located in non-coding regions (Pegadaraju et al., 2013; Houston et al., 2014). Indeed, Cheng et al. (2020) identified 54 outlier SNPs potentially under positive selection, but only five were in the protein-coding regions. More recently, Cheng et al. (2019) compared the transcriptomes of S. crosnieri collected from the same seep and vent populations, but with only three individuals from each population. They detected 545 differentially expressed genes (DEGs) and 82 protein-coding genes (PCGs) that have potentially undergone positive selection. However, the small sample size may have limited the statistical power for the detection of DEGs and PCGs.
In the present study, we sequenced the transcriptomes of a total of 44 S. crosnieri individuals, including 20 from a methane seep in the SCS and 24 from a hydrothermal vent in the OT. We identified DEGs between the two populations, population-specific genes (PSGs), transcriptome-wide SNP markers, and outlier SNP markers. We also conducted subsampling analyses to determine the number of individuals required to generate representative data for a meaningful population comparison. Our results not only provide new insights into the local adaptation and population genetics of S. crosnieri inhabiting both types of habitats, but also demonstrate how different techniques and sample sizes may affect these results.
Materials and Methods
Sample Collection
A total of 44 S. crosnieri individuals were used in this study. Among them, 10 were collected by the manned submersible Jiaolong from Jiaolong Ridge (also known as the F site), a methane seep (22°06.921′ N, 119°17.131′ E; 1,122 m deep) in the SCS in June 2013. Another set of 10 individuals were collected using the remotely operated vehicle (ROV) ROPOS on board the research vessel (R/V) Tan Kah Kee from the same site in April 2018. In addition, 24 individuals were collected using the ROV KAIKO (with vehicle Mk-IV) from the Sakai hydrothermal field (27°31.4749′ N, 126°59.021′ E; 1,550 m deep) (Nakamura et al., 2015) in the OT during the Japan Agency for Marine-Earth Science and Technology (JAMSTEC) R/V Kairei cruise KR15-17 in November 2015. Samples were frozen at −80°C upon recovery or fixed with RNAlater, and then shipped to the laboratory and stored at −80°C until use.
RNA Extraction and Sequencing
The gill, hepatopancreas, ovary, and abdominal muscle from one vent individual (OT_1), testis, and abdominal muscle from another vent individual (OT_2) and the abdominal muscles of the other 42 individuals (from SCS_1 to 20 and OT_3 to 24) were dissected for total RNA extraction using the TRIzol kit (Thermo Fisher Scientific, United States) according to the manufacturer’s protocol. The quantity and quality of RNA were examined using 1% agarose gel electrophoresis and NanoDrop 2000 (Thermo Fisher Scientific, United States), respectively. RNA libraries were constructed individually and sequenced on an Illumina HiSeq 2500 platform (PE150) by Novogene Bioinformatics Technology Co., Ltd., Beijing, China1.
Transcriptome Assembly, Completeness Assessment, and Functional Annotation
The quality of raw sequencing data was controlled using FASTQC2 and filtered using TRIMMOMATIC v.0.36 (Bolger et al., 2014). The parameters were leading: 10; trailing: 10; sliding window: 4:15; minlen: 25, and adapters: ILLUMINACLIP: TruSeq3-PE.fa:2:30:10. The resultant clean reads of the four tissues from OT_1, testis from OT_2 and abdominal muscle from SCS_3 (with maximum sequence data size of SCS individuals) were de novo assembled using Trinity v.2.8.3 (Grabherr et al., 2011) under default settings except the min_contig_length parameter was set to 300 and the min_kmer_cov was set to 2. The longest isoform of each gene cluster was selected using a custom Python script as a unigene. CD-HIT-EST (Fu et al., 2012) was used to remove redundant unigenes based on a similarity threshold of 95%. TransDecoder v.5.5.0 (Haas et al., 2013) was then applied to predict candidate open reading frames (ORFs) with the single_best_only option. BUSCO v.3.0 (Simão et al., 2015) was utilized to evaluate the completeness of the final assembly based on the metazoa_odb9 database, and the Perl script assemblathon_stats.pl (Bradnam et al., 2013) was run to evaluate the final assembly. The transcriptome from each individual was also assembled separately using the same Trinity parameters and CD-HIT was applied thereafter.
All obtained unigenes were searched against the NCBI non-redundant (NR) protein database using BLASTp v.2.7.1 (Altschul et al., 1990) with an E-value of 10–5, a word size of 3, a minimum alignment of 20, and max hsps of 20, and the resultant .xml file was fed into OmicsBox (Götz et al., 2008) to search for the Gene Ontology (GO) function. The UniProt database was scanned using BLASTp with an E-value of 10–5 and the online annotation KAAS-KEGG server3 applying the single-directional best hit method was used to search for the Kyoto Encyclopedia of Genes and Genomes (KEGG) annotation.
Differentially Expressed Genes (DEGs) and Population-Specific Genes (PSGs) Analyses
Kallisto (Bray et al., 2016) was used to quantify abundances of the assembled unigenes with a bootstrap value of 100. The gene expression level in transcripts per kilobase million (TPM) was further normalized with the TMM method in edgeR (Robinson et al., 2010). The correlation between individuals and normalized TPM was determined by principal component analysis (PCA) implemented in the R package DESeq2 (Love et al., 2014). Genes without expression were removed, and the average TPM of each contig was calculated individually within each sampling site. The Differential expression analysis was conducted via the web portal RNA-seq 2G (Zhang et al., 2017) using the DESeq2 method with a minimal read count of 10. Unigenes with an absolute value of fold change greater than 2 and a false discovery rate (FDR) less than 0.05 were considered as DEGs. Partial DEGs were visualized by Morpheus4.
Quantitative real-time reverse transcription-PCR (qRT-PCR) was performed to validate the expression levels of selected genes. Primers for qRT-PCR were designed utilizing the online NCBI Primer-BLAST tool5 with sequences given in Supplementary Table 1. Total RNA of two individuals (SCS_23 and OT_3) were extracted with the TRIzol kit (Thermo Fisher Scientific, United States) and reverse transcription from RNA to single-stranded cDNA was conducted using the High Capacity cDNA Reverse Transcription Kit (Thermo Fisher Scientific, United States). The SYBR Green PCR Master Mix (Thermo Fisher Scientific, United States) was utilized with synthesized cDNA to conduct qPCR reaction on a LightCycler 480 Instrument II (Roche, Switzerland). The relative fold change in the expression of selected genes was calculated by the 2–ΔΔCt method using actin as an internal standard gene. The correlation coefficient (r2) between expression of qRT-PCR and that of RNA-Seq was analyzed in Excel.
Gene Ontology enrichment analysis of DEGs was performed with Fisher’s Exact Test in OmicsBox v1.3.116. KEGG pathway enrichment analysis was performed via Enrichr (Chen et al., 2013). In both enrichment analyses the significant enrichment level was set to 0.05.
The transcriptome data for individuals collected from the two sampling sites were compared, adopting the same Kalisto and RNA-seq 2G parameters as mentioned above. The groups of orthologous genes of each individual transcriptome were detected using Proteinortho v.6.0b (Lechner et al., 2011). PSGs were defined as the unigenes shared among at least 90% of the individuals from one site but among less than 10% of the individuals from the other site (Parra et al., 1998; Belcaid et al., 2019). PSGs were annotated according to the NCBI NR and KEGG databases. The KEGG pathway of PSGs was reconstructed using KEGG Mapper7.
Statistical power of different sample sizes used for the identification of DEGs was tested by a subsampling approach. In brief, a total of 3, 5, 10, and 15 individuals were randomly selected from each habitat to identify DEGs using the methods detailed in this section. Afterward, comparison was conducted to determine an appropriate sample size for the reliable DEGs. In addition, DEGs obtained in our study were also compared with those reported in Cheng et al. (2019).
Identification of Transcriptome-Wide SNP Markers
Raw reads of each individual were trimmed using Trimmomatic v.0.36 (see section “Transcriptome Assembly, Completeness Assessment, and Functional Annotation” for the settings). Filtered reads of each individual were mapped to the assembled transcriptome using Bowtie2 (Langmead and Salzberg, 2012) with a maximum fragment length of 1,200 (–maxins 1200), a seed of 20 (−D 20), re-seed reads twice (−R 2), a mismatch number of 1 (−N 1), a seed length of 18 (−L 18), and an interval between seeds of S,1,0.50. The generated .sam files were converted to the .bam format and sorted by SAMtools v.1.8 (Li et al., 2009). PCR duplicates were removed using Picard MarkDuplicates8. Then, the mpileup function implemented in SAMtools was applied to generate .bcf files with the following settings: 10 for minimum mapping quality for an alignment (−q 10) and 20 for minimum base quality (−Q 20). SNPs were identified using the call function implemented in BCFtools v.1.9 (Li, 2011) with the default settings along with the options −mv and −Ov. The obtained .vcf file for each individual was then sorted using VCFtools v.0.1.13 (Danecek et al., 2011) and the .vcf files of all the individuals were combined into a single file using the merge function in BCFtools v.1.9.
Filtering of SNPs was carried out using VCFtools v.0.1.13 with the following criteria: (1) retaining only bi-allelic sites (–min-alleles 2 –max-alleles 2); (2) with a minor allele frequency (MAF) greater than or equal to 0.02 (–maf 0.02); (3) excluding sites with indels (–remove-indels); (4) excluding sites not conforming to Hardy–Weinberg equilibrium with a p-value threshold of 0.01; (5) retaining SNPs successfully genotyped in at least 50% of all individuals (–max-missing 0.5); and (6) retaining SNPs with a sequencing depth greater than 3 and less than 120 (–minDP 3 and –maxDP 120).
Statistical power of different sample sizes selected to identify SNPs was tested via a subsampling approach as well. In brief, a total of 3, 5, and 10 individuals were randomly selected from each habitat to identify SNPs using the methods described above. Afterward, the SNP numbers were compared to evaluate the impact of sample sizes on SNP detection.
Detection and Annotation of Outlier SNPs
Two methods were adopted to detect outlier SNPs. First, a coalescent method implemented in Arlequin v.3.5 (Excoffier and Lischer, 2010) was used for outlier detection by running 20,000 simulations with 100 simulated demes per group, and SNPs with a p-value < 0.05 were considered as the Arlequin outliers. Second, a multivariate analysis was implemented in the R package pcadapt (Luu et al., 2017) for outlier identification, and SNPs with an adjusted p-value < 0.1 from the Benjamini–Hochberg procedure were considered as the pcadapt outliers. Outliers detected by both methods were retained and used for GO enrichment and KEGG enrichment analyses using the same approaches described in the Section “Differentially Expressed Genes and Population-Specific Genes”.
Population Genetic Analyses Based on the Entire and the Outlier SNP Dataset and Physical Oceanographic Modeling
Genetic differentiation was evaluated using the pairwise Fst statistic via Arlequin v.3.5.2.2 with the default settings based on both the entire and the outlier SNP datasets. Population structure was examined using the maximum-likelihood estimation method implemented in ADMIXTURE v1.3 (Alexander et al., 2009) and PCA implemented in the R package SNPRelate (Zheng et al., 2012) using single SNP per locus of both the entire and the outlier SNP datasets. The .ped, .map, and .bed format files (Alexander et al., 2015) required by the ADMIXTURE analysis were transformed based on the combined .vcf file of all the individuals using PLINK v.2.00a2LM (Purcell et al., 2007) with the –allow-extra-chr option. The number of ancestral populations (i.e., the K value) in ADMIXTURE was predefined from 1 to 3. When K was set to 2, the divergence was between sites. Population structure was visualized using the function bar plot in R based on the best K value. The relative migration pattern of all samples was estimated via divMigrate in the R package diveRsity (Keenan et al., 2013) using the DJost statistic as a measure of genetic distance and a bootstrap value of 1,000. To validate population genetics results against physical oceanographic model of larval drift, we inferred the annual-mean lateral ocean currents from the HYCOM + NCODA Global 1/12° Reanalysis (experiment sequence: 53.X) data9, which has assimilated multiple sources of available observational records of the ocean.
Results
Transcriptome Assembly, Completeness, and Annotation
A total of 3.93 Gb of paired-end clean reads of abdominal muscle from one SCS individual (SCS_3) and 10.96 Gb of paired-end clean reads of five tissues (gill, ovary, abdominal muscle, hepatopancreas, and testis) from two OT individuals (OT_1 and OT_2) (Supplementary Table 2) were obtained after quality control and were used for transcriptome reference assembly. The detailed sequencing statistics of the abdominal muscle from these individuals are summarized in Supplementary Table 3. De novo assembly and data filtering resulted in 29,273 unigenes. The assembled transcriptome had a contig N50 of 2,690 bp and a mean contig size of 1,615 bp. The contig length ranged from 301 to 29,765 bp. BUSCO analysis revealed that the transcriptome contained 89.7% complete plus 3.1% fragmented conserved metazoan genes.
A total of 19,743 (67.44%) unigenes had at least one significant hit in the NR, UniProt, KEGG, or GO database. In total, 7,044 (24.06%) unigenes were annotated according to the GO database and assigned to three major GO categories according to GO level three in OmicsBox: biological process (BP, 707, 2.42%), molecular function (MF, 1,394, 4.76%), and cellular component (CC, 1,589, 5.43%) (Supplementary Figure 1A). Specifically, in the category of BP, MF, and CC, ‘organic substance metabolic process’ (GO: 0071704), ‘organic cyclic compound binding’ (GO: 0097159), and ‘organelle’ (GO: 0043226) were the top most abundant subcategories, respectively. Furthermore, 8,707 (29.7%) unigenes were mapped to 295 KEGG pathways, with ‘thermogenesis,’ ‘endocytosis,’ and ‘RNA transport’ being the top three most abundant pathways (Supplementary Figure 1B).
PSGs and DEGs Between the SCS and OT Populations
De novo transcriptome assembly for each individual produced an average of 38,707 transcripts with statistical details presented in Supplementary Table 4. Specifically, a total of 61 (0.16%) and 51 (0.13%) SCS and OT PSGs were identified in our study and their KEGG and NR annotations are presented in Supplementary Table 5. Among them, 10 SCS-PSGs were mapped to 18 KEGG pathways, such as ‘propanoate metabolism’ (ko00640), ‘spliceosome’ (ko03040), and ‘focal adhesion’ (ko04510). Meanwhile, 13 OT-PSGs were mapped to 26 KEGG pathways, such as ‘drug metabolism – cytochrome P450’ (ko00982), ‘peroxisome’ (ko04146), and ‘glycosaminoglycan biosynthesis - chondroitin sulfate/dermatan sulfate’ (ko00532).
Results of PCA based on the unigene expression matric revealed that all the SCS seep individuals were separated from all the OT vent individuals along the first eigenvector (Figure 1A). Further analyses showed that a total of 4,854 (16.6%) unigenes were differentially expressed between S. crosnieri from the SCS and the OT. Among them, 2,597 (8.87%) unigenes showed higher expression levels in the SCS than in the OT, whereas 2,257 (7.71%) had higher expression levels in the OT than in the SCS. Relationship between the FDR and fold change for all DEGs is illustrated in Figure 1B. Expression heatmap and hierarchical clustering analysis of 29 DEGs involved in oxidative activity, metabolism of xenobiotics by cytochrome P450, sulfur metabolism, and methane metabolism are presented in Figure 2 and their mean expression levels in the SCS and OT as well as functional annotations are given in Supplementary Table 6. Furthermore, qRT-PCR and RNA-Seq data are highly correlated (R2 = 0.97) (Supplementary Figure 2), indicating the robustness of our DEG analyses.
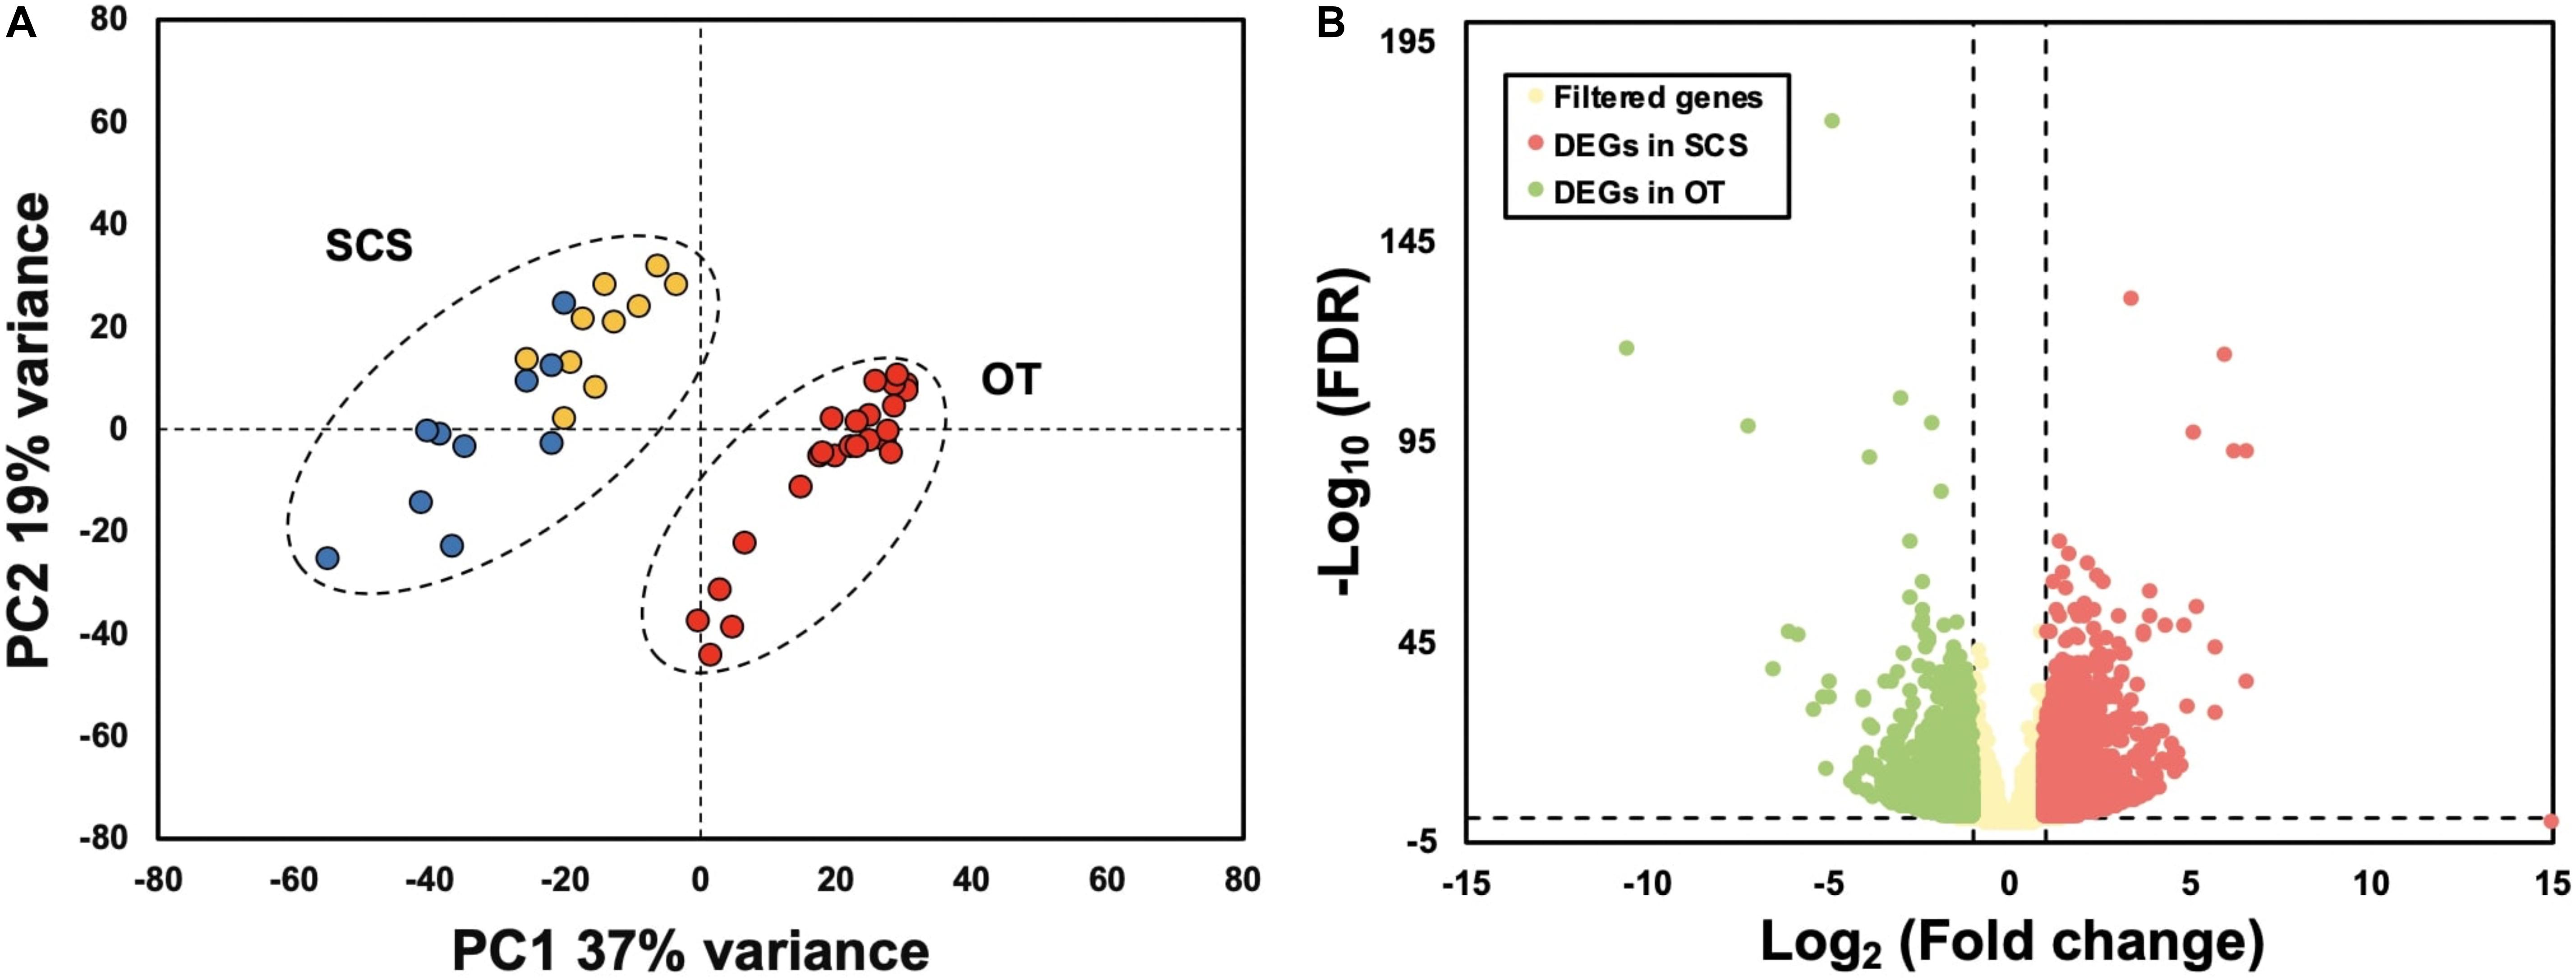
Figure 1. (A) Principal component analysis (PCA) based on gene expression matric of all individuals shows complete separation between individuals from the South China Sea (SCS) and the Okinawa Trough (OT). Red dots indicate samples collected from the OT, and yellow and blue dots indicate samples collected from SCS in 2013 and 2018, respectively. (B) Relationship between FDR and fold change. Red and green dots represent up-regulated genes in the SCS and the OT, respectively. Yellow dots indicate non-DEGs. Vertical dotted lines: log2 (Fold change) = 1 and –1; horizontal dotted line: –log10 (FDR) = 0.05.
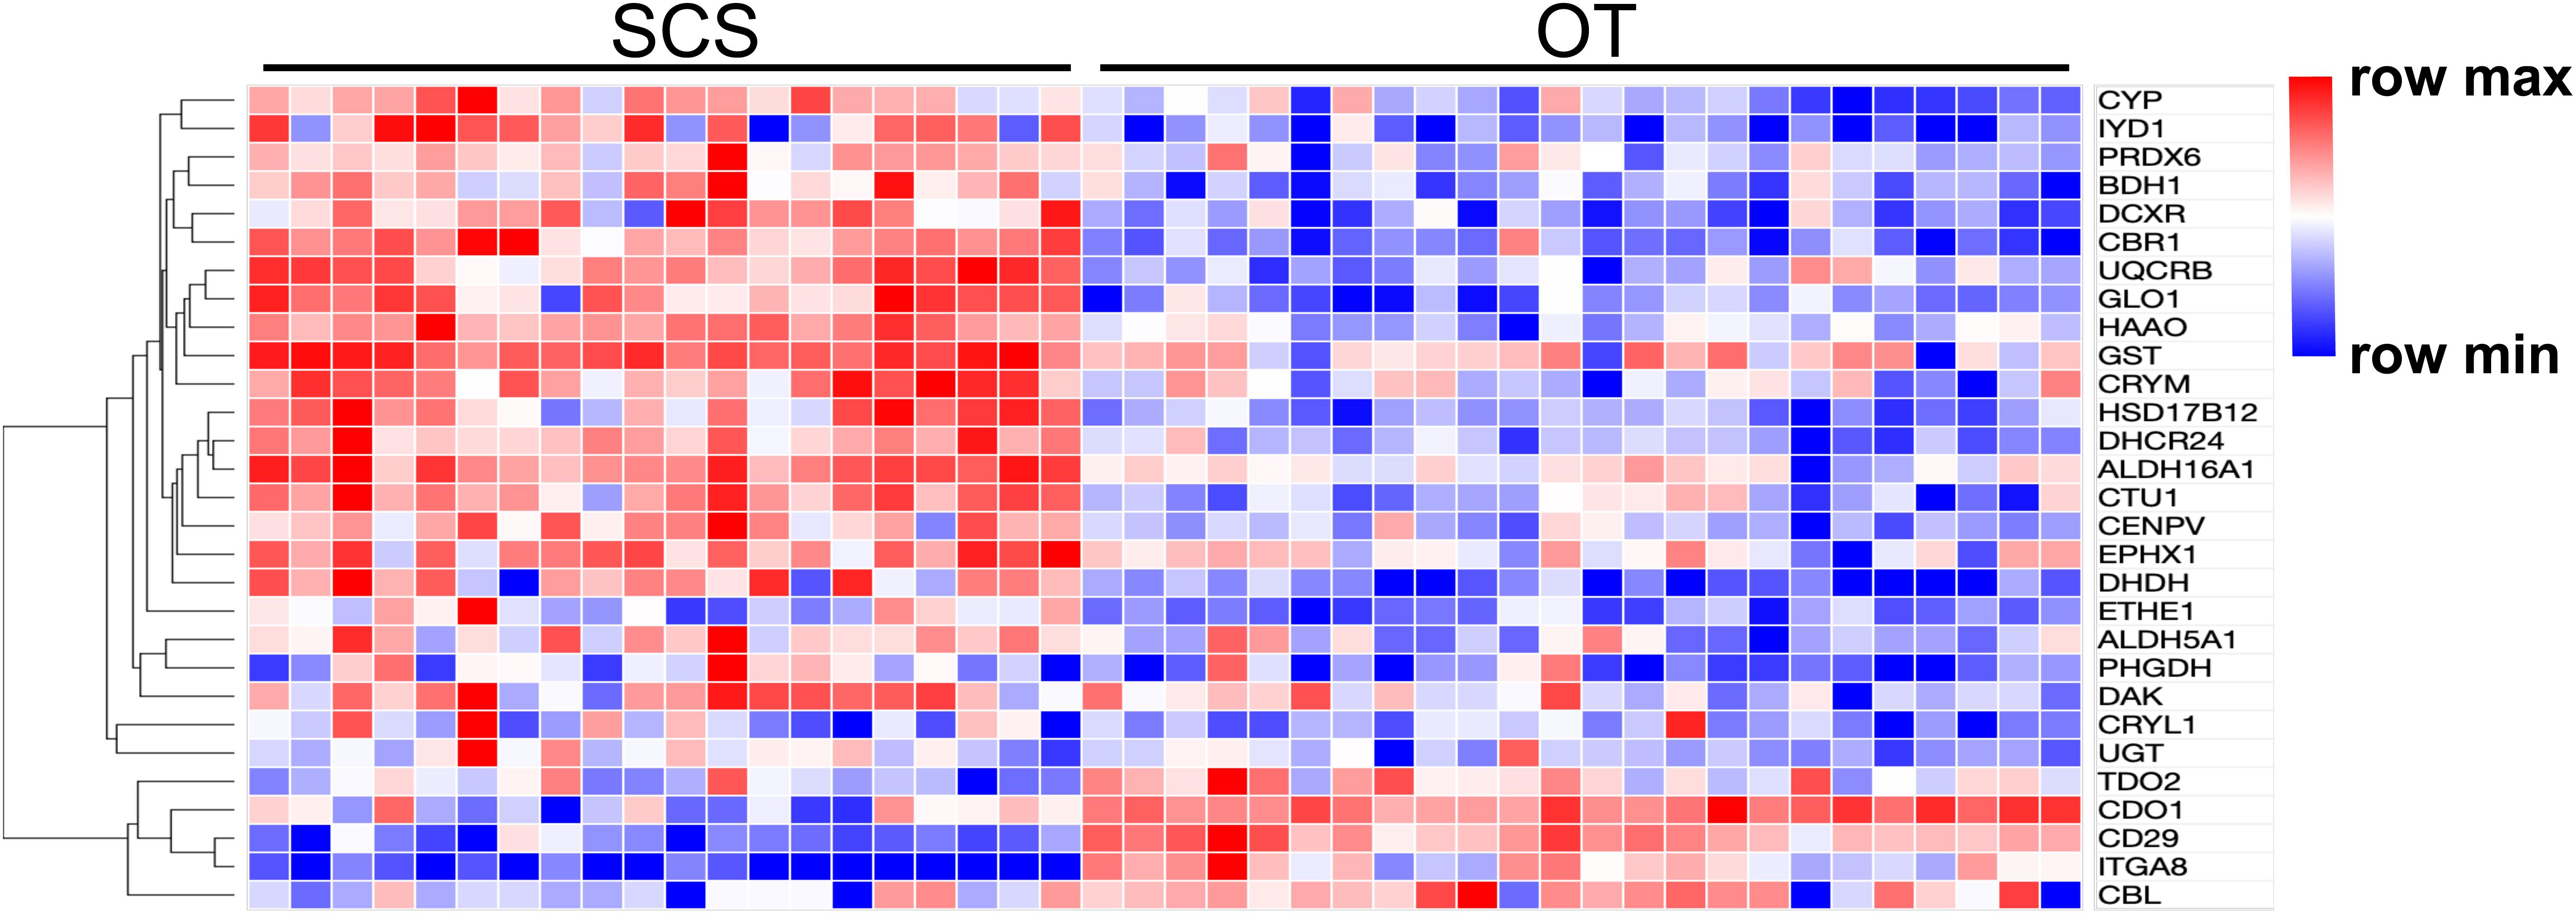
Figure 2. Heatmap and hierarchical clustering analysis of 29 DEGs between the SCS and the OT. The color code represents the gene expression level based on the Log-transformed values. Red color indicates higher expression, whereas blue color indicates lower expression.
There were 40 and 32 subcategories enriched in the SCS seep population and the OT vent population, respectively, by GO enrichment analysis (Supplementary Figure 3A). The top three enriched categories in the seep population were ‘translation’ (GO: 0006412), ‘structural constituent of ribosome’ (GO: 0003735), and ‘polymeric cytoskeletal fiber’ (GO: 0099513); and those in the vent population were ‘adenyl ribonucleotide binding’ (GO: 0032559), ‘motor activity’ (GO: 0003774), and ‘myosin complex’ (GO: 0016459). Additionally, more (40 vs. 32) subcategories were enriched in the seep population than in the vent population. For instance, ‘oxidoreductase activity, oxidizing metal ions, NAD or NADP as acceptor’ (GO: 0016723) was one of the representative subcategories in the seep population, which included metalloreductase (STEAP3). procollagen-lysine,2-oxoglutarate 5-dioxygenase (PLOD), tryptophan 2,3-dioxygenase (TDO2), 4-hydroxyphenylpyruvate dioxygenase (HPPD), cysteine dioxygenase (CDO1), and prolyl 4-hydroxylase (P4HA) belonged to the ‘dioxygenase activity’ (GO: 0051213) subcategory that was enriched in the vent population. A total of 692 unigenes upregulated in the seep population had KEGG annotations, while 589 unigenes upregulated in the vent population were annotated. The results of KEGG pathway-enriched analysis showed six significantly enriched pathways in the seep population including ‘glycosaminoglycan biosynthesis – chondroitin sulfate/dermatan sulfate’ (ko00532), ‘pentose and glucuronate interconversions’ (ko00040), and ‘RNA transport’ (ko03013), while eight significantly enriched pathways were detected in the vent population including ‘axon guidance’ (ko04360), ‘amino sugar and nucleotide sugar metabolism’ (ko00520), and ‘bacterial invasion of epithelial cells’ (ko05100) (Table 1).
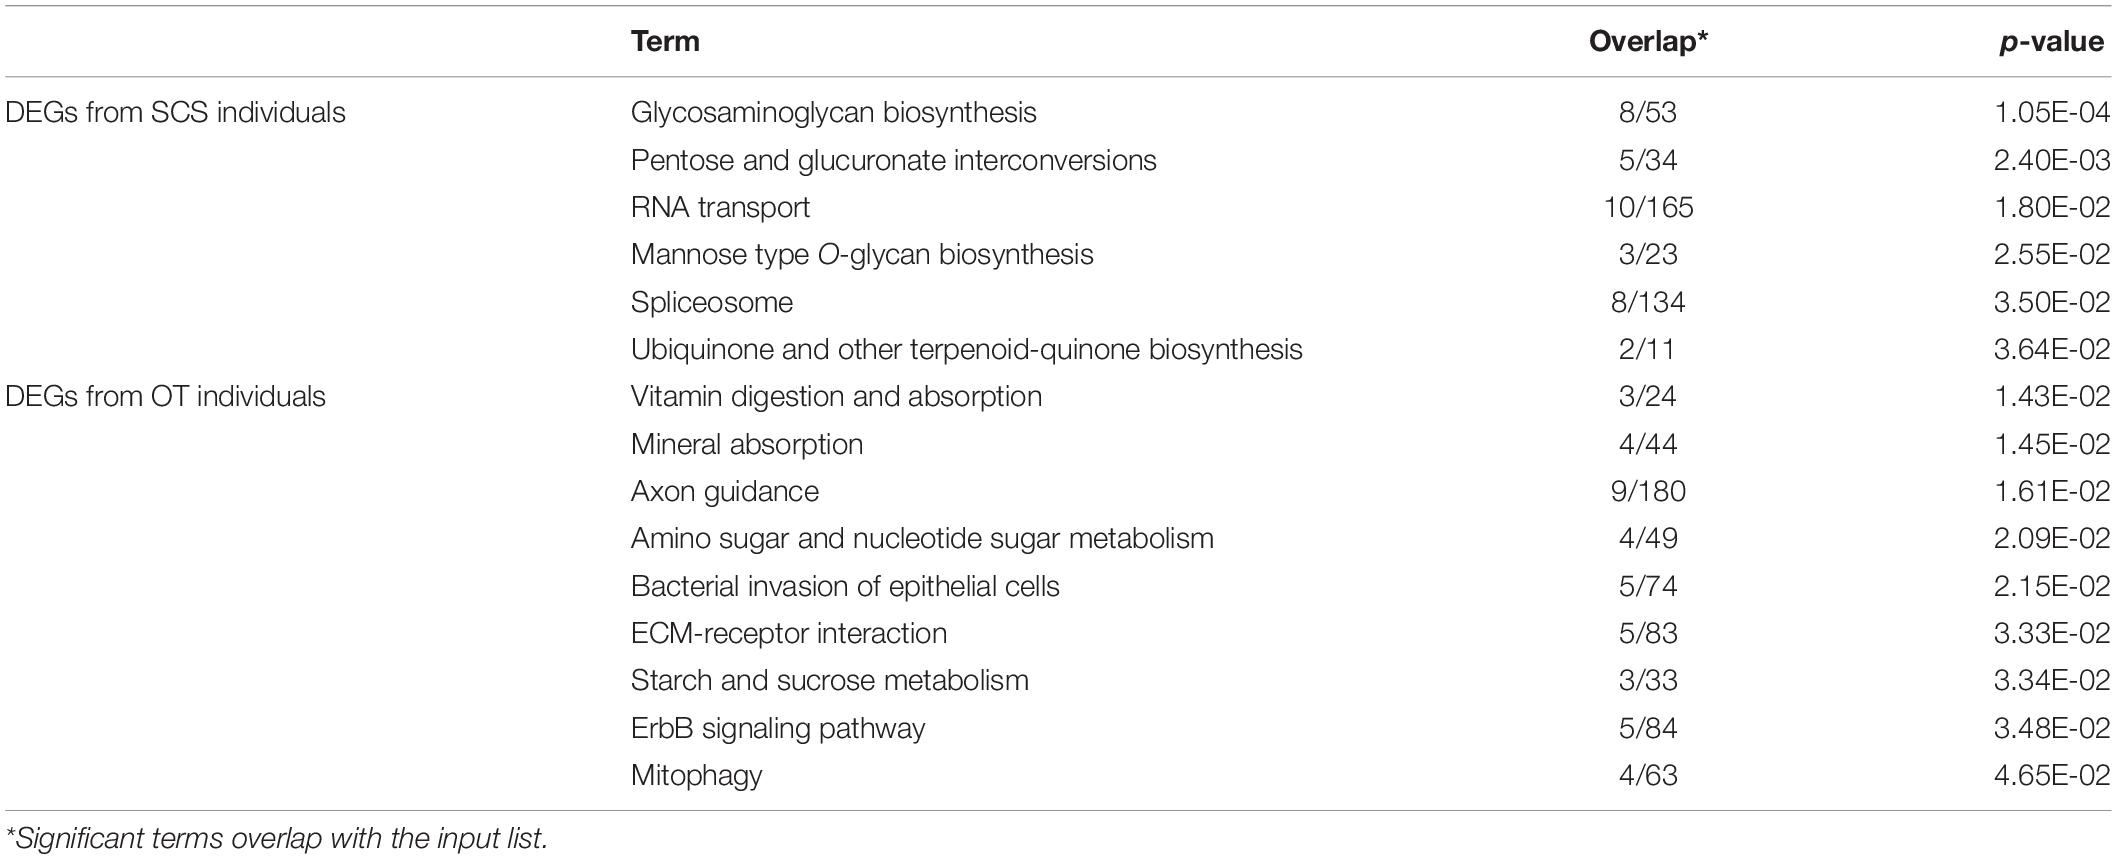
Table 1. KEGG enrichment analysis of all DEGs between S. crosnieri individuals from the SCS and those from the OT.
SNP Identification and Outlier SNP Characterization
After genotyping and stringent data filtering (Table 2), a total of 32,452 transcriptome-wide SNPs located in 8,667 unigenes were obtained and subjected to downstream analyses. Outlier screening tests resulted in 1,065 Arlequin outliers and 1,307 pcadapt outliers, with 504 outliers identified by both approaches (Figure 3A). These 504 outlier SNPs (Figure 3B) were located in 345 unigenes and GO enrichment analysis of these unigenes resulted in the discovery of 27 enriched categories (Supplementary Figure 3B). Among them, the top category for all, as well as molecular function, was ‘ATP binding’ (GO: 0070403), and the second and third categories of MF were ‘calcium ion binding’ (GO: 0005509) and ‘zinc ion binding’ (GO: 0008270), respectively. The category of ‘calcium ion binding’ includes myosin light chain 6 and 12 (MYL6 and MYL12), chloride intracellular channel protein 2 (CLIC2), Plastin-2 (PLSL) and serine/threonine-protein phosphatase 2A regulatory subunit B” subunit alpha (PPP2R3A); the category of ‘zinc ion binding’ includes NAD-dependent protein deacylase 2 and 5 (SIRT2 and SIRT5), glycine hydroxymethyltransferase (GlyA) and chitin deacetylase 1 (CDA1). The annotations and partial functions of the nine metal ion binding related genes using the published literature are presented in Table 3.
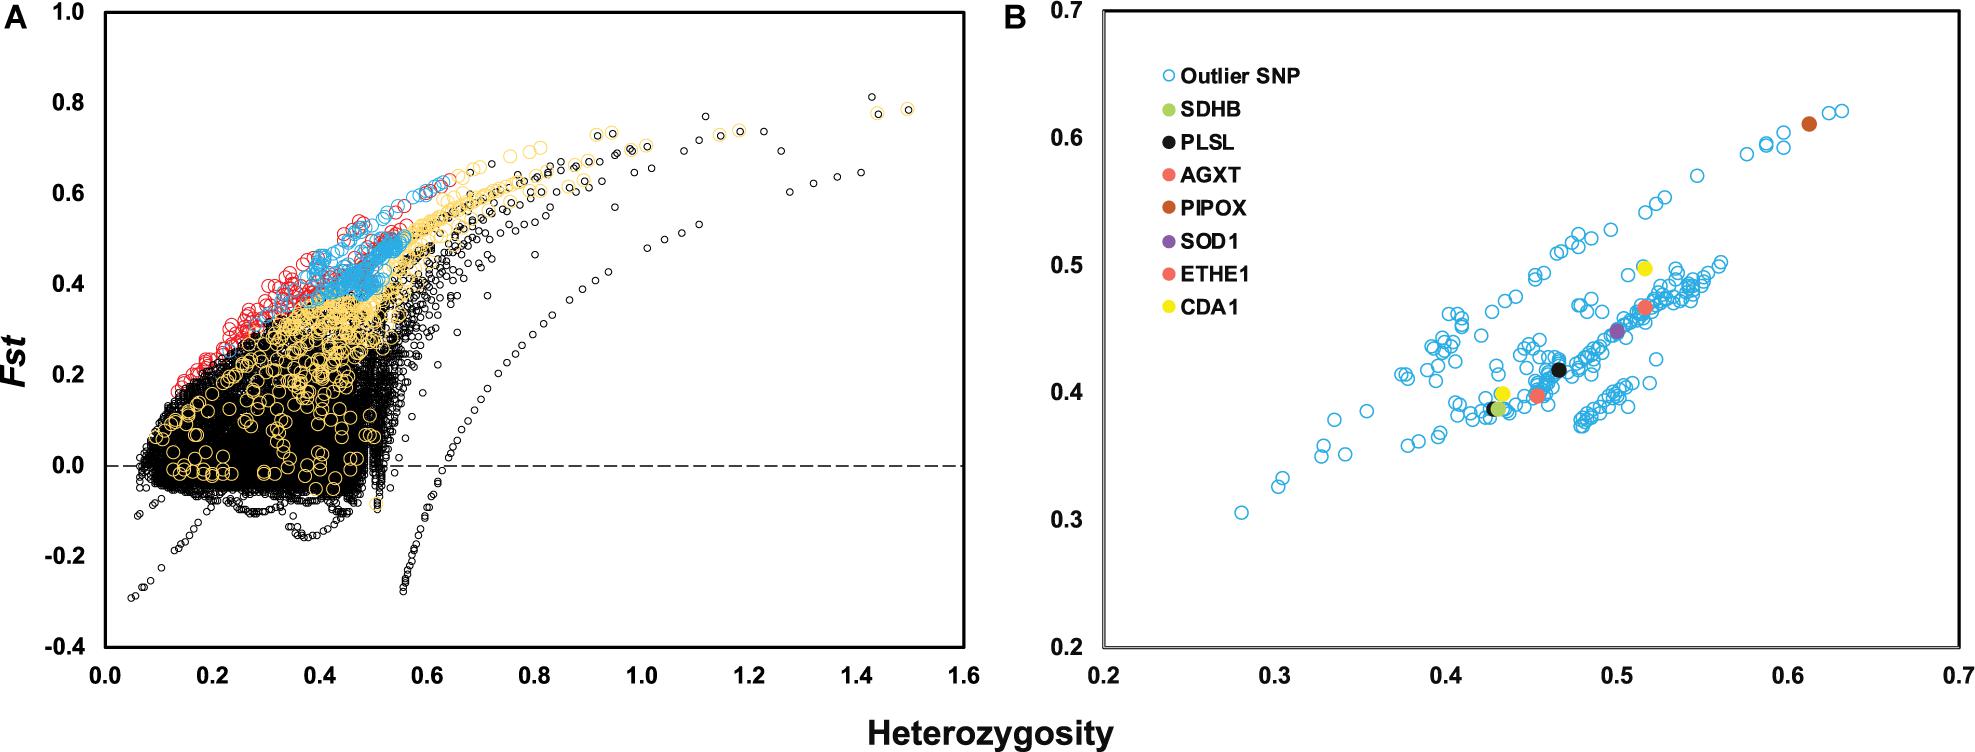
Figure 3. (A) Locus-specific Fst is plotted against observed heterozygosity (Heterozygosity) with black circles indicating neutral SNPs, red circles indicating outlier SNPs only identified by Arlequin, yellow circles indicating outlier SNPs only identified by PCAdapt and blue circles indicating overlapped outlier SNPs identified by two methods. (B) A total of 504 outlier SNPs is plotted based on observed heterozygosity and locus-specific Fst value with seven genes highlighted with different colors.
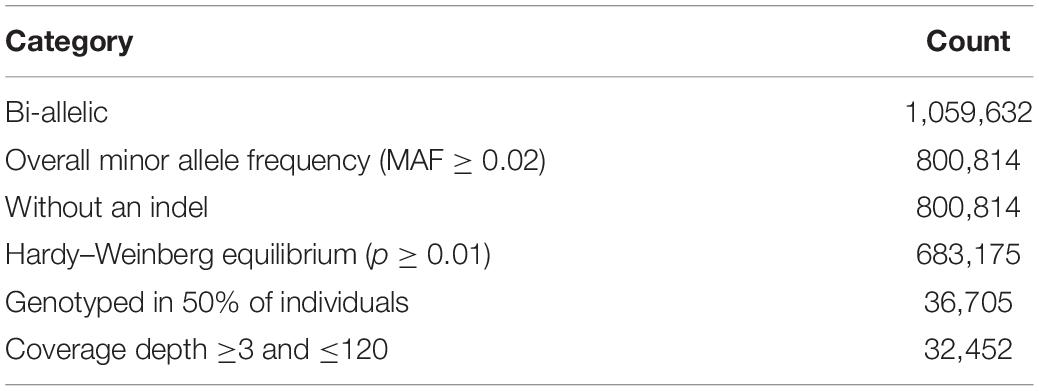
Table 2. Number of filtering SNP candidates retained after each step of filtering.
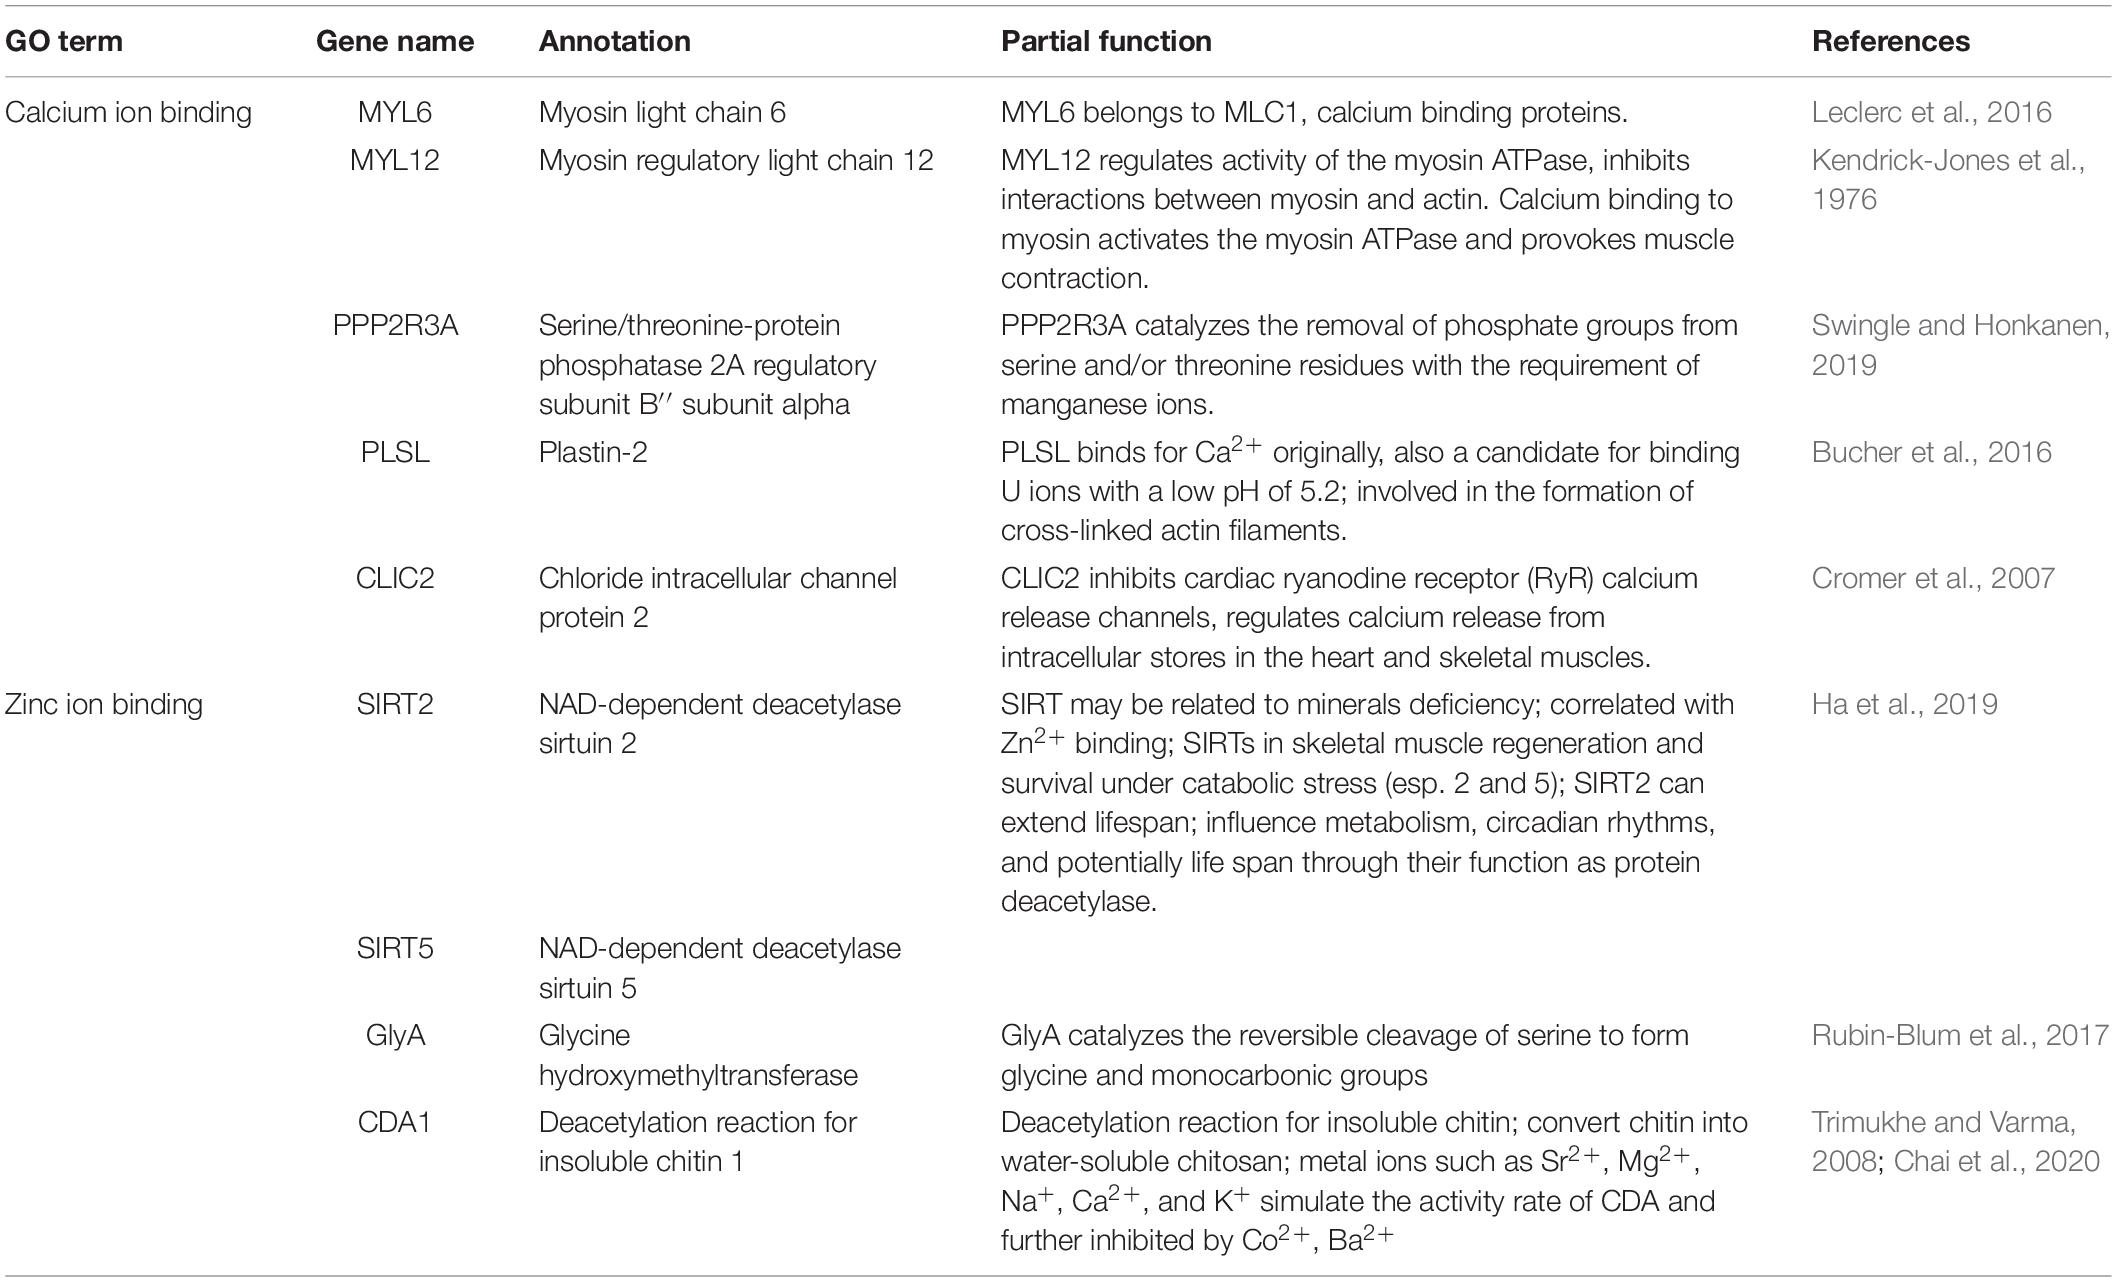
Table 3. Nine enriched outlier-associated unigenes related with metal ion binding.
KEGG enrichment analysis revealed that 180 of the 345 outlier-containing unigenes were significantly enriched in 15 pathways (Table 4). Specifically, a number of pathways may be related to the adaptation of S. crosnieri to local environments, although it is not possible to pinpoint the specific environmental condition shaping the adaptation. For example, three unigenes were enriched in the ‘peroxisome’ (ko04146) pathway: sarcosine oxidase/L-pipecolate oxidase (PIPOX), alanine-glyoxylate transaminase/serine-glyoxylate transaminase/serine-pyruvate transaminase (AGXT), and Cu-Zn superoxide dismutase (SOD1); and five unigenes were enriched in the ‘thermogenesis’ (ko04714) pathway: cyclic AMP-responsive element-binding protein 1 (CREB1), succinate dehydrogenase cytochrome b560 subunit (SDHC), succinate dehydrogenase (SDHD), NAD-dependent protein deacetylase Sirt6 (SIRT6), and succinate dehydrogenase [ubiquinone] iron-sulfur subunit (SDHB). Genes from environment-related pathways such as sulfur dioxygenase (ETHE1) in the ‘sulfur metabolism’ (ko00920) pathway and dihydrodiol dehydrogenase (DDH) in the ‘metabolism of xenobiotics by cytochrome P450’ (ko00980) pathway were identified in the outlier SNP dataset and the results of amino acid substitutions of 27 outlier SNPs with annotation are given in Table 5. Overall, 74 unigenes were found in both the outlier SNP dataset and the DEG dataset (42 in the SCS and 32 in the OT) (Supplementary Table 7), such as ETHE1 and DDH in the SCS population, suggesting a link between mutation and expressional change.
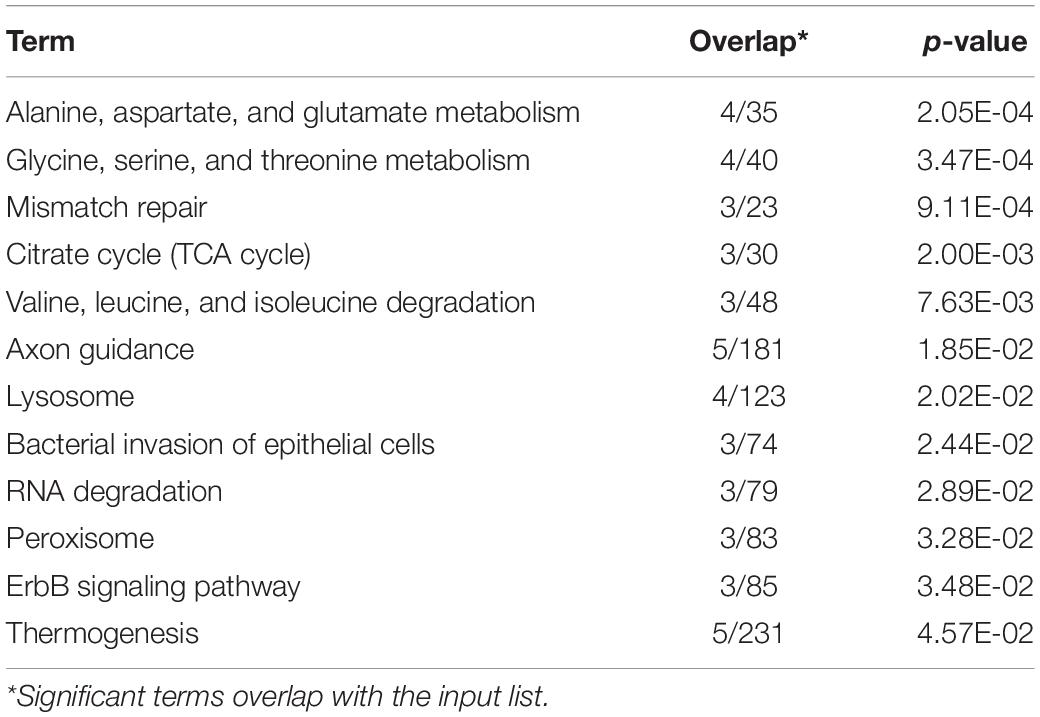
Table 4. KEGG enrichment analysis of outlier SNPs.
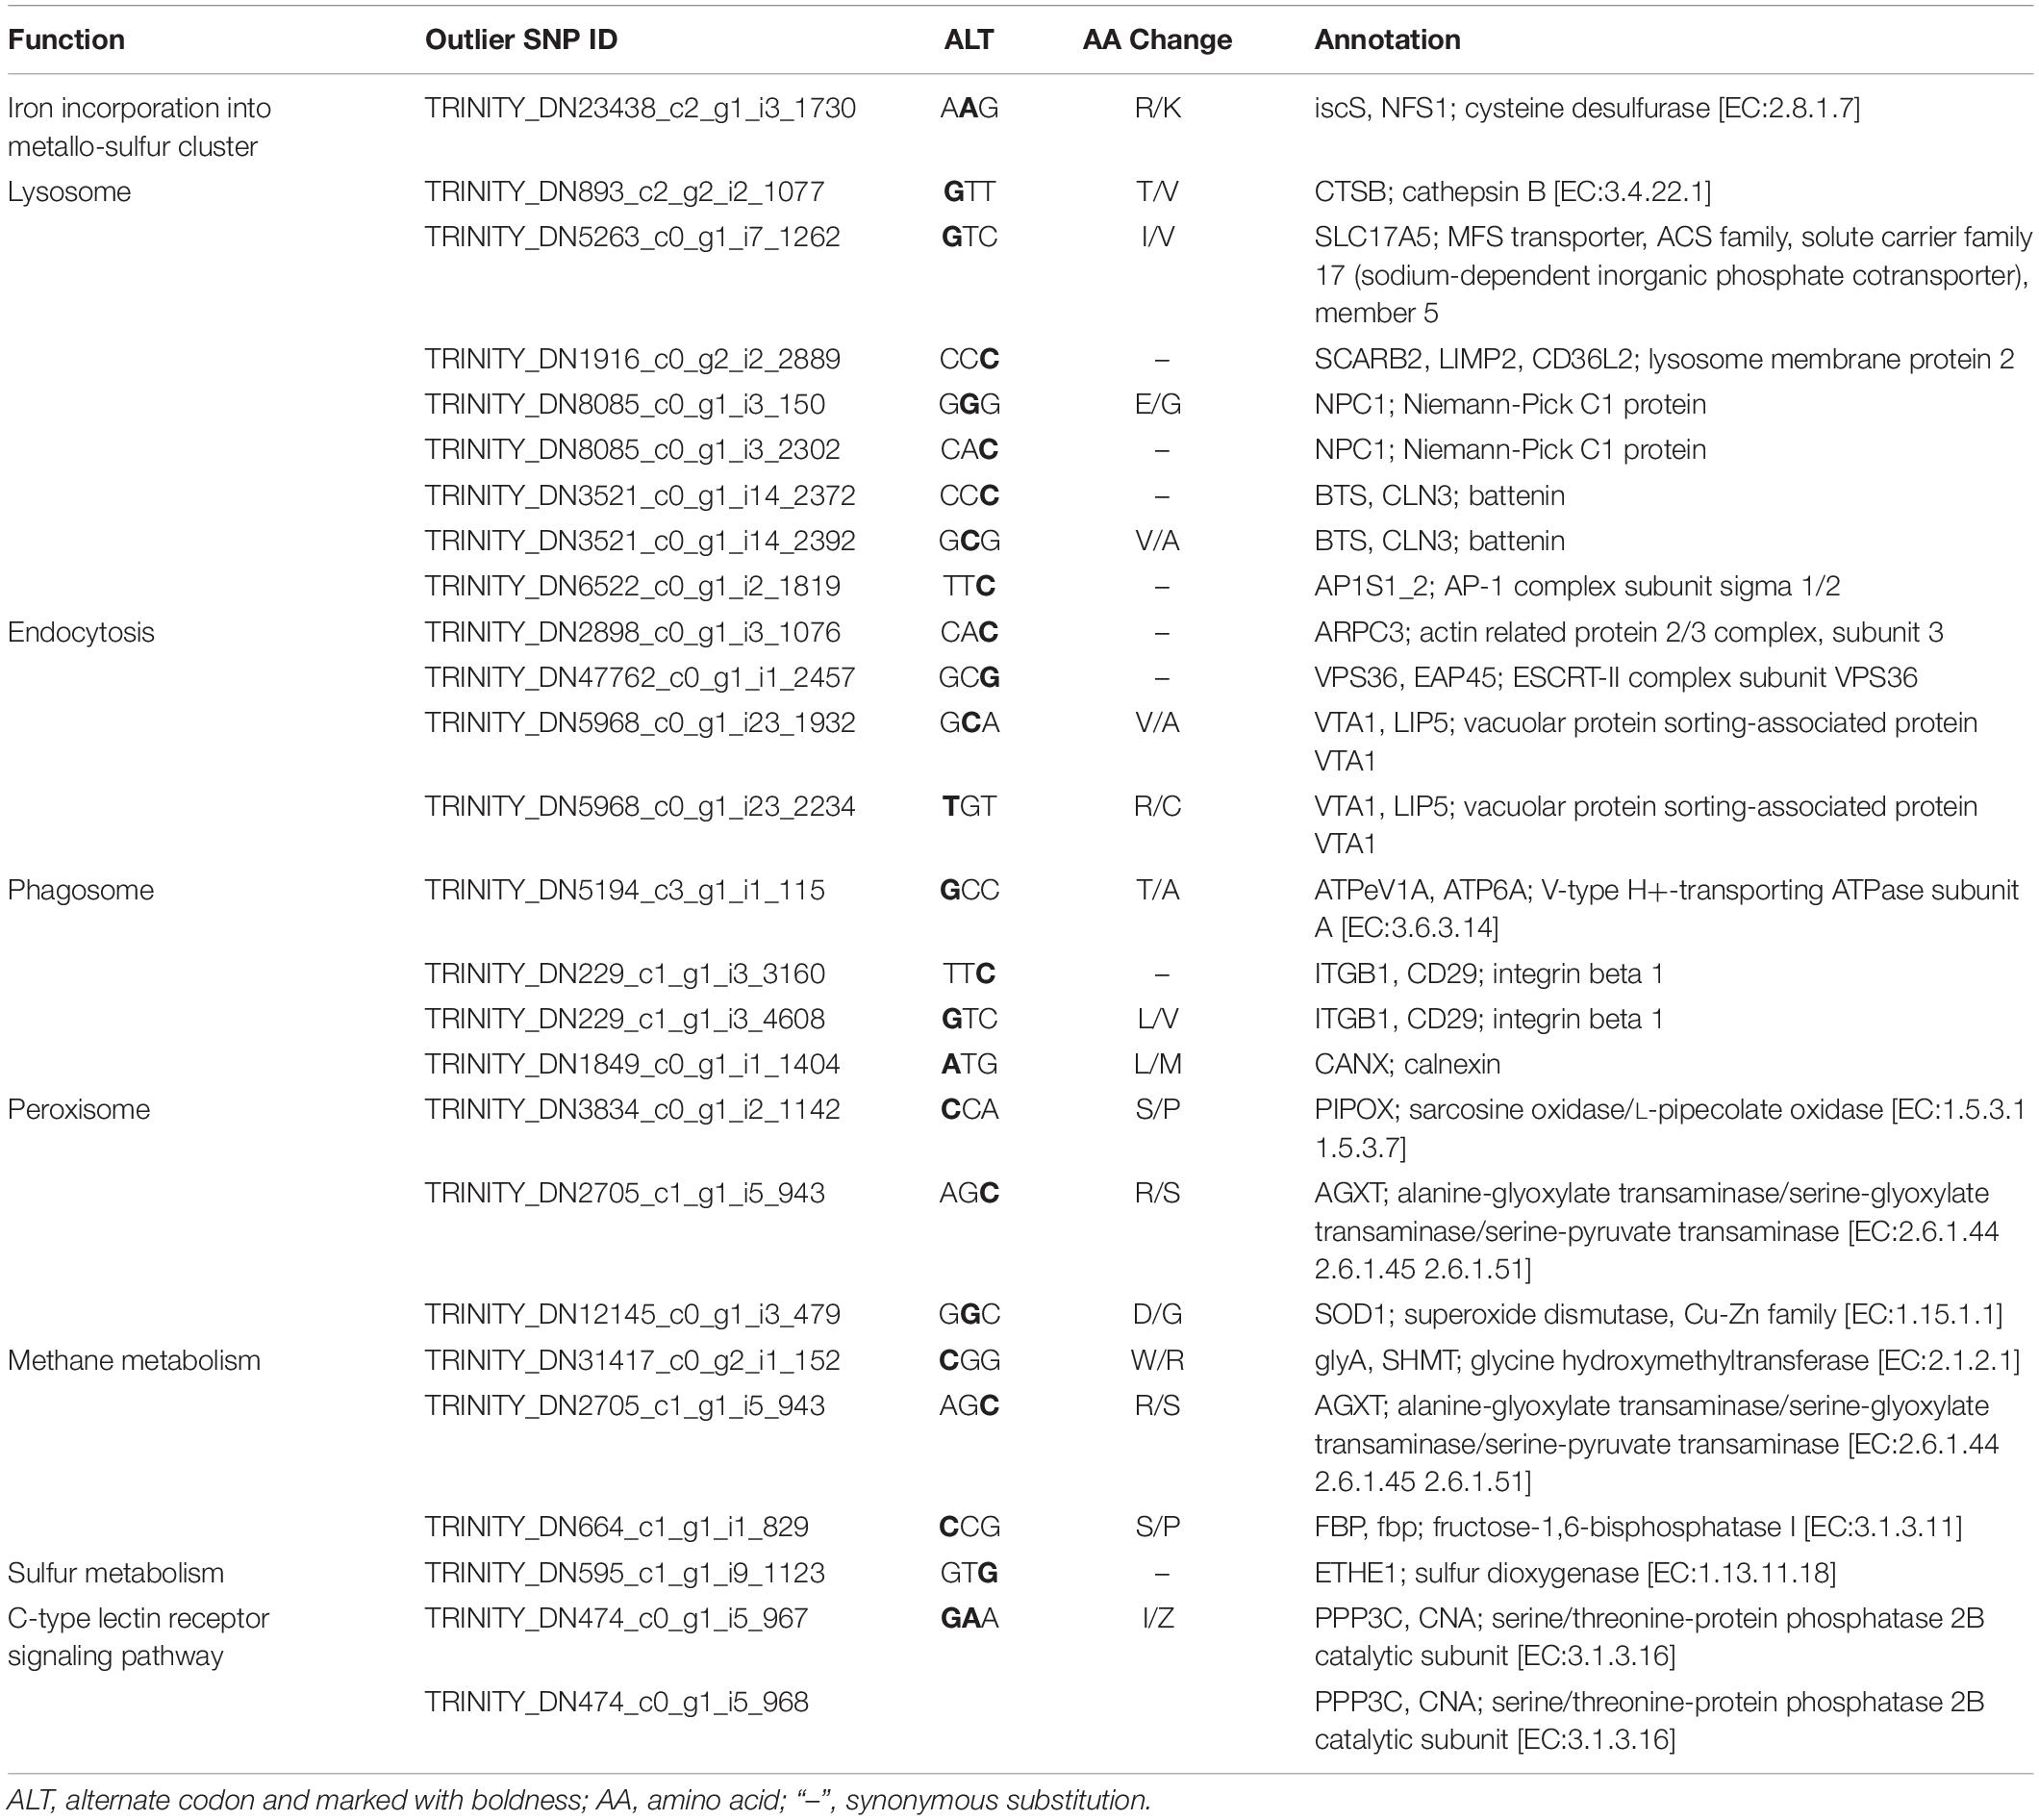
Table 5. Functional classification and amino acid substitution of the 27 annotated outlier SNPs.
Population Structure Based on the Entire and the Outlier SNP Dataset
Pairwise Fst calculated based on the entire SNP dataset was 0.07 (p < 0.0005), and pairwise Fst value estimated based on the outlier SNP dataset was 0.43 (p < 0.0005), much higher than that based on the entire SNP dataset as expected. ADMIXTURE analyses and PCA based on both all the (Figures 4A,B) and just the outlier SNPs (Figures 4C,D) clearly revealed two genetic groups of S. crosnieri, with one formed by all the individuals from the SCS and the other formed by all the individuals from the OT. Nevertheless, eight individuals in the OT showed a signature of admixture of two genetic groups (Figure 4A), indicating a stronger gene flow from the SCS to the OT. A similar result was also obtained via the divMigrate analysis where a higher migration rate was detected in the SCS to OT direction (1.00 for SCS to OT vs. 0.21 for OT to SCS). Figure 5A shows the lateral velocity vectors at 500 m depth laid upon the bathymetry in our study region. The Kuroshio Current is visible at this level and turns anticyclonically at the Luzon strait, allowing for water exchange between the Pacific Ocean and the SCS. At 1,000 m depth, however, much less connectivity is revealed between the Pacific and the South China Sea SCS (Figure 5B).
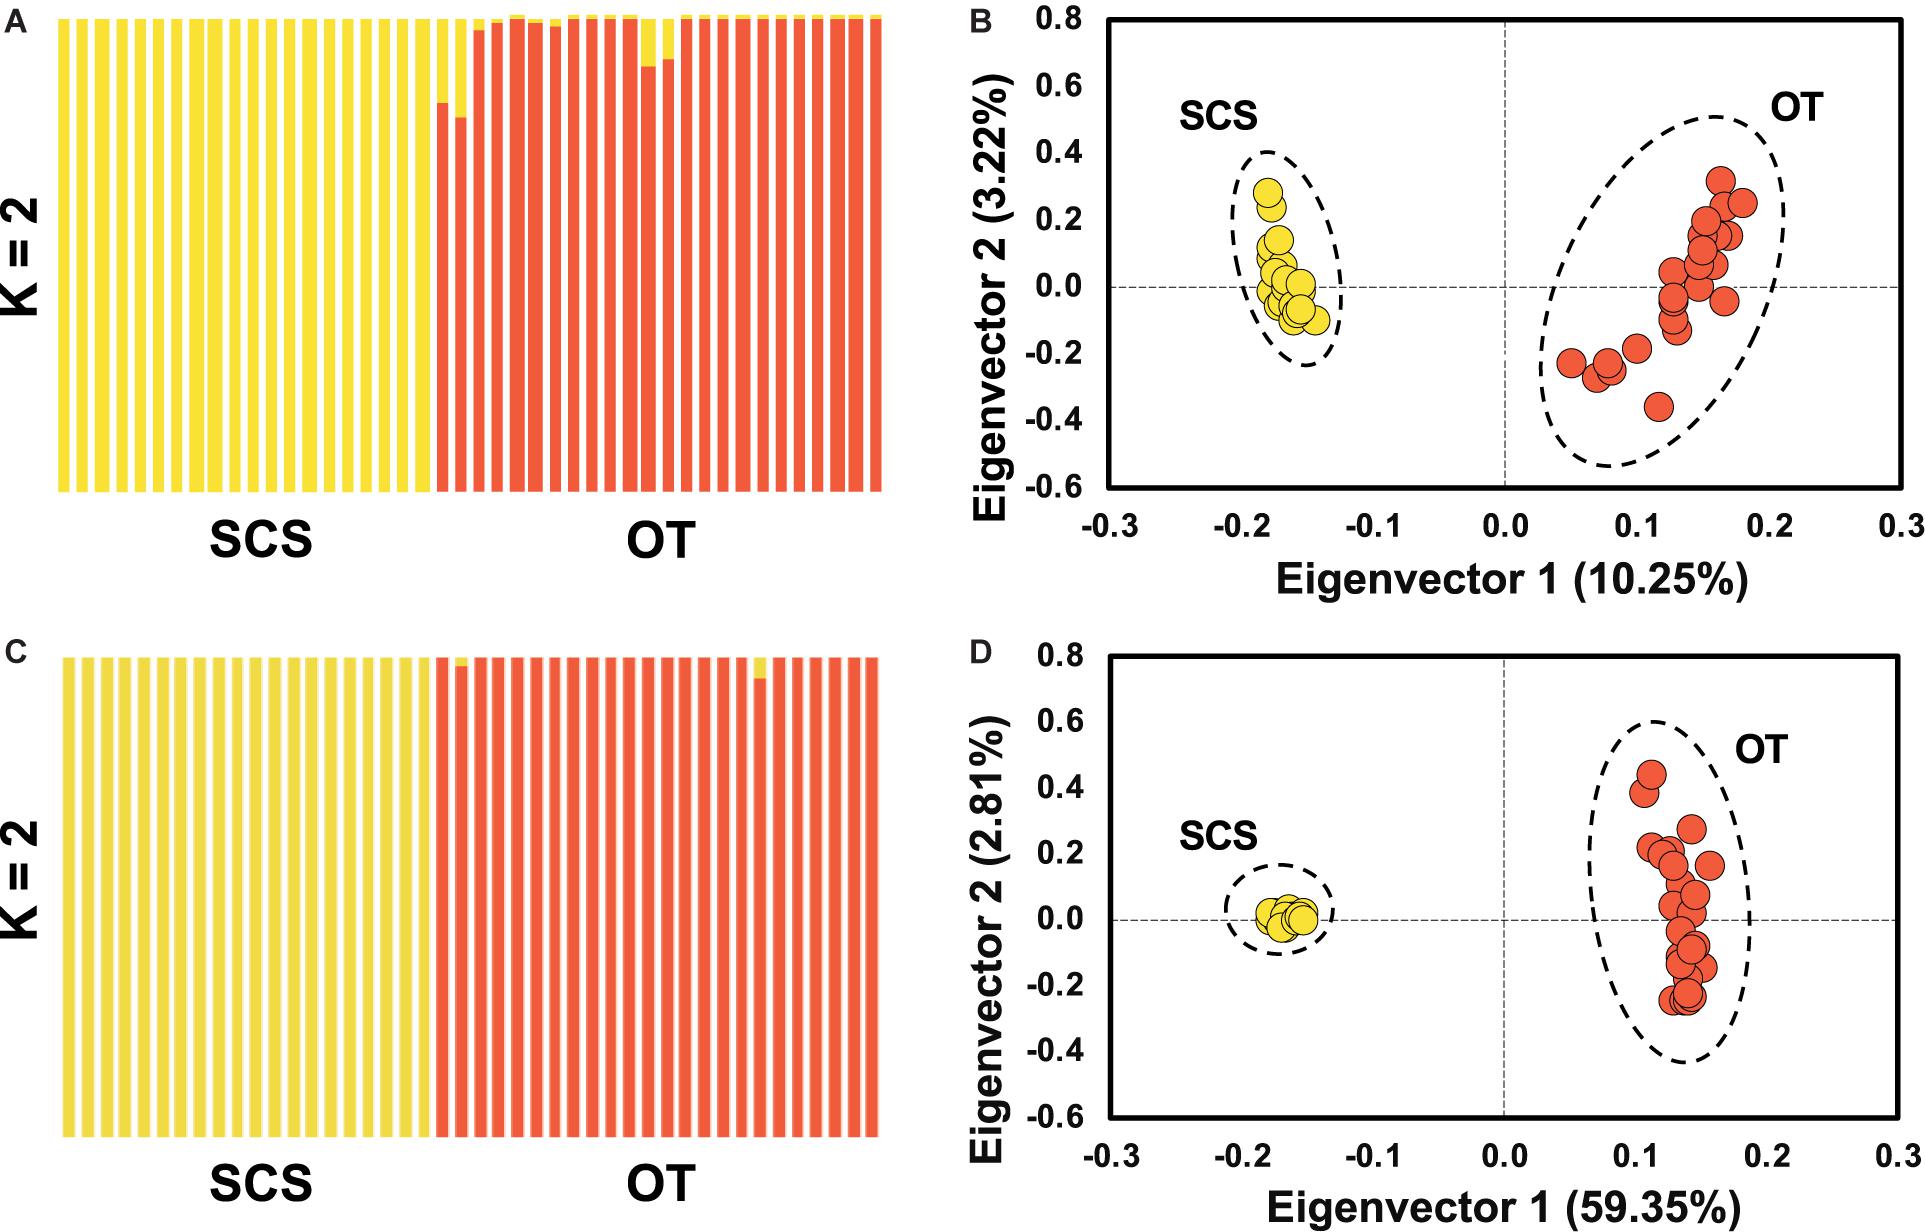
Figure 4. Population structure analyses based on ADMIXUTRE (A,C) and PCA (B,D) using entire SNP for (A,B) and the outlier SNP dataset for (C,D), showing the population genetic structure of S. crosnieri (K for optimal genetic group number).
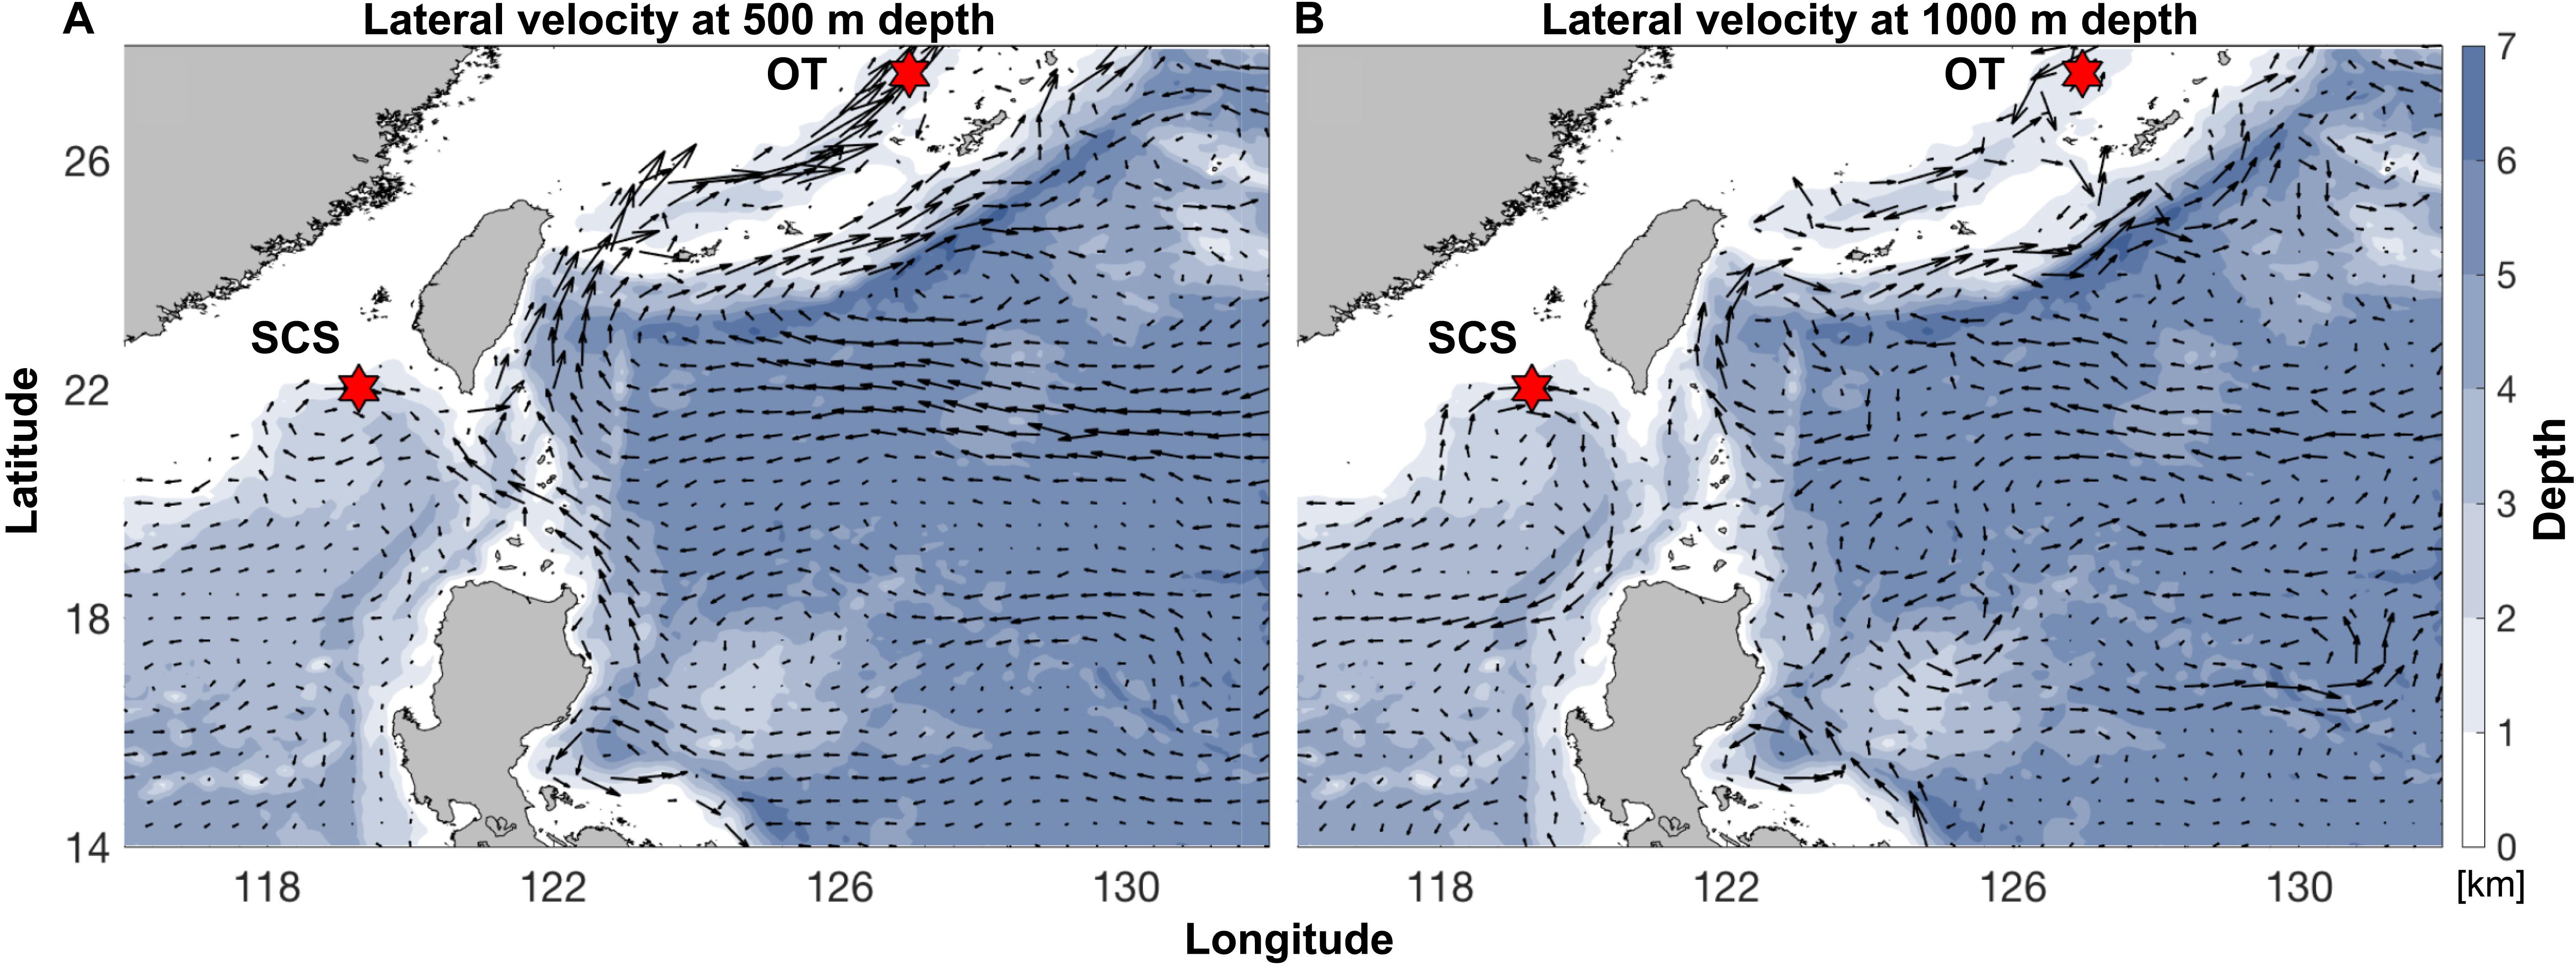
Figure 5. Annual-mean lateral velocity vectors, denoted by black arrows, at (A) 500 m depth and (B) 1,000 m depth laid upon the bathymetry (color contours; unit: km) in our analysis region. Sampling sites of the SCS and the OT are indicated by the red hexagrams. Datasets are based on the HYCOM + NCODA Global 1/12° Reanalysis (experiment sequence: 53.X).
Subsampling Analyses and Comparison With Previous Studies
Although the samples we used were different from those used in Cheng et al. (2019), some DEGs identified in our study showed the same expression patterns as in Cheng et al. (2019), including cystathionine gamma-lyase (CSE) and heat shock protein 22 (HSP) (Table 6), indicating they might reflect true differences between the two populations. Nevertheless, subsampling of our data clearly revealed a requirement of a larger sample size to capture the DEGs of the two populations (Figure 6A). From our data, the total number of DEGs increased sharply from 2,142 when using data from three individuals to 4,353 when using data from five individuals. But the number of DEGs did not increase further when data from even more individuals were included in the analysis.
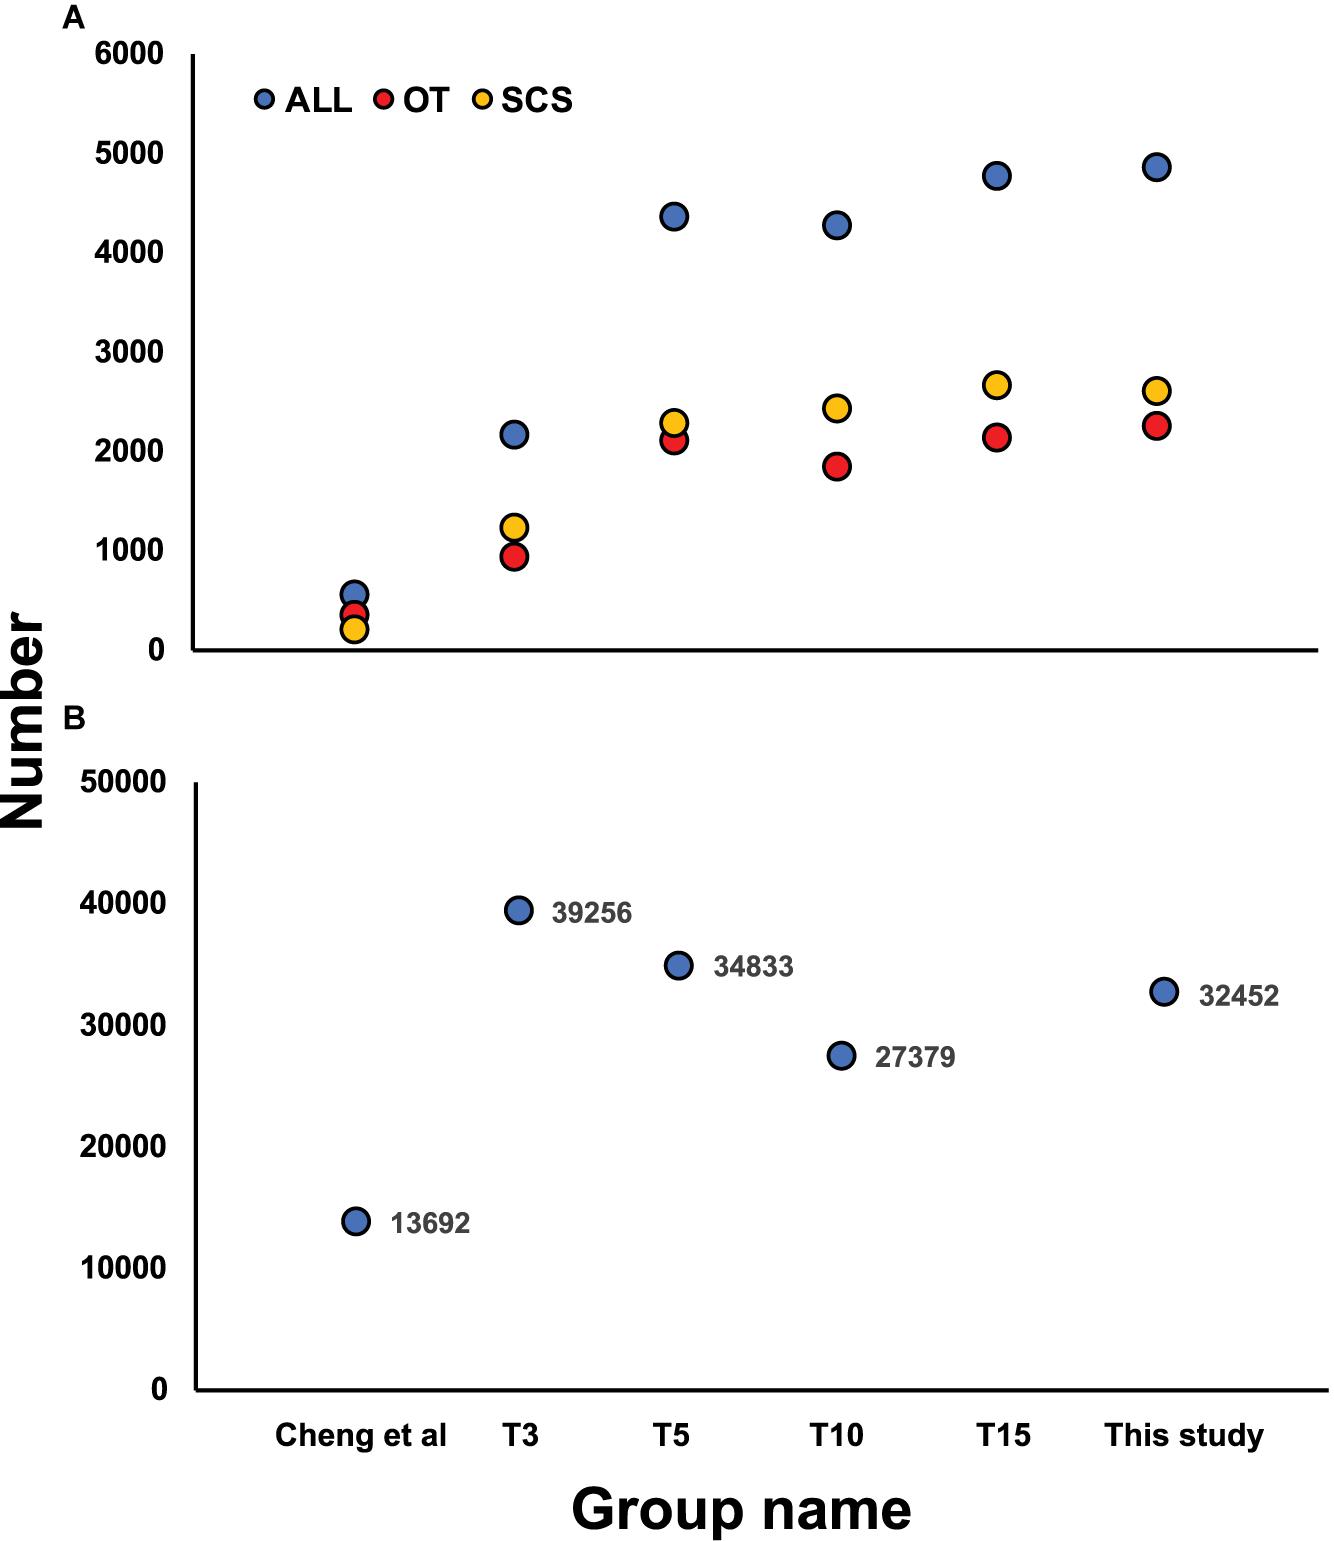
Figure 6. (A) Number of DEGs identified based on the subsampling approach by random selecting 3 (T3), 5 (T5), 10 (T10), and 15 (T15) individuals from each local population and comparing with Cheng et al. (2019), with yellow, red, and blue dots indicating DEGs in SCS, OT, and total DEGs number, respectively. (B) Number of SNPs identified based on the subsampling approach by random selecting 3 (T3), 5 (T5), and 10 (T10) individuals from each local population and comparison with Cheng et al. (2020).
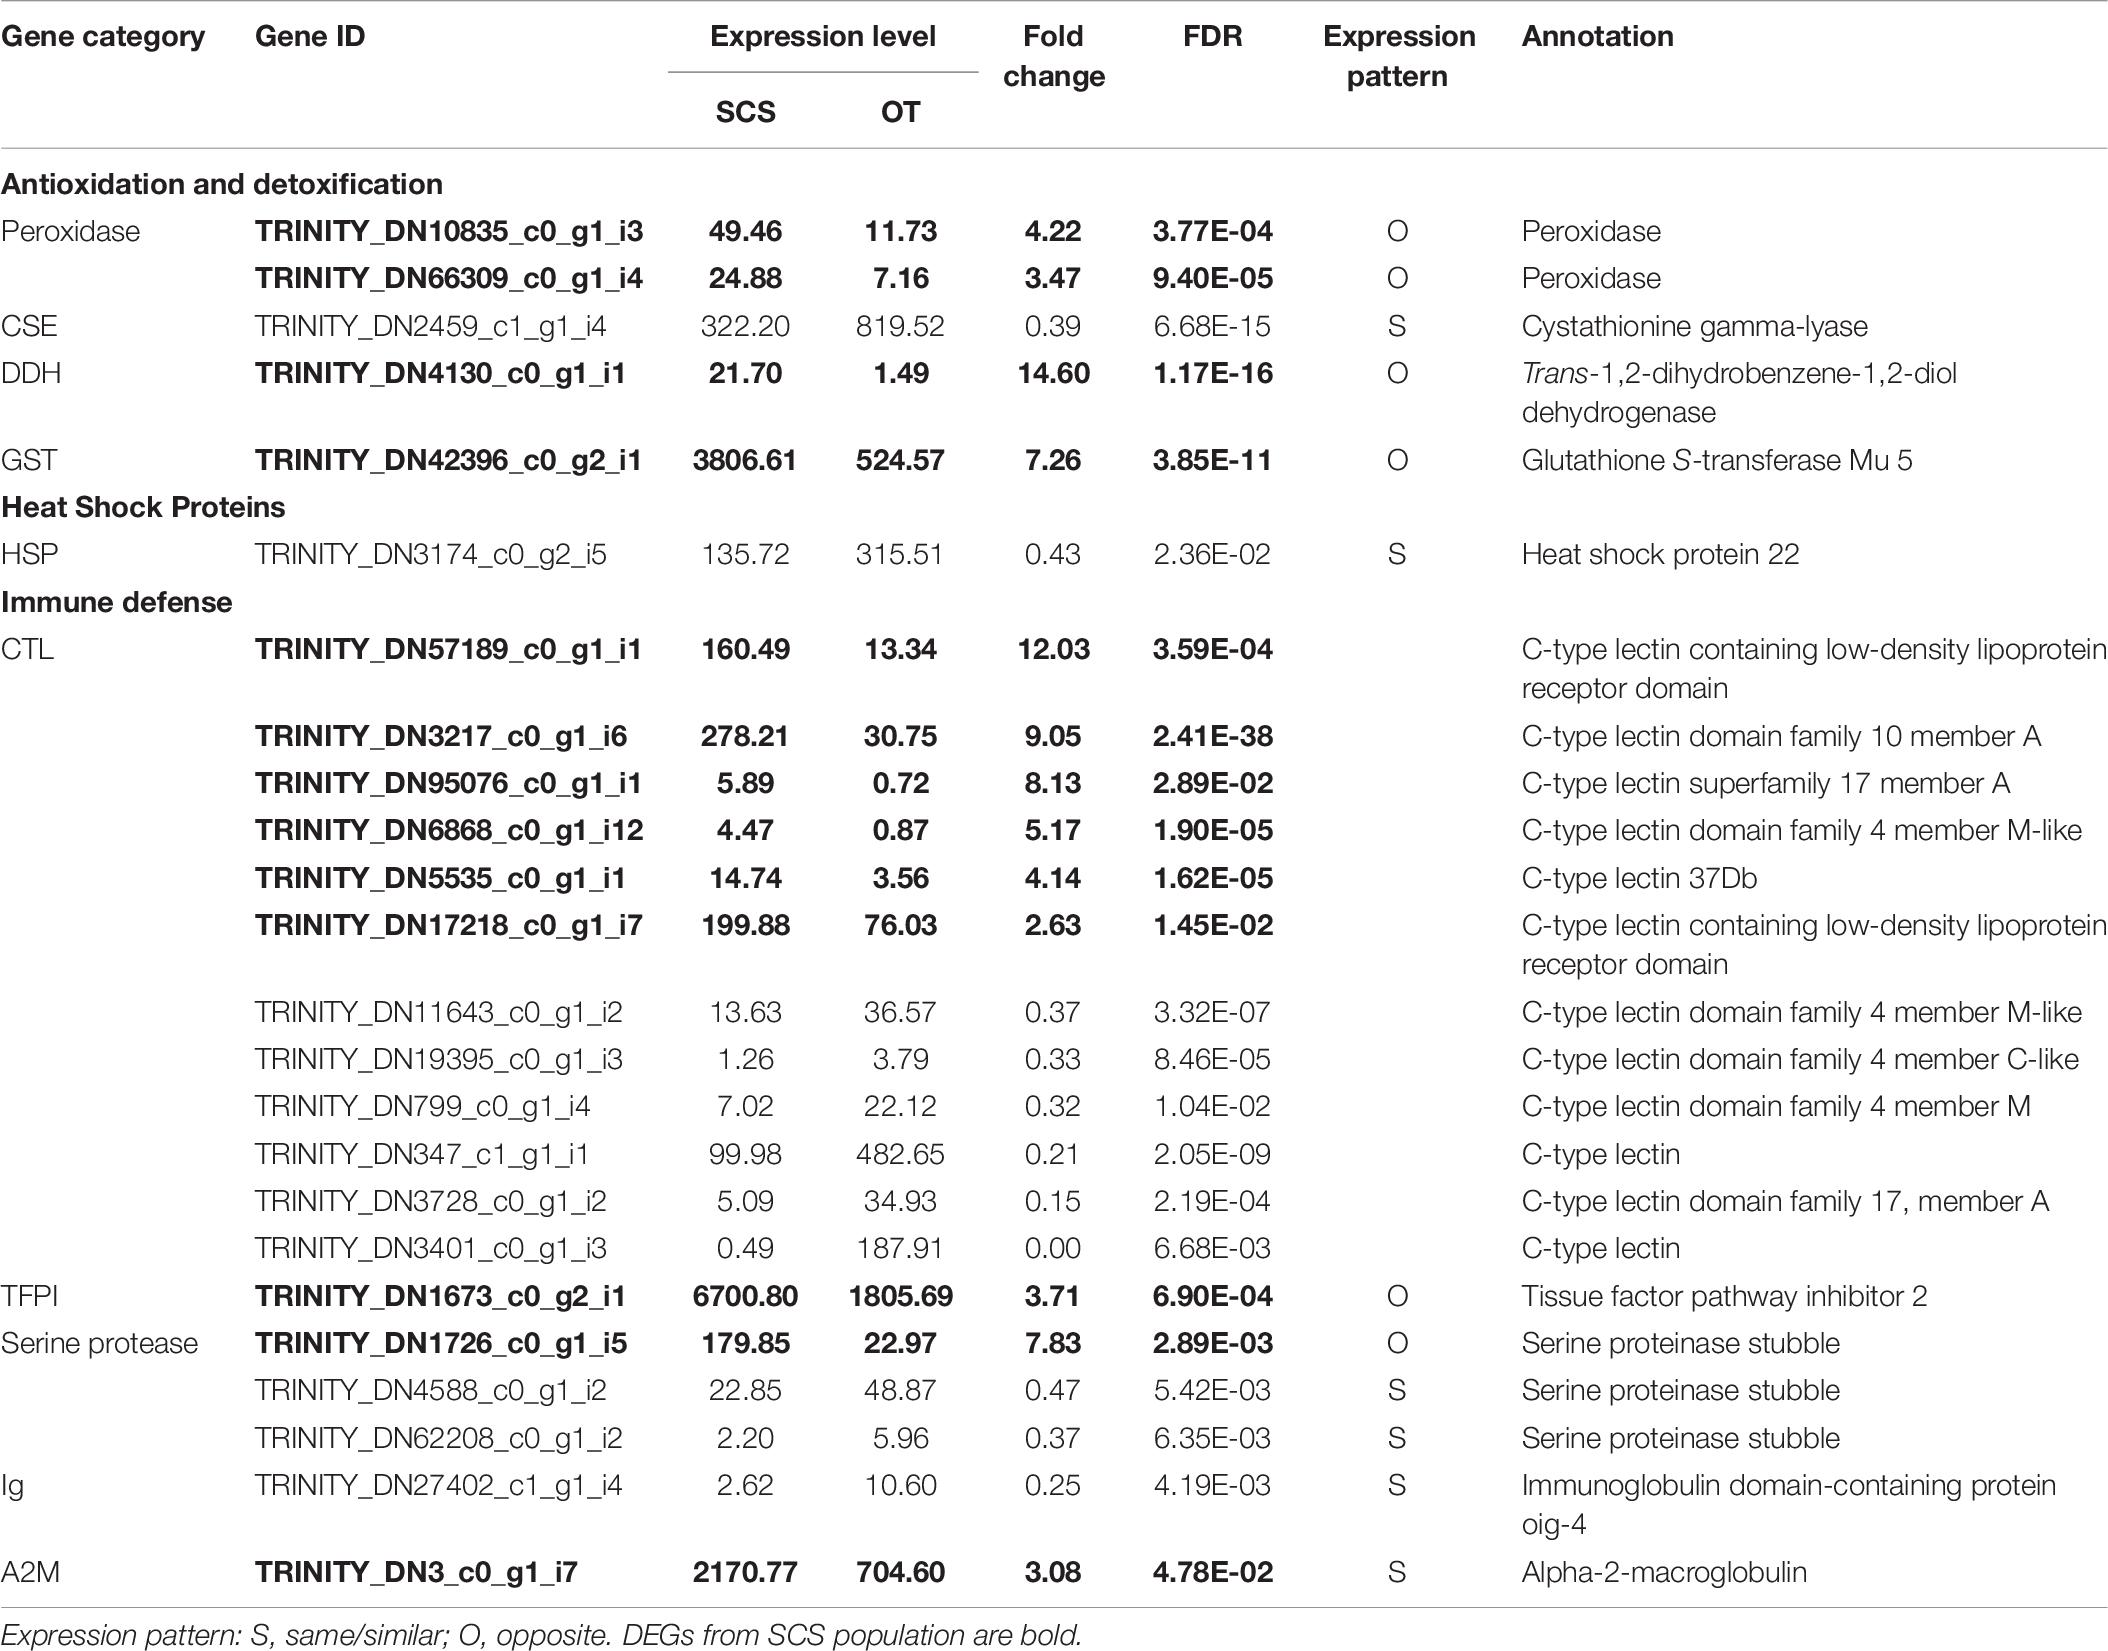
Table 6. Comparison of DEGs involved in antioxidation and detoxification, heat shock proteins, and immune defense with those in the study of Cheng et al. (2020).
The SNP markers detected using the subsampling strategy showed a basically consistent trend when 3, 5, and 10 individuals were chosen from each habitat (Figure 6B), and all three subsampling groups under transcriptome sequencing obtained more SNPs than the number of loci obtained under RAD sequencing. Moreover, more outlier SNP sequences were detected from transcriptome-wide SNP dataset compared with the results from RAD-Seq. Another advantage is that SNPs detected from transcriptome are all located in protein coding sequences while markers from RAD-Seq were sometimes out of protein-coding regions which is degermed by restriction enzymes (Cheng et al., 2020).
Discussion
By using the RNA-Seq technique, a total of 112 PSGs, 4,854 DEGs, and 32,452 SNPs were detected in this study, which provided the basis for investigating the population differentiation and environment-specific local adaptation of S. crosnieri from a methane seep and a hydrothermal vent in the Western Pacific.
Population Genetic Structure of Shinkaia crosnieri Between SCS and OT
Previous population genetic studies (Shen et al., 2016; Yang et al., 2016; Cheng et al., 2020) using different molecular markers have consistently shown that the seep population of S. crosnieri in the SCS and the vent population in the OT form two distinct genetic groups. By using 32,452 transcriptome-wide SNPs markers, our study also uncovered the same pattern of population structure.
One of the abiotic factors that may have contributed to such population subdivision is the physical barrier formed by the Luzon Strait. The Luzon Strait is the only deep channel that connects the semi-enclosed SCS with the deeper Pacific Ocean for water transportation via a sandwiched vertical structure (Tian et al., 2009). Seawater flows into the SCS from the Pacific Ocean in both the upper (<700 m) and the deep (>1,500 m) layers and exits the SCS through the Luzon Strait in the intermediate layer (700–1,500 m) (Tian et al., 2006; Yuan et al., 2009). The eastward spread is stronger in both winter and spring (You et al., 2005). Previously, by using genome-wide SNP markers, Xu et al. (2018) revealed a limited gene flow of the deep-sea mussel Gigantidas platifrons (previously known as Bathymodiolus platifrons) between the SCS and the OT. However, G. platifrons and S. crosnieri have different life-history traits. Bathymodioline mussels produce planktotrophic larvae that take almost a year to develop, and their dispersal ability is largely influenced by the upper or surface currents (Arellano and Young, 2009). Consequently, the limited larval exchange of G. platifrons between the two sides of the Luzon Strait is suggested to be achieved by the looping path of the Kuroshio Current, which flows into the SCS via the middle part and exits via the northern part of the Luzon Strait (Nan et al., 2011), as well as by the North Pacific Intermediate Water (NPIW; Xu et al., 2018). In contrast, S. crosnieri produces large (2 mm) oil-rich eggs and equally oil-rich lecithotrophic larvae (Miyake et al., 2010; Nakajima et al., 2018), and its dispersal is expected to mainly occur within the middle and deep layers. Its larval dispersal between the two sides of the Luzon Strait could be greatly restricted by the effect of the NPIW widely distributed between a depth range of 300–800 m (Watanabe and Wakatsuchi, 1998), approximately 300 m above the SCS methane seep and approximately 700 m above the OT hydrothermal vent. The physical oceanographic modeling results also revealed limited water connection between these two sites at the middle (500 m) and deep (1,000 m) layers.
Local Adaptation of Shinkaia crosnieri
Results of DEGs, PSGs, and outlier SNP detection revealed that several functional groups such as oxidoreductase activity, sulfur metabolism and metal ion binding may be involved in the local adaptation and expression plasticity of S. crosnieri under the varying environmental conditions of methane seeps and hydrothermal vents.
Mitochondria are a target of pollutant-induced toxicity, as reflected by the expressional changes of mitochondria-related proteins as well as oxidative enzymes in response to exposure to toxicants (Gobe and Crane, 2010). Iron plays a role in many cellular processes as well as the generation of harmful reactive oxygen species (ROS). Extracellular iron is taken up by cells and transported to mitochondria which form a major center of iron utilization and accumulation. In this process, metalloreductase (STEAP3), an endosomal membrane enzyme, can convert iron from an insoluble ferric (Fe3+) to a soluble ferrous (Fe2+) form (Martinez-Finley et al., 2012). Then, Fe2+ is transported directly from the endosome to mitochondria (Paul et al., 2017). STEAP3 was unigene upregulated in the SCS seep population, which may be a strategy against comparatively higher level of dissolved Fe concentration in the SCS than in the OT (Hu et al., 2015; Miyazaki et al., 2017a,b).
Hydrogen sulfide (H2S) is an important energy source driving carbon fixation and other critical metabolic processes in deep-sea thiotrophs, which then supply energy and nutrients to many macrobenthos living in hydrothermal vents and methane seeps. However, this gas is also a potent toxin to cytochrome c oxidase. Therefore, animals living in these chemosynthesis-based ecosystems are expected to be able to detoxify sulfide (Julian et al., 2005). Organisms inhabiting H2S-rich environments have evolved many strategies for coping with continuous exposure to H2S (Tobler et al., 2016). Eukaryotes usually possess a mitochondrial sulfur detoxification pathway, which converts sulfide into sulfite. Two key enzymes in the sulfide detoxification system, sulfide:quinone oxidoreductase (SQR) and sulfur dioxygenase (SDO), have been identified in this study. SQR is a mitochondrial membrane-bound enzyme. It converts sulfide to persulfides and transfers electrons to the pool of ubiquinone, which is then oxidized by SDO to generate sulfite with the consumption of molecular oxygen and persulfide molecules (Hildebrandt and Grieshaber, 2010). A previous study of the mussel G. platifrons from the SCS methane seep discovered the expression of the same sulfide detoxification pathway in the symbiont-hosting gill (Wong et al., 2015; Sun et al., 2017). Succinate dehydrogenase [ubiquinone] iron-sulfur subunit (SDHB), a subunit of SQR, was identified in our outlier SNP dataset, and sulfur dioxygenase (ETHE1), a homodimeric Fe-containing sulfur dioxygenase (SDO), was a DEG in the seep population as well as an outlier SNP with synonymous substitution. Natural gas hydrate on the seafloor of the Formosa Ridge (also known as the Jiaolong Ridge) in the SCS contained significant amounts of H2S (Zhang et al., 2017). These results indicate activation of mitochondrial sulfur detoxification in the seep population to cope with the local physicochemical condition. One PSG in the vent population, chondroitin 4-sulfotransferase 11 (CHST11), belongs to the family of sulfotransferases that catalyze the conversion of sulfate to chondroitin 4′-sulfate, a sulfated polysaccharide usually found in the matrix of animal cells (Suzuki and Strominger, 1960; Helbert, 2017).
Apart from cellular organelles, the mixed-function oxygenase (MFO) system also contributes to xenobiotic detoxification in all organisms (Ramos and Garcia, 2007). The first phase of MFO is mainly controlled by biotransformation enzymes like CYP and glutathione S-transferase (GST) that introduce a functional group to transform and metabolize toxicants. Superoxide dismutase (SOD), catalase (CAT), and glutathione peroxidase (GPx) catalyze subsequent reactions (second phase) and generate more polar products which are more easily excreted by the organisms (Lee, 1981). CYP and GST were upregulated unigenes in the seep population, while the alternative hydroperoxide of GPx, the peroxiredoxin 6 (PRDX 6) that also uses glutathione (GSH) as an electron donor (Deponte, 2013), was upregulated in the seep population. Cu-Zn superoxide dismutase (SOD1), a major antioxidant defense enzyme in charge of the detoxification of superoxide radicals and the generation of H2O2, was identified as an outlier SNP. The different expression levels of MFO system-related enzymes may suggest varying toxicant accumulation patterns between the two studied populations. Besides SOD1, sarcosine oxidase/L-pipecolate oxidase (PIPOX) and alanine-glyoxylate transaminase/serine-glyoxylate transaminase/serine-pyruvate transaminase (AGXT) were two other unigenes enriched under the ‘peroxisome’ pathway from the outlier SNP dataset. PIPOX catalyzes the oxidation of sarcosine and l-pipecolate with the production of H2O2 and it was also identified as a PSG in the vent population. AGXT takes part in glyoxylate detoxification and prevents the generation of toxic oxalate from glyoxylate. All three unigenes underwent amino substitutions. Differential gene expression and allele frequency changes of all these oxidoreductase-related genes may suggest different extents of local adaptation to the extreme environmental conditions.
Plastin is involved in the formation of cross-linked actin filaments, which are also responsible for the structural solidity of certain cells (Shinomiya, 2012). Plastin is a protein known for binding metals including Ca and could therefore be a candidate for binding uranium (U) with a low pH of 5.2 (Bucher et al., 2016). If the alteration in plastin occurs in the presence of U, it may contribute to the structural damage previously observed in gill tissues of zebrafish (Barillet et al., 2010). Hu et al. (2015) reported that cold seeps of the northern SCS contained enriched authigenic U in sediments, which may explain its influence on the genetic variation of plastin. Chitin deacetylases may convert chitin into chitosan by enzymatic deacetylation of the amino group of chitin (Raval et al., 2017). Chitin and chitosan both play a role in metal ions absorption (Kurita, 2006). Previous study found metal ions such as Sr2+, Mg2+, Na+, Ca2+, and K+ simulate the activity rate of CDA and further inhibited by Co2+, Ba2+ (Chai et al., 2020). Trace metals such as Sr2+, Mg2+, and Ca2+ have been detected in the seawater of both the SCS seep and OT vent sites, with Sr2+ being more abundant in the SCS site than in the OT site (Hu et al., 2015; Miyazaki et al., 2017a,b). Plastin-2 (PLSL) and chitin deacetylase 1 (CDA1) were enrichened under GO term from the outlier SNP dataset.
Sample Size Advantages
Transcriptome sequencing data are able to reveal gene expression patterns in different sample tissues or in samples under different conditions. Nevertheless, an appropriate sample size should be applied for transcriptome-based studies as it will affect the results obtained (Aach and Church, 2001). For example, in a study of gene expression profiling to prognose lymphoma, breast cancer, head cancer, and neck cancer, all data sets showed that predictive inaccuracy was reduced by increasing the sample size (Dunkler et al., 2007). Our empirical experience showed that, based on ∼3 Gb of 150-bp data per sample, at least five samples would be required to detect sufficient DEGs for comparing transcriptomes from two different populations. When only three replicates were used in a simulation with our data, only about half of the DEGs were detected. Moreover, when less data per sample were available (2.3 Gb of 100-bp data) (Cheng et al., 2019), even fewer DEGs (545) could be detected. Our results are consistent with the results of another study that indicated at least six replicates should be used in order to obtain sufficient DEGs for a study of the treatment effects (Schurch et al., 2016). Meanwhile, our subsampling indicated the need to choose up-to-date methodology in order to detect transcriptome-wide SNPs. Our empirical results will thus be useful when planning population genetic studies of not only the squat lobster S. crosnieri, but also other invertebrates.
Conclusion
Using transcriptome sequencing, we identified DEGs and PSGs between two Shinkaia crosnieri populations, one from a methane seep in the SCS and another from a hydrothermal vent field in the OT. These genes were found to be involved and enriched in metabolic pathways including oxidoreductase activity and sulfur metabolism that may be important in adaptation to different environmental conditions. Using transcriptome-wide SNP markers, we confirmed clear genetic subdivision between S. crosnieri from the SCS and the OT, and suggested the Luzon Strait as an important physical barrier to the larval dispersal between the two populations. Moreover, our outlier analysis revealed the involvement of genes related to metal ion binding and energy metabolism in shaping the genetic divergence of the two populations. Using a subsampling strategy, we found that at least five replicates were required to capture the full spectrum of DEGs between the two populations. Altogether, our study provide new insights into the genetic structure of S. crosnieri and molecular mechanisms that have enabled it to thrive in both vents and seeps. A broader sampling involving more localities with contrasting environmental conditions including both different temperatures and depths is desired in the future to further improve our understanding of the population dynamics and local adaptation of this widespread species in the Western Pacific.
Data Availability Statement
The datasets generated from this study can be found in online repositories. The names of the repository/repositories and accession number(s) can be found below: https://www.ncbi.nlm.nih.gov/, PRJNA612951.
Ethics Statement
The animal study was reviewed and approved by The Ethics Committee of the Hong Kong University of Science and Technology. Written informed consent was obtained from the owners for the participation of their animals in this study.
Author Contributions
P-YQ and J-WQ conceived and designed the project. J-WQ, JS, and CC collected the samples. TX and YX extracted the RNA. YX, YHK, and WCW performed the real-time PCR experiments. YW conducted ocean modeling analysis. YX, TX, and JS performed the bioinformatics analyses and drafted the manuscript. All authors contributed to the manuscript and approved it for submission and publication.
Conflict of Interest
The authors declare that the research was conducted in the absence of any commercial or financial relationships that could be construed as a potential conflict of interest.
Funding
This work was supported by grants from the Major Basic and Applied Research Projects of Guangdong Province (2019B030302004-04), the Hong Kong Branch of Southern Marine Science and Engineering Guangdong Laboratory (Guangzhou) (SMSEGL20SC01), and Southern Marine Science and Engineering Guangdong Laboratory (Guangzhou) (GML2019ZD0409) as well as by a grant from China Ocean Mineral Resources Research and Development Association (DY135-E2-1-03). The R/V Kairei research cruise KR15-17 (PI: Hiroyuki Yamamoto) was supported by the Council for Science, Technology, and Innovation (CSTI) in Japan as part of the Cross Ministerial Strategic Innovation Promotion Program (SIP), Next-generation Technology for Ocean Resource Exploration.
Acknowledgments
We thank the captains and crews of Xiangyanghong 9, R/V Kairei, and R/V Tan Ka Kee, as well as the operation team of the deep-submergence vehicle Jiaolong, ROV KAIKO, and ROV ROPOS for helping us with sample collection during the relevant cruises. Hiroyuki Yamamoto (JAMSTEC) is thanked for serving as the chief scientist of the research cruise KR15-17. The data for physical oceanographic modeling in this study can be found on the http://www.hycom.org data server under the “HYCOM + NCODA Global 1/12° Reanalysis” link.
Supplementary Material
The Supplementary Material for this article can be found online at: https://www.frontiersin.org/articles/10.3389/fmars.2020.587686/full#supplementary-material
Footnotes
- ^ www.novogene.com
- ^ https://www.bioinformatics.babraham.ac.uk/projects/fastqc/
- ^ https://www.genome.jp/kegg/kaas/
- ^ https://software.broadinstitute.org/morpheus/
- ^ https://www.ncbi.nlm.nih.gov/tools/primer-blast/
- ^ https://www.biobam.com/download-omicsbox/
- ^ https://www.genome.jp/kegg/tool/map_pathway.html
- ^ http://picard.sourceforge.net
- ^ https://www.hycom.org/
References
Aach, J., and Church, G. M. (2001). Aligning gene expression time series with time warping algorithms. Bioinformatics 17, 495–508. doi: 10.1093/bioinformatics/17.6.495
Alexander, D. H., Novembre, J., and Lange, K. (2009). Fast model-based estimation of ancestry in unrelated individuals. Genome Res. 19, 1655–1664. doi: 10.1101/gr.094052.109
Alexander, D. H., Shringarpure, S. S., Novembre, J., and Lange, K. (2015). Admixture 1.3 Software Manual. Available online at: https://www.genetics.ucla.edu/software/admixture/admixture-manual.pdf (accessed March 23, 2020).
Altschul, S. F., Gish, W., Miller, W., Myers, E. W., and Lipman, D. J. (1990). Basic local alignment search tool. J. Mol. Biol. 215, 403–410. doi: 10.1016/S0022-2836(05)80360-2
Arellano, S. M., and Young, C. M. (2009). Spawning, development, and the duration of larval life in a deep-sea cold-seep mussel. Biol. Bull. 216, 149–162. doi: 10.1086/BBLv216n2p149
Baba, K., and Williams, A. (1998). New galatheoidea (Crustacea, Decapoda, Anomura) from hydrothermal systems in the West Pacific Ocean: bismarck archipelago and Okinawa Trough. Zoosystema 20, 143–156. doi: 10.11646/zootaxa.4057.1.5
Barillet, S., Larno, V., Floriani, M., Devaux, A., and Adam-Guillermin, C. (2010). Ultrastructural effects on gill, muscle, and gonadal tissues induced in zebrafish (Danio rerio) by a waterborne uranium exposure. Aquat. Toxicol. 100, 295–302. doi: 10.1016/j.aquatox.2010.08.002
Belcaid, M., Casaburi, G., McAnulty, S. J., Schmidbaur, H., Suria, A. M., Moriano-Gutierrez, S., et al. (2019). Symbiotic organs shaped by distinct modes of genome evolution in cephalopods. Proc. Natl. Acad. Sci. U.S.A. 116, 3030–3035. doi: 10.1073/pnas.1817322116
Bolger, A. M., Lohse, M., and Usadel, B. (2014). Trimmomatic: a flexible trimmer for Illumina sequence data. Bioinformatics 30, 2114–2120. doi: 10.1093/bioinformatics/btu170
Bradnam, K. R., Fass, J. N., Alexandrov, A., Baranay, P., Bechner, M., Birol, I., et al. (2013). Assemblathon 2: evaluating de novo methods of genome assembly in three vertebrate species. GigaScience 2:10. doi: 10.1186/2047-217X-2-10
Bray, N. L., Pimentel, H., Melsted, P., and Pachter, L. (2016). Near-optimal probabilistic RNA-seq quantification. Nat. Biotechnol. 34:525. doi: 10.1038/nbt.3519
Bucher, G., Mounicou, S., Simon, O., Floriani, M., Lobinski, R., and Frelon, S. (2016). Insights into the nature of uranium target proteins within zebrafish gills after chronic and acute waterborne exposures. Environ. Toxicol. Chem. 35, 736–741. doi: 10.1002/etc.3249
Chai, J., Hang, J., Zhang, C., Yang, J., Wang, S., Liu, S., et al. (2020). Purification and characterization of chitin deacetylase active on insoluble chitin from Nitratireductor aquimarinus MCDA3-3. Int. J. Biol. Macromol. 152, 922-929. doi: 10.1016/j.ijbiomac.2020.02.308
Chan, T. Y., Lee, D. A., and Lee, C. S. (2000). The first deep-sea hydrothermal animal reported from Taiwan: Shinkaia crosnieri Baba and Williams, 1998 (Crustacea: Decapoda: Galatheidae). Bull. Mar. Sci. 67, 799–804.
Chen, E. Y., Tan, C. M., Kou, Y., Duan, Q., Wang, Z., Meirelles, G. V., et al. (2013). Enrichr: interactive and collaborative HTML5 gene list enrichment analysis tool. BMC Bioinform. 14:128. doi: 10.1186/1471-2105-14-128
Cheng, J., Hui, M., Li, Y., and Sha, Z. (2020). Genomic evidence of population genetic differentiation in deep-sea squat lobster Shinkaia crosnieri (Crustacea: Decapoda: Anomura) from Northwestern Pacific hydrothermal vent and cold seep. Oceanogr. Res. Pap. 156:103188. doi: 10.1016/j.dsr.2019.103188
Cheng, J., Hui, M., and Sha, Z. (2019). Transcriptomic analysis reveals insights into deep-sea adaptations of the dominant species, Shinkaia crosnieri (Crustacea: Decapoda: Anomura), inhabiting both hydrothermal vents and cold seeps. BMC Genom. 20:388. doi: 10.1186/s12864-019-5753-7
Corliss, J. B., Dymond, J., Gordon, L. I., Edmond, J. M., von Herzen, R. P., Ballard, R. D., et al. (1979). Submarine thermal springs on the Galapagos Rift. Science 203, 1073–1083. doi: 10.1126/science.203.4385.1073
Cromer, B. A., Gorman, M. A., Hansen, G., Adams, J. J., Coggan, M., Board, P. G., et al. (2007). Expression, purification, crystallization and preliminary X-ray diffraction analysis of chloride intracellular channel 2 (CLIC2). Struct. Biol. Crystall. Commun. 63, 961–963. doi: 10.1107/S1744309107049159
Danecek, P., Auton, A., Abecasis, G., Albers, C. A., Banks, E., DePristo, M. A., et al. (2011). The variant call format and VCFtools. Bioinformatics 27, 2156–2158. doi: 10.1093/bioinformatics/btr330
Deponte, M. (2013). Glutathione catalysis and the reaction mechanisms of glutathione-dependent enzymes. Biochim. Biophys. Acta 1830, 3217–3266. doi: 10.1016/j.bbagen.2012.09.018
Dunkler, D., Michiels, S., and Schemper, M. (2007). Gene expression profiling: does it add predictive accuracy to clinical characteristics in cancer prognosis? Eur. J. Cancer 43, 745–751. doi: 10.1016/j.ejca.2006.11.018
Excoffier, L., and Lischer, H. E. (2010). Arlequin suite ver 3.5: a new series of programs to perform population genetics analyses under Linux and Windows. Mol. Ecol. Resour. 10, 564–567. doi: 10.1111/j.1755-0998.2010.02847.x
Fu, L., Niu, B., Zhu, Z., Wu, S., and Li, W. (2012). CD-HIT: accelerated for clustering the next-generation sequencing data. Bioinformatics 28, 3150–3152. doi: 10.1093/bioinformatics/bts565
German, C., Livermore, R., Baker, E., Bruguier, N., Connelly, D., Cunningham, A., et al. (2000). Hydrothermal plumes above the East Scotia Ridge: an isolated high-latitude back-arc spreading centre. Earth Planet. Sci. Lett. 184, 241–250. doi: 10.1016/S0012-821X(00)00319-8
German, C. R., Ramirez-Llodra, E., Baker, M. C., Tyler, P. A., and Committee, C. S. S. (2011). Deep-water chemosynthetic ecosystem research during the census of marine life decade and beyond: a proposed deep-ocean road map. PLoS One 6:e23259. doi: 10.1371/journal.pone.0023259
Gobe, G., and Crane, D. (2010). Mitochondria, reactive oxygen species and cadmium toxicity in the kidney. Toxicol. Lett. 198, 49–55. doi: 10.1016/j.toxlet.2010.04.013
Götz, S., García-Gómez, J. M., Terol, J., Williams, T. D., Nagaraj, S. H., Nueda, M. J., et al. (2008). High-throughput functional annotation and data mining with the Blast2GO suite. Nucl. Acids Res. 36, 3420–3435. doi: 10.1093/nar/gkn176
Grabherr, M. G., Haas, B. J., Yassour, M., Levin, J. Z., Thompson, D. A., Amit, I., et al. (2011). Trinity: reconstructing a full-length transcriptome without a genome from RNA-Seq data. Nat. Biotechnol. 29:644. doi: 10.1038/nbt.1883
Ha, B. G., Jung, S. S., Jang, Y. K., Jeon, B. Y., and Shon, Y. H. (2019). Mineral-enriched deep-sea water modulates lactate metabolism via PGC-1α-mediated metabolic reprogramming. Mar. Drugs 17:611. doi: 10.3390/md17110611
Haas, B. J., Papanicolaou, A., Yassour, M., Grabherr, M., Blood, P. D., Bowden, J., et al. (2013). De novo transcript sequence reconstruction from RNA-seq using the Trinity platform for reference generation and analysis. Nature protocols 8, 1494–1512. doi: 10.1038/nprot.2013.084
Helbert, W. (2017). Marine polysaccharide sulfatases. Front. Mar. Sci. 4:6. doi: 10.3389/fmars.2017.00006
Hildebrandt, T. M., and Grieshaber, M. K. (2010). Three enzymatic activities catalyze the oxidation of sulfide to thiosulfate in mammalian and invertebrate mitochondria. FEBS J. 275, 3352–3361. doi: 10.1111/j.1742-4658.2008.06482.x
Houston, R. D., Taggart, J. B., Cézard, T., Bekaert, M., Lowe, N. R., Downing, A., et al. (2014). Development and validation of a high density SNP genotyping array for Atlantic salmon (Salmo salar). BMC Genom. 15:90. doi: 10.1186/1471-2164-15-90
Hu, Y., Feng, D., Liang, Q., Xia, Z., Chen, L., and Chen, D. (2015). Impact of anaerobic oxidation of methane on the geochemical cycle of redox-sensitive elements at cold-seep sites of the northern South China Sea. Top. Stud. Oceanogr. 122, 84–94. doi: 10.1016/j.dsr2.2015.06.012
Julian, D., April, K. L., Patel, S., Stein, J. R., and Wohlgemuth, S. E. (2005). Mitochondrial depolarization following hydrogen sulfide exposure in erythrocytes from a sulfide-tolerant marine invertebrate. J. Exp. Biol. 208, 4109–4122. doi: 10.1242/jeb.01867
Keenan, K., McGinnity, P., Cross, T. F., Crozier, W. W., and Prodöhl, P. A. (2013). diveRsity: an R package for the estimation and exploration of population genetics parameters and their associated errors. Methods Ecol. Evol. 4, 782–788. doi: 10.1111/2041-210X.12067
Kendrick-Jones, J., Szentkiralyi, E. M., and Szent-Györgyi, A. G. (1976). Regulatory light chains in myosins. J. Mol. Biol. 104, 747–775. doi: 10.1016/0022-2836(76)90180-7
Kiel, S. (2016). A biogeographic network reveals evolutionary links between deep-sea hydrothermal vent and methane seep faunas. Biol. Sci. 283:20162337. doi: 10.1098/rspb.2016.2337
Kurita, K. (2006). Chitin and chitosan: functional biopolymers from marine crustaceans. Mar. Biotechnol. 8, 203–226. doi: 10.1007/s10126-005-0097-5
Kyuno, A., Shintaku, M., Fujita, Y., Matsumoto, H., Utsumi, M., Watanabe, H., et al. (2009). Dispersal and differentiation of deep-sea mussels of the genus Bathymodiolus (Mytilidae. Bathymodiolinae). J. Mar. Biol. 2009, 1–15. doi: 10.1155/2009/625672
Langmead, B., and Salzberg, S. L. (2012). Fast gapped-read alignment with Bowtie 2. Nat. Methods 9, 357–359. doi: 10.1038/nmeth.1923
Lechner, M., Findeiß, S., Steiner, L., Marz, M., Stadler, P. F., and Prohaska, S. J. (2011). Proteinortho: detection of (co-) orthologs in large-scale analysis. BMC Bioinform. 12:124. doi: 10.1186/1471-2105-12-124
Leclerc, C., Haeich, J., Aulestia, F. J., Kilhoffer, M. C., Miller, A. L., Neant, I., et al. (2016). Calcium signaling orchestrates glioblastoma development: facts and conjunctures. Biochim. Biophys. Acta 1863, 1447–1459. doi: 10.1016/j.bbamcr.2016.01.018
Lee, R. F. (1981). Mixed function oxygenases (MFO) in marine invertebrates. Mar. Biol. Lett. 2, 87–105.
Levin, L. A. (2005). “Ecology of cold seep sediments: interactions of fauna with flow, chemistry and microbes,” in Oceanography and Marine Biology: An Annual Review, eds R. Gibson, R. Atkinson, and J. Gordon (Boca Raton, FL: Taylor and French), 1–46. doi: 10.1201/9781420037449.ch1
Li, H. (2011). A statistical framework for SNP calling, mutation discovery, association mapping and population genetical parameter estimation from sequencing data. Bioinformatics 27, 2987–2993. doi: 10.1093/bioinformatics/btr509
Li, H., Handsaker, B., Wysoker, A., Fennell, T., Ruan, J., Homer, N., et al. (2009). The sequence alignment/map format and SAMtools. Bioinformatics 25, 2078–2079. doi: 10.1093/bioinformatics/btp352
Love, M., Anders, S., and Huber, W. (2014). Differential analysis of count data–the DESeq2 package. Genome Biology 15:550. doi: 10.1186/s13059-014-0550-8
Luu, K., Bazin, E., and Blum, M. G. (2017). pcadapt: an R package to perform genome scans for selection based on principal component analysis. Mol. Ecol. Resour. 17, 67–77. doi: 10.1111/1755-0998.12592
Martinez-Finley, E. J., Chakraborty, S., Fretham, S. J., and Aschner, M. (2012). Cellular transport and homeostasis of essential and nonessential metals. Metallomics 4, 593–605. doi: 10.1039/C2MT00185C
Miyake, H., Kitada, M., Nakamura, K. I., Omata, T., and Itoh, T. (2010). Larvae of deep-sea chemosynthetic ecosystem animals in captivity. Cahiers Biol. Mar. 51, 441–450. doi: 10.1111/j.1439-0485.2006.00115.x
Miyazaki, J., Kawagucci, S., Makabe, A., Takahashi, A., Kitada, K., Torimoto, J., et al. (2017a). Deepest and hottest hydrothermal activity in the Okinawa Trough: the Yokosuka site at Yaeyama Knoll. Royal Soc. Open Sci. 4:171570. doi: 10.1098/rsos.171570
Miyazaki, J., Makabe, A., Matsui, Y., Ebina, N., Tsutsumi, S., Ishibashi, J. I., et al. (2017b). WHATS-3: an improved flow-through multi-bottle fluid sampler for deep-sea geofluid research. Front. Earth Sci. 5:45. doi: 10.3389/feart.2017.00045
Miyazaki, J. I., de Oliveira Martins, L., Fujita, Y., Matsumoto, H., and Fujiwara, Y. (2010). Evolutionary process of deep-sea Bathymodiolus mussels. PLoS One 5:e10363. doi: 10.1371/journal.pone.0010363
Nakajima, Y., Shinzato, C., Khalturina, M., Nakamura, M., Watanabe, H. K., Nakagawa, S., et al. (2018). Isolation and characterization of novel polymorphic microsatellite loci for the deep-sea hydrothermal vent limpet, Lepetodrilus nux, and the vent-associated squat lobster, Shinkaia crosnieri. Mar. Biodivers. 48, 677–684. doi: 10.1007/s12526-017-0704-5
Nakamura, K., Kawagucci, S., Kitada, K., Kumagai, H., Takai, K., and Okino, K. (2015). Water column imaging with multibeam echo-sounding in the mid-Okinawa Trough: implications for distribution of deep-sea hydrothermal vent sites and the cause of acoustic water column anomaly. Geochem. J. 49, 579–596. doi: 10.2343/geochemj.2.0387
Nan, F., Xue, H., Chai, F., Shi, L., Shi, M., and Guo, P. (2011). Identification of different types of Kuroshio intrusion into the South China Sea. Ocean Dyn. 61, 1291–1304. doi: 10.1007/s10236-011-0426-3
Parra, E. J., Marcini, A., Akey, J., Martinson, J., Batzer, M. A., Cooper, R., et al. (1998). Estimating African American admixture proportions by use of population-specific alleles. Am. J. of Hum. Genet. 63, 1839–1851. doi: 10.1086/302148
Paul, B. T., Manz, D. H., Torti, F. M., and Torti, S. V. (2017). Mitochondria and Iron: current questions. Exp. Rev. Hematol. 10, 65–79. doi: 10.1080/17474086.2016.1268047
Pegadaraju, V., Nipper, R., Hulke, B., Qi, L., and Schultz, Q. (2013). De novo sequencing of sunflower genome for SNP discovery using RAD (Restriction site Associated DNA) approach. BMC Genom. 14:556. doi: 10.1186/1471-2164-14-556
Purcell, S., Neale, B., Todd-Brown, K., Thomas, L., Ferreira, M. A., Bender, D., et al. (2007). PLINK: a tool set for whole-genome association and population-based linkage analyses. Am. J. Hum. Genet. 81, 559–575. doi: 10.1086/519795
Ramos, R., and Garcia, E. (2007). Induction of mixed-function oxygenase system and antioxidant enzymes in the coral Montastraea faveolata on acute exposure to benzo (a) pyrene. Toxicol. Pharmacol. 144, 348–355. doi: 10.1016/j.cbpc.2006.11.006
Raval, R., Simsa, R., and Raval, K. (2017). Expression studies of Bacillus licheniformis chitin deacetylase in E. coli Rosetta cells. Int. J. Biol. Macromol. 104, 1692–1696. doi: 10.1016/j.ijbiomac.2017.01.151
Robinson, M. D., McCarthy, D. J., and Smyth, G. K. (2010). edgeR: a Bioconductor package for differential expression analysis of digital gene expression data. Bioinformatics 26, 139–140. doi: 10.1093/bioinformatics/btp616
Rubin-Blum, M., Antony, C. P., Borowski, C., Sayavedra, L., Pape, T., Sahling, H., et al. (2017). Short-chain alkanes fuel mussel and sponge Cycloclasticus symbionts from deep-sea gas and oil seeps. Nature microbiology 2:17093. doi: 10.1038/nmicrobiol.2017.93
Schurch, N. J., Schofield, P., Gierliński, M., Cole, C., Sherstnev, A., Singh, V., et al. (2016). How many biological replicates are needed in an RNA-seq experiment and which differential expression tool should you use? RNA 22, 839–851. doi: 10.1261/rna.053959.115
Shen, Y., Kou, Q., Chen, W., He, S., Yang, M., Li, X., et al. (2016). Comparative population structure of two dominant species, Shinkaia crosnieri (Munidopsidae: Shinkaia) and Bathymodiolus platifrons (Mytilidae: Bathymodiolus), inhabiting both deep-sea vent and cold seep inferred from mitochondrial multi-genes. Ecol. Evol. 6, 3571–3582. doi: 10.1002/ece3.2132
Shinomiya, H. (2012). Plastin family of actin-bundling proteins: its functions in leukocytes, neurons, intestines, and cancer. Int. J. Cell Biol. 2012, 213492. doi: 10.1155/2012/213492
Simão, F. A., Waterhouse, R. M., Ioannidis, P., Kriventseva, E. V., and Zdobnov, E. M. (2015). BUSCO: assessing genome assembly and annotation completeness with single-copy orthologs. Bioinformatics 31, 3210–3212. doi: 10.1093/bioinformatics/btv351
Sun, J., Zhang, Y., Xu, T., Zhang, Y., Mu, H., Zhang, Y., et al. (2017). Adaptation to deep-sea chemosynthetic environments as revealed by mussel genomes. Nat. Ecol. Evol. 1:121. doi: 10.1038/s41559-017-0121
Suzuki, S., and Strominger, J. L. (1960). Enzymatic sulfation of mucopolysaccharides in hen oviduct I. Transfer of sulfate from 3’-phosphoadenosine 5’-phosphosulfate to mucopolysaccharides. J. Biol. Chem. 235, 257–266.
Swingle, M. R., and Honkanen, R. E. (2019). Inhibitors of serine/threonine protein phosphatases: biochemical and structural studies provide insight for further development. Curr. Med. Chem. 26, 2634–2660. doi: 10.2174/0929867325666180508095242
Tian, J., Yang, Q., Liang, X., Xie, L., Hu, D., Wang, F., et al. (2006). Observation of Luzon Strait transport. Geophys. Res. Lett. 33:L19607. doi: 10.1029/2006GL026272
Tian, J., Yang, Q., and Zhao, W. (2009). Enhanced diapycnal mixing in the South China Sea. J. Phys. Oceanogr. 39, 3191–3203. doi: 10.1175/2009JPO3899.1
Tobler, M., Passow, C. N., Greenway, R., Kelley, J. L., and Shaw, J. H. (2016). The evolutionary ecology of animals inhabiting hydrogen sulfide–rich environments. Annu. Rev. Ecol. Evol. Syst. 47, 239–262. doi: 10.1146/annurev-ecolsys-121415-032418
Trimukhe, K. D., and Varma, A. J. (2008). Complexation of heavy metals by crosslinked chitin and its deacetylated derivatives. Carbohydr. Polym. 71, 66–73. doi: 10.1016/j.carbpol.2007.05.016
Van Dover, C. L., German, C., Speer, K. G., Parson, L., and Vrijenhoek, R. (2002). Evolution and biogeography of deep-sea vent and seep invertebrates. Science 295, 1253–1257. doi: 10.1126/science.1067361
Vrijenhoek, R. C. (2013). On the instability and evolutionary age of deep-sea chemosynthetic communities. Top. Stud. Oceanogr. 92, 189–200. doi: 10.1016/j.dsr2.2012.12.004
Watanabe, H., Fujikura, K., Kojima, S., Miyazaki, J. I., and Fujiwara, Y. (2010). “Japan: Vents and Seeps in Close Proximity,” in The vent and seep biota, ed. S. Kiel (Dordrecht: Springer), 379–401. doi: 10.1007/978-90-481-9572-5_12
Watanabe, T., and Wakatsuchi, M. (1998). Formation of 26.8–26.9 σθ water in the kuril basin of the sea of okhotsk as a possible origin of north pacific intermediate water. J. Geophys. Res. 103, 2849–2865. doi: 10.1029/97JC02914
Wong, Y. H., Sun, J., He, L. S., Chen, L. G., Qiu, J. W., and Qian, P. Y. (2015). High-throughput transcriptome sequencing of the cold seep mussel Bathymodiolus platifrons. Sci. Rep. 5:16597. doi: 10.1038/srep16597
Xu, J., Ji, P., Zhao, Z., Zhang, Y., Feng, J., Wang, J., et al. (2012). Genome-wide SNP discovery from transcriptome of four common carp strains. PLoS One 7:e48140. doi: 10.1371/journal.pone.0048140
Xu, T., Sun, J., Lv, J., Watanabe, H. K., Li, T., Zou, W., et al. (2017). Genome-wide discovery of single nucleotide polymorphisms (SNPs) and single nucleotide variants (SNVs) in deep-sea mussels: Potential use in population genomics and cross-species application. Top. Stud. Oceanogr. 137, 318–326. doi: 10.1016/j.dsr2.2016.03.011
Xu, T., Sun, J., Watanabe, H. K., Chen, C., Nakamura, M., Ji, R., et al. (2018). Population genetic structure of the deep-sea mussel Bathymodiolus platifrons (Bivalvia: Mytilidae) in the Northwest Pacific. Evol. Appl. 11, 1915–1930. doi: 10.1111/eva.12696
Yahagi, T., Watanabe, H., Kojima, S., and Kano, Y. (2017). Do larvae from deep-sea hydrothermal vents disperse in surface waters? Ecology 98, 1524–1534. doi: 10.1002/ecy.1800
Yang, C. H., Tsuchida, S., Fujikura, K., Fujiwara, Y., Kawato, M., and Chan, T. Y. (2016). Connectivity of the squat lobsters Shinkaia crosnieri (Crustacea: Decapoda: Galatheidae) between cold seep and hydrothermal vent habitats. Bull. Mar. Sci. 92, 17–31. doi: 10.5343/bms.2015.1031
You, Y., Chern, C. S., Yang, Y., Liu, C. T., Liu, K. K., and Pai, S. C. (2005). The South China Sea, a cul-de-sac of North Pacific intermediate water. J. Oceanogr. 61, 509–527. doi: 10.1007/s10872-005-0059-6
Yuan, Y., Liao, G., Wang, H., Lou, R., and Chen, H. (2009). Variability of the currents in the Luzon Strait during spring of 2002 obtained from observations and satellite geostrophic currents and spectral analyses. Earth Sci. 52, 519–531. doi: 10.1007/s11430-009-0041-z
Zhang, Z., Zhang, Y., Evans, P., Chinwalla, A., and Taylor, D. (2017). RNA-seq 2G: online analysis of differential gene expression with comprehesive options of statistical methods. bioRxiv[Preprint]. doi: 10.1101/122747
Keywords: deep sea, gene expression, population connectivity, RNA-seq, single-nucleotide polymorphism
Citation: Xiao Y, Xu T, Sun J, Wang Y, Wong WC, Kwan YH, Chen C, Qiu J-W and Qian P-Y (2020) Population Genetic Structure and Gene Expression Plasticity of the Deep-Sea Vent and Seep Squat Lobster Shinkaia crosnieri. Front. Mar. Sci. 7:587686. doi: 10.3389/fmars.2020.587686
Received: 27 July 2020; Accepted: 22 September 2020;
Published: 02 November 2020.
Edited by:
Yong Wang, Institute of Deep-Sea Science and Engineering (CAS), ChinaReviewed by:
Yong-Jin Won, Ewha Womans University, South KoreaYun-wei Dong, Xiamen University, China
Copyright © 2020 Xiao, Xu, Sun, Wang, Wong, Kwan, Chen, Qiu and Qian. This is an open-access article distributed under the terms of the Creative Commons Attribution License (CC BY). The use, distribution or reproduction in other forums is permitted, provided the original author(s) and the copyright owner(s) are credited and that the original publication in this journal is cited, in accordance with accepted academic practice. No use, distribution or reproduction is permitted which does not comply with these terms.
*Correspondence: Jian-Wen Qiu, cWl1andAaGtidS5lZHUuaGs=; Pei-Yuan Qian, Ym9xaWFucHlAdXN0Lmhr
†These authors have contributed equally to this work