 Anna de Kluijver1*
 Martijn C. Bart2
 Dick van Oevelen3
 Jasper M. de Goeij2
 Sally P. Leys4
 Sandra R. Maier3
 Manuel Maldonado5
 Karline Soetaert1,3Sander Verbiest1
 Jack J. Middelburg1
- 1Department of Earth Sciences, Faculty of Geosciences, Utrecht University, Utrecht, Netherlands
- 2Department of Freshwater and Marine Ecology, Institute for Biodiversity and Ecosystem Dynamics, University of Amsterdam, Amsterdam, Netherlands
- 3Department of Estuarine and Delta Systems, Royal Netherlands Institute for Sea Research (NIOZ) and Utrecht University, Yerseke, Netherlands
- 4Department of Biological Sciences, University of Alberta, Edmonton, AB, Canada
- 5Center for Advanced Studies of Blanes (CEAB), Spanish National Research Council (CSIC), Girona, Spain
Deep-sea sponges and their microbial symbionts transform various forms of carbon (C) and nitrogen (N) via several metabolic pathways, which, for a large part, are poorly quantified. Previous flux studies on the common deep-sea sponge Geodia barretti consistently revealed net consumption of dissolved organic carbon (DOC) and oxygen (O2) and net release of nitrate (). Here we present a biogeochemical metabolic network model that, for the first time, quantifies C and N fluxes within the sponge holobiont in a consistent manner, including many poorly constrained metabolic conversions. Using two datasets covering a range of individual G. barretti sizes (10–3,500 ml), we found that the variability in metabolic rates partially resulted from body size as O2 uptake allometrically scales with sponge volume. Our model analysis confirmed that dissolved organic matter (DOM), with an estimated C:N ratio of 7.7 ± 1.4, is the main energy source of G. barretti. DOM is primarily used for aerobic respiration, then for dissimilatory reduction to ammonium ( (DNRA), and, lastly, for denitrification. Dissolved organic carbon (DOC) production efficiencies (production/assimilation) were estimated as 24 ± 8% (larger individuals) and 31 ± 9% (smaller individuals), so most DOC was respired to carbon dioxide (CO2), which was released in a net ratio of 0.77–0.81 to O2 consumption. Internally produced from cellular excretion and DNRA fueled nitrification. Nitrification-associated chemoautotrophic production contributed 5.1–6.7 ± 3.0% to total sponge production. While overall metabolic patterns were rather independent of sponge size, (volume-)specific rates were lower in larger sponges compared to smaller individuals. Specific biomass production rates were 0.16% day–1 in smaller compared to 0.067% day–1 in larger G. barretti as expected for slow-growing deep-sea organisms. Collectively, our approach shows that metabolic modeling of hard-to-reach, deep-water sponges can be used to predict community-based biogeochemical fluxes and sponge production that will facilitate further investigations on the functional integration and the ecological significance of sponge aggregations in deep-sea ecosystems.
Introduction
Sponges are abundant and key ecosystem engineers of the deep sea that occur scattered on soft- and hard-bottomed surfaces and in multi- or mono-specific aggregations (Maldonado et al., 2017). These so-called sponge grounds create complex habitats and thereby support high local biodiversity (Klitgaard, 1995; Hogg et al., 2010; Beazley et al., 2013). As deep-sea sponges process large amounts of water for filter feeding, they are implicated to have an important role in the biogeochemical cycling and benthic–pelagic coupling of carbon (C), nitrogen (N), and silicon (Si) (Maldonado et al., 2012, 2019; Kutti et al., 2013; Kahn et al., 2015).
Deep-sea sponges efficiently filter (preferably nano- and pico-) plankton (Pile and Young, 2006; Yahel et al., 2007; Kahn et al., 2015) and, similar to their shallow counter parts (de Goeij et al., 2013), consume dissolved organic carbon (DOC), constituting most of their diet (Bart et al., 2020b). The efficiency at which sponges process (e.g., assimilate, respire, release) organic and inorganic nutrients (e.g., C, N) is termed production efficiency, which is an important ecological and metabolic parameter to determine energy (re)cycling in organisms (also referred to as growth efficiency) (Thomassen and Riisgard, 1995; Sterner and Elser, 2002; Maldonado et al., 2012; de Goeij et al., 2017) and ecosystems (Keesing et al., 2013; Kahn et al., 2015; Porada et al., 2018). Despite its potential relevance, the C and N production efficiency of deep-sea sponges and most other deep-sea benthos are largely unknown—especially in situ assessments of metabolic rates and conversions—because of the technical constraints of conducting (properly controlled) experiments in the deep sea. Recent advances in technology and accessibility of remotely operated vehicle have increased the ability to collect live deep-sea sponges for ex situ-controlled laboratory experiments (e.g., Kutti et al., 2015; Leys et al., 2018; Bart et al., 2020a,b) and even in situ metabolic rate measurements (Yahel et al., 2007; Kahn et al., 2015; Maldonado et al., 2020a).
Geodia barretti (Porifera, Demospongiae) is one of the best studied deep-sea sponge species. In the North-Atlantic Ocean, along the continental shelf and in fjords, the massive, ball-shaped G. barretti can be present in large densities of up to 0.4–5 individuals per square meter, known as “Geodia grounds” (Murillo et al., 2012; Kutti et al., 2013; Beazley et al., 2015). It is considered to be a slow-growing sponge species that, if undisturbed, can reach a meter in diameter, although most specimens have a diameter of 20–30 cm (Klitgaard and Tendal, 2004; Kutti et al., 2013). Oxygen (O2) consumption by G. barretti individuals, combined with biomass estimates from video imaging, indicated that Geodia sponge grounds have high metabolic activity and C demand (ex situ, Kutti et al., 2013; eddy correlation, Cathalot et al., 2015). To date, the metabolic C demands of G. barretti have been derived from O2 consumption measurements and a supposed respiratory quotient (RQ) for organic matter (OM) mineralization (O2:CO2). Despite the importance of RQ in estimating the C demand from O2 measurements, its value has never been empirically determined for G. barretti. The RQ values for G. barretti might deviate from values for canonical organic matter mineralization because of the various metabolic pathways conducted by the endosymbionts.
G. barretti is considered as a high microbial abundance (HMA) species, containing a dense and diverse community of microbial symbionts (∼1011 microbes per cubic centimeter) (Hoffmann et al., 2009; Leys et al., 2018). Microbial symbionts (i.e., the microbiome) and sponge host are a metabolically integrated functional unit, known as a “holobiont.” This, generally considered mutualistic, symbiosis is known to benefit in a variety of ways, which include nutrition, development, defense, and immunity (Pita et al., 2018). In G. barretti, the microbiome is actively involved in the (re)cycling of C and N compounds and, therefore impacts the holobiont nutrition (Hoffmann et al., 2009; Leys et al., 2018; Bart et al., 2020a). As for many sponge species, anaerobic and aerobic N-transforming processes occur in G. barretti, thereby expanding its metabolic capacity (Hoffmann et al., 2009; Rooks et al., 2020). It has been hypothesized that G. barretti actively controls the oxygenation level of its tissue to maintain aerobic and anaerobic micro-environments that facilitate the co-existence of aerobic and anaerobic symbionts (Hoffmann et al., 2005). The nitrifying and denitrifying potential of the microbial populations within the tissue of G. barretti has been demonstrated by cutting sponges in small fragments (0.3–0.4 cm3) and incubating those pieces under labeled substrates (Hoffmann et al., 2009; Rooks et al., 2020). However, N transformations within intact, pumping G. barretti individuals have yet to be resolved and quantified.
Two studies have examined the C, N, and O2 exchange rates of intact G. barretti individuals. Leys et al. (2018) studied larger specimens (∼1-L volume) using the “in–ex” methodology, i.e., sponge filtration rates are combined with the composition of inhalant and exhalant water to obtain release/uptake fluxes. Bart et al. (2020b) used incubation flow chambers to quantify fluxes for smaller (∼100-ml volume) specimens. Both studies found that G. barretti effectively removed organic C and concluded that the observed organic matter consumption was sufficient to sustain the minimal metabolic needs. Bart et al. (2020b) found a relatively higher net organic C intake compared to Leys et al. (2018). This difference can be attributed to the smaller size of the individuals tested by Bart et al. (2020b), as volume-specific pumping rates may be related to sponge size (Morganti et al., 2019). Regarding N, intact G. barretti was found to release nitrate () rather than ammonium (), indicative of net nitrification (Leys et al., 2018), yet the metabolic conversions of O2, C, and N within and exchanges among sponge and symbionts can be complex, and it is not straightforward to derive those from net fluxes obtained by the in–ex and chamber incubation techniques.
To integrate existing experimental metabolic flux data, we constructed a metabolic network model for the holobiont. Metabolic (or stoichiometric) network models are common tools to quantify and predict the intracellular metabolism of, for example, eukaryotic cells and microbes (Palsson and Varma, 1994; Edwards and Covert, 2002) based on net resource (e.g., C, N) fluxes. Such models are underexplored to quantify sponge–symbiont metabolism, despite their potential to elucidate the intricacies of the sponge physiology and their ecological significance. To date, only one study that employs a genome-scale metabolic network model to reconstruct biochemical conversions in the sponge–symbiont system of the tropical sponge Amphimedon queenslandica exists (Watson, 2017). In our study, we applied the metabolic network model to quantify internal and unconstrained C, N, and O2 fluxes of the common and abundant deep-sea G. barretti holobiont. To assess the size dependency of G. barretti metabolism, we compared and separately analyzed the metabolic datasets of Leys et al. (2018) and Bart et al. (2020b) because they assessed different size classes. The size dependency of metabolism is particularly relevant when estimating the metabolic fluxes and metabolic demands of sponge grounds from video images. The outcome of the model advances the understanding on G. barretti metabolism and its potential role in biogeochemical cycling within the vast, benthic deep-sea ecosystems where it abounds.
Materials and Methods
Datasets
The experimental data of Leys et al. (2018) and Bart et al. (2020b) were used to develop and constrain the metabolic network model for larger and smaller G. barretti, respectively, since they cover different size ranges. We refer to their publications (Leys et al., 2018; Bart et al., 2020b) for a full description of sponge collection, experimental procedures, data analyses, and data presentation and only briefly recap some relevant aspects here.
In short, Leys et al. (2018) maintained G. barretti individuals in ex situ (running seawater) conditions in the Institute of Marine Research aquarium facilities at Austevoll (Norway) and measured exchange fluxes using the “in–ex” method. The flow rates and O2 uptake of G. barretti were collected simultaneously in 2012 (n = 17, sponge volume = 150–3,500 ml) (Table 1). Dissolved inorganic N [DIN, consisting of , nitrite (, and ] exchange rates and bacterial cell removal were measured in 2011 (n = 53, sponge volume = 125–3,400 ml), and DIN exchange rates and total OC (TOC = DOC + POC) removal were measured in 2014 (n = 29, sponge volumes unknown) (Table 1). Leys et al. (2018) converted bacterial cell removal to bacterial C uptake using standard conversion factors and defined DOC uptake as TOC uptake minus bacterial C uptake (Table 1). Bart et al. (2020b) measured exchange fluxes in G. barretti individuals (n = 12, sponge volume = 9–210 ml) (Table 1) using incubation flow chambers under ex situ (running seawater) conditions in aquarium facilities in Bergen (Norway) in 2017 (n = 9) and 2018 (n = 3). O2, DOC, and living POC (LPOC, consisting of bacteria and phytoplankton C) removal rates were calculated from changes in incubation water and used to calculate a C budget (Table 1; Bart et al., 2020b). For both studies, the incubation water was collected from 160-m depth (Leys et al., 2018) and 200-m depth (Bart et al., 2020b) from nearby fjords, thus representing deep water. This corresponds with the depth range of 200–300 m where G. barretti grounds are typically found (Klitgaard and Tendal, 2004).
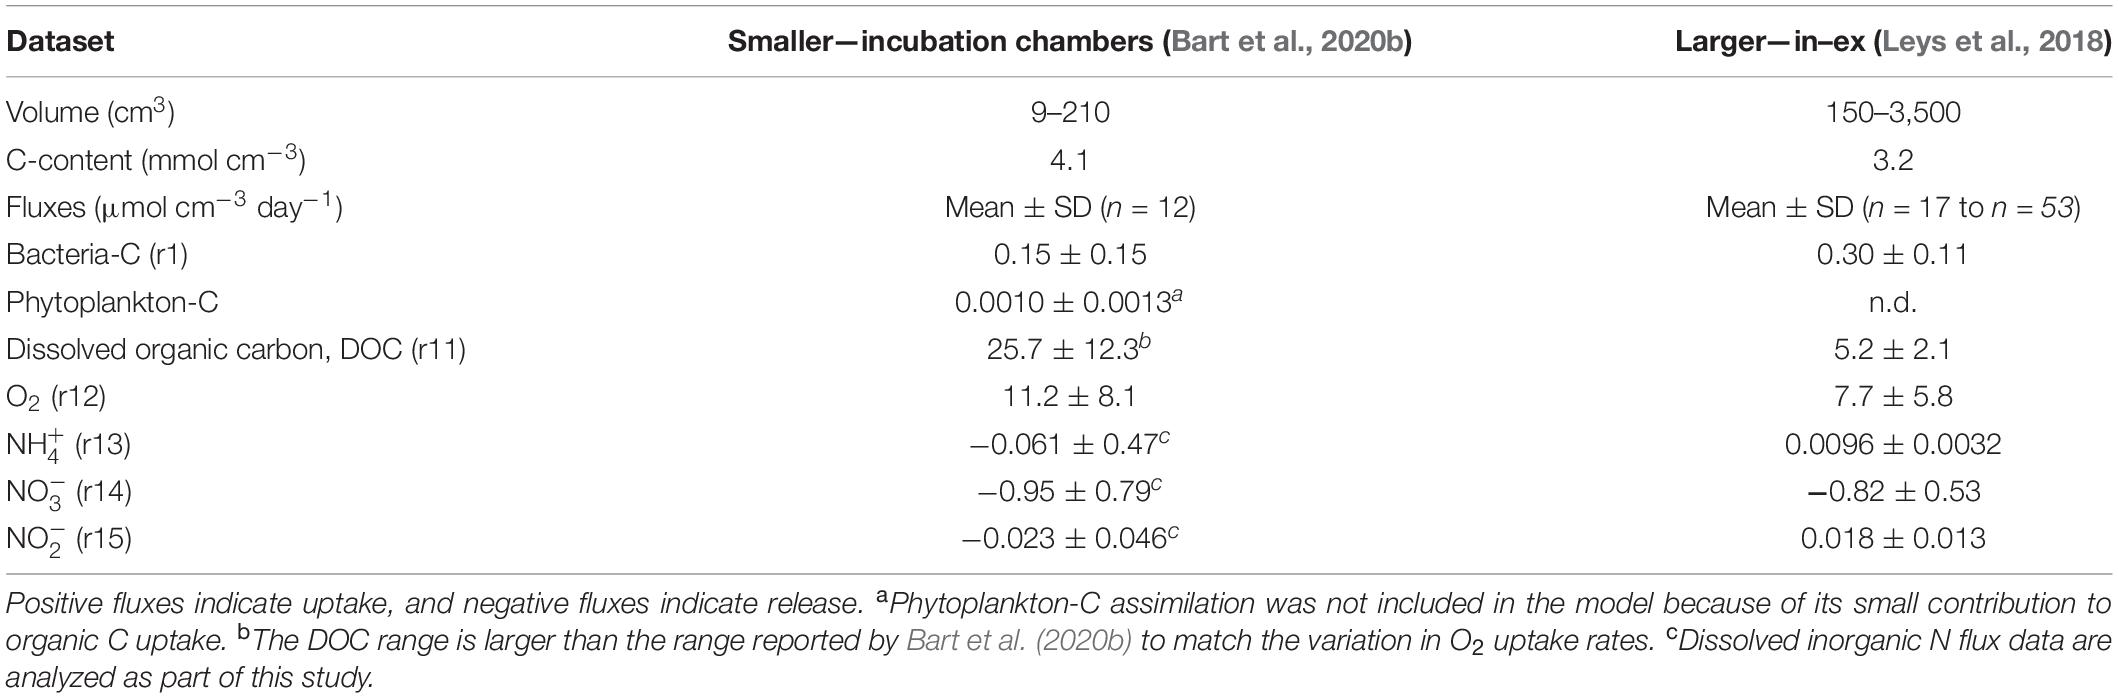
Table 1. Experimental metabolic datasets of intact Geodia barretti sponges (Leys et al., 2018; Bart et al., 2020b) which were analyzed with the metabolic network model.
DIN Exchange Rates From Incubation Chambers
Changes in DIN (, , and ) were also measured by Bart et al. (2020b), but as these data were not presented before, the procedures and the results are presented in this paper. DIN fluxes were determined as follows: duplicate samples for DIN (, , and ) were collected at t = 0, 1, 2, 3, and 4 h in 2017 and t = 0, 2, 4, 6, and 8 h in 2018 from the incubation chambers with acid-washed 100-ml polycarbonate syringes. The samples were subsequently filtered over sterile 0.2-μm polyethersulfone syringe filters (Whatman Puradisc), collected in 10-ml high-density polyethylene vials, and stored at −20°C until further analysis. Nutrients were analyzed in the laboratory with a QuAAtro Gas Segmented Continuous Flow Analyzer. Measurements were made simultaneously for (Helder and de Vries, 1979), , and combined with (Grasshoff et al., 2009). All measurements were calibrated with standards diluted in low-nutrient seawater. DIN exchange rates were calculated from a linear regression slope and incubation volume and corrected with changes in control (i.e., no sponge) incubations. Fluxes were normalized to sponge volume to obtain fluxes in μmol N cm–3 (sponge) day–1 (Table 1, Supplementary Figure 1).
Linear Inverse Modeling Concepts
Metabolic network models are a type of linear inverse modeling (LIM), which are based on mass balances under steady-state conditions. This implies that the internal changes of a substance due to chemical reactions are balanced by the inflow and outflow into a system and that the system can be solved by a set of linear equations (Edwards and Covert, 2002). The steady-state metabolic situation is justified by the rationale that chemical reactions take place on shorter timescales than transport (exchange) fluxes (Edwards and Covert, 2002). As detailed through subsequent sections, LIM of stoichiometric (metabolic) networks requires the following: (1) selection of relevant substances and (chemical) processes and conceptualization of the metabolic network, (2) stoichiometrically balancing of all chemical reactions and construction of mass balances for each substance, (3) constraining model solutions with actual flux measurements or fluxes derived from literature (although LIM can solve for or constrain missing flux data), and (4) mathematically solving the model, including variability and uncertainty analysis (Edwards and Covert, 2002; Soetaert and van Oevelen, 2009; van Oevelen et al., 2010).
Sponge Metabolic Network Model Concept
The metabolic network model integrates the C, N, and O2 metabolism of G. barretti and consists of both net holobiont metabolism and host versus symbiont-driven metabolism (Figure 1 and Table 2). In detail, sponges rely largely on heterotrophy as they filter the water column for LPOC, consisting predominantly of bacterioplankton in the deep sea (Bart et al., 2020b; Table 1) (r1), and consume dissolved organic matter (DOM) (r11). Sponges aerobically respire assimilated organic matter to obtain energy for basal metabolism (r1–r2). The metabolic waste of N is mineralized to (r1–r2). The assimilated organic matter that is not required for basal metabolism is allocated to biomass production (r10). The C (or N) balance for sponges applied in the network model is: assimilation = production + respiration (mineralization in case of N) (Thomassen and Riisgard, 1995; Maldonado et al., 2012).
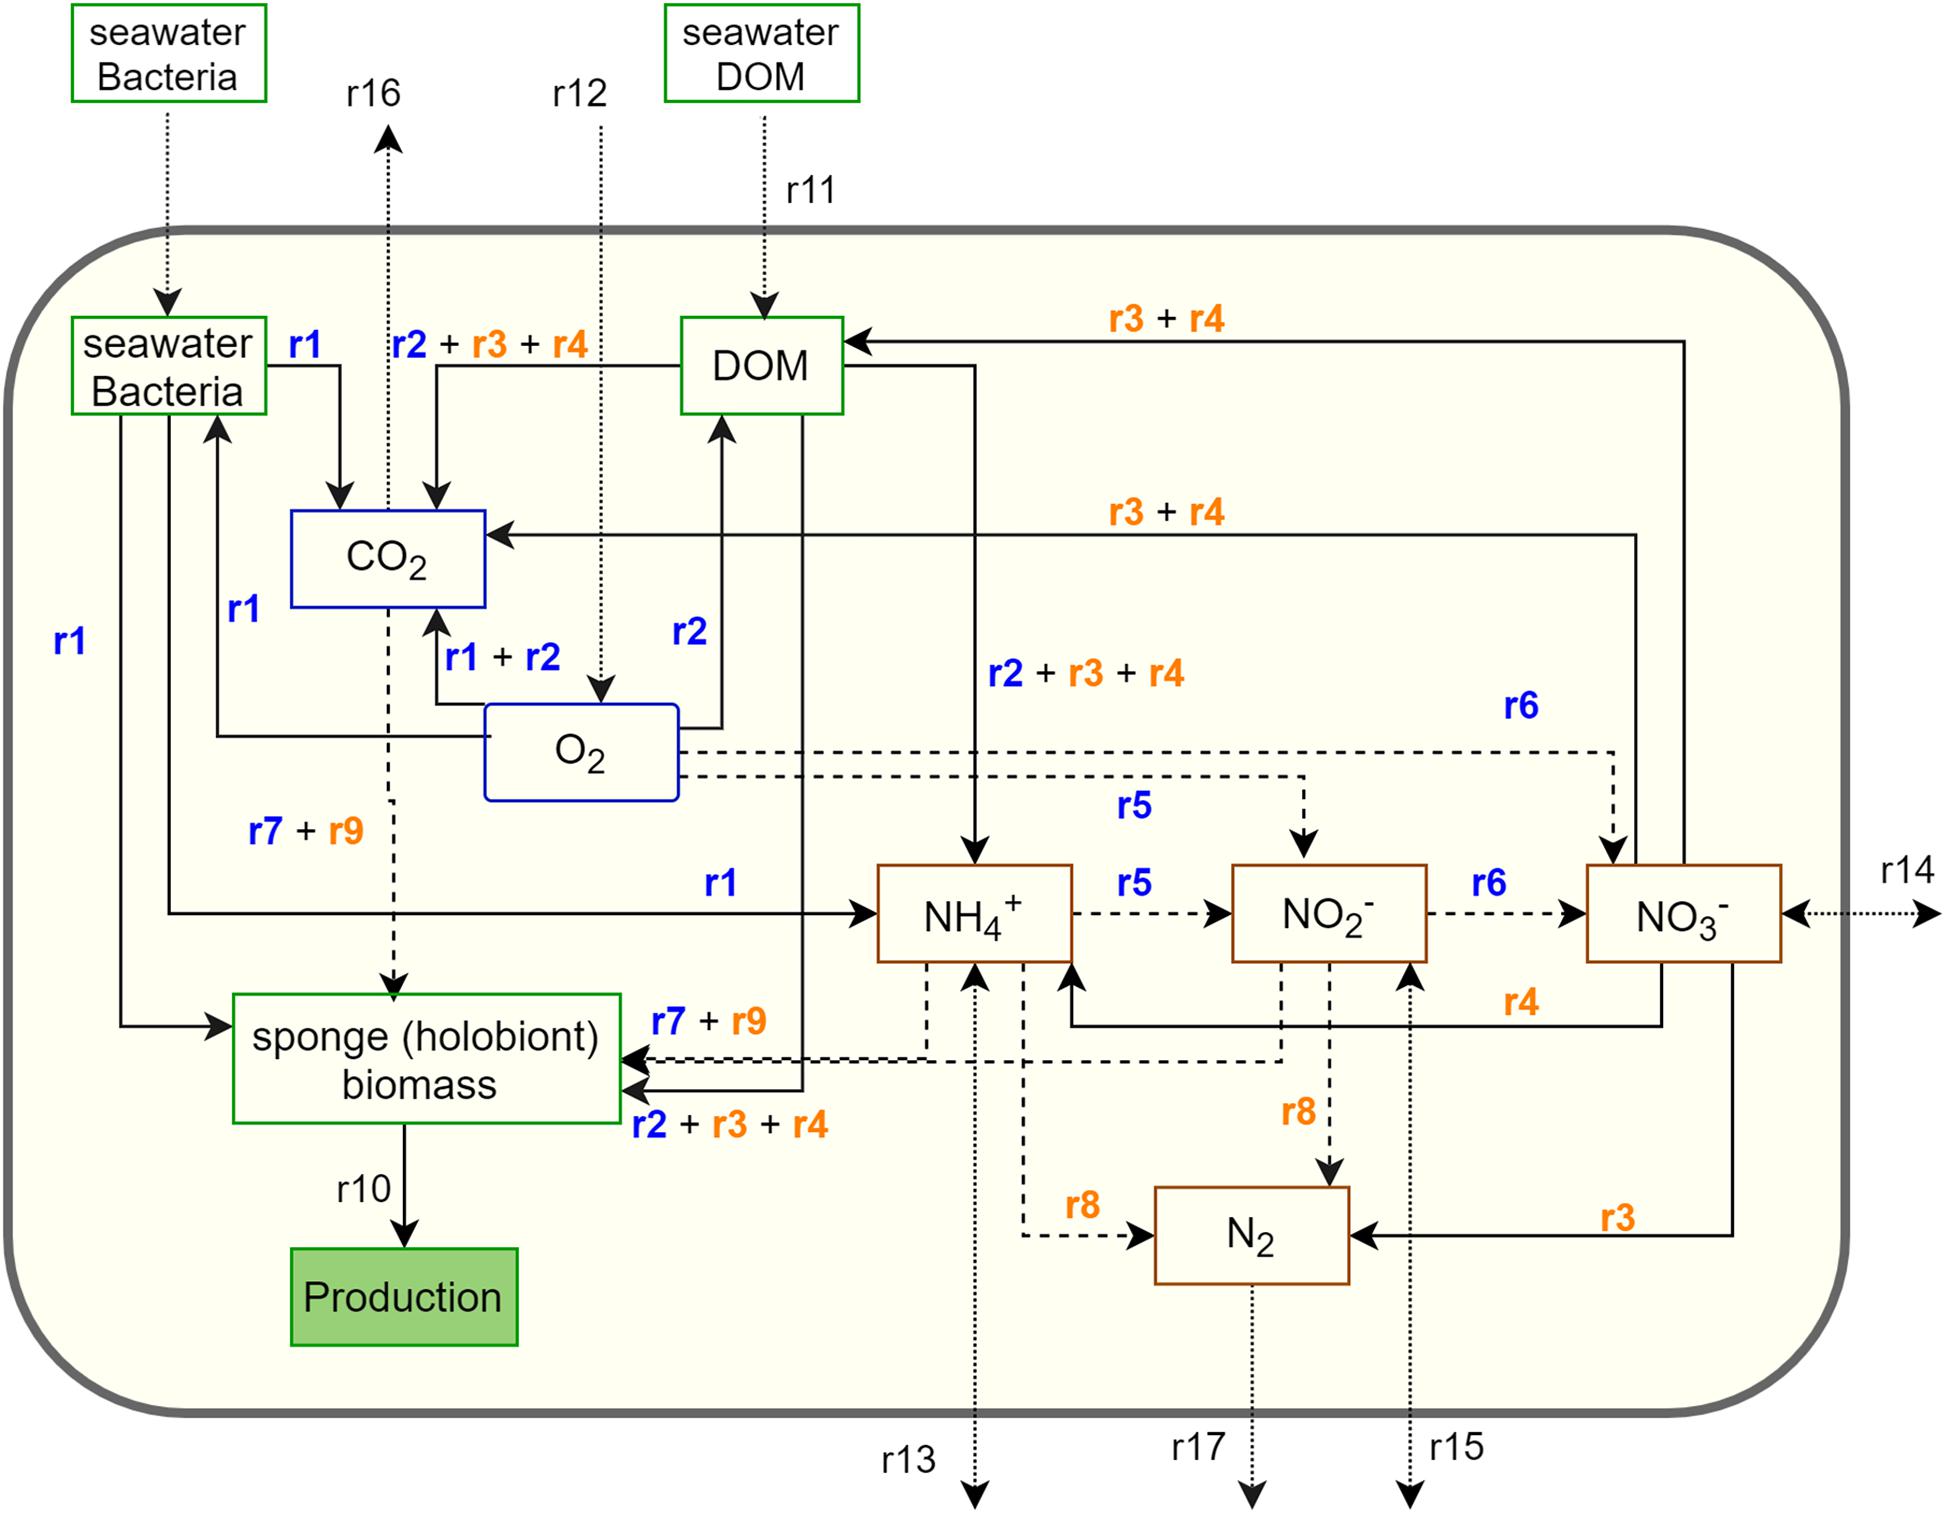
Figure 1. Schematic representation of the metabolic network model for a sponge holobiont (large yellow box) containing nitrogen species (brown boxes), organic substances (green boxes), and O2/CO2 (blue boxes). Production (filled green) is not a standing stock, but a closure term for production of sponge biomass. The arrows indicate metabolic transformations: solid arrows refer to heterotrophic processes, dashed arrows refer to chemoautotrophy, and dotted arrows indicate exchange with the environment. Reaction numbers correspond with those in Table 2: blue numbers indicate aerobic processes, and orange numbers indicate anaerobic processes.
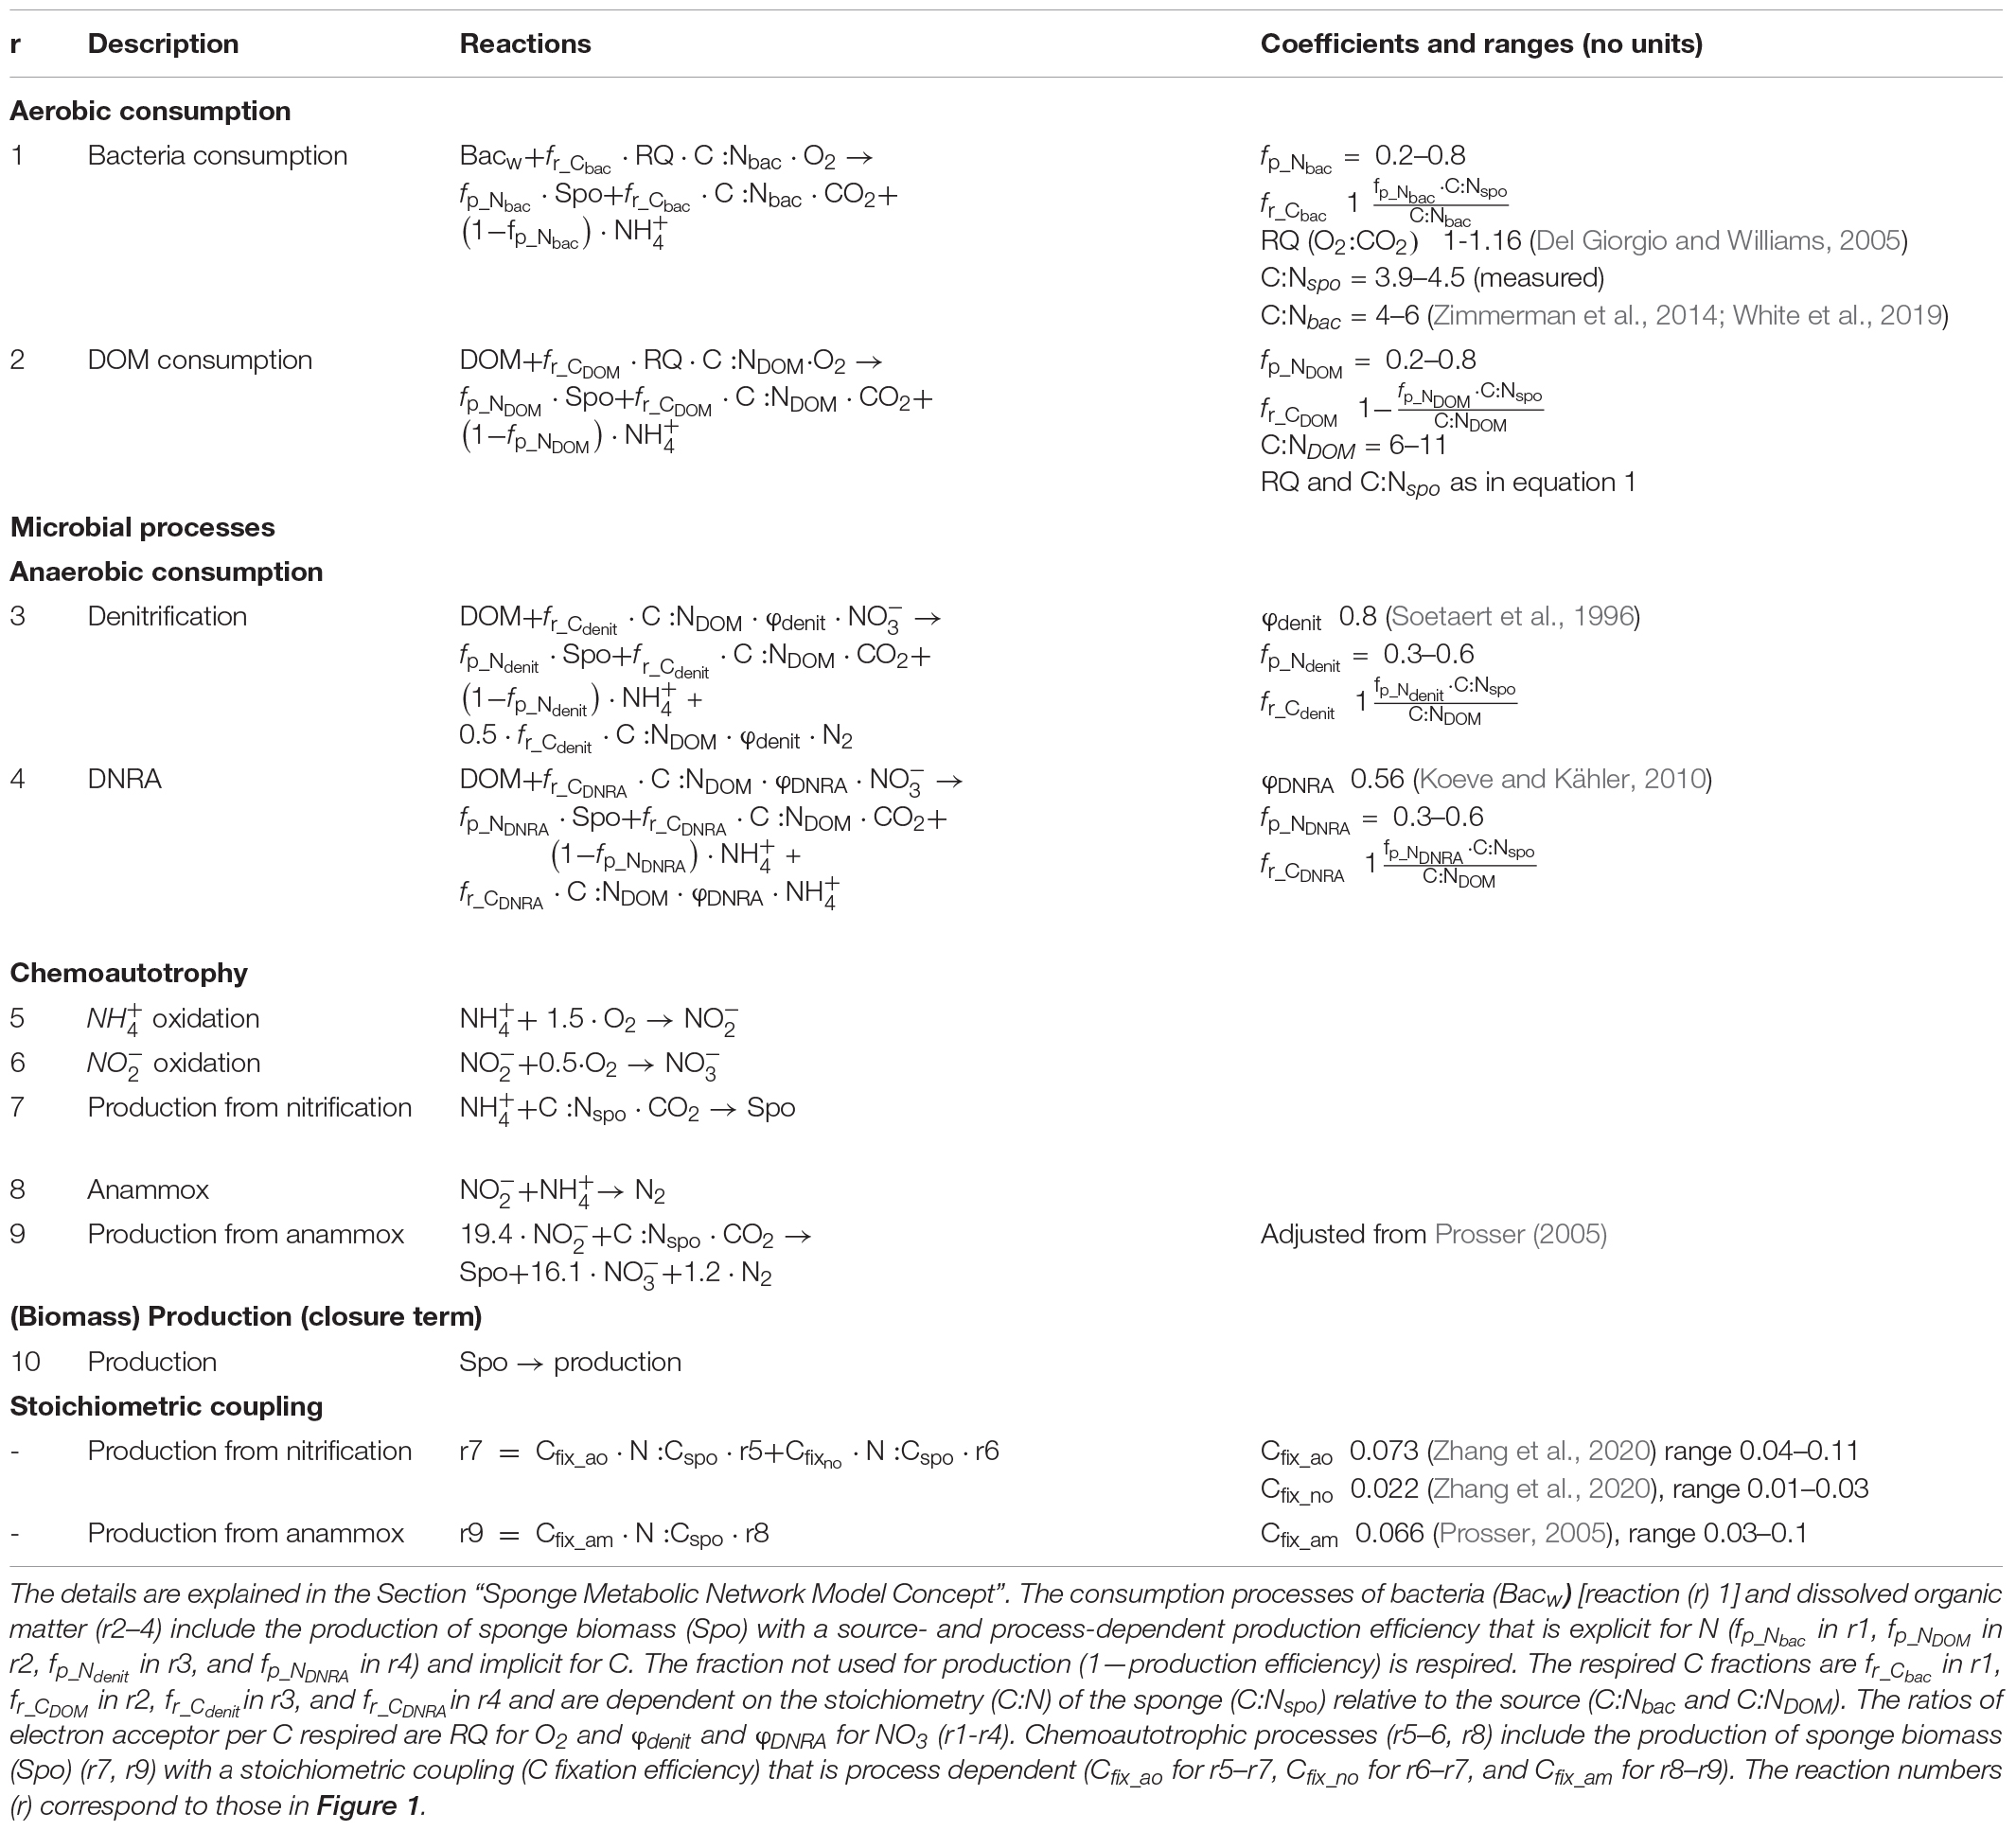
Table 2. Reactions and coefficients involved in C, N, and O metabolism as implemented in the metabolic network model.
Microbial symbionts expand the metabolic capacity of the sponge host by exploiting metabolic pathways additional to mere aerobic respiration, such as heterotrophy coupled to denitrification (r3) (Hoffmann et al., 2005; Rooks et al., 2020) and dissimilatory reduction to (DNRA) (r4) in anoxic parts of the sponge. The latter process has not been measured, but the accompanying genes (napA, nrfA) were found in G. barretti (Gavriilidou, personal communication). The included chemoautotrophic processes are nitrification in oxic (r5, r6) and anaerobic oxidation (anammox) (r8) in anoxic parts of the sponge holobiont (Hoffmann et al., 2005; Rooks et al., 2020). N2 fixation is not considered in the model since, at present, no genetic evidence exists for G. barretti (Rooks et al., 2020). All considered microbial processes yield production (growth) of symbionts, either via anaerobic heterotrophy (denitrification and DNRA) or chemoautotrophy (nitrification and anammox) (r7, r9; Table 2). The production of symbiont biomass is considered an integrative part of sponge holobiont production, as the sponge host can phagocyte and ingest (in an undetermined amount) microbial symbionts that may continuously grow within the sponge tissue, including chemoautotrophic bacteria. The process of assimilation by symbionts (for which genetic evidence exists; Gavriilidou, personal communication) is considered implicit in organic matter consumption (r1–r2), where it functions as an internal feedback loop (from to production). Because of the steady-state approach, production of sponge (holobiont) biomass is treated as a closure term (r10).
Finally, all remaining mass-balanced substances, i.e., DOM (r11), O2 (r12), (r13), (r14), (r15), CO2 (r16), and N2 (r17), have an exchange with the environment (Figure 1).
Reactions and Coefficients
All reactions are stoichiometrically coupled for N and C, with N as base and C derived from the stoichiometry of the substrates. For example, in reaction 2, assimilated DOM is converted to sponge (holobiont) biomass (“Spo”) with a N production efficiency (fp_N_DOM), while the remaining fraction is excreted as (1−fp_NDOM). The C production efficiency (fp_C_DOM) and the fraction that is respired to CO2 (fr_CDOM =1−fp_CDOM) depends on the stoichiometry (molar C:N ratio) of DOM and sponge biomass:fp_CDOM = fp_NDOM⋅ C:Nspo / C:NDOM (Table 2). Reactions 1, 3, and 4 have a similar structure as reaction 2 (Table 2). The measured (molar) stoichiometry of G. barretti biomass “Spo” (C:Nspo) is 4.2 ± 0.29 [n = 20 specimens collected by Bart et al. (2020b) and Maier et al. (2020)]. The C:N ratios of assimilated food sources (bacteria and DOM) are unconstrained, but experimental studies indicated that G. barretti preferentially assimilates N-rich DOM, with C:N ratios close to or below Redfield (C:N < 6.6) (Maier et al., 2020; Bart et al., 2020a). The C:N ratios of marine bacteria (C:Nbac) are typically 4 to 6, thus below the Redfield ratio (Sterner and Elser, 2002; Zimmerman et al., 2014; White et al., 2019). The C:N ratios of seawater DOM (C:NDOM) are generally higher, with average C:N ratios of labile DOM of 10.7 (Hopkinson and Vallino, 2005). The C production efficiencies of metazoans typically range from ∼20 to 30%, which would correspond to fp_NDOM of 32–48% on Redfield DOM (C:NDOM = 6.6). However, G. barretti might have a higher fp_N_DOM as heterotrophic symbionts can assimilate into organic N (Hentschel et al., 2012; Gavriilidou pers. communication). The C production efficiency for denitrification (fp_Cdenit) is ∼25% (Koike and Hattori, 1975; van den Berg et al., 2016), and DNRA has a comparable production efficiency (fp_CDNRA)(Strohm et al., 2007; van den Berg et al., 2016). Depending on the stoichiometry of DOM, the N production efficiencies (fp_Ndenit) and (fp_NDNRA) are expected to range from 30 to 60%. The variability and uncertainty in C:N of the assimilated substrates and production efficiencies were considered in model solutions (Table 2, “Section Model Implementation and Solutions”).
Oxygen is used as electron acceptor in r1 and r2, and the respiratory quotient (RQ; O2 consumed to CO2 produced) depends on the elemental composition of the substrate and the fraction of substrate that is respired (Table 2 and Figure 1). RQ ranges from 1 for oxidation of glucose to 1.16 for complete mineralization of plankton Redfield OM (C:N = 6.6) to (Del Giorgio and Williams, 2005; Middelburg, 2019). In anoxic parts of the sponge tissue, may be used as an electron acceptor and is reduced to N2 in denitrification (r3, Table 2) and to in DNRA (r4, Table 2). consumption per CO2 produced for Redfield OM in denitrification (φdenit) is 0.8 (r3; Soetaert et al., 1996; Strohm et al., 2007). In DNRA, this ratio (φDNRA) is determined as 0.56 (r4; Koeve and Kähler, 2010). In the oxic compartments of the sponge holobiont, is oxidized to (r5) and is oxidized to (r6). oxidation in G. barretti is primarily conducted by archaea, while oxidizers are primarily Nitrospira bacteria (Radax et al., 2012). The energy and the corresponding chemoautotrophic yields are higher for oxidation than for oxidation, with an average reported molar Cfix:Noxidized ratios of 0.073 for -oxidizing archaea (Zhang et al., 2020) and 0.022 for -oxidizing bacteria (Zhang et al., 2020). These chemoautotrophic yields were used to constrain the production of sponge holobiont “Spo” (r7) as a function of r5 and r6 (Table 2 and Figure 1). In the anoxic compartments of the sponge holobiont, anammox takes place (Hoffmann et al., 2009), in which N2 is produced from and by anammox bacteria (r8). The growth and the energy yields of anammox bacteria are well studied; anammox bacteria fix inorganic C coupled to oxidation (r9), with ∼0.07 Cfix: oxidized (Prosser, 2005; Thamdrup, 2012), which was used to constrain r9 as a function of r8 (Table 2 and Figure 1).
Model Constraints
The metabolic network model is generic and can be applied to any sponge volume, depending on data availability. Since two almost complete metabolic flux datasets were available for G. barretti that covered distinct volumes [9–210 ml (Bart et al., 2020b) versus 150–3,500 ml (Leys et al., 2018)] and are based on different methods, we quantified metabolism of “smaller” (from incubation chambers) and “larger” (by in–ex) G. barretti individuals separately (Table 1). This not only allowed us to evaluate the potential size dependence of metabolic activities but also provided an independent assessment of the eventual metabolic patterns inferred.
The measured metabolic exchange fluxes (μmol cm–3 day–1) were used to constrain the exchange fluxes of O2 (r12), (r13), (r14), and (r15) for smaller (incubation chambers) and larger (in–ex) specimens (Table 1). For external bacteria uptake (r1) and DOM uptake (r11), the measured bacteria C and DOC uptake fluxes combined with C:Nbac and C:NDOM constrained the model.
In addition, the model was constrained with 13 inequalities (soft constraints), of which 10 stated that all metabolic reactions (r1–r10) must be positive. Furthermore, two inequalities limited DOM consumption in denitrification and DNRA (r3, r4) to be lower than aerobic DOM consumption (r2). Lastly, the anammox rates (r8) were constrained to be limited to a maximum of 20% of denitrification rates (r3) (Hoffmann et al., 2009; Rooks et al., 2020).
Model Implementation and Solutions
The metabolic network model of G. barretti was implemented and solved in the modeling environment R (R Core Team, 2018) with R-package LIM (van Oevelen et al., 2010). With 17 unknowns (reactions) and 16 knowns (eight mass balances and eight constraints), the model was almost even determined, resulting in small ranges of possible solutions for each reaction. The (small) ranges in reaction rates were assessed by Bayesian sampling of the solution space with 500 iterations using the function “xsample” (Van den Meersche et al., 2009). This resulted in reaction rate values with standard deviations < 4% of average. The variation in reaction rates is mostly depending on model input parameters, which comprises reaction coefficients (e.g., C:NDOM and fp_N_DOM) (Table 2) and constraints (e.g., measured O2 uptake and release; Table 1). However, the linear setup allows only single-parameter values rather than ranges. Inclusion of uncertainty and variability in parameters was achieved by creating one million model input files with values that were randomly sampled from parameter ranges. The ranges for reaction coefficients are as explained in “Section “Reactions and Coefficients”” (Table 2), and the ranges for constraints are mean ± standard deviation (SD) for larger and smaller sponges (Table 1). Only ∼0.2–1.0% of parameter combinations resulted in a feasible model solution, corresponding to 10,088 and 2,228 feasible model solutions for smaller and larger sponges, respectively. The feasibility of parameters to produce successful results gives an indication on the likelihood of these parameter values. A successful input file is available in the Supporting Information. The R code to run the model is available at Zenodo (doi: 10.5281/zenodo.4139792). The model results from all feasible model solutions, and the likelihood of parameter values in smaller and larger sponges was analyzed for mean, SD, and min and max based on 5 and 95% confidence intervals (CI).
Results
Analysis of Measured Flux Data
DIN Exchange in Incubation Chambers
All G. barretti showed a net release of , corrected to control incubations in which concentrations remained constant (Supporting Figure 1), of, on average, 0.95 ± 0.79 μmol N cm–3 day–1 (mean ± SD, used throughout text, n = 12, Table 1). release was positively correlated to O2 consumption (r = 0.82, p < 0.01, n = 12). The and concentrations in the chambers did not significantly change (i.e., the regression slope was not significant) during incubations with sponges and neither in control incubations without sponges (Supporting Figure 1). Although the concentration changes were insignificant, we calculated control-corrected and fluxes to obtain feasible ranges for the metabolic network model analysis. The average (control-corrected) release and release rates by G. barretti in incubation chambers were 0.023 ± 0.069 and 0.061 ± 0.47 μmol N cm–3 day–1, respectively (n = 12, Table 1).
Size Relationships
The datasets of smaller G. barretti individuals (9–210 ml in incubation chambers) and larger G. barretti individuals (150–3,500 ml with in–ex) were analyzed together to explore for allometric relationships in data. A statistically significant allometric relationship was found between sponge volume and O2 consumption rates, although only 21% of the variation could be explained with this regression (Figure 2). The allometric equation for volume-specific O2 consumption rates (vOcr, μmol cm–3 day–1) as a function of volume (V, cm–3) for G. barretti is: vOcr = 25.5⋅V−0.23(p < 0.01, R2 = 0.21, n = 29, Figure 2). No temperature correction was needed since all data were collected at a similar temperature of 8–9°C. At overlapping sizes, O2 consumption rates are comparable between the two datasets (green circle, Figure 2). No allometric relations were found for DIN net exchange data (data not shown).
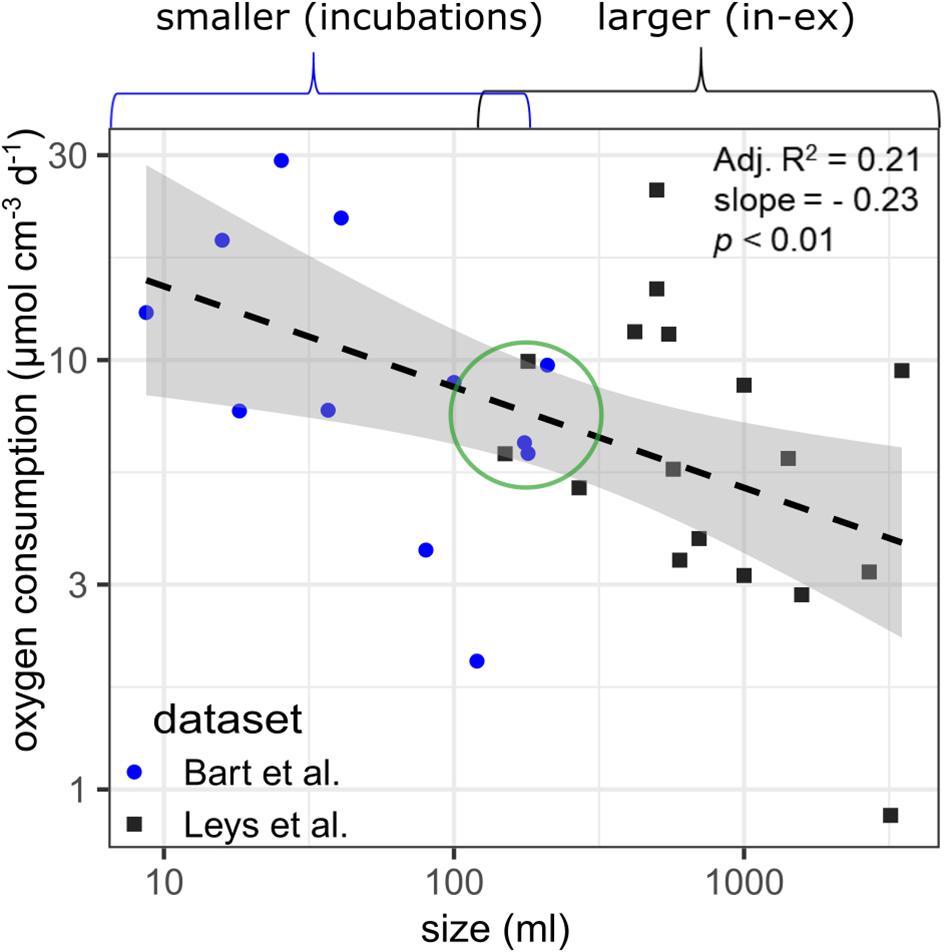
Figure 2. Regression between sponge volume (cm–3) and measured volume-specific oxygen consumption (μmol O2 cm–3 day–1) in Geodia barretti by Bart et al. (2020b) (blue circles) and Leys et al. (2018) (dark gray squares). Log-log linear models were used to fit all data (dashed black line). The gray zones indicate the 95% confidence interval. The green circle indicates that the two methods (incubation chambers and in–ex) can produce consistent results (despite the large variability).
Model Results
The equalities (hard constraints) and inequalities (soft constraints) were internally consistent, as the model was able to resolve an internal metabolic flux network for smaller and larger G. barretti sponges (Table 3). As imposed with measured metabolic flux data (Table 1), almost all model-produced metabolic rates (μmol cm–3 day–1) were higher in smaller compared to larger specimens (Table 3), except the assimilation of bacteria (r1), which was higher in larger sponges (Tables 1, 3). However, the overall relative partitioning of internal C- and N-transforming processes was similar for smaller and larger sponge individuals (Figures 3, 4).
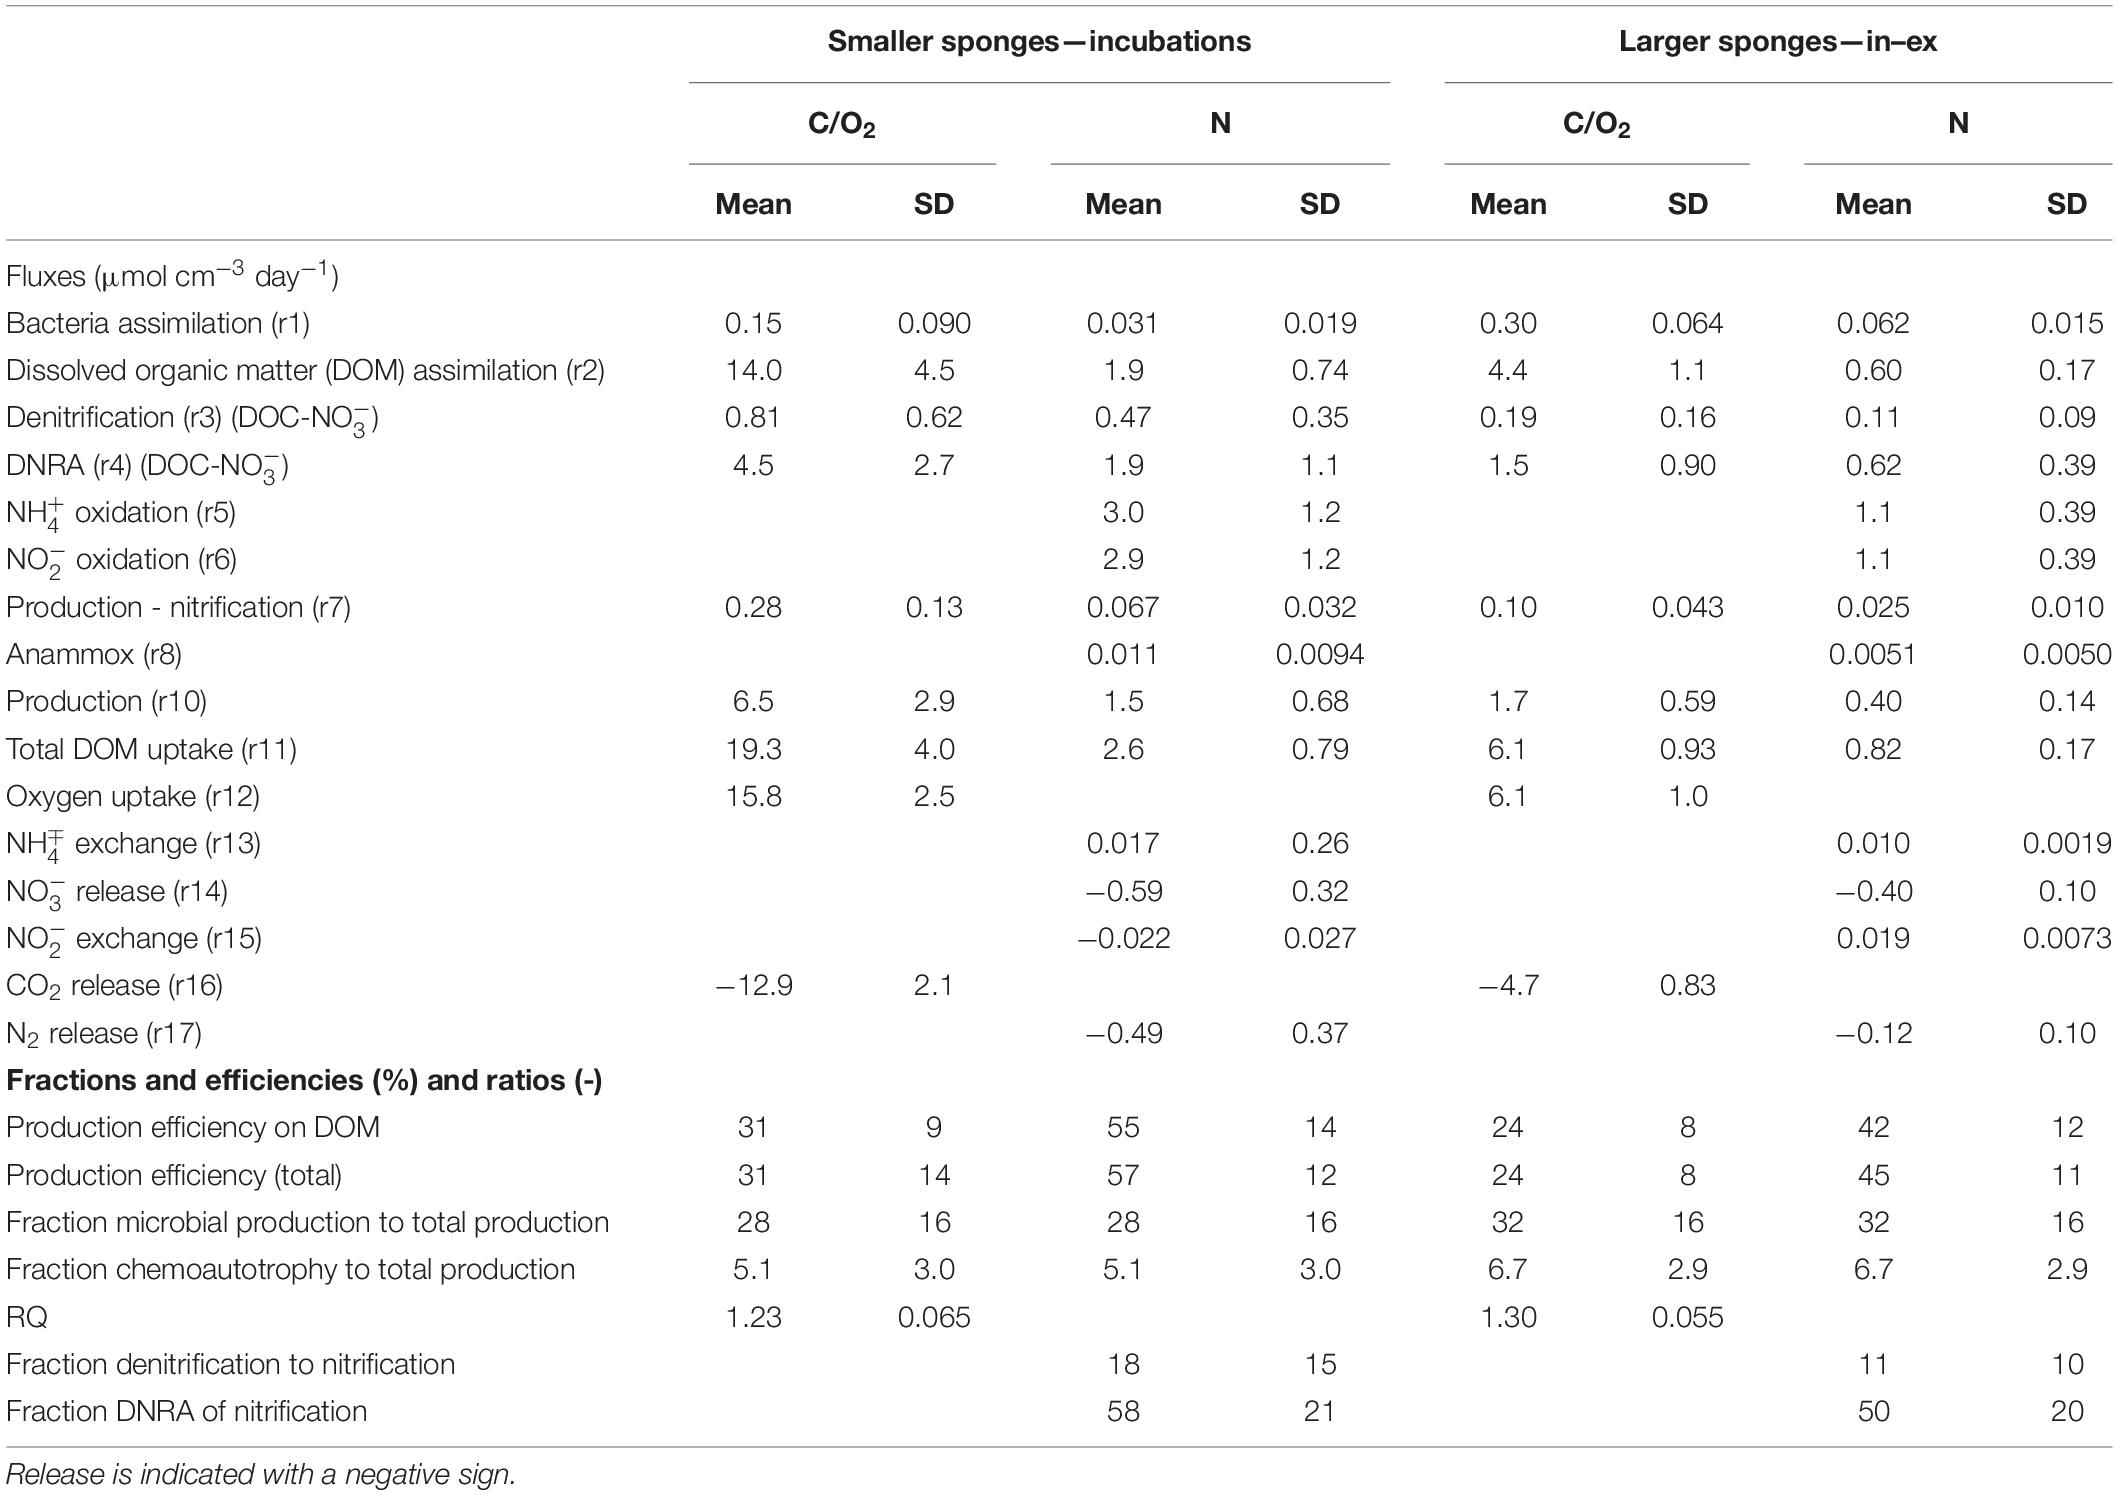
Table 3. Metabolic network model results for smaller and larger Geodia barretti for C/O2 and N.
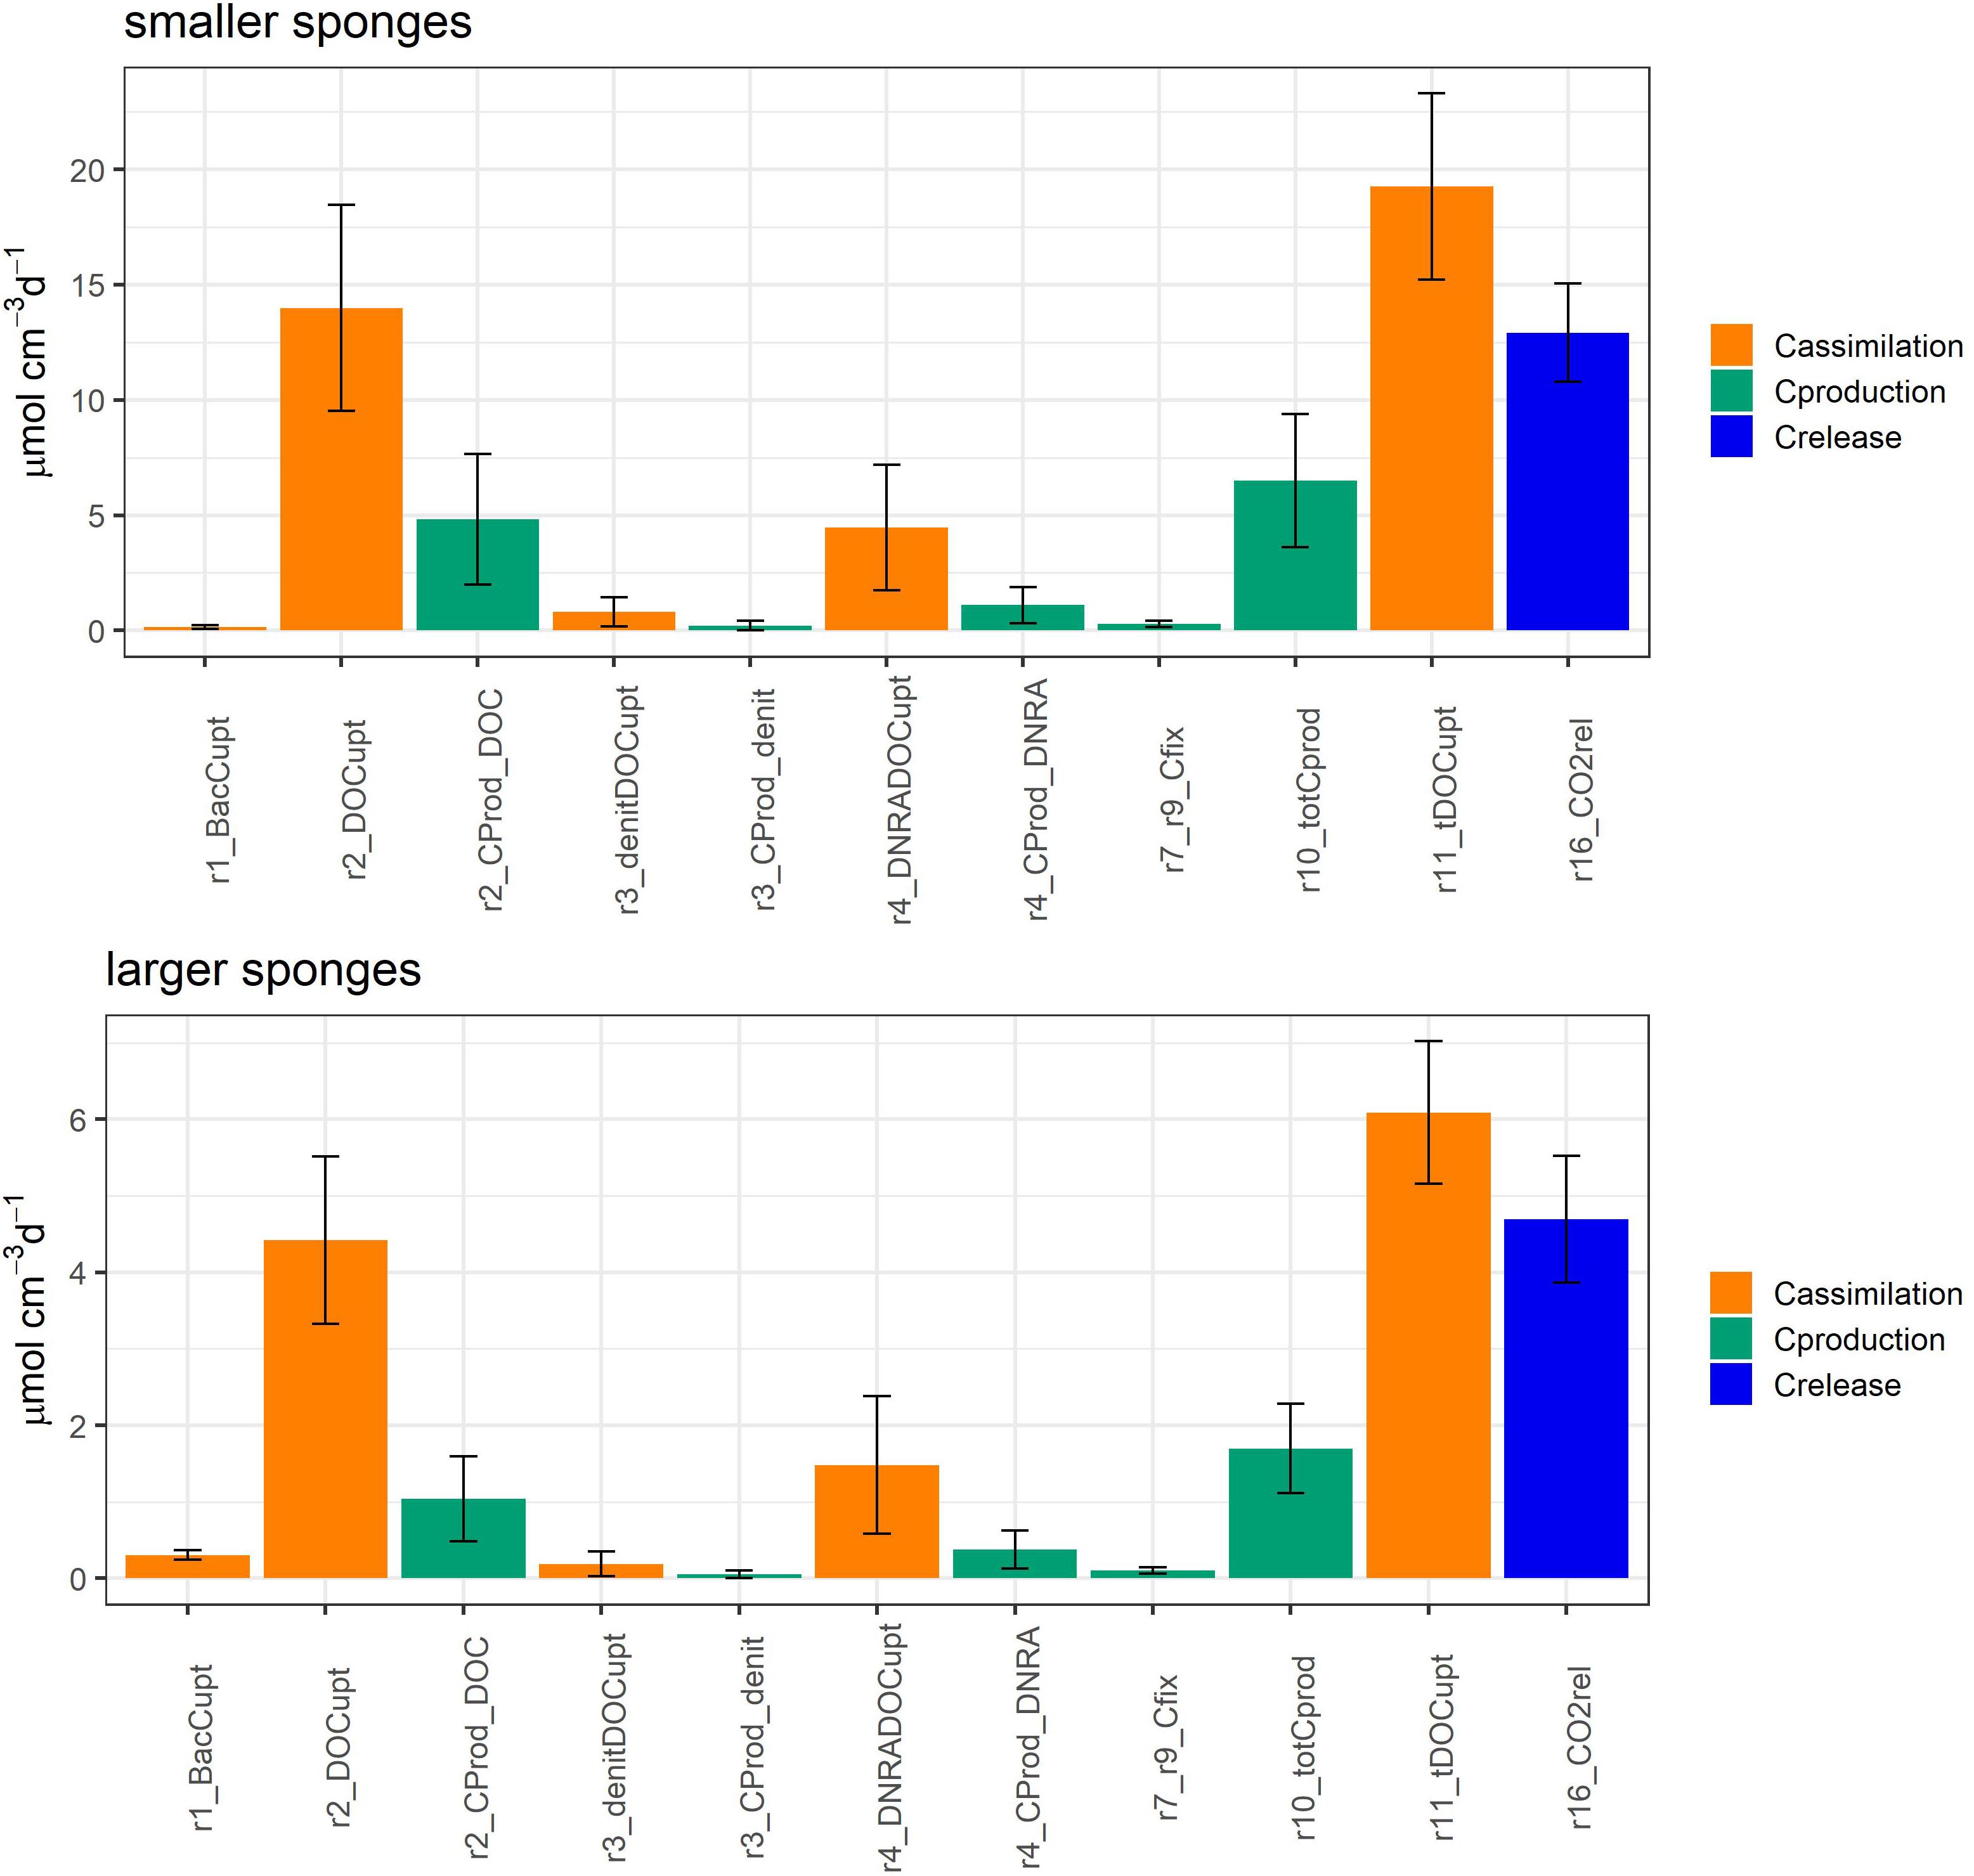
Figure 3. Model-calculated average C fluxes ± SD (μmol C cm–3 day–1) in smaller Geodia barretti specimens (top) and larger G. barretti specimens (bottom). G. barretti assimilates bacteria (r1_BacCupt) and mainly dissolved organic carbon (r11_tDOCupt), which is used for aerobic respiration (r2_DOCupt), denitrification (r3_denitDOCupt), and DNRA (r4_DNRA_DOCupt). Production processes are shown in green, where r10_totCprod is the total C (biomass) production by the holobiont. r16_CO2rel (blue) is the net CO2 release rate. The reaction numbers correspond to Figure 1 and Table 2.
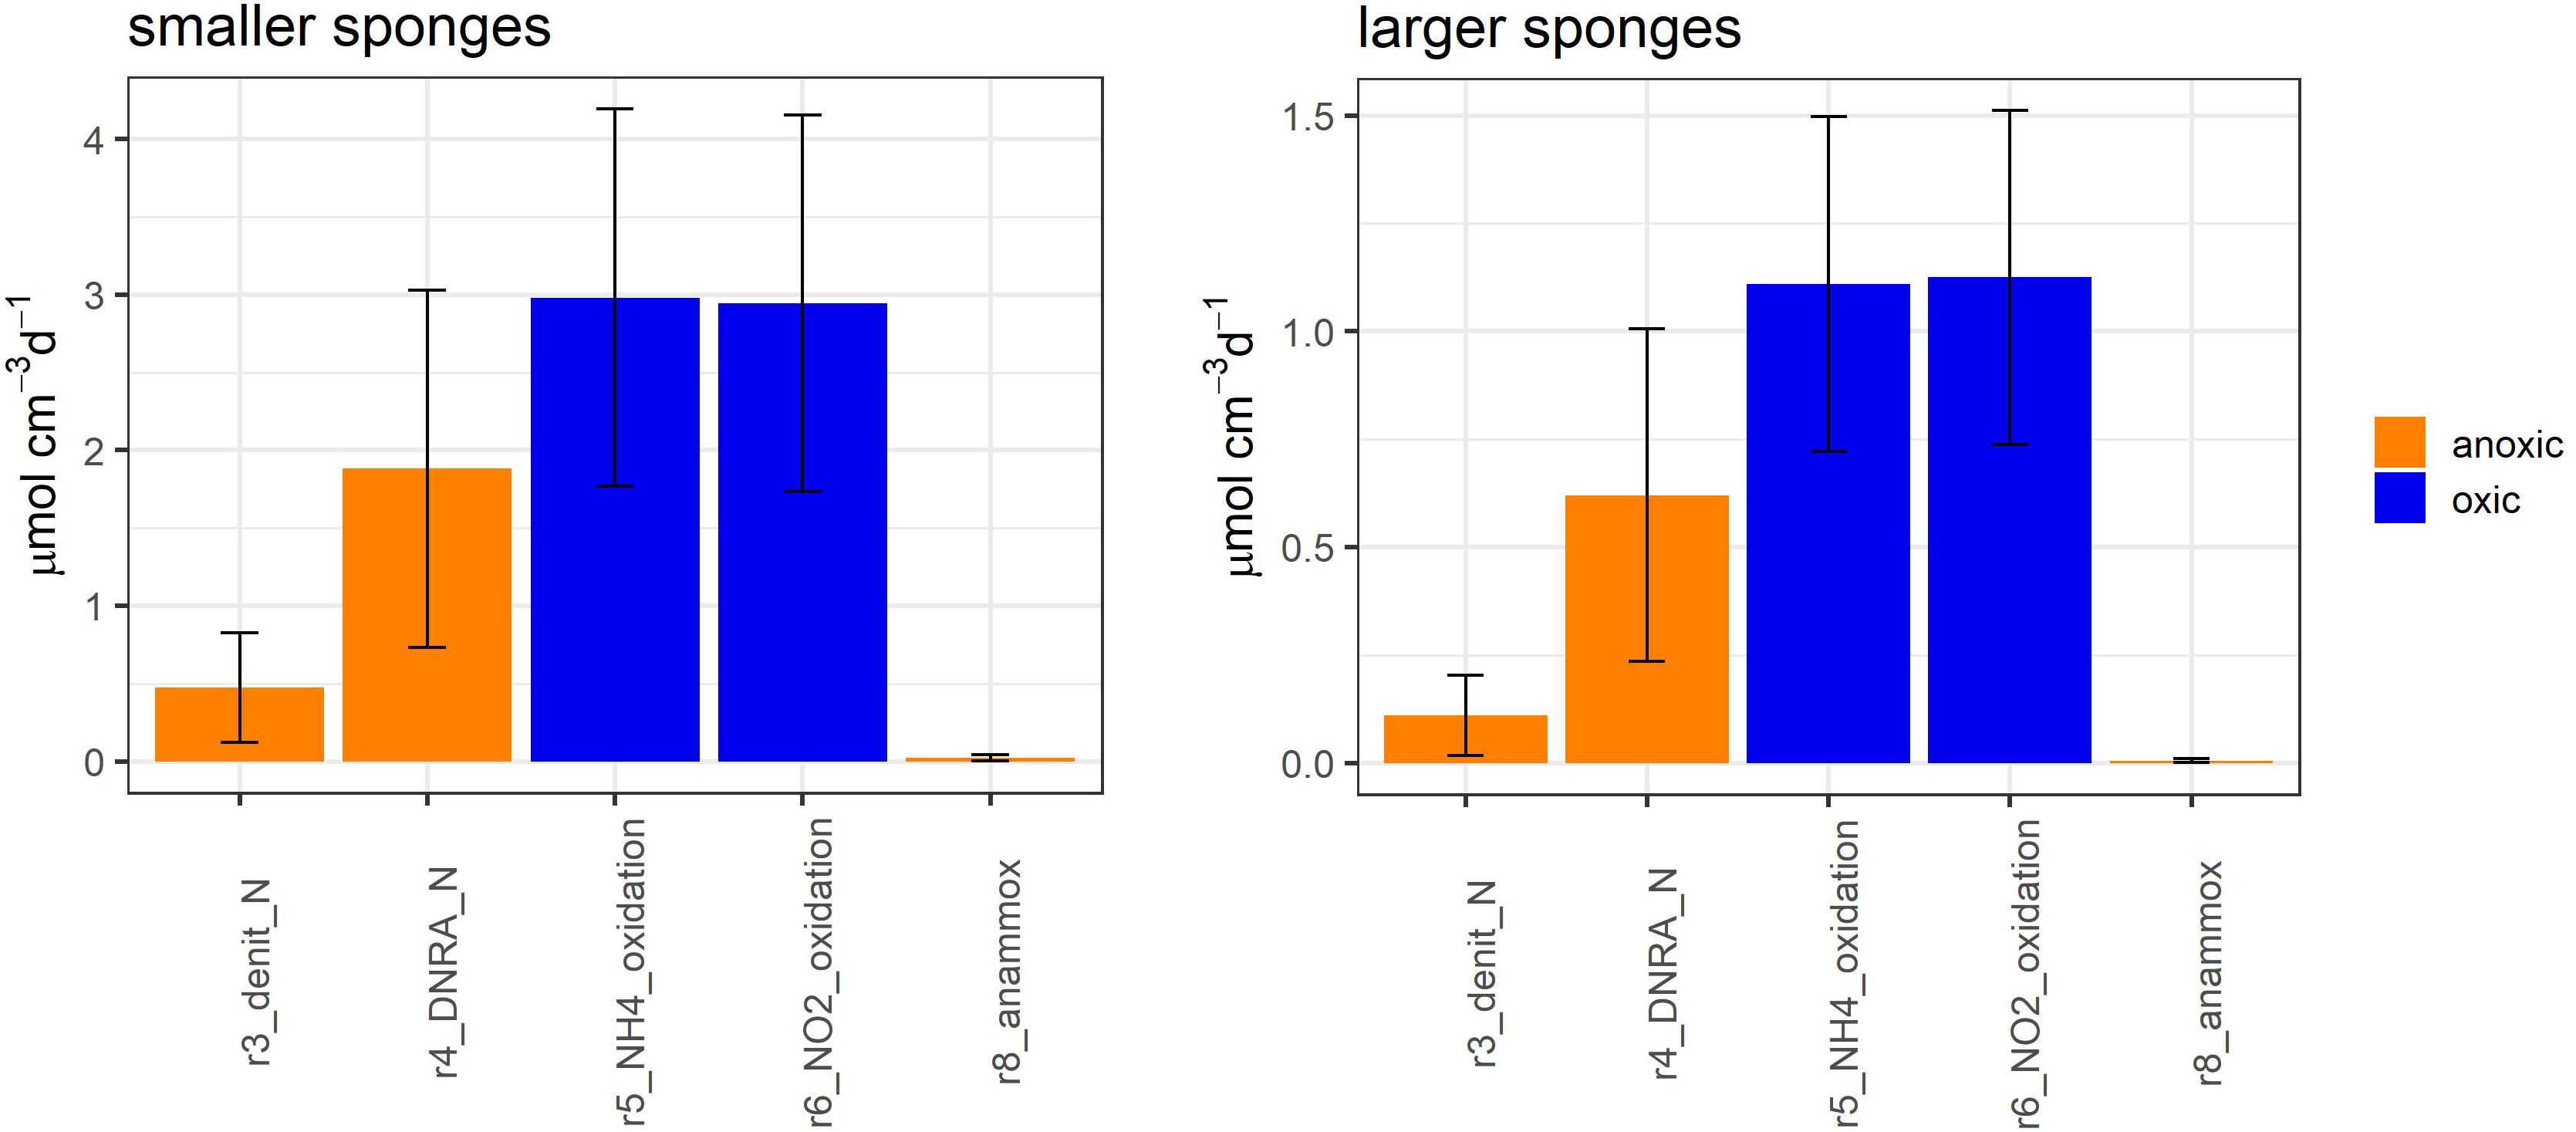
Figure 4. Model-calculated metabolic aerobic (blue) and anaerobic (orange) nitrogen-transforming fluxes in smaller Geodia barretti individuals (left) and larger G. barretti individuals (right). The reaction numbers refer to Figure 2 and Table 2.
Sponge Host Metabolism
G. barretti metabolism was dominated by heterotrophy, with DOM as primary food source (Table 3 and Figure 3). DOM assimilation and aerobic respiration by the sponge (holobiont) (r2) were the main heterotrophic processes in G. barretti, independent of size (Table 3 and Figure 3). Because this process dominated sponge metabolism, it was also most sensitive to input parameters. Lower values of C:NDOM input range (Table 2) resulted in more feasible model solutions (Figure 5). Feasible C:NDOM values averaged 7.6 ± 1.4 in both smaller and larger sponges (Figure 5). Higher values of fp_N_DOM from the rather wide input range (20–80%, Table 2) resulted in more feasible model solutions in smaller sponges, while the opposite was found in larger sponges (Figure 5). The averages of feasible fp_N_DOM values were 58 ± 18% in smaller sponges compared to 41 ± 17% in larger sponges (Figures 5, 6). The corresponding average C production efficiency (fp_C_DOM) was 33 ± 12% in smaller sponges and 24 ± 11% in larger sponges (Figures 5, 6). The associated C (biomass) production rate was 4.8 ± 2.8 and 1.0 ± 0.55 μmol C cm–3 day–1 in smaller and larger sponges, respectively (Figures 3, 6). The majority of assimilated DOC, i.e., 67 ± 12% in smaller sponges and 76 ± 11% in larger sponges, was aerobically respired to CO2 (Figure 6).
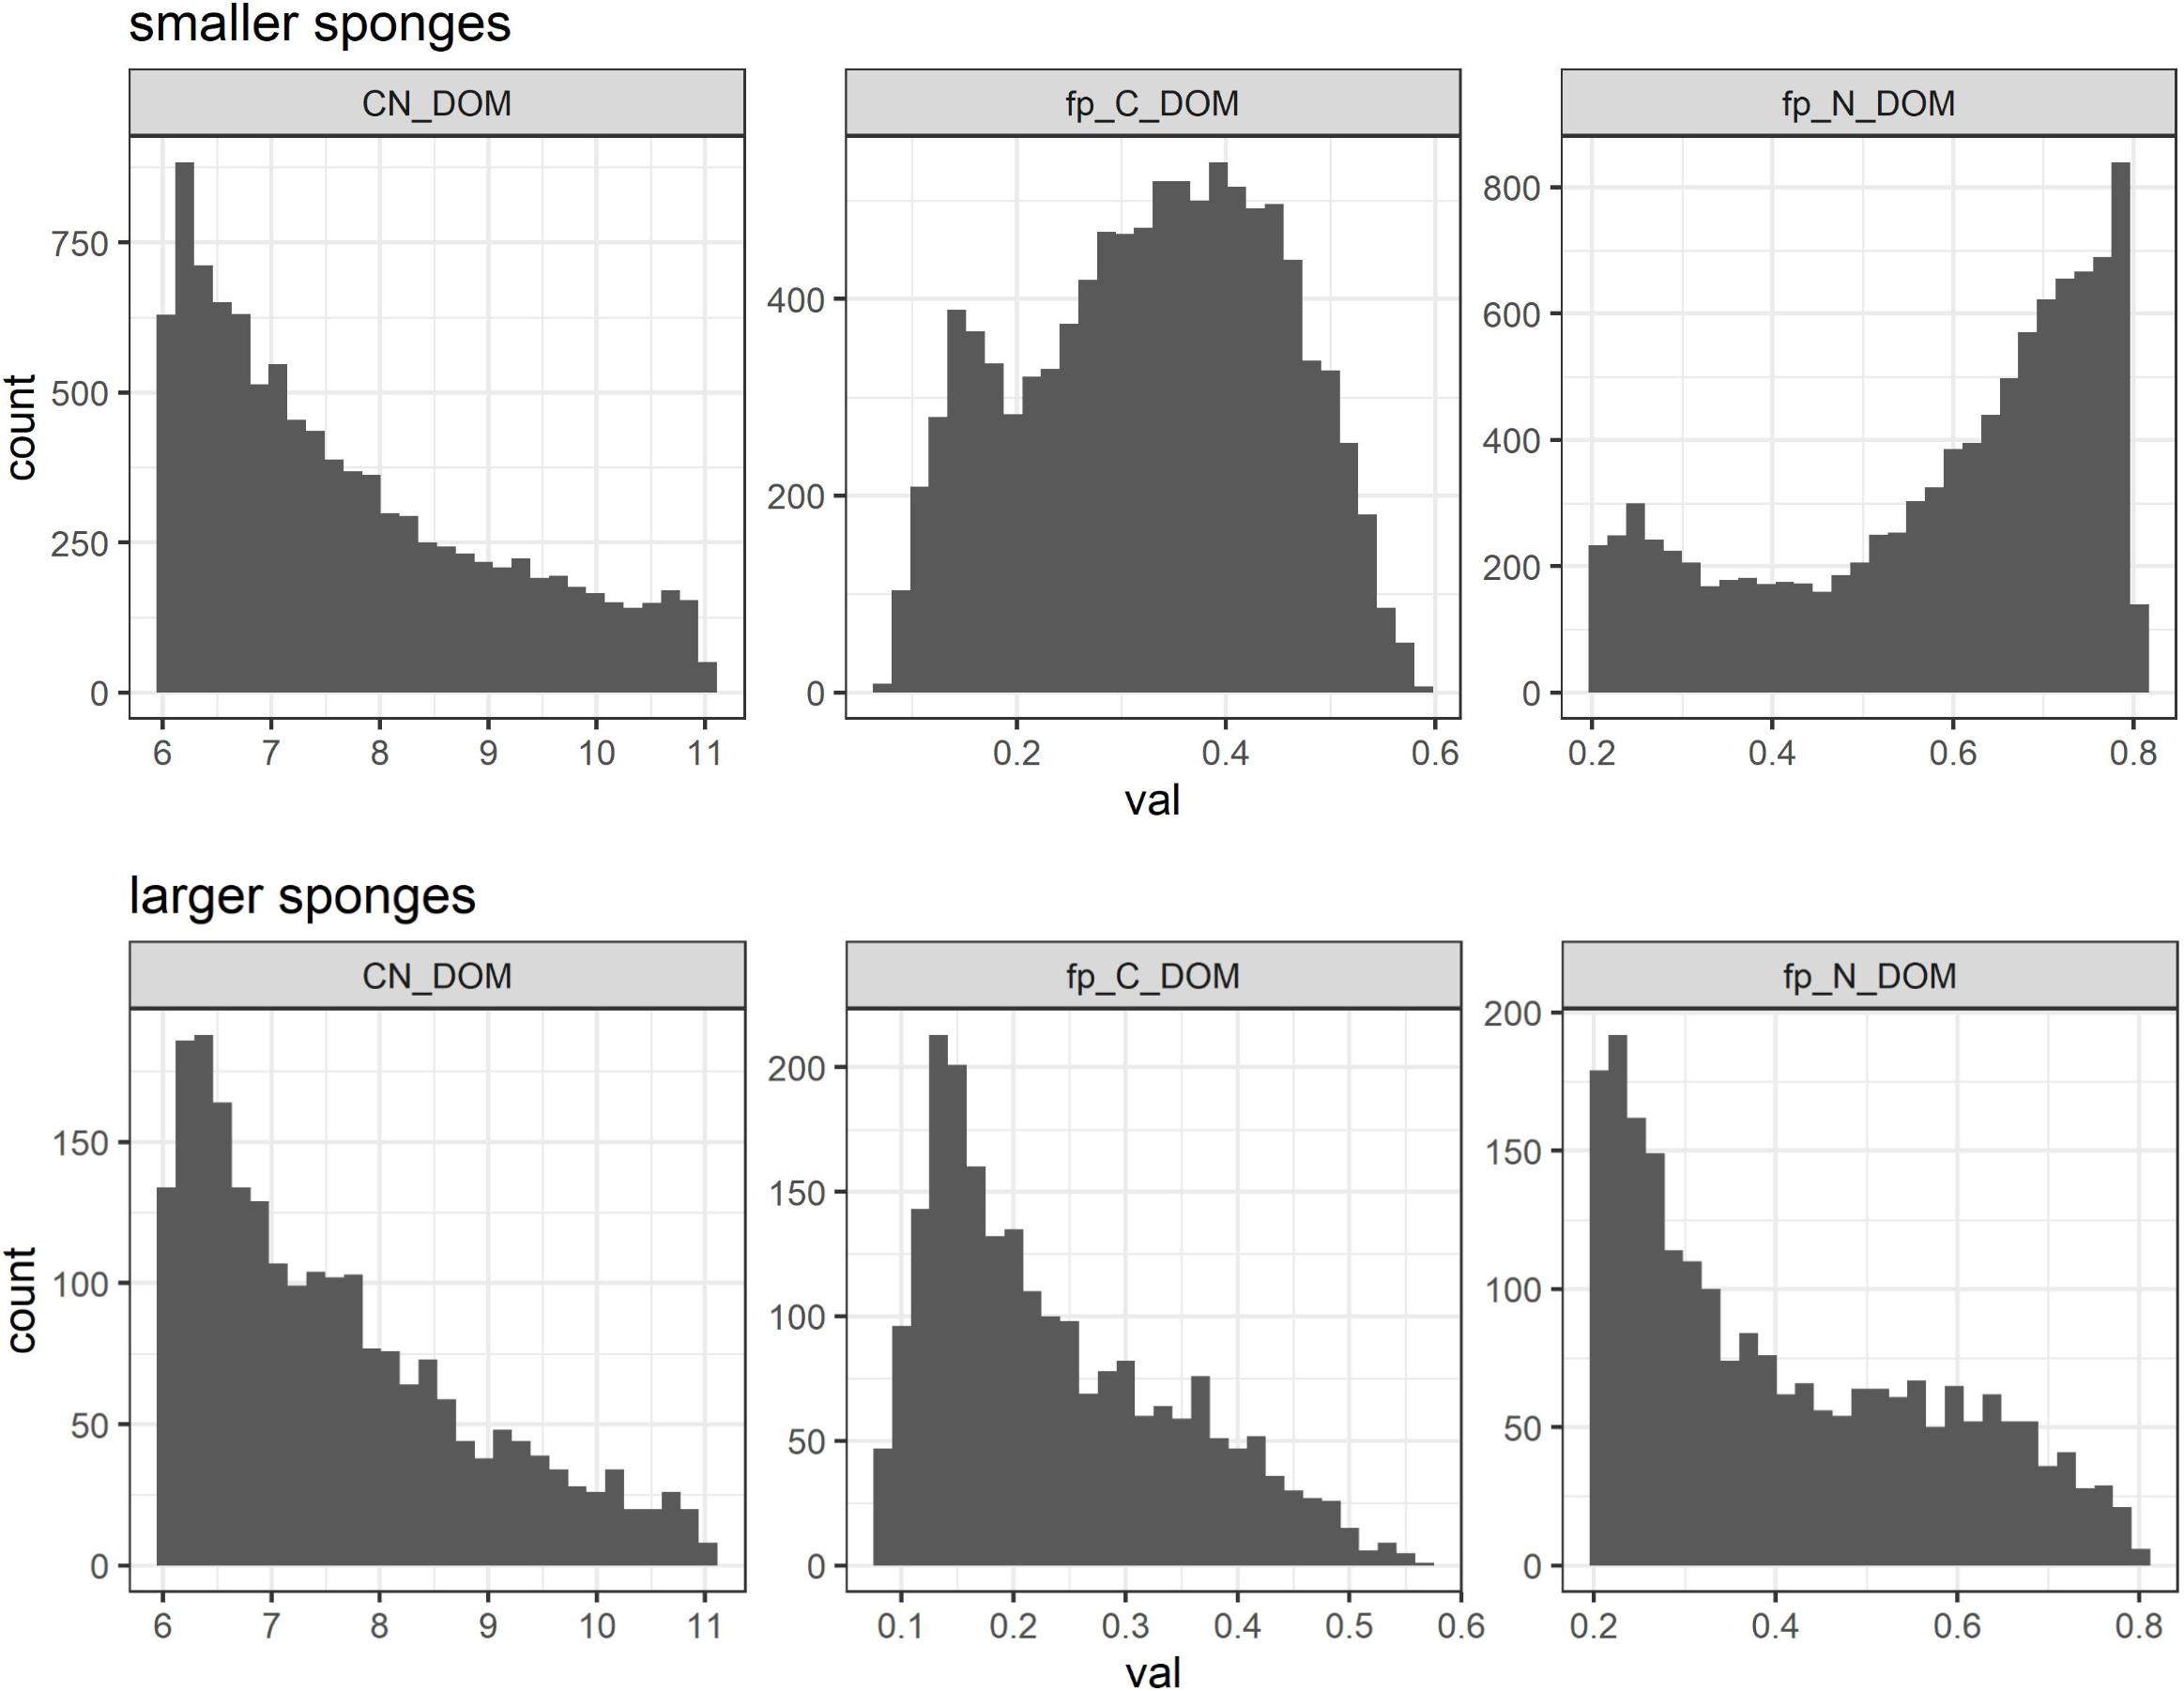
Figure 5. Distribution of coefficients in reaction 2 [(DOM) assimilation and aerobic respiration] to produce feasible model solutions: stoichiometry (C:N) of DOM (left) and C (middle) and N (right) production efficiencies in smaller (top) and larger (bottom) Geodia barretti.
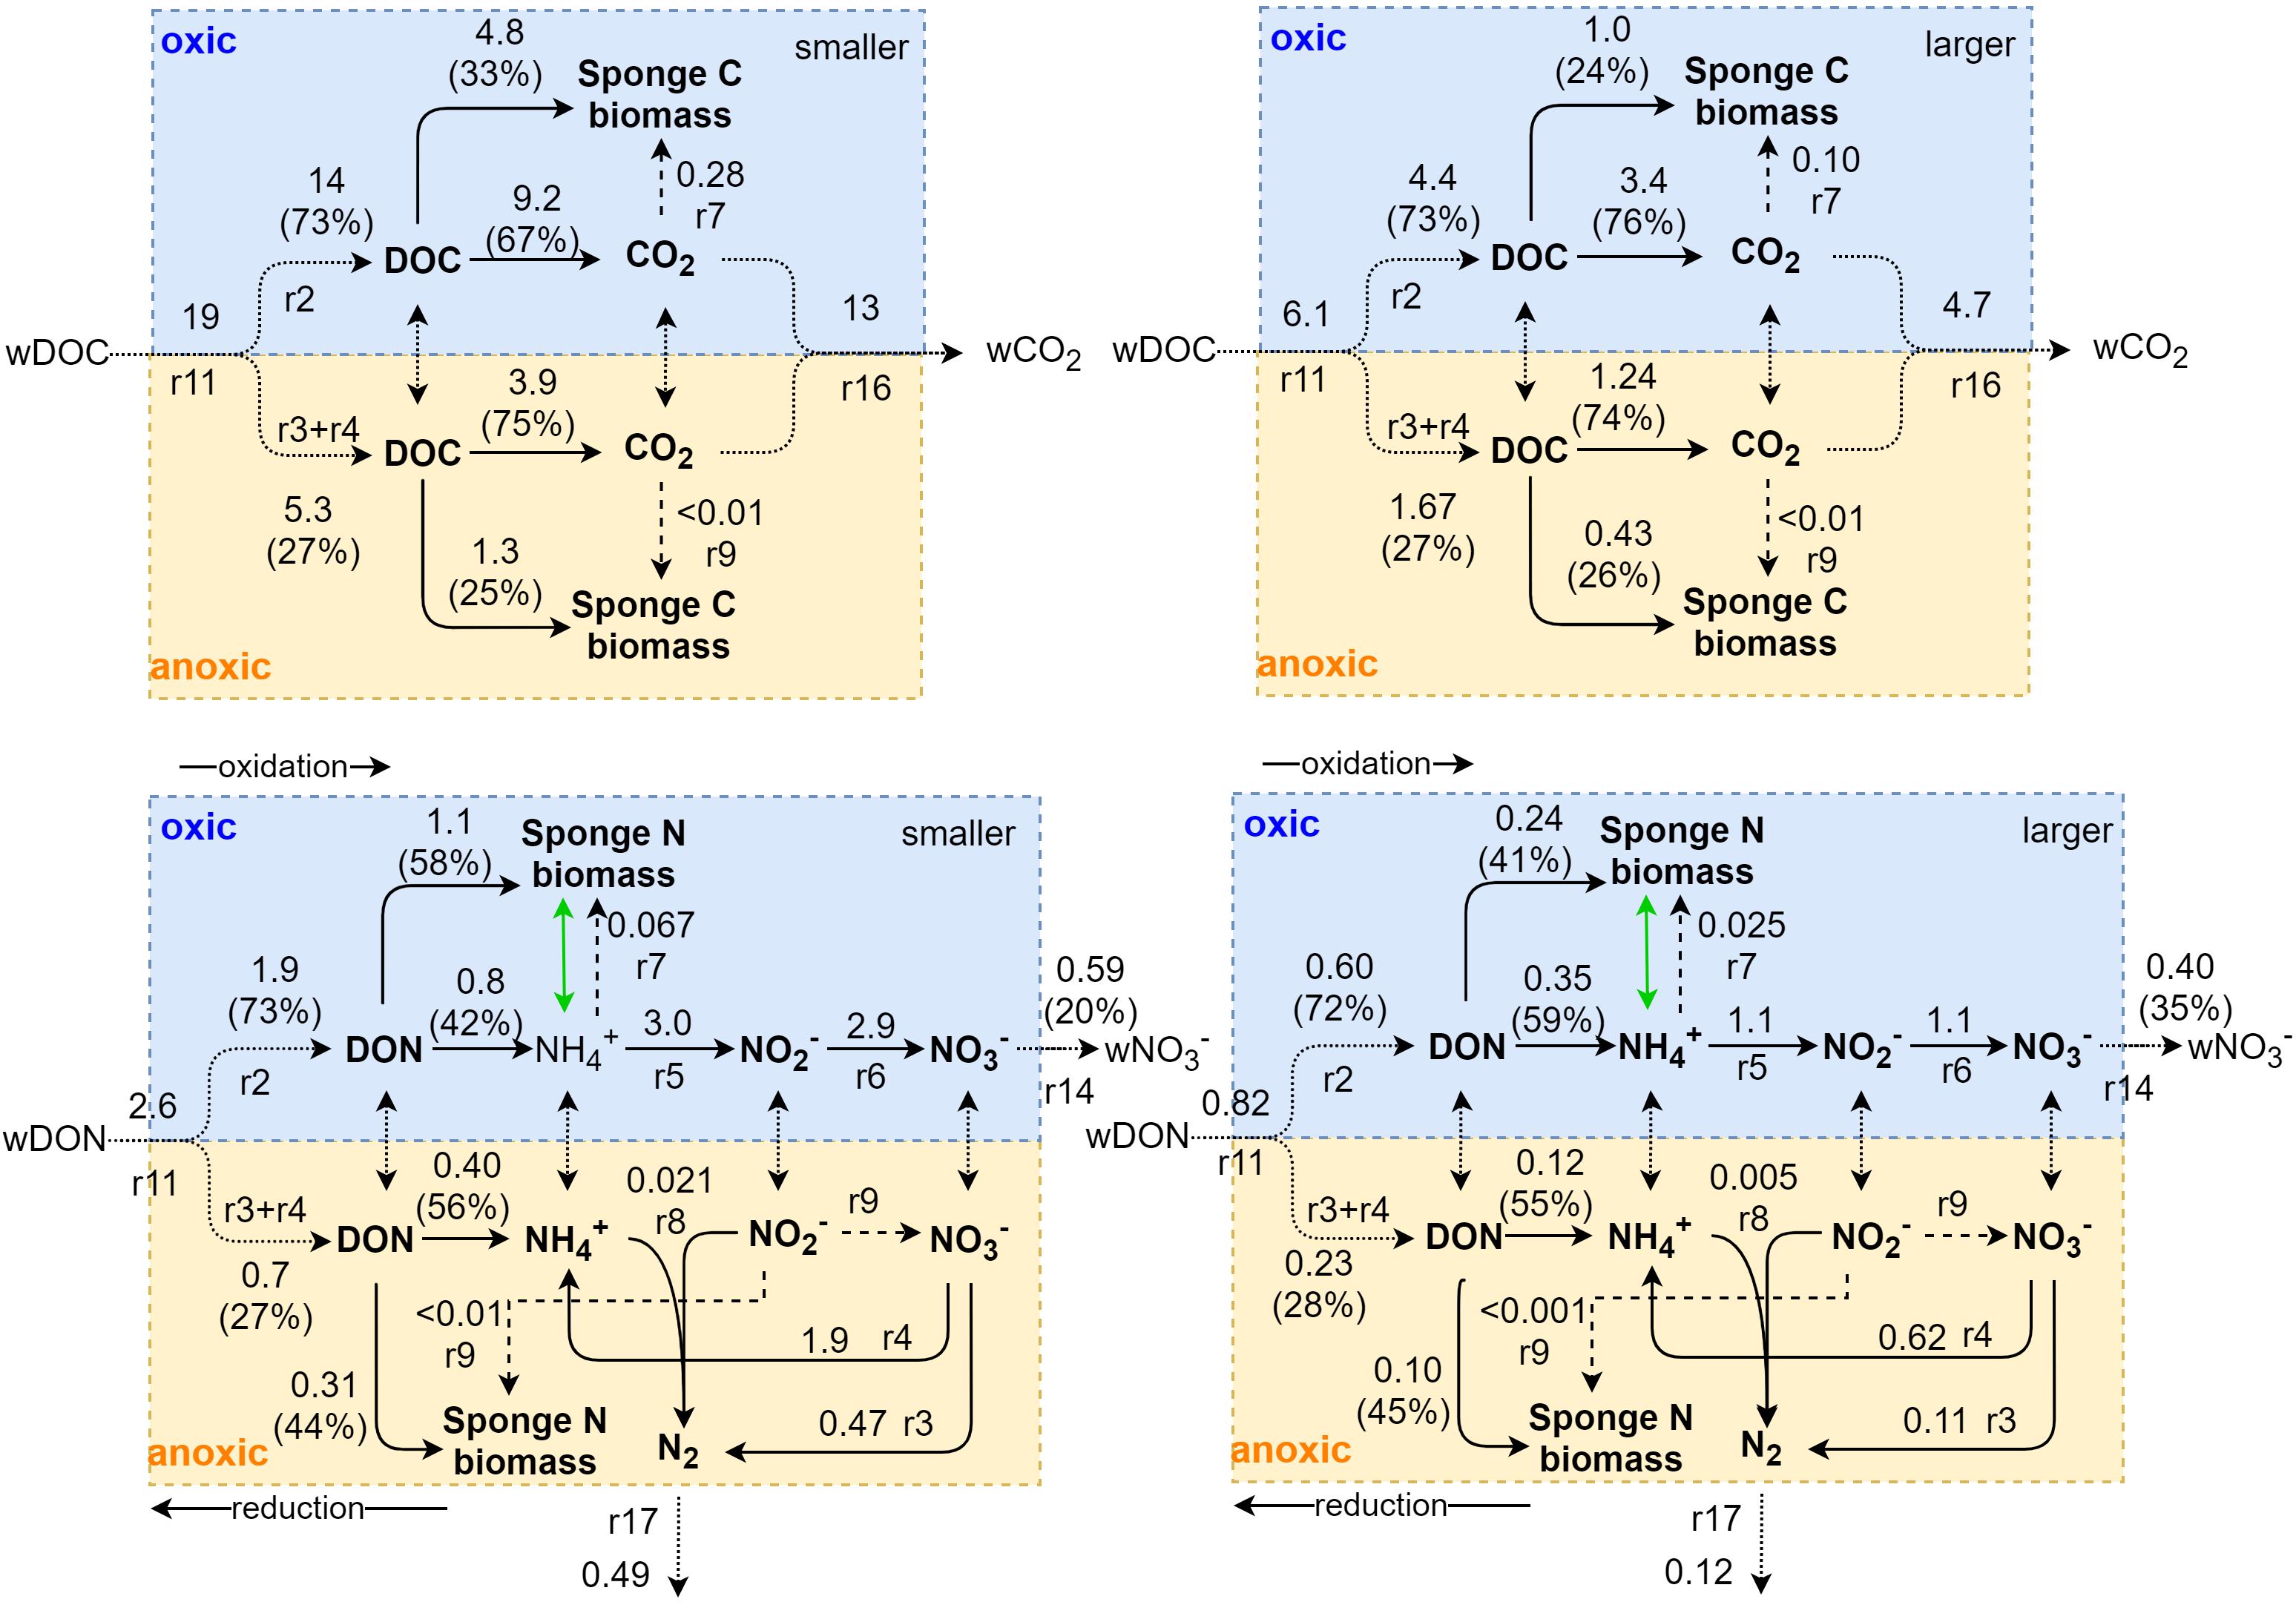
Figure 6. Schematic representation of internal C and N metabolism in Geodia barretti. Metabolic processes are indicated with solid arrows with reaction (r) numbers corresponding to those of Figure 2 and Table 2. Aerobic and anaerobic processes are separated in the blue and yellow part, respectively. Exchange fluxes are shown with dotted arrows. Model-calculated average metabolic rates in μmol C cm–3 day–1 or μmol N cm–3 day–1, shown adjacent to arrows, differ between smaller and larger G. barretti (right). The partition of dissolved organic matter to oxic and anoxic processes and to (C and N) sponge biomass production and respiration are shown with percentages. Dashed arrows indicate chemoautotrophic processes. Internal NH4+ excretion and re-assimilation, shown by the green arrow, is expected to take place but is not explicitly modeled. Bacteria uptake (r1) and NO2– (r15) and NH4+ (r13) exchange are not shown for simplicity.
Microbial N-Transforming Processes
Oxic N-transforming processes dominated over anoxic N-transforming processes necessary to create a net release (Table 3 and Figures 4, 6). The dominant microbial N-transforming processes were nitrification (r5–r6) and DNRA (r4) (Table 3, Figure 4). The nitrification rates in smaller sponges ranged from 1.1 to 5.1 μmol N cm–3 day–1 (5–95% confidence interval), with an average of 3.0 ± 1.2 μmol N cm–3 day–1 (Table 3 and Figures 4, 6). The nitrification rates in larger sponges ranged from 0.51 to 1.8 μmol N cm–3 day–1 (1.1 ± 0.39 μmol N cm–3 day–1; Table 3 and Figures 4, 6). Nitrification was responsible for 38 ± 14% of the O2 consumption, independent of sponge size. Nitrification (r5–r6) and DNRA (r4) are positively related: nitrification uses the produced substrate of DNRA ( and vice versa. The model results indicate that N cycling from coupled / conversion in DNRA and nitrification is 58 ± 21% of nitrification in smaller sponges and 50 ± 20% in larger sponges (Table 3 and Figure 6). The remaining part of comes from the mineralization of organic N (r1–r4) (Figure 6). The modeled DNRA and nitrification rates were sensitive to the imposed maximum ratio DNRA vs. aerobic respiration (r4 vs. r2) because more O2 is available to nitrification if OM is mineralized anaerobically (via DNRA) compared to aerobic mineralization (r2) (Supplementary Figure 2). Denitrification rates (r3) were consistently below DNRA rates (r4) in both sponges (Table 3 and Figure 4). The anammox rates, which were constrained to be below denitrification rates, were the lowest of all nitrogen-transforming rates (Table 3 and Figure 4). N2 loss via denitrification was 18 ± 15% of nitrification in smaller sponges and 11 ± 10% in larger sponges (Table 3 and Figures 4, 6). The N2 release rates were 0.49 ± 0.37 and 0.12 ± 0.10 μmol N cm–3 day–1 in smaller and larger sponges, respectively (Table 3 and Figure 6).
Microbial symbiont C (biomass) production was 1.6 ± 1.1 μmol C cm–3 day–1 in smaller sponges, from which 1.3 ± 0.98 μmol C cm–3 day–1 came from heterotrophy (denitrification, DNRA) and 0.28 ± 0.13 μmol C cm–3 day–1 came from chemoautotrophy (nitrification, anammox) (Figures 3, 6 and Table 3). In larger sponges, symbiont C (biomass) production was 0.53 ± 0.34 μmol C cm–3 day–1, from which 0.43 ± 0.30 μmol C cm–3 day–1 came from heterotrophy and 0.10 ± 0.043 μmol C cm–3 day–1 came from chemoautotrophy (Figures 3, 6 and Table 3).
Integrated Holobiont Metabolism and Net Exchange
Integrated G. baretti holobiont metabolism comprises biomass production rates and efficiencies of sponge and microbial symbionts. The holobiont production (r10) rates in smaller sponges were 6.5 ± 2.9 μmol C cm–3 day–1 and 1.5 ± 0.68 μmol N cm–3 day–1 (C:N = 4.2) (Table 3 and Figures 3, 6), with an estimated contribution of 28 ± 16% by nitrogen-transforming symbionts, comprising 5.1 ± 3.0% of total production from chemoautotrophy. The holobiont production (r10) in larger sponges was 1.7 ± 0.59 μmol C cm–3 day–1 and 0.40 ± 0.14 μmol N cm–3 day–1 (C:N = 4.2) (Table 3 and Figures 3, 6), with a contribution of 32 ± 16% by nitrogen-transforming symbionts, comprising 6.7 ± 2.9% of total production from chemoautotrophy. Overall production efficiencies for all assimilated OM, including bacterial uptake [production / assimilated OM, r10/(r11 + r1)], were 31 ± 14% for C and 57 ± 12% for N in smaller sponges compared to 24 ± 8% for C and 45 ± 11% for N in larger sponges (Table 3). The CO2 release rates were 13 ± 2.1 μmol C cm–3 day–1 in smaller G. barretti and 4.7 ± 0.83 μmol C cm–3 day–1 in larger G. barretti (Table 3 and Figures 3, 6). The overall RQ (O2: CO2) was 1.23 ± 0.065 in smaller G. barretti and 1.30 ± 0.056 in larger G. barretti (Table 3).
The model-calculated exchange rates of O2 and comprised a smaller range compared to the measured rates (compare Tables 1, 3) because not all combinations of flux measurements resulted in feasible model solutions. The average model-based release rates were lower compared to the averages of the measured rates because more feasible solutions were obtained at the low end of measured release rates (compare Tables 1, 3). Higher O2 uptake values from the measured range resulted in more feasible solutions in smaller sponges, while the opposite occurred in large sponges (compare Tables 1, 3).
Specific Rates
Specific rates (day–1) are derived from C-based reaction rates (μmol C cm–3 day–1) (Table 3) relative to C content (M, μmol cm–3; Table 1). The specific assimilation rates derived from total organic matter consumption (r1 + r11) were 4.7 10–3 and 2.0 × 10⁻³ day–1 for smaller and larger sponges, respectively (Table 4). Daily production rates (r10) were 1.6 × 10⁻³ (0.16%) and 0.67 × 10⁻³ (0.067%) day–1 for smaller and larger sponges, respectively (Table 4), indicative of allometric scaling.
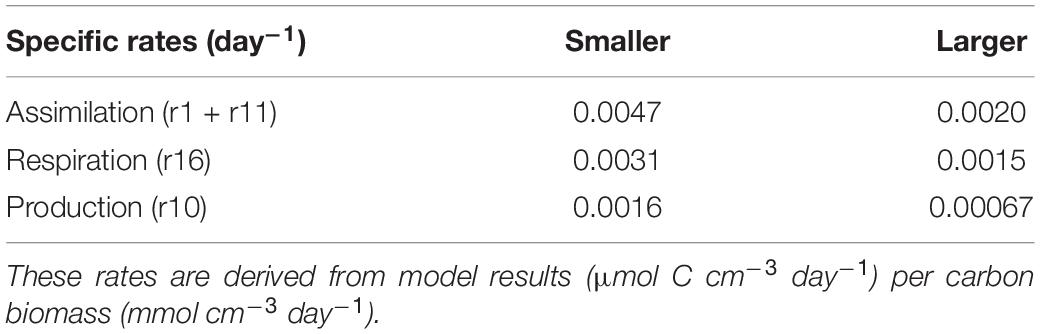
Table 4. Model-based specific rates (day–1) for small and larger Geodia barretti.
Discussion
The aim of this study was to infer internal C and N metabolic conversions in a deep-sea sponge holobiont system. To this end, a metabolic network model integrating C and N metabolism of the sponge G. barretti and its microbial symbionts was developed. The presented model can serve as a valuable data analysis tool to quantify internal and intermediate routes in sponge metabolism given any metabolic dataset. In this study, we used two independent metabolic datasets to constrain internal G. barretti metabolism that encompassed a range of sponge volumes. The model results indicate that G. barretti has complex but flexible metabolism consisting of aerobic and anaerobic processes. The measured fluxes and model metabolic results suggest that specific metabolic rates decline with increasing G. barretti size, while the ratios between oxic and anoxic processes and between sponge host and microbial metabolism seem rather independent of size.
Organic Matter Assimilation by G. barretti
The measured DOC assimilation rates (Bart et al., 2020b) as well as the estimated DOC assimilation rates (i.e., not directly measured but derived from TOC; Leys et al., 2018) show that DOC is the dominant C source (> 90%) that fuels G. barretti metabolism. Our metabolic network analysis showed that assimilated DOM serves multiple purposes, since it is used as energy source for aerobic and anaerobic respiration and as a substrate to produce sponge (holobiont) biomass (Table 3 and Figures 3, 6). While the DOC assimilation rates were available to constrain the model, the stoichiometry (molar C:N ratio) of assimilated DOM was not known a priori and was inferred by uncertainty analysis (Figure 5). DOM assimilation was feasible when DOM had a C:N < 9 (Figure 5). This indicates a preference for N-rich DOM because the reported bulk C:N ratios for DOM range from 9 for fresh (labile) to 17 for more refractory material (Hopkinson and Vallino, 2005). Sponges are recently shown to be more selective feeders than traditionally assumed on both particulate (e.g., plankton) (Maldonado et al., 2010; McMurray et al., 2016) and dissolved organic food (Fiore et al., 2017). Selective assimilation (and retention) of N-rich organic matter by G. barretti and other deep-sea sponges has been demonstrated in tracer assimilation studies using dual-isotope-labeled substrates (Kazanidis et al., 2018; Bart et al., 2020a). Most marine heterotrophs preferentially assimilate N, as they have C:N ratios which are lower than the C:N ratios of available food sources (Steinberg and Landry, 2017). The average C:N ratio of 4.2 for G. barretti tissue matches well with the C:N ratios of sponges and other deep-sea North Atlantic benthos that had an average C:N of 3.9 (Parzanini et al., 2018) and with those of marine bacteria (C:N = 4–6; Table 2). Whether the preferential assimilation of N-rich DOM is opportunity driven or an actual metabolic requirement of G. barretti metabolism remains to be determined. Because sponges filter water for DOM, they will increase the C:N ratio of surrounding seawater DOM as they selectively retain N, which might influence its bioavailability for surrounding seawater bacteria.
As the C and N production efficiencies for G. barretti and other deep-sea sponges were largely unknown, they were inferred by sensitivity analysis (Figure 5). Our estimated C production efficiency values of 24 ± 8% in larger individuals and 31 ± 14% in smaller individuals (Table 3 and Figures 3, 5, 6) are within the reported range of 20–30% for metazoans (Sterner and Elser, 2002) and ∼30% in pelagic marine microbes in the same temperature range (Rivkin and Legendre, 2001). High production efficiencies for G. barretti (∼80%) have been reported in isotope tracer studies with labeled diatom DOM and marine bacteria (Maier et al., 2020; Bart et al., 2020b). In contrast, the encrusting deep-sea sponge Hymedesmia coricea had a maximum production efficiency of 10% when fed with stable-isotope-labeled algae and bacteria for 10 days (van Oevelen et al., 2018). Although isotope tracer experiments are advantageous to identify and quantify certain metabolic routes, the obtained values might depend on the incubation time and are representative for the added isotopically labeled substrates only, making it hard to compare the uptake efficiencies to natural diet C and N processing rates. Compared to C production efficiencies, very little information is available on N production efficiencies, especially in sponges. Our estimated N production efficiencies (57 ± 14% in smaller G. barretti and 45 ± 11% in larger G. barretti) (Table 3 and Figures 5, 6) are comparable to (larger sponges) or above (smaller sponges) those of 40–50% reported for marine zooplankton and bacteria (Touratier et al., 1999). The presence of genes for assimilation through glutamine metabolism in G. barretti (Gavriilidou, personal communication) and several other sponges (Hentschel et al., 2012) is a possible explanation for the slightly higher N production efficiencies in G. barretti compared to those in other organisms. Overall, our estimated values for the C:N ratio of assimilated DOM and the C and N production efficiencies agree with previous estimates for marine organisms, indicating that our model produces reasonable results and might serve as a valuable tool to estimate the efficiencies by which assimilated food is turned into production.
Most of the assimilated DOC (76 ± 8% in larger sponges and 69 ± 9% in smaller sponges) was respired to CO2 (Figures 3, 6). Model quantification of net CO2 release rate (respiration minus fixation) relative to O2 consumption allowed us to estimate an integrated RQ. The estimated RQ values (O2:CO2) were very similar between the two datasets, 1.25–1.30 ± 0.06 (Table 3; 0.77–0.80 for CO2:O2), a value in between complete mineralization of Redfield DOM to (1.16) and (1.43) (Del Giorgio and Williams, 2005; Middelburg, 2019). These values can be used to translate measured O2 consumption into C respiration as has been done previously using RQ values of 1 (Kutti et al., 2013; Maier et al., 2020; Bart et al., 2020b), 1.30 (Cathalot et al., 2015, closest to our estimates), and 1.4 (Leys et al., 2018).
Microbial Nitrogen-Transforming Processes
In contrast to most marine animals, several sponge species (in particular, HMA demosponges) release rather than (Jiménez and Ribes, 2007; Keesing et al., 2013). release also seems a consistent feature of G. barretti as observed in incubation studies with intact G. barretti (Bart et al., 2020b; also presented in this study), explants (Strand et al., 2017; Fang et al., 2018), and tissue fragments (Hoffmann et al., 2009) and by direct in–ex measurements in intact G. barretti (Leys et al., 2018). The average measured release by intact G. barretti in incubation chambers (0.95 ± 0.79 μmol N cm–3 day–1; Table 1) was at the high end compared to average values of 0.20–0.65 μmol N cm–3 day–1 in explants and fragments (Radax et al., 2012; Strand et al., 2017; Fang et al., 2018). A plausible explanation for the higher release in intact sponges is that the functional integration between the host sponge and the microbiome has not been disrupted and that active pumping (not possible within tissue fragments) results in better tissue oxygenation. Indeed a positive relation between O2 consumption and release in incubation chambers was found to be in agreement with Fang et al. (2018). The and exchange rates were much smaller compared to the release rates as observed by direct in–ex measurements and incubation experiments with G. barretti (this study; Fang et al., 2018) (Table 1). This implies that most substrate for nitrification is produced internally either via sponge cell excretion of as metabolic waste or via microbial DNRA (Figures 2, 6).
All model-based internal N-transforming process rates were higher compared to previous estimates from isotope tracer incubations with G. barretti tissue fragments (volume 0.30–0.45 cm–3) (Hoffmann et al., 2009; Rooks et al., 2020). Especially model-inferred nitrification rates in intact sponges were twice (1.1 ± 0.39 μmol cm–3 day–1 in larger G. barretti) to five times (3.0 ± 1.2 μmol cm–3 day–1 in smaller G. barretti) higher compared to rates (0.57 μmol cm–3 day–1) that were experimentally obtained by isotope tracer incubations with sponge tissue fragments (Hoffmann et al., 2009; Table 3 and Figures 4, 6). Furthermore, the model-based denitrification rates (0.18–0.81 μmol cm–3 day–1) were high compared to the measured rates of 0.010 μmol cm–3 day–1 in oxic conditions and 0.16 μmol cm–3 day–1 in anoxic conditions as obtained by isotope tracer experiments with G. barretti tissue fragments (Hoffmann et al., 2009; Rooks et al., 2020; Table 3 and Figures 4, 6). It might therefore well be that the model-inferred rates from intact (pumping) sponges are more representative from the natural holobiont condition than the rates obtained from just tissue fragments. Anammox genes accompanied with low anammox rates (∼0.003 μmol cm–3 day–1) were found in G. barretti by Hoffmann et al. (2009) but were absent in G. barretti in the study by Rooks et al. (2020). Model-based anammox rates (0.005–0.011 μmol cm–3 day–1) imposed to be below denitrification also hardly contributed to nitrogen cycling in G. barretti (Figures 4, 6).
Genes (napA, nrfA) involved in all steps of DNRA have been found in metagenomes of G. barretti (Gavriilidou, personal communication) and other deep-sea sponges (Li et al., 2014), but the DNRA process rates in Geodia (or other sponges) have not been quantified yet. The model-based DNRA rates were higher than the model-based denitrification rates (Table 3 and Figures 4, 6). The high organic C concentrations compared to concentrations would indeed favor DNRA (van den Berg et al., 2016), but whether these conditions are found in G. barretti remains to be validated. Studies on DNRA and denitrification gene expression might help to understand the relative role of each process, and that information can be used to constrain the rates in the model. It is however likely that DNRA is an important nitrogen-transforming process in G. barretti. In an earlier version of the model without DNRA, more had to be produced by excretion, which was balanced by the assimilation of DOM with an even lower C:N, lower nitrification rates, and release.
Dark carbon fixation rates in G. barretti (or other Geodiidae spp.) associated with nitrification and anammox have not yet been experimentally quantified. The first model-based estimates of dark carbon fixation rates for G. barretti are presented here (Table 3 and Figure 3), acknowledging the different energy yields from each nitrogen-transforming process (e.g., oxidation, oxidation, anammox). CO2 fixation rates contributed only a small fraction of 5.1–6.5% of G. barretti production and ∼1.5% of total C assimilation. These contributions are very similar to the range of 0.2–2.1% fixation relative to assimilation for the deep-sea encrusting sponge Hymedesmia coriacea (van Duyl et al., 2020). The benefit of hosting nitrifiers by the sponge holobiont is hypothesized to decrease or rapidly inactivate the internal concentration of produced as metabolic waste, which is possibly toxic to the host cells. In addition, it provides the substrate () for heterotrophic symbiont production in anoxic parts of the sponges. Combined with the production of DNRA and denitrification, N-transforming processes enhance the metabolic capacity of G. barretti and contribute significantly to G. barretti production [28 ± 16% (smaller individuals) and 32 ± 16% (larger individuals) of total production] (Table 3 and Figure 3). The substantial production by endosymbionts supports the idea that G. barretti, which is a HMA sponge, uses “microbial farming” and phagocytes and digests part of the microbiome as part of heterotrophic feeding.
The model covers N-based metabolism but not sulfur-based metabolism because sulfur data were not available. Both genes for sulfate reduction (heterotrophy) and sulfur oxidation (chemoautotrophy) are found in G. barretti (Jensen et al., 2017). The contribution of microbial production to G. barretti might become even higher if these processes would be included in the metabolic network model.
Size Dependency of Metabolism
Based on the metabolic datasets of Leys et al. (2018) and Bart et al. (2020b), all measured and modeled volume-specific rates, except the assimilation of external bacteria, were lower in larger than smaller sponges (Tables 1, 3). The measured O2 consumption by G. barretti showed large variability within and across the two metabolic datasets, which can be partly attributed (21% based on R2) to sponge volume (Figure 2; Leys et al., 2018; Bart et al., 2020b). The large variability within each metabolic dataset (Figure 2) might be linked to the intrinsic variability between individuals, e.g., the physiological and metabolic state of the holobiont (and analytical uncertainty), rather than external conditions as individuals were measured under the same experimental conditions. We cannot exclude that differences across the two metabolic datasets are partially caused by methodology [non-invasive in–ex, but snapshot (minutes) sampling vs. incubations, longer time integration (hours), but more prone to incubation effects]. However, comparable estimates of O2 consumption rates were obtained in sponges of similar size (green circle, Figure 2), indicating that the two complementary methods give consistent results.
O2 consumption in G. barretti is directly linked to pumping since pumping supplies sponge tissue with O2 and G. barretti that reduce their pumping activity rapidly become anoxic (Hoffmann et al., 2005; Leys et al., 2018). Lower specific pumping and clearance rates in larger individuals have been shown for some massive (i.e., non-encrusting) sponge species (Reiswig, 1974; Morganti et al., 2019), including G. barretti (Leys et al., 2018). Reduced pumping and O2 uptake in larger-sized ball-shaped sponges might be an effect of longer flow paths in larger individuals, resulting in increasing constraints to oxygenate the whole tissue. Lower O2 consumption in larger individuals did not result in a shift from aerobic to anaerobic processes. This is surprising because we had presumed that larger sponges would run easily into anoxic conditions at the deepest and less water-irrigated portions of their mesohyl. In contrast, the results suggest that all mesohyl regions are similarly, well irrigated by the network of aquiferous canals. However, it could be that any metabolic differences were masked by the large uncertainty associated with aerobic and anaerobic N-transforming processes (Figure 4). It will be interesting to compare microbial community structure between smaller- and larger-sized G. barretti to see how that changes with size.
The lower production efficiencies (24 ± 8% for C, 45 ± 11% for N; Table 3 and Figure 5) and production rates (0.067% day–1; Table 4) in larger G. barretti compared to smaller G. barretti (31 ± 14% for C, 57 ± 12% for N; Table 3 and Figure 5; 0.19% day–1, Table 4) fit with theoretical predictions that production efficiencies decrease with size (Banse, 1979; Sterner and Elser, 2002) because organisms cannot grow infinitely. Larger individuals will relatively use more energy for maintenance, while smaller individuals will allocate more energy to growth. Reiswig (1973) measured oscula growth in tubular sponge populations and observed that smaller individuals grow faster than larger individuals of the same sponge species and that a sharp decline in growth rate occurred when sponges reached maturity and started reproducing, thus allocating energy to gametes.
Sponge (Biomass) Production
Production by the sponge holobiont is allocated to various processes, which are mainly growth, reproduction, and renewal. The magnitudes and portions of each flow are largely unquantified for Geodia (and other deep-sea sponges). Therefore, we did not go any further with our model beyond estimating production by the sponge holobiont. Our production rates for G. barretti of 0.16% day–1 in smaller sponges and 0.067% day–1 in larger sponges (Table 4) seem low compared to modeled estimates for deep-sea sponges (0.23% day–1; Gontikaki et al., 2011), but not unrealistic as Geodiidae are generally considered to be slow growing. The yearly production would be 0.15 year–1 for larger sponges and 0.57 year–1 for smaller sponges, although temporal upscaling comes with large uncertainty as sponge metabolism, related to environmental conditions, might vary seasonally (Koopmans and Wijffels, 2008; Morley et al., 2016). Several sponge species (e.g., de Goeij et al., 2013; Alexander et al., 2014; Maldonado, 2016), including deep-sea species (Witte et al., 1997; Rix et al., 2016), release a substantial (up to 10% day–1) part of biomass as sponge detritus, but other studies show no or only limited production by (mostly non-encrusting) species (e.g., Yahel et al., 2007; Maldonado, 2016; McMurray et al., 2018; Pawlik and McMurray, 2020). Sponge detritus production by G. barretti was found to be low (Leys et al., 2018; Maier et al., 2020). Maier et al. (2020) estimated detritus release by G. barretti from tracer experiments as 0.03% day–1, which would still be 19–44% of our estimated sponge production. However, because of their efficiency in turning metabolic waste into new products, it could also be that any organic waste gets recycled within the holobiont rather than excreted. The low production rates, from which only an unconstrained fraction will be used for net growth, can explain why this sponge species is typically considered slow growing.
Ecosystem Context Using Model Estimations
The metabolic activity of G. barretti influences local C and N cycling at the benthic boundary layer, given the enormous abundance of this species over the extensive deep-sea area of the boreal region, forming the so-called Geodia grounds (Pham et al., 2019). G. barretti and other Geodiidae can make up > 90% of total benthic biomass (Klitgaard and Tendal, 2004; Murillo et al., 2012) in these regions at up to 6 kg WW m–2 (Klitgaard and Tendal, 2004; Kutti et al., 2013), although their distribution is patchy (Pham et al., 2019). Our sponge metabolic model results may aid in the first estimates of biogeochemical fluxes of C and N in these areas, specifically when only a subset of fluxes or environmental settings is known (e.g., only O2 fluxes, no C or N). For example, Geodia grounds have been identified as hotspots of metabolic activity compared to bare sediments (Kutti et al., 2013; Cathalot et al., 2015), showing one order of magnitude higher O2 consumption at high-abundance sponge grounds than for bare sediments (54 versus 6 mmol O2 m–2 day–1; based on 3 kg G. barretti WW m–2; Cathalot et al., 2015). Using our model-estimated RQ and C:N conversions, future studies can now approximate C and N fluxes based on in situ-assessed O2 fluxes alone. For example, G. barretti enhances nutrient recycling via DIN ( release (0.4–1.1 mmol N m–2 day–1 for a biomass of 1–3 kg WW m–2), which is comparable to or in excess of values typical for marine sediments [0.06 mmol N m–2 day–1 in the north Norwegian coast (Glud et al., 1998) to 0.64 mmol N m–2 day–1 in Logachev mound province, North-Atlantic (de Froe et al., 2019)]. However, sponge grounds are also a sink for N, as they release N2 at rates of 0.1–0.3 mmol N m–2 day–1, comparable to fluxes found in shelf sediments (0.1–1.0 mmol N m–2 day–1; Middelburg et al., 1996; Seitzinger and Giblin, 1996).
Care must be taken, however, since, on a larger ecosystem scale, the average G. barretti biomass in the south-west Barents Sea region (i.e., Trømso Plateau, North Cap bank, and areas in between; approximately 125,000 km2) is ∼50 g WW m–2 (Anisimova et al., 2010; Kêdra et al., 2017) and is even lower within the entire Barents Sea (∼15 g WW sponge m–2, 1.5 million km2; Wassmann et al., 2006). This points to orders-of-magnitude differences in local (see above) versus ecosystem-scale biogeochemical fluxes driven by sponges, including many species other than G. barretti from different phyla. In addition to (largely unknown) variations in metabolic rates between sponge species, the effect of metabolic rates under varying environmental conditions, including seasonality or hydrodynamics, is not yet well understood, considering the two available datasets that we used for our model.
Another important aspect of our model that can improve the ecological context of deep-sea sponges and sponge grounds is the size dependence on metabolic rates. Currently, benthic biomass estimations in deep-sea ecosystems, such as the Barents Sea, are largely based on trawl catch data (e.g., Wassmann et al., 2006; Jørgensen et al., 2014). Trawling is an invasive and only semi-quantitative (but cost-effective) method to assess benthic biomass and is generally skewed to larger individuals. The abundance and size distributions of deep-sea sponges can be better quantified on a larger scale by the non-invasive method of video transects (e.g., Kutti et al., 2013; Kêdra et al., 2017; Kazanidis et al., 2019; Maldonado et al., 2020b). Those data, combined with our modeled biogeochemical rates and efficiencies for different size classes of sponges, will further allow (first estimates of) quantifications of biogeochemical fluxes in sponge grounds of the NorthAtlantic Ocean and assess the functional integration of these sponge-dominated communities into deep-sea ecosystems.
Data Availability Statement
The dataset of Leys et al. (2018) is available at University of Alberta Education and Research Archive: doi: 10.7939/R3057D48V. The dataset of Bart et al. (2020b) will be made available at Pangaea. The model input files and R scripts are available on Zenodo: doi: 10.5281/zenodo.4139792.
Author Contributions
AK developed the model, performed the data analyses and model analyses, prepared the figures, and wrote the manuscript. MB and JG designed and conducted the incubation experiments, performed nutrient analyses, and contributed to the writing of the manuscript. SV contributed to model conceptualization and development. JM acquired funding and contributed to the conceptualization of the model, interpretation, and writing of the manuscript. MM contributed to the conceptualization of the model, interpretation, and writing. SL and SM contributed data for model development. KS contributed technically with model implementation and analyses. DO designed the model, contributed to model development and interpretation, and writing of the manuscript. All authors contributed to the article and approved the submitted version.
Funding
This research has been performed in the scope of the EU SponGES project, which received funding from the European Union’s Horizon 2020 Research and Innovation Program under grant agreement no. 679849. Further support included ERC starting grant agreement no. 715513 to JG and the Netherlands Earth System Science Center to JM. This document reflects only the authors’ views, and the Executive Agency for Small and Medium-sized Enterprises (EASME) is not responsible for any use that may be made of the information it contains.
Conflict of Interest
The authors declare that the research was conducted in the absence of any commercial or financial relationships that could be construed as a potential conflict of interest.
Acknowledgments
Titus Rombouts and Pieter Slot (UvA) and Sharyn Ossebaar (NIOZ) are acknowledged for their analytical assistance with the nutrient measurements of the incubation experiments. We thank Asimenia Gavriilidou and Detmer Sipkema (WUR, SponGES) for their input on the microbial genome in G. barretti. We thank last Hans Tore Rapp (UiB) for the excellent project coordination. We would like to thank CF and CR for their valuable and constructive reviews.
Supplementary Material
The Supplementary Material for this article can be found online at: https://www.frontiersin.org/articles/10.3389/fmars.2020.596251/full#supplementary-material
References
Alexander, B. E., Liebrand, K., Osinga, R., Geest, H. G., Van Der, Admiraal, W., et al. (2014). Cell turnover and detritus production in marine sponges from tropical and temperate benthic ecosystems. PLoS One 9:e0109486. doi: 10.1371/journal.pone.0109486
Anisimova, N. A., Jørgensen, L. L., Lyubin, P. A., and Manushin, I. E. (2010). Mapping and Monitoring of Benthos in the Barents Sea and Svalbard waters: Results From the Joint Russian - Norwegian Benthic Programme 2006-2008. IMR-PINRO Joint Report Series 1-2010. ISSN 1502-8828. 114 pp.
Banse, K. (1979). On weight dependence of net growth efficiency and specific respiration rates among field populations of invertebrates. Oecologia 38, 111–126. doi: 10.1007/bf00346558
Bart, M. C., de Kluijver, A., Hoetjes, S., Absalah, S., Mueller, B., Kenchington, E. L., et al. (2020a). Differential processing of dissolved and particulate organic matter by deep-sea sponges and their microbial symbionts. Sci. Rep. 10:17515. doi: 10.1038/s41598-020-74670-0
Bart, M. C., Mueller, B., Rombouts, T., van de Ven, C., Tompkins, G., Osinga, R., et al. (2020b). Dissolved organic carbon (DOC) is essential to balance the metabolic demands of North-Atlantic deep-sea sponges. Limnol. Oceanogr. 1–14. doi: 10.1002/lno.11652
Beazley, L., Kenchington, E., Yashayaev, I., and Murillo, F. J. (2015). Drivers of epibenthic megafaunal composition in the sponge grounds of the Sackville Spur, northwest Atlantic. Deep. Res. Part I Oceanogr. Res. Pap. 98, 102–114. doi: 10.1016/j.dsr.2014.11.016
Beazley, L. I., Kenchington, E. L., Murillo, F. J., and Sacau, M. (2013). Deep-sea sponge grounds enhance diversity and abundance of epibenthic megafauna in the Northwest Atlantic. ICES J. Mar. Sci. 70, 1471–1490. doi: 10.1093/icesjms/fst124
Cathalot, C., Van Oevelen, D., Cox, T. J. S., Kutti, T., Lavaleye, M., Duineveld, G., et al. (2015). Cold-water coral reefs and adjacent sponge grounds: hotspots of benthic respiration and organic carbon cycling in the deep sea. Front. Mar. Sci. 2:37. doi: 10.3389/fmars.2015.00037
de Froe, E., Rovelli, L., Glud, R. N., Maier, S. R., Duineveld, G., Mienis, F., et al. (2019). Benthic oxygen and nitrogen exchange on a cold-water coral reef in the north-east Atlantic ocean. Front. Mar. Sci. 6:665. doi: 10.3389/fmars.2019.00665
de Goeij, J. M., Lesser, M. P., and Pawlik, J. R. (2017). “Nutrient fluxes and ecological functions of coral reef sponges in a changing ocean,” in Climate Change, Ocean Acidification and Sponges: Impacts Across Multiple Levels of Organization, eds J. L. Carballo and J. J. Bell (Berlin: Springer), 373–410. doi: 10.1007/978-3-319-59008-0
de Goeij, J. M., van Oevelen, D., Vermeij, M. J. A. A., Osinga, R., Middelburg, J. J., de Goeij, A. F. P. M., et al. (2013). Surviving in a marine desert: the sponge loop retains resources within coral reefs. Science 342, 108–110. doi: 10.1126/science.1241981
Del Giorgio, P., and Williams, P. (2005). Respiration in Aquatic Ecosystems. Oxford: OUP, doi: 10.1093/acprof:oso/9780198527084.001.0001
Edwards, J. S., and Covert, M. (2002). Metabolic modelling of microbes: the flux-balance approach. Environ. Microbiol. 4, 133–140. doi: 10.1046/j.1462-2920.2002.00282.x
Fang, J. K. H., Rooks, C. A., Krogness, C. M., Kutti, T., Hoffmann, F., and Bannister, R. J. (2018). Impact of particulate sediment, bentonite and barite (oil-drilling waste) on net fluxes of oxygen and nitrogen in Arctic-boreal sponges. Environ. Pollut. 238, 948–958. doi: 10.1016/j.envpol.2017.11.092
Fiore, C. L., Freeman, C. J., and Kujawinski, E. B. (2017). Sponge exhalent seawater contains a unique chemical profile of dissolved organic matter. PeerJ 5:e2870. doi: 10.7717/peerj.2870
Glud, R., Holby, O., Hoffmann, F., and Canfield, D. E. (1998). Benthic mineralization and exchange in Arctic sediments (Svalbard, Norway). Mar. Ecol. Prog. Ser. 173, 237–251. doi: 10.3354/meps173237
Gontikaki, E., van Oevelen, D., Soetaert, K., and Witte, U. (2011). Food web flows through a sub-arctic deep-sea benthic community. Prog. Oceanogr. 91, 245–259. doi: 10.1016/j.pocean.2010.12.014
Grasshoff, K., Kremling, K., and Ehrhardt, M. (eds) (2009). Methods of Seawater Analysis. Weinheim: John Wiley and Sons.
Helder, W., and de Vries, R. T. P. (1979). An automatic phenol-hypochlorite method for the determination of ammonia in sea-and brackish waters. Neth. J. Sea Res. 13, 154–160. doi: 10.1016/0077-7579(79)90038-3
Hentschel, U., Piel, J., Degnan, S. M., and Taylor, M. W. (2012). Genomic insights into the marine sponge microbiome. Nat. Rev. Microbiol. 10, 641–654. doi: 10.1038/nrmicro2839
Hoffmann, F., Larsen, O., Thiel, V., Rapp, H. T., Pape, T., Michaelis, W., et al. (2005). An Anaerobic World in Sponges. Geomicrobiol. J. 22, 1–10. doi: 10.1080/01490450590922505
Hoffmann, F., Radax, R., Woebken, D., Holtappels, M., Lavik, G., Rapp, H. T., et al. (2009). Complex nitrogen cycling in the sponge Geodia barretti. Environ. Microbiol. 11, 2228–2243. doi: 10.1111/j.1462-2920.2009.01944.x
Hogg, M. M., Tendal, O. S., Conway, K. W., Pomponi, S. A., Van Soest, R. W. M., Gutt, J., et al. (2010). Deep-Sea Sponge Grounds: Reservoirs of Biodiversity. Cambridge: UNEP-WCMC. UNEP-WCMC Biodiversity Series No. 32.
Hopkinson, C. S., and Vallino, J. J. (2005). Efficient export of carbon to the deep ocean through dissolved organic matter. Nature 433, 142–145. doi: 10.1038/nature03191
Jensen, S., Fortunato, S. A. V., Hoffmann, F., Hoem, S., Rapp, H. T., Øvreås, L., et al. (2017). The relative abundance and transcriptional activity of marine sponge-associated microorganisms emphasizing groups involved in sulfur cycle. Microb. Ecol. 73, 668–676. doi: 10.1007/s00248-016-0836-3
Jiménez, E., and Ribes, M. (2007). Sponges as a source of dissolved inorganic nitrogen: nitrification mediated by temperate sponges. Limnol. Oceanogr. 52, 948–958. doi: 10.4319/lo.2007.52.3.0948
Jørgensen, L. L., Ljubin, P., Skjoldal, H. R., Ingvaldsen, R. B., Anisimova, N. A., and Manushin, I. (2014). Distribution of benthic megafauna in the Barents Sea: Baseline for an ecosystem approach to management. ICES J. Mar. Sci. 72, 595–613. doi: 10.1093/icesjms/fsu106
Kahn, A. S., Yahel, G., Chu, J. W. F., Tunnicliffe, V., and Leys, S. P. (2015). Benthic grazing and carbon sequestration by deep-water glass sponge reefs. Limnol. Oceanogr. 60, 78–88. doi: 10.1002/lno.10002
Kazanidis, G., Vad, J., Henry, L. A., Neat, F., Berx, B., Georgoulas, K., et al. (2019). Distribution of deep-sea sponge aggregations in an area of multisectoral activities and changing oceanic conditions. Front. Mar. Sci. 6:163. doi: 10.3389/fmars.2019.00163
Kazanidis, G., van Oevelen, D., Veuger, B., and Witte, U. F. M. (2018). Unravelling the versatile feeding and metabolic strategies of the cold-water ecosystem engineer Spongosorites coralliophaga (Stephens, 1915). Deep. Res. Part I Oceanogr. Res. Pap. 141, 71–82. doi: 10.1016/j.dsr.2018.07.009
Kêdra, M., Renaud, P. E., and Andrade, H. (2017). Epibenthic diversity and productivity on a heavily trawled Barents Sea bank (Tromsøflaket). Oceanologia 59, 93–101. doi: 10.1016/j.oceano.2016.12.001
Keesing, J. K., Strzelecki, J., Fromont, J., and Thomson, D. (2013). Sponges as important sources of nitrate on an oligotrophic continental shelf. Limnol. Oceanogr. 58, 1947–1958. doi: 10.4319/lo.2013.58.6.1947
Klitgaard, A. B. (1995). The fauna associated with the outer shelf and upper slope sponges (Porifera, Demospongiae) at the Faroe Isands, Northeastern Atlantic. Sarsia 80, 1–22. doi: 10.1530/EJE-11-0663
Klitgaard, A. B., and Tendal, O. S. (2004). Distribution and species composition of mass occurrences of large-sized sponges in the northeast Atlantic. Prog. Oceanogr. 61, 57–98. doi: 10.1016/j.pocean.2004.06.002
Koeve, W., and Kähler, P. (2010). Heterotrophic denitrification vs. autotrophic anammox-quantifying collateral effects on the oceanic carbon cycle. Biogeosciences 7, 2327–2337. doi: 10.5194/bg-7-2327-2010
Koike, I., and Hattori, A. (1975). Energy yield of denitrification: an estimate from growth yield in continuous cultures of Pseudomonas denitrijicans under nitrate-, nitrite- and nitrous oxide-limited conditions. J. Gen. Microbiol. 88, 11–19. doi: 10.1099/00221287-88-1-11
Koopmans, M., and Wijffels, R. H. (2008). Seasonal growth rate of the sponge Haliclona oculata (Demospongiae: Haplosclerida). Mar. Biotechnol. 10, 502–510. doi: 10.1007/s10126-008-9086-9
Kutti, T., Bannister, R. J., and Fosså, J. H. (2013). Community structure and ecological function of deep-water sponge grounds in the Traenadypet MPA-Northern Norwegian continental shelf. Cont. Shelf Res. 69, 21–30. doi: 10.1016/j.csr.2013.09.011
Kutti, T., Bannister, R. J., Fosså, J. H., Krogness, C. M., Tjensvoll, I., and Søvik, G. (2015). Metabolic responses of the deep-water sponge Geodia barretti to suspended bottom sediment, simulated mine tailings and drill cuttings. J. Exp. Mar. Bio. Ecol. 473, 64–72. doi: 10.1016/j.jembe.2015.07.017
Leys, S. P., Kahn, A. S., Fang, J. K. H., Kutti, T., and Bannister, R. J. (2018). Phagocytosis of microbial symbionts balances the carbon and nitrogen budget for the deep-water boreal sponge Geodia barretti. Limnol. Oceanogr. 63, 187–202. doi: 10.1002/lno.10623
Li, Z. Y., Wang, Y. Z., He, L. M., and Zheng, H. J. (2014). Metabolic profiles of prokaryotic and eukaryotic communities in deep-sea sponge Neamphius huxleyi indicated by metagenomics. Sci. Rep. 4, 1–12. doi: 10.1038/srep03895
Maier, S., Kutti, T., Bannister, R., Fang, J., van Breugel, P., van Rijswijk, P., et al. (2020). Recycling pathways in cold-water coral reefs: use of dissolved organic matter and bacteria by key reef suspension feeders. Sci. Rep 10:9942. doi: 10.1038/s41598-020-66463-2
Maldonado, M. (2016). Sponge waste that fuels marine oligotrophic food webs: a re-assessment of its origin and nature. Mar. Ecol. 37, 477–491. doi: 10.1111/maec.12256
Maldonado, M., Aguilar, R., Bannister, R. J., Bell, J. J., Conway, K. W., Dayton, P. K., et al. (2017). “Sponge grounds as key marine habitats: a synthetic review of types, structure, functional roles, and conservation concerns,” in Marine Animal Forests the Ecology of Benthic Biodiversity Hotspots, eds S. Rossi, L. Bramanti, A. Gori, and C. Orejas (Berlin: Springer), 145–183. doi: 10.1007/978-3-319-17001-5
Maldonado, M., Beazley, L., Kenchington, E., Koutsouveli, V., and Riesgo, A. (2020a). Cooperation between passive and active silicon transporters clarifies the ecophysiology and evolution of biosilicification in sponges. Sci. Adv. 6:eaba9322. doi: 10.1126/sciadv.aba9322
Maldonado, M., Beazley, L., López-Acosta, M., Kenchington, E., Casault, B., Hanz, U., et al. (2020b). Massive silicon utilization facilitated by a benthic-pelagic coupled feedback sustains deep-sea sponge aggregations. Limnol. Oceanogr. 1–26. doi: 10.1002/lno.11610
Maldonado, M., López-Acosta, M., Sitjà, C., García-Puig, M., Galobart, C., Ercilla, G., et al. (2019). Sponge skeletons as an important sink of silicon in the global oceans. Nat. Geosci. 12, 815–822. doi: 10.1038/s41561-019-0430-7
Maldonado, M., Ribes, M., and van Duyl, F. C. (2012). Nutrient fluxes through sponges. biology, budgets, and ecological implications. Adv. Mar. biol. 62, 113–182. doi: 10.1016/B978-0-12-394283-8.00003-5
Maldonado, M., Zhang, X., Cao, X., Xue, L., Cao, H., and Zhang, W. (2010). Selective feeding by sponges on pathogenic microbes: a reassessment of potential for abatement of microbial pollution. Mar. Ecol. Prog. Ser. 403, 75–89. doi: 10.3354/meps08411
McMurray, S. E., Johnson, Z. I., Hunt, D. E., Pawlik, J. R., and Finelli, C. M. (2016). Selective feeding by the giant barrel sponge enhances foraging efficiency. Limnol. Oceanogr. 61, 1271–1286. doi: 10.1002/lno.10287
McMurray, S. E., Stubler, A. D., Erwin, P. M., Finelli, C. M., and Pawlik, J. R. (2018). A test of the sponge-loop hypothesis for emergent Caribbean reef sponges. Mar. Ecol. Prog. Ser. 588, 1–14. doi: 10.3354/meps12466/
Middelburg, J. J. (2019). Marine Carbon Biogeochemistry, A Primer for Earth System Scientist. Cham: Springer Nature, doi: 10.1007/978-3-030-10822-9
Middelburg, J. J., Soetaert, K., Herman, P. M. J., and Heip, C. H. R. (1996). Denitrification in marine sediments: a model study. Global Biogeochem. Cy. 10, 661–673. doi: 10.1029/96gb02562
Morganti, T. M., Ribes, M., Yahel, G., and Coma, R. (2019). Size is the major determinant of pumping rates in marine sponges. Front. Physiol. 10:1417. doi: 10.3389/fphys.2019.01474
Morley, S. A., Berman, J., Barnes, D. K. A., Carbonell, C., de, J., Downey, R. V., et al. (2016). Extreme phenotypic plasticity in metabolic physiology of Antarctic demosponges. Front. Ecol. Evol. 3:157. doi: 10.3389/fevo.2015.00157
Murillo, F. J., Muñoz, P. D., Cristobo, J., Ríos, P., González, C., Kenchington, E., et al. (2012). Deep-sea sponge grounds of the flemish cap, flemish pass and the grand banks of newfoundland (Northwest Atlantic Ocean): distribution and species composition. Mar. Biol. Res. 8, 842–854. doi: 10.1080/17451000.2012.682583
Palsson, B. Ø, and Varma, A. (1994). Metabolic flux balancing: basic concepts, scientific and practical use. Biotechnology 12, 994–998. doi: 10.1038/nbt1094-994
Parzanini, C., Parrish, C. C., Hamel, J., and Mercier, A. (2018). Trophic relationships of deep-sea benthic invertebrates on a continental margin in the NW Atlantic inferred by stable isotope, elemental, and fatty acid composition. Prog. Oceanogr. 168, 279–295. doi: 10.1016/j.pocean.2018.10.007
Pawlik, J. R., and McMurray, S. E. (2020). The emerging ecological and biogeochemical importance of sponges on coral reefs. Annu. Rev. Mar. Sci. 12, 3.1–3.23.
Pham, C. K., Murillo, F. J., Lirette, C., Maldonado, M., Colaço, A., Ottaviani, D., et al. (2019). Removal of deep-sea sponges by bottom trawling in the Flemish Cap area: conservation, ecology and economic assessment. Sci. Rep. 9, 1–13. doi: 10.1038/s41598-019-52250-1
Pile, A. J., and Young, C. M. (2006). The natural diet of a hexactinellid sponge: benthic-pelagic coupling in a deep-sea microbial food web. Deep. Res. Part I Oceanogr. Res. Pap. 53, 1148–1156. doi: 10.1016/j.dsr.2006.03.008
Pita, L., Rix, L., Slaby, B. M., Franke, A., and Hentschel, U. (2018). The sponge holobiont in a changing ocean: from microbes to ecosystems. Microbiome 6:46. doi: 10.1186/s40168-018-0428-1
Porada, P., Thurner, M., Winterdahl, M., Beer, C., Vico, G., and Way, D. (2018). Reviews and syntheses: carbon use efficiency from organisms to ecosystems – definitions, theories, and empirical evidence. Biogeosciences 15, 5929–5949. doi: 10.5194/bg-15-5929-2018
Prosser, J. I. (2005). ““Nitrification,” in Encyclopedia of Soils in the Environment, eds D. Hillel and J. L. Hatfield (Amsterdam: Elsevier Inc), 31–39. doi: 10.1016/B0-12-348530-4/00512-9
R Core Team (2018). R: A Language and Environment for Statistical Computing. R Foundation for Statistical Computing. Vienna: R Core team.
Radax, R., Hoffmann, F., Rapp, H. T., Leininger, S., and Schleper, C. (2012). Ammonia-oxidizing archaea as main drivers of nitrification in cold-water sponges. Environ. Microbiol. 14, 909–923. doi: 10.1111/j.1462-2920.2011.02661.x
Reiswig, H. M. (1973). Coral reef project - papers in memory of Dr. Thomas F. Goreau. 8. population dynamics of three jamaican Demospongiae. Bull. Mar. Sci. 23, 191–226.
Reiswig, H. M. (1974). Water transport, respiration and energetics of three tropical marine sponges. J. Exp. Mar. Bio. Ecol. 14, 231–249. doi: 10.1016/0022-0981(74)90005-7
Rivkin, R. B., and Legendre, L. (2001). Biogenic carbon cycling in the upper ocean: effects of microbial respiration. Science 291, 2398–2400. doi: 10.1126/science.291.5512.2398
Rix, L., de Goeij, J. M., Mueller, C. E., Struck, U., Middelburg, J. J., van Duyl, F. C., et al. (2016). Coral mucus fuels the sponge loop in warm- and cold-water coral reef ecosystems. Sci. Rep. 6:18715. doi: 10.1038/srep18715
Rooks, C., Fang, J. K.-H., Mørkved, P. T., Zhao, R., Rapp, H. T., Xavier, J. R., et al. (2020). Deep-sea sponge grounds as nutrient sinks: high denitrification rates in boreo-arctic sponges. Biogeosciences 17, 1231–1245. doi: 10.5194/bg-17-1231-2020
Seitzinger, S. P., and Giblin, A. E. (1996). Estimating denitrification in North Atlantic continental shelf sediments. Biogeochemistry 35, 235–260. doi: 10.1007/bf02179829
Soetaert, K., Herman, P. M. J., and Middelburg, J. J. (1996). A model of early diagenetic processes from the shelf to abyssal depths. Geochim. Cosmochim. Acta 60, 1019–1040. doi: 10.1016/0016-7037(96)00013-0
Soetaert, K., and van Oevelen, D. (2009). Modeling food web interactions in benthic deep-sea ecosystems: a practical guide. Oceanography 22, 128–143. doi: 10.5670/oceanog.2009.13
Steinberg, D. K., and Landry, M. R. (2017). Zooplankton and the Ocean Carbon Cycle. Ann. Rev. Mar. Sci. 9, 413–444. doi: 10.1146/annurev-marine-010814-015924
Sterner, R., and Elser, J. (2002). Ecological Stoichiometry: The Biology of Elements from Molecules to the Biosphere. Princeton: Princeton university press.
Strand, R., Whalan, S., Webster, N. S., Kutti, T., Fang, J. K. H., Luter, H. M., et al. (2017). The response of a boreal deep-sea sponge holobiont to acute thermal stress. Sci. Rep. 7:1660. doi: 10.1038/s41598-017-01091-x
Strohm, T. O., Griffin, B., Zumft, W. G., and Schink, B. (2007). Growth yields in bacterial denitrification and nitrate ammonification. Appl. Environ. Microbiol. 73, 1420–1424. doi: 10.1128/AEM.02508-06
Thamdrup, B. (2012). New pathways and processes in the global nitrogen cycle. Annu. Rev. Ecol. Evol. Syst. Annu. Rev. 43, 407–428. doi: 10.1146/annurev-ecolsys-102710-145048
Thomassen, S., and Riisgard, H. U. (1995). Growth and energetics of the sponge Halichondria panicea. Mar. Ecol. Prog. Ser. 128, 239–246. doi: 10.3354/meps128239
Touratier, F., Legendre, L., and Vézina, A. (1999). Model of bacterial growth influenced by substrate C:N ratio and concentration. Aquat. Microb. Ecol. 19, 105–118. doi: 10.3354/ame019105
van den Berg, E. M., Boleij, M., Kuenen, J. G., Kleerebezem, R., and van Loosdrecht, M. C. M. (2016). DNRA and denitrification coexist over a broad range of acetate/N-NO3– ratios, in a chemostat enrichment culture. Front. Microbiol. 7:1841. doi: 10.3389/fmicb.2016.01842
Van den Meersche, K., Soetaert, K., and van Oevelen, D. (2009). xsample (): an R function for sampling linear inverse problems. J. Stat. Softw. 30, 1–15. doi: 10.1002/wics.10
van Duyl, F. C., Lengger, S. K., Schouten, S., Lundälv, T., van Oevelen, D., and Müller, C. E. (2020). Dark CO2 fixation into phospholipid-derived fatty acids by the cold-water coral associated sponge Hymedesmia (Stylopus) coriacea (Tisler Reef, NE Skagerrak). Mar. Biol. Res. 16, 1–17. doi: 10.1080/17451000.2019.1704019
van Oevelen, D., Mueller, C. E., Lundälv, T., van Duyl, F. C., de Goeij, J. M., and Middelburg, J. J. (2018). Niche overlap between a cold-water coral and an associated sponge for isotopically-enriched particulate food sources. PLoS One 13:e0194659. doi: 10.1371/journal.pone.0194659
van Oevelen, D., van den Meersche, K., Meysman, F. J. R., Soetaert, K., Middelburg, J. J., and Vézina, A. F. (2010). Quantifying food web flows using linear inverse models. Ecosystems 13, 32–45. doi: 10.1007/s10021-009-9297-6
Wassmann, P., Reigstad, M., Haug, T., Rudels, B., Carroll, M. L., Hop, H., et al. (2006). Food webs and carbon flux in the Barents Sea. Prog. Oceanogr. 71, 232–287. doi: 10.1016/j.pocean.2006.10.003
Watson, J. R. (2017). Modelling Sponge-Symbiont Metabolism. Dissertation, The University of Queensland, Brisbane, QLD, doi: 10.14264/uql.2017.180
White, A. E., Giovannoni, S. J., Zhao, Y., Vergin, K., and Carlson, C. A. (2019). Elemental content and stoichiometry of SAR11 chemoheterotrophic marine bacteria. Limnol. Oceanogr. Lett 4, 44–51. doi: 10.1002/lol2.10103
Witte, U., Brattegard, T., Graf, G., and Springer, B. (1997). Particle capture and deposition by deep-sea sponges from the Norwegian-Greenland Sea. Mar. Ecol. Prog. Ser. 154, 241–252. doi: 10.3354/meps154241
Yahel, G., Whitney, F., Reiswig, H. M., Eerkes-Medrano, D. I., and Leys, S. P. (2007). In situ feeding and metabolism of glass sponges (Hexactinellida, Porifera) studied in a deep temperate fjord with a remotely operated submersible. Limnol. Oceanogr. 52, 428–440. doi: 10.4319/lo.2007.52.1.0428
Zhang, Y., Qin, W., Hou, L., Zakem, E. J., Wan, X., Zhao, Z., et al. (2020). Nitrifier adaptation to low energy flux controls inventory of reduced nitrogen in the dark ocean. Proc. Natl. Acad. Sci. U.S.A. 117:201912367. doi: 10.1073/pnas.1912367117
Keywords: allometry, metabolic network model, sponge holobiont metabolism, production, biogeochemistry, chemoautotrophy, sponge ground, LIM
Citation: de Kluijver A, Bart MC, van Oevelen D, de Goeij JM, Leys SP, Maier SR, Maldonado M, Soetaert K, Verbiest S and Middelburg JJ (2021) An Integrative Model of Carbon and Nitrogen Metabolism in a Common Deep-Sea Sponge (Geodia barretti). Front. Mar. Sci. 7:596251. doi: 10.3389/fmars.2020.596251
Received: 18 August 2020; Accepted: 30 November 2020;
Published: 18 January 2021.
Edited by:
Daniela Zeppilli, Institut Français de Recherche pour l’Exploitation de la Mer (IFREMER), FranceReviewed by:
Christopher Freeman, College of Charleston, United StatesClara F. Rodrigues, University of Aveiro, Portugal
Copyright © 2021 de Kluijver, Bart, van Oevelen, de Goeij, Leys, Maier, Maldonado, Soetaert, Verbiest and Middelburg. This is an open-access article distributed under the terms of the Creative Commons Attribution License (CC BY). The use, distribution or reproduction in other forums is permitted, provided the original author(s) and the copyright owner(s) are credited and that the original publication in this journal is cited, in accordance with accepted academic practice. No use, distribution or reproduction is permitted which does not comply with these terms.
*Correspondence: Anna de Kluijver, YS5kZWtsdWlqdmVyQHV1Lm5s; YW5uYS5kZWtsdWlqdmVyQHJ2by5ubA==