 Caio Cesar-Ribeiro1,2*
 Fernanda R. Piedras1,2
 Leticia C. da Cunha1,3,4,5
 Domênica T. de Lima1,2
 Luana Q. Pinho3
 Gleyci A. O. Moser1,2
- 1Programa de Pós-Graduação em Oceanografia, Universidade do Estado do Rio de Janeiro (UERJ), Rio de Janeiro, Brazil
- 2Laboratório de Ecologia e Cultivo de Fitoplâncton Marinho, Departamento de Oceanografia Biológica, Faculdade de Oceanografia, Universidade do Estado do Rio de Janeiro, Rio de Janeiro, Brazil
- 3Laboratório de Oceanografia Química, UERJ, Rio de Janeiro, Brazil
- 4Brazilian Ocean Acidification Network (BrOA), Rio Grande, Brazil
- 5Rede Clima, Sub-Rede Oceanos, Instituto Nacional de Pesquisas Espaciais (INPE), São José dos Campos, Brazil
From the southwestern termination of the Agulhas current, anticyclonic eddies are emitted and drift across the South Atlantic Ocean. This study is based on a FORSA (Following Ocean Rings in the South Atlantic) oceanographic cruise, from Cape Town (South AFRica) to Arraial do Cabo (Brazil) in June 2015, during which three eddies of different ages (E1, 7 months; E3, 11 months; E5, 24 months) from the Agulhas current were sampled for microplankton identification and determination of functional traits. The stations where sampling occurred at each eddy included a control outside the eddy and three stations inside the eddy—border, midway (between the border and center), and center (identified through satellite images of sea level anomaly—SLA). Functional traits were determined based on microscopic observations and consultation of the literature. An evident decay in the Agulhas eddies toward the west was observed, and each eddy proved to be different. E1 represented a younger and more robust structure. At the same time, the other eddies, E3 and E5, were more alike with similar physical, chemical, and ecological characteristics and almost the same indices values of functional diversity, demonstrating that although their species compositions were different, the strategies used by the species were the same. The most crucial ecological trait for microplankton was nutrition mode. The microplankton contained mainly mixotrophic dinoflagellates and cyanobacteria adapted to oligotrophic conditions. The functional strategy of microplankton did not differ among the eddies and stations, with mixotrophy being the most striking trait. Therefore, the older eddies’ microplankton community fits the neutrality theory, whereby species perform similar ecological functions, and the younger eddy fits in the niche complementarity. Even with the species composition being different in each eddy and/or within the same eddy, the functional strategy was the same, with scarce resources and species selected that best use any source of nutrients or use evolutionary advantages to live in an oligotrophic environment.
Introduction
Phytoplankton community structure can be affected by both deterministic and stochastic processes. In a niche-driven community model, deterministic processes can affect the frequency of traits (e.g., coloniality, nutritional mode) across all individuals because community structure depends on the species’ traits (Violle et al., 2007; Litchman and Klausmeier, 2008). However, high species richness is not always translated into high functional richness, as neutrality can occur when species are ecological equivalents (Vergnon et al., 2009).
The paradox of the plankton describes a situation in which phytoplankton richness is greater than the number of existing resources in a steady-state system, rather than a presumed limited number of coexisting species due to competition for nutrients under resource-limitation (Hutchinson, 1961). A solution to the paradox comes from environmental fluctuations, in opposition to a steady-state condition, stopping competitive exclusion (Tilman, 1977, 1981, 1982) and niche-driven community fluctuations (Vergnon et al., 2009). Other mechanisms not involving environmental fluctuations could lead to high species richness (Narwani et al., 2009), including neutral population dynamics.
Neutrality refers to the co-occurrence of species that are ecological equivalents in their competitive abilities (Hubbell, 2001). Because of this near-equal competitiveness, multiple species can coexist over time scales relevant to ecology, thereby allowing greater biodiversity. In phytoplankton assemblages, neutrality can be a mechanism that drives increased species richness (Vergnon et al., 2009). Neutral models assume that all species are identical; consequently, no single species is at a competitive advantage or disadvantage, and exclusion does not occur. On the other hand, niche-based models assume differences in resource use between species so that they avoid competition and coexist (Hubbell, 2001, 2005; Adler et al., 2007).
Coexistence depends on the magnitude of the difference or inequality in capability between species (Adler et al., 2007). The consequences of the shape that the species take when and where they occur and the niches of individual species come from how they interact with other species (as competitors, resource-providers, predators, etc.) (Gaston and Chown, 2005).
Functional trait-based diversity of phytoplankton is mostly unexplored throughout the ocean, even though this approach (functional trait diversity) gives ecological information about species in changing environments (stratification, nutrient availability, cell size, and community structure) (Lorrain et al., 2019; Tuerena et al., 2019). Global climate change may favor opportunistic plankton species (e.g., Van de Waal and Litchman, 2020). Thus, knowledge of plankton community dynamics is important to understand which community ecological traits might remain or alter in a changing environment.
Mesoscale ocean eddies, such as the Agulhas rings, form partially isolated environments with particular physical and chemical conditions that support and transport entire plankton communities (Lehahn et al., 2011; Condie and Condie, 2016; Barlow et al., 2017). These eddies are mesoscale, anticyclonic structures that constitute the principal route for relatively warm and saline waters from the Indian Ocean to reach the Atlantic Ocean as part of the surface limb of the Meridional Overturning Circulation (Olson and Evans, 1986; Schouten et al., 2000; Dencausse et al., 2010). After being shed from the Agulhas Current retroflection offshore of the southern tip of AFRica, between longitudes 16°E and 20°E, the eddies drift initially embedded in the Benguela Current, overcome the Walvis Ridge, and then follow W-NW through the South Atlantic with some even reaching the western boundary (Lutjeharms and Van Ballegooyen, 1988; Gordon and Haxby, 1990; Byrne et al., 1995; Guerra et al., 2018). As recently discussed, such rings can also transport plankton over long distances from the source region (Villar et al., 2015; Carvalho et al., 2019). The environment within Agulhas rings may create a selective mechanism, with higher nutrient concentrations than the oligotrophic surface water of the Atlantic Ocean, and associated phytoplankton blooms dominated by opportunistic species nitrate-metabolizing Synechococcus spp. analogs (Villar et al., 2015).
Low microplankton diversity observed in the South Atlantic Ocean is associated with nutrient limitation (e.g., Olson, 1981), and Agulhas rings work as filters for planktonic size fractions above 20 μm (Villar et al., 2015), thereby limiting species diversity. However, there have been no studies focusing on the functional diversity and dynamics of these organisms within Agulhas rings of different ages.
Considering that Agulhas rings are oligotrophic and biogeochemically peculiar environments and that they act as a selective mechanism for phytoplankton species diversity, we hypothesized that with increasing eddy age and loss of vorticity, the physicochemical properties of seawater inside these mesoscale structures become more similar to the surrounding oligotrophic waters, this equalizing process minimizes the differences in microplankton functional diversity. Here we provide the results of analyzing data sampled during a cruise specifically planned to study Agulhas rings of different ages throughout the South Atlantic.
Materials and Methods
The FORSA Cruise
This study is based on FORSA (Following Ocean Rings in the South Atlantic) oceanographic cruise from Cape Town (South AFRica) to Arraial do Cabo (Brazil) in June 2015 (Austral Winter). The expedition aimed at studying anticyclonic mesoscale ocean eddies, using satellite sea level anomaly (SLA) data from AVISO (Archiving, Validation, and Interpretation of Satellite Oceanographic Data) to find and cross these structures along the ship’s path (Figure 1). During the FORSA cruise, six Agulhas rings were sampled, but plankton samples were collected in three eddies of different ages (E1, 7 months; E3, 11 months; E5, 24 months). The eddies ages were determined through satellite images (AVISO) of the moment of their formation in the retroflection area (Guerra et al., 2018; Orselli et al., 2019).
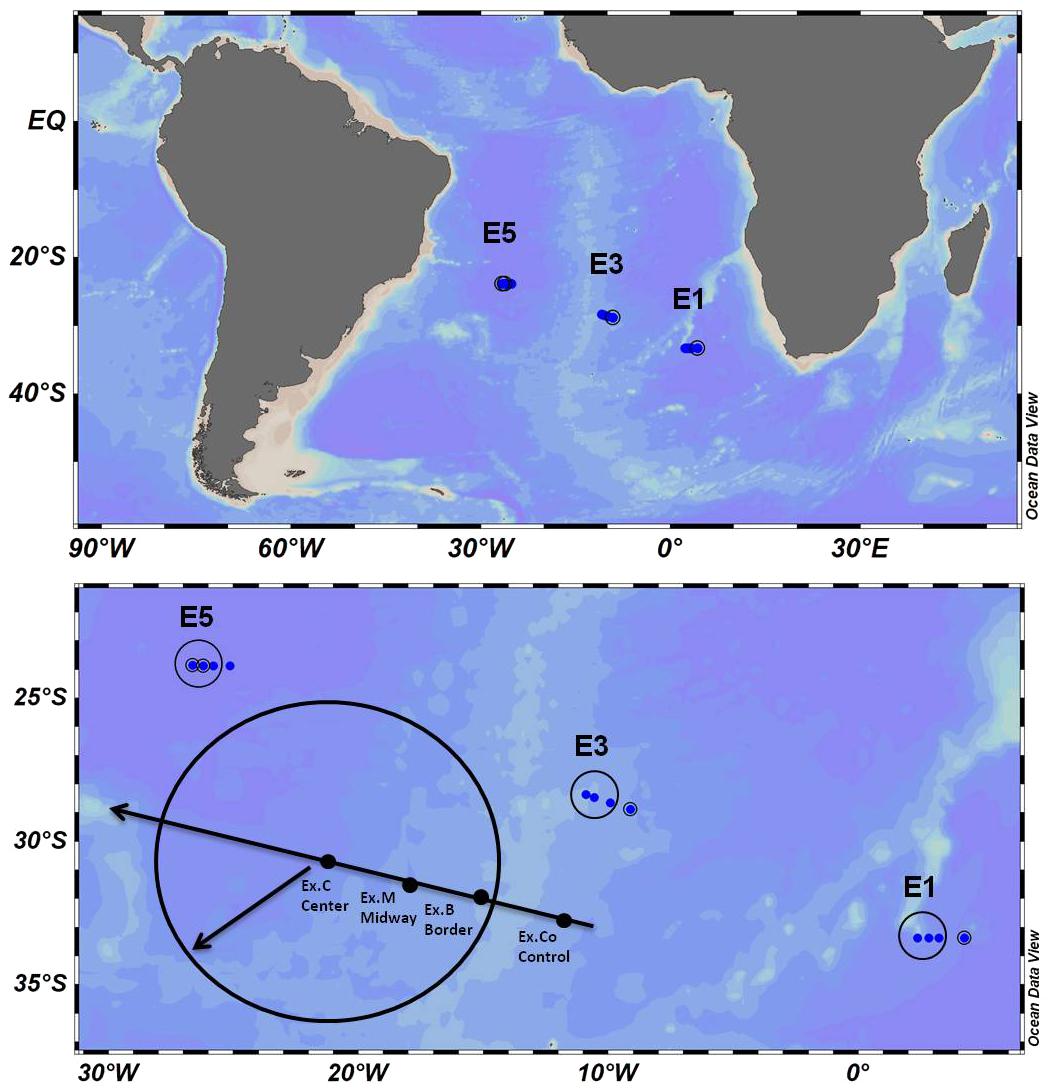
Figure 1. Ocean Data View (ODV) Sampling maps (a and b—sample scheme) of eddies in the South Atlantic (E1, E3, and E5, control: Co—outside, border: B, midway: M and center: C of the eddy).
The CTD-O2 and discrete water sampling stations were always occupied on the eastern side of eddies E1, E3, and E5; one Co—control station outside the eddy, and three stations inside the eddy (at the B—border, M—midway—between the border and the center, and C—center—Figure 1), determined by AVISO satellite images of SLA. Discrete water samples for plankton and nutrient analysis were collected in two different depths: near-surface (10 m) and DCM (Deep chlorophyll maximum—obtained by CTD fluorimeter data). Seawater samples (1.5 L) were collected for microphytoplankton (>20 μm) analyses and fixed with 1% neutral Lugol’s solution, final concentration. Once at the laboratory, the samples were left to settle for a week’ and subsequently reduced to a volume of 200–300 ml. This entire volume was counted in 100 ml chambers, previously settled for 48 h. The entire chambers were counted on an inverted optical microscope (Nikon Eclipse TS-100, under 200× and 400× magnification). Cell densities (cell L–1) of microphytoplankton (20–200 μm) were determined, according to Utermöhl (1958). The organisms (cells, colonies, and filaments) were quantified throughout the chamber on an inverted optical microscope. Diatoms and dinoflagellates were identified using specific bibliography (Hasle and Fryxell, 1970; Tomas, 1997).
Dissolved nutrients were analyzed in the water samples (nitrate, NO3–, nitrite NO2–, phosphate PO43–, and silicate Si(OH)4). The samples were immediately frozen on board without filtration and kept frozen at −20°C until analysis by spectrophotometry, according to Aminot and Chaussepied (1983).
Functional Traits
Functional traits were selected based on microscopic observations and consultation of the literature, especially Litchman and Klausmeier (2008) and Litchman et al. (2010), considering only microplankton (20–200 μm).
The classification was performed, including morphological, physiological, behavioral, and life-cycle traits. Morphological traits included size—represented by maximum linear dimension (MLD), obtained by measuring at least 5 cells of each taxon (due to the rarity of species and number of individuals found, the species with less than 5 individuals were excluded from the statistical analyses). According to Litchman et al. (2010), MLD classification reflects predation pressure, MLD < 40 μm- vulnerable to microzooplankton predators, and MLD > 40 μm less vulnerable to microzooplankton predators. In addition to this morphological trait, other morphological traits determined from microscopic analyses included sv–1 (cell’s surface per volume ratio), considered as a master trait that can represent a powerful predictor of phytoplankton physiological performances offering a valid interpretation of environmental conditions (Kruk et al., 2010), in the binary traits matrix sv–1 > 0.44, was considered 1 and sv–1 < 0.44, was considered 0; the presence of large vacuoles and iv. coloniality (filaments and chains). Physiological traits, represented by potential toxicity and harmful algal bloom (HAB) formation capacity (Kofoid and Swezy, 1921; Round et al., 1990; Brandt et al., 2001; Horner et al., 2002; Hällfors, 2004; Moestrup et al., 2020; Steidinger, 2009)1 and nutrition mode- autotrophy, heterotrophy, and mixotrophy (Tomas, 1997; Throndsen et al., 2007; Mitra et al., 2014; Leles et al., 2017; Moser et al., 2017). An important trophic mode among planktonic protists (dinoflagellates) in the global ocean is mixotrophy—the combination of phagotrophy and autotrophy in an individual cell (Leles et al., 2017; Stoecker et al., 2017). The behavioral trait considered was mobility, which was determined by flagella’s presence during microscopic observation and from the literature (Tomas, 1997). Resting stages represented life cycle traits, evaluated using the literature (Tomas, 1997; Patil and Anil, 2008; Imai and Yamaguchi, 2012).
For plastic traits such as colony and chain formation, HAB formation capacity, mixotrophy, and resting stages, trait values refer to a potential function, not whether expressed in any particular community.
Data Analyses
Testing Environmental Patterns
Biotic and abiotic data were submitted to analyze variation (ANOVA) and Mann-Whitney pairwise test (Software Paleontological Statistical 3—PAST, Hammer et al., 2001). We tested the variation among the three analyzed rings and considered the Depth (Surface × DCM).
Functional Diversity Indices
The functional traits used to evaluate the functional diversity (FD) index of the community (Petchey and Gaston, 2006, 2007) were: morphological, physiological, behavioral, and life-cycle traits. Two matrices were prepared for calculating FD indices, a functional trait matrix (species composition- as observations, and the presence or absence of traits—as variables) and a species abundance matrix (sampled stations and species abundances cell L–1—as observations).
Functional groups were tested using cluster analysis (Euclidean distance and the Ward method), in the Vegan package (version 3.5.1—R Core Team, 2018) (Oksanen et al., 2017), with the functional trait matrix (Petchey and Gaston, 2006, 2007). Functional diversity indices aim to describe how much of the multifunctional space is filled and how the abundance of a community is distributed within this functional space. These indices have positive values, with higher values representing greater functional diversity of the component they scale (Villéger et al., 2008).
Functional richness (FRic) represents a multidimensional measure of community-filled functional space and corresponds to a convex hull volume in the functional space (Cornwell et al., 2006; Villéger et al., 2008). There is no limit as it quantifies an absolute filled volume (Villéger et al., 2008). Functional equitability (FEve) describes the evenness of the distribution of abundance in the space of functional traits; it corresponds to a measure of regularity between species along the gradient of functional traits and regularity in the weighted distribution of their abundance. This measure decreases when abundance is less evenly distributed among species or when functional distances between species are not consistent. It is restricted to values between 0 and 1 (Villéger et al., 2008). FDis is the weighted mean of each species’ distance to the centroid of all species within a community, in the multidimensional space of traits. This index considers both traits and abundance of each species, where weights correspond to each species’ relative abundance, and there is no upper limit to its value (Laliberté and Legendre, 2010).
The functional traits matrix (binary data) and species abundances matrix were used to evaluate community functional diversity (FD) in the resulting groups, using multidimensional indices based on Euclidean distance and non-parametric multidimensional scaling (NMDS) of traits to measure different aspects of diversity, FRic, FEve, and FDis. These metrics were calculated using the dbFD function of the FD package (Laliberté and Legendre, 2010; R software, version 3.5.1; R Core Team, 2018).
The Relationship Among Environment, Planktonic Species, and Function Indices
To determine which environmental variables are correlated with phytoplankton assemblages, a Canonical Correspondence Analysis (CCA) and a Pearson correlation were applied to log-transformed matrices of species abundance, functional indices, and environmental variables (temperature, salinity, nitrite, nitrate, phosphate, silicate, and fluorescence). Normality was tested by the Shapiro–Wilk test (Software Paleontological Statistical 3—PAST, Hammer et al., 2001). ANOSIM was also applied to data matrices of abundance and traits, comparing the three observed eddies cluster. ANOVA Mann-Whitney pairwise test was applied to data matrices comparing all eddies, in-depth between each other.
Results
The Physical Structure of the Eddies
All eddies contained South Atlantic Central Water (SACW) within the sampled depths for phytoplankton are represented in Figure 2, according to the given ranges of potential temperature (°C) and salinity of source water types (Souza et al., 2018; Table 1). Subtropical Mode Water 18 (STMW18) was found in all eddies, but STMW14 was present only outside eddy E1 below 100 m (control station). Eddies E3 and E5 had Atlantic Tropical Water (TW) in the surface layer.
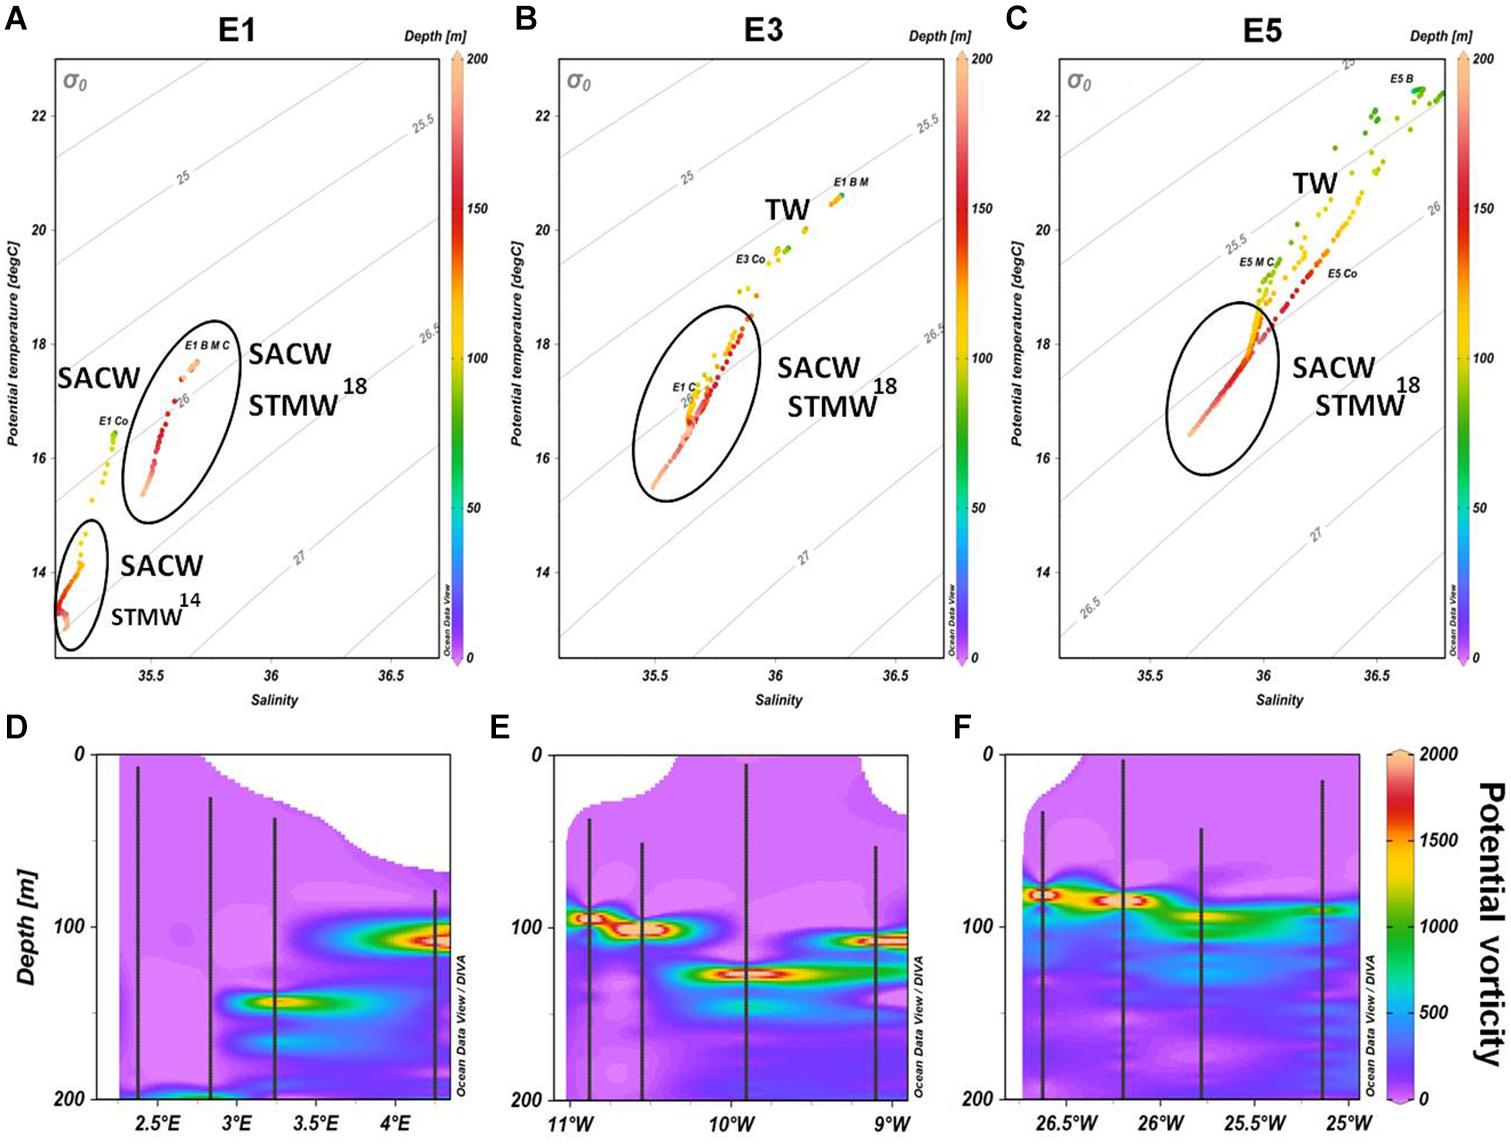
Figure 2. (A–C) TS (Temperature and Salinity) Diagrams for eddies E1, E3, and E5, respectively, from the surface to 200 m. The continuous black ellipses denote the water masses found in each eddy. (D–F) Potential vorticity Q (10–12m–1. s–1) of the three eddies (E1, E3, and E5, respectively) from 0 to 200 m depth. The black points forming lines indicate the CTD profile.
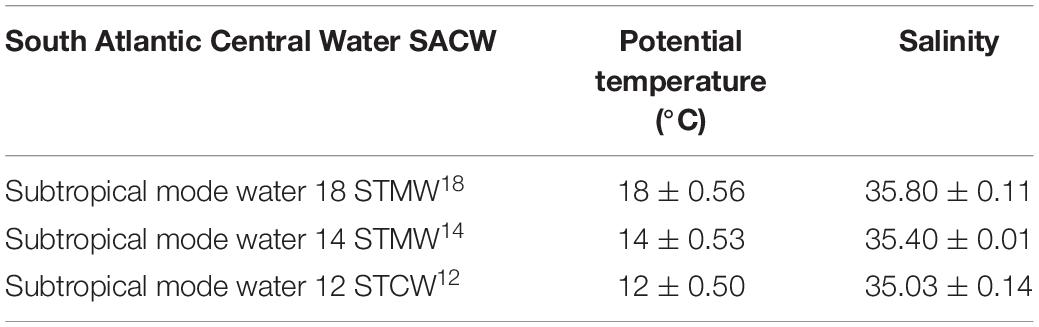
Table 1. South Atlantic Central Water (SACW) sources of water types characteristics: temperature (°C) and salinity—according to Souza et al. (2018).
The highest values of potential vorticity (>1,500 10–12m–1s–1) were found between 75 and 200 m (Figure 2), coinciding with maximum fluorescence depth. Thus, potential vorticity relates to water column turbulence and maintains primary producers within the euphotic zone.
The higher nitrite concentrations of nutrient distribution throughout the water column were found at the E1 border (Surface: 0.34 μmol.L–1 and DCM: 0.36 μmol.L–1), and higher nitrate concentrations were found in the E3 midway (DCM: 5.61 μmol.L–1). Phosphate was high at E1: control (surface) 0.21 μmol.L–1, border (120 m depth) 0.31 μmol.L–1, and midway (surface) 0.27 μmol.L–1. Silicate concentrations were higher at the deep chlorophyll maximum (DCM) in the center of all eddies (Table 2).
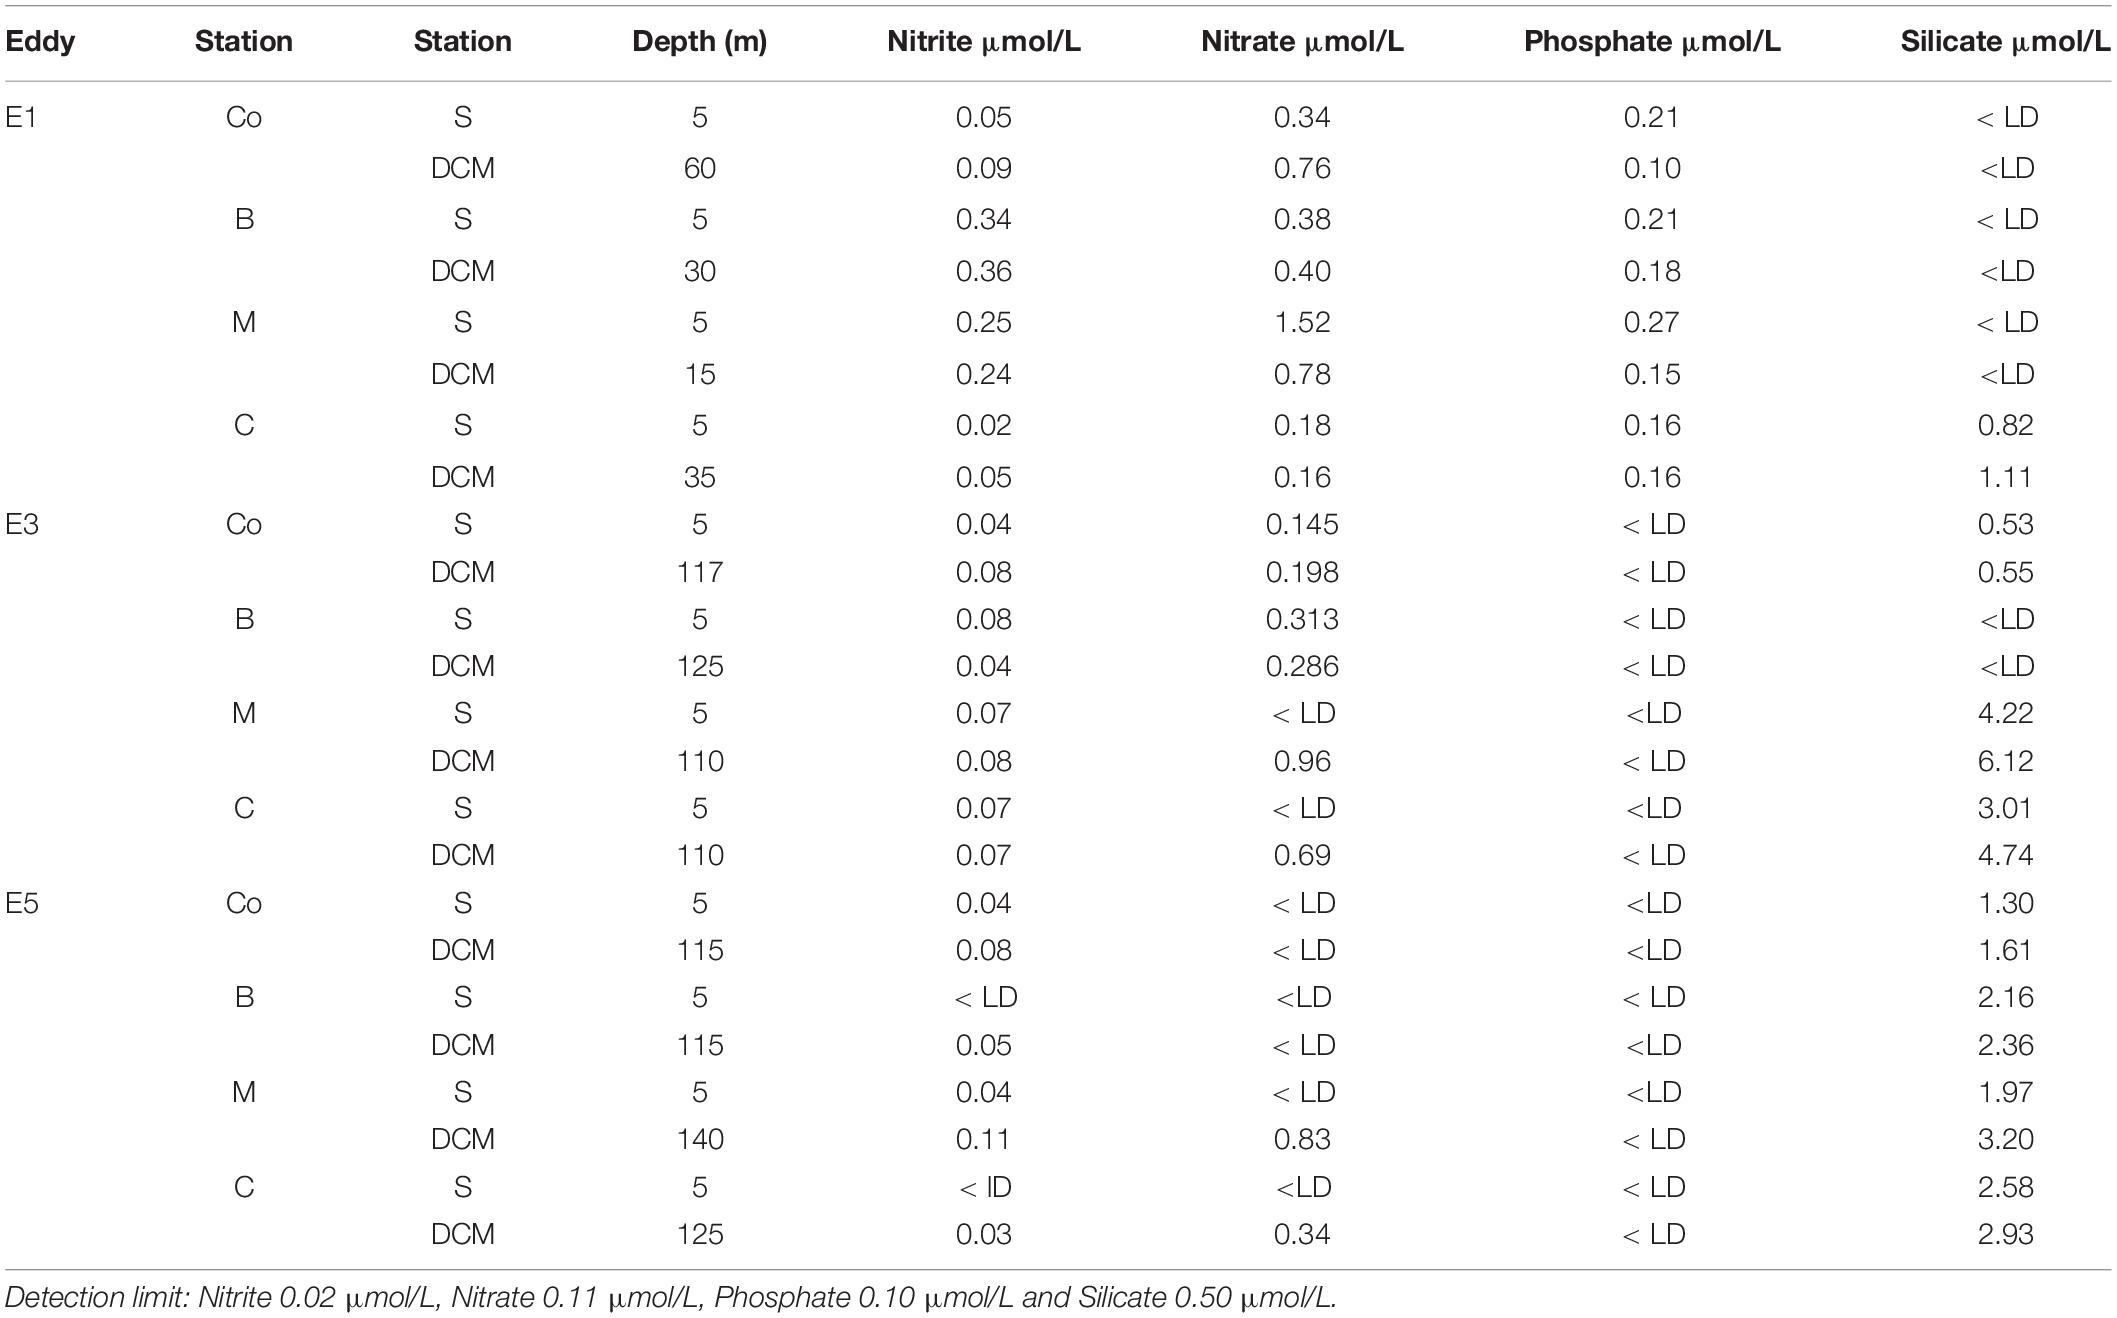
Table 2. Nutrients data (nitrite, nitrate phosphate, and silicate—μmol/L) from the eddies 1, 3, and 5, in different stations (Co, B, M, and C) and depths (S, subsurface; and DCM, the depth of chlorophyll maximum).
There were 111 taxa of microphytoplankton, corresponding to 81 taxa of dinoflagellates, 23 taxa of diatoms, and 7 taxa of phytoflagellates. The E1 was dominated mainly by filamentous cyanobacteria and dinoflagellates at the control and border, both on the surface and DCM. In the midway and center stations, there was an increase in the abundance of diatoms dominating the samples at the two depths (Figure 3). In E3 (stations E3.Co, E3.B, and E3.M), cyanobacteria were dominant, followed by dinoflagellates on the surface and DCM. Eddy E5 had a lower absolute concentration of microphytoplankton (cell L–1) than the other eddies, and the cell densities were more similar to the control station. However, three sampling points (E5 Co, M, and C) were also dominated by cyanobacteria followed by dinoflagellates in the DCM surface and diatoms.
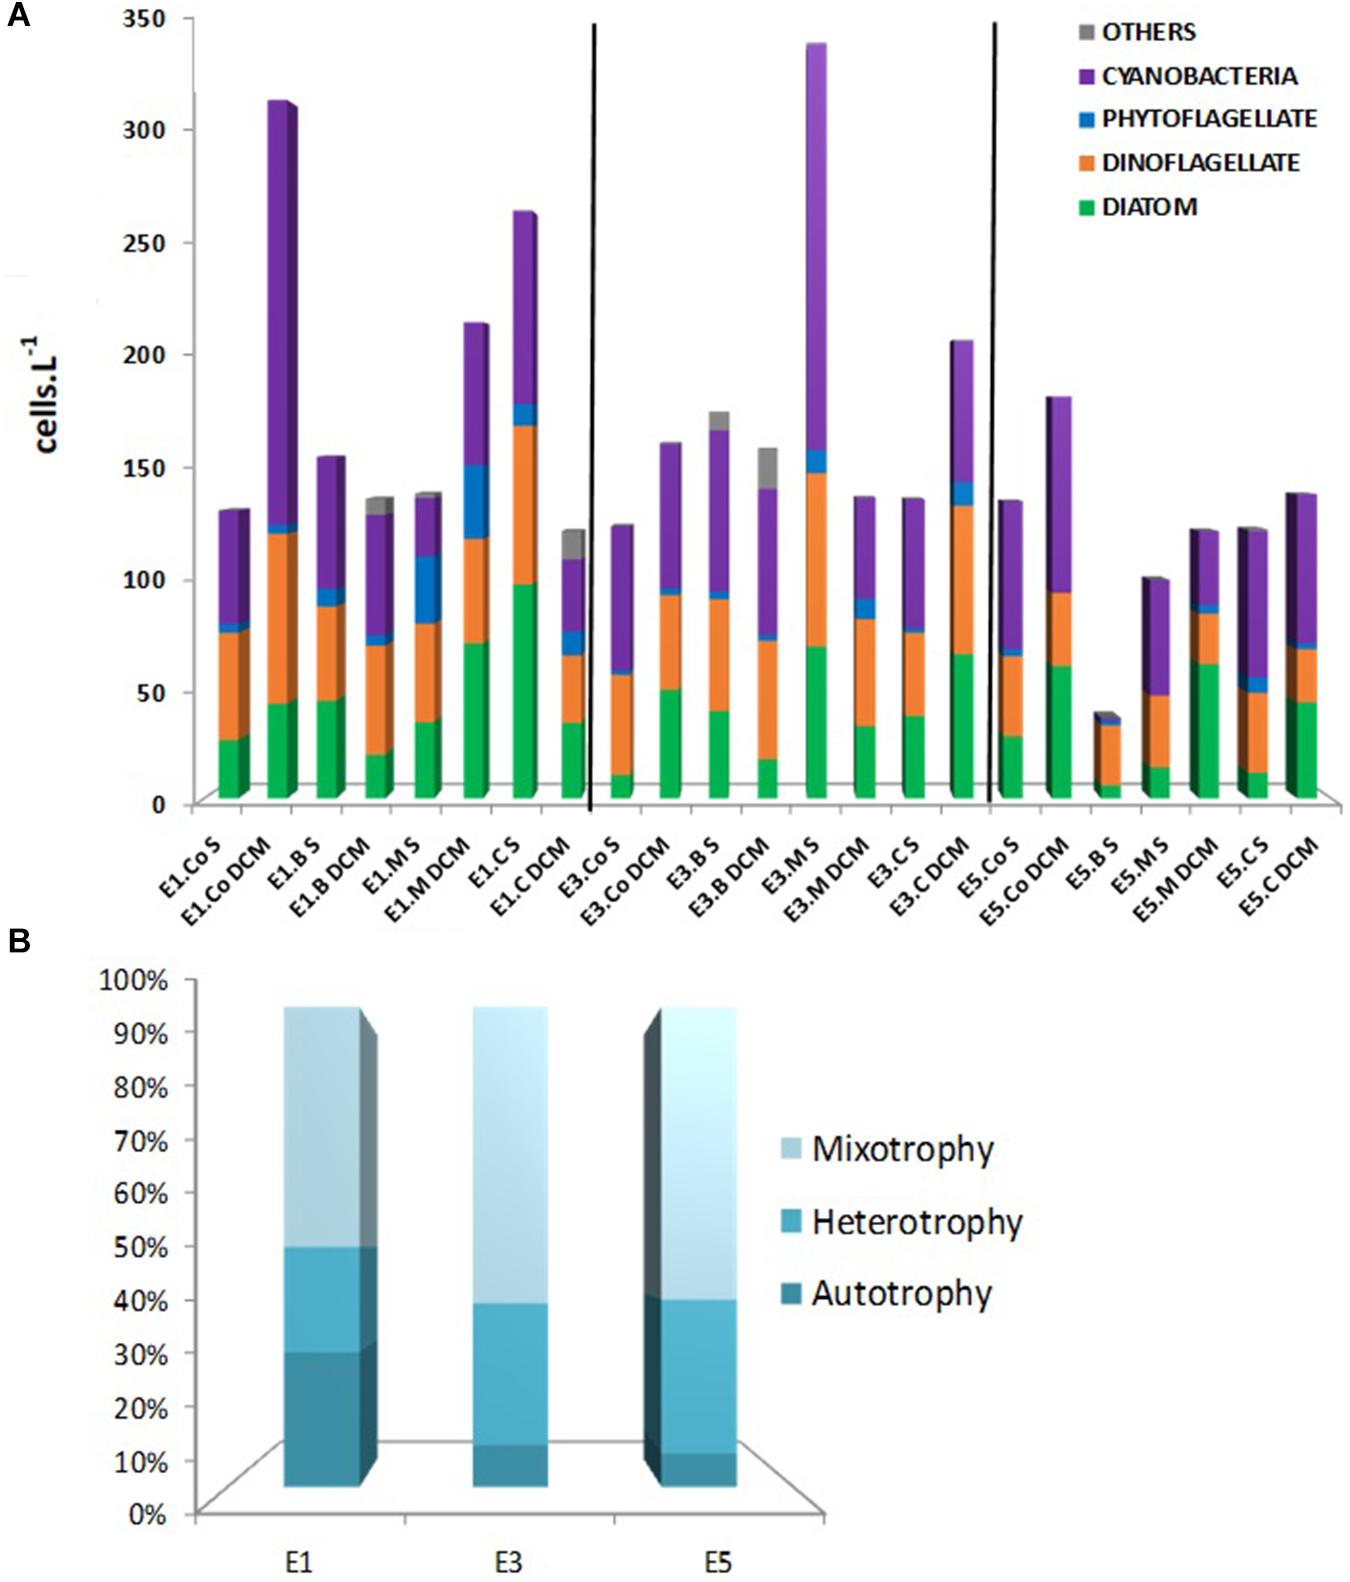
Figure 3. (A) Group densities (cells.L–1) of microphytoplankton in E1, E3, and E5—in the control, border, midway and center stations, surface, and DCM. (B) Frequency (%) of autotrophy, mixotrophy, and heterotrophy of microphytoplankton.
The most frequent diatoms were Thalassiosira spp. and Thalassionema spp. in comparison, the most frequent dinoflagellate was Gymnodinium spp.; Prorocentrum cordatum; Heterocapsa spp.; Tripos teres and Prorocentrum spp. The 24-month-old eddy E5 presented the lowest number of individuals and microphytoplankton diversity and a relatively large amount of coccoid cyanobacteria (Anabaena sp.).
The traits revealed that nutrition mode (Figure 3) was the essential trait to differentiate species and their functional strategies. The frequencies (%) of autotrophy, mixotrophy, and heterotrophy of microplankton in E3 and E5 were similar: the majority of the species were mixotrophs (>60%), due to the high diversity of dinoflagellates, followed by heterotrophs (approximately 30%) and a minor percentage of autotrophs (<10). The situation in E1, however, differed, with the frequency of mixotrophs being lower than in the other eddies (<50%), followed by autotrophs 28% (highest frequency among all eddies) and heterotrophs 22%, showing that autotrophy is a crucial functional strategy more so in the youngest eddy than in the others.
The majority of the Indian Ocean species found were dinoflagellates, and E3 had more species mainly collected in its feature than the others (Table 3). Species observed exclusively in the three eddies can be indicators of these features in the Atlantic Ocean. The typical Indian Ocean species found uniquely inside the eddies were: diatom: Asteromphalus sp.; silicoflagellate: Dictyocha fibula; dinoflagellates Gymnodinium sp.; Heterocapsa sp.; Oxytoxum scolopax; Phalacroma rotundatum; Podolampas palmipes; Prorocentrum cordatum; Protoperidinium steinii; Pyrocystis lunula; Scrippsiella sp.; Scrippsiella spinifera; Tripos teres; Gyrodinium spirale.
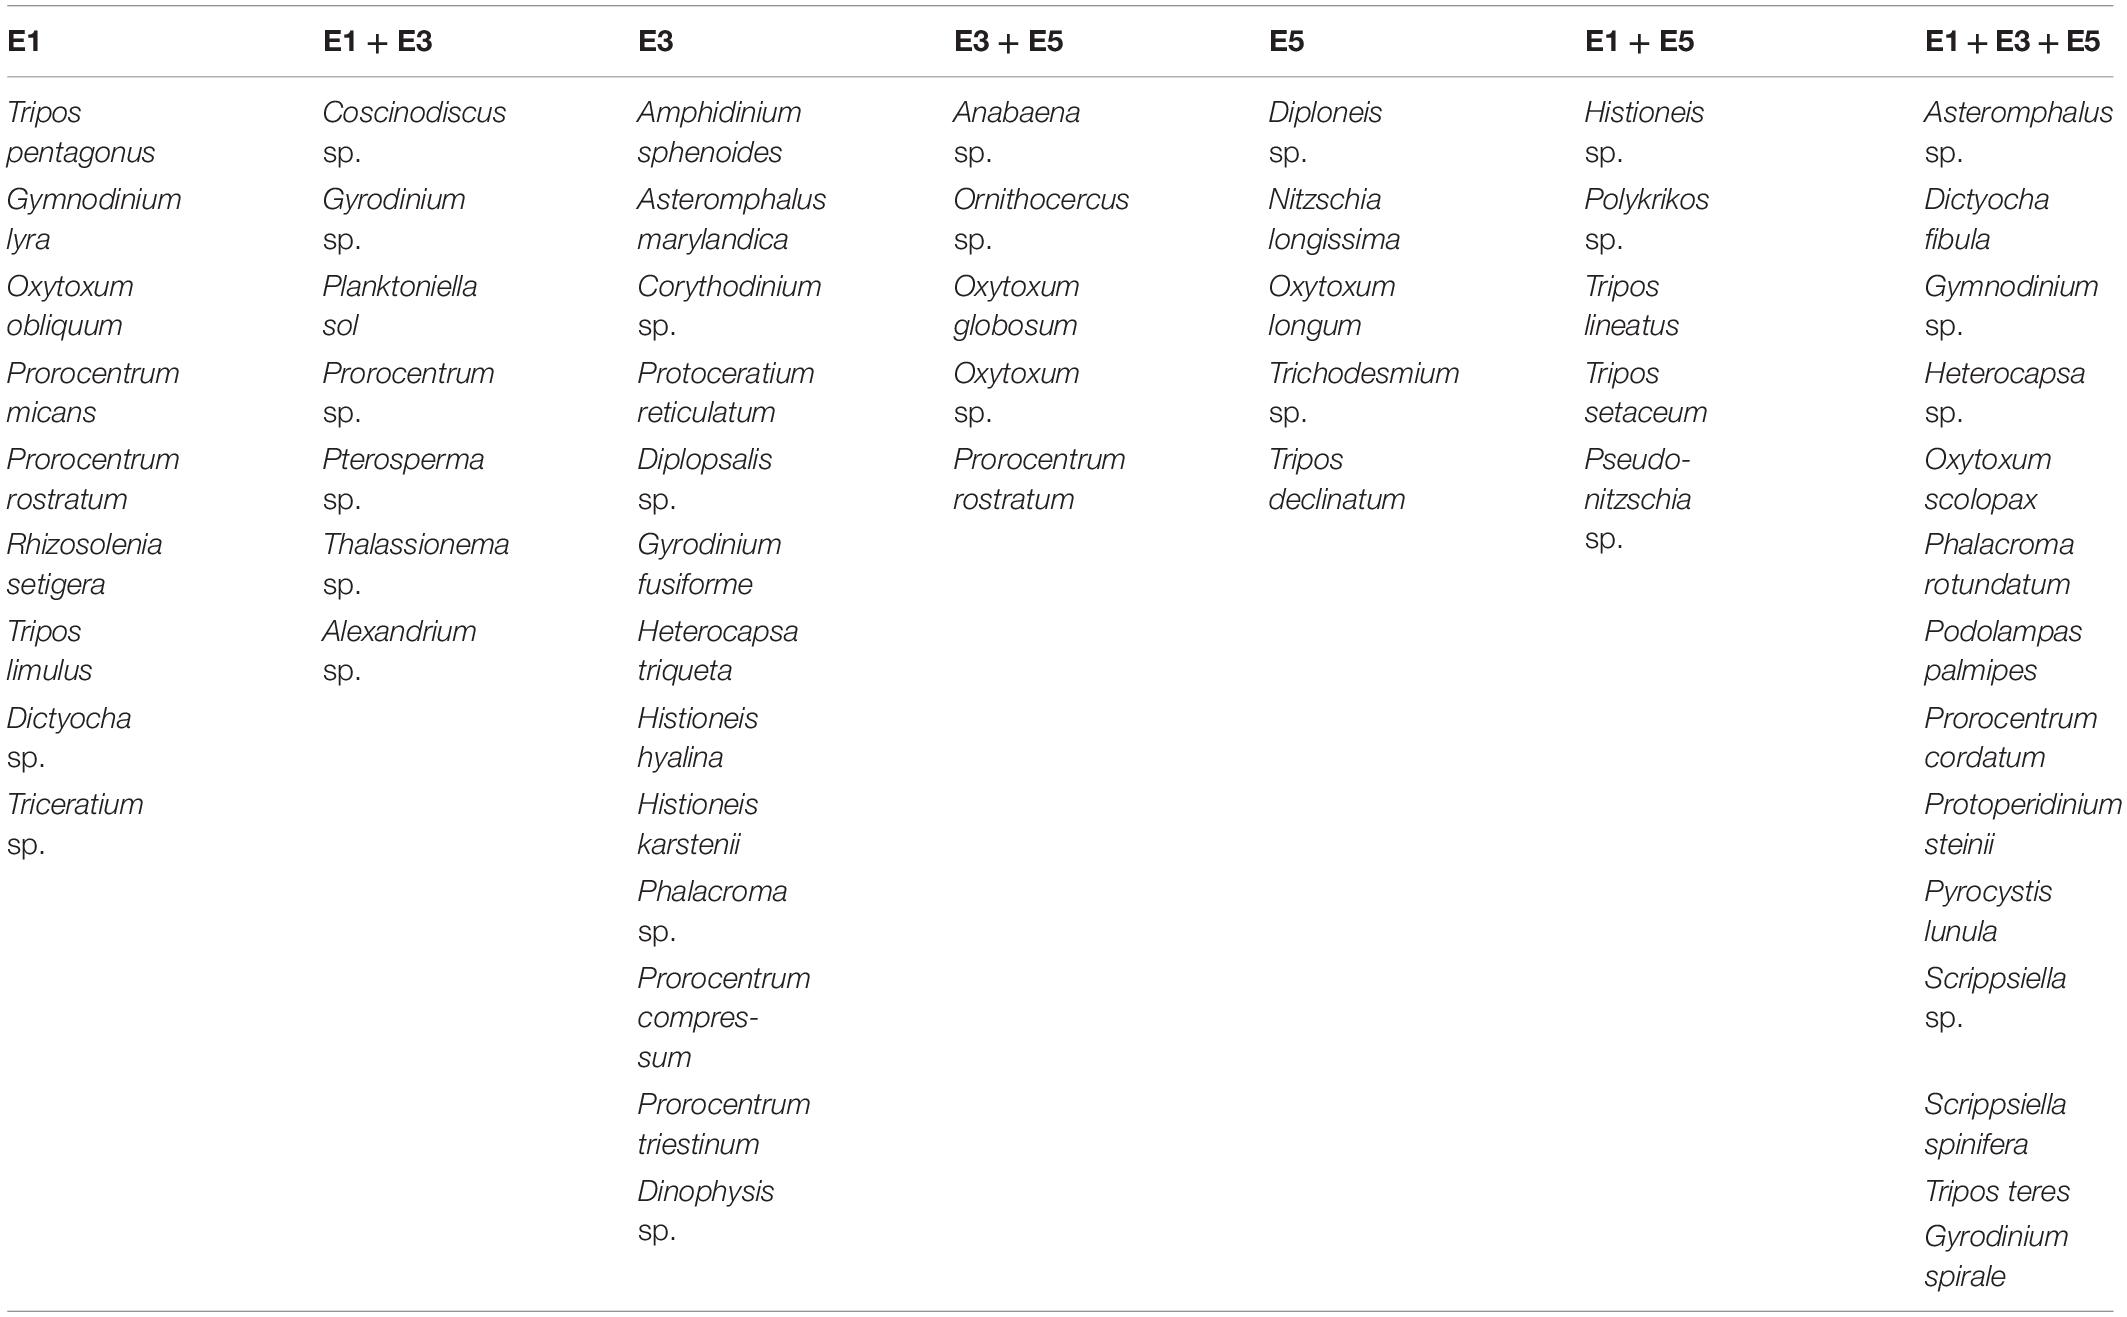
Table 3. Species found specifically in the eddies E1, E3 and E5; or E1 + E3; E3 + E5; E1 + E5; E1 + E3 + E5.
Functional Diversity
All functional diversity (FD) indices for the microplankton community were higher in E1, mostly in the DCM, showing that the diversity of community traits in this eddy was higher than in E3 and E5. Nevertheless, the FD indices did not differ significantly among the eddies (p > 0.05, ANOSIM), so functional diversity was nearly equivalent. Pearson correlation tests between functional indices and classical beta diversity indices showed significant correlations (p < 0.05) between FRic and Margalef richness (R2 = 0.79) and between FRic and Shannon diversity (R2 = 0.54). On the other hand, functional evenness and species evenness were not significantly correlated (R2 = 0.13, p > 0.05) (Table 4).
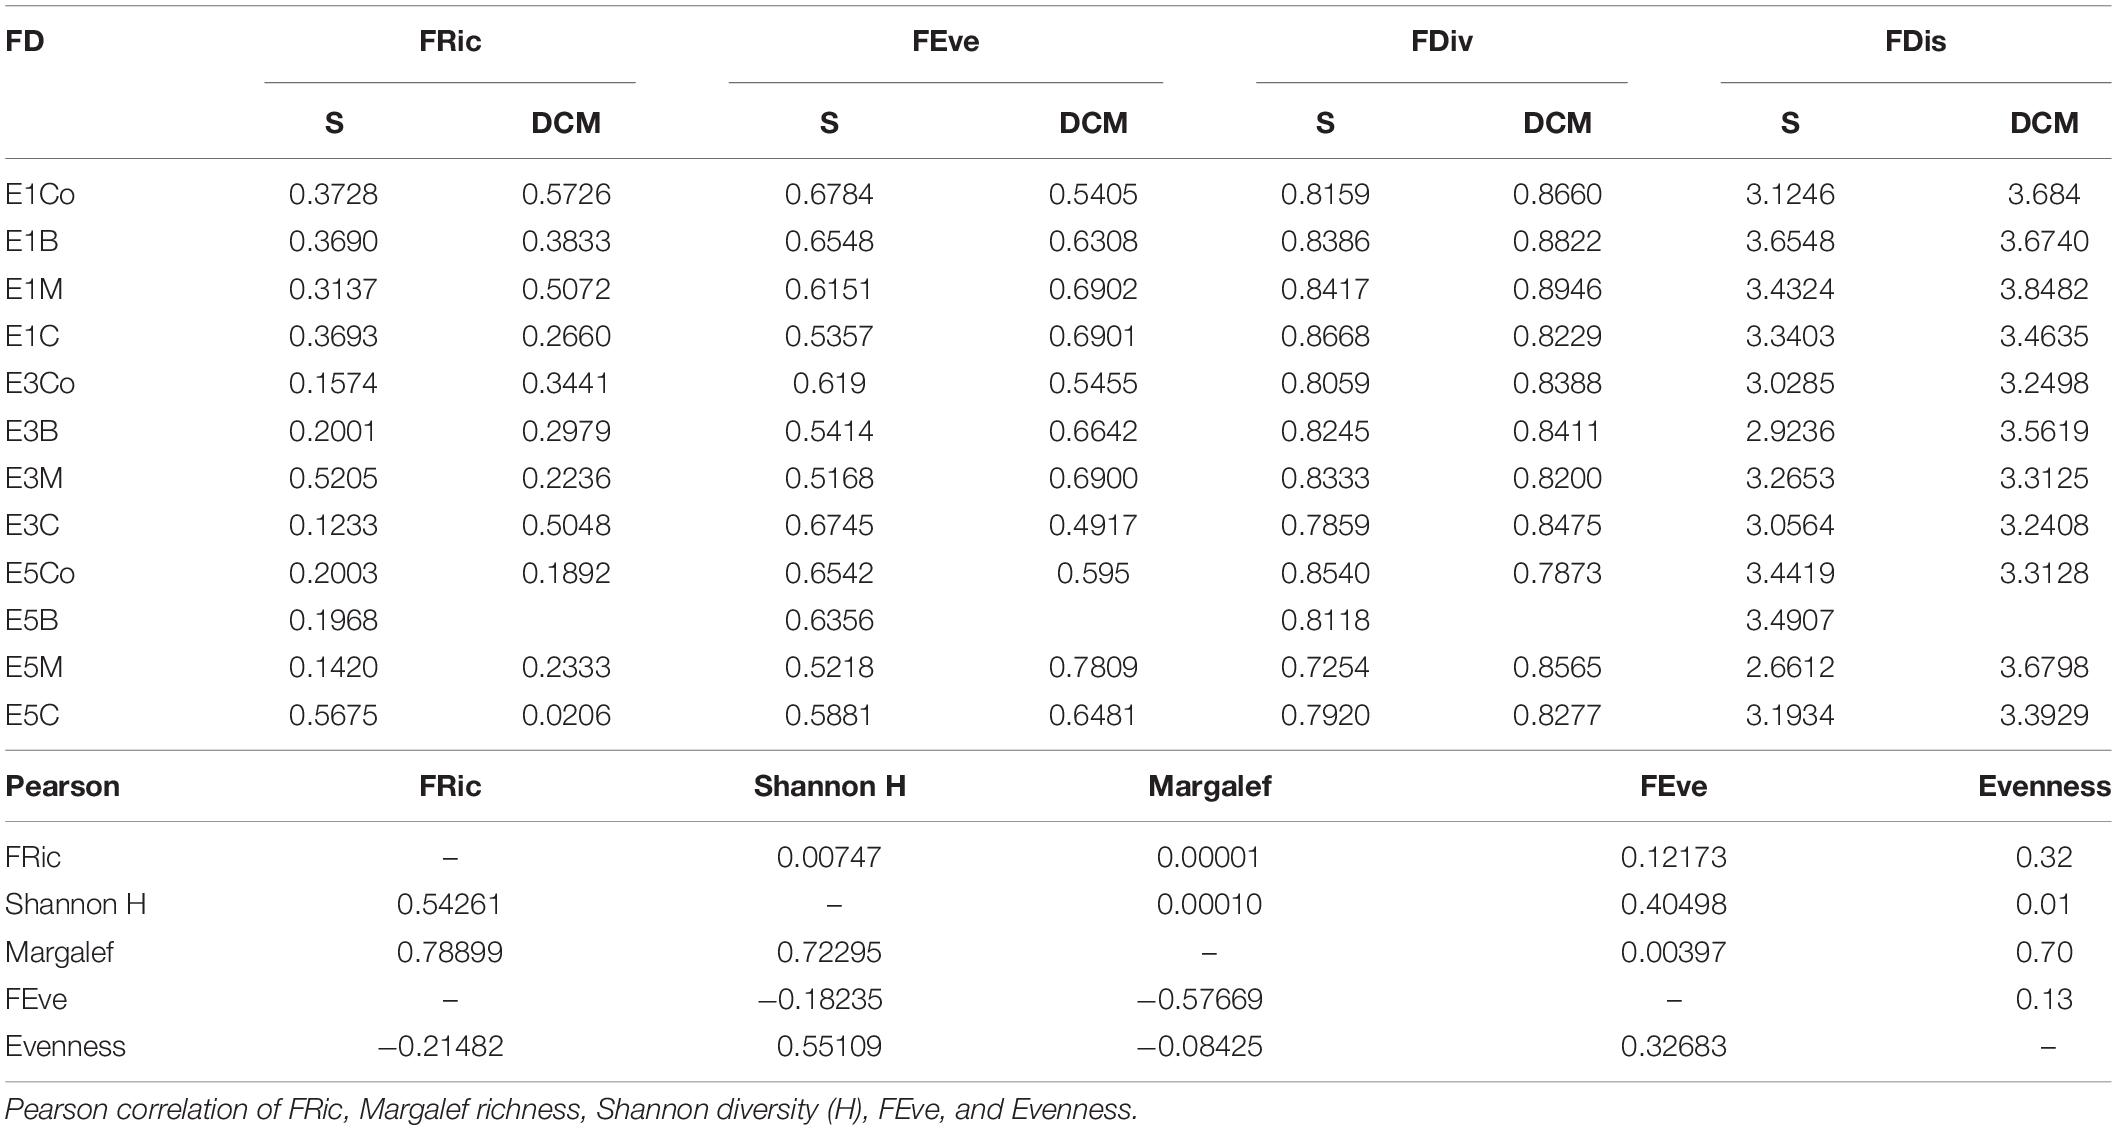
Table 4. Functional traits indices: FRic, FEve, FDiv, and FDis to microphytoplankton eddies E1, E3, and E5 (Co, B, M, and C in S, surface and DCM, deep chlorophyll maximum).
Dendrogram and multidimensional scaling (NMDS) representations (Figures 4, 5, respectively) clustered micro plankton by trophic strategy. Three main groups were identified in the dendrogram (Figure 4) based on nutrition mode—constitutive mixotrophy (innate capacity for photosynthesis and phagotrophy), strict heterotrophy, and strict autotrophy—but other characteristics separated some small groups due to different traits. There were more mixotrophic than heterotrophic and autotrophic species. The NMDS analysis separated the convex hulls into two sides: the left represented by autotrophs (diatoms, cyanobacteria, and phytoflagellates), and the right represented by mixotrophs and heterotrophs (dinoflagellates). The group of autotrophs in the NMDS is larger than the others because it is more diverse in traits: raphe (the structure that allows diatom cells to move over surfaces, composed of one or two slits, or fissures, that penetrate the valve of some diatoms); chain formation, presence of silica (differing diatoms and silicoflagellates from the other taxa), flagella, vacuoles, and size (MLD > 40). A variety of sizes and shapes were identified, mainly among dinoflagellates. However, morphological traits were also prominent in distinguishing different groups, such as cell surface per volume (sv–1) > 0.44 and MLD > 40, which helps to understand the ability to assimilate nutrients and palatability predators.
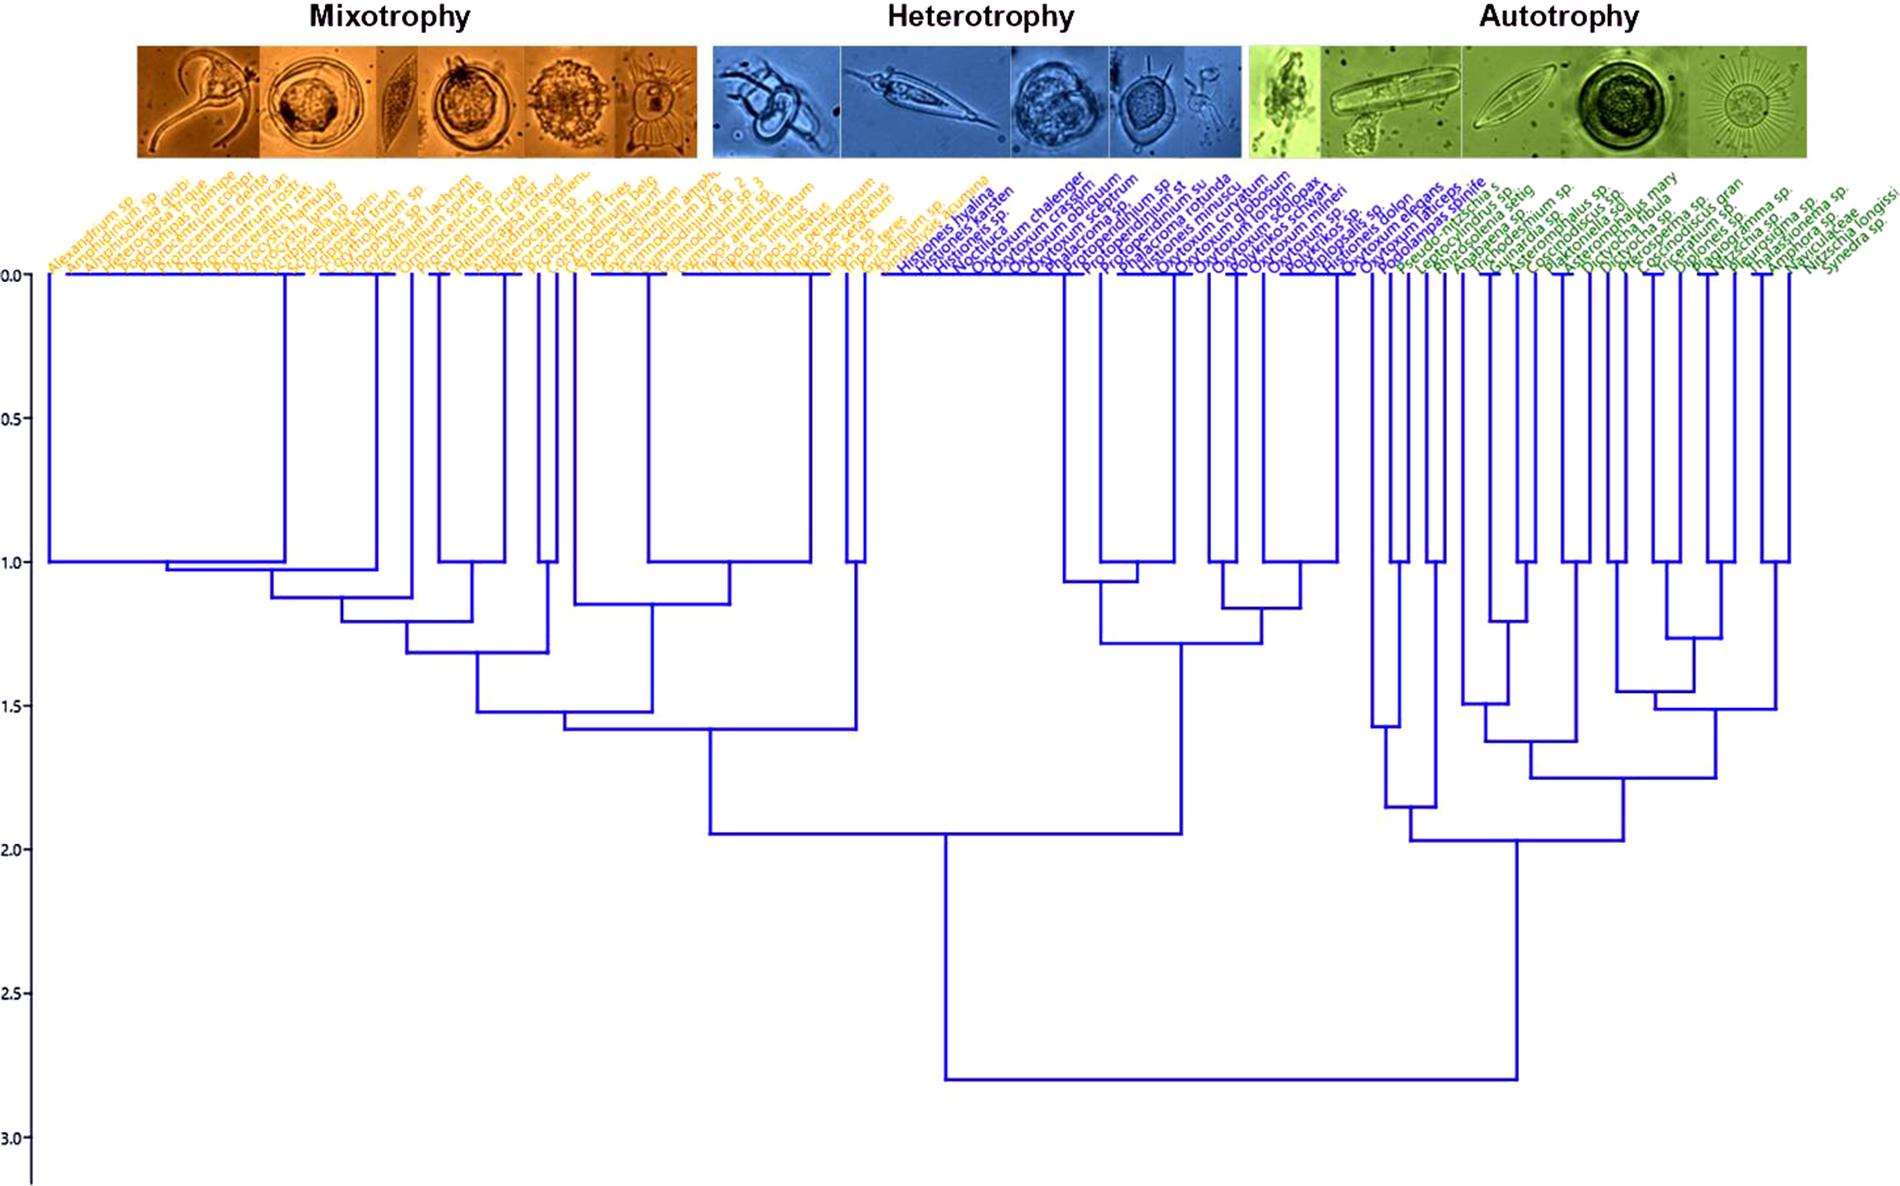
Figure 4. Dendrogram from the functional traits of microphytoplankton.
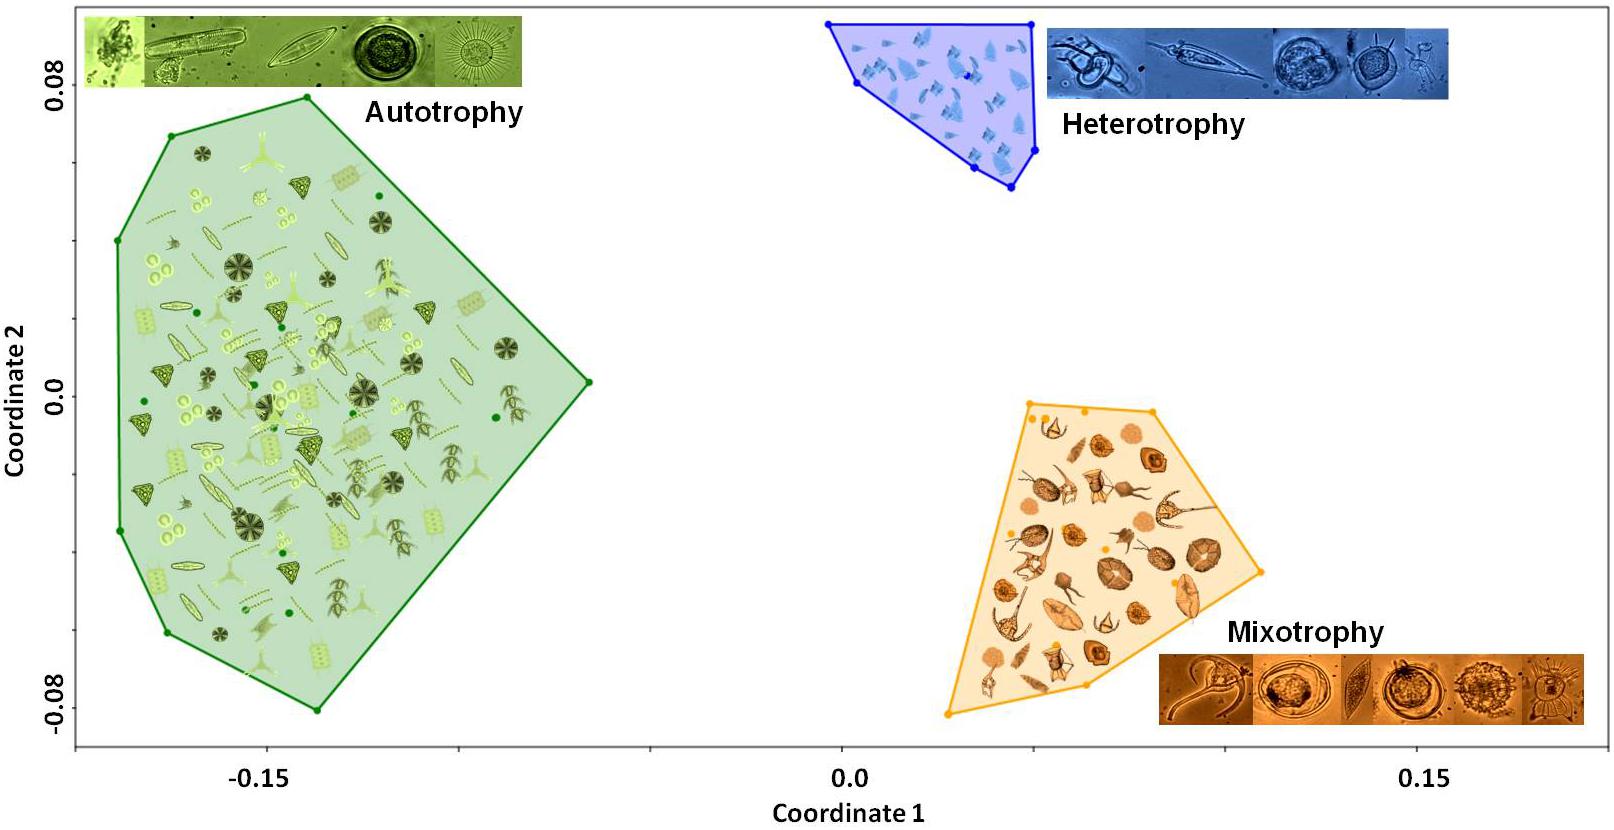
Figure 5. NMDS diagram from the functional traits of microphytoplankton in the eddies, using multidimensional indices based on Euclidean distance and non-parametric multidimensional scaling of traits. These metrics were calculated using the dbFD function of the FD package (Laliberté and Legendre, 2010) (R software, version 3.5.1; R Core Team, 2018).
Canonical Correspondence Analysis (CCA Figure 6A and Table 5—microplankton × environmental variables) explained 58.57% of total environmental variation in the first two axes. Axis 1 (32.62%), in its positive portion, presented the vector silicate and dinoflagellates: Amphisolenia globifera, Ornithocercus sp., Oxytoxum curvatum, Oxytoxum milneri, Prorocentrum compressum, Prorocentrum triestinum, Protoceratium reticulatum as well as the E3 stations in its negative portion the vectors phosphate, fluorescence and nitrogen compounds, E5 sampling stations were also plotted in this with diatom: Synedra sp. and the dinoflagellates: Heterocapsa rotundata, Histioneis dolon, Oxytoxum crassum, Oxytoxum longum, Oxytoxum sceptrum. In axis 1, it is possible to separate eddies E1 and E3 in the positive portion and E5 in the negative. Axis 2 explained 25.95% with inorganic nitrogen and dissolved oxygen (DO) vectors in its positive portion, with diatoms: Amphora sp., Asteromphalus marylandica, Nitzschia sp., and the dinoflagellates: Dinophysis acuminata, Histioneis hyalina, Noctiluca, Oxytoxum laticeps, Pyrocystis hamulus, Tripos declinatum, and temperature and salinity in its negative portion, as well as diatoms: Diploneis sp., Plagiogramma sp., Rhizosolenia setigera, Thalassionema sp., Triceratium sp., dinoflagellates: Oxytoxum obliquum, Podolampas spinifera, Polykrikos schwartzii, Protoperidinium sp., Scrippsiella spinifera, Tripos limulus, and the silicoflagellate Dictyocha fibula. In axis 2, eddy E3 was separated in the positive portion and E1 in the negative. There was no correlation between the depths and stations with the axes (Figure 6A).
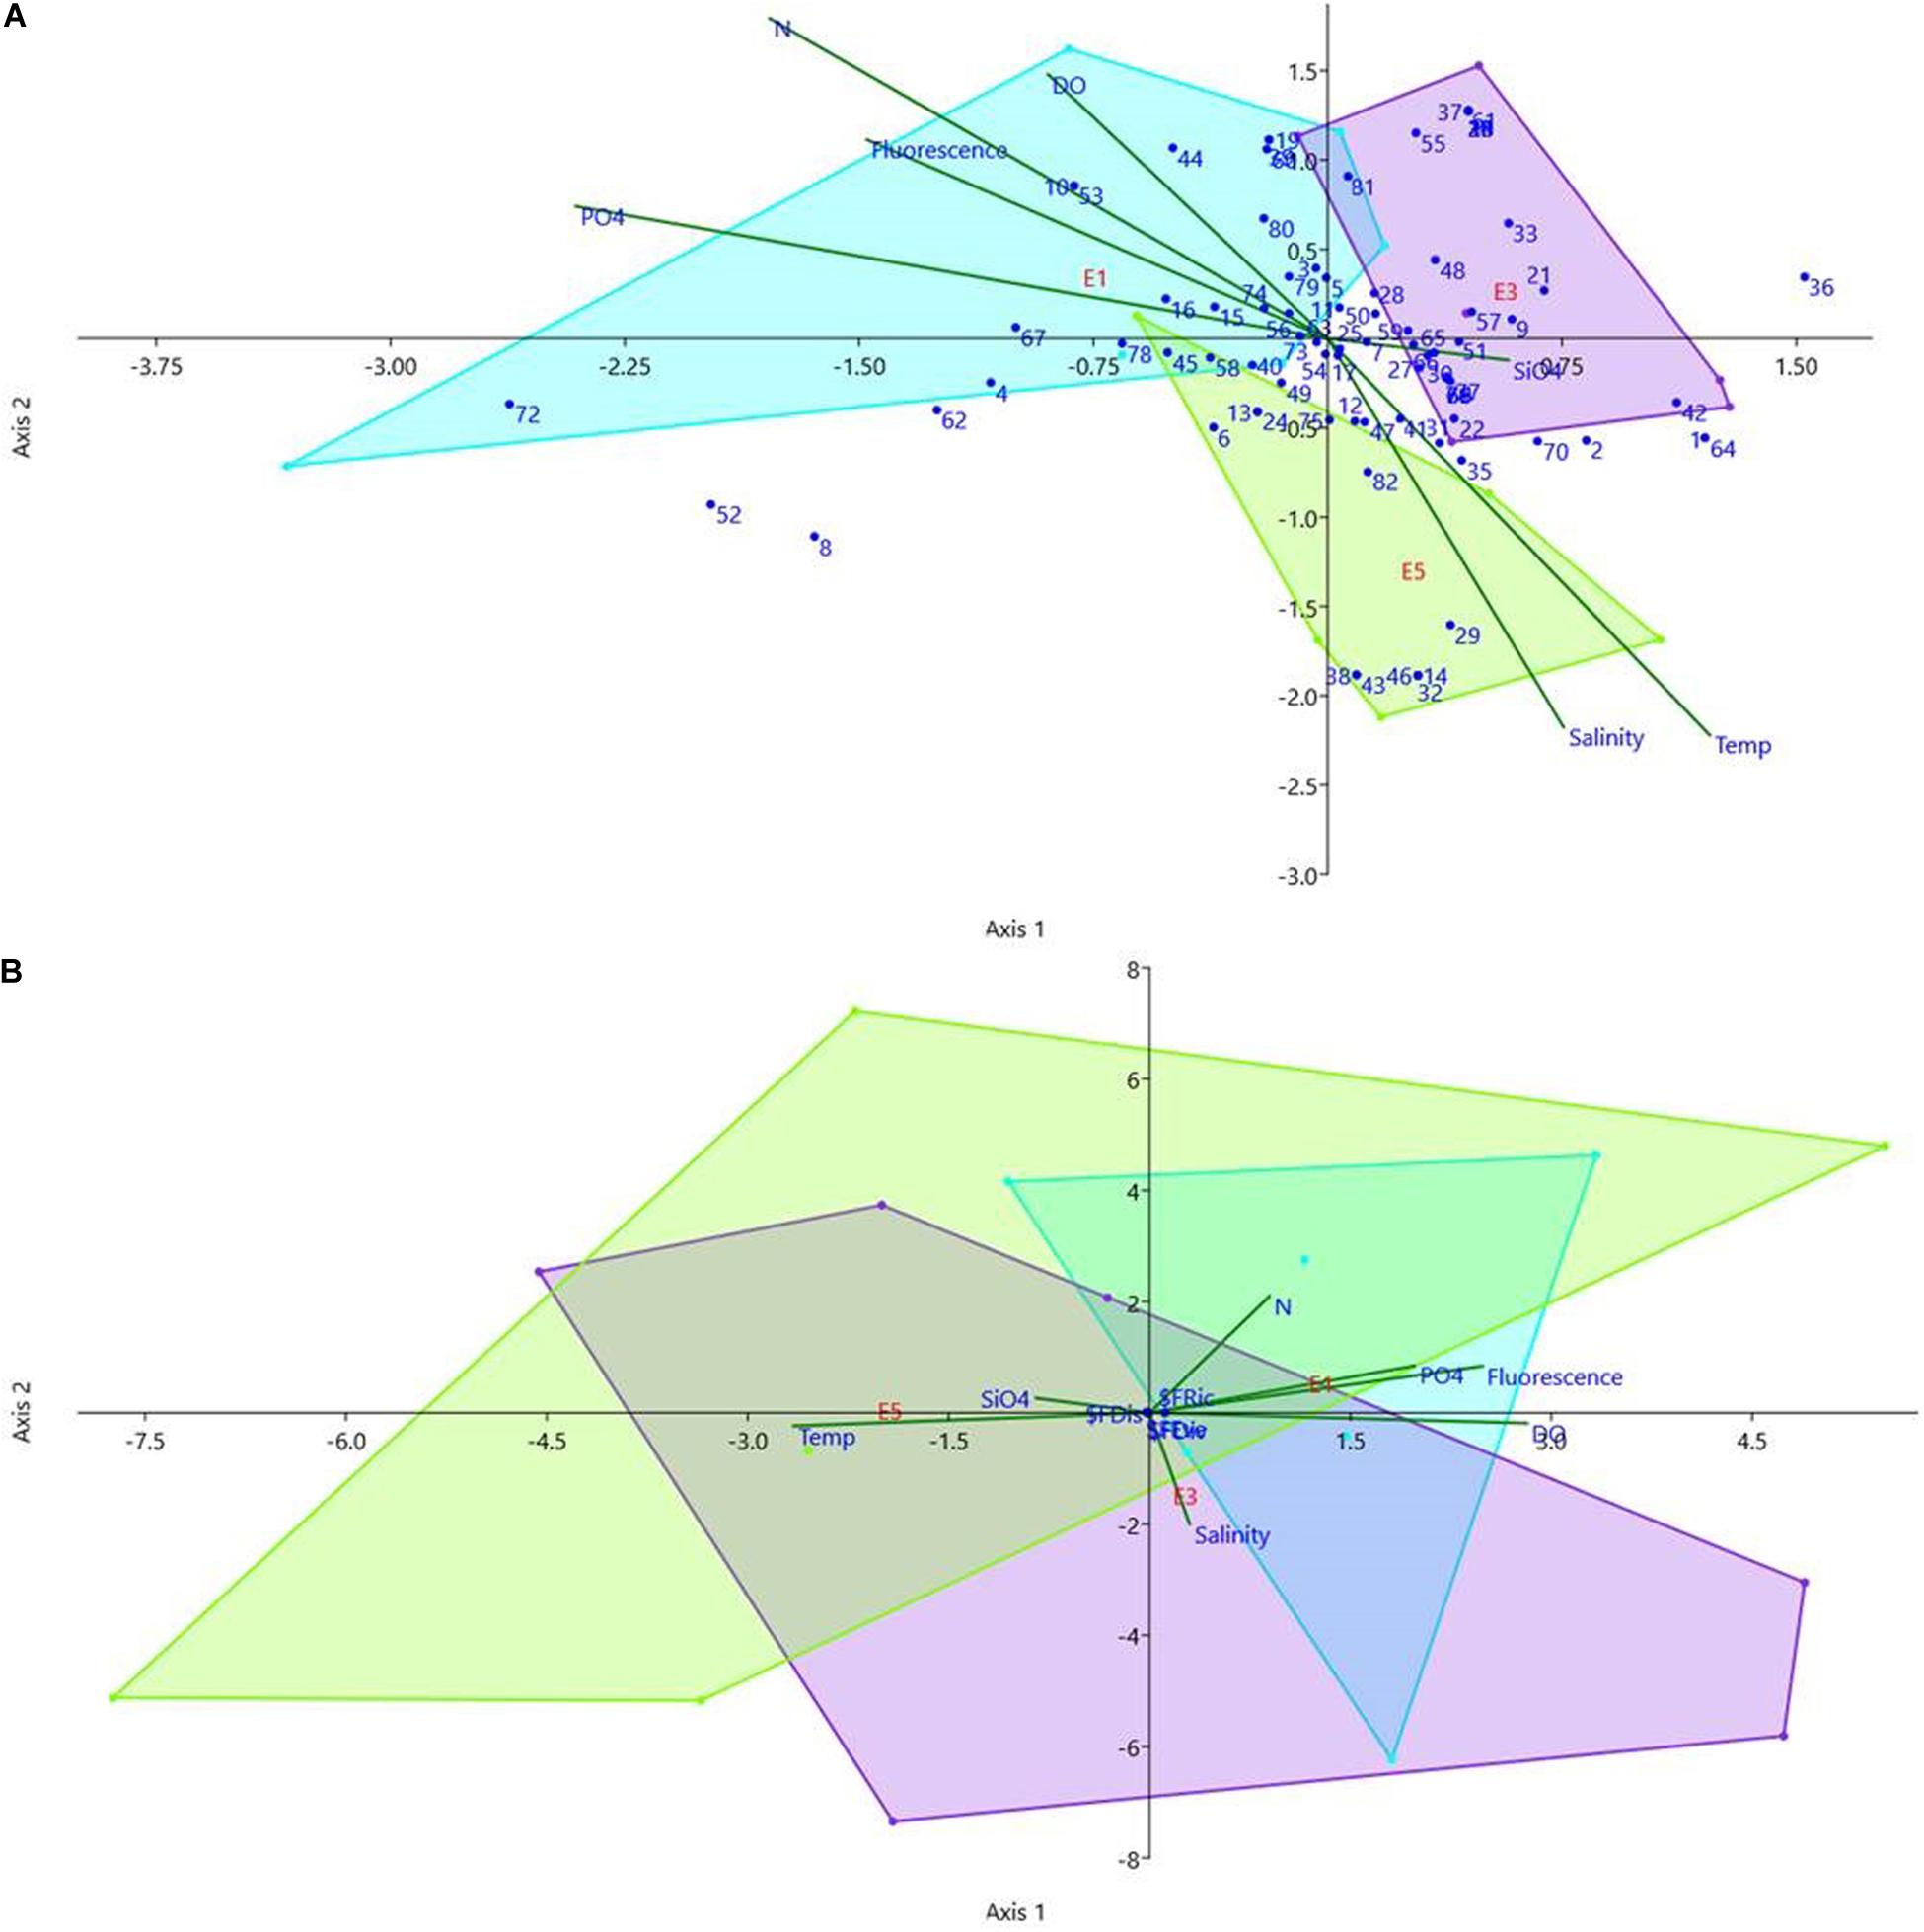
Figure 6. Canonical correspondence analysis of microphytoplankton comparing the density (cells.L–1) (A) the species were numbered according to Table 5 and functional traits indices (B) with the environmental analysis [Salinity, Temp (°C)—temperature, Flu—fluorescence, N—nitrogen compounds (NO2– + NO3–), PO4—phosphate, SiO4—silicate and DO—dissolved oxygen] in all the eddies stations. Legend- blue: E1; purple: E3 and green: E5, the color convex hull was divided by the eddy data, each eddy received a color to represent in the CCA.
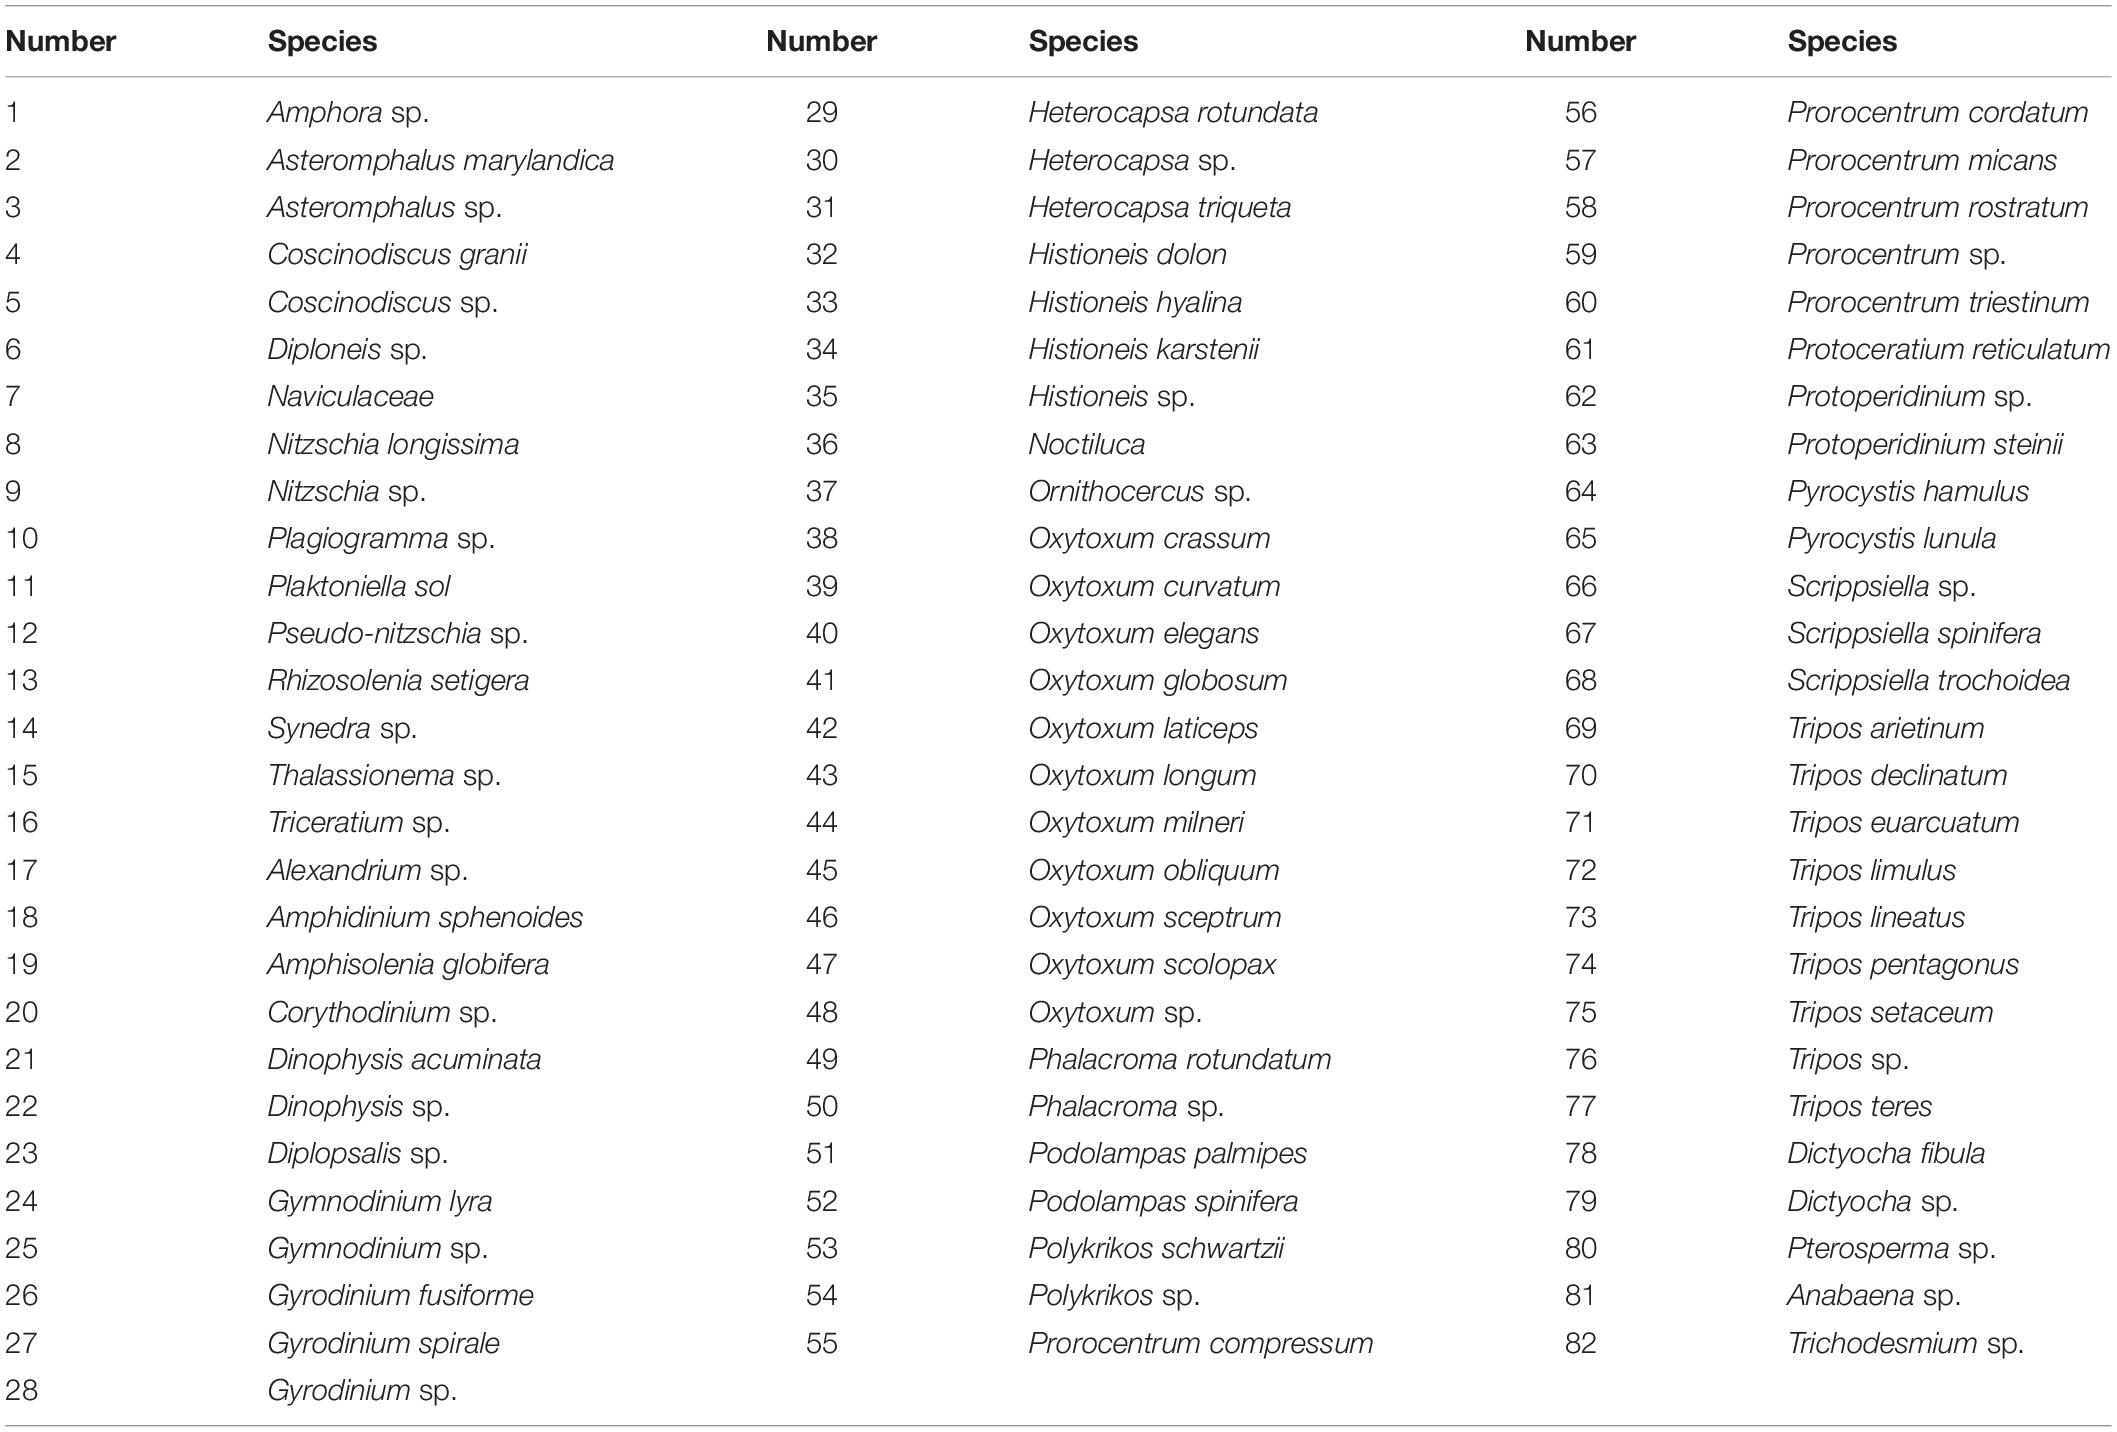
Table 5. Species found in the 3 eddies used in the CCA in comparison with the environmental variables (Figure 6A).
Comparisons between environmental variables and cell density revealed differences among the eddies. In E1, cell density was positively correlated with nutrients (phosphate, nitrite, and nitrate) and fluorescence, while in E5, cell density was positively correlated with silicate, negatively correlated with phosphate, nitrite, and nitrate, and positively correlated with temperature and salinity. Eddy 3 was in the middle of the factorial plane, which was expected because it is of intermediate age, and its characteristics were changing while it was drifting in the ocean (Figure 6A).
On the other hand, the canonical correspondence analysis (CCA) of functional traits indices (99.21% total environmental variation; Figure 6B) showed that the eddies’ functional traits were more similar, as the three convex hulls overlap, due to similarity in functional traits among eddies. Axis 1 explained 96.94% of environmental variation with salinity and inorganic nitrogen, while Axis 2 explained 2.27% with temperature, dissolved oxygen, phosphate, fluorescence, and silicate.
The one-way pairwise ANOSIM test revealed that species composition and density differed among the three different eddies, with the eddies differing significantly: E1 and E5 (p = 0.0073); E3 and E5 (p = 0.0189); and E1 and E3 (p = 0.0416). However, when considering variation in functional traits among eddies, E3 and E5 did not differ significantly (p = 0.1295), while E1 and E3 (p = 0.0012) and E1 and E5 (p = 0.0002) did differ significantly. The ANOVA Mann-Whitney pairwise test among stations for microplankton species density revealed that E1 DCM control differed significantly from E1, E3, and E5 and the control of E3. The control of the E1 surface did not differ significantly from the eddies’ interior, both surface and DCM. The control of E3 DCM differed slightly from the stations inside E3. However, the midway surface and DCM center differed from all other stations in E1, E3, and E5, notably the center of the eddies. The oldest eddy, E5 in the DCM, differed from all other E1 and E3; however, it did not differ from the control itself, and there were no differences between the border, midway, and center of the eddy itself. However, comparing the functional indices, they do not differ from the control itself, and there are no differences between the border, midway, and center of the eddies.
Discussion
In the first effort to evaluate the microplankton functional diversity within Agulhas rings of different ages, this study sampled during the FORSA cruise in the South Atlantic Ocean. Previous studies have investigated plankton diversity, ecology, and dynamics in oligotrophic waters of the South Atlantic subtropical gyre (Lee and Williams, 2000; Oschlies, 2002; Lévy, 2003); and Agulhas rings (Villar et al., 2015; Carvalho et al., 2019; Orselli et al., 2019).
A decay of the Agulhas rings toward the west was evident from SLA (Carvalho et al., 2019; Orselli et al., 2019). Each eddy proved to be different, with different physical and chemical characteristics and different species’ presence. The youngest eddy, E1, was the most discrepant, having the highest vorticity, more nutrients, and a greater density of organisms, and was the only eddy with STMW14. Orselli et al. (2019) represented the formation of the eddies of the present study in a video, in which it is possible to observe the start of the formation of E1 with a high SLA. Carvalho et al. (2019) suggested that E1, located in the South Atlantic Ocean’s eastern basin, represented a younger and stronger structure and a more diverse phytoplankton community (HPLC pigments analysis) than E3 and E5.
Compared to E1, the older eddies E3 and E5 were more alike, with similar physical, chemical, and ecological characteristics and almost identical microplankton functional strategies, demonstrating that although their species compositions were different, the strategies used by the species were the same. Eddies E3 and E5 also had fewer differences in seawater properties and microplankton functional strategies than the surrounding waters, suggesting that the eddies lost some of their characteristics to the surrounding water with time. According to Schouten et al. (2000), Agulhas rings usually cross the Walvis Ridge at its deepest parts, and after having crossed, they have lower translational speeds, and their decay rate decreases markedly. Liu et al. (2018) proposed that alterations over time in oceanic eddies could be promoted by variation in eddy scale, amplitude, and speed due to changes in eddy properties (Liu et al., 2018).
In E1 only, there was a sub-surface signal of nitrite in the control station. According to Villar et al. (2015), after being oxidized to nitrate, the remaining nitrite might remain evident at subsurface as a positive nitrite anomaly in younger rings. Anticyclonic rings typically experience a decrease in nutrient concentration due to subsidence, but the different situations in E1 could be promoted by Ekman upwelling induced by the wind, as observed by Martin and Richards (2001). Carvalho et al. (2019) suggested that perturbations in the water column associated with the passage of E1 for Cape Basin resulted in more vigorous and more in-depth (up to 200 m) mixing of the surface layer. This may have contributed to enhancing nitrogen and phosphate and relatively higher phytoplankton biomass at the control station.
Species Transport From the Indian Ocean to the Atlantic Ocean
The present study identified Planktoniella sol, which is an indicator of the Agulhas Current (Boden et al., 1988), at the border and center stations of E1 and the control station of E3; Tripos limulus was found at midway and center stations of E1; Pseudo-nitzchia spp. was found at center stations at the maximum chlorophyll depth (DCM) in E1 and E5; Rhizosolenia setigera was found at the surface at the control and center stations of E1, as also found by Perissinotto (1992); the silicoflagellates Dictyocha spp. were found in all eddies, with higher density in E1; Thalassiosira spp. occurred mostly in E1 and E3, as also found by Boden et al. (1988). The occurrence of Indian Ocean microphytoplankton species shows that the eddies transport these organisms from the Indian Ocean to the South Atlantic Ocean.
In a study in the Indian Ocean, Schlüter et al. (2011) found samples to be dominated by pennate diatoms and dinoflagellates of unknown trophy. For these authors, autotrophic thecate dinoflagellates constituted insignificant biomass, except where species of the genera Gonyaulax, Heterocapsa, Prorocentrum, and Torodinium were observed. Froneman et al. (1998) identified the dominance of the genus Chaetoceros in their analyses between Cape Town and Prince Edwards, highlighting C. peruvianus, among others: Pseudoeunotia doliolus, Rhizosolenia stolterfothii, Cylindrotheca closterium, Nitzschia spp., Thalassiosira spp., and Thalassiothrix spp. The authors did not identify seasonal trends in species composition or biogeographic zoning. Froneman et al. (1995) concluded that diatom distribution in the Agulhas Current is associated with the availability of silica; and interferes with the distribution of zooplankton. Besides, the authors reiterated silicate dependence and the correlations of phosphate and temperature with the abundance of microphytoplankton, whose main contribution in the Agulhas Current refers to Chaetoceros spp. and Thalassiosira spp.
Villar et al. (2015) identified some plankton groups specific to Young Agulhas rings through microscopic analyses, such as Pseudo-nitzschia spp. Another potentially circumstantial plankton characteristic of the young Agulhas rings included the diatom Corethron pennatum and the dinoflagellate Tripos limulus. According to Lasbleiz et al. (2016), the genera Chaetoceros and Thalassiosira spp. were the most abundant in the Indian Ocean in the vicinity of Agulhas Current.
Most species identified through microscopy inside the present study’s eddies were dinoflagellates of different sizes, shapes, and characteristics (Table 3). On the other hand, Carvalho et al. (2019) used CHEMTAX in the same samples as this study and did not find high concentrations of peridinin, a biomarker dinoflagellates, while fucoxanthin and 19-hexanoyloxyfucoxanthin, also associated with this group, were more abundant. The authors suggested the low concentration of peridinin, a proxy to dinoflagellates’ presence, and the low concentrations of nitrate in the samples may have interfered with the density of dinoflagellates. Barlow et al. (2017) also found through pigment analysis (CHEMTAX) that mainly dinoflagellates were the dominant phytoplankton group in the nutrient-rich upwelling-influenced surface waters in a cyclonic eddy in the Indian Ocean sector of the Agulhas Current. Finally, Higgins et al. (2011) state that environmental conditions such as nitrogen availability affect the chlorophyll and other pigment ratios, leading to imprecision in estimating plankton composition when using chemotaxonomic methods.
Functional Traits
There are no significant variations concerning the indices in terms of functionality, but there are differences in the species composition, E1 had the most significant number of autotrophs, and its center was distinct from the other centers. This was also observed by Villar et al. (2015), who highlighted blooms at the center of the newest eddies. The most significant differences among stations were found in the DCM. It was also possible to observe differences inside and outside the eddies in terms of species composition but not in functionality. Diatoms, dinoflagellates, and cyanobacteria were equivalent in density. All eddies had a predominance of cyanobacteria outside of control points, which differed from central points where diatoms, dinoflagellates, and cyanobacteria were equivalent in density. The increase in diatoms in the E1 center and midway seems to be linked to the higher concentrations of nitrogenous compounds in the DCM. E5 had a lower abundance of microplankton because it is the oldest eddy and had lost some characteristics to the surrounding oligotrophic ocean by physical processes, and thus the upwelled nutrients due to the entrainment in the center of the eddy had already been consumed. The phytoplankton community structure’s differences become less clear (E3 and E5) some months after the eddies formation in the retroflection region (Carvalho et al., 2019).
The most important ecological trait for microplankton was its nutrition mode—mixotrophy, heterotrophy, and autotrophy—which helps separate large groups of diatoms (as well as raphe and silica) dinoflagellates. Traits such as theca, chain formation, flagellum, vacuoles, and resistance cysts also helped separate functional groups. Mixotrophic dinoflagellates with motility have advantages under conditions of low nutrient concentrations such as an oligotrophic ocean (Litchman and Klausmeier, 2008; Bellinger and Sigee, 2011; Roselli et al., 2017; Leles et al., 2018; Lima et al., 2019).
The diversity of sizes and shapes suggests that size is selected by several selective pressures (Litchman et al., 2009). Although larger cells are less efficient than smaller cells in acquiring nutrients, several traits can mitigate transport and uptake (Chisholm, 1992). When cells swim or sink, the diffusive boundary layer is distorted by the uniform flow around the cell, creating a thinner part in the front. In stagnant water, elongated cells, like dinoflagellates, can absorb more nutrients than spherical cells (cyanobacteria) due to their higher surface-volume ratio. In shear flows, elongated cells rotate intermittently (Jeffery orbits), improving nutrient transport (Pahlow et al., 1997).
Among autotrophs, cyanobacteria and diatoms have the capacity for coloniality, thus modifying their size, altering their interaction with the environment, reducing palatability to grazers, reducing sedimentation, and permitting migration to depths with irradiance and nutrients (Brookes and Ganf, 2001; Brasil and Huszar, 2011; Barton et al., 2013). Bacterioplankton is an extremely competitive community of heavily stratified oligotrophic gyres, rapidly sequestering nutrients in the euphotic zone. The scarcity of inorganic nutrients restricts strict photoautotroph capacity to grow among larger and less competitive phytoplankton (Ward, 2019).
In the older eddy (E5), the nutrient concentrations (nitrite, nitrate and phosphate) and functional diversity indices (FRic, Fdiv, and FDis) were lower than in the youngest eddy (E1). This shrinking of the functional space as the eddies over time is more consistent with neutrality than with niche specialization as a co-existence mechanism. Considering that there is an increasing stress gradient from E1 to E5, translated in an increase of oligotrophy (see Table 2, values of nitrogen compounds and phosphate) and a decrease in vorticity (Guerra et al., 2018) correlations between species richness, abundance, and functional indices, as FRic (volume of functional niche—Van de Perre et al., 2020), provide a good power test for increasing niche complementarity with declining stress across a broad range of ecological contexts (according to Mason and De Bello, 2013; Schabhüttl et al., 2013). Though no significant variation on species and functional richness was observed inside the rings, Shannon diversity (H) and Margalef richness were significantly correlated to FRic, especially in E1, where the positive correlation between species richness and FRic can be interpreted as high niche complementarity (Mason and De Bello, 2013), facilitating coexistence in an environment of lower stress, such as E1 when compared to the other eddies (MacArthur, 1955; Elton(ed.), 1958; Levine and HilleRisLambers, 2009). Niche differences promote coexistence, whereas fitness differences among species lead to competitive exclusion and, consequently, to a decrease in diversity (Segura et al., 2011).
However, in eddies E3 and E5, richness, FRic, FDis, FDiv decreased concerning E1; in fact, functional traits were significantly different (p < 0.05 ANOSIM) when comparing E1–E3 and E5, but similar between E3 and E5, as also denoted by CCA analyses showing differences among species in the three eddies, and similarities among functional traits in an ultra-oligotrophic environment, translated as a high-stress environment. As represented in NMDS, microplankton trophic modes were the most important traits, mainly represented by mixotrophic dinoflagellates; higher representativeness of the strictly autotrophic plankton was observed in E1. Species composition differed among stations in the same eddy and distinct eddies, but in this stress gradient influenced by age, loss of vorticity, and ultra-oligotrophy, species functional fitness was similar adapted to this environment.
Which mechanism drives species diversity is a key question in community ecology (Segura et al., 2011). Explanations of the plankton paradox and why so many species coexist (Hutchinson, 1961) highlight different approaches: (i) multiple niches as a stabilizing process (Haegeman and Loreau, 2011), (ii) neutrality as an equalizing process (Scheffer and van Nes, 2006; Vergnon et al., 2012), and (iii) intraspecific variations (Menden-Deuer and Rowlett, 2014), this last mechanism is specific to population models, not applied to our data. A combination of stabilizing and equalizing processes may better explain coexisting species patterns (Vergnon et al., 2009, 2012).
Species with different functional traits complement each other by increasing the efficiency of the processes (niche complementarity), while species with similar functional traits replace each other (Blüthgen and Klein, 2011), as observed in the increasing stress gradient from E1 to E5. Nutritional stress was an equalizing factor of the functional traits in E3 and E5, favoring mixotrophic organisms in these conditions in Figure 7.
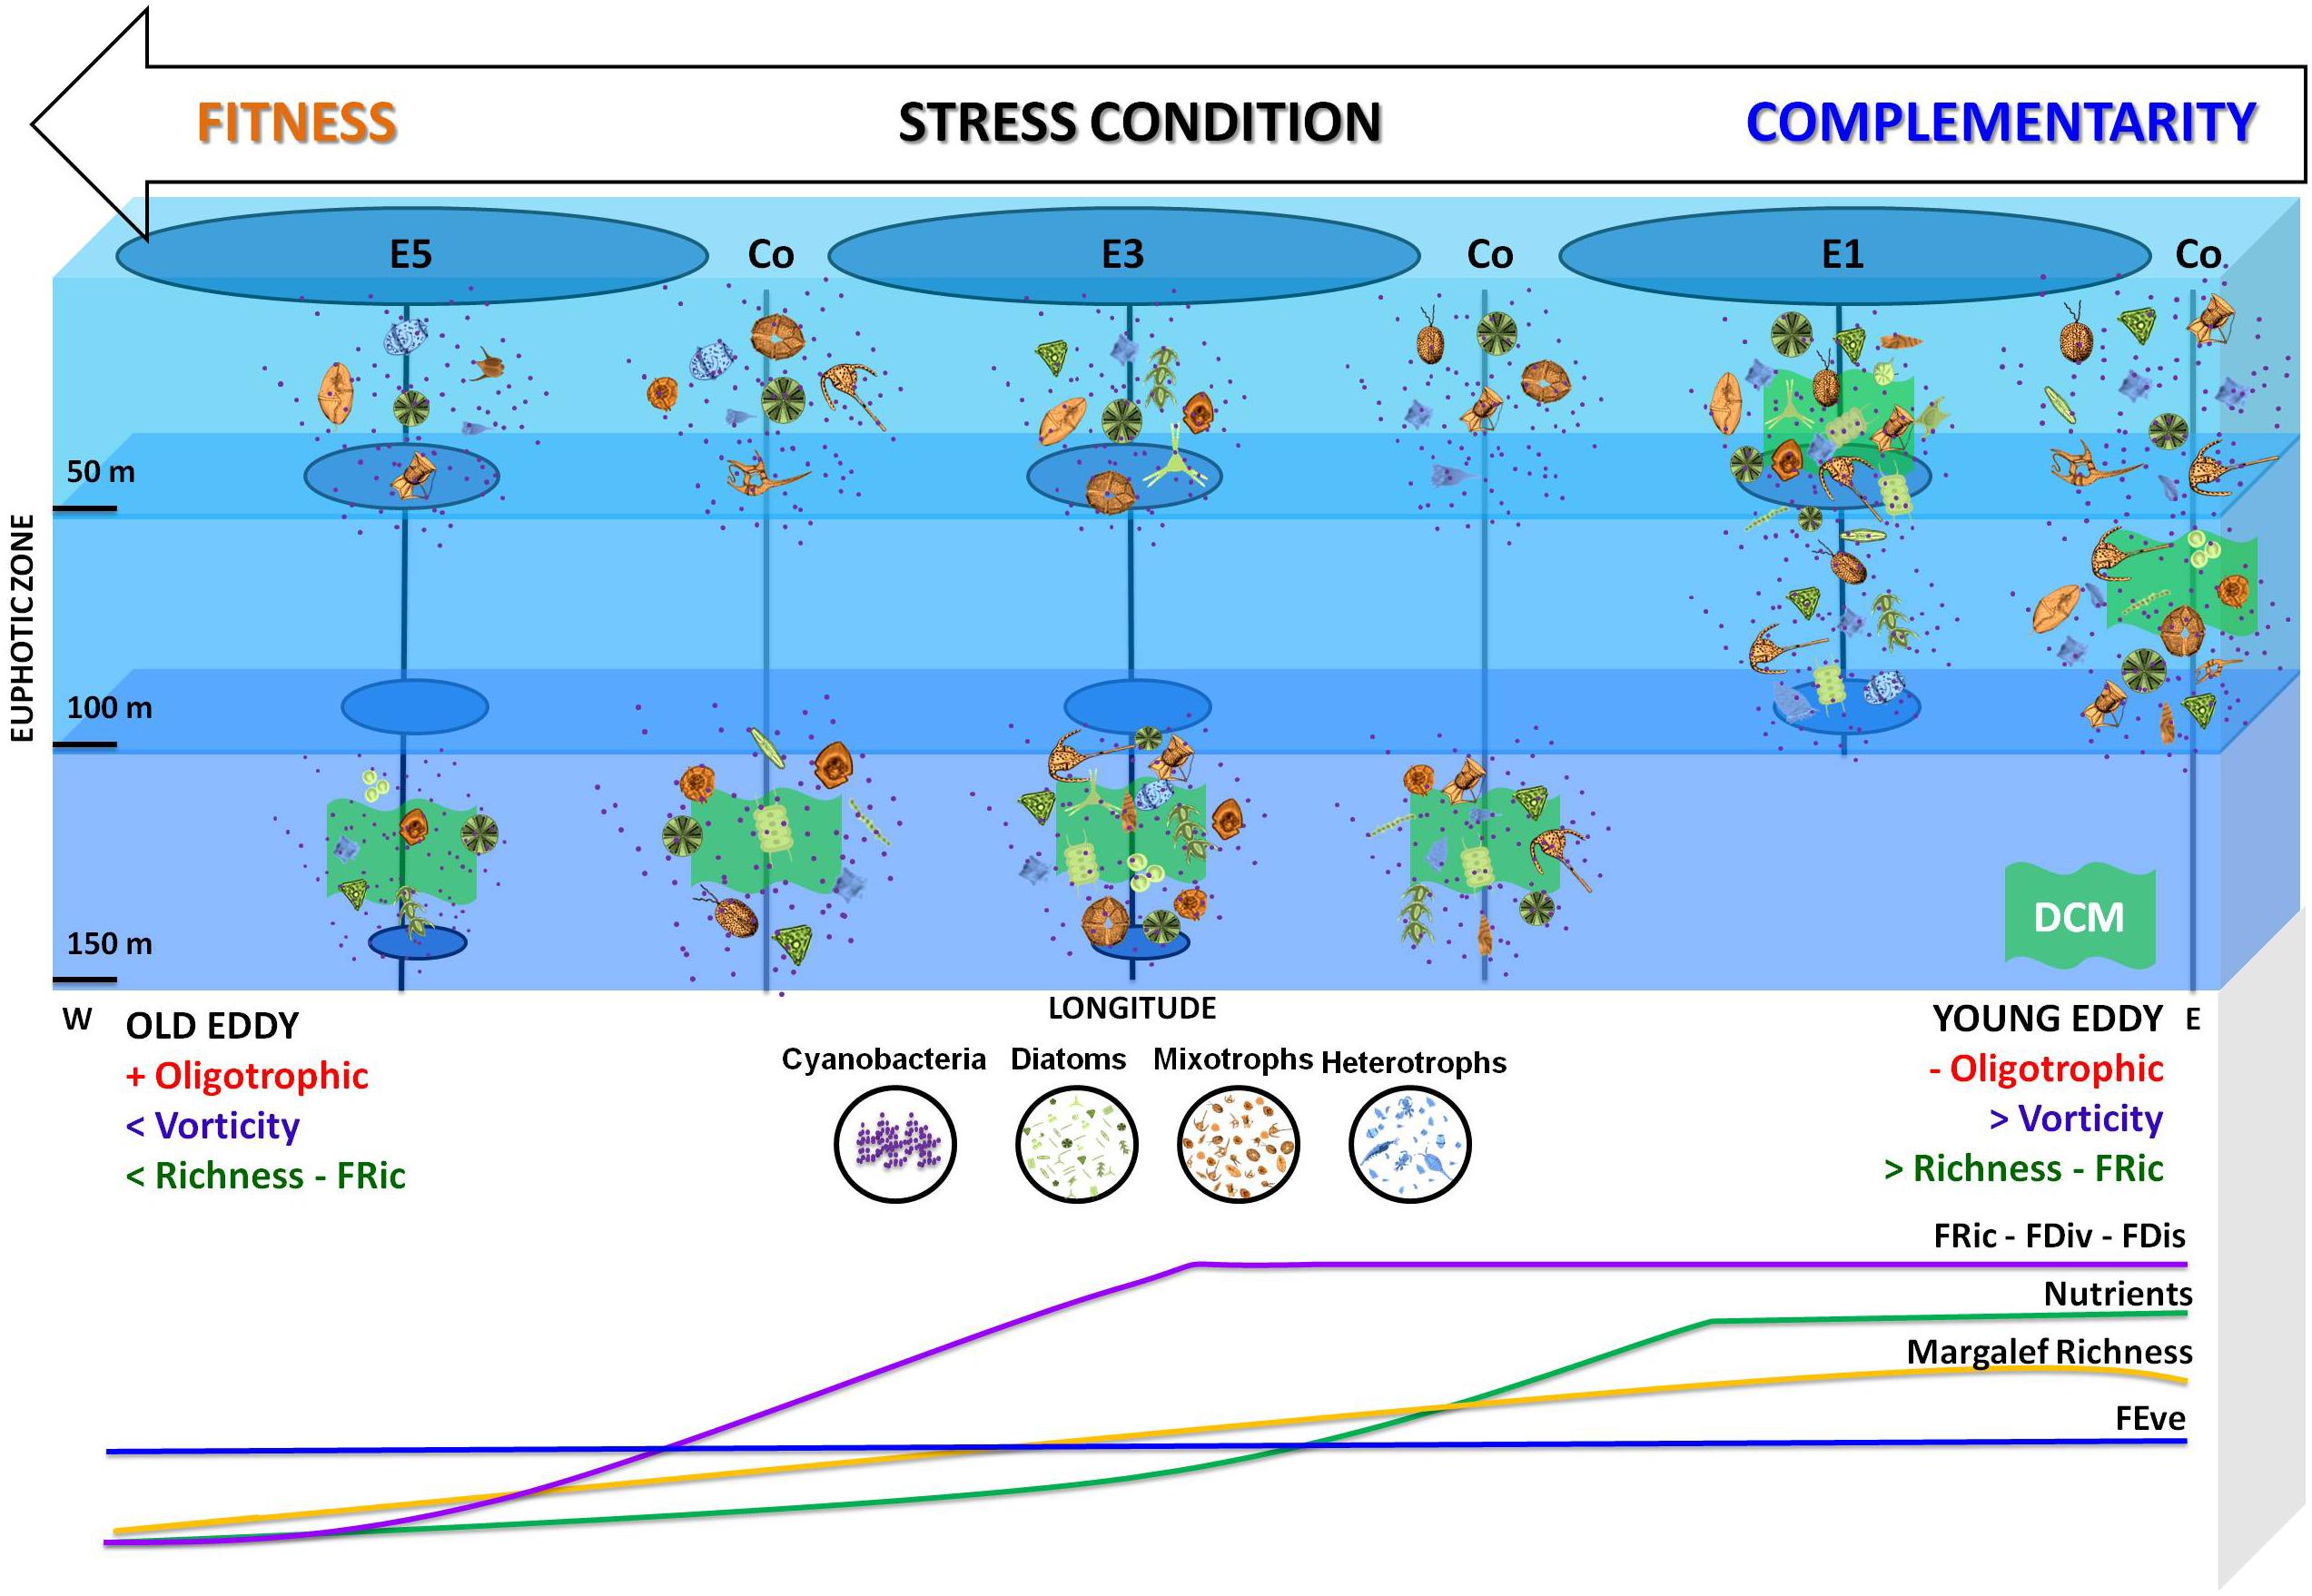
Figure 7. The conceptual distribution model of microplankton richness, trophic mode, and functional diversity indices (FRic, FEve, FDis, and Fdiv) in Agulhas eddies of different ages.
Neutrality is the idea that interactions among species can lead a system in a direction in which some species become so similar that this similarity will be the primary cause of their coexistence (Scheffer and van Nes, 2006). Among the traits utilized in the present study, potential mixotrophy makes the distribution model (Figure 7) different because we introduce a new trophy, and it can be interpreted as an evolutionary trait to live in an oligotrophic environment.
According to Vergnon et al. (2012), each group of species is segregated by the other via classical resource competition, while species within a group coexist mainly due to their similarity, species within a cluster coexist essentially in the same niche, filling the gap between the niche and neutral theory.
However, when the differences occur in only a single functional characteristic, such as trophic strategy, then the competitive effect must depend on environmental factors (Barabás et al., 2013; Gracco-Roza et al., 2020), such as the stress gradient observed from E1 to E5. Differences among species have much greater ecological importance than neutral theory might suggest; the neutral model alone is insufficient to determine the mechanisms by which dominance change is biotically accommodated in communities (Caswell, 1976). Furthermore, competitive interactions might succeed in squeezing out a set of species or stable conditions that might allow a community’s invasion by new species of surrounding niche space. Marine phytoplankton typically gives evidence of non-neutrality, but this does not imply that ecological drift is unimportant with these organisms (Schabhüttl et al., 2013).
Our hypothesis is partially accepted; when comparing the eddies between control and center, or border and center, there was no significant variation neither for functional nor for species richness. However, when comparing eddies of different ages, there is a variation in species and functional richness within an environmental stress gradient. Both equalizing (neutrality concerning functional diversity) and stabilizing (niche) processes, filtered by this environmental stress gradient, denoted by ultra-oligotrophy and loss of vorticity observed in older eddies, explains the microplankton species coexistence. Oligotrophy is an equalizing factor for microplankton functional diversity. The absence of inorganic nutrients restricts strict photoautotroph capacity to grow among larger and less competitive phytoplankton in older eddies, promoting the increment of mixotrophic microplankton in the Agulhas rings environment.
Conclusion
The analyzed data revealed that the studied oceanic eddies are extremely complex mesoscale features. The physical variables can change, but previously identified species as indicators of the Indian Ocean or region of eddies are also introduced. Turbulence occurs in association with vorticity in the region of eddies and the entrainment of water in the center; it can favor an increase in nutrients and phytoplankton. However, the eddies that drift in the Atlantic Ocean carry species characteristics of the Indian Ocean and cause turbulence that favors plankton diversity. The microplankton sampled in the present study contained mainly mixotrophic dinoflagellates adapted to oligotrophic conditions since they can perform photosynthesis, consume other smaller organisms, and cyanobacteria to the smaller size and higher surface/volume ratio, are efficient at harnessing surrounding nutrients. When densities and physicochemical parameters were compared among eddies, the older ones were more similar, while when functional trait indices were compared, a vital difference gradient was revealed from older to younger eddies. In the older eddy, the nutrient concentrations and functional diversity were lower than in the youngest eddy, with neutrality explaining better the ecology distribution of microplankton than with niche specialization as a co-existence mechanism.
The ecology of the studied eddies’ microplankton is complex, but the complementary and selection distribution models helped to better understand these organisms’ dynamics in these mesoscale features. Physical processes along these mesoscale structure paths along the South Atlantic also influence the inner water column structure and nutrient availability and limitation to plankton. Although species composition differed among rings/eddies, mixotrophs were present in all conditions, which, in an oligotrophic ocean, are well-adapted for taking advantage of nutrients and, under limiting conditions, able to perform mixotrophy and consume smaller organisms. Even with the species composition being different in each eddy and/or within the same eddy, the functional strategy was the same, demonstrating that neutrality linked to niche diversity and complementarity could explain the microplankton distribution. Where resources are scarce, and utilization is intimately linked to coexistence and competitiveness for resources, there is a selection of species that best use any source of nutrients or use evolutionary advantages to live in an oligotrophic environment.
Data Availability Statement
The raw data supporting the conclusions of this article will be made available by the authors, without undue reservation.
Author Contributions
GM, LC, LP, and FP conceived the experimental design. CC-R, LC, LP, and FP organized the database. CC-R, DL, and LP performed the sample analysis. CC-R and GM performed the statistical analysis. CC-R, GM, LC, and FP wrote the first draft of the manuscript. All authors contributed to the manuscript revision, read and approved the submitted version.
Funding
LC acknowledges UERJ-Prociência grant for the 2018–2021 period. GM acknowledges UERJ-Prociência grant for the 2018–2020. DL acknowledges Qualitec, Departamento de Inovação—UERJ.
Conflict of Interest
The authors declare that the research was conducted in the absence of any commercial or financial relationships that could be construed as a potential conflict of interest.
Acknowledgments
This work integrates FORSA cruise was sponsored by the Brazilian Coastal Monitoring System (SiMCosta), the Brazilian National Council for Scientific and Technological Development (CNPq), and the Brazilian Federal Agency for Coordination of Improvement of Higher Education Personnel (CAPES), with logistics supported by the Ministry of Science, Technology, and Innovation (MCTI); Brazilian Secretariat of the Inter-ministerial Commission for the Sea Resources (SECIRM); and Brazilian Navy. We would like to thank the RV Vital de Oliveira crew and the scientific staff onboard for collecting and storing the plankton samples and for the AVISO satellite images produced by Dr. L. A. Guerra (PETROBRAS) who helped identify the sampled eddies. CC-R acknowledges Margareth de Paula for all support.
Supplementary Material
The Supplementary Material for this article can be found online at: https://www.frontiersin.org/articles/10.3389/fmars.2020.599185/full#supplementary-material
Footnotes
References
Adler, P. B., Hillerislambers, J., and Levine, J. M. (2007). A niche for neutrality. Ecol. Lett. 10, 95–104.
Aminot, A., and Chaussepied, M. (1983). Manuel Des Analyses Chimiques En Milieu Marin. Brest: Centre National pour l’Exploitation des Océans.
Barabás, G., D’andrea, R., Rael, R., Meszéna, G., and Ostling, A. (2013). Emergent neutrality or hidden niches? Oikos 122, 1565–1572. doi: 10.1111/j.1600-0706.2013.00298.x
Barlow, R., Lamont, T., Gibberd, M.-J., Airs, R., Jacobs, L., and Britz, K. (2017). Phytoplankton communities and acclimation in a cyclonic eddy in the Southwest Indian Ocean. Deep Sea Res. I Oceanogr. Res. Pap. 124, 18–30. doi: 10.1016/j.dsr.2017.03.013
Barton, A. D., Pershing, A. J., Litchman, E., Record, N. R., Edwards, K. F., Finkel, Z. V., et al. (2013). The biogeography of marine plankton traits. Ecol. Lett. 16, 522–534. doi: 10.1111/ele.12063
Bellinger, E. G., and Sigee, D. C. (2011). Freshwater Algae: Identification And Use As Bioindicators. Chichester: Wiley-Blackwell.
Blüthgen, N., and Klein, A. M. (2011). Functional complementarity and specialisation: the role of biodiversity in plant–pollinator interactions. Basic Appl. Ecol. 12, 282–291. doi: 10.1016/j.baae.2010.11.001
Boden, J. R. E., Duncombe Rae, C. M., and Lutjeharms, J. R. E. (1988). The distribution of diatoms of the South-West Indian Ocean surface waters between cape town and the prince edward islands archipelago. S. Afr. J. Sci. 10, 811–818.
Brandt, K. K., Vester, F., Jensen, A. N., and Ingvorsen, K. (2001). Sulfate reduction dynamics and enumeration of sulfate-reducing bacteria in hypersaline sediments of the Great Salt Lake (Utah, USA). Microb. Ecol. 41, 1–11. doi: 10.1007/s002480000059
Brasil, J., and Huszar, V. L. M. (2011). O papel dos traços funcionais na ecologia do fitoplâncton continental. Oecol. Austral. 15, 799–834. doi: 10.4257/oeco.2011.1504.04
Brookes, J. D., and Ganf, G. G. (2001). Variations in the buoyancy response of microcystis aeruginosa to nitrogen, phosphorus and light. J. Plankton Res. 23, 1399–1411. doi: 10.1093/plankt/23.12.1399
Byrne, D. A., Gordon, A. L., and Haxby, W. F. (1995). Agulhas eddies: a synoptic view using Geosat ERM data. J. Phys. Oceanogr. 25, 902–917. doi: 10.1175/1520-0485(1995)025<0902:aeasvu>2.0.co;2
Carvalho, A., Da, C., De, O., Mendes, C. R. B., Kerr, R., De Azevedo, J. L. L., et al. (2019). The impact of mesoscale eddies on the phytoplankton community in the South Atlantic Ocean: HPLC-chemtax approach. Mar. Environ. Res. 144, 154–165. doi: 10.1016/j.marenvres.2018.12.003
Caswell, H. (1976). Community structure: a neutral model analysis. Ecol. Monogr. 46, 327–354. doi: 10.2307/1942257
Chisholm, S. W. (1992). “Phytoplankton Size,” in Primary Productivity And Biogeochemical Cycles In The Sea, eds P. G. Falkowski, A. D. Woodhead, and K. Vivirito (Boston: Springer), 213–237. doi: 10.1007/978-1-4899-0762-2_12
Condie, S., and Condie, R. (2016). Retention of plankton within ocean eddies. Glob. Ecol. Biogeogr. 25, 1264–1277. doi: 10.1111/geb.12485
Cornwell, W. K., Schwilk, D. W., and Ackerly, D. D. (2006). A trait-based test for habitat filtering: convex hull volume. Ecology 87, 1465–1471. doi: 10.1890/0012-9658(2006)87[1465:attfhf]2.0.co;2
Dencausse, G., Arhan, M., and Speich, S. (2010). Spatio-temporal characteristics of the agulhas current retroflection. Deep Sea Res. I Oceanogr. Res. Pap. 57, 1392–1405. doi: 10.1016/j.dsr.2010.07.004
Elton, C. S. (ed.) (1958). “The reasons for conservation,” in The Ecology of Invasions by Animals and Plants, (Boston, MA: Springer), 143–153. doi: 10.1016/s0006-3207(02)00423-8
Froneman, P. W., Mcquaid, C. D., and Perissinotto, R. (1995). Biogeographic structure of the microphytoplankton assemblages of the south Atlantic and Southern Ocean during austral summer. J. Plankton Res. 17, 1791–1802. doi: 10.1093/plankt/17.9.1791
Froneman, P. W., Parkhomov, E. A., and Meaton, V. (1998). Surface distribution of microphytoplankton of the south-west Indian Ocean along a repeat transect between Cape Town and the Prince Edward Islands. S. Afr. J. Sci. 94, 124–129.
Gordon, A. L., and Haxby, W. F. (1990). Agulhas eddies invade the South Atlantic: evidence from Geosat altimeter and shipboard conductivity-temperature-depth survey. J. Geophys. Res. Oceans 95, 3117–3125. doi: 10.1029/jc095ic03p03117
Gracco-Roza, C., Marley, A., Kruk, C., Domingos, P., Soininen, J., and Marinho, M. (2020). Clumpy coexistence in phytoplankton: the role of functional similarity in community assembly. bioRxiv [Preprint]. doi: 10.1101/869966
Guerra, L. A. A., Paiva, A. M., and Chassignet, E. P. (2018). On the translation of agulhas rings to the Western South Atlantic Ocean. Deep Sea Res. I Oceanogr. Res. Pap. 139, 104–113. doi: 10.1016/j.dsr.2018.08.005
Haegeman, B., and Loreau, M. (2011). A mathematical synthesis of niche and neutral theories in community ecology. J. Theor. Biol. 269, 150–165. doi: 10.1016/j.jtbi.2010.10.006
Hällfors, G. (2004). Checklist Of Baltic Sea Phytoplankton Species (Including Some Heterotrophic Protistan Groups). Helsinki: Baltic Sea Environment Proceedings.
Hammer, Ø, Harper, D. A. T., and Ryan, P. D. (2001). Past: paleontological statistics software package for education and data analysis. Paleontol. Electron. 1, 1–9.
Hasle, G. R., and Fryxell, G. A. (1970). Diatoms: cleaning and mounting for light and electron microscopy. Trans. Am. Microsc. Soc. 89:469. doi: 10.2307/3224555
Higgins, H., Wright, S., and Schlüter, L. (2011). “Quantitative interpretation of chemotaxonomic pigment data,” in Phytoplankton Pigments: Characte rization, Chemotaxonomy and Applications in Oceanography (Cambridge Environmental Chemistry Series, eds S. Roy, C. Llewellyn, E. Egeland, and G. Johnsen (Cambridge: Cambridge University Press), 257–313. doi: 10.1017/CBO9780511732263.010
Horner, D. S., Heil, B., Happe, T., and Embley, T. M. (2002). Iron hydrogenases – ancient enzymes in modern eukaryotes. Trends Biochem. Sci. 27, 148–153. doi: 10.1016/s0968-0004(01)02053-9
Hubbell, S. P. (2001). The Unified Neutral Theory of Biodiversity and Biogeography (MPB-32), Vol. 32. Princeton, NJ: Princeton University Press.
Hubbell, S. P. (2005). Neutral theory in community ecology and the hypothesis of functional equivalence. Funct. Ecol. 19, 166–172. doi: 10.1111/j.0269-8463.2005.00965.x
Imai, I., and Yamaguchi, M. (2012). Life cycle, physiology, ecology and red tide occurrences of the fish-killing raphidophyte chattonella. Harmful Algae 14, 46–70. doi: 10.1016/j.hal.2011.10.014
Kofoid, C. A., and Swezy, O. (1921). The Free-Living Unarmored Dinoflagellata. Berkeley: University Of California Press.
Kruk, C., Huszar, V. L. M., Peeters, E. T. H. M., Bonilla, S., Costa, L., Lürling, M., et al. (2010). A morphological classification capturing functional variation in phytoplankton. Freshw. Biol. 55, 614–627. doi: 10.1111/j.1365-2427.2009.02298.x
Laliberté, E., and Legendre, P. (2010). A distance-based framework for measuring functional diversity from multiple traits. Ecology 91, 299–305. doi: 10.1890/08-2244.1
Lasbleiz, M., Leblanc, K., Armand, L. K., Christaki, U., Georges, C., Obernosterer, I., et al. (2016). Composition of diatom communities and their contribution to plankton biomass in the naturally iron-fertilized region of kerguelen in the Southern Ocean. FEMS Microbiol. Ecol. 92:fiw171. doi: 10.1093/femsec/fiw171
Lee, M. M., and Williams, R. G. (2000). The role of eddies in the isopycnic transfer of nutrients and their impact on biological production. J. Mar. Res. 58, 895–917. doi: 10.1357/002224000763485746
Lehahn, Y., d’Ovidio, F., Lévy, M., Amitai, Y., and Heifetz, E. (2011). Long range transport of a quasi isolated chlorophyll patch by an Agulhas ring. Geophys. Res. Lett. 38:e00755340.
Leles, S. G., Mitra, A., Flynn, K. J., Stoecker, D. K., Hansen, P. J., Calbet, A., et al. (2017). Oceanic protists with different forms of acquired phototrophy display contrasting biogeographies and abundance. Proc. R. Soc. B Biol. Sci. 284:0664.
Leles, S. G., Moser, G. A. O., Valentin, J. L., and Figueiredo, G. M. A. (2018). Lagrangian study of plankton trophodynamics over a diel cycle in a eutrophic estuary under upwelling influence. J. Mar. Biol. Assoc. U.K. 98, 1547–1558. doi: 10.1017/s0025315417001333
Levine, J. M., and HilleRisLambers, J. (2009). The importance of niches for the maintenance of species diversity. Nature 461, 254–257. doi: 10.1038/nature08251
Lévy, M. (2003). Mesoscale variability of phytoplankton and new production: impact of the large-scale nutrient distribution. J. Geophys. Res. 108, 1–15.
Lima, D. T., De, Moser, G. A. O., Piedras, F. R., Da Cunha, L. C., Tenenbaum, D. R., et al. (2019). Abiotic changes driving microphytoplankton functional diversity in Admiralty Bay, King George Island (Antarctica). Front. Mar. Sci. 6:638. doi: 10.3389/fmars.2019.00638
Litchman, E., and Klausmeier, C. A. (2008). Trait-based community ecology of phytoplankton. Annu. Rev. Ecol. Evol. Syst. 39, 615–639. doi: 10.1146/annurev.ecolsys.39.110707.173549
Litchman, E., Klausmeier, C. A., and Yoshiyama, K. (2009). Contrasting size evolution in marine and freshwater diatoms. Proc. Natl. Acad. Sci. U.S.A. 106, 2665–2670. doi: 10.1073/pnas.0810891106
Litchman, E., Pinto, P., De, T., Klausmeier, C. A., Thomas, M. K., and Yoshiyama, K. (2010). Linking traits to species diversity and community structure in phytoplankton. Hydrobiologia 653, 15–28. doi: 10.1007/s10750-010-0341-5
Liu, X., Chang, P., Kurian, J., Saravanan, R., and Lin, X. (2018). Satellite-observed precipitation response to ocean mesoscale eddies. J. Clim. 31, 6879–6895. doi: 10.1175/jcli-d-17-0668.1
Lorrain, A., Pethybridge, H., Cassar, N., Receveur, A., Allain, V., Bodin, N., et al. (2019). Trends in tuna carbon isotopes suggest global changes in pelagic phytoplankton communities. Glob. Change Biol. 26, 458–470. doi: 10.1111/gcb.14858
Lutjeharms, J. R. E., and Van Ballegooyen, R. C. (1988). The retroflection of the agulhas current. J. Phys. Oceanogr. 18, 1570–1583.
MacArthur, R. (1955). Fluctuations of animal populations and a measure of community stability. Ecology 36, 533–536. doi: 10.2307/1929601
Martin, A. P., and Richards, K. J. (2001). Mechanisms for vertical nutrient transport within a North Atlantic mesoscale eddy. Deep Sea Res. II Top. Stud. Oceanogr. 48, 757–773. doi: 10.1016/s0967-0645(00)00096-5
Mason, N. W., and De Bello, F. (2013). Functional diversity: a tool for answering challenging ecological questions. J. Veg. Sci. 24, 777–780. doi: 10.1111/jvs.12097
Menden-Deuer, S., and Rowlett, J. (2014). Many ways to stay in the game: individual variability maintains high biodiversity in planktonic microorganisms. J. R. Soc. Interface 11:1120140031.
Mitra, A., Flynn, K. J., Burkholder, J. M., Berge, T., Calbet, A., Raven, J. A., et al. (2014). The role of mixotrophic protists in the biological carbon pump. Biogeosciences 11, 995–1005. doi: 10.5194/bg-11-995-2014
Moestrup, Ø, Akselmann-Cardella, R., Churro, C., Fraga, S., Hoppenrath, M., Iwataki, M., et al. (2020). Ioc-Unesco Taxonomic Reference List Of Harmful Micro Algae. Available online at: http://www.marinespecies.org/hab (accessed May 21, 2020).
Moser, G. A. O., Piedras, F. R., Oaquim, A. B. J., Souza, D. S., Leles, S. G., Lima, D. T., et al. (2017). Tidal effects on phytoplankton assemblages in a near-pristine estuary: a trait-based approach for the case of a shallow tropical ecosystem in Brazil. Mar. Ecol. 38:e12450. doi: 10.1111/maec.12450
Narwani, A., Berthin, J., and Mazumder, A. (2009). Relative importance of endogenous and exogenous mechanisms in maintaining phytoplankton species diversity. Écoscience 16, 429–440. doi: 10.2980/16-4-3232
Oksanen, J., Blanchet, F. G., Friendly, M., Kindt, R., Legendre, P., Mcglinn, D., et al. (2017). Vegan: Community Ecology Package 2017. Available online at: https://cran.ism.ac.jp/web/packages/vegan/vegan.pdf (accessed November 21, 2019).
Olson, D. B., and Evans, R. H. (1986). Rings of the Agulhas current. Deep Sea Res. A Oceanogr. Res. Pap. 33, 27–42. doi: 10.1016/0198-0149(86)90106-8
Olson, R. J. (1981). Differential photoinhibition of marine nitrifying bacteria: a possible mechanism for the formation of the primary nitrite maximum. J. Mar. Res. 39, 227–238.
Orselli, I. B. M., Goyet, C., Kerr, R., De Azevedo, J. L. L., Araujo, M., Galdino, F., et al. (2019). The effect of agulhas eddies on absorption and transport of anthropogenic carbon in The South Atlantic Ocean. Climate 7:84. doi: 10.3390/cli7060084
Oschlies, A. (2002). Can eddies make ocean deserts bloom? Glob. Biogeochem. Cycles 16, 53–51. doi: 10.1029/2001gb001830
Pahlow, M., Riebesell, U., and Wolf-Gladrow, D. A. (1997). Impact of cell shape and chain formation on nutrient acquisition by marine diatoms. Limnol. Oceanogr. 42, 1660–1672. doi: 10.4319/lo.1997.42.8.1660
Patil, J. S., and Anil, A. C. (2008). Temporal variation of diatom benthic propagules in a monsoon-influenced tropical estuary. Continent. Shelf Res. 28, 2404–2416. doi: 10.1016/j.csr.2008.06.001
Perissinotto, R. (1992). Mesozooplankton size-selectivity and grazing impact on the phytoplankton community of the Prince Edward Archipelago (Southern Ocean). Mar. Ecol. Prog. Ser. 79, 243–258. doi: 10.3354/meps079243
Petchey, O. L., and Gaston, K. J. (2006). Functional diversity: back to basics and looking forward. Ecol. Lett. 9, 741–758. doi: 10.1111/j.1461-0248.2006.00924.x
Petchey, O. L., and Gaston, K. J. (2007). Dendrograms and measuring functional diversity. Oikos 116, 1422–1426. doi: 10.1111/j.0030-1299.2007.15894.x
R Core Team (2018). R: A Language and Environment for Statistical Computing. Vienna: R Foundation for Statistical Computing.
Roselli, L., Litchman, E., Stanca, E., Cozzoli, F., and Basset, A. (2017). Individual trait variation in phytoplankton communities across multiple spatial scales. J. Plankton Res. 39, 577–588. doi: 10.1093/plankt/fbx001
Round, F. E., Crowford, R. M., and Mann, D. G. (1990). Diatoms: Biology And Morphology Of The Genera. Cambridge: Cambridge University Press, 747.
Schabhüttl, S., Hingsamer, P., Weigelhofer, G., Hein, T., Weigert, A., and Striebel, M. (2013). Temperature and species richness effects in phytoplankton communities. Oecologia 171, 527–536. doi: 10.1007/s00442-012-2419-4
Scheffer, M., and van Nes, E. H. (2006). Self-organized similarity, the evolutionary emergence of groups of similar species. Proc. Natl. Acad. Sci. U.S.A. 103, 6230–6235. doi: 10.1073/pnas.0508024103
Schlüter, L., Henriksen, P., Nielsen, T. G., and Jakobsen, H. H. (2011). Phytoplankton composition and biomass across the southern Indian Ocean. Deep Sea Res. I Oceanogr. Res. Pap. 58, 546–556. doi: 10.1016/j.dsr.2011.02.007
Schouten, M. W., Ruijter, W. P. M., De, Van Leeuwen, P. J., and Lutjeharms, J. R. E. (2000). Translation, decay and splitting of agulhas rings in the Southeastern Atlantic Ocean. J. Geophys. Res. Oceans 105, 21913–21925. doi: 10.1029/1999jc000046
Segura, A. M., Calliari, D., Kruk, C., Conde, D., Bonilla, S., and Fort, H. (2011). Emergent neutrality drives phytoplankton species coexistence. Proc. R. Soc. B Biol. Sci. 278, 2355–2361. doi: 10.1098/rspb.2010.2464
Souza, A. G. Q., Kerr, R., and Azevedo, J. L. L. (2018). On the influence of subtropical mode water on the South Atlantic Ocean. J. Mar. Syst. 185, 13–24. doi: 10.1016/j.jmarsys.2018.04.006
Steidinger, K. A. (2009). Historical perspective on karenia brevis red tide research in the Gulf Of Mexico. Harmful Algae 8, 549–561. doi: 10.1016/j.hal.2008.11.009
Stoecker, D. K., Hansen, P. J., Caron, D. A., and Mitra, A. (2017). Mixotrophy in the marine plankton. Annu. Rev. Mar. Sci. 9, 311–335. doi: 10.1146/annurev-marine-010816-060617
Throndsen, J., Hasle, G. R., and Tangen, K. (2007). Phytoplankton Of Norwegian Coastal Waters. Oslo: Almater Forlag.
Tilman, D. (1977). Resource competition between plankton algae: an experimental and theoretical approach. Ecology 58, 338–348. doi: 10.2307/1935608
Tilman, D. (1981). Tests of resource competition theory using four species of lake michigan algae. Ecology 62, 802–815. doi: 10.2307/1937747
Tilman, D. (1982). Resource Competition And Community Structure. Princeton: Princeton University Press.
Tuerena, R. E., Williams, R. G., Mahaffey, C., Vic, C., Green, J. A. M., Naveira-Garabato, A., et al. (2019). Internal tides drive nutrient fluxes into the deep chlorophyll maximum over mid-ocean ridges. Glob. Biogeochem. Cycles 33, 995–1009. doi: 10.1029/2019gb006214
Utermöhl, H. (1958). Zur vervollkommnung der quantitativen phytoplankton-methodik. Sil Communications 9, 1–38. doi: 10.1080/05384680.1958.11904091
Van de Perre, F., Willig, M. R., Presley, S. J., Mukinzi, I. J. C., Gambalemoke, M. S., Leirs, H., et al. (2020). Functional volumes, niche packing and species richness: biogeographic legacies in the Congo Basin. R. Soc. Open Sci. 7:191582. doi: 10.1098/rsos.191582
Van de Waal, D. B., and Litchman, E. (2020). Multiple global change stressor effects on phytoplankton nutrient acquisition in a future ocean. Philos. Trans. R. Soc. B 375:20190706. doi: 10.1098/rstb.2019.0706
Vergnon, R., Dulvy, N. K., and Freckleton, R. P. (2009). Niches versus neutrality: uncovering the drivers of diversity in a species-rich community. Ecol. Lett. 12, 1079–1090. doi: 10.1111/j.1461-0248.2009.01364.x
Vergnon, R., van Nes, E. H., and Scheffer, M. (2012). Emergent neutrality leads to 1 multimodal species abundance distributions. Nat. Commun. 3:663.
Villar, E., Farrant, G. K., Follows, M., Garczarek, L., Speich, S., Audic, S., et al. (2015). Environmental characteristics of agulhas rings affect interocean plankton transport. Science 348, 1261447–1261447. doi: 10.1126/science.1261447
Villéger, S., Mason, N. W. H., and Mouillot, D. (2008). New multidimensional functional diversity indices for a multifaceted framework in functional ecology. Ecology 89, 2290–2301. doi: 10.1890/07-1206.1
Violle, C., Navas, M.-L., Vile, D., Kazakou, E., Fortunel, C., Hummel, I., et al. (2007). Let the concept of trait be functional! Oikos 116, 882–892. doi: 10.1111/j.0030-1299.2007.15559.x
Keywords: microplankton, neutrality, mixotrophy, functional traits, Agulhas rings
Citation: Cesar-Ribeiro C, Piedras FR, da Cunha LC, de Lima DT, Pinho LQ and Moser GAO (2020) Is Oligotrophy an Equalizing Factor Driving Microplankton Species Functional Diversity Within Agulhas Rings? Front. Mar. Sci. 7:599185. doi: 10.3389/fmars.2020.599185
Received: 26 August 2020; Accepted: 11 November 2020;
Published: 17 December 2020.
Edited by:
Angel Borja, Technological Center Expert in Marine and Food Innovation (AZTI), SpainReviewed by:
Anne Willem Omta, Massachusetts Institute of Technology, United StatesAlex J. Poulton, The Lyell Centre, United Kingdom
Copyright © 2020 Cesar-Ribeiro, Piedras, da Cunha, de Lima, Pinho and Moser. This is an open-access article distributed under the terms of the Creative Commons Attribution License (CC BY). The use, distribution or reproduction in other forums is permitted, provided the original author(s) and the copyright owner(s) are credited and that the original publication in this journal is cited, in accordance with accepted academic practice. No use, distribution or reproduction is permitted which does not comply with these terms.
*Correspondence: Caio Cesar-Ribeiro, Y2Fpb2NyaWJlaXJvQGhvdG1haWwuY29t