 Shan Jiang1*
 Jie Jin1Shuo Jiang1
 Ying Wu1
 Jianing Wang2Ju Chen3Zhenqiu Zhang3
 Sumei Liu4Yan Chang1Lingyan Wang4Jing Zhang1,5
- 1State Key Laboratory of Estuarine and Coastal Research, East China Normal University, Shanghai, China
- 2Institute of Oceanology, Chinese Academy of Sciences, Qingdao, China
- 3South China Sea Institute of Oceanology, Chinese Academy of Sciences, Guangzhou, China
- 4Frontiers Science Center for Deep Ocean Multispheres and Earth System, and Key Laboratory of Marine Chemistry Theory and Technology Ministry of Education, Ocean University of China, Qingdao, China
- 5School of Oceanography, Shanghai Jiao Tong University, Shanghai, China
Atmospheric deposition is the dominant pathway for the loading of exogenous nitrogen (N) to open ocean. Here, rainwater samples were collected from 31 stations in the equatorial East Indian Ocean (EIO) and West Pacific Ocean (WPO) to explore the spatial variability of N species, potential sources, and related ecological influences. Among two oceans, nitrate (NO3–) and ammonium (NH4+) were the main components in the rainwater N inventory. NO3– concentrations varied from 0.19 to 100.5 μM, whereas NH4+ concentrations ranged from 0.54 to 110.6 μM. Among all stations, low concentrations of NO3– and NH4+ appeared in the remote ocean, whereas high concentrations were observed at the stations near the Malacca Strait and New Guinea, coupled with an enhancement of non-sea salt major ions, e.g., calcium ions (Ca2+) and sulfate (SO42–), revealing the influence from coastal human activities, such as coal and gasoline combustion. In the remote ocean, δ15N–NH4+ ranged from −5.7 to −9.3‰, whereas it dropped to -15.5‰ near coasts. A logarithmic decay between δ15N–NH4+ and NH4+ concentrations in rainwater samples was obtained, suggesting a shift from natural source (seawater emission) in oceanic precipitation events to anthropogenic source (chemical fertilizer volatilization and vehicle exhaust) in coastal rainwaters. δ15N–NO3– in the remote ocean varied between −1.7 and 0.4‰ with low levels found in the WPO, likely related to the ascending air flow driven by the Walker Circulation. In coastal oceans, δ15N–NO3– ranged from 1.5 to 3.5‰. The linkage between δ15N–NO3– and NO3– concentrations varied in two oceans, resulting from difference in biological and fossil fuel combustion contributions. Compared with ocean surface water, N in the rainwater was markedly enriched, suggesting that N from atmospheric wet depositions could rapidly enhance the dissolved N availability in ocean surface water. However, the N redundancy according to the Redfield–Brzezinski ratio (N:Si:P = 16:16:1) in the rainwater might benefit from the growth of N-preference phytoplankton species and microbes. As the first study on N concentrations, sources, and stoichiometry balance in rainwater over the equatorial WPO and EIO, the results could be a support to the global N budget estimation and oceanic primary production modeling.
Introduction
Nitrogen (N) is essential for the biosynthesis of amino acids, phospholipid, nucleic acids, etc. Since preindustrial times, the reactive N storage in the biosphere has rapidly increased due to anthropogenic N fixation (Kuypers et al., 2018). Given the high solubility and chemical activity, reactive N intensively transports among different systems in the biosphere (Galloway et al., 2008). Though the importance in biological actives, excessive N frequently leads to negative ecological feedbacks, especially in aquatic systems, such as harmful algae blooms, benthic hypoxia, and phytoplankton community succession. Accordingly, N cycling with regard to transport and transformation receives great attention from the scientific community.
On a global scale, the magnitude of N deposition flux to terrestrial systems is relatively well gauged based on monitoring projects in continents (e.g., Loÿe-Pilot et al., 1990; Fenn et al., 2003; Duan et al., 2016). In contrast, the impacts of N deposition to oceans are less evaluated, with sporadic measurements and limited spatial coverage archived in the past several decades (e.g., the tropical Atlantic Ocean, Baker et al., 2007; Bermuda, Altieri et al., 2013; the North Pacific Jung et al., 2013). In those unexplored oceans, our knowledge of atmospheric N deposition, with regard to concentration, species, and sources, is highly scarce. This knowledge gap adds great uncertainties in global N budget estimations, such as oceanic N storages and N reaction rates. In addition, the limitation of oceanic N deposition data also produces the difficulty in ecological explanation on the variability of N-related phytoplankton community structure (Li et al., 2015). Furthermore, the lack of oceanic N deposition data also hampers the understanding of carbon cycles because of the reaction linkage of the sequestration capability of atmospheric CO2 via primary producers (Capone, 2001).
In the present study, wet deposition (rainwater) samples from two cruises covering tropical areas in the East Indian Ocean (EIO) and West Pacific Ocean (WPO) were obtained (Figure 1A). The sampling area in the EIO is adjacent to the Peninsular Thailand and Indonesia Archipelagoes on the east and the Indian Subcontinent and Sri Lanka on the north. In those regions, dense population (>1.5 billion) and intensive agriculture/manufacture are characterized. From May to September, the south-west monsoon introduces significant precipitation to South Asia, whereas the east wind from November to April introduces substantial land-derived matter from the Indian Subcontinent to the EIO (Sinha et al., 2019). For the sampling region in the WPO, it is surrounded by tropical islands, e.g., Guam, Borneo, and New Guinea. Walker Circulation (latitudinal) and Hadley Circulation (meridional) related east wind is prevailing at the eastern boundary of this sampling region, whereas the west wind from the Sulawesi Sea introduces terrestrial compounds derived from the Borneo and Indonesian islands (Supplementary Figure S1). The equatorial EIO and WPO have been identified as global sea ranches for tuna and squid catching more than 30 years (Takashi and Tsukada, 1988), whereas the primary productivity in seawater frequently remains a low level due to oligotrophic status (Supplementary Figure S2). During these two cruises, 31 rainwater samples (13 from EIO and 18 from WPO) were collected. Coupled with in situ measurement of precipitation amount and rainwater pH, concentrations of major ions and dissolved inorganic N species [ammonium (NH4+), nitrite (NO2–), nitrate (NO3–)] were determined. More importantly, multiple N isotopic signatures (15N–NO3–, 18O–NO3–, 15N–NH4+) and water stable isotope fractions (2H–H2O, 18O–H2O) in these rainwater samples were determined, in order to identify different sources of NH4+ and NO3– during these precipitation events (e.g., volatilized fertilizer, vehicle exhaust, and lighting production) according to their significant variability in isotopic fractions (e.g., Felix et al., 2015; Elliott et al., 2019; Zeng et al., 2019). Together with the backward trajectory mode from the National Oceanic and Atmospheric Administration (NOAA) (Figure 1A), we aimed to: (1) determine the spatial variability of N species in wet precipitations in the equatorial EIO and WPO and dynamic linkage with the Walker Circulation and Hadley Circulation; (2) identify potential sources of rainwater N and evaluate the influence of anthropogenic activities from adjacent coasts on rainwater N inventory; and (3) explore the potential ecology/environment impacts from wet deposition derived N on the equatorial EIO and WPO.
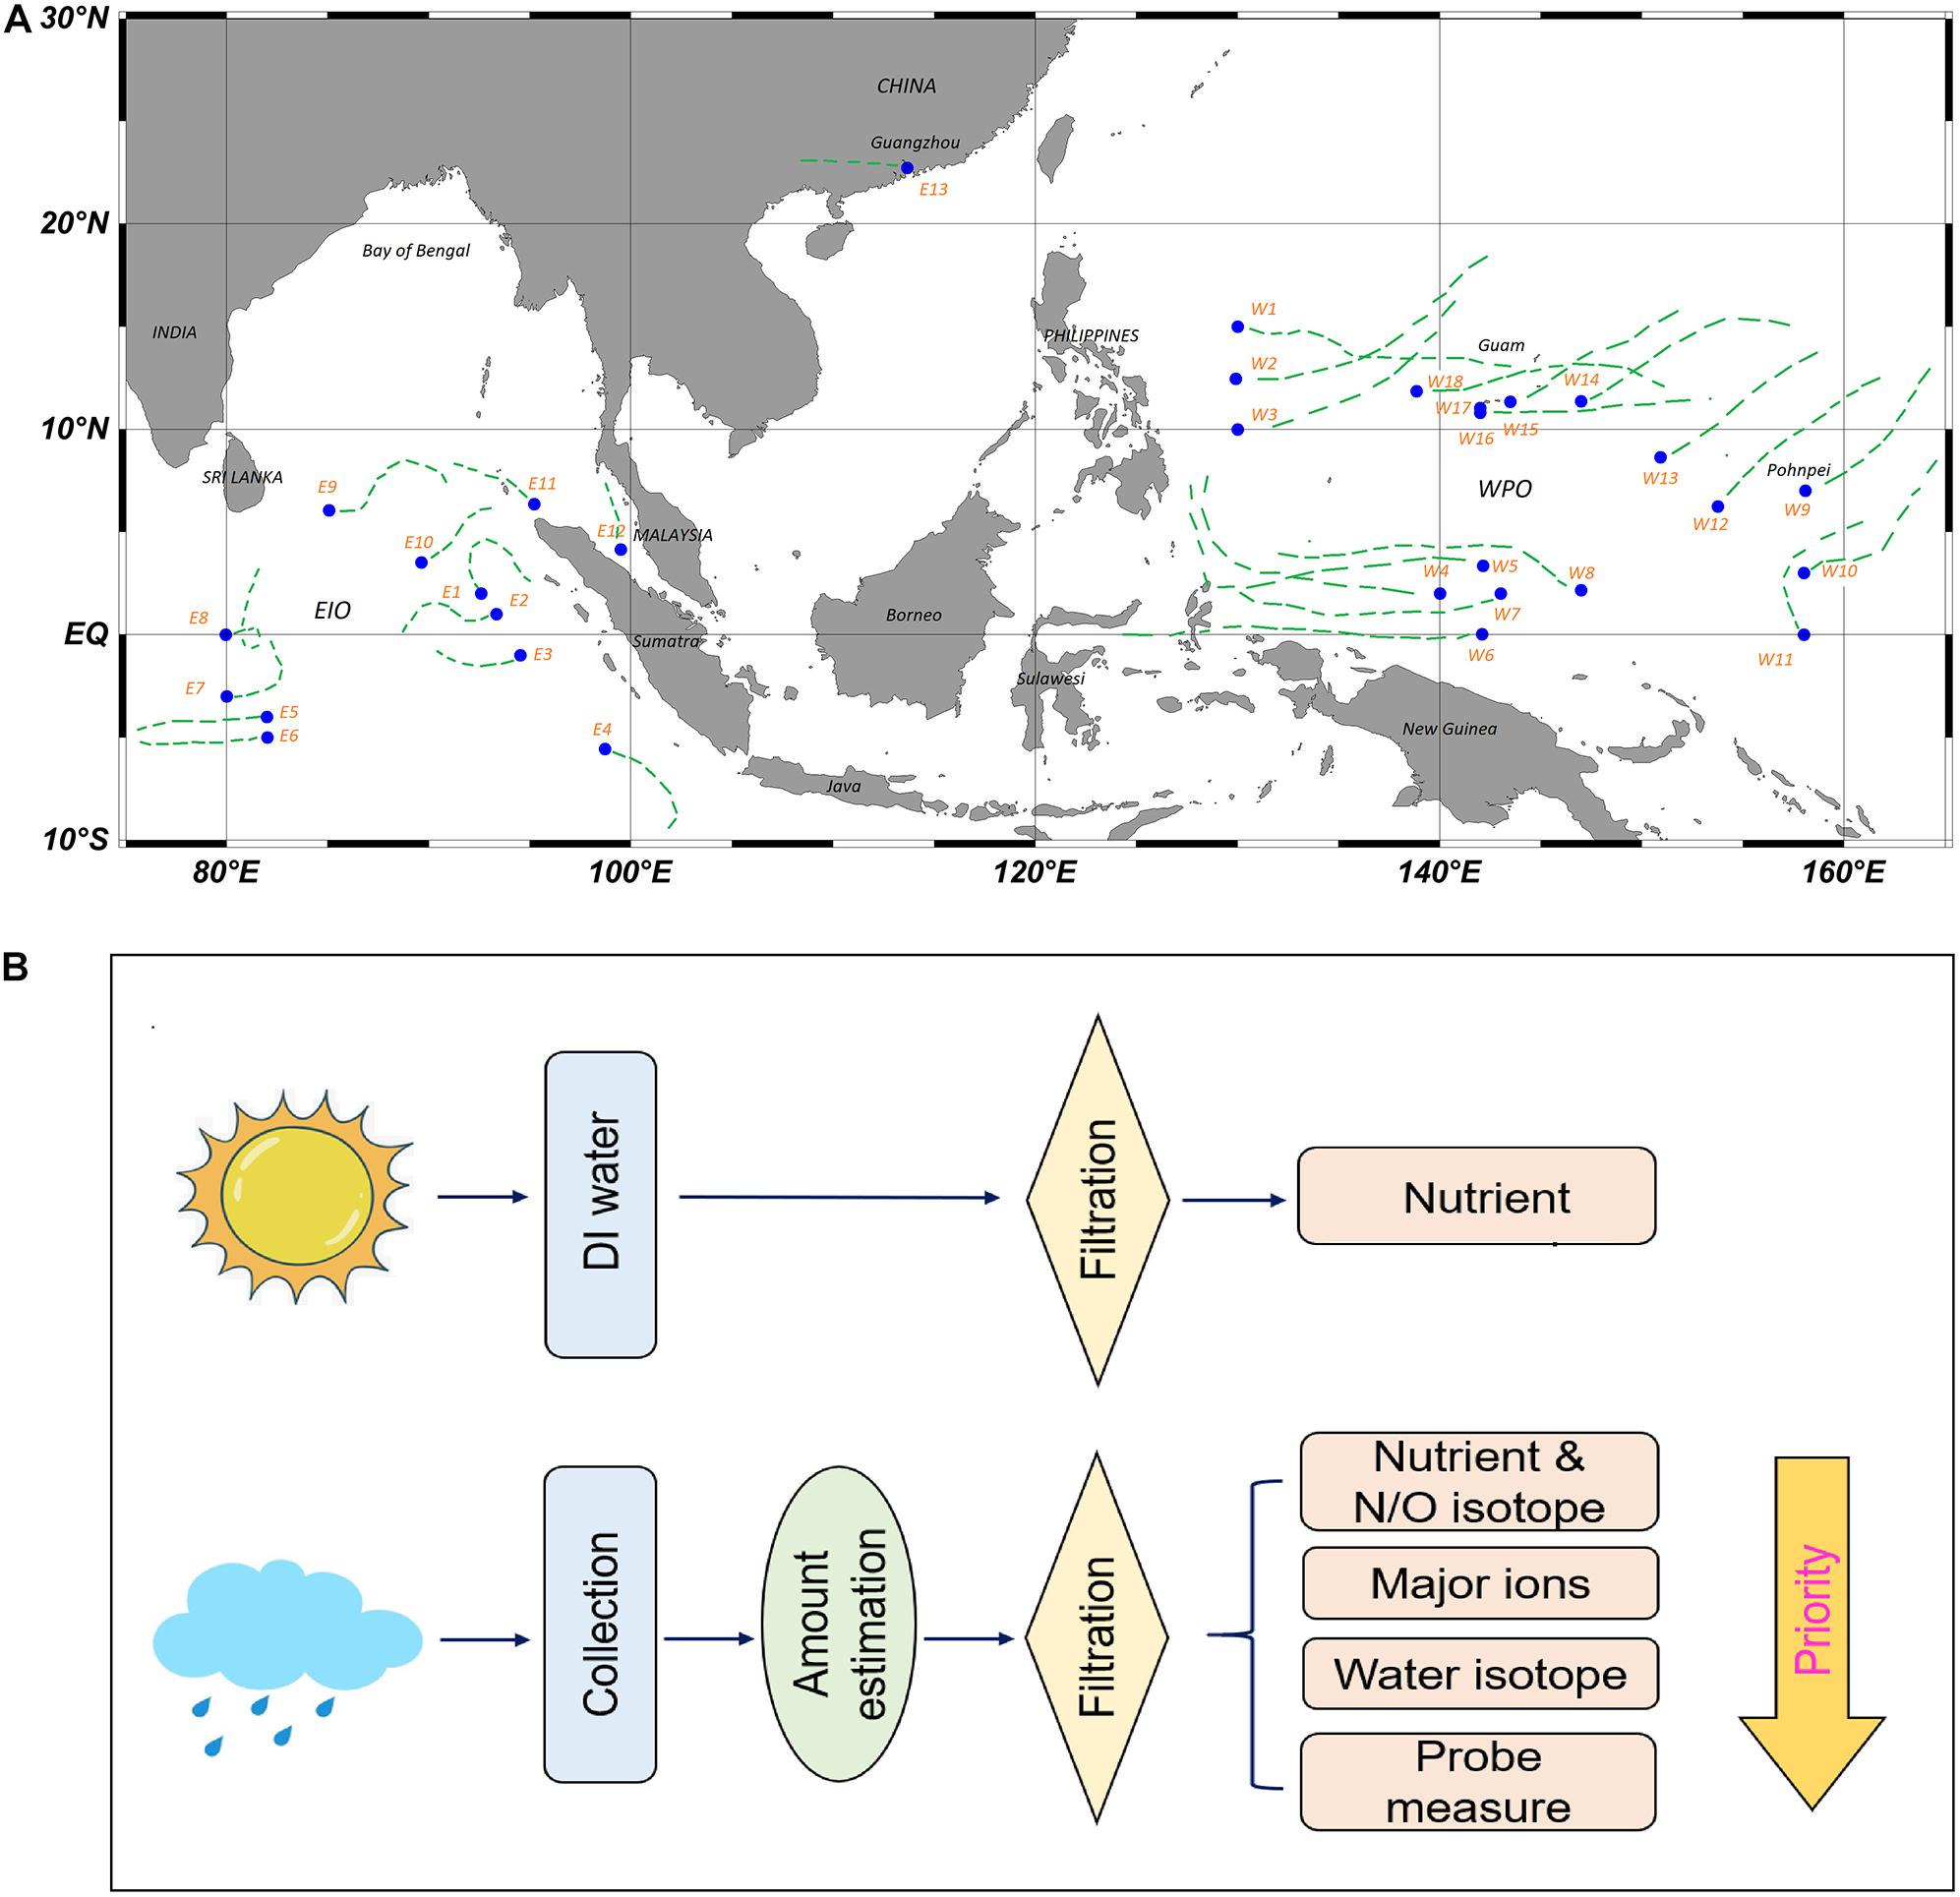
Figure 1. Sampling sites in both EIO and WPO cruises (A), the dash lines indicate 72 h transport pathway of atmospheric particles at an altitude of 1,000 m (back-trajectory analysis). (B) Sketch of the sampling procedure, including atmospheric blank analysis (only WPO) and rainwater collection/filtration.
Materials and Methods
Sample Collection
The EIO cruise was conducted from 17th March 2018 to 12th May 2018 on the Shiyan III R/V, whereas the WPO cruise ranged from 15th November 2018 to 30th January 2019 on the Kexue R/V. Atmospheric temperature and wind speed were automatically recorded on board during both campaigns. Rainwater samples were collected with an acid-prewashed container at an open area of the top deck. The collection ranged from 2 to 6 h in each site. After rainwater gathering, the precipitation amount (unit: mm) was estimated, and then the collected rainwater was used for filtration and pH measurement (sketch in Figure 1B). The filtration was conducted at air-cleaning environment, using polycarbonate membrane filter (0.4 μm pore size, Whatman®). The filtrate was stored in acid-prewashed high-density polyethylene (HDPE) bottles at −20°C environment for major ions, nutrients, and N stable isotope fractions. Water stable isotope samples were stored in air-tight vacutainers at 4°C environment (Jiang et al., 2017). Occasionally, the volume of collected rainwater was limited. In these cases, nutrients and major ions collection were priority targets. The pH of the rainwater (unfiltered) was measured with a calibrated WTW multi-function probe (350 type, Germany) on board. After each collection, the sampling container was cleaned using ethanol (analytical reagent purity) and deionized (DI) water (resistance: 18.2 MΩ.cm) and then resettled on the top deck. In total, 13 rainwater samples were collected from the EIO cruise (E1–E13), and 18 rainwater samples were obtained from the WPO cruise (W1–W18; Figure 1A). In addition, during both cruises, a series of blank experiments was conducted to quantitively determine the bias introduced from the filtration system (test 1st and 2nd) and seawater spray on the collected rainwater (test 3rd–6th). In practice, 100 ml DI water was filtered and then stored in acid-prewashed sampling bottles to determine the bias from the filtration system. For the seawater spray influence, approximately 500 ml DI water was injected into the container and received sunlight exposure at the sampling spot for 1 (3rd, 4th, 5th) and 3 days (6th). Subsequently, the water was filtered and analyzed with rainwater samples together. Notably, the filtration blank was conducted in both EIO and WPO cruises, whereas the spray effect was only determined in the WPO.
Chemical Analyses
After thawing, concentrations of NH4+, NO2–, NO3–, soluble reaction phosphorus (SRP), and dissolved silicate (Si) in water samples were determined on a flow injection system (SKLAR + +, the Netherlands) with the standard colorimetric approach. The method precision for all species was <5%. The concentration of total dissolved nitrogen (TDN) and total dissolved phosphorus (TDP) was quantified on the identical system after 30 min at 121°C digestion with alkaline potassium persulfate solution. Dissolved organic nitrogen (DON) and dissolved organic phosphorus (DOP) were assumed to be the concentration difference between TDN and dissolved inorganic nitrogen (DIN), as well as TDP and SRP, respectively (Jiang et al., 2019). Both δ15N–NO3– and δ18O–NO3– were determined via transforming NO3– to N2O using a denitrifier with the reference of USGS-32, USGS-34, and IAEA-N3 (Sigman et al., 2001) after removing NO2– (Weigand et al., 2016). The produced N2O was concentrated in a Thermo-Fisher Precon system at liquid nitrogen environment, and the signal of N2O was detected in a Thermo-Fisher Delta V Advantage Isotope Mass Spectrometer (Jin et al., 2020). The method detection limit was approximately 1 μM, and the method variation for δ15N–NO3– <0.2‰ and δ18O–NO3– <0.5‰ was based on the long run. The δ15N–NH4+ was determined via transforming NH4+ to N2O using the sodium hypobromite–sodium azide method with the reference of USGS-26, USGS-25, and IAEA-N1 (Zhang et al., 2007). The detection limit was ca. 2 μM, and the method variation was approximately 0.5‰. The water stable isotope fractions (2H–H2O) and (18O–H2O) were analyzed on an Elementary Analyzer-Isotope Ratio Mass Spectrometer. The concentration of major ions, including sodium (Na+), potassium (K+), calcium (Ca2+), magnesium (Mg2+), chloride (Cl–), sulfate (SO42–), and fluoride (F–), was tested using ion chromatography (Dione ICS-2000). The eluent was potassium hydroxide solution (25 mM) for anions and methanesulfonic acid solution (20 mM) for cations, with the flow rate of 1 ml min–1. The detection limit was approximately 0.01 mg L–1 for all species. The precision for major ions was below 4%.
Data Analyses
The linear regression, cluster analysis, and Spearman’s rank correlation were conducted in the Minitab software (version 17.5). The redundancy analysis (RDA) was conducted in the Canoco 5 software. The statistical significance was assumed to be P ≤ 0.05. Chlorophyll a concentration in the sampled ocean areas was estimated from the remote sensing and downloaded from the online database1. The visualized atmospheric circulation (wind speed and direction) information (altitude of 850 hPa, approximately 1,500 m height; download from https://earth.nullschool.net) on two sampling regions was invoked to validate the long-range atmospheric dispersion (e.g., Yang et al., 2017). To identify the origin of aerosol particles via atmospheric transport, back-trajectory analysis has been performed (dash lines in Figure 1A). The trajectory of aerosol particles was back to 72 h at an altitude of 1,000 m (e.g., Zhang et al., 2004; Sinha et al., 2019).
Results
Meteorology
During the EIO cruise, the atmospheric temperature was 20°C at Guangzhou, China (Supplementary Figure S3). Temperature ranged from 26.2 to 34.3°C during the EIO cruise. Concurrently, the wind speed varied from 0.96 to 14.8 m s–1 (Supplementary Figure S3). The wind direction was northeast at 850 hPa with eddies (Supplementary Figure S1). Both temperature and wind speed showed insignificant variations during precipitation events. The precipitation amount ranged from approximately 0.4 to 22 mm, and pH in the EIO rainwater varied between 4.3 (Guangzhou) and 6.6 (remote ocean). Chlorophyll a concentration in surface EIO was <8 mg m–3 (Supplementary Figure S2). During the WPO cruise, the atmospheric temperature increased from 9°C at Qingdao to approximately 29°C at the equatorial WPO. Wind speed varied between 1.6 and 14.1 m s–1. The east wind was prevailing, whereas several sites near the New Guinea coast were influenced by the west wind (Supplementary Figure S1). The precipitation amount varied between 0.3 and 32 mm, and the pH ranged from 5.2 to 6.4. Similar with the EIO, insignificant variations in both temperature and wind speed during precipitation events and low-level chlorophyll a concentration in the equatorial WPO were found (Supplementary Figure S2).
Blank Test
In the filter blank, nutrient concentrations were below the detection limit (Supplementary Table S1). For the 1-day exposure, concentrations of NH4+, NO2–, and NO3– slightly increased, reaching 0.54 μM. After the 3-day exposure, approximately 20% of DI water was evaporated. N species and dissolved Si increased, whereas the level of SRP and DOP remained low. Excluding the influence from evaporation, the addition rate for nutrient species ranged from 1.3 to 13.0 nmol L–1 h–1. Considering that the rainwater collection only lasted 6 h (maximum) at each site, the exogenous nutrient concentration from seawater spray introduced into the sampling container should be <0.12 μM, indicating an insignificant influence.
N Concentrations and Isotope Fractions
NH4+ concentration in rainwater samples from the EIO cruise varied between 1.8 and 110 μM, peaking at Guangzhou (Figure 2). Enrichment of NH4+ was also found at sites near the Malacca Strait. In the WPO, the NH4+ concentration ranged from 0.9 to 12.3 μM (Figure 2). High concentrations were observed between the W4 and W8 sites (near New Guinea). δ15N–NH4+ in the EIO cruise ranged from -7.5 to 15.5‰ that the lowest value was still found at Guangzhou. In the WPO, δ15N–NH4+ ranged from -5.4 to -14.7‰ (Figure 2). In both EIO and WPO, δ15N–NH4+ showed a logarithmic decay with NH4+ concentrations (Figure 3A).
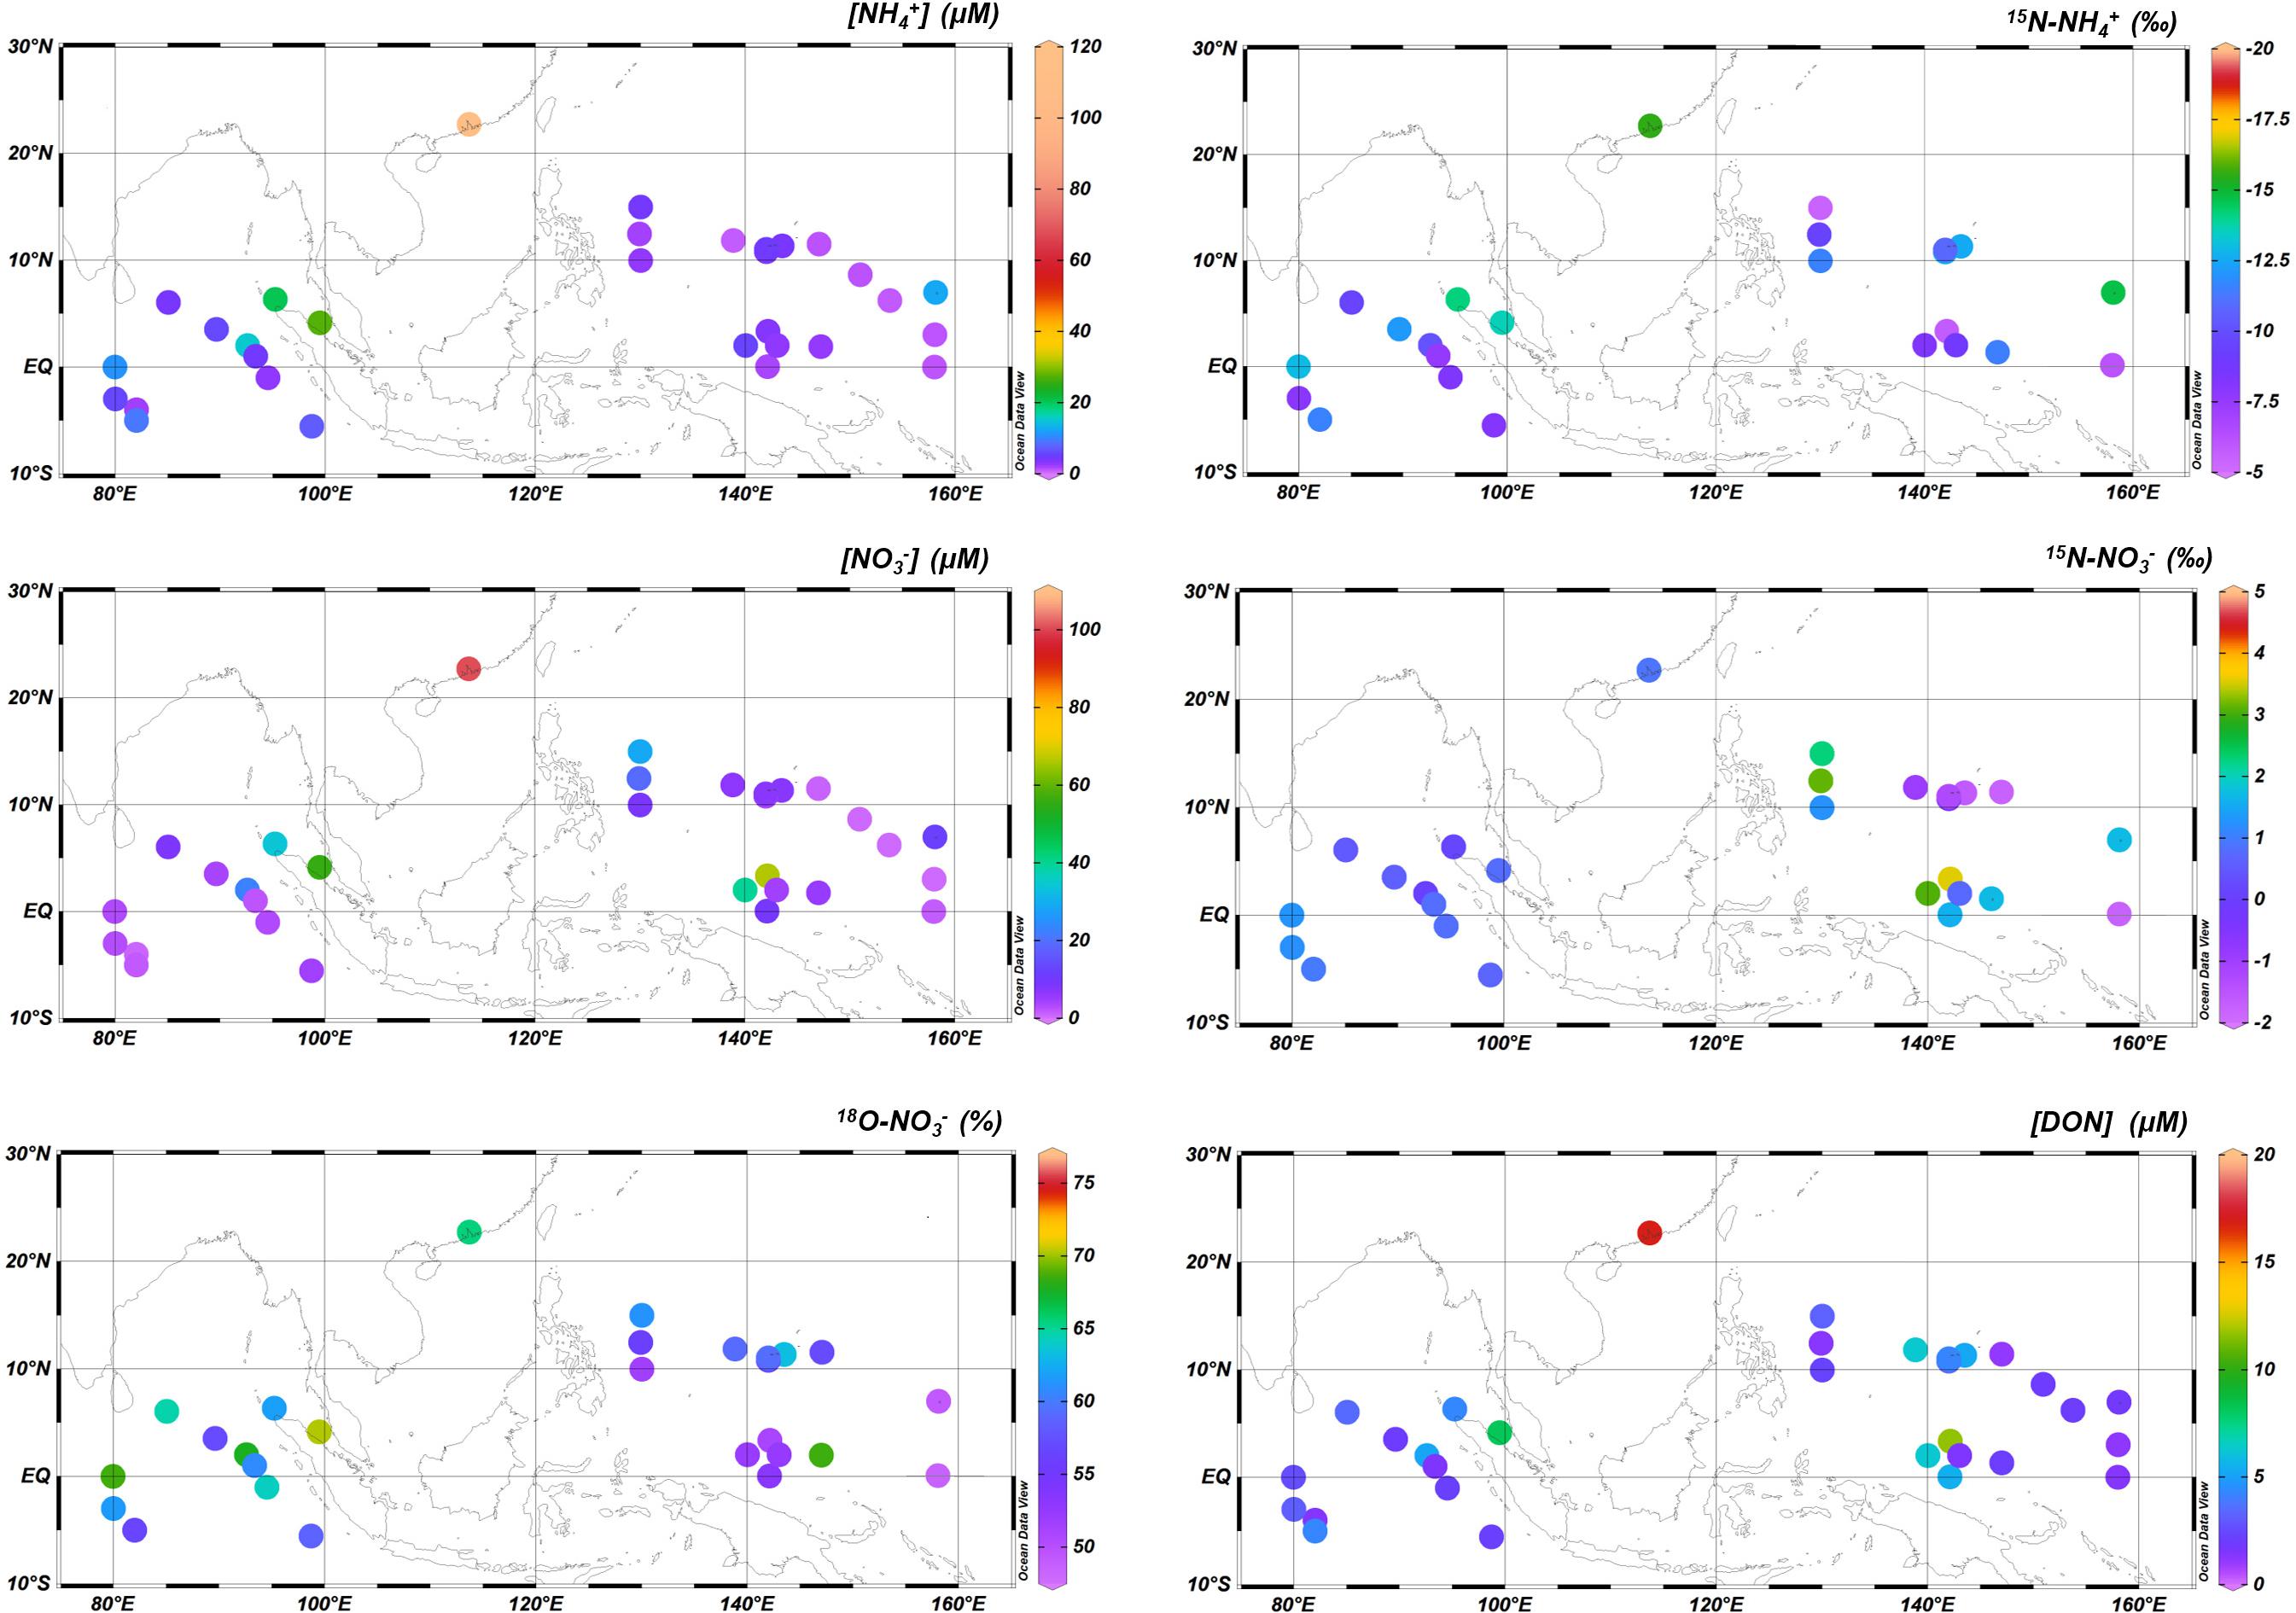
Figure 2. Spatial variability of NH4+, NO3–, and DON concentrations and their isotope fractions in both EIO and WPO.
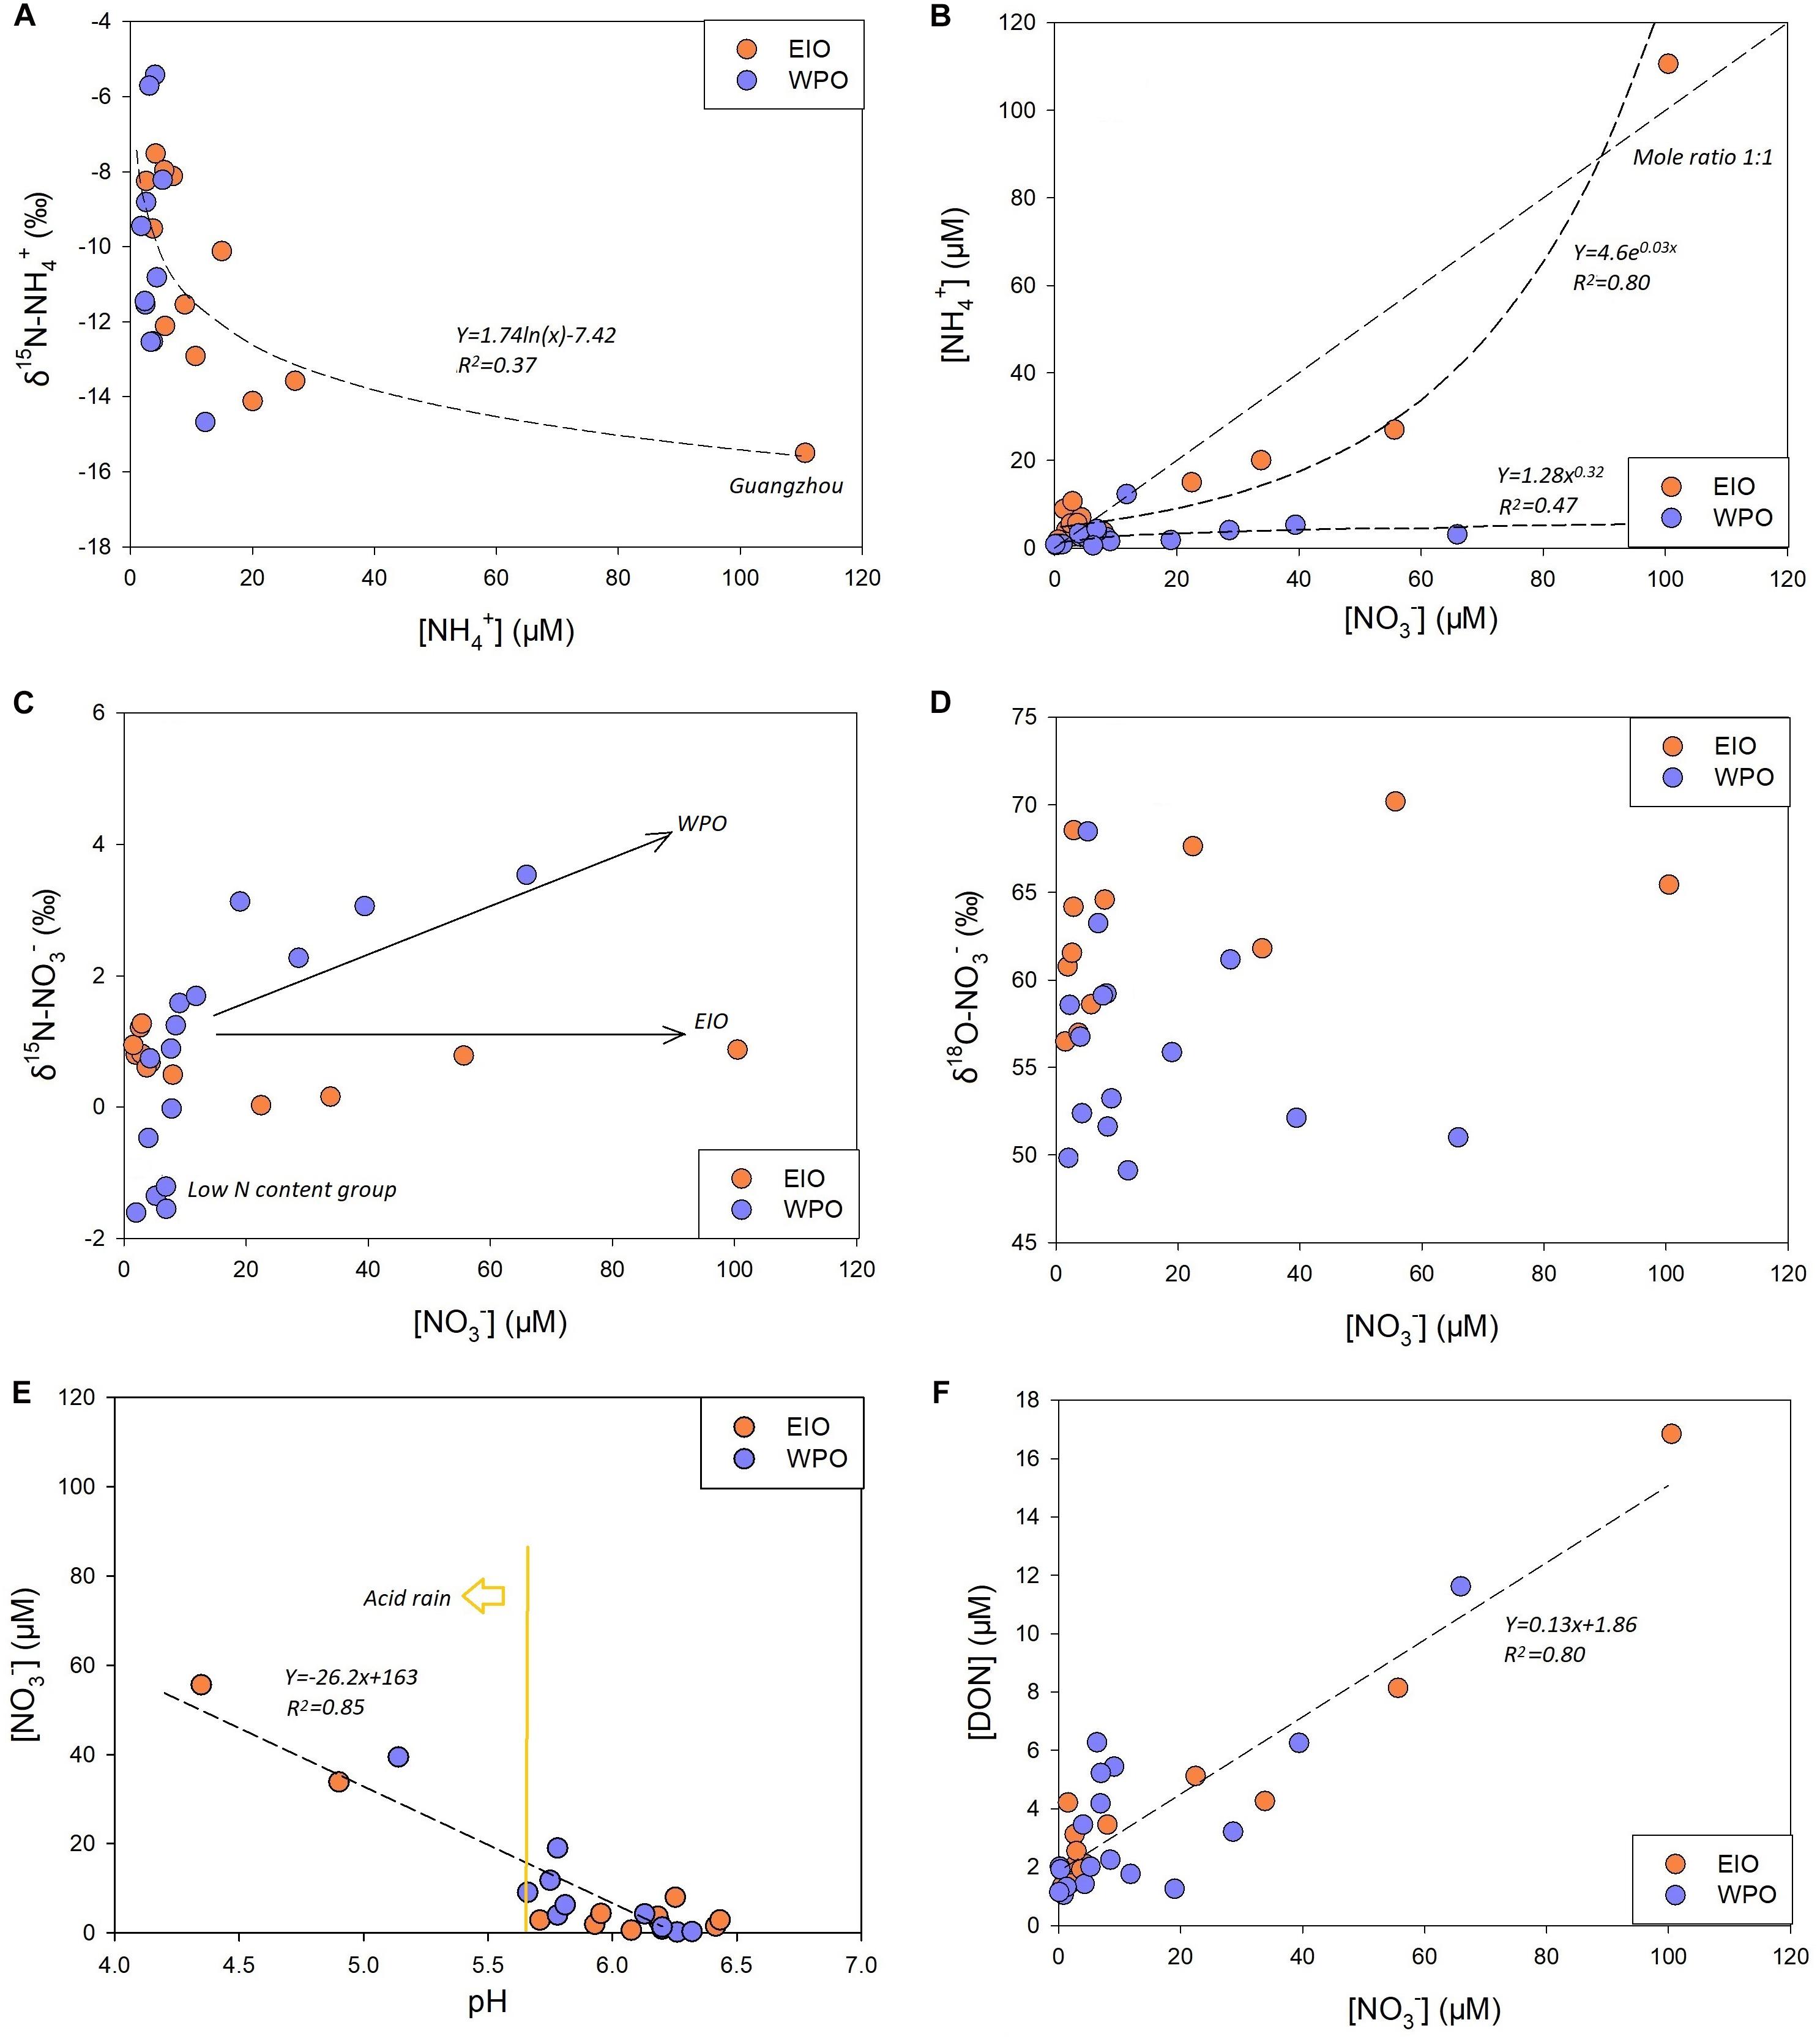
Figure 3. (A) Correlation between NH4+ concentration and δ15N–NH4+. (B) Correlation between NH4+ and NO3– concentrations in rainwater, showing significantly different curves between two oceans. (C,D) The insignificant trend between NO3– concentration and δ15N/18O–NO3–. (E,F) Correlation between pH/DON and NO3– concentrations in rainwater from two oceans.
For NO3– concentration, it varied from 0.6 to 55.6 μM in the EIO apart from the highest level at Guangzhou (100.5 μM). During the WPO cruise, NO3– concentration ranged from 0.5 to 66 μM. High-level NO3– spatially co-occurred with NH4+ enrichments (Figure 2). In the EIO, an exponential increase was obtained between NH4+ and NO3– concentrations (Figure 3B), whereas rainwater samples in the WPO were comparatively enriched of NO3– than NH4+, suggesting a potential reduction of terrestrial NH4+ inputs. Under the low pH condition, the NO3– content in wet precipitations was likely in the chemical form of HNO3 (Figure 3E). For δ15N–NO3–, it varied from 0.03 to 1.3‰ in the EIO and from -1.6 to 3.5‰ in the WPO (Figure 2), whereas the linkage between δ15N–NO3– and NO3– concentrations was variable among two oceans (Figure 3C). An insignificant linkage was obtained between δ18O–NO3– and NO3– concentrations (Figure 3D).
NO2– was the minor portion in the rainwater DIN inventory, likely due to the rapid transformation from NO2– to nitric acid. The concentration of NO2– in both EIO and WPO was frequently < 1 μM. For DON, it varied from 1.4 to 16.9 μM during the EIO cruise and from 1.1 to 11.6 μM during the WPO cruise (Figure 2). In addition, a significantly linear correlation was identified between DON and NO3– concentrations in rainwaters from both oceans (Figure 3F). Based on the N compound compositions and concentrations (Figures 4A,B), the rainwater in the EIO and WPO was assigned into three clusters (the Euclidean-distance similarity), namely, the low N (<7.8 μM in the EIO, <4.1 μM in the WPO), moderate N (11.6–17.2 μM in the EIO, 8.7–18.6 μM in the WPO), and high N groups (>17.3 μM in the EIO, >18.7 μM in the WPO). The RDA also identified the variation of N inventory among different groups during two cruises (Figures 4C,D).
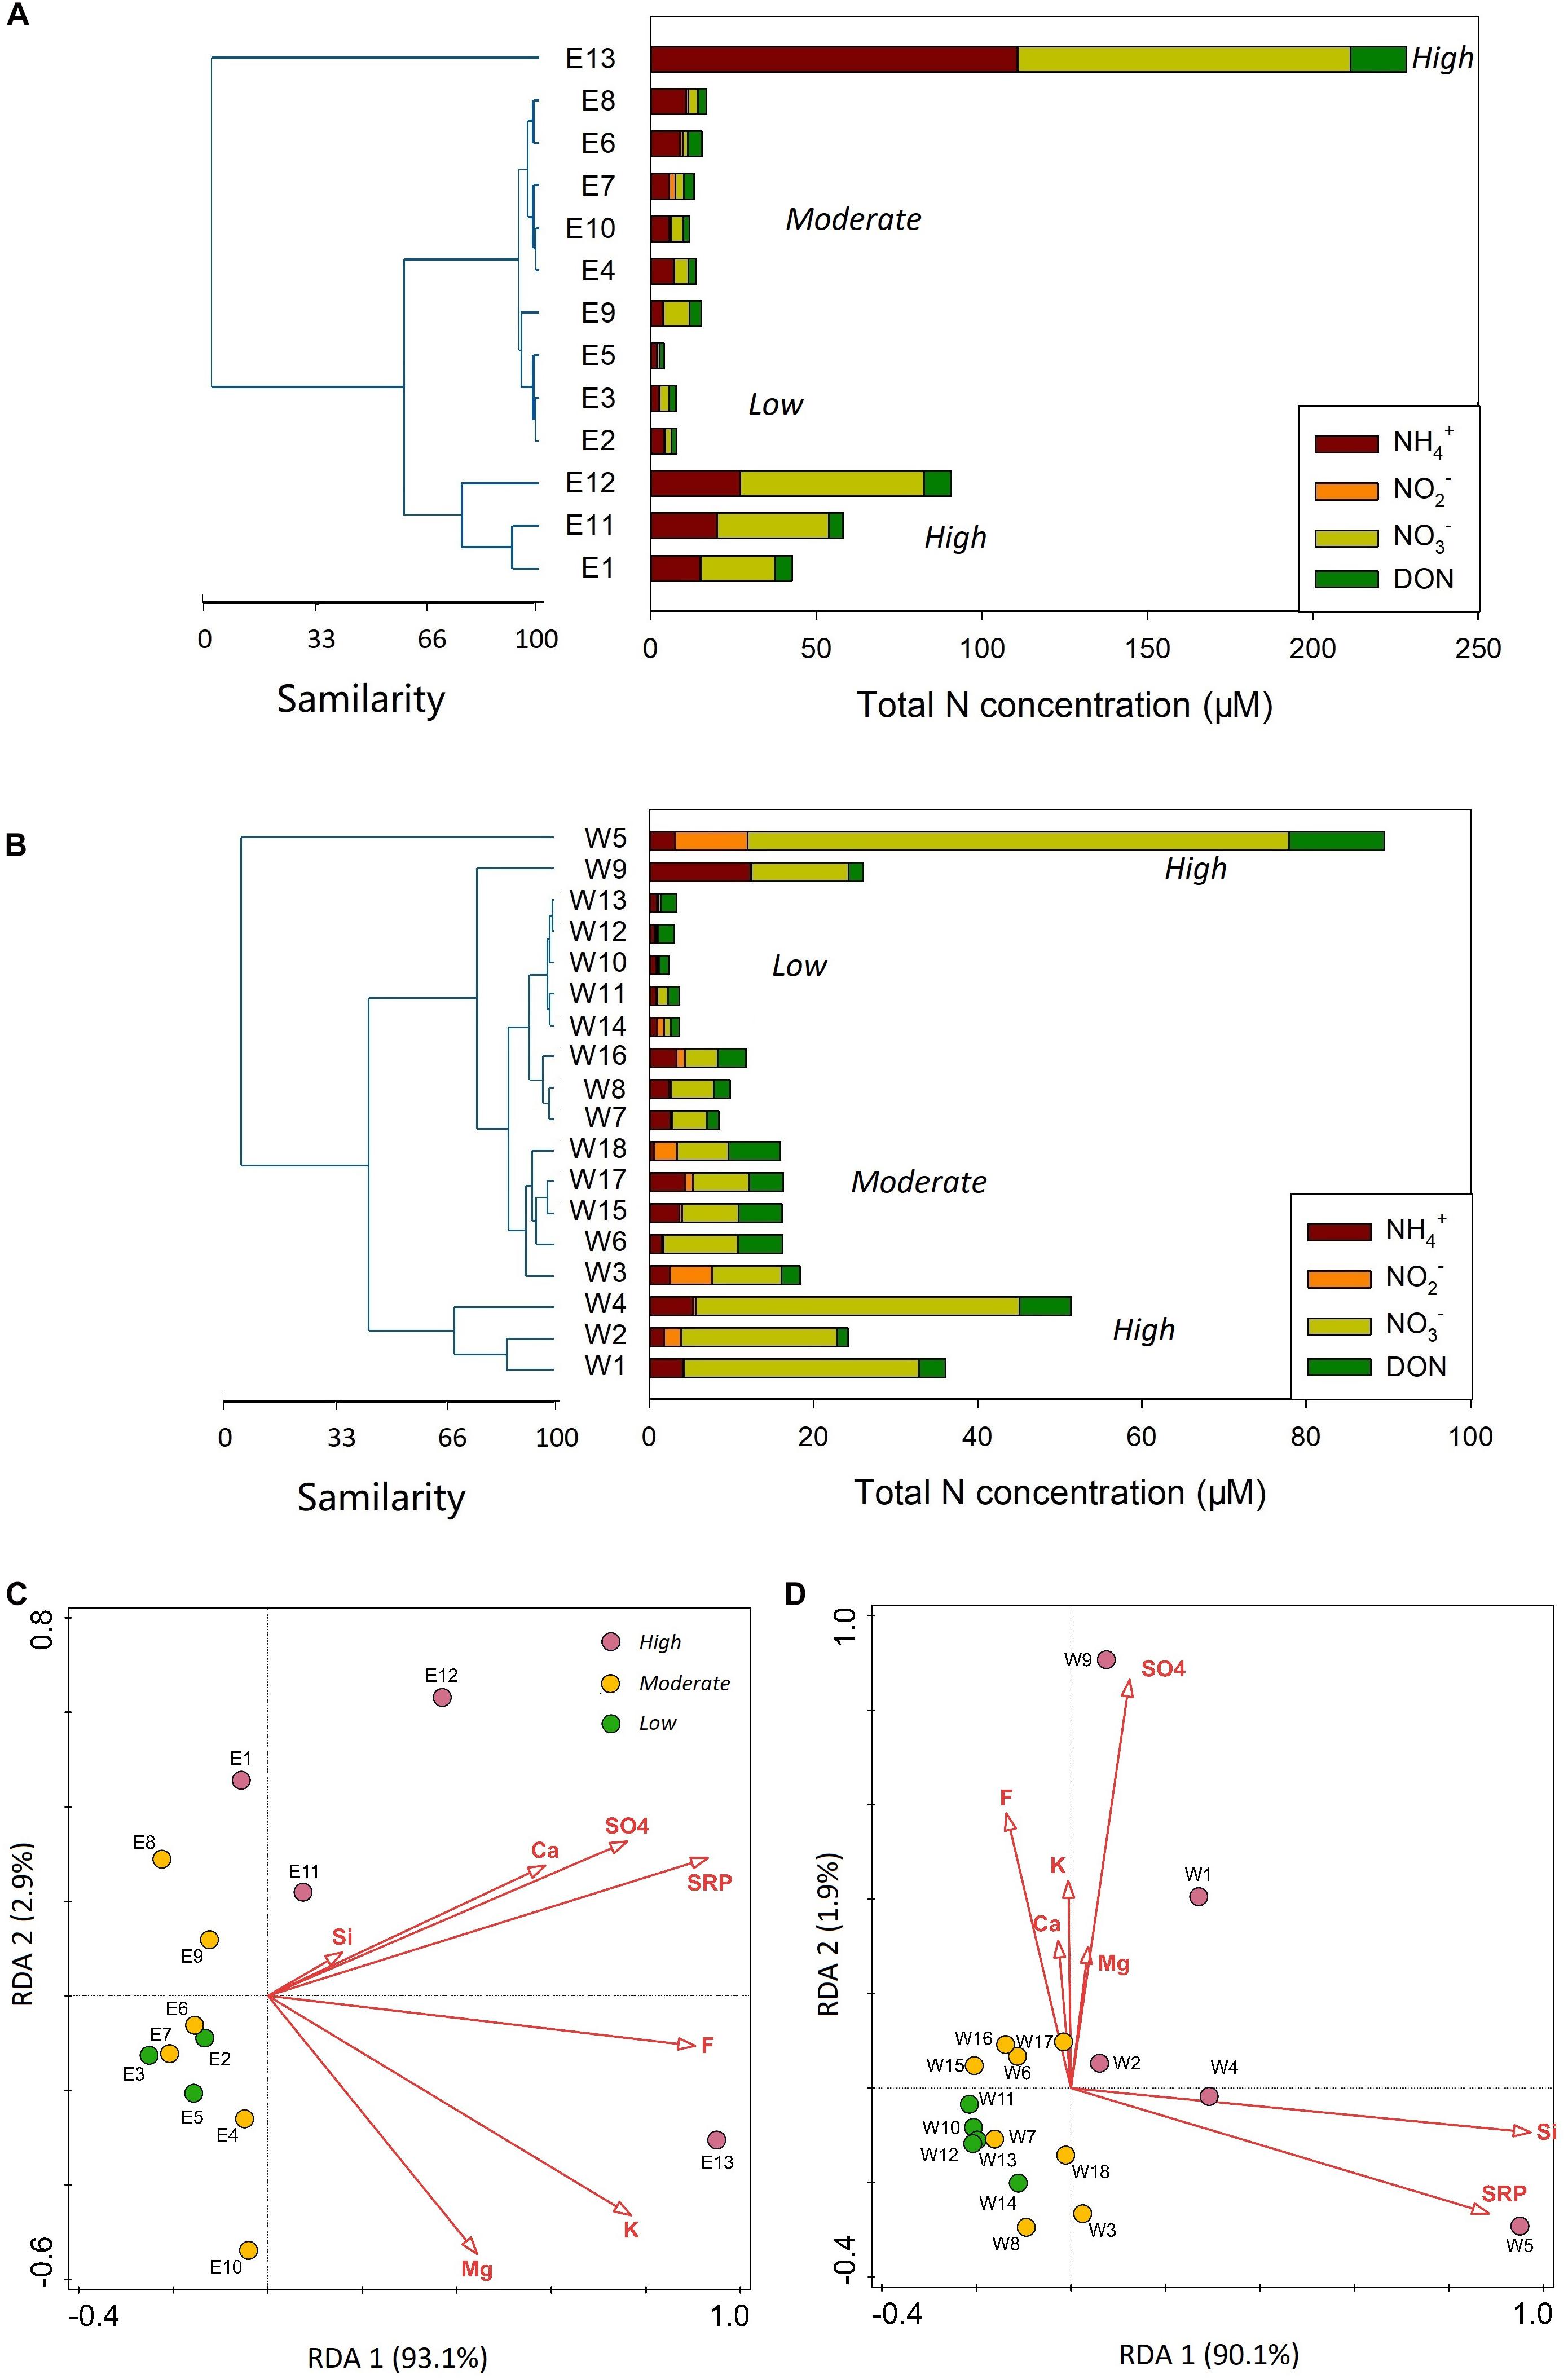
Figure 4. (A,B) Cluster analyses for rainwater samples from both EIO and WPO based on concentrations of different N species. In both cluster analyses, three clusters are identified, namely, the low N, moderate N, and high N groups. (C,D) RDA results for the EIO and WPO rainwater samples, highlighting the difference among the low, moderate, and high N groups.
P Species and Dissolved Si
For SRP and DOP, the concentration in rainwaters was frequently below 1 μM (Table 1). Apart from NO2– content, positive correlations among SRP/DOP and N species were observed in both oceans (Table 2), especially for the high N groups and P species (Figures 4C,D). Dissolved Si accounted for a low level in rainwater compared with N content. The highest concentration was 2.3 μM, whereas the remaining was <1 μM (Table 1). Such low-concentration P and Si contents led to stoichiometric N-redundancy in all samples based on the Redfield–Brzezinski ratio plot (N:Si:P = 16:16:1; Figure 5A).
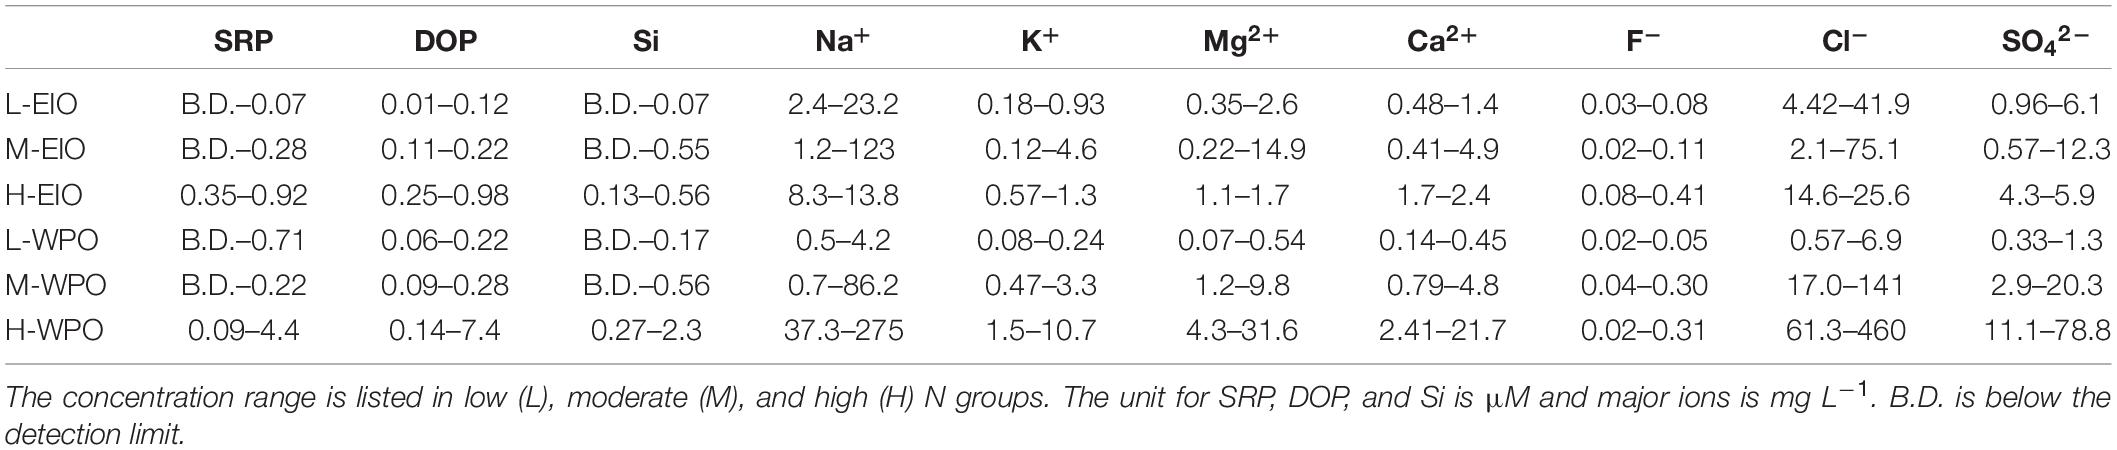
Table 1. Range of phosphorus, dissolved silicate, and major ions in rainwater collected from two cruises.
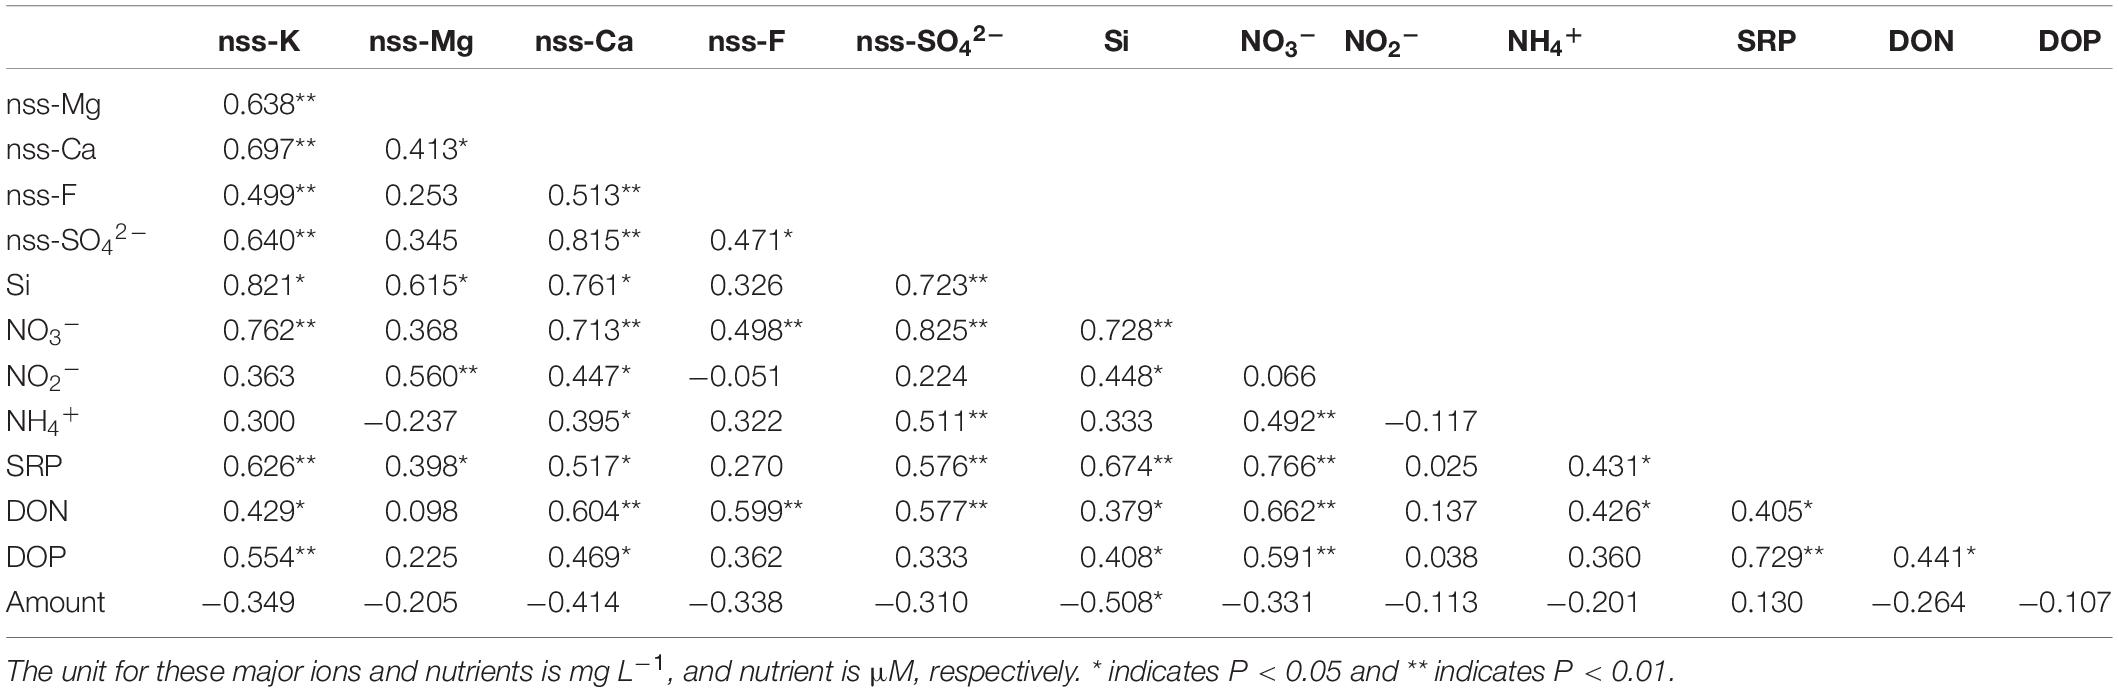
Table 2. Coefficients from Spearman’s rank correlation tests between non-sea salt fraction of major ions and nutrients, as well as precipitation amount (mm) in rainwater.
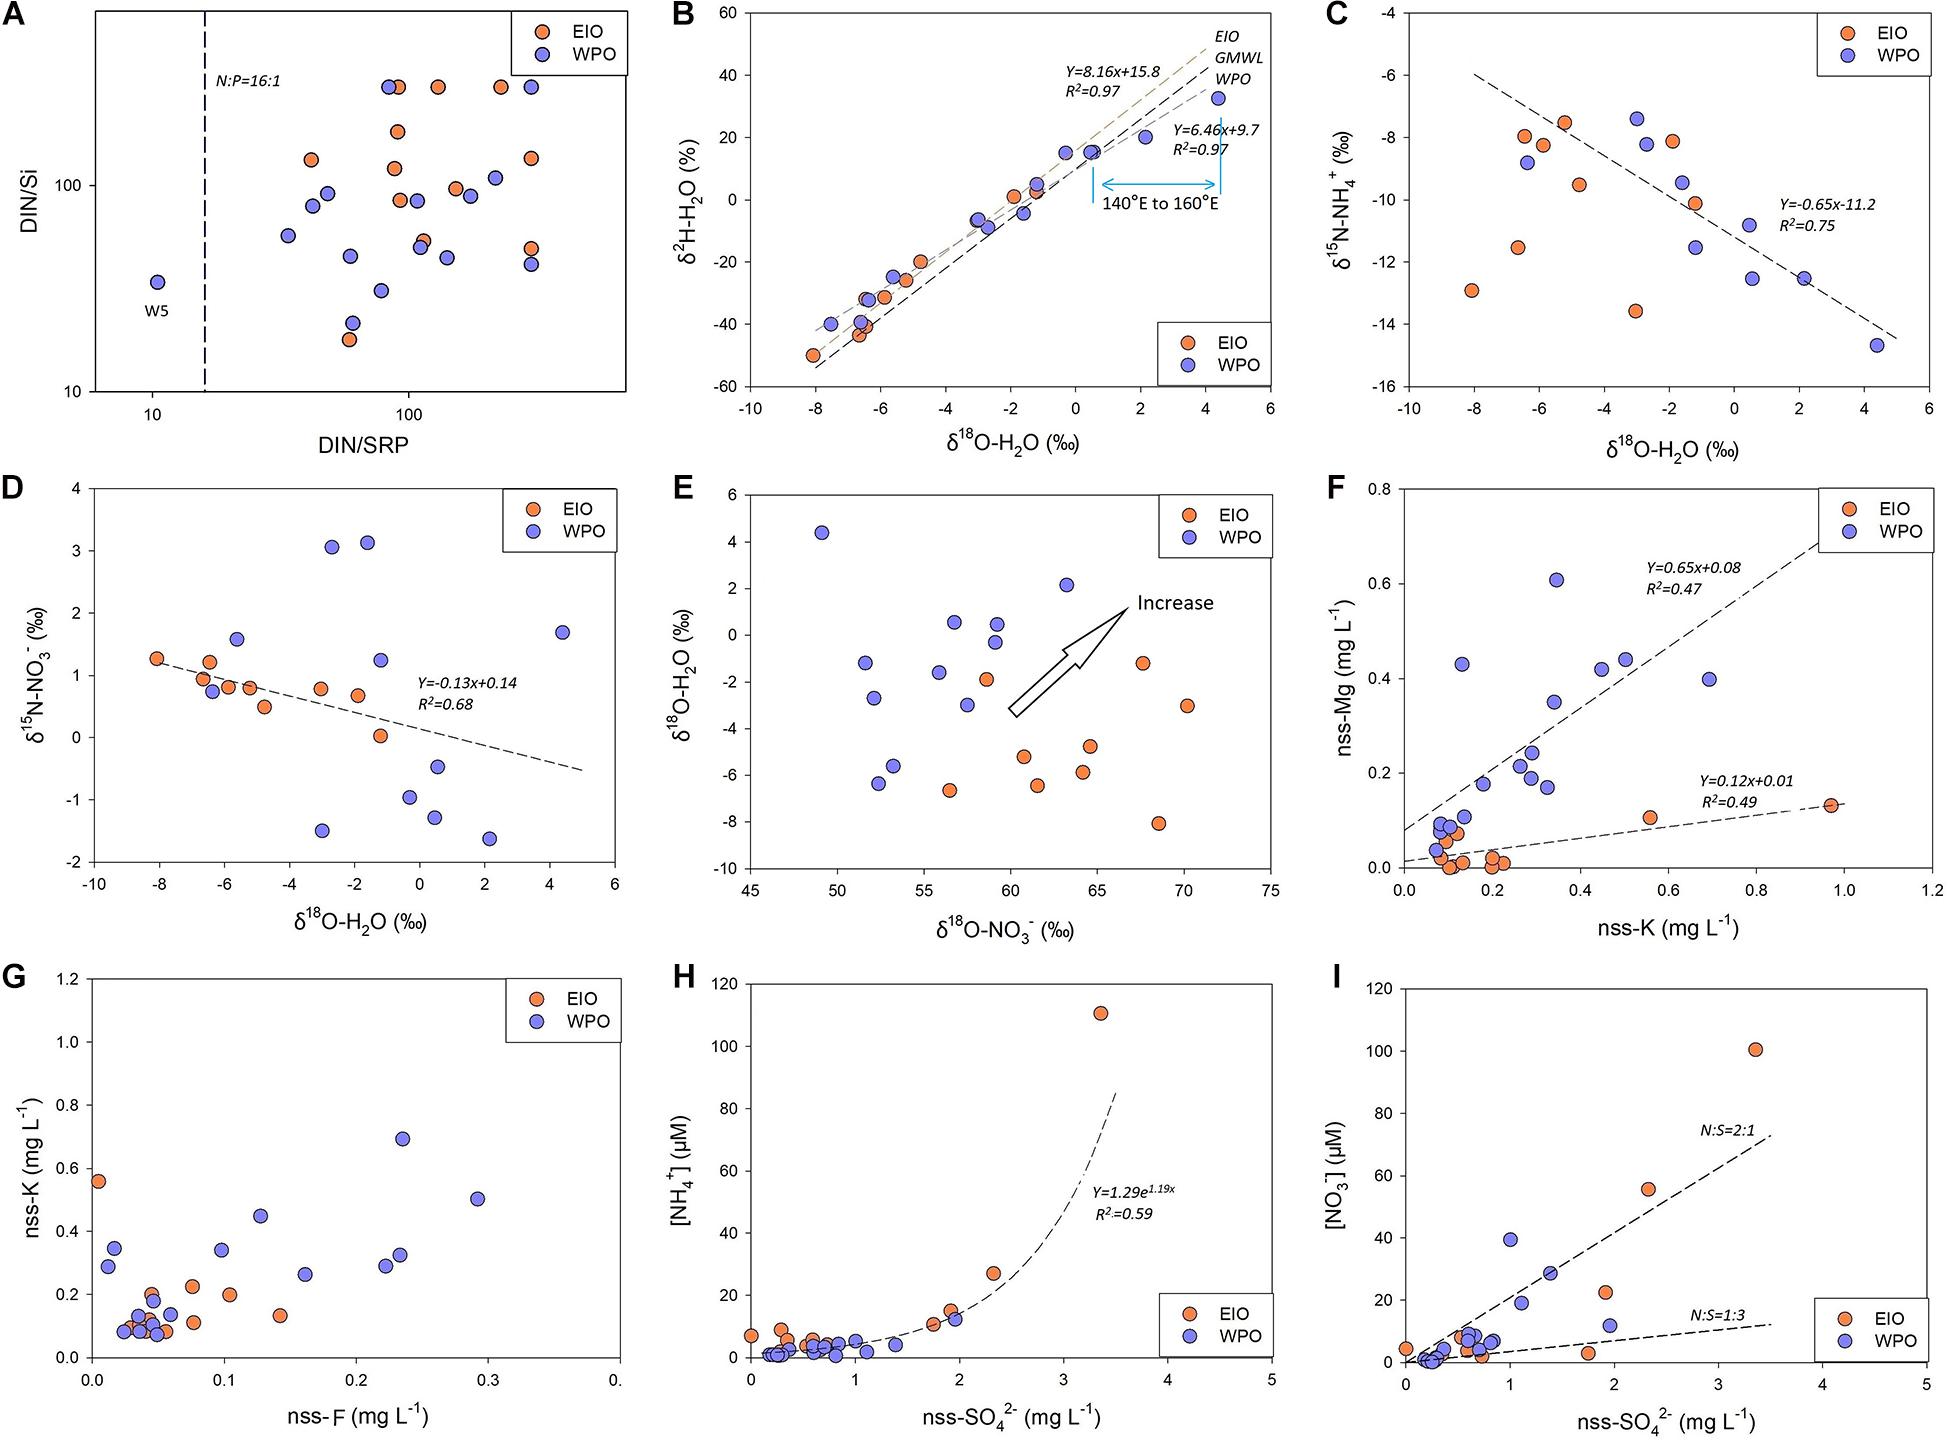
Figure 5. (A) The comparison between DIN:SRP and DIN:Si. Most sites are characterized as P-limitation, and W5 site is characterized as Si-limitation based on the Redfield–Brzezinski ratio. (B) The correlation between δ2H–H2O and δ18O–H2O in rainwaters. GMWL is the global meteoric water line with a slope of 8 and an intercept of 10. Different curves are found in the EIO and WPO. (C,D) δ15N–NH4+/δ15N–NO3– and δ18O–H2O from samples obtained in the WPO and EIO, respectively; it shows the regression curve between δ15N–NH4+ and δ18O–H2O in the WPO (C), as well as δ15N–NO3– and δ18O–H2O in the EIO (D). (E) δ18O–NO3– vs. δ18O–H2O in both EIO and WPO, highlighting the increasing trend. (F,G) Correlations between nss-K+ and nss-Mg2+/nss-F– concentrations. (H,I) Correlations between NH4+/NO3– concentration with nss-SO42–.
Water Stable Isotopes
δ2H–H2O and δ18O–H2O in oceanic rainwater were significantly linearly correlated (Figure 5B). In the EIO, the slope (8.2) of the regression curve was similar to the global meteoric water line (GMWL, slope 8), whereas the intercept (15.8) was much higher (GMWL, intercept 10). In contrast, in the WPO, both slope (6.5) and intercept (9.7) of the curve were slightly smaller than those of the GMWL. Such difference suggests the variability of hydrologic cycle between seawater and atmospheric water vapor in the EIO and WPO. In addition, significant correlations were found between δ15N–NH4+ and δ18O–H2O in the WPO, as well as δ15N–NO3– and δ18O–H2O in the EIO (Figures 5C,D). For δ18O–H2O and δ18O–NO3– (Figure 5E), the plot clearly separated rainwater samples from two oceans though δ18O–NO3– in rainwater samples likely increased with δ18O–H2O enhancements.
Major Ions
Na+ was the most abundant cation in the rainwater. The concentration in the rainwater collected from the EIO ranged from 1.2 to 123 mg L–1 (Table 1). In the WPO, Na+ concentration varied between 0.5 and 275 mg L–1. The highest level of Na+ was obtained in the moderate and high N groups, with a similar distribution pattern of K+, Ca2+, and Mg2+ (Table 1). In the WPO, the Cl– concentration in rainwater reached 460 mg L–1, much higher than the level of SO42– and F–. After removing the sea salt in rainwater based on the standard seawater composition (Zhang et al., 2011), the concentrations of non-sea salt (nss) K+, Ca2+, Mg2+, SO42–, and F– markedly decreased (e.g., Figures 5F,G). Several nss-cations and nss-anions were correlated, e.g., F– vs. K+ and SO42– vs. Ca2+ (Table 2). More importantly, the enrichment of nss fractions varied between the EIO and WPO. In particular, both nss-Mg2+ and nss-F– were relatively enriched in the WPO. Significant correlations were also obtained between nss-ions and nutrient species (Table 2), such as the exponential increase between nss-SO42– and NH4+ (Figure 5H). Notably, the mole ratio between NO3– and nss-SO42– in the EIO and WPO frequently ranged between 1/3 and 2, whereas the ratio in three sites was >2, indicating nss-SO42– as the dominant solute in acid rains (Figure 5I).
Discussion
Wet Deposition N in the EIO
In the EIO, high atmospheric temperature (>26°C, Supplementary Figure S3) accelerated the seawater evaporation and introduced 13 precipitation events. Given the variability of rainwater N inventory, low, moderate, and high N clusters were identified (Figure 4A). The low-level N group includes three sites with the lowest content found in the remote ocean (E5 in Figure 1A), where received west-direction wind. At the E5 site, NO3– and NH4+ were key species in N inventory, but their concentrations were <3 μM. The west wind also produced the remaining two low-level N sites near the coast of Sumatra Island (E2 and E3). Low concentrations of N species in these sites are comparable to observations made in other oceanic environments, such as the record made in the North Pacific Ocean and the Bermuda Island (Figure 6). In the low-level group, the concentrations of nss-cations and nss-anions were also frequently <2 mg L–1, which was 1–2 orders of magnitude lower than the measurement at Guangzhou (E13 in Figure 1A), further suggesting a minor influence from terrestrial sources (e.g., coal combustion and agriculture emission, sketch in Figure 7). Consequently, NH4+ in the low N group can be assumed to be the product of NH4+ emission from the surface seawater, whereas NO3– mainly resulted from lighting fixation (Figure 7). The δ15N–NH4+ directly supports that NH4+ in the low N group derived from oceanic surface water emission was the main source of NH4+. In particular, δ15N–NH4+ in the surface seawater was approximately -0.5‰ (Hoch et al., 1994). Accordingly, the oceanic emission of δ15N–NH4+ was found to be -0.5 to -9‰ (Lin et al., 2016), as highlighted in Supplementary Figure S4. Due to the positive correlation between temperature and emitted δ15N–NH4+ (Elliott et al., 2019), δ15N–NH4+ derived from oceanic emission in equatorial regions tended to be higher in this range, which fitted our observation in the remote ocean. Furthermore, lighting fixation may also produce a small quantity of NH4+ via the combination between N and H molecules (NOAA site)2. δ15N–NH4+ produced from nitrogen gas (N2) via lighting fixation is still approaching 0, which could not significantly change the δ15N–NH4+ in oceanic environments. By contrast, δ15N–NH4+ from volatilized fertilizer [e.g., (NH4)2SO4, NH4Cl] frequently hosts a more negative isotope value (dropping to -56‰; Pan et al., 2018). In addition, during the atmospheric transport from inland to remote oceans, terrestrial NH4+ could be easily loosed during the long-range transport (Lin et al., 2016), and δ15N–NH4+ tends to be decreasing due to the “washout” of heavy isotopes from aerosols (Agnihotri et al., 2011; Altieri et al., 2014). In the EIO low N group, δ15N–NH4+ was markedly higher than δ15N–NH4+ reported in terrestrial precipitation events, e.g., Toshima, Japan (mean: -25‰, Uchiyama et al., 2017) and Guiyang, China (mean: -15‰; Xiao et al., 2012), also confirming its oceanic origin. In the low N group, the oceanic NO3– is the oxidation product of lighting-produced NO and NO2 (NOx; Altieri et al., 2013). These gas products host δ15N of 0 (Hoering, 1957), indicating that the oceanic δ15N–NO3– should be 0 with a small variation after transformation (Supplementary Figure S4). In these samples, δ15N–NO3– was 1‰, suggesting that the lighting-induced reaction was the dominant source.
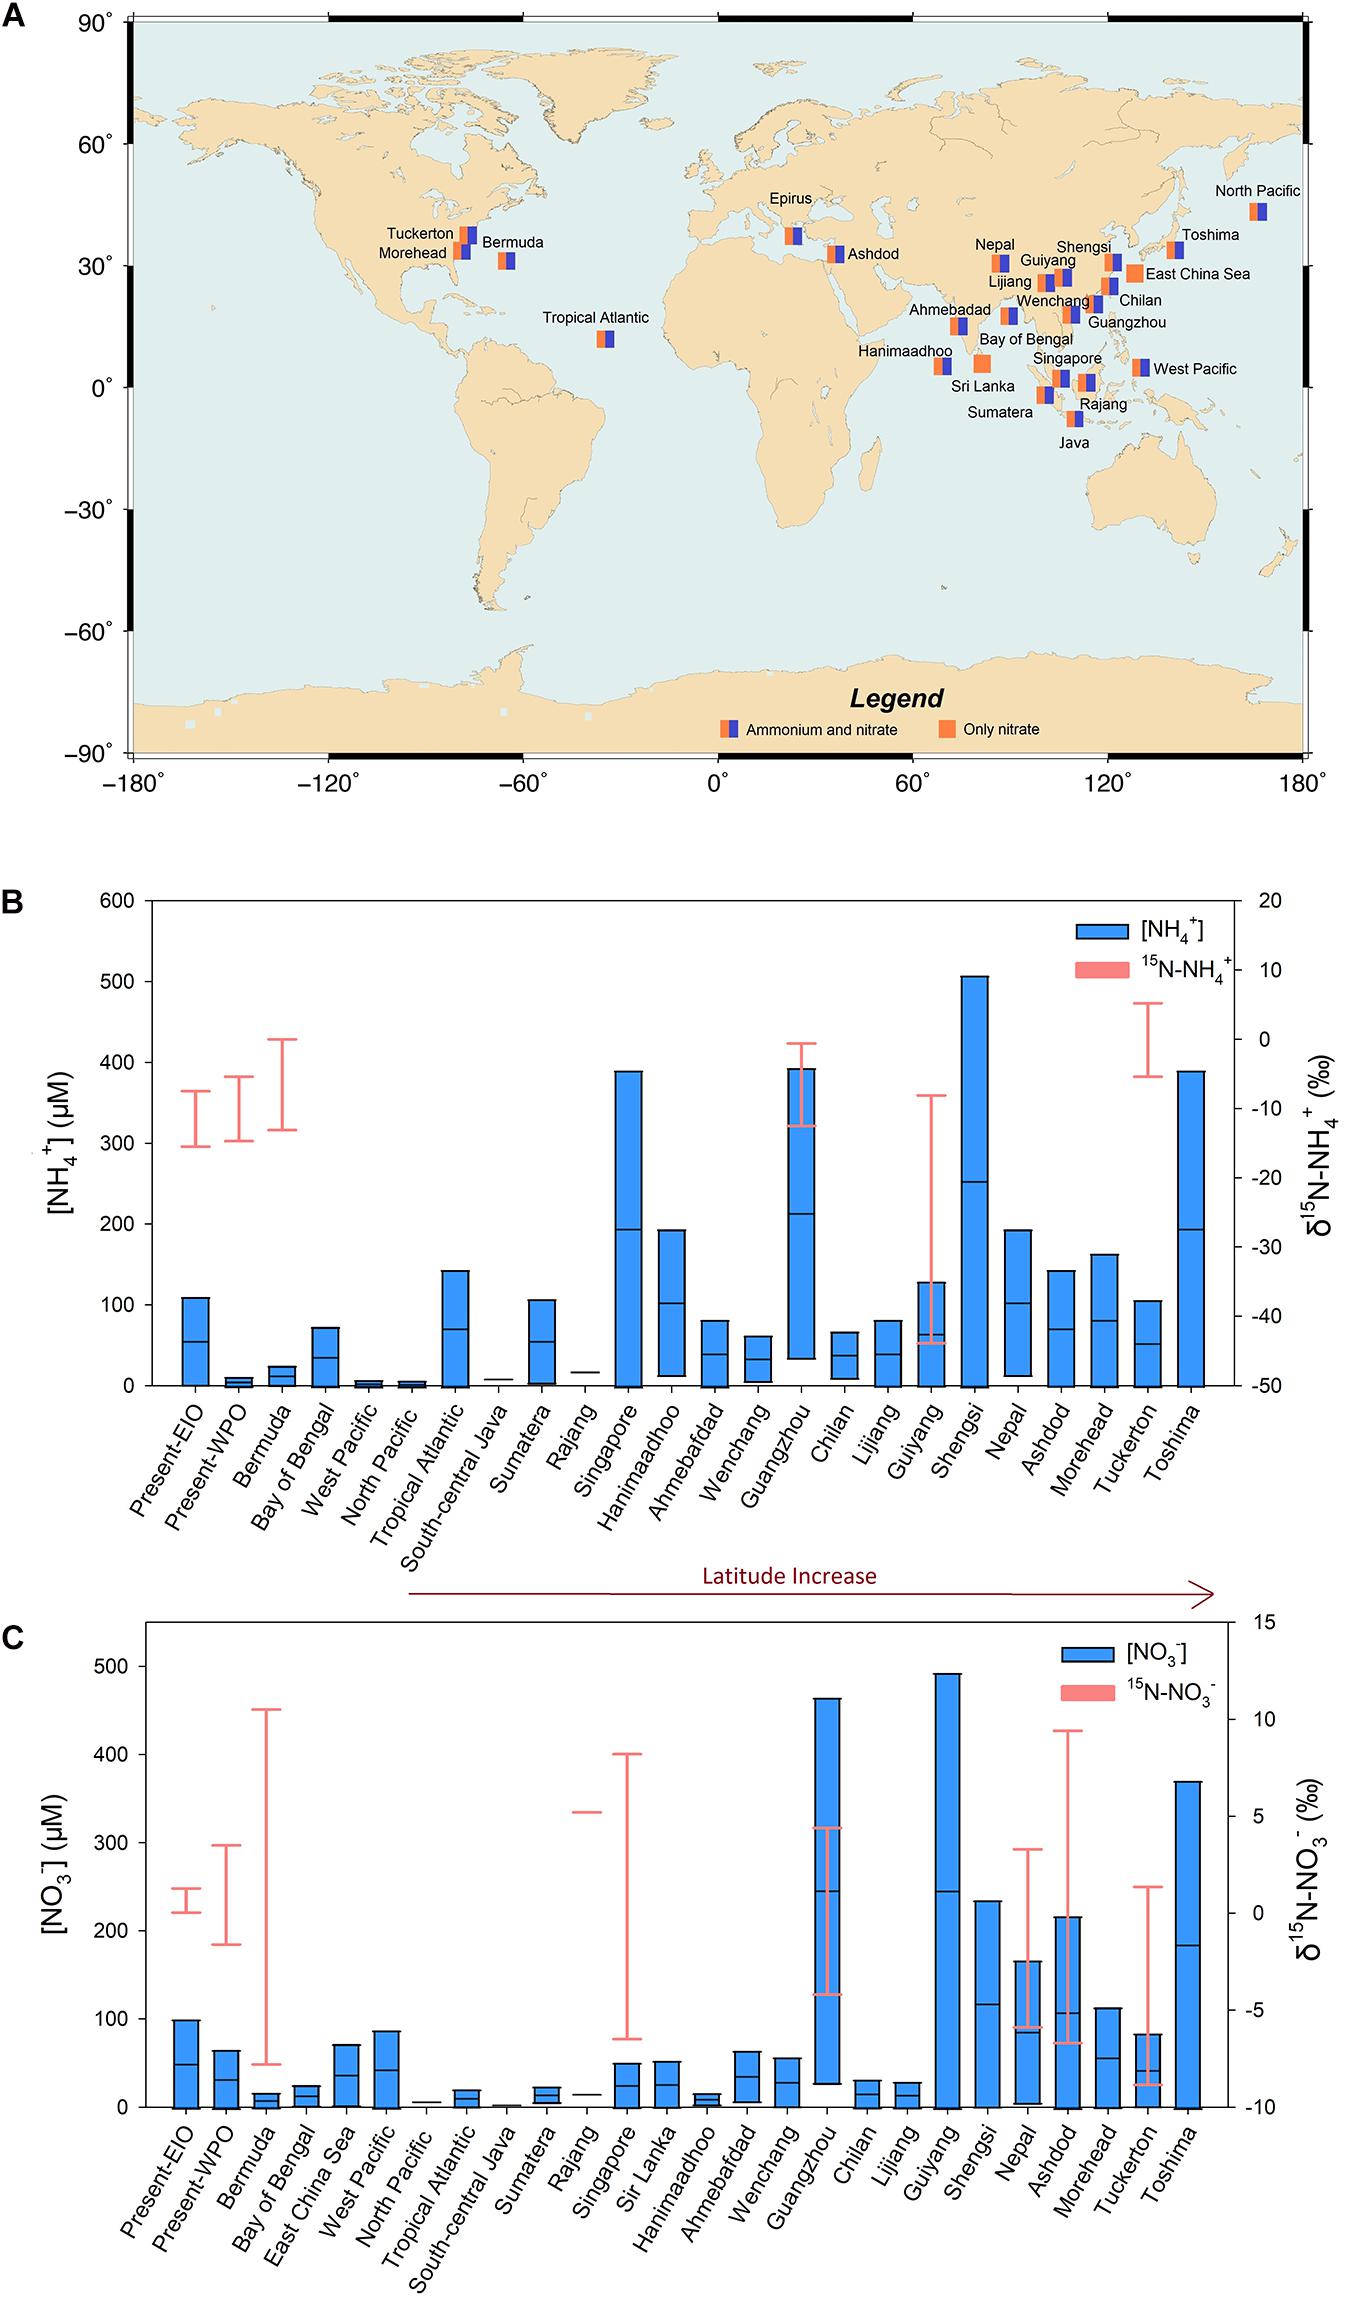
Figure 6. Global comparison of NO3–/NH4+ concentrations and isotopes among different study sites (A: location, B: NH4+ comparison, C: NO3– comparison; detailed references in Supplementary Table S2). The majority of them are around the EIO and WPO. Notably, the NO3–/NH4+ concentration range in the EIO excludes the value obtained from Guangzhou.
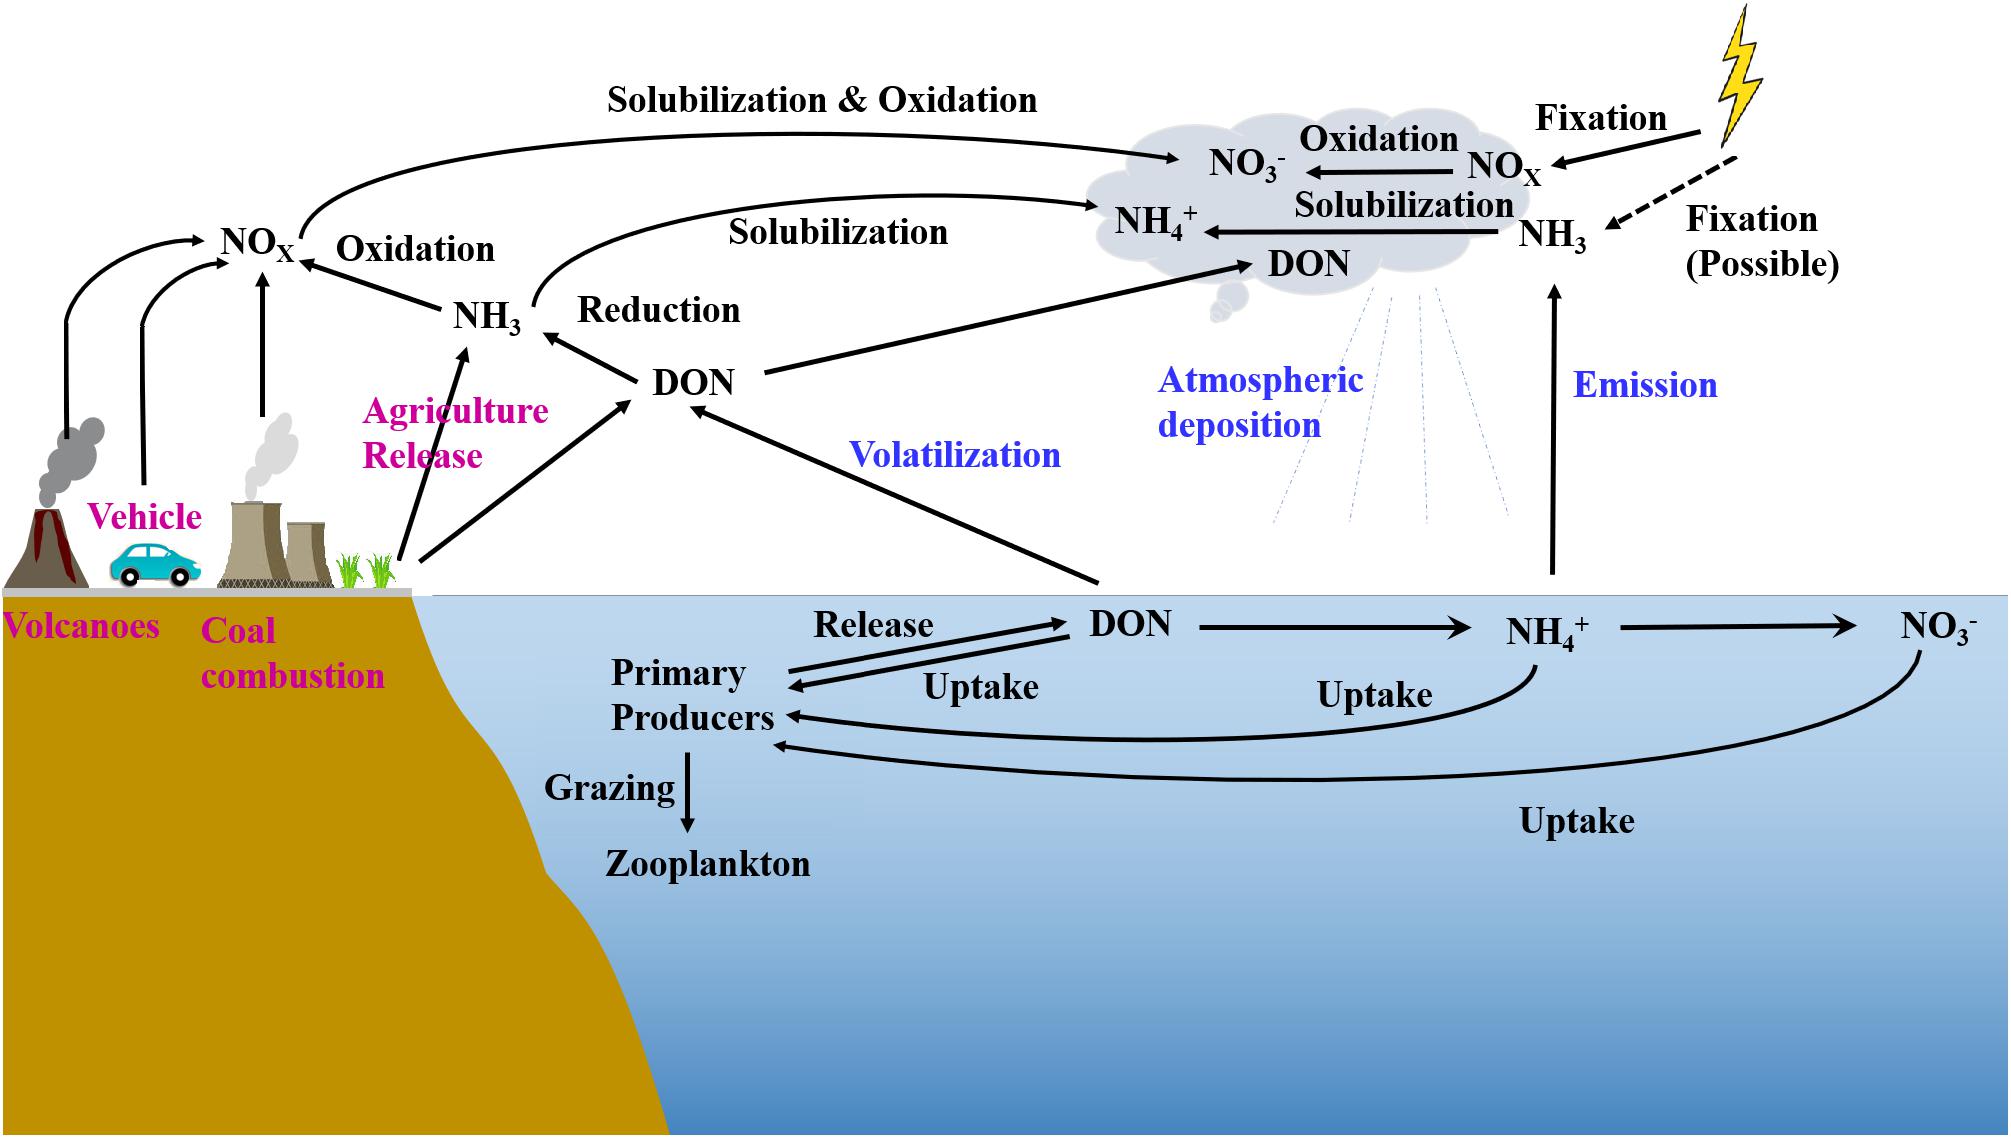
Figure 7. Sketch of N sources, atmospheric transport, and reaction pathways in oceanic precipitation events (modified from Cao et al., 2021).
When sampling sites were approaching the Indian Subcontinent and Malaysian Peninsular (Figure 1A), N concentrations in rainwater samples increased and created the moderate and high N concentration groups (Figure 4A). The NH4+ concentration is similar to the rainwater collected from the Bay of Bengal (Figure 6). Such high-level NH4+ is beyond the requirement of neutralization (NH4+ to neutralize nss-SO42– and NO3–; Supplementary Figure S5) when ammonium available index (AAI) is introduced (Szép et al., 2018). Large AAI indicates the excessive NH4+ from intensive human activities (Szép et al., 2018). Concurrently, nss-ions, e.g., Ca2+ and K+, also markedly increased, suggesting the input from terrestrial materials into the rainwaters (Martino et al., 2013). In particular, Ca2+ was the byproduct of coal combustion in India (Singh et al., 2007), whereas K+ was identified as the product of biomass burning (Srinivas et al., 2011). Accordingly, the increase of NH4+ concentration in rainwater was deemed to be responsible for anthropogenic activities. Given the isotopic information, atmospheric NH4+ likely resulted from several activities. The fertilizer volatilization is assumed to be a key factor for atmospheric NH4+ (Xiao et al., 2020). In the Indian Subcontinent, a significant amount of chemical fertilizer, e.g., urea, NH4Cl, and (NH4)2SO4, is intensively applied to enhance the yield. For instance, the 16.9 million tones N yr–1 fertilizer was applied to the Indian farmland in 20143 and the application amount kept increasing in the recent 20 years. The fertilizer application in China is also prominent. The redundant NH3 in soils is easily volatilized into the atmosphere coupled with the high temperature and air humidity (Sommer et al., 1991). In addition, approximately 45% of fertilized urea was transformed to NH3 and then increased atmospheric NH3 concentration (Trierweiler and Bishop, 1983). In the atmosphere, with the combination of acid materials, such as H2SO4 from petrochemical industry, steelmaking, thermo power stations, and volcanic activities (Martino et al., 2014), NH3 is transformed to NH4+ (Jia and Chen, 2010). The positive increase in both sulfide and NH3 led to the accumulation of atmospheric NH4+ (Figure 7), which, in turn, increased NH4+ concentration in the wet deposition. Apart from agriculture, traffic (vehicle exhaust) was also a significant source of atmospheric NH4+, which increased δ15N–NH4+ in precipitations (Chang et al., 2016) due to the significant positive values (Supplementary Figure S4). In the surrounding coasts, the 1.5 billion population in India, Bangladesh, Thailand, etc., could be a key contributor of fossil fuel NH3 via daily transport. Notably, based on the logarithmic decay between NH4+ concentration and δ15N–NH4+ (Figure 3A), the contribution from chemical fertilizer seemed to be stronger than that of vehicle exhaust on the rainwater NH4+ enrichment, indicating the necessity of fertilizer application regulation and management.
Different from NH4+, the increase of NO3– concentration in the moderate group did not significantly influence δ15N–NO3– and δ18O–NO3– in the EIO (Figures 3C,D), indicating multiple sources for terrestrial NO3– in these precipitation events (Supplementary Figure S4). Notably, human activities could not directly introduce NO3– but add the precursor of NO3–, i.e., NOx, into the atmosphere (Figure 7). NOx is rapidly transformed to NO2– in humid environment. Due to the instability of NO2– and the presence of O3, the majority of NO2– could be transformed to NO3– (Elliott et al., 2019), typically as the nitric acid under low pH condition (e.g., low pH conditions in Figure 3E). The combustion of fossil fuels, mainly as gasolines from vehicles, is a significant source of NOx. Anthropogenic NOx is usually positive in δ15N, ranging from 3.7 to 13‰ (Jia and Chen, 2010) and from 5 to 25‰ (Felix et al., 2015). In contrast, NOx from soil microbiota is usually negative in δ15N (-20 to -50‰; Felix et al., 2015) due to the preferential utilization of 14N compounds in metabolism (Harrison et al., 2007). In addition, thermo power plants, especially in India, also markedly contribute to anthropogenic NOx emissions (Ghude et al., 2012). Coupled with north direction wind (Figure 1 and Supplementary Figure S1), the terrestrial NOx is transported along the meridional direction into the equatorial EIO, as evidenced by the significant correlation between δ15N–NO3– and δ18O–H2O (Figure 5D). On the other hand, the intensive chemical fertilizer triggered active nitrification and denitrification in terrestrial soils, especially in the Indo-Gangetic Plains where intensive agriculture has been conducted (Ghude et al., 2012), leading to an active production of NOx (Pathak et al., 2002). This clearly introduces biological NO3– in the rainwater N inventory. Accordingly, the mixing of these sources likely compensates the isotopic variation of NO3–, leading to the distribution pattern observed in Figures 3C,D. When the samples were collected in coastal zones (<1 km distance), such as the Malacca Strait and Guangzhou, China (Figure 1A), the influence of anthropogenic activities peaked (both soil emission and fossil fuel combustion; Supplementary Figure S4), producing high-level N compounds, as well as nss major ions (e.g., SO42–). The increase of these compounds markedly decreased rainwater pH (Figure 3E) and further accelerated the transformation from NH3 to NH4+ and from NOx to NO3–, eventually leading to the significant enhancement in NH4+ and NO3– in precipitation.
Wet Deposition N in the WPO
Similar with the EIO, three categories in the WPO were observed (Figure 4B). The low N group was obtained in the east boundary of the sampling area, where received east trade wind driven by the Hadley Circulation (Supplementary Figure S1). Both NH4+ and NO3– concentrations in the low N group were < 2.7 μM, which was highly comparable to the record in the EIO (Figure 4A vs. Figure 4B). In addition, the nss portion of ions in the low N group between oceans was similar (cf. Figures 5F,G). Accordingly, marine sourced N should be identified as the dominance in these samples. In the low N group, δ15N–NH4+ varied between -10 and -6‰, which was in line with the range found in the EIO samples (Figure 3A), as well as the range (-0.5–9‰) in the Atlantic Ocean (Lin et al., 2016), reinforcing that the seawater emission can be identified as the major source of NH4+ in oceanic samples. For NO3– in the WPO low N group, both δ15N–NO3– and δ18O–NO3– were more negative (–1.5–0) compared with the EIO, indicating a potential difference during the transformation of NOx to NO3– in atmospheric environments.
Apart from influence from “isotope washout” during long-range transport, as a reaction mainly oxidized by O3 (Altieri et al., 2013; Elliott et al., 2019), the concentration of O3 might be a key for the NO3– isotopic signature. Between two oceans, the hydrologic cycle impacted by the Walker Circulation deeply influences atmospheric O3. In particular, the water stable isotopes (δ2H–H2O vs δ18O–H2O) usually decrease from the equatorial ocean to high-latitude oceans (Field et al., 2010). The slope and intercept of the regression line is a mirror of hydrologic cycle on a local scale (Vallet-Coulomb et al., 2008). Compared with the EIO, small values in regression slope and intercept were found in the WPO (Figure 5B), indicating the unsteady isotopic fractionation during the precipitation (Gat, 1996). This unsteady state is linked to the environment characterized as evaporation with strong ascending air, termed as “sub-cloud secondary evaporation” (Xia et al., 2019). These sites with δ18O–H2O > 0 also appeared in the WPO (Figure 5B), adding the evidence of ascending air flow in tropical systems (e.g., Gonfiantini et al., 2001; Vallet-Coulomb et al., 2008). In the WPO, such environment settings result from the Walker Circulation, which continuously pumps moisture from the warm pool into the atmosphere (Stechmann and Ogrosky, 2014). This ascending flow likely dilutes the atmospheric O3 in the turbulently mixed sublayer, as the low-level O3 from 0 to 2 km altitude in the tropical Pacific Ocean (Singh et al., 1996). According to the dynamic balance between NOx and O3 (Elliott et al., 2019), low-level O3 likely produced a weak oxidation with the preference of 14N compounds (Altieri et al., 2013), hence leading to a more negative value of δ15N–NO3–. In addition, δ18O in O3 ranges from 90 to 122‰ (Johnston and Thiemens, 1997). The reduced reaction potential also decreased δ18O–NO3–, creating a drop of both δ15N–NO3– and δ18O–NO3– in the WPO low N group (Figure 3D), as well as different correlations in water stable isotopes (Figure 5E).
In contrast, the rainwater samples collected from the west boundary of WPO hosted the high concentration of N compounds (Figure 4B). From W1 to W4, the short distance to the Philippines/Indonesia coasts and seaward wind introduced a significant amount of terrestrial materials (Figure 1A), leading to the enrichment of land-derived NH4+ (low-level 15N signals) with the longitude signal (Figure 5C). This west wind that drives the air flow toward the Pacific Ocean center also results from the Walker Circulation (Stechmann and Ogrosky, 2014) and further leads to the increase of NH4+ concentration at sites near New Guinea. Interestingly, though the impacts of anthropogenic influence, the enrichment of NH4+ in the WPO was relatively weak than that in the EIO (e.g., AAI in the WPO < 100%, Supplementary Figure S5). In addition, the NH4+ concentration in aerosol PM2.5 particles detected in the northwestern Philippines was approximately 0.5 μg N–NH4+ m–3 (Bagtasa et al., 2018), which was significantly smaller than the value found in the Bay of Bengal (2.8 μg N–NH4+ m–3; Srinivas et al., 2011). This likely results from variation of chemical fertilizer application during local agriculture activities in the Philippines, Malaysia, and Indonesia. Specifically, in these three countries, the agriculture activities mainly include the rubber and oil palm plantations (Sia et al., 2019), which produce a low-level application of N fertilizer in agriculture compared with South Asia4. However, the requirement on magnesium fertilizer is intensive in peatlands at tropical countries (e.g., Panhwar et al., 2014). As a response, we observed the pattern of low NH4+ enrichment but the high-level nss-Mg2+ in the WPO precipitation events.
Interestingly, NO3– concentrations in the WPO high N group were comparable to the EIO high N group, excluding the Guangzhou site (Figures 3B, 6). However, the total population in the Philippines, Malaysia, and Indonesia is much smaller than that in India, Thailand, and Bangladesh5, indicating a low contribution of NOx to the atmosphere on fossil fuel combustion from economic activities. Accordingly, NO3– concentration in the WPO samples should be significantly reduced. This contradiction might be resulted from the multiple sources of atmospheric NOx from terrestrial systems in Southeast Asia (Li et al., 2020). In particular, the Indonesian volcanic activities are an important source for NOx with δ15N from N gas compounds of 0.1–4.0‰ (Sano et al., 2001), which is similar to the range found in the WPO (Figure 2). During December 2018, the Dungusan Soputan Volcano erupted (Indonesian Geology Bureau)6 and added a significant amount of ashes into the atmosphere (reaching 7,000 m height). The enrichment of nss-F– (easily evaporated element; Figure 5G) in the WPO samples could be a support of the volcanic activities. In addition, croplands in Indonesia are also a hotpot of NOx with a significant annual increase in NOx emission (Takakai et al., 2006). Besides, a significant fraction of peatland in Southeast Asia has been changed to oil palm plantations (Jiang et al., 2019). The releasing rate of N2O from these peatlands is significantly higher (emission factors: 2.4–2.7%) than the IPCC standard on a global scale (1%; Rahman et al., 2019). Though low-level application of chemical fertilizer, the rapid and active production from peatland could contribute to atmospheric NOx. Emissions from the biomass burning, e.g., rice straw burning after harvesting (Bagtasa et al., 2018; Xiao et al., 2020) and forest/peatland fire events induced from high temperature and accidents (Kumar et al., 2019; Szép et al., 2019), are also an unneglectable source for atmospheric NOx. Coupled with west wind driven by the Walker Circulation, the terrestrial NOx is easily delivered into the equatorial WPO. In addition, the volcano activities may also introduce a significant amount of atmospheric nss-SO42– (Martino et al., 2014). Such high-level nss-SO42– drove the acid rain event in the WPO as the SO42––NO3– mixing type (Figure 5I). In the WPO high N group, the W9 site is located in the east boundary of the sampling area (Figure 1A). This sample was collected at Pohnpei, Micronesia, directly receiving the anthropogenic influence. However, the population in Pohnpei is only approximately 35,000. In addition, the manufacture and agriculture activities in Micronesia are less developed, and citizens are mainly dependent on imported food (Connell, 2015). Compared with NO3– and NH4+ in the wet precipitation collected at Guangzhou (Figure 2) and other coastal sites with millions of population residence, e.g., Wenchang, China (Liu et al., 2011) and Toshima, Japan (Uchiyama et al., 2017), the N content in the Pohnpei harbor is minor, reinforcing that the major driver of wet precipitation N inventory is population-based anthropogenic activities instead of latitude effect driven by the Hardly Circulation.
Budget Estimation and Ecological Implications
Compared with the surface seawater in remote ocean, DIN concentrations in the rainwater were frequently higher, indicating a significant influence on ecological structure from precipitation (Zhang et al., 2004). The estimated precipitation amount in the equatorial EIO was approximately 1,900 mm yr–1, whereas it increased to 2,000 mm yr–1 in the equatorial WPO (Béranger et al., 2006). By the mean precipitation rate and the lowest rainwater DIN concentration, the wet precipitation conservatively introduced 66.5 and 47.6 kg N-DIN km–2 yr–1 into the remote EIO and WPO, respectively. Such conservative contribution from wet deposition events is comparable to the WPO dry deposition (132 kg N-DIN km–2 yr–1; Martino et al., 2014). As aforementioned, in the remote ocean, biological fixation and atmospheric disposition are only pathway for the replenishment of N. Biological N fixation is frequently constrained by the input of P and trace elements, such as iron (Großkopf et al., 2012). In the equatorial EIO and WPO, the estimated biological fixation would be <280 kg N km–2 yr–1 (Deutsch et al., 2007), indicating wet depositions in the EIO and WPO as a key N contributor. Coupled with the surface seawater mixing, the deposited DIN could be rapidly diluted and assimilated by phytoplankton communities (Zhang et al., 2004). Excluding the influence from nutrient stoichiometric balance, the completely biological consumption of rainwater DIN could produce 378 and 270 kg C km–2 yr–1 sequestration in the EIO and WPO at the conservative scenarios, respectively. The carbon sequestration capability induced by the wet precipitation could easily go to the magnitude of 2,000 kg C km–2 yr–1 in those regions that received terrestrial materials, such as the area near the Malacca Strait and New Guinea coasts (Figure 1A), which is highly comparable to the estimated results in the continental margin of the East China Sea (1,825–3,650 kg C km–2 yr–1, Zhang et al., 2004).
Currently, the source of DON in the atmospheric wet deposition is still under debate (reviewed by Cape et al., 2011). Terrestrial source is assumed to be significant in many investigations (e.g., Mace et al., 2003 at Cape Grim, Australia; Luo et al., 2018 at North Pacific Ocean). In the present study, based on the tight linkage between DON and NO3– (Figure 3F), a significant portion of DON is estimated to be terrestrial emission. Though DON compounds frequently account for a small portion in the oceanic aerosol and wet precipitation N inventory (Cornell et al., 2001; Matsumoto and Uematsu, 2005; Luo et al., 2018) and the recalcitrant nature, DON in surface oceans might also be important by primary producers after phytodegradation (Deutsch et al., 2007), enhancing the carbon sequestration capability. Apart from stimulation on the growth of primary producers (Paerl, 1985), the enrichment of DIN in the rainwater may also add negative effects to the oceanic ecological system, mainly resulting from the imbalanced stichometry ratio among DIN, P, and Si. In particular, the DIN content was constantly redundant in rainwaters from both EIO and WPO, as outlined in Figure 5A. Such significant N-redundancy might significantly benefit from the growth of N-preference species in oceanic environments (Rocha et al., 2002). In the equatorial EIO and WPO, the dominant phytoplankton species was mainly picophytoplankton, such as Synechococcus and Prochlorococcus (Li et al., 2015; Wei et al., 2019). The in situ incubation in the WPO has revealed an enhancement in the biomass of diatom and dinoflagellates with excessive N loading (Li et al., 2015). Accordingly, the long-term N excess from the wet atmospheric deposition potentially triggers the ecological succession of phytoplankton species, which should receive further attention.
Conclusion
The present study investigated the N inventory in rainwaters obtained from the EIO and WPO. NH4+ and NO3– frequently accounted for the dominant species with highly variable concentrations. Accordingly, three clusters, namely low, moderate, and high N groups, were identified. In both oceans, the sites included in the low N group were located in the remote ocean. Main N sources were oceanic NH4+ emission and lighting fixation (NO3–). In contrast, the sites near the coastal line frequently host the higher N concentrations, especially subject to the west wind driven by the Walker Circulation in the WPO. The enhancement of NH4+ concentration in rainwater resulted from the intensive application of chemical fertilizer and daily transport, especially in EIO surrounding countries. The enrichment of NO3– is deemed to be responsible for the microbial reactions in terrestrial soils and combustion of fossil fuel. Different contributions from these two sources produced variable correlation between NO3– concentration and δ15N–NO3– in rainwaters. Together with the precipitation, 66.5–47.6 kg N km–2 yr–1 could be introduced into the EIO and WPO, respectively, acting as an important source to support the oceanic CO2 sequestration. Notably, compared with N content, SRP and Si in rainwater were relatively insufficient based on the Redfield–Brzezinski ratio. As the major path for the exogenous N input, the wet precipitation likely benefits from the growth of N-preference phytoplankton and eventually modifies the ecological structure in tropical oceans. This deserves further attention from the scientific community.
Data Availability Statement
The original contributions presented in the study are included in the article/Supplementary Material, further inquiries can be directed to the corresponding author/s.
Author Contributions
ShaJ: field survey, laboratory analyses, and data analysis. JJ, YW, and SL: laboratory analysis and data analysis. ShuJ, JW, ZZ, and JZ: field survey and data analysis. JC and YC: data analysis. LW: laboratory analysis. All authors contributed significantly on this manuscript.
Funding
This work was supported by the National Natural Science Foundation of China (41876071, 41876074, 41476065, 41706081, and 41806096) and Scientific Research Foundation of SKLEC (2017RCDW04).
Conflict of Interest
The authors declare that the research was conducted in the absence of any commercial or financial relationships that could be construed as a potential conflict of interest.
Acknowledgments
We dedicate this work to Dr. Jian Li, the Chief Scientist in Shiyan III R/V during the EIO cruise. We appreciate the assistance from crew members in Shiyan III R/V and Kexue R/V during two surveys, as well as Yao Wang, Xiaohui Zhang, Yuxi Ma, Peng Wang, Miao Zhang, and Xunchi Zhu for the preparation of sampling tools. Technical support and suggestions during the laboratory analyses by Guosen Zhang at East China Normal University and Prof. Zhiming Yu at Institute of Oceanology, Chinese Academy of Sciences are greatly acknowledged. We are thankful to reviewers whose comments helped to improve an earlier version of the manuscript.
Supplementary Material
The Supplementary Material for this article can be found online at: https://www.frontiersin.org/articles/10.3389/fmars.2020.600843/full#supplementary-material
Footnotes
- ^ https://giovanni.gsfc.nasa.gov
- ^ https://www.esrl.noaa.gov/gmd/education
- ^ https://ourworldindata.org/fertilizers
- ^ https://ourworldindata.org/fertilizers
- ^ https://data.worldbank.org
- ^ http://vsi.esdm.go.id/
References
Agnihotri, R., Mandal, T. K., Karapurkar, S. G., Naja, M., Gadi, R., Ahammmed, Y. N., et al. (2011). Stable carbon and nitrogen isotopic composition of bulk aerosols over India and northern Indian Ocean. Atmos. Environ. 45, 2828–2835. doi: 10.1016/j.atmosenv.2011.03.003
Altieri, K. E., Hastings, M. G., Gobel, A. R., Peters, A. J., and Sigman, D. M. (2013). Isotopic composition of rainwater nitrate at Bermuda: the influence of air mass source and chemistry in the marine boundary layer. J. Geophys. Res. Atmos. 118, 304–311.
Altieri, K. E., Hastings, M. G., Peters, A. J., Oleynik, S., and Sigman, D. M. (2014). Isotopic evidence for a marine ammonium source in rainwater at Bermuda. Glob. Biogeochem. Cycles 28, 1066–1080. doi: 10.1002/2014gb004809
Bagtasa, G., Cayetano, M. G., and Yuan, C.-S. (2018). Seasonal variation and chemical characterization of PM2.5 in northwestern Philippines. Atmos. Chem. Phys. 18, 4965–4980. doi: 10.5194/acp-18-4965-2018
Baker, A. R., Weston, K., Kelly, S. D., Voss, M., Streu, P., and Cape, J. N. (2007). Dry and wet deposition of nutrients from the tropical Atlantic atmosphere: links to primary productivity and nitrogen fixation. Deep Sea Res. Part I Oceanogr. Res. Pap. 54, 1704–1720. doi: 10.1016/j.dsr.2007.07.001
Béranger, K., Barnier, B., Gulev, S., and Crépon, M. (2006). Comparing 20 years of precipitation estimates from different sources over the world ocean. Ocean Dyn. 56, 104–138. doi: 10.1007/s10236-006-0065-2
Cao, W., Yan, C., Jiang, S., Li, J., Zhang, Z., Jin, J., et al. (2021). Spatial distribution and behavior of dissolved selenium speciation in the South China Sea and Malacca Straits during spring inter-monsoon period. Acta Oceanol. Sin. [Epub ahead of print].
Cape, J. N., Cornell, S. E., Jickells, T. D., and Nemitz, E. (2011). Organic nitrogen in the atmosphere – Where does it come from? A review of sources and methods. Atmos. Res. 102, 30–48. doi: 10.1016/j.atmosres.2011.07.009
Capone, D. G. (2001). Marine nitrogen fixation: what’s the fuss? Curr. Opin. Microbiol. 4, 341–348. doi: 10.1016/s1369-5274(00)00215-0
Chang, Y., Liu, X., Deng, C., Dore, A., and Zhuang, G. (2016). Source apportionment of atmospheric ammonia before, during, and after the 2014 APEC summit in Beijing using stable nitrogen isotope signatures. Atmos. Chem. Phys. 16, 11635–11647. doi: 10.5194/acp-16-11635-2016
Connell, J. (2015). Food security in the island Pacific: is micronesia as far away as ever? Region. Environ. Change 15, 1299–1311. doi: 10.1007/s10113-014-0696-7
Cornell, S., Mace, K., Coeppicus, S., Duce, R., Huebet, B., Jickells, T., et al. (2001). Organic nitrogen in Hawaiian rain and aerosol. J. Geophys. Res. 106, 7973–7983. doi: 10.1029/2000jd900655
Deutsch, C., Sarmiento, J. L., Sigman, D. M., Gruber, N., and Dunne, J. P. (2007). Spatial coupling of nitrogen inputs and losses in the ocean. Nature 445, 163–167. doi: 10.1038/nature05392
Duan, L., Yu, Q., Zhang, Q., Wang, Z., Pan, Y., Larssen, T., et al. (2016). Acid deposition in Asia: emissions, deposition, and ecosystem effects. Atmos. Environ. 146, 55–69. doi: 10.1016/j.atmosenv.2016.07.018
Elliott, E. M., Yu, Z., Cole, A. S., and Coughlin, J. G. (2019). Isotopic advances in understanding reactive nitrogen deposition and atmospheric processing. Sci. Tot. Environ. 662, 393–403. doi: 10.1016/j.scitotenv.2018.12.177
Felix, J. D., Elliott, E. M., Avery, G. B., Kieber, R. J., Mead, R. N., Willey, J. D., et al. (2015). Isotopic composition of nitrate in sequential Hurricane Irene precipitation samples: implications for changing NOx sources. Atmos. Environ. 106, 191–195. doi: 10.1016/j.atmosenv.2015.01.075
Fenn, M. E., Haeuber, R., Tonnesen, G. S., Baron, J. S., Grossman-Clarke, S., Hope, D., et al. (2003). Nitrogen emissions, deposition, and monitoring in the Western United States. BioScience 53, 391–403. doi: 10.1641/0006-3568(2003)053[0391:nedami]2.0.co;2
Field, R. D., Jones, D. B. A., and Brown, D. P. (2010). Effects of postcondensation exchange on the isotopic composition of water in the atmosphere. J. Geophys. Res. 115:D24305.
Galloway, J. N., Townsend, A. R., Erisman, J. W., Bekunda, M., Cai, Z., Freney, J. R., et al. (2008). Transformation of the nitrogen cycle: recent trends, questions, and potential solutions. Science 320, 889–892. doi: 10.1126/science.1136674
Gat, J. R. (1996). Oxygen and hydrogen isotopes in the hydrologic cycle. Annu. Rev. Earth Planet. Sci. 24, 225–262. doi: 10.1146/annurev.earth.24.1.225
Ghude, S. D., Pfister, G. G., Jena, C., van der, A. R. J., Emmons, L. K., and Kumar, R. (2012). Satellite constraints of nitrogen oxide (NOx) emissions from India based on OMI observations and WRF-Chem simulations. Geophys. Res. Lett. 40, 423–428. doi: 10.1002/grl.50065
Gonfiantini, R., Roche, M.-A., Olivry, J.-C., Fontes, J.-C., and Zuppi, G. M. (2001). The altitude effect on the isotopic composition of tropical rains. Chem. Geol. 181, 147–167. doi: 10.1016/s0009-2541(01)00279-0
Großkopf, T., Mohr, W., Baustian, T., Schunck, H., Gill, D., Kuypers, M. M. M., et al. (2012). Doubling of marine dinitrogen-fixation rates based on direct measurements. Nature 488, 361–364. doi: 10.1038/nature11338
Harrison, K. A., Bol, R., and Bardgett, R. D. (2007). Preferences for different nitrogen forms by coexisting plant species and soil microbes. Ecology 88, 989–999. doi: 10.1890/06-1018
Hoch, M. P., Fogel, M. L., and Kirchman, D. L. (1994). Isotope fractionation during ammonium uptake by marine microbial assemblages. Geomicrobiol. J. 12, 113–127. doi: 10.1080/01490459409377977
Hoering, T. (1957). The isotopic composition of the ammonia and the nitrate ion in rain. Geochim. Cosmochim. Acta 12, 97–102. doi: 10.1016/0016-7037(57)90021-2
Jia, G., and Chen, F. (2010). Monthly variations in nitrogen isotopes of ammonium and nitrate in wet deposition at Guangzhou, south China. Atmos. Environ. 44, 2309–2315. doi: 10.1016/j.atmosenv.2010.03.041
Jiang, S., Kavanagh, M., and Rocha, C. (2017). Evaluation of the suitability of vacutainers for storage of nutrient and dissolved organic carbon analytes in water samples. Biol. Environ. Proc. R. Irish Acad. 117, 33–46. doi: 10.3318/bioe.2017.01
Jiang, S., Müller, M., Jin, J., Wu, Y., Zhu, K., Zhang, G., et al. (2019). Dissolved inorganic nitrogen in a tropical estuary in Malaysia: transport and transformation. Biogeosciences 16, 2821–2836. doi: 10.5194/bg-16-2821-2019
Jin, J., Jiang, S., and Zhang, J. (2020). Nitrogen isotopic analysis of nitrate in aquatic environment using cadmium–hydroxylamine hydrochloride reduction. Rapid Commun. Mass Spectrom. 34:e8804.
Johnston, J. C., and Thiemens, M. H. (1997). The isotopic composition of tropospheric ozone in three environments. J. Geophys. Res. Atmos. 102, 25395–25404. doi: 10.1029/97jd02075
Jung, J., Furutani, H., Uematsu, M., Kim, S., and Yoon, S. (2013). Atmospheric inorganic nitrogen input via dry, wet, and sea fog deposition to the subarctic western North Pacific Ocean. Atmos. Chem. Phys. 13, 411–428. doi: 10.5194/acp-13-411-2013
Kumar, A., Bali, K., Singh, S., Naja, M., and Mishra, A. K. (2019). Estimates of reactive trace gases (NMVOCs, CO and NOx) and their ozone forming potentials during forest fire over Southern Himalayan region. Atmos. Res. 227, 41–51. doi: 10.1016/j.atmosres.2019.04.028
Kuypers, M. M., Marchant, H. K., and Kartal, B. (2018). The microbial nitrogen-cycling network. Nat. Rev. Microbiol. 16:263. doi: 10.1038/nrmicro.2018.9
Li, C., Li, S. L., Yue, F. J., He, S. N., Shi, Z. B., Di, C. L., et al. (2020). Nitrate sources and formation of rainwater constrained by dual isotopes in Southeast Asia: example from Singapore. Chemosphere 241:125024. doi: 10.1016/j.chemosphere.2019.125024
Li, Q., Legendre, L., and Jiao, N. (2015). Phytoplankton responses to nitrogen and iron limitation in the tropical and subtropical Pacific Ocean. J. Plankton Res. 37, 306–319. doi: 10.1093/plankt/fbv008
Lin, C. T., Jickells, T. D., Baker, A. R., Marca, A., and Johnson, M. T. (2016). Aerosol isotopic ammonium signatures over the remote Atlantic Ocean. Atmos. Environ. 133, 165–169. doi: 10.1016/j.atmosenv.2016.03.020
Liu, S. M., Li, R. H., Zhang, G. L., Wang, D. R., Du, J. Z., Herbeck, L. S., et al. (2011). The impact of anthropogenic activities on nutrient dynamics in the tropical Wenchanghe and Wenjiaohe Estuary and lagoon system in East Hainan, China. Mar. Chem. 125, 49–68. doi: 10.1016/j.marchem.2011.02.003
Loÿe-Pilot, M. D., Martin, J. M., and Morelli, J. (1990). Atmospheric input of inorganic nitrogen to the Western Mediterranean. Biogeochemistry 9, 117–134. doi: 10.1007/bf00692168
Luo, L., Kao, S.-J., Bao, H., Xiao, H., Xiao, H., Yao, X., et al. (2018). Sources of reactive nitrogen in marine aerosol over the Northwest Pacific Ocean in spring. Atmos. Chem. Phys. 18, 6207–6222. doi: 10.5194/acp-18-6207-2018
Mace, K. A., Duce, R. A., and Tindale, N. W. (2003). Organic nitrogen in rain and aerosol at Cape Grim, Tasmania, Australia. J. Geophys. Res. 108:4338.
Martino, M., Hamilton, D., Baker, A. R., Jickells, T. D., Bromley, T., Nojiri, T., et al. (2013). Western Pacific atmospheric nutrient deposition fluxes, their impact on surface ocean productivity. Global Biogeochem. Cycles 28, 712–728. doi: 10.1002/2013GB004794
Martino, M., Hamilton, D., Baker, A. R., Jickells, T. D., Bromley, T., Nojiri, Y., et al. (2014). Western Pacific atmospheric nutrient deposition fluxes, their impact on surface ocean productivity. Glob. Biogeochem. Cycles 28, 712–728. doi: 10.1002/2013gb004794
Matsumoto, K., and Uematsu, M. (2005). Free amino acids in marine aerosols over the western North Pacific Ocean. Atmos. Environ. 39, 2163–2170. doi: 10.1016/j.atmosenv.2004.12.022
Paerl, H. W. (1985). Enhancement of marine primary production by nitrogen-enriched acid rain. Nature 315, 747–749. doi: 10.1038/315747a0
Pan, Y., Tian, S., Liu, D., Fang, Y., Zhu, X., Gao, M., et al. (2018). Isotopic evidence for enhanced fossil fuel sources of aerosol ammonium in the urban atmosphere. Environ. Pollut. 238, 942–947. doi: 10.1016/j.envpol.2018.03.038
Panhwar, Q. A., Naher, U. A., Radziah, O., Shamshuddin, J., and Razi, I. M. (2014). Bio-Fertilizer, ground magnesium limestone and basalt applications may improve chemical properties of Malaysian acid sulfate soils and rice growth. Pedosphere 24, 827–835. doi: 10.1016/s1002-0160(14)60070-9
Pathak, H., Bhatia, A., Prasad, S., Singh, S., Kumar, S., Jain, M. C., et al. (2002). Emission of nitrous oxide from rice-wheat systems of Indo-Gangetic plains of India. Environ. Monit. Assess. 77, 163–178.
Rahman, N., Bruun, T. B., Giller, K. E., Magid, J., van de Ven, G. W. J., and de Neergaard, A. (2019). Soil greenhouse gas emissions from inorganic fertilizers and recycled oil palm waste products from Indonesian oil palm plantations. Glob. Change Biol. Bioenergy 11, 1056–1074. doi: 10.1111/gcbb.12618
Rocha, C., Galvão, H., and Barbosa, A. (2002). Role of transient silicon limitation in the development of cyanobacteria blooms in the Guadiana estuary, south-western Iberia. Mar. Ecol. Prog. Ser. 228, 35–45. doi: 10.3354/meps228035
Sano, Y., Takahata, N., Nishio, Y., Fischer, T. P., and Williams, S. N. (2001). Volcanic flux of nitrogen from the Earth. Chem. Geol. 171, 263–271. doi: 10.1016/s0009-2541(00)00252-7
Sia, E. S. A., Zhu, Z., Zhang, J., Cheah, W., Jiang, S., Holt Jang, F., et al. (2019). Biogeographical distribution of microbial communities along the Rajang River–South China Sea continuum. Biogeosciences 16, 4243–4260. doi: 10.5194/bg-16-4243-2019
Sigman, D. M., Casciotti, K. L., Andreani, M., Barford, C., Galanter, M., and Böhlke, J. K. (2001). A bacterial method for the nitrogen isotopic analysis of nitrate in seawater and freshwater. Anal. Chem. 73, 4145–4153. doi: 10.1021/ac010088e
Singh, A. K., Mondal, G. C., Kumar, S., Singh, K. K., Kamal, K. P., and Sinha, A. (2007). Precipitation chemistry and occurrence of acid rain over Dhanbad, coal city of India. Environ. Monit. Assess 125, 99–110. doi: 10.1007/s10661-006-9243-4
Singh, H. B., Gregory, G. L., Anderson, B., Browell, E., Sachse, G. W., Davis, D. D., et al. (1996). Low ozone in the marine boundary layer of the tropical Pacific Ocean: photochemical loss, chlorine atoms, and entrainment. J. Geophys. Res. Atmos. 101, 1907–1917. doi: 10.1029/95jd01028
Sinha, N., Chakraborty, S., Chattopadhyay, R., Goswami, B. N., Mohan, P. M., Parua, D. K., et al. (2019). Isotopic investigation of the moisture transport processes over the Bay of Bengal. J. Hydrol. X 2:100021. doi: 10.1016/j.hydroa.2019.100021
Sommer, S. G., Olesen, J. E., and Christensen, B. T. (1991). Effects of temperature, wind speed and air humidity on ammonia volatilization from surface applied cattle slurry. J. Agric. Sci. 117, 91–100. doi: 10.1017/s0021859600079016
Srinivas, B., Sarin, M. M., and Sarma, V. V. S. S. (2011). Atmospheric dry deposition of inorganic and organic nitrogen to the Bay of Bengal: impact of continental outflow. Mar. Chem. 127, 170–179. doi: 10.1016/j.marchem.2011.09.002
Stechmann, S. N., and Ogrosky, H. R. (2014). The Walker circulation, diabatic heating, and outgoing longwave radiation. Geophys. Res. Lett. 41, 9097–9105. doi: 10.1002/2014gl062257
Szép, R., Bodor, Z., Miklóssy, I., Niţǎ, I.-A., Oprea, O. A., and Keresztesi, Á (2019). Influence of peat fires on the rainwater chemistry in intra-mountain basins with specific atmospheric circulations (Eastern Carpathians, Romania). Sci. Total Environ. 647, 275–289. doi: 10.1016/j.scitotenv.2018.07.462
Szép, R., Mateescu, E., Niţǎ, I.-A., Birsan, M.-V., Bodor, Z., and Keresztesi, Á (2018). Effects of the Eastern Carpathians on atmospheric circulations and precipitation chemistry from 2006 to 2016 at four monitoring stations (Eastern Carpathians, Romania). Atmos. Res. 214, 311–328. doi: 10.1016/j.atmosres.2018.08.009
Takakai, F., Morishita, T., Hashidoko, Y., Darung, U., Kuramochi, K., Dohong, S., et al. (2006). Effects of agricultural land-use change and forest fire on N2O emission from tropical peatlands, Central Kalimantan, Indonesia. Soil Sci. Plant Nutr. 52, 662–674. doi: 10.1111/j.1747-0765.2006.00084.x
Takashi, O., and Tsukada, S. (1988). Squids eaten by lancetfish and tunas in the tropical Indo-Pacific oceans. Tokyo Suisanda Kempo 75, 1–44.
Trierweiler, J. F., and Bishop, B. L. (1983). Estimated NH3-volatilization losses from surface-applied urea on a wet calcareous Vertisol. Fertilizer Res. 4, 271–280. doi: 10.1007/bf01049483
Uchiyama, R., Okochi, H., Ogata, H., Katsumi, N., Asai, D., and Nakano, T. (2017). H and O isotopic differences in typhon and urban-induced heavy rain in Tokyo. Environ. Chem. Lett. 15, 739–745. doi: 10.1007/s10311-017-0652-0
Vallet-Coulomb, C., Gasse, F., and Sonzogni, C. (2008). Seasonal evolution of the isotopic composition of atmospheric water vapour above a tropical lake: deuterium excess and implication for water recycling. Geochim. Cosmochim. Acta 72, 4661–4674. doi: 10.1016/j.gca.2008.06.025
Wei, Y., Sun, J., Zhang, X., Wang, J., and Huang, K. (2019). Picophytoplankton size and biomass around equatorial eastern Indian Ocean. MicrobiologyOpen 8:e00629. doi: 10.1002/mbo3.629
Weigand, M. A., Foriel, J., Barnett, B., Oleynik, S., and Sigman, D. M. (2016). Updates to instrumentation and protocols for isotopic analysis of nitrate by the denitrifier method. Rapid Commun. Mass Spectrom. 30, 1365–1383. doi: 10.1002/rcm.7570
Xia, C., Liu, G., Mei, J., Meng, Y., Liu, W., and Hu, Y. (2019). Characteristics of hydrogen and oxygen stable isotopes in precipitation and the environmental controls in tropical monsoon climatic zone. Int. J. Hydrogen Energy 44, 5417–5427. doi: 10.1016/j.ijhydene.2018.10.171
Xiao, H.-W., Wu, J.-F., Luo, L., Liu, C., Xie, Y.-J., and Xiao, H.-Y. (2020). Enhanced biomass burning as a source of aerosol ammonium over cities in central China in autumn. Environ. Pollut. 266:115278. doi: 10.1016/j.envpol.2020.115278
Xiao, H.-W., Xiao, H.-Y., Long, A.-M., and Wang, Y.-L. (2012). Who controls the monthly variations of NH4+ nitrogen isotope composition in precipitation? Atmos. Environ. 54, 201–206. doi: 10.1016/j.atmosenv.2012.02.035
Yang, Y., Russell, L. M., Lou, S., Liao, H., Guo, J., Liu, Y., et al. (2017). Dust-wind interactions can intensify aerosol pollution over eastern China. Nat. Commun. 8:15333.
Zeng, J., Yue, F.-J., Wang, Z.-J., Wu, Q., Qin, C.-Q., and Li, S.-L. (2019). Quantifying depression trapping effect on rainwater chemical composition during the rainy season in karst agricultural area, southwestern China. Atmos. Environ. 218:116998. doi: 10.1016/j.atmosenv.2019.116998
Zhang, J., Zhang, G. S., Bi, Y. F., and Liu, S. M. (2011). Nitrogen species in rainwater and aerosols of the Yellow and East China seas: effects of the East Asian monsoon and anthropogenic emissions and relevance for the NW Pacific Ocean. Glob. Biogeochem. Cycles 25:GB3020.
Zhang, J., Zou, L., Wu, Y., and Lin, Y. A. (2004). Atmospheric wet deposition and changes in phytoplankton biomass in the surface ocean. Geophys. Res. Lett. 31:L11310.
Keywords: atmosphere, nitrogen, Indian Ocean, Pacific Ocean, precipitation, stable isotope
Citation: Jiang S, Jin J, Jiang S, Wu Y, Wang J, Chen J, Zhang Z, Liu S, Chang Y, Wang L and Zhang J (2021) Nitrogen in Atmospheric Wet Depositions Over the East Indian Ocean and West Pacific Ocean: Spatial Variability, Source Identification, and Potential Influences. Front. Mar. Sci. 7:600843. doi: 10.3389/fmars.2020.600843
Received: 31 August 2020; Accepted: 16 December 2020;
Published: 25 January 2021.
Edited by:
Sabine Mathesius, Simon Fraser University, CanadaReviewed by:
Róbert Szép, Institute for Research and Development for Hunting and Mountain Resources, RomaniaHuayun Xiao, East China University of Technology, China
Copyright © 2021 Jiang, Jin, Jiang, Wu, Wang, Chen, Zhang, Liu, Chang, Wang and Zhang. This is an open-access article distributed under the terms of the Creative Commons Attribution License (CC BY). The use, distribution or reproduction in other forums is permitted, provided the original author(s) and the copyright owner(s) are credited and that the original publication in this journal is cited, in accordance with accepted academic practice. No use, distribution or reproduction is permitted which does not comply with these terms.
*Correspondence: Shan Jiang, c2ppYW5nQHNrbGVjLmVjbnUuZWR1LmNu