 Michael Sweet1*
 Mark Bulling1
 Dorsa Varshavi2
 Gavin R. Lloyd3
 Andris Jankevics3Lukáš Najdekr3
 Ralf J. M. Weber3
 Mark R. Viant2,3
 Jamie Craggs1,4
- 1Aquatic Research Facility, Environmental Sustainability Research Centre, University of Derby, Derby, United Kingdom
- 2Natural Environment Research Council (NERC) Biomolecular Analysis Facility—Metabolomics Node (NBAF-B), School of Biosciences, University of Birmingham, Birmingham, United Kingdom
- 3Phenome Centre Birmingham, University of Birmingham, Birmingham, United Kingdom
- 4Horniman Museum and Gardens, London, United Kingdom
Coral reefs are suffering unprecedented declines in health state on a global scale. Some have suggested that human assisted evolution or assisted gene flow may now be necessary to effectively restore reefs and pre-condition them for future climate change. An understanding of the key metabolic processes in corals, including under stressed conditions, would greatly facilitate the effective application of such interventions. To date, however, there has been little research on corals at this level, particularly regarding studies of the metabolome of Scleractinian corals. Here, the metabolomic profiles [measured using 1H nuclear magnetic resonance spectroscopy (1H NMR) and ultra-high-performance liquid chromatography-mass spectrometry (LC-MS)] of two dominant reef building corals, Acropora hyacinthus and A. millepora, from two distinct geographical locations (Australia and Singapore) were characterized. We assessed how an acute temperature stress (an increase of 3.25°C ± 0.28 from ambient control levels over 8 days), shifted the corals’ baseline metabolomic profiles. Regardless of the profiling method utilized, metabolomic signatures of coral colonies were significantly distinct between coral species, a result supporting previous work. However, this strong species-specific metabolomic signature appeared to mask any changes resulting from the acute heat stress. On closer examination, we were able to discriminate between control and temperature stressed groups using a partial least squares discriminant analysis classification model (PLSDA). However, in all cases “late” components needed to be selected (i.e., 7 and 8 instead of 1 and 2), suggesting any treatment effect was small, relative to other sources of variation. This highlights the importance of pre-characterizing the coral colony metabolomes, and of factoring that knowledge into any experimental design that seeks to understand the apparently subtle metabolic effects of acute heat stress on adult corals. Further research is therefore needed to decouple these apparent individual and species-level metabolomic responses to climate change in corals.
Introduction
Metabolites are small molecular products and intermediates of metabolism that play essential roles in biochemical pathways underpinning growth, nutrition, reproduction and survival. External disturbances can trigger responses in the cellular pathways of any given organism, leading to shifts in their metabolomic profiles. Arguably, these shifts should be observable prior to any visual signs of ill health—therefore acting as an early warning tool or bioindicator of stress events. Despite the significant potential gains in organismic understanding offered by metabolome studies, metabolism research in corals has only recently gained traction (Sogin et al., 2014, 2016; Farag et al., 2016; Quinn et al., 2016; Galtier d’Auriac et al., 2018; Hillyer et al., 2018; Lohr et al., 2019; Vohsen et al., 2019; Roach et al., 2020; Williams et al., 2021). That said, the Cnidarians as a group have been the focus of an extensive chemical industry based on marine products for decades (Kornprobst, 2014). For example, over 90% of known terpenic-based commercial compounds (which are involved in predator deterrence, anti-fouling and allelopathy) originated from Cnidarians (Kornprobst, 2014). These same metabolites have also been identified as exhibiting medically useful properties. For example, as anti-microbials, anti-inflammatories and cytotoxins for cancer cell lines (Vohsen et al., 2019). As such, there is well-developed understanding of how certain metabolites (for example, sugars, lipids and mycosporine-like amino acids) are associated with particular responses in Cnidarian hosts (Hillyer et al., 2017a, 2018; Galtier d’Auriac et al., 2018; Roach et al., 2020; Williams et al., 2021). In contrast, the behavior of other metabolites such as steroids, isoprenoids, alkaloids, and sulfur containing compounds such as dimethylsulphoniopropionate (DMSP) and glycosaminoglycans and/or their breakdown products including acrylate, have been studied far less (Sogin et al., 2014; Yuyama et al., 2016; Westmoreland et al., 2017; Williams et al., 2021). This has resulted in a strong bias in our knowledge of the roles of coral metabolites.
The understudied metabolites are undoubtedly important to corals as they have been linked with coral reproduction, growth, survival and maintenance of symbiotic status (Tarrant et al., 2003; Gordon and Leggat, 2010; Tapiolas et al., 2010; Sogin et al., 2014; Williams et al., 2021). The maintenance of symbiotic relationships with algae (Symbiodiniaceae) is particularly important for reef building corals. In exchange for nitrogen compounds, the algae produce and translocate organic metabolites to the host, which can be used to meet up to 95% of the corals’ daily nutritional needs (Muscatine and Porter, 1977). Algal photosynthate is primarily composed of glycerol with smaller quantities of glucose, amino acids, organic acids and free fatty acids (Burriesci et al., 2012). These compounds support host nutritional pathways by providing energetic resources needed for growth, respiration, reproduction and calcification processes. They also support host nutritional storage, with translocated compounds stored in lipid droplets and starch granules, which can then be remobilised when nutritional demands are not being met (Kopp et al., 2015). This remobilization of nutrients is likely to be an important determinant of the resilience of corals when under stress. These photosynthetic products are also incorporated into the epithelial tissue layer, where the coral uses them for growth and cell maintenance. Like Symbiodiniaceae, the corals’ prokaryotic partners are also involved in contributing to the bulk of the coral holobiont metabolomic profile (Sogin et al., 2017). For example, the prokaryotic partners are involved in the cycling of sulfur compounds, participating in processes such as the degradation of DMSP to dimethyl sulfide, and the fixation of nitrogen compounds. Positive correlations between associated microbial community structure and metabolome profile have been shown; specifically with cyanobacteria and metabolite signals originating from nitrogen containing branch-chained amino acids and acetate (Sogin et al., 2017). Such evidence supports the hypothesis that cyanobacteria produce nitrogen compounds to support coral nutrition (Sogin et al., 2017). Horizontal gene transfer can also facilitate rapid evolution within microbial strains and change metabolic functions, with the potential to subsequently also confer beneficial traits to their host (Webster and Reusch, 2017). The corals themselves also produce and mobilize other small compounds, including steroids, DMSP, betaines, and a diverse assemblage of lipids and mycosporine-like amino acids (Raina et al., 2013; Sogin et al., 2014; Westmoreland et al., 2017; Ngugi et al., 2020; Williams et al., 2021).
We therefore applied two widely recognized metabolomic approaches—ultra-high-performance liquid chromatography-mass spectrometry (LC-MS) and proton nuclear magnetic resonance spectroscopy (1H NMR), to measure metabolomic variation within and between colonies of two major reef building Acroporids from two geographically separated locations (Australia and Singapore). Further, we assessed the potential for metabolomic studies to support projects exploring the feasibility of human assisted evolution (HEA) or assisted gene flow (AGF) interventions to restore coral cover by measuring changes in the metabolomic profiles of laboratory reared corals exposed to environmentally relevant acute and prolonged heat stress.
Materials and Methods
Coral Species and Geographical Location
In March 2015, 20 cm2 fragments of Acropora hyacinthus colonies were collected from two reefs south of mainland Singapore, Kusu reef and Pulau Satumu (National Biodiversity Centre, National Parks Board Singapore research permit NP/RP14-115, CITES import permit 532422/01 and export permit 15SG006834AE). The same size fragments of both A. hyacinthus and A. millepora were also collected from Sudbury Reef, on the Great Barrier Reef (GBR), Australia in September 2016 (CITES import permit number: 545320/03). These colonies were transported to the UK (Craggs et al., 2018) and transferred to two purpose built closed system mesocosms; one with environmental parameters matching Kusu reef in Singapore, and the other matching conditions around Lizard Island, GBR (due to the absence of data from Sudbury). Mesocosm design enabled accurate replication of conditions required to induce spawning ex situ, including seasonal temperature change, photoperiod, solar irradiance and lunar cycles (Craggs et al., 2017). All broodstock (those from Singapore and GBR) completed full gametogenic cycles ex situ from 2015 to 2016, after which the Singapore genotypes were moved into the GBR mesocosm and maintained alongside their GBR counterparts.
Temperature Stress Experiment
In June 2019, six ∼3 cm fragments of coral were taken from each of the original colonies (n = 6 colonies of A. hyacinthus from Singapore; and n = 9 A. hyacinthus and n = 9 A. millepora from Australia). These were then mounted on aragonite plugs using marine epoxy resin and placed into two separate tank systems. Colony fragments were then acclimated for 20 days prior to the experiment commencing. One system represented a “control” and was maintained at 27.50°C (±0.28 sd). The other system applied a ramped increase in temperature up to 30.75°C (±0.13 sd) over an 8-day period. This equates to an increase of 3.25°C (±0.28 sd) from ambient, control levels over the 8-day experimental period (hereafter referred to as “temperature stress”) (Supplementary Figure S1). This relatively short stress period was designed to enable detection of early shifts in metabolic profiles prior to the appearance of physical signs of stress in the corals. Fragments for this experiment were constrained to equal numbers and randomly assigned a placement in either the control or temperature stress systems. At the end of the 8-days, samples were collected for metabolomic analysis (see below for details and Supplementary Figure S1 for a schematic on the sampling time points).
After metabolomic sample collection (time point 1 or T1—see Supplementary Figure S1), the fragments were returned to their original tank systems and the temperature stress continued for an additional 23 days. During this period the heaters maintained at an elevated temperature of 31.14°C (±0.37 sd) (Supplementary Figure S1). This was undertaken to assess the thermal tolerance and fate of the colonies under prolonged thermal stress. Control tanks remained at their “natural” temperature levels (blue line, Supplementary Figure S1). The health of the fragments at the end of the experiment was visually assessed and classified at time point 2 (or T2—see Supplementary Figure S1). At this point, each fragment was placed into one of four categories; “not bleached” (N), “partially bleached” (PB), “completely bleached” (CB), or dead (D). We also calculated the equivalent degree heating weeks for which each of the fragments were exposed to in the experimental set up (Supplementary Figure S2). To do this, we used the hottest monthly temperatures from the respective home reef locations. For Singapore, this was 30.215°C (logger; Hobo data logger, depth; 5 m, date; June 2012 and 2015), and for the GBR 29.142°C. (logger; replay pole 2, location; Lizard Island, GBR, depth; 10.1 m, date; March 2014 through to 2019)1. This ensured that corals were exposed to elevated temperatures they would naturally experience on their natal reef.
Sample Extraction and Metabolomic Analysis
The sampling of corals for metabolomic analysis was based on two experimental designs. Experiment 1 involved characterizing intra-colony variation, colony-colony variation, and species variation in the metabolomic profiles before the temperature stress experiment was run i.e., at control temperatures, 27.50°C (±0.28 sd). At this time, 1 cm2 fragments (n = 3) of both the axial and radial polyps of each colony were sampled and snap frozen in liquid nitrogen. The axial polyp samples were always taken first by snipping off the top growing tips using pliers sterilized in ethanol prior to each sampling. Subsequently, a section consisting only of radial polyps (approx. 1 cm from the site of the axial polyp sampling) was snipped off following the same protocol. The biomass of the coral samples collected for metabolomic analysis (tissue and skeleton) ranged from 50 to 100 mg (freeze dried mass). Extracts of these coral samples (details provided below) were subjected to LC-MS and 1H NMR analysis to allow a comparison of the methods in supporting high quality analyses of this sample type and size.
Experiment 2 assessed how an acute temperature stress affected the colony profiles. For this, coral samples were only subjected to LC-MS analysis, based on the consistent results obtained from experiment 1. Samples for experiment 2 were taken at the end of the 8-day acute stress test (see above, and Supplementary Figure S1). Upon collection, samples were frozen immediately in liquid nitrogen. The biomass of the coral samples collected for metabolomic analysis in experiment 2 ranged from 73 to 136 mg.
All samples were extracted in the same manner, as per the modified Matyash method (Sostare et al., 2018). In brief, the coral samples were transfered to individual Precellys tubes, 75% ice-cold methanol (32 μL/mg methanol and 10.6 μL/mg LC-MS-grade water) was then added and homogenized in a Precellys-24 bead-based homogenizer (Bertin technologies) for 2 × 10 sec bursts at 6,400 rpm. Phase separation was induced by adding the homogenized mixture into a clean 1.8 mL glass vial using a Pasteur pipette, and then adding methyl tert-butyl ether (MTBE) (5.2 μL/mg) and water (2.4 μL/mg) and mixing on a Bioshake (2,000 rpm, 3 min). Following this, samples were left on ice for 10 min and then centrifuged (4,000 g at 4°C, 10 min). For both experiments (to account for the differences in sample masses), we used the same volume of polar extract for each sample (determined by the lowest available amount), and the same volume of non-polar extract. Therefore, 20 μL of the polar or non-polar fractions were aliquoted into separate clean Eppendorf tubes or glass vials, respectively, and dried using a SpeedVac concentrator (SPD111V, Thermo Savant; for polar samples only) or nitrogen blow-down evaporator (TECHNE sample concentrator with Peak Scientific Genius nitrogen generator; for non-polar samples only). Extracts were then stored at -80°C until analysis. Blank samples were prepared by the same procedures as for the biological samples, but without the coral.
Ultrahigh Performance Liquid Chromatography—Mass Spectrometry
Dried sample extracts were analyzed using a Dionex UltiMate 3000 Rapid Separation LC system (Thermo Fisher Scientific, MA, United States), coupled with a heated electrospray Q Exactive Focus mass spectrometer (Thermo Fisher Scientific, MA, United States). Polar extracts and extraction blanks were reconstituted in acetonitrile:water (75:25 (v/v); 160 μL) and analyzed on a Accucore-150-Amide-HILIC column (100 × 2.1 mm, 2.6 μm, Thermo Fisher Scientific, MA, United States), hereafter referred to as HILIC. Mobile phase A consisted of 10 mM ammonium formate and 0.1% formic acid in 95% acetonitrile:water, and mobile phase B consisted of 10 mM ammonium formate and 0.1% formic acid in 50% acetonitrile:water. Flow rate was set for 0.50 mL/min with the following gradient: t = 0.0, 1% B; t = 1.0, 1% B; t = 3.0, 15% B; t = 6.0, 50% B; t = 9.0, 95% B; t = 10.0, 95% B; t = 10.5, 1% B; t = 14.0, 1% B; all changes were linear with curve = 5. The column temperature was set to 35°C and the injection volume was 2 μL. Data were acquired in positive and negative ionization modes separately within the mass range of 70–1,050 m/z at resolution 70,000 (FWHM at m/z 200). Ion source parameters were set as follows: Sheath gas = 53 arbitrary units, Aux gas = 14 arbitrary units, Sweep gas = 3 arbitrary units, Spray voltage = 3.5 kV, Capillary temp. = 269°C, Aux gas heater temp. = 438°C. Non-polar extracts, hereafter referred to as LIPID, and extraction blanks were reconstituted in isopropanol:water (75:25 (v/v); 300 μL) and analyzed on a Hypersil GOLD column (100 × 2.1 mm, 1.9 μm; Thermo Fisher Scientific, MA, United States). Mobile phase A consisted of 10 mM ammonium formate and 0.1% formic acid in 60% acetonitrile:water. Mobile phase B consisted of 10 mM ammonium formate and 0.1% formic acid in 90% propan-2-ol:water. Flow rate was set for 0.40 mL/min with the following gradient: t = 0.0, 20% B; t = 0.5, 20% B, t = 8.5, 100% B; t = 9.5, 100% B; t = 11.5, 20% B; t = 14.0, 20% B; all changes were linear with curve = 5. The column temperature was set to 55°C and the injection volume was 2 μL. Data were acquired in positive and negative ionization mode separately within the mass range of 150–2,000 m/z at resolution 70,000 (FWHM at m/z 200). Ion source parameters were set as follows: Sheath gas = 50 arbitrary units, Aux gas = 13 arbitrary units, Sweep gas = 3 arbitrary units, Spray Voltage = 3.5kV, Capillary temp. = 263°C, Aux gas heater temp. = 425°C. All solvent used was LC-MS grade. A Thermo Exactive Tune 2.8 SP1 build 2,806 was used as instrument control software in both cases and data were acquired in profile mode. Pooled quality control (QC) samples were prepared for individual assay by mixing 40 μL from re-suspended extracts, vortexing thoroughly for 60 s and aliquoted by 100 μL into the HPLC vials. Intrastudy quality control (QC) samples were analyzed as the first ten injections and then every seventh injection, with two QC samples at the end of the analytical batch. Two blank samples were analyzed, the first as the 6th injection and the second at the end of the batch.
Processing of Mass Spectrometry Raw Data
Raw data acquired in each analytical batch were converted from the instrument-specific format to the mzML file format applying the open access ProteoWizard (version 3.0.11417) msconvert tool (Kessner et al., 2008). During this procedure, peak picking and centroiding were achieved using vendor algorithms. Isotopologue Parameter Optimization (IPO—version 1.0.0, using XCMS—version 1.46.0) (Libiseller et al., 2015) was used to perform automatic optimization of XCMS parameter settings. For the centWave peak picking algorithm the following parameters and ranges were used: min_peakwidth (from 2 to 10); max_peakwidth (from 20 to 60); ppm (from 5 to 15); m/zdiff (−0.001 to 0.01); snthresh (Wang et al., 2019); noise (10,000); prefilter (Brown et al., 2012); value_of_prefilter (100); m/zCenterFun (wMean); integrate (Kessner et al., 2008); fitgauss (FALSE); verbose.columns (FALSE). Deconvolution of sample spectra was performed with XCMS software (Smith et al., 2006) according to the settings detailed in Supplementary Tables S1, S2. A data matrix of metabolite features (m/z-retention time pairs) vs. samples was constructed, with peak areas provided where the metabolite feature was detected for each sample.
Putative Metabolite Annotation
Experimental m/z values of all observed peaks were searched directly, one at a time, against KEGG, HMDB and/or LIPID MAPS databases, and all matches within a 5 ppm mass error tolerance were recorded. As different metabolites can be detected with the same accurate m/z value (e.g., isomers with the same molecular formula), multiple annotations can occur for a single detected metabolite feature. Also, a single metabolite can be detected as multiple features, e.g., as different types of adduct (protonated or sodiated ions). We attempted to improve the confidence in metabolite annotation by matching features in the intrastudy QC sample UHPLC–MS/MS data to the mzCloud mass spectral library, using Thermo Fisher Scientific Compound Discoverer 3.1 software. Metabolite annotations with an “mzCloud best match” score of >70% were considered reliable2; (see SM met-annotations-mzCloud-exp2 located at https://doi.org/10.6084/m9.figshare.13915820.v1). These annotations met the Metabolomics Standards Initiative’s (MSI) requirements to be classed as confidence level 2.
Quality Control and Quality Assessment
A quality assurance and quality control (QA/QC) assessment was performed to measure drift across retention time, m/z and signal intensity and to identify potential outliers. Up to eight QCs were used to equilibrate the analytical system, and therefore subsequently removed from the data prior to data analysis. Principal Component Analysis (PCA) was performed to assess the technical variability (measured by the replicate analysis of a pooled intrastudy QC sample) and biological variability as part of the quality control process. Prior to PCA, missing values in the data were replaced by applying k nearest neighbor (kNN) missing value imputation (k = 5) followed by probabilistic quotient normalization (PQN) (Dieterle et al., 2006), and glog transformation (Purohit et al., 2004).
Peak Matrix Filtering Prior to Statistical Analysis
The data from the pooled intrastudy QC samples were utilized to perform QC filtering. For each metabolite feature detected, the relative standard deviation and percentage detection rates were calculated using the QC samples. Blank samples at the start and end of a run were used to remove features from non-biological origins. Any feature with an average QC intensity of less than 20 times the average intensity of the blanks was removed. Any sample with >50% missing values was excluded from further analysis. Metabolite features with a QC Relative Standard Deviation (RSD) >30% and present in less than 90% of the QC samples were deleted from the dataset. Features with a <50% detection rate over all samples were also removed.
Nuclear Magnetic Resonance Spectroscopy
Sample Preparation for 1H NMR Analysis
Dried polar extracts were resuspended in 650 μL of a 0.15 M potassium phosphate buffer solution (pH 7.4) containing 0.58 mM 3-(trimethylsilyl)-2,2′,3,3′-tetradeuteropropionic acid (TSP) as a chemical shift reference, and 0.2 mM NaN3 as an anti-microbial agent. The buffered samples were vortexed for 30 s and then centrifuged (13,000 rpm at 4°C for 15 min) to remove any suspended particles. After centrifugation, 600 μL of each supernatant was transferred into a 5 mm 1H NMR tube and maintained at 4°C in the 1H NMR autosampler until analysis. The samples were measured in a randomized order.
Data Acquisition and Processing
One-dimensional proton NMR (1H NMR) spectra of all the extracted metabolites were acquired on a 600.40 MHz Bruker AVANCE III HD spectrometer equipped with a room temperature double resonance (1H, 13C) broadband probe (Bruker 5 mm BBI probe), operating at a temperature of 300.0 K. 1H NMR spectra were acquired with a standard 1D NOESY pre-saturation pulse sequence with gradient pulses (RD–gz,1–90°–t–90°–tm–gz,2–90°–ACQ, Bruker sequence code noesygppr1d) and with water suppression applied during the relaxation delay of 4 s. Parameters included a mixing time of 10 ms, with 512 transients collected into 65,536 data points, and a spectral width of 20 ppm. Prior to applying Fourier transformation, the free induction decays were multiplied by an exponential function corresponding to a line broadening of 0.3 Hz. The 1H NMR spectra were automatically phased, baseline corrected and referenced to the chemical shift of TSP (0.0 ppm) using TopSpin 3.5pl7 (Bruker Biospin, United Kingdom). The 1H NMR spectra were then imported into Matlab (The Mathworks 2013), using the program ProMetab, via the graphical user interface pmgui. Using the ProMetab software, regions of the spectra upfield of 0.86 ppm, downfield of 10 ppm, and the spectral region containing water (δ 4.7–5.16) were omitted to eliminate the effects of background noise and variable water saturation, respectively. Spectra were binned to a bin width of 0.005 ppm.
Statistical Analysis
All univariate analysis (for both 1H NMR and LC-MS) was performed in the R environment using struct and structToolbox packages (Lloyd et al., 2020). Probabilistic quotient normalization [PQN, mean QC applied (LC-MS), mean of samples applied (NMR)] of the data was performed prior to the application of Student’s t-tests to identify features showing a significant difference in intensities between groups. This required the application of multiple tests (one for each metabolite feature), so a False Discovery Rate (FDR) correction was performed to control the FDR (p < 0.05). Multivariate analysis was conducted in the R environment using the struct and structToolbox packages (see above). Prior to the multivariate analysis, Probabilistic Quotient Normalization (PQN), using the mean of the QC samples as a reference, was applied. Following this, k-nearest neighbor missing value imputation (k = 5) to replace missing values and a glog-transformation [mean QC applied as a reference (LC-MS), mean of samples as reference (NMR)] of the data were performed. Principal Component Analysis (PCA) was utilized to visualize the largest variance in the data and Partial Least Squares (PLS) Discriminant Analysis (DA) was utilized to detect more subtle variations related to temperature stress. The number of latent variables to use in the PLS model was established using a grid search over 1–15 components inclusive, using a permuted (10 repetitions) k-fold cross-validation model to determine the number of components that minimized the average test set prediction error over all classes. The number of folds (k) was set equal to the square root of the number of samples for a given matrix. Permutation tests (50 repetitions) were utilized to establish the validity of the model.
Results
For the first experiment, we assessed if there was detectable intra-colony variation in the metabolomic profiles (i.e., between the axial and radial polyp of the same coral). PCA revealed some clustering related to axial and radial polyps in Acropora hyacinthus (Figure 1A) and Acropora millepora (Figure 1B), for all methods assessed (HILIC, LIPID, and 1H NMR—Supplementary Figure S3). Additional univariate analysis (t-test with FDR correction) revealed that this differentiation was largely driven by only one of the assays and for only one species (the HILIC (neg) assay of Acropora hyacinthus which captured 34 features, p < 0.05) (see SM met-annotations-mz-ttests located at https://doi.org/10.6084/m9.figshare.13915820.v1). This indicates that the differences between axial and radial samples are very subtle and findings for one sample type are likely to be applicable to both sample types. Nonetheless, axial and radial polyps were analyzed separately for the remainder of the study. Separation was observable in the PCA scores plots between the two Acroporid species originating from the same geographical location, i.e., Australia (Figure 1C—only data for radial polyp samples displayed). Again, this result was consistent for all three methods (HILIC, LIPID, and 1H NMR). Univariate analysis (t-test with FDR correction) indicated features with a significant difference (p < 0.05) between species in all assays except LIPID (pos). HILIC (neg) 60 features; HILIC (pos) 187 features; LIPID (neg) 100 features; 1H NMR 213 features (see SM met-annotations-mz-ttests located at https://doi.org/10.6084/m9.figshare.13915820.v1).
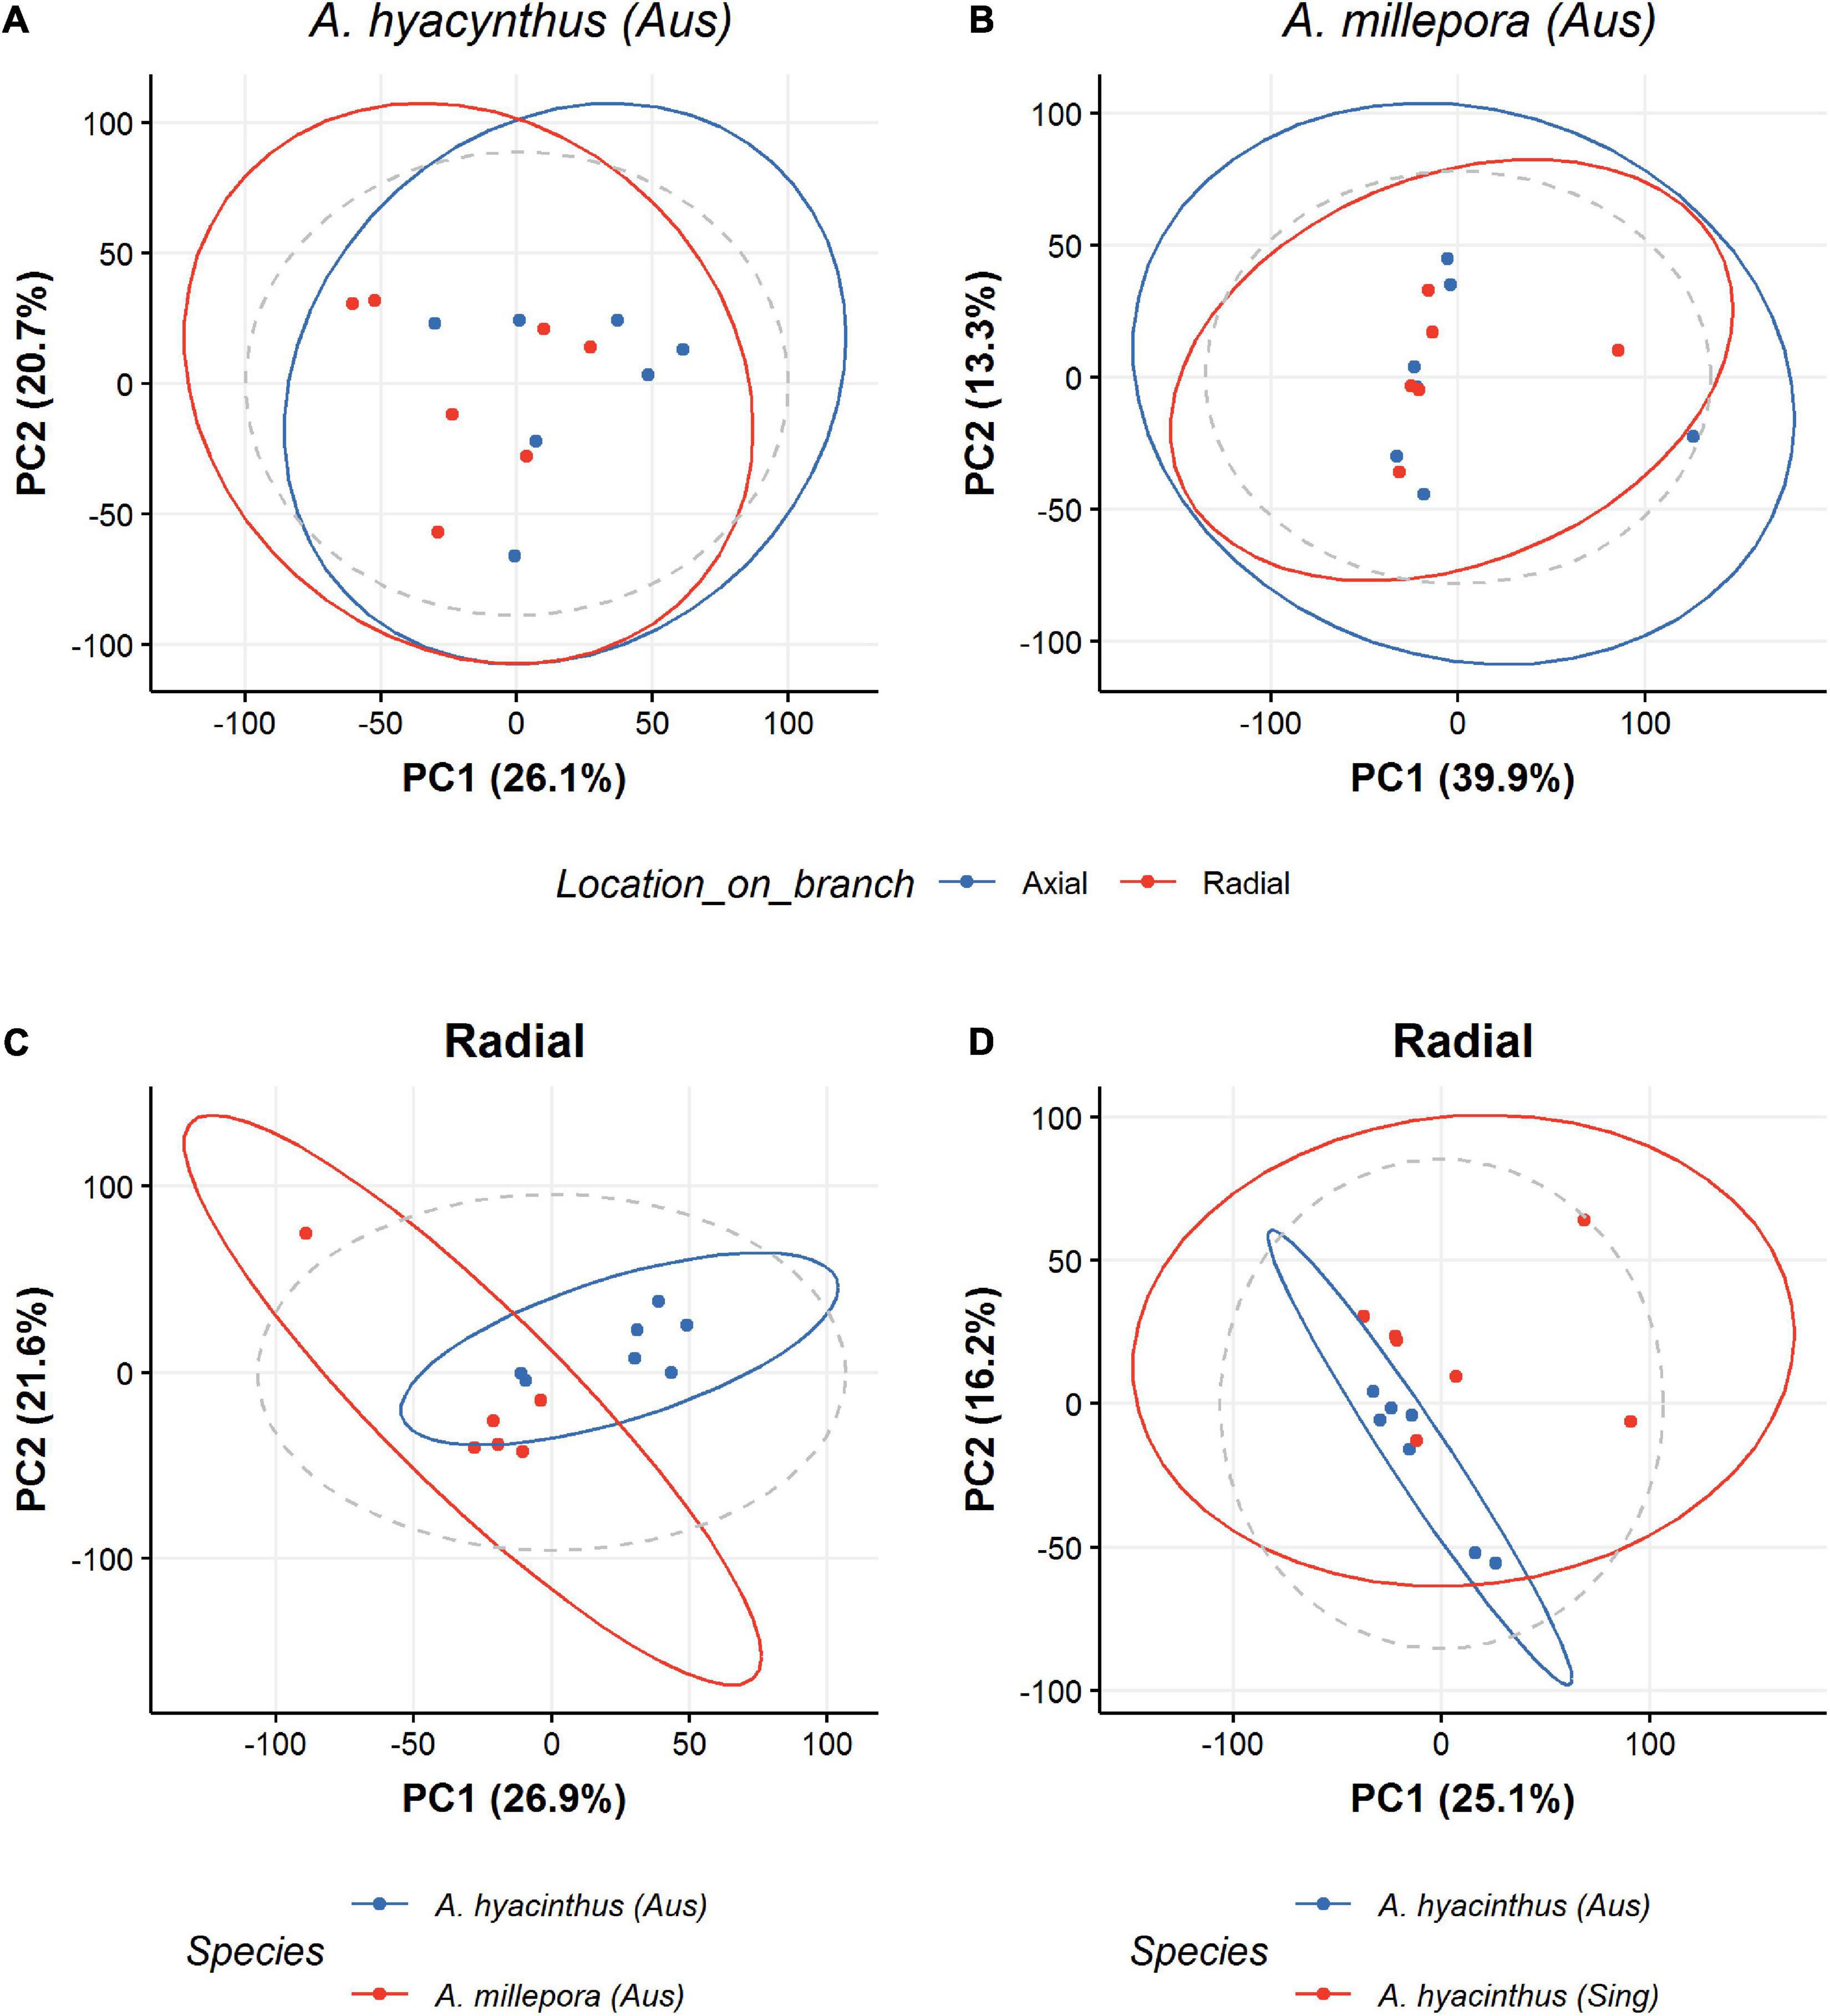
Figure 1. PCA scores plots for LIPID LC-MS results colored according to the locations on the corals from which samples were obtained for A. hyacinthus (A) and A. millepora (B). Blue dots represent axial polyp sampling and red dots represent radial polyp sampling. (C) A PCA scores plot for the two coral species A. hyacinthus and A. millepora originating from a single sample location (Australia). (D) A PCA scores plot for A. hyacinthus from two locations; Singapore (Sing) and Australia (Aus). Both (C,D) are for Radial samples only.
Separation was also observable in the PCA scores plots of A. hyacinthus from the two geographical locations (Australia and Singapore) (Figure 1D). This is despite colonies from both geographical regions being kept in the same mesocosm system for over 2 years. Univariate analysis (t-test with FDR correction) indicated features with a significant difference (p < 0.05) between species in all assays; HILIC (neg) 69 features; HILIC (pos) 137 features; LIPID (neg) 343 features; LIPID (pos) 103 features; 1H NMR 25 features (see SM met-annotations-mz-ttests located at https://doi.org/10.6084/m9.figshare.13915820.v1).
It should be noted that although genomic data was not collected for these corals, all colonies (regardless of natal reef), retained the characteristic tabular formation of the identified species, with new growth occurring at the peripheral edges (Supplementary Figure S4).
In experiment 2, the metabolomic profiles of both control samples and those exposed to acute temperature stress were compared. Consistent results were observed across both HILIC and LIPID assays; note 1H NMR was not utilized in experiment 2. After data filtering and pre-processing (see methods), 3339 peaks were observed in HILIC (neg), 4945 in HILIC (pos), 4904 in LIPID (neg) and 8590 in LIPID (pos) (see SM https://doi.org/10.6084/m9.figshare.13234874.v1).
We observed strong separation between the two species (Figure 2), with no separation for treatment (control vs. temperature stress) (Figure 3). To assess if the species variation masked any effect of temperature stress, we built a partial least squares discriminant analysis classification model (PLSDA), to discriminate between the control and temperature stress groups (Figure 4). A five-fold cross-validation identified that three components minimize the classification error. Performance of this model on test data was good (error 0.025), in comparison to that with the training set (error 0.00). Although results from the PCA did then identify differences between the metabolomic profiles of corals (in control and temperature stress groups) (Figure 5), in all cases, “late” components needed to be selected (i.e., 7 and 8 instead of 1 and 2). This suggests that any treatment effect is small (relative to other sources of variation, such as species). Interestingly, model performance for one assay, HILIC (neg), exhibited strong overlap with the performance of permuted null models (permutation testing), suggesting overfitting. Model performance for all other assays was better than for the permuted null models, with no overlap. Univariate statistics (t-test with FDR correction) indicated features with a significant difference (p < 0.05) between control and temperature stressed samples in all assays; HILIC (neg) 37 features; HILIC (pos) 65 features; LIPID (neg) 147 features; LIPID (pos) 444 features (see SM met-annotations-mz-ttests located at https://doi.org/10.6084/m9.figshare.13915820.v1). A large proportion of features were putatively assigned a metabolite name using accurate mass (m/z) data alone. Additionally, a subset of features were able to be assigned a metabolite structure utilizing fragmentation data and the mzCloud mass spectral library (see SM met-annotations-mzCloud-exp-2 located at https://doi.org/10.6084/m9.figshare.13915820.v1). One of these MSI level 2 annotations, propionylcarnitine (see SM propionylcarnitine-mzCloud located at https://doi.org/10.6084/m9.figshare.13915820.v1), corresponded to a feature that changed significantly between control and temperature stressed corals (see SM met-annotations-mz-ttests located at https://doi.org/10.6084/m9.figshare.13915820.v1).
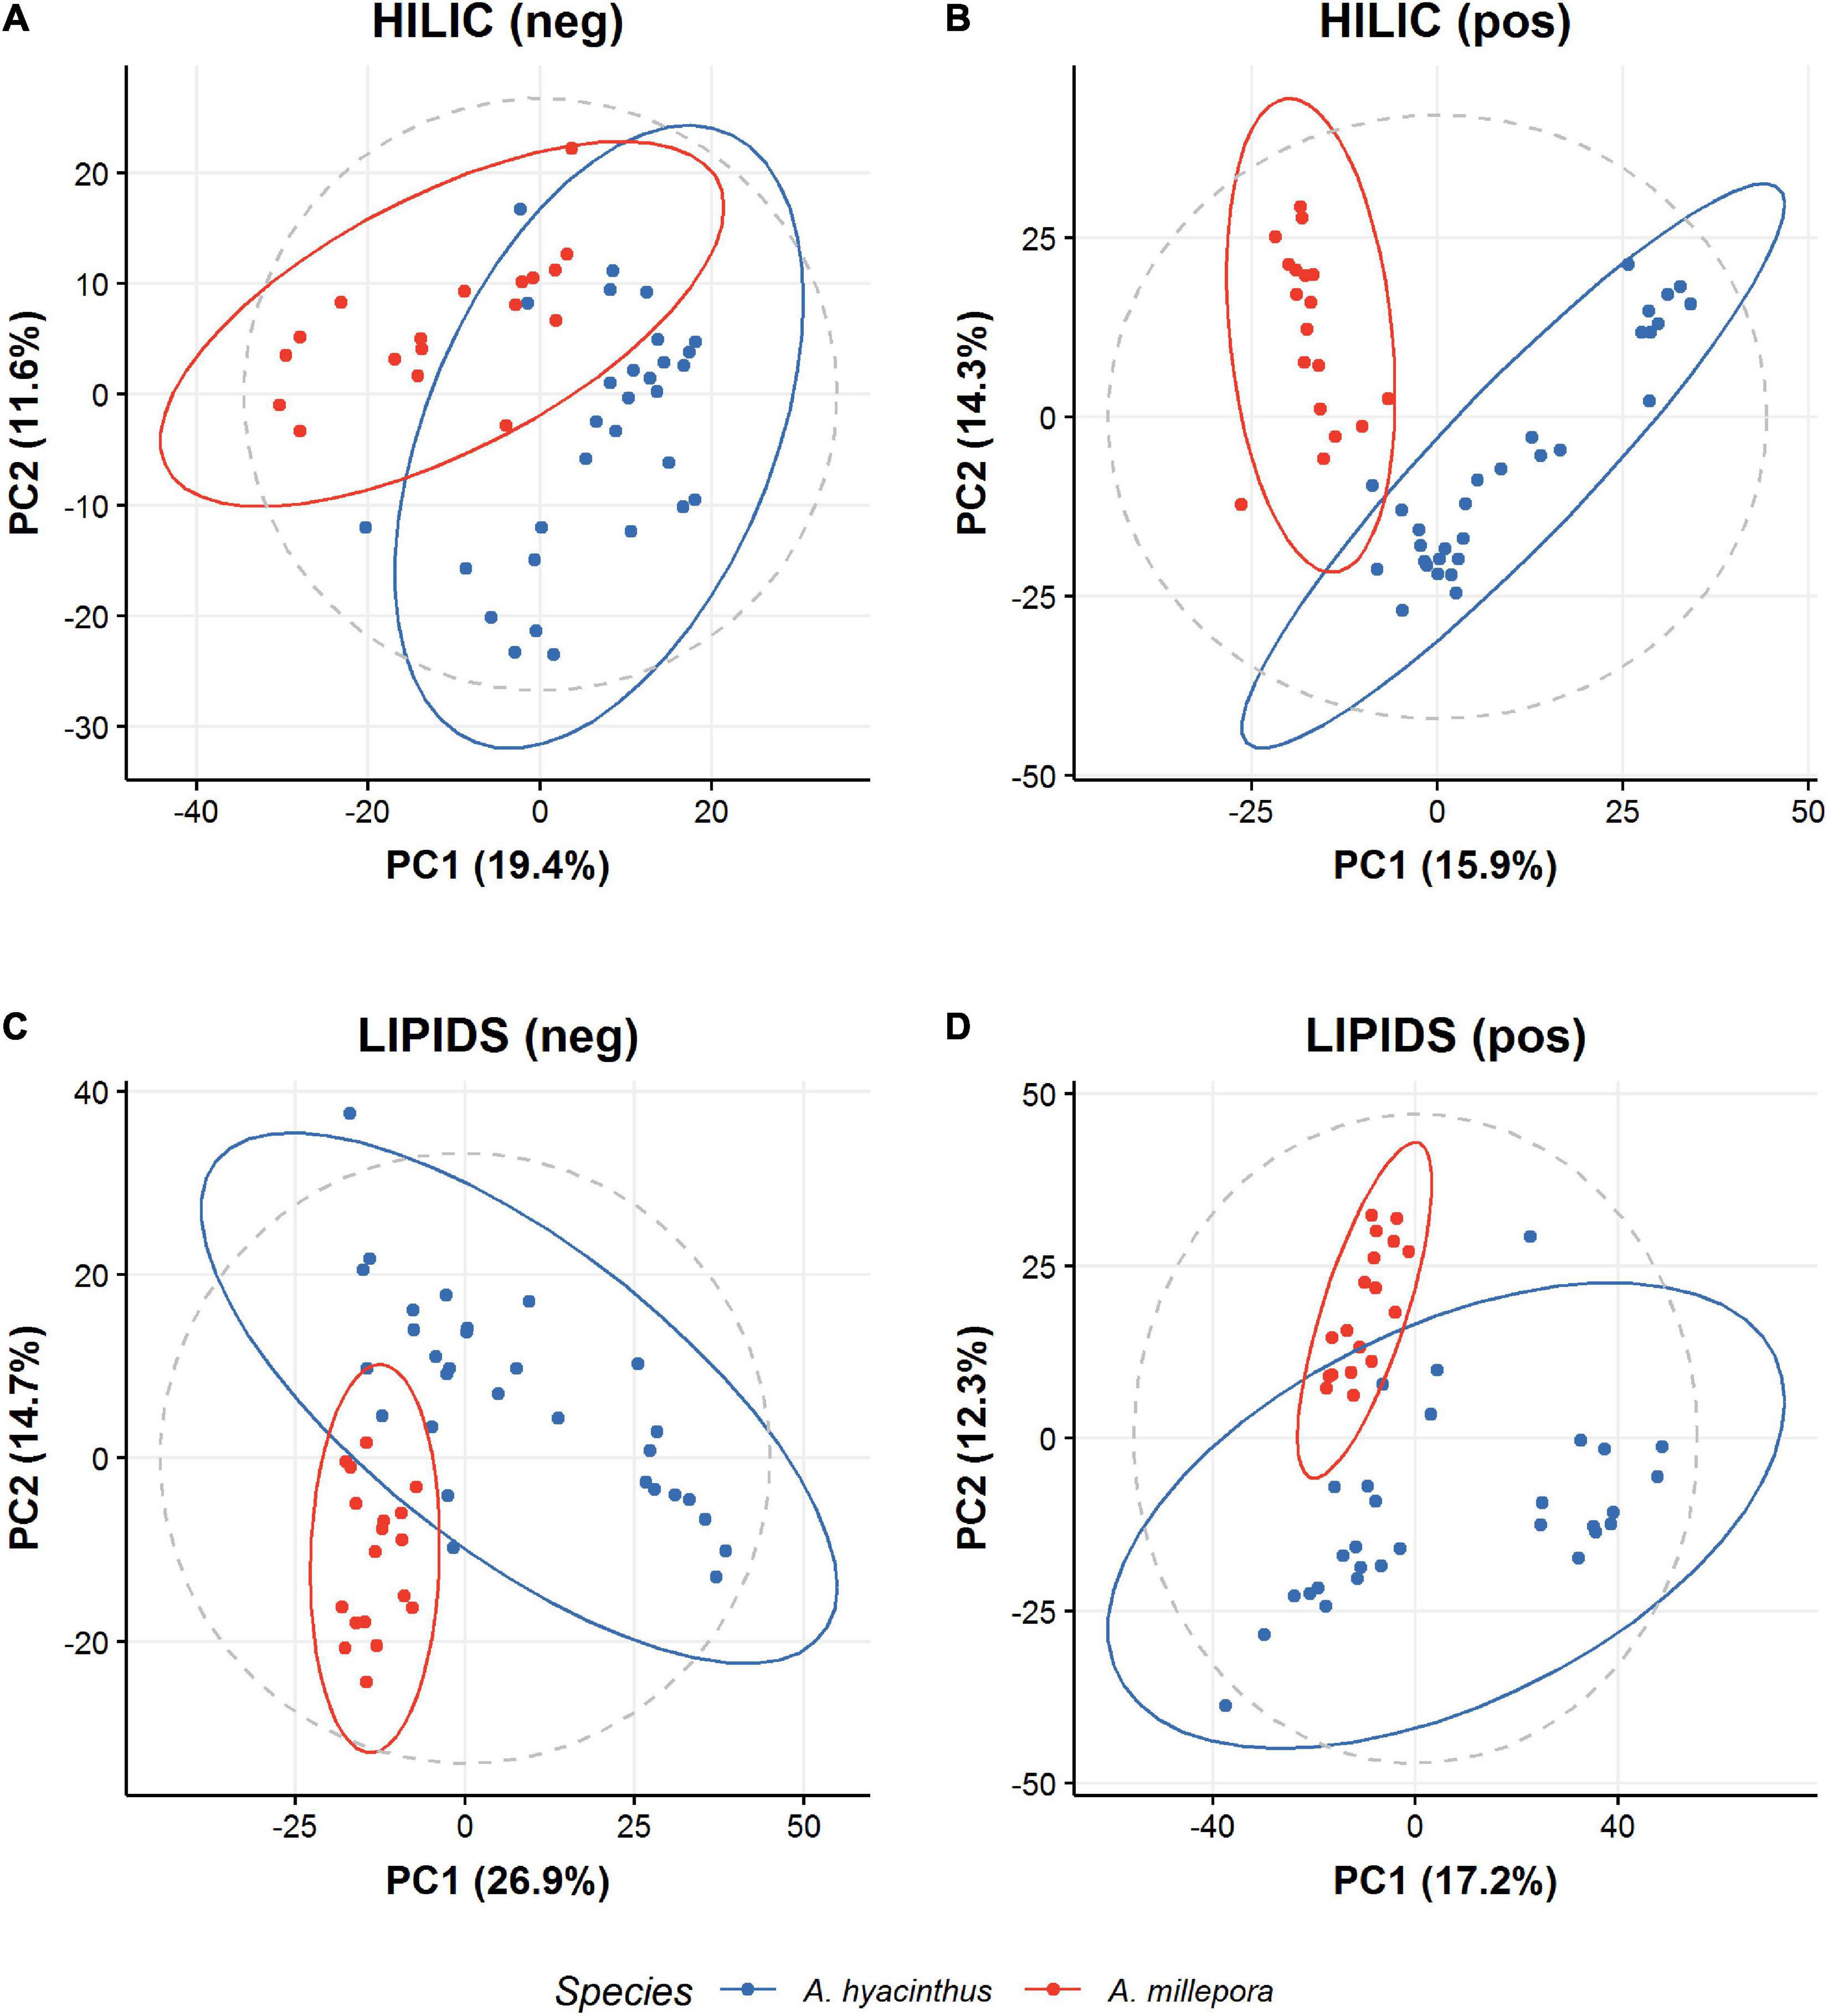
Figure 2. PCA scores representation of metabolomic profiles of A. hyacinthus (blue dots) and A. millepora (red dots) under control “natural” conditions. Results from polar HILIC coral extracts in (A) negative mode and (B) positive mode LC-MS, and of non-polar LIPID coral extracts in (C) negative mode and (D) positive mode LC-MS.
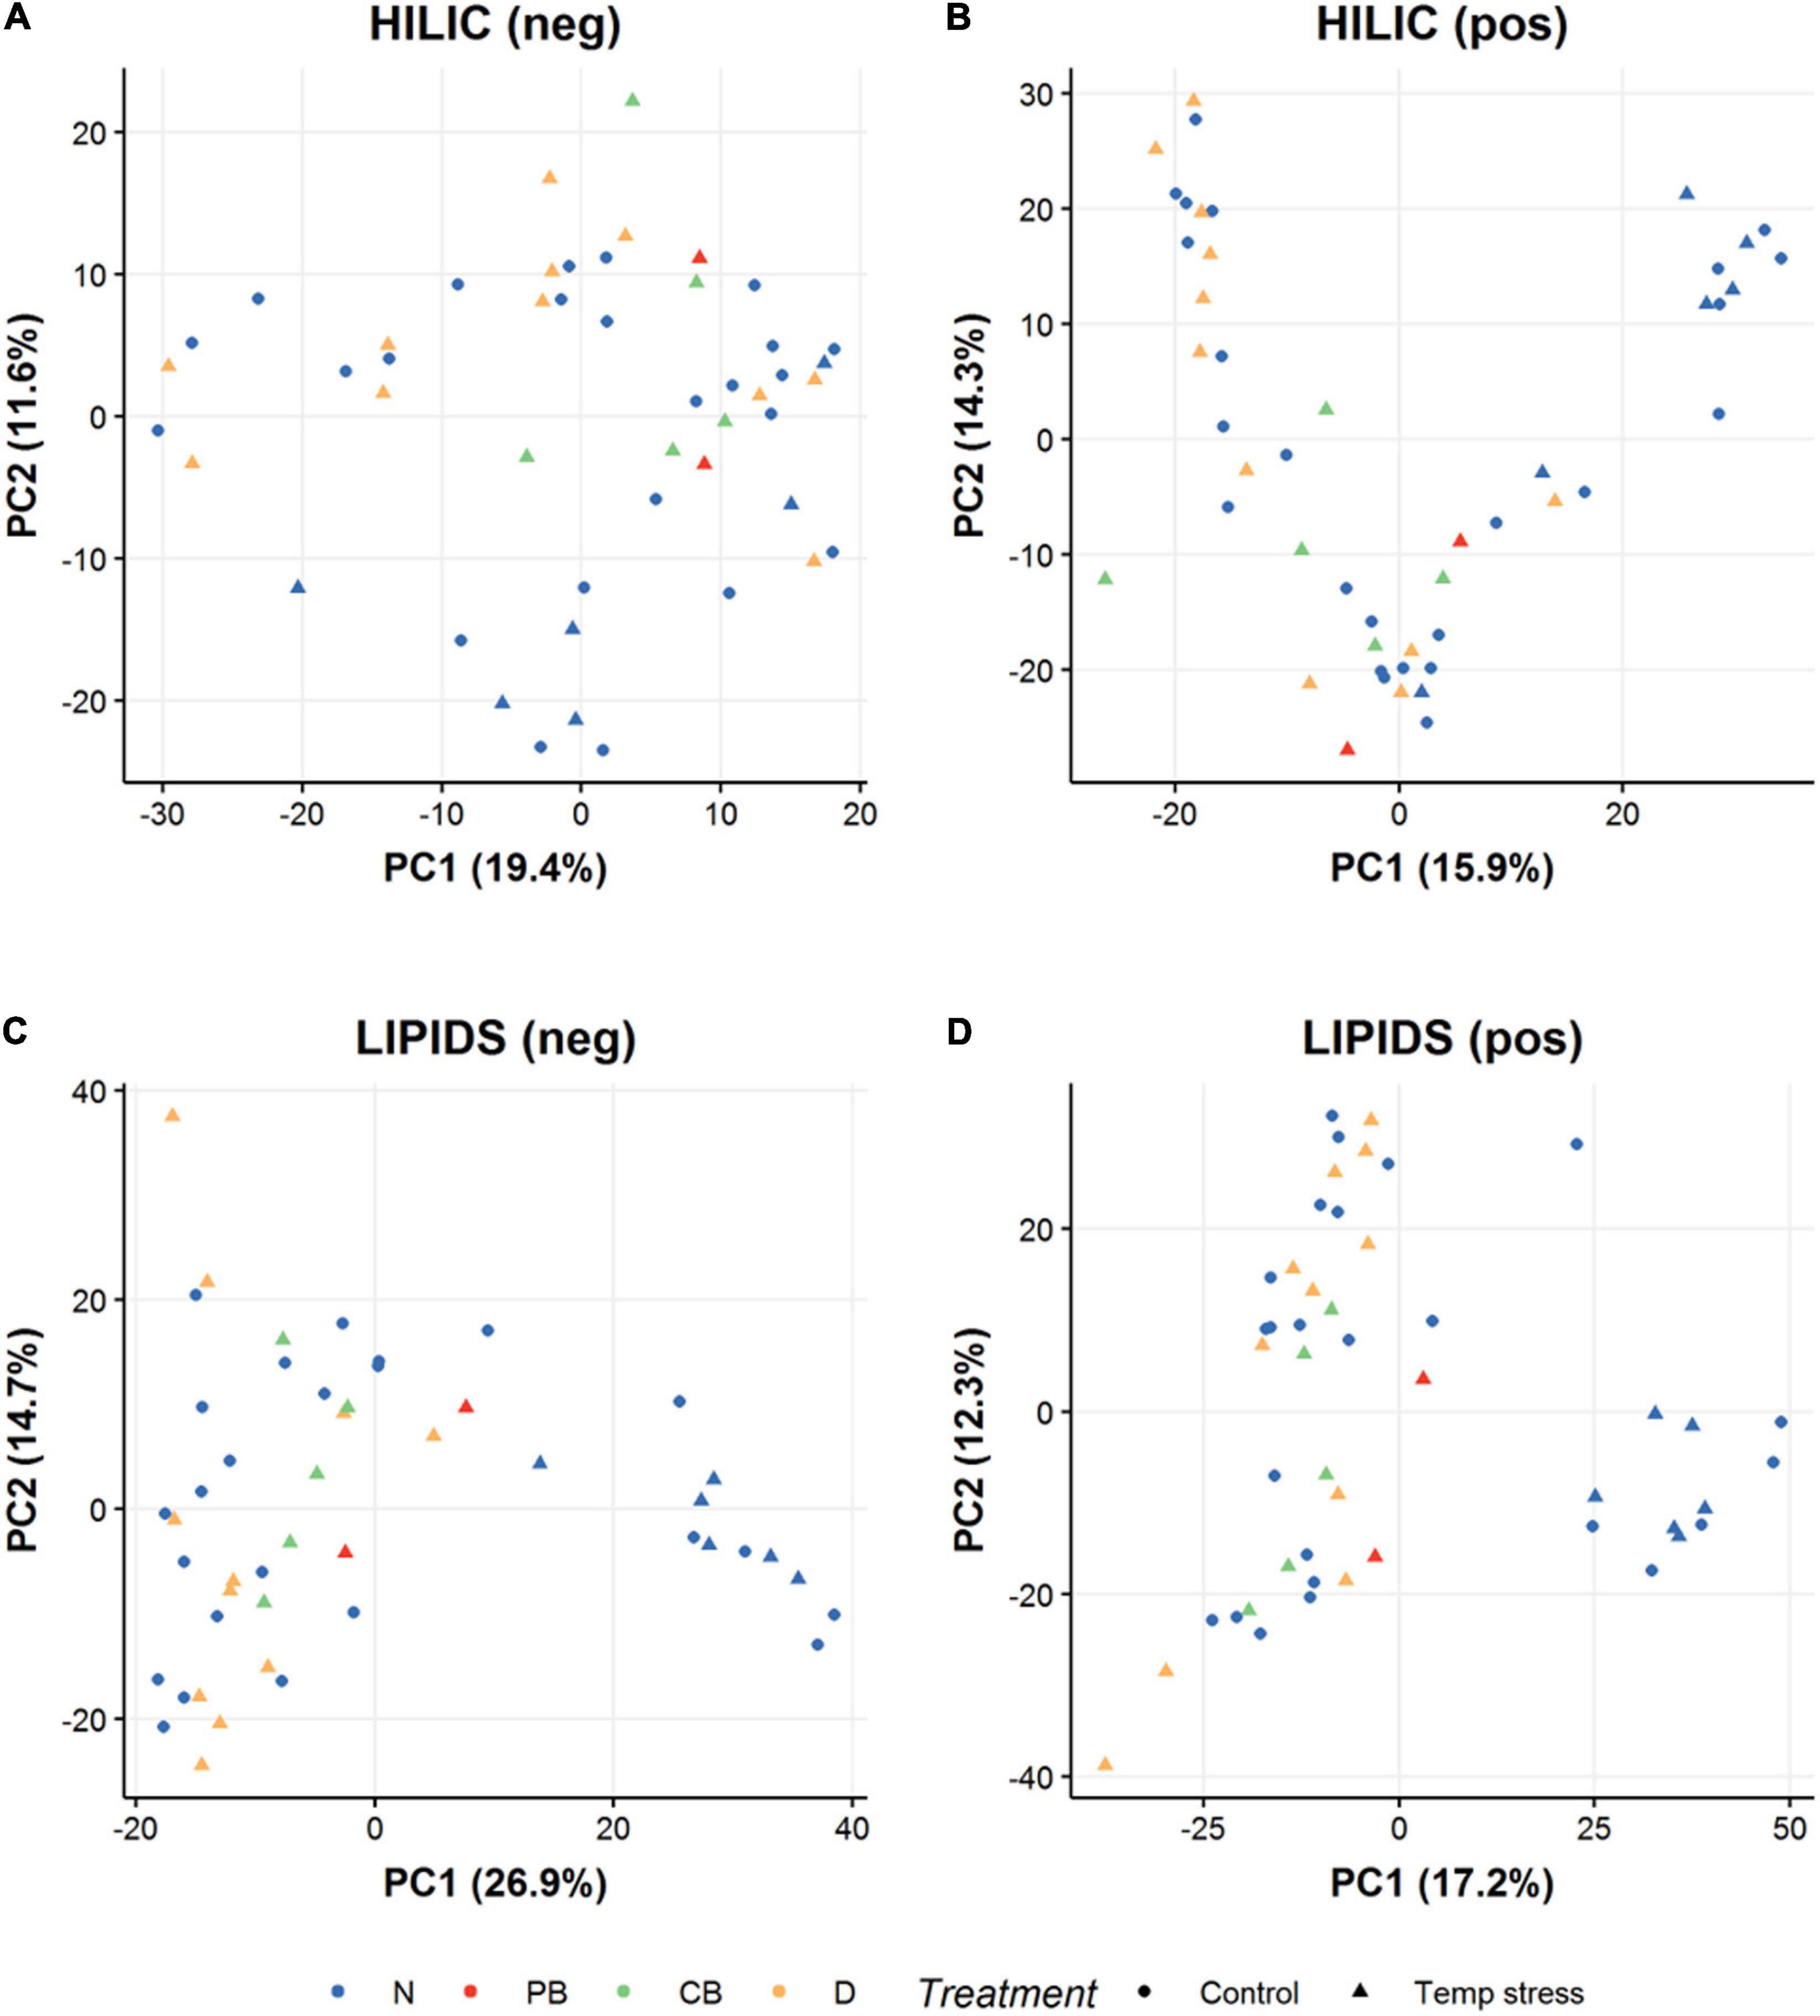
Figure 3. PCA scores representation of metabolomic profiles of A. hyacinthus and A. millepora exposed to acute temperature stress (28 days at 30.75°C). Results from polar HILIC coral extracts in (A) negative mode and (B) positive mode LC-MS, and from non-polar LIPID coral extracts in (C) negative mode and (D) positive mode LC-MS. Circles represent control samples and triangles represent those exposed to an acute temperature stress. Colors refer to the fate or health state of the corals after the prolonged temperature stress period which ran after the sampling for the metabolomic analysis; blue = not bleached, red = partially bleached, green = completely bleached and orange = rapid tissue necrosis and death.
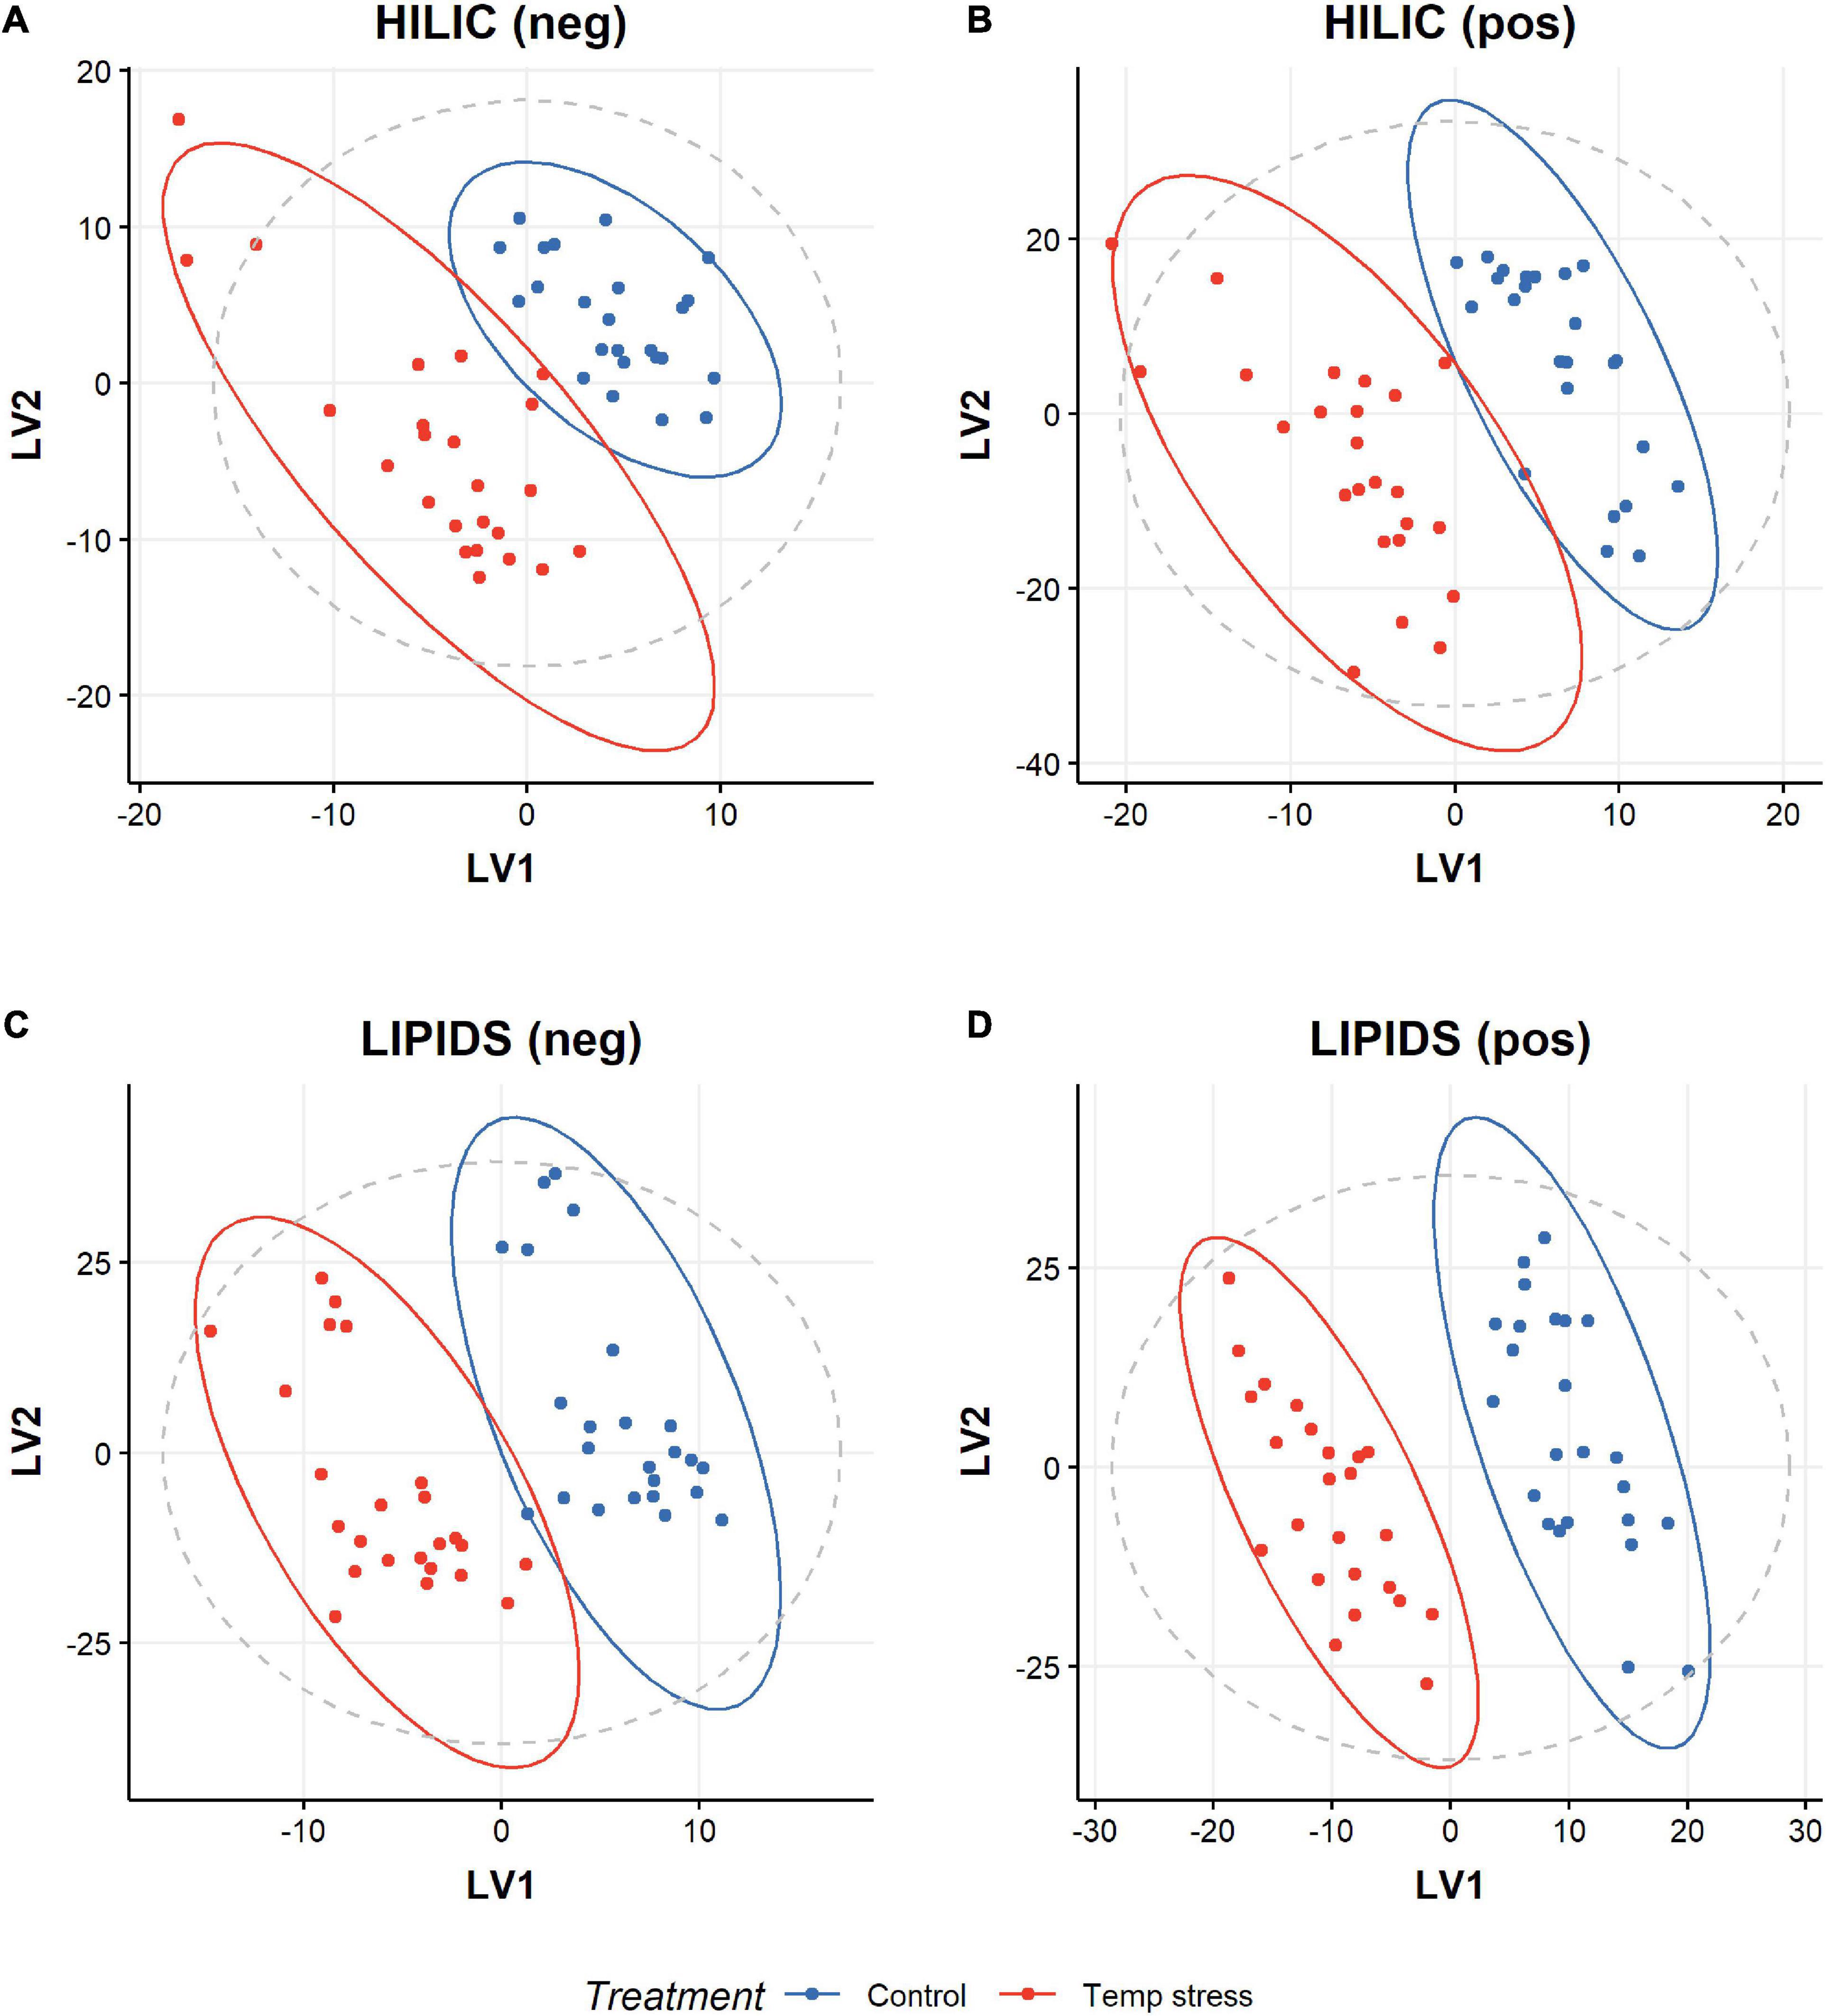
Figure 4. Distribution of metabolomic profiles of A. hyacinthus and A. millepora exposed to control or acute temperature stress (8 days at 30.75°C) represented by PLSDA scores. Distribution of polar HILIC coral extracts in (A) negative mode and (B) positive mode LC-MS, and of non-polar LIPID coral extracts in (C) negative mode and (D) positive mode LC-MS.
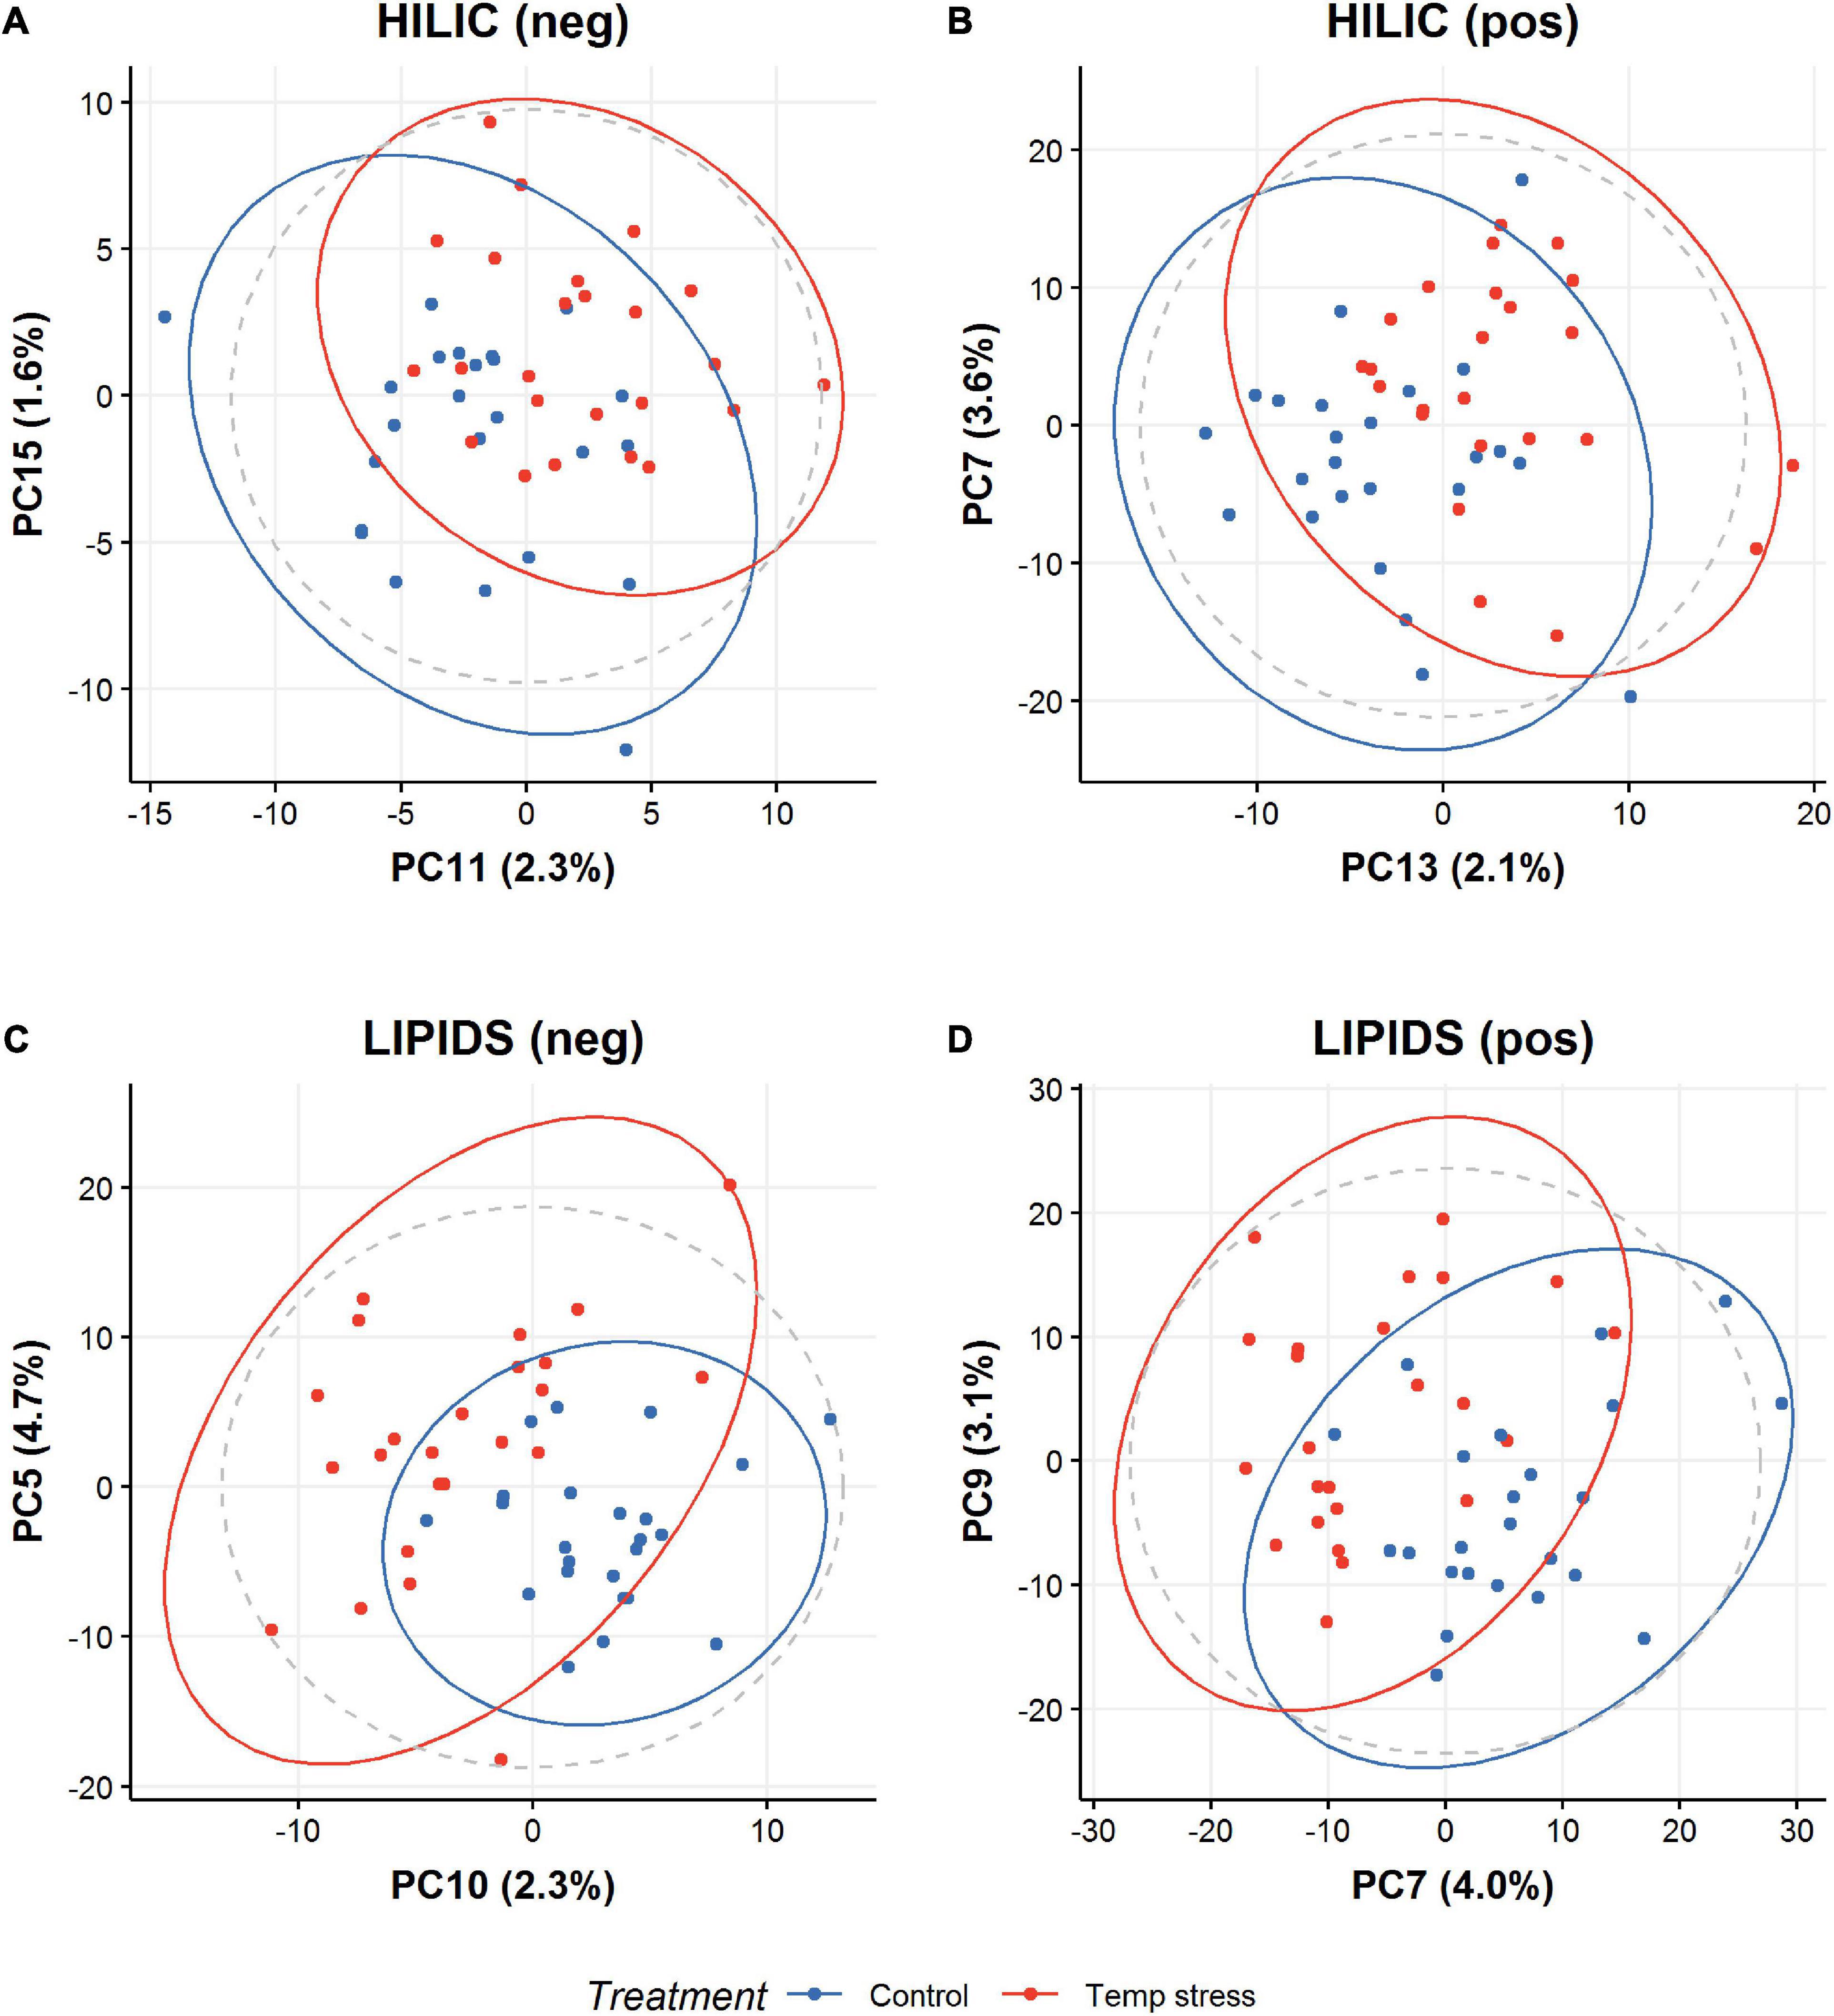
Figure 5. Distribution of polar HILIC coral extracts in (A) negative mode and (B) positive mode LC-MS, and of non-polar LIPID coral extracts in (C) negative mode and (D) positive mode LC-MS. PCA representation of the effect of treatment on colonies for all methods (LIPID/HILIC and negative/positive mode LC-MS). “Late” principal components (i.e., 5, 7, 9, 10, 11, 13, and 15 instead of 1 and 2), drive the separation, suggesting any treatment effect is small compared with effects from other variables such as species identity.
All A. hyacinthus colonies from Singapore survived prolonged exposure to elevated temperature (T2— Supplementary Figure S1) and were classified as healthy or not bleached (N), whilst all the Australian colonies showed some sign of bleaching stress (PB or CB) or death (D) (Figure 6). A. hyacinthus from Australia showed a slightly higher tolerance to stress compared to A. millepora, with a lesser fragment mortality rate (50% of A. hyacinthus fragments died by the end of the prolonged thermal stress compared to 75% of A. millepora fragments—see Figure 6). Surprisingly, there was no observable difference in the metabolomic profiles of the corals at T1 (Figure 3), regardless of their final health states at T2 i.e., the profiles taken after acute exposure to elevated temperature and prior to any visible signs of stress could not be used to predict the health state of the corals after prolonged exposure (Figure 3).
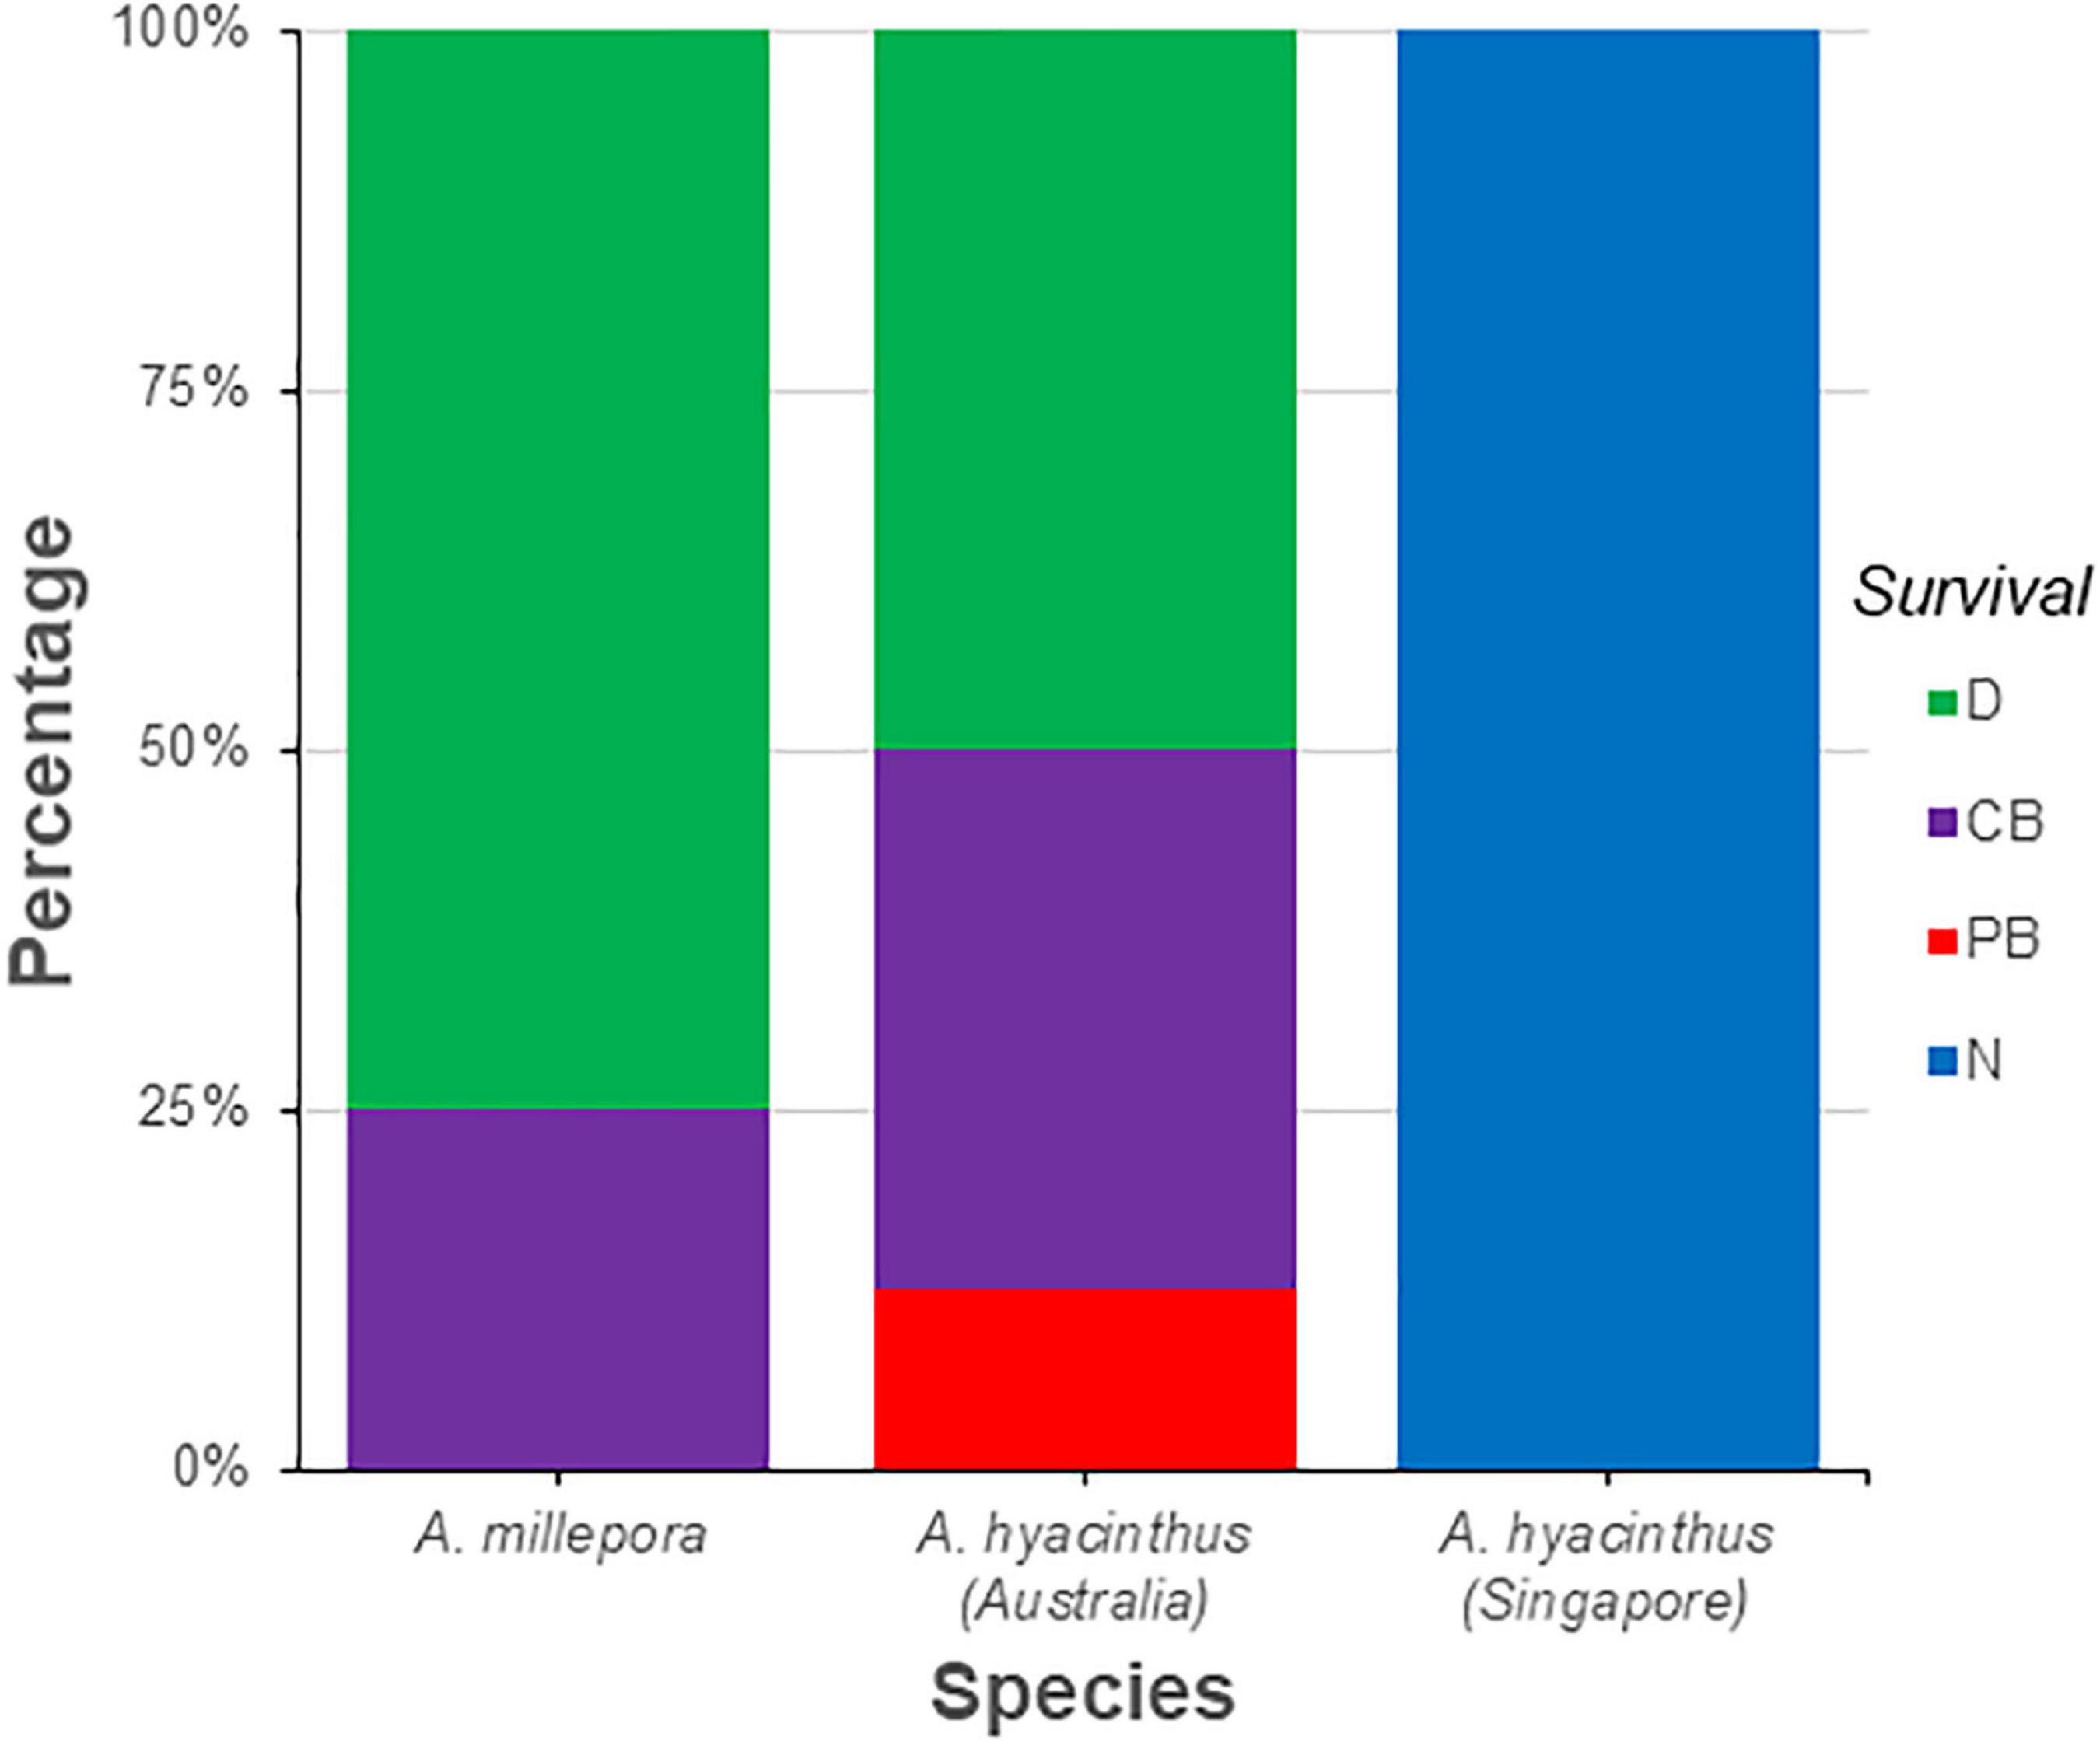
Figure 6. Post temperature stress survival (%) of Acropora millepora and Acropora hyacinthus colonies from the two geographical locations (Australia and Singapore). N, not bleached; PB, partially bleached; CB, completely bleached; D, Dead.
Discussion
The ability of 1H NMR and LC-MS to differentiate corals under several scenarios was evaluated, and the derived metabolomic profiles interrogated. Even with low biomass coral samples, both analytical techniques revealed metabolomic profiles that grouped similarly. Furthermore, the same trends were also observed for both the HILIC and LIPID LC-MS profiles. However, this is contrary to a previous coral metabolite study (Sogin et al., 2016), who noted that the primary HILIC metabolite profiles are better predictors of global climate change exposure than LIPID. Clearly, we are in the early stages of utilizing these methods in coral research, and it will only be after a larger number of studies have been undertaken that we will achieve a more comprehensive understanding of the comparative merits of these methods in this field.
This study also illustrates that intra-colony metabolic variation is comparable between axial and radial polyps for both A. millepora and A. hyacinthus, a similar result to that previously shown for Porites compressa (Sogin et al., 2014). This suggests that metabolite profiles are relatively homogenous within a colony, and that sampling from different locations on the colony will not greatly affect results (Sogin et al., 2014). However, it should be noted that Galtier d’Auriac et al. (2018) highlighted that the amounts of specific metabolites associated with growth (such as platelet-activating factor production) are higher in growing regions (i.e., axial polyps) compared to non-growing regions (i.e., the base). Therefore, although general trends in metabolic profiles may indeed be similar across regions (as seen in our study), variation in specific metabolites is likely to occur. This means that careful consideration in relation to the specific objectives of a study is still needed when deciding on the appropriate sampling region. For example, a study focusing on metabolites associated with gametogenesis in Acroporid species might yield variations between axial and radial polyps as many species within this group are infertile in the growing branch tips (Wallace, 1985).
We also show that variation in metabolite profiles between species was greater than between colonies of the same species. This again supports results from previous studies, which indicate that metabolomics can be utilized to differentiate between species and/or genera of corals (Sogin et al., 2014; Quinn et al., 2016; Vohsen et al., 2019). Specifically, metabolites putatively annotated as catechin, alanine, threonine, lactate, valine, isoleucine and leucine appear to differentiate coral species in our study (see SM met-annotations-mz-ttests located at https://doi.org/10.6084/m9.figshare.13915820.v1 and the studies; Sogin et al., 2014; Quinn et al., 2016; Lohr et al., 2019). The putative annotation of catechin is of particular interest as it is a flavonoid known for its antioxidant properties in many plants (Cuadrado-Silva et al., 2017; D’Urso et al., 2018). Further, catechin has been shown to prevent bleaching in thermally stressed Porites astreoides (Yudowski et al., 2018) and tentatively identified in Acropora cervicornis, although its role in thermotolerance for Acroporids remains undetermined (Lohr et al., 2019).
Despite a growing number of metabolomic studies using profiles to establish species separation, these differences do not always map to the evolutionary relationships between coral species (Sogin et al., 2014; Quinn et al., 2016; Vohsen et al., 2019). This is in contrast to the phlylosymbiosis shown amongst coral microbiomes (Pollock et al., 2018). Here we show clear differences in metabolomic profiles between closely related species and the same species (populations) separated by distinct geographical distances. This latter result is comparable to results from studies on soft corals (Callogoria delta and Sarcophyton ehrenbergi) which have been shown to exhibit varying metabolomic profiles and richness at the individual and population levels (Farag et al., 2016; Vohsen et al., 2019). Initially, one would point to the environment from where these corals were sampled as being a major driver of the different metabolomic profiles (Farag et al., 2016). However, our corals had been maintained in the same ex situ mesocosm (same environment) since 2017 (2 years at the time of sampling). Farag et al. (2016) also highlighted that wild collected corals (of the same species), were distinct in their metabolomic profiles compared to their counterparts housed in aquaria. They attributed this change to diet, specifically the enrichment of cembranoids (reduction of diterpene and enrichment of oxylipid in the aquarium housed colonies compared with their wild counterparts) (Bonini et al., 1983). As we did not assess the metabolomic profiles of the wild types in our study, we cannot rule out the role of diet in our profiles, although, diterpene or oxylipid were not even putatively annotated in any of our samples (see SM met-annotations-mz-ttests located at https://doi.org/10.6084/m9.figshare.13915820.v1 and for the complete data sets https://doi.org/10.6084/m9.figshare.13234874.v1). Further, the diet was consistent between the species assessed in this study.
Another, alternative and potentially complementary explanation, for why our corals retained their inter-species and geographic variation despite being exposed to the same environmental conditions for 2 years, may be that of a lack of phenotypic plasticity or acclimation (at least in terms of their metabolomic profiles). Indeed, a similar strong influence of a source effect (i.e., the origin of the coral) has been shown in previous studies when exploring gene expression of basic biological functions and response to environmental change; in particular genes associated with biosynthetic processing, translation and ribosome biogenesis (Rocker et al., 2019). That said, fatty acid composition and specific genes related to elevated health and immunity were shown to respond to changes in environmental conditions in the same study (Rocker et al., 2019). Similarly, for the same coral species as utilized in this study (Acropora millepora), transcriptional plasticity has been shown when colonies from different populations were exposed to different levels of turbidity (Bay et al., 2009). In this latter study, declines in total lipid content following translocation were greatest for inshore corals compared to offshore populations, suggesting turbid water corals likely have a strong reliance on heterotrophic feeding (Bay et al., 2009). Similar differences in ecological characteristics of corals from the two origin reefs in our study, may therefore explain some of the observed lack of plasticity witnessed in our experiment. For example differences in; (a) growth and morphology between the colonies from the different locations (Todd, 2008), (b) their life history strategy e.g., reliance on heterotrophy (Bay et al., 2009) and/or (c) variation in the core or key members of their microbiome (Januar et al., 2012). However, as these were not measured, we are unable to conclude if these played a role in the observed metabolomic profiles. Even so, the Australian A. hyacinthus colonies were more affected by prolonged thermal stress than those from Singapore with many more being classified as PB, CB, or D (Supplementary Figure S5). This is not unsurprising given the lower temperature range that the Australian A. hyacinthus colonies were historically exposed to (i.e., before collection and transport to the aquarium).
This working hypothesis around the lack of metabolomic plasticity is further supported by the lack of change in the metabolomic profiles when the colonies were exposed to an acute temperature stress experiment. The lack of separation in the profiles was surprising and contrary to a number of other studies (Rosenblum et al., 2006; Boroujerdi et al., 2009; Sogin et al., 2016). That said, some of these studies only highlighted relatively minimal changes in the host pools of 13C-enriched glucose (Hillyer et al., 2017a). Similarly, in bleaching Acropora aspera, minimal 13C enrichment of host fatty acid pools was also observed, despite pronounced photodamage in its symbionts (Hillyer et al., 2018). In our study, the lack of separation may be explained by the degree of stress imposed on our test subjects. Here we explored the effect of an acute heat stress, i.e., high temperature over a relatively short time period (an increase of 3.25°C ± 0.28 from ambient control levels over 8 days). Although we acknowledge this is a very brief, and therefore likely minor stress event for the corals, a recent study (Voolstra et al., 2020) has shown that even acute stress assays mirror the results of longer term studies (21 days in their case). Further Voolstra et al. (2020) highlighted that both long and short term assays have the ability to resolve coral thermotolerance differences reflective of in situ reef temperature thresholds. It should also be noted that we purposefully conducted our sampling prior to the onset of visible signs of bleaching so as to assess small scale metabolomic shifts which were occurring in otherwise apparently healthy coral. In contrast, other studies have run their experiments for upwards of 1.5 months (Sogin et al., 2016), and only then shown significant shifts in the metabolomic primary (HILIC) profiles. If we had sampled our colonies at the end of the full-term stress experiment (when the corals were showing signs of stress, bleaching, disease, and death) shifts in the metabolomic profiles would almost certainly be more evident. Running the experiment for slightly longer time periods (16 days to 5 weeks for example), would have likely resulted in more profound shifts in the metabolomic profiles of the corals. Our results would have then likely reflected studies such as Williams et al. (2021), who illustrated changes in the metabolome of heat tolerant Montipora capitata and heat sensitive Pocillopora acuta. However, this latter study did not present generalized patterns in their metabolomics data (as presented in this study), instead choosing to focus on specific metabolomic features that accumulated during stress, making direct comparisons difficult.
An alternative explanation to our contrasting findings with these other studies, may be the differences in model species utilized. That said, Acroporids, (the corals used in the current study), are well known for being more susceptible to heat stress than most other species (Mydlarz et al., 2010). Therefore, this latter explanation seems less likely to apply. In support of the acute nature of the stress being the explanation for the differences in findings with previous work, major lipid regulation in corals typically only occurs after exposure to extreme stress events (Grottoli et al., 2004; Fitt et al., 2009). It is therefore probable that our stress was not extreme enough to illicit a response in the metabolomic profiles. However, we cannot rule out the hypothesis that adult colonies are more resilient (or less plastic) in their metabolomic profiling than previously thought. Interestingly, Sogin et al. (2016) also showed no significant difference in the LIPID LC-MS profiles during their longer term stress event, providing further evidence supporting this theory.
Despite the lack of separation between metabolomic profiles of the control and temperature stressed corals, we were able to report several metabolites which appeared to vary significantly between the groups, indicating them as potentially relevant biomarkers. Although the majority of these metabolites were putatively assigned using accurate mass (m/z) only, one (propionylcarnitine), was able to be annotated with a higher level of confidence utilizing MS/MS fragmentation data and spectral library matching. Although not previously noted as important in corals, this metabolite has been identified in the stress response of other marine calcifying organisms such as mussels (Connor and Gracey, 2012). Interestingly, there is now growing evidence indicating that propionylcarnitine plays a crucial role in the cellular stress response to oxidative damage (Calabrese et al., 2009). As oxidative stress is a clear component of the bleaching process in corals following increases in sea surface temperatures (Lesser, 1997; Dias et al., 2019), further work assessing changes in this metabolite in corals is therefore warranted. Other metabolites identified in our study which were shown to significantly change between control and temperature stressed corals include the betaines, which have previously been linked with being photoprotective (Hill et al., 2010), nicotinamide, reported as a key metabolite in thermally stressed anemones (Hillyer et al., 2016) and D-(+)-proline, which has previously been shown to accumulate in corals under prolonged thermal stress (Williams et al., 2021). Indeed, a recent study highlighted the ability to predict bleaching response in corals (with 100% accuracy) by using a group of betaine lipids (Roach et al., 2020). Those with saturated fatty acids were significantly enriched in thermally tolerant corals whilst those with longer, unsaturated and diacyl forms were more enriched in historically bleached colonies (Roach et al., 2020). However, it should be noted that in our study we were only able to putatively annotate the metabolites and so although there is some evidence that these represent useful biomarkers in coral thermotolerance further work needs to be conducted in this regard.
Other metabolites that were putatively annotated in this study appear to be associated more with the corals’ symbionts and their thermotolerance. These included histidine and threonine (Hillyer et al., 2016, 2017b), and inosine, hypoxanthine, and guanine (Xiang et al., 2020). Finally, uradine is interesting, as this metabolite may well be important to the coral holobiont but appears to be associated more with the corals’ microbiome rather than the host itself. Fang et al. (2019) showed that uradine has high antibacterial capabilities against pathogenic bacteria and is derived from a coral associated actinomycete (Fang et al., 2019). Increased amounts of uridine in thermally stressed corals could indicate a response of the coral holobiont to rising temperatures, acting as a line of defense in preparation for disease infection and is therefore worthy of further investigation in this regard. These examples collectively highlight the great promise of the use of metabolomics in the field of coral biology, specifically when tasked with identifying key processes and mechanisms underpinning coral responses to stress.
To summarize, our findings indicate that studies exploring the prospect of HAE/AGF and assessing metabolomics (and likely also proteomics) as a proxy for host fitness should consider running longer-term experiments when assessing the response of adult coral colonies, particularly if the question is to assess host responses to a given stress. The potential gains in our knowledge of coral physiology and ecology through the application of metabolomics are considerable. However, there are currently a number of logistical issues around the analysis of metabolomic data which limit the insights that can currently be gained. Although there is an increasing number of natural product databases available, not all contain MSn data against which ions and fragment ions can be searched, for example. Further, there is no consensus on optimal experimental protocols for metabolomic studies. Finally, we recommend that to better capture the full range of metabolites associated with a particular genotype, or across species, time series designs should be incorporated into future studies. For example, sampling points during periods of high and low thermal stress will be extremely useful in discovering metabolites associated with thermal tolerance.
Data Availability Statement
The raw data supporting the conclusions of this article will be made available by the authors, without undue reservation.
Author Contributions
MS designed the study, collected, analyzed and assessed the samples, wrote the manuscript. JC conducted the aquarium studies and collected the samples. DV organized and assisted in extraction of samples for metabolomics. MS, GL, AJ, LN, RW, and MV worked on the metabolomics and analysis. All authors edited the manuscript.
Funding
This work was partially supported by the UK Natural Environment Research Council’s Biomolecular Analysis Facility at the University of Birmingham (R8-H10-61) through an NBAF award (NBAF-1071).
Conflict of Interest
The authors declare that the research was conducted in the absence of any commercial or financial relationships that could be construed as a potential conflict of interest.
Acknowledgments
We would like to thank the UK Medical Research Council for funding the construction of the Phenome Centre Birmingham (MR/M009157/1). In addition, we thank SEAWORLD and Busch Gardens Conservation fund, EcoTech Marine and Triton Applied Reef Bioscience for supporting the running of the mesocosms in which the experimental work was conducted. We would also like to thank the reviewers for their diligent assessment and advice which greatly improved the manuscript. All raw data associated with this project can be found at https://doi.org/10.6084/m9.figshare.13234874.v1
Supplementary Material
The Supplementary Material for this article can be found online at: https://www.frontiersin.org/articles/10.3389/fmars.2021.574292/full#supplementary-material
Footnotes
References
Bay, L. K., Ulstrup, K. E., Nielsen, H. B., Jarmer, H., Goffard, N., Willis, B. L., et al. (2009). Microarray analysis reveals transcriptional plasticity in the reef building coral Acropora millepora. Mol. Ecol. 18, 3062–3075. doi: 10.1111/j.1365-294X.2009.04257.x
Bonini, C., Kinnel, R. B., Li, M., Scheuer, P. J., and Djerassai, C. (1983). Minor and trace sterols in marine invertebrates: isolation, structure elucidation and partial synthesis of papakusterol, a new biosynthetically unusual marine sterol with a cyclopropyl-containing side chain. Tetrahedron Lett. 24, 277–280. doi: 10.1016/S0040-4039(00)81384-2
Boroujerdi, A. F. B., Vizcaino, M. I., Meyers, A., Pollock, E. C., Huynh, S. L., Schock, T. B., et al. (2009). NMR-based microbial metabolomics and the temperature-dependent coral pathogen Vibrio coralliilyticus. Environ. Sci. Technol. 43, 7658–7664. doi: 10.1021/es901675w
Brown, M., Wedge, D. C., Goodacre, R., Kell, D. B., Baker, P. N., Kenny, L. C., et al. (2012). Automated workflows for accurate mass-based putative metabolite identification in LC/MS-derived metabolomic datasets. Bioinformatics 28:149. doi: 10.1093/bioinformatics/btr601
Burriesci, M. S., Raab, T. K., and Pringle, J. R. (2012). Evidence that glucose is the major transferred metabolite in dinoflagellate-cnidarian symbiosis. J. Exp. Biol. 215, 3467–3477. doi: 10.1242/jeb.070946
Calabrese, V., Cornelius, C., Dinkova-Kostova, A. T., and Calabrese, E. J. (2009). Vitagenes, cellular stress response, and acetylcarnitine: Relevance to hormesis. Biofactors 35, 146–160. doi: 10.1002/biof.22
Connor, K. M., and Gracey, A. Y. (2012). High-resolution analysis of metabolic cycles in the intertidal mussel Mytilus californianus. Am. J. Physiol. Regul. Integr. Comp. Physiol. 302, R103–R111. doi: 10.1152/ajpregu.00453.2011
Craggs, J., Guest, J., Brett, A., Davis, M., and Sweet, M. (2018). Maintaining natural spawning timing in Acropora corals following long distance inter-continental transportation. J. Zoo Aquar. Res. 6, 30–36. doi: 10.19227/jzar.v6i2.317
Craggs, J., Guest, J. R., Davis, M., Simmons, J., Dashti, E., and Sweet, M. (2017). Inducing broadcast coral spawning ex situ: closed system mesocosm design and husbandry protocol. Ecol. Evol. 7, 11066–11078. doi: 10.1002/ece3.3538
Cuadrado-Silva, C. T., and Pozo-Bayón, M. Á, and Osorio, C. (2017). Targeted metabolomic analysis of polyphenols with antioxidant activity in sour guava (Psidium friedrichsthalianum Nied.) fruit. Molecules 22:11. doi: 10.3390/molecules22010011
Dias, M., Madeira, C., Jogee, N., Ferreira, A., Gouveia, R., Cabral, H., et al. (2019). Oxidative stress on scleractinian coral fragments following exposure to high temperature and low salinity. Ecol. Indic. 107:105586. doi: 10.1016/j.ecolind.2019.105586
Dieterle, F., Ross, A., Schlotterbeck, G., and Senn, H. (2006). Probabilistic quotient normalization as robust method to account for dilution of complex biological mixtures. Application in1H NMR metabonomics. Anal. Chem. 78, 4281–4290. doi: 10.1021/ac051632c
D’Urso, G., Pizza, C., Piacente, S., and Montoro, P. (2018). Combination of LC–MS based metabolomics and antioxidant activity for evaluation of bioactive compounds in Fragaria vesca leaves from Italy. J. Pharm. Biomed. Anal. 150, 233–240. doi: 10.1016/j.jpba.2017.12.005
Fang, Z., Chen, S., Zhu, Y., Li, J., Khan, I., Zhang, Q., et al. (2019). A new uridine derivative and a new indole derivative from the coral-associated actinomycete Pseudonocardia sp. SCSIO 11457. Nat. Prod. Res. 35, 1–7. doi: 10.1080/14786419.2019.1616729
Farag, M. A., Porzel, A., Al-Hammady, M. A., Hegazy, M. E. F., Meyer, A., Mohamed, T. A., et al. (2016). Soft corals biodiversity in the egyptian red sea: a comparative MS and NMR metabolomics approach of wild and aquarium grown species. J. Proteome Res. 15, 1274–1287. doi: 10.1021/acs.jproteome.6b00002
Fitt, W. K., Gates, R. D., Hoegh-Guldberg, O., Bythell, J. C., Jatkar, A., Grottoli, A. G., et al. (2009). Response of two species of Indo-Pacific corals, Porites cylindrica and Stylophora pistillata, to short-term thermal stress: the host does matter in determining the tolerance of corals to bleaching. J. Exp. Mar. Biol. Ecol. 373, 102–110. doi: 10.1016/j.jembe.2009.03.011
Galtier d’Auriac, I., Quinn, R. A., Maughan, H., Nothias, L. F., Little, M., Kapono, C. A., et al. (2018). Before platelets: the production of platelet-activating factor during growth and stress in a basal marine organism. Proc. Biol. Sci. 285:20181307. doi: 10.1098/rspb.2018.1307
Gordon, B. R., and Leggat, W. (2010). Symbiodinium – Invertebrate symbioses and the role of metabolomics. Mar. Drugs 8, 2546–2568. doi: 10.3390/md8102546
Grottoli, A. G., Rodrigues, L. J., and Juarez, C. (2004). Lipids and stable carbon isotopes in two species of Hawaiian corals, Porites compressa and Montipora verrucosa, following a bleaching event. Mar. Biol. 145, 621–631. doi: 10.1007/s00227-004-1337-3
Hill, R. W., Li, C., Jones, A. D., Gunn, J. P., and Frade, P. R. (2010). Abundant betaines in reef-building corals and ecological indicators of a photoprotective role. Coral Reefs 29, 869–880. doi: 10.1007/s00338-010-0662-x
Hillyer, K. E., Dias, D., Lutz, A., Roessner, U., and Davy, S. K. (2018). 13 C metabolomics reveals widespread change in carbon fate during coral bleaching. Metabolomics 14:12. doi: 10.1007/s11306-017-1306-8
Hillyer, K. E., Dias, D. A., Lutz, A., Roessner, U., and Davy, S. K. (2017a). Mapping carbon fate during bleaching in a model cnidarian symbiosis: the application of 13C metabolomics. New Phytol. 214, 1551–1562. doi: 10.1111/nph.14515
Hillyer, K. E., Dias, D. A., Lutz, A., Wilkinson, S. P., Roessner, U., and Davy, S. K. (2017b). Metabolite profiling of symbiont and host during thermal stress and bleaching in the coral Acropora aspera. Coral Reefs 36, 105–118. doi: 10.1007/s00338-016-1508-y
Hillyer, K. E., Tumanov, S., Villas-Bôas, S., and Davy, S. K. (2016). Metabolite profiling of symbiont and host during thermal stress and bleaching in a model cnidarian-dinoflagellate symbiosis. J. Exp. Biol. 219, 516–527. doi: 10.1242/jeb.128660
Januar, H., Marraskuranto, E., Patantis, G., and Chasanah, E. (2012). LC-MS metabolomic analysis of environmental stressor impacts on the metabolite diversity in Nephthea spp. Chron. Young Sci. 3:57. doi: 10.4103/2229-5186.94319
Kessner, D., Chambers, M., Burke, R., Agus, D., and Mallick, P. (2008). ProteoWizard: open source software for rapid proteomics tools development. Bioinformatics 24, 2534–2536. doi: 10.1093/bioinformatics/btn323
Kopp, C., Domart-Coulon, I., Escrig, S., Humbel, B. M., Hignette, M., and Meibom, A. (2015). Subcellular investigation of photosynthesis-driven carbon assimilation in the symbiotic reef coral Pocillopora damicornis. MBio 6:e2299-14. doi: 10.1128/mBio.02299-14
Kornprobst, J.-M. (2014). “Cnidaria and ctenophora-2,” in Encyclopedia of Marine Natural Products, eds Wiley-VCH Verlag GmbH & Co. KGaA. (Weinheim: Wiley-VCH Verlag GmbH & Co. KGaA), 1208–1271. doi: 10.1002/9783527335855.marprod202
Lesser, M. P. (1997). Oxidative stress causes coral bleaching during exposure to elevated temperatures. Coral Reefs 16, 187–192. doi: 10.1007/s003380050073
Libiseller, G., Dvorzak, M., Kleb, U., Gander, E., Eisenberg, T., Madeo, F., et al. (2015). IPO: a tool for automated optimization of XCMS parameters. BMC Bioinformatics 16:118. doi: 10.1186/s12859-015-0562-8
Lloyd, G. R., Jankevics, A., and Weber, R. J. M. (2020). struct: an R/Bioconductor-based framework for standardized metabolomics data analysis and beyond. Bioinformatics btaa1031. doi: 10.1093/bioinformatics/btaa1031
Lohr, K. E., Khattri, R. B., Guingab-Cagmat, J., Camp, E. F., Merritt, M. E., Garrett, T. J., et al. (2019). Metabolomic profiles differ among unique genotypes of a threatened Caribbean coral. Sci. Rep. 9:6067. doi: 10.1038/s41598-019-42434-0
Muscatine, L., and Porter, J. W. (1977). Reef Corals: mutualistic symbioses adapted to nutrient-poor environments. Bioscience 27, 454–460. doi: 10.2307/1297526
Mydlarz, L. D., McGinty, E. S., and Drew Harvell, C. (2010). What are the physiological and immunological responses of coral to climate warming and disease? J. Exp. Biol. 213, 934–945. doi: 10.1242/jeb.037580
Ngugi, D. K., Ziegler, M., Duarte, C. M., and Voolstra, C. R. (2020). Genomic blueprint of glycine betaine metabolism in coral metaorganisms and their contribution to reef nitrogen budgets. iScience 23:101120. doi: 10.1016/j.isci.2020.101120
Pollock, F. J., McMinds, R., Smith, S., Bourne, D. G., Willis, B. L., Medina, M., et al. (2018). Coral-associated bacteria demonstrate phylosymbiosis and cophylogeny. Nat. Commun. 9:4921. doi: 10.1038/s41467-018-07275-x
Purohit, P. V., Rocke, D. M., Viant, M. R., and Woodruff, D. L. (2004). Discrimination models using variance-stabilizing transformation of metabolomic NMR data. OMICS J. Integr. Biol. 8, 118–130. doi: 10.1089/1536231041388348
Quinn, R. A., Vermeij, M. J. A., Hartmann, A. C., D’Auriac, I. G., Benler, S., Haas, A., et al. (2016). Metabolomics of reef benthic interactions reveals a bioactive lipid involved in coral defence. Proc. R. Soc. B Biol. Sci. 283:20160469. doi: 10.1098/rspb.2016.0469
Raina, J. B., Tapiolas, D. M., Forêt, S., Lutz, A., Abrego, D., Ceh, J., et al. (2013). DMSP biosynthesis by an animal and its role in coral thermal stress response. Nature 502, 677–680. doi: 10.1038/nature12677
Roach, T. N. F., Dilworth, J., Martin, H. C., Jones, A. D., Quinn, R., and Drury, C. (2020). Metabolomic signatures of coral bleaching history. bioRxiv [Preprint]. doi: 10.1101/2020.05.10.087072
Rocker, M. M., Kenkel, C. D., Francis, D. S., Willis, B. L., and Bay, L. K. (2019). Plasticity in gene expression and fatty acid profiles of Acropora tenuis reciprocally transplanted between two water quality regimes in the central Great Barrier Reef, Australia. J. Exp. Mar. Biol. Ecol. 511, 40–53. doi: 10.1016/j.jembe.2018.11.004
Rosenblum, E. S., Tjeerdema, R. S., and Viant, M. R. (2006). Effects of temperature on host-pathogen-drug interactions in red abalone, Haliotis rufescens, determined by 1H NMR metabolomics. Environ. Sci. Technol. 40, 7077–7084. doi: 10.1021/es061354e
Smith, C. A., Want, E. J., O’Maille, G., Abagyan, R., and Siuzdak, G. (2006). XCMS: processing mass spectrometry data for metabolite profiling using nonlinear peak alignment, matching, and identification. Anal. Chem. 78, 779–787. doi: 10.1021/ac051437y
Sogin, E. M., Anderson, P., Williams, P., Chen, C. S., and Gates, R. D. (2014). Application of 1H-NMR metabolomic profiling for reef-building corals. PLoS One 9:e111274. doi: 10.1371/journal.pone.0111274
Sogin, E. M., Putnam, H. M., Anderson, P. E., and Gates, R. D. (2016). Metabolomic signatures of increases in temperature and ocean acidification from the reef-building coral, Pocillopora damicornis. Metabolomics 12:71. doi: 10.1007/s11306-016-0987-8
Sogin, E. M., Putnam, H. M., Nelson, C. E., Anderson, P., and Gates, R. D. (2017). Correspondence of coral holobiont metabolome with symbiotic bacteria, archaea and Symbiodinium communities. Environ. Microbiol. Rep. 9, 310–315. doi: 10.1111/1758-2229.12541
Sostare, J., Di Guida, R., Kirwan, J., Chalal, K., Palmer, E., Dunn, W. B., et al. (2018). Comparison of modified Matyash method to conventional solvent systems for polar metabolite and lipid extractions. Anal. Chim. Acta 1037, 301–315. doi: 10.1016/j.aca.2018.03.019
Tapiolas, D. M., Motti, C. A., Holloway, P., and Boyle, S. G. (2010). High levels of acrylate in the Great Barrier Reef coral Acropora millepora. Coral Reefs 29, 621–625. doi: 10.1007/s00338-010-0608-3
Tarrant, A. M., Blomquist, C. H., Lima, P. H., Atkinson, M. J., and Atkinson, S. (2003). Metabolism of estrogens and androgens by scleractinian corals. Comp. Biochem. Physiol. B. Biochem. Mol. Biol 136, 473–485.
Todd, P. A. (2008). Morphological plasticity in scleractinian corals. Biol. Rev. 83, 315–337. doi: 10.1111/j.1469-185X.2008.00045.x
Vohsen, S. A., Fisher, C. R., and Baums, I. B. (2019). Metabolomic richness and fingerprints of deep-sea coral species and populations. Metabolomics 15:34. doi: 10.1007/s11306-019-1500-y
Voolstra, C. R., Buitrago-López, C., Perna, G., Cárdenas, A., Hume, B. C. C., Rädecker, N., et al. (2020). Standardized short-term acute heat stress assays resolve historical differences in coral thermotolerance across microhabitat reef sites. Glob. Chang. Biol. 26, 4328–4343. doi: 10.1111/gcb.15148
Wallace, C. C. (1985). Reproduction, recruitment and fragmentation in nine sympatric species of the coral genus Acropora. Mar. Biol. 88, 217–233. doi: 10.1007/BF00392585
Wang, L., Naser, F. J., Spalding, J. L., and Patti, G. J. (2019). “A protocol to compare methods for untargeted metabolomics,” in Methods in Molecular Biology, eds S. M. Fendt and S. Lunt (New York, NY: Humana Press Inc.), 1–15. doi: 10.1007/978-1-4939-8769-6_1
Webster, N. S., and Reusch, T. B. H. (2017). Microbial contributions to the persistence of coral reefs. ISME J. 11, 2167–2174. doi: 10.1038/ismej.2017.66
Westmoreland, L. S. H., Niemuth, J. N., Gracz, H. S., and Stoskopf, M. K. (2017). Altered acrylic acid concentrations in hard and soft corals exposed to deteriorating water conditions. FACETS 2, 531–544. doi: 10.1139/facets-2016-0064
Williams, A., Chiles, E. N., Conetta, D., Pathmanathan, J. S., Cleves, P. A., Putnam, H. M., et al. (2021). Metabolomic shifts associated with heat stress in coral holobionts. Sci. Adv. 7:eabd4210. doi: 10.1126/sciadv.abd4210
Xiang, T., Lehnert, E., Jinkerson, R. E., Clowez, S., Kim, R. G., DeNofrio, J. C., et al. (2020). Symbiont population control by host-symbiont metabolic interaction in Symbiodiniaceae-cnidarian associations. Nat. Commun. 11:108. doi: 10.1038/s41467-019-13963-z
Yudowski, G., Roberson, L., and Marty-Rivera, M. (2018). Mitigation of coral bleaching by antioxidants. bioRxiv [Preprint]. doi: 10.1101/281014
Keywords: NMR, LC-MS, assisted evolution, assisted gene flow, method development, species specific, propionylcarnitine, HILIC
Citation: Sweet M, Bulling M, Varshavi D, Lloyd GR, Jankevics A, Najdekr L, Weber RJM, Viant MR and Craggs J (2021) Species-Specific Variations in the Metabolomic Profiles of Acropora hyacinthus and Acropora millepora Mask Acute Temperature Stress Effects in Adult Coral Colonies. Front. Mar. Sci. 8:574292. doi: 10.3389/fmars.2021.574292
Received: 19 June 2020; Accepted: 03 March 2021;
Published: 25 March 2021.
Edited by:
E. Maggie Sogin, Max Planck Institute for Marine Microbiology (MPG), GermanyReviewed by:
Cherie Ann Motti, Australian Institute of Marine Science (AIMS), AustraliaSandra Goetze, Alfred Wegener Institute Helmholtz Centre for Polar and Marine Research (AWI), Germany
Copyright © 2021 Sweet, Bulling, Varshavi, Lloyd, Jankevics, Najdekr, Weber, Viant and Craggs. This is an open-access article distributed under the terms of the Creative Commons Attribution License (CC BY). The use, distribution or reproduction in other forums is permitted, provided the original author(s) and the copyright owner(s) are credited and that the original publication in this journal is cited, in accordance with accepted academic practice. No use, distribution or reproduction is permitted which does not comply with these terms.
*Correspondence: Michael Sweet, bS5zd2VldEBkZXJieS5hYy51aw==