 Hege Gundersen
 Eli Rinde
 Trine Bekkby
 Kasper Hancke
 Janne K. Gitmark
 Hartvig Christie
- Section for Marine Biology, Norwegian Institute for Water Research (NIVA), Oslo, Norway
There is an increasing focus on ecosystem services provided by macroalgae worldwide, many which depend on its structural and morphological characteristics. Here we investigated how characteristics of canopy kelp plants of Laminaria hyperborea varies along the Norwegian part of the NE Atlantic. Ten characteristics related to size, allometry, density, biomass and epiphytes were analyzed along wide gradients of depth, wave exposure and latitude. The analyses were performed on a compiled dataset of 630 scuba samples from different research and monitoring projects along the Norwegian coast (58-71°N). The largest kelps, highest biomass, and highest biomass of epiphytic algae was found in Mid-Norway (63-65°N). While most size-related kelp characteristics were reduced with water depth, they were enlarged with wave exposure. The developed statistical models can be used to calculate site-specific values (and their variation) of the different characteristics at any location based on latitude, depth and wave exposure. These can further be used to map kelp derived ecosystem services. We predicted region-specific estimates of total plant weight, kelp density and kelp biomass. Moreover, the models were applied to estimate living biomass (56 million tonnes fresh weight), carbon standing stock (2.6 million tonnes carbon or 9.5 million tonnes CO2), and carbon sequestration potential (0.46 million tonnes per year) for the Norwegian kelp forests, that were estimated to cover about 5 355 km2. The site- and region-specific estimates are relevant to kelp forest management and for blue carbon accountings.
Introduction
An increasing focus on ecosystem services provided by kelps and other macroalgae along temperate coasts worldwide (e.g., Smale et al., 2013; Rebours et al., 2014) has resulted in a growing literature on the status and trends of kelp forest distributions and conditions (Araújo et al., 2016; Krumhansl et al., 2016; Wernberg et al., 2019). The rapid deterioration of ecosystems and biodiversity globally (IPBES, 2019) reinforces the need to quantify the distribution and key characteristics of these highly diverse coastal habitats and to obtain foundational baseline data in order to monitor and mitigate any negative human impact on kelp-associated ecosystem services. The potential important role of macroalgae in global carbon sequestration and climate change mitigation needs to be quantified (Hill et al., 2015; Krause-Jensen and Duarte, 2016) and for this quantitative estimates of kelp distribution and biomass coverage is a prerequisite for incorporating their role in international policies such as blue carbon strategies (Duarte et al., 2013; Krause-Jensen et al., 2018; Hoegh-Guldberg et al., 2019). So far, kelp have not been integrated in neither national nor global Blue Carbon inventories due to the limited knowledge and invalid postulations that kelp forests do not sequestrate carbon because they grow on hard substrates (Smale et al., 2018).
In the North-East Atlantic, Laminaria hyperborea (Gunn.) Foslie stands out as the most widely distributed species (Bartsch et al., 2008; Araújo et al., 2016). This species extends from Portugal in the south to Russia in the north (Kain, 1971a; Schoschina, 1997), and the Norwegian coast represents a substantial part of the latitudinal and environmental gradients under which it forms rich and extensive forests. The most updated estimate of total coverage of these kelp forests in Norway is 8 000 km2 roughly calculated by Gundersen et al. (2011) and has been acknowledged for its high biomass, important primary production (Abdullah and Fredriksen, 2004; Pedersen et al., 2012), secondary production, and supporting a large biodiversity (Christie et al., 2003, 2009; Norderhaug et al., 2003; Norderhaug and Christie, 2011; Teagle et al., 2017). Also, kelp forests are recognized for their role in food webs and to support commercial fish stocks (Norderhaug et al., 2005). Kelp forests supply organic matter to surrounding areas, including deep-sea ecosystems, through the export of detached or dislodged biomass (Fredriksen, 2003; Krumhansl and Scheibling, 2012; Filbee-Dexter et al., 2018; Ortega et al., 2019). Through this export of biomass to adjacent soft bottom systems kelp forests contribute to carbon sequestration, which occurs from burial and long-term storage of kelp organic matter in the sediments (Smith, 1981; Hill et al., 2015; Krause-Jensen and Duarte, 2016; Filbee-Dexter and Wernberg, 2020). Being commercially harvested and further processed for alginate, L. hyperborea kelp forests are also the source for raw material of a considerable commercial value (Vea and Ask, 2011).
Laminaria hyperborea kelp forests are dominated by large kelp plants, often older than 4–5 years (Rinde and Sjøtun, 2005), that form dense and stable canopies which constitutes the most important part of the kelp forest in terms of biomass and biodiversity (Christie et al., 1998; Smale and Moore, 2017). The species grows upright in shallow (0–30 m depth), wave exposed areas - firmly attached to hard substrata (Kain, 1971b; Rinde and Sjøtun, 2005; Bekkby et al., 2009). The thallus consists of three distinct parts - the holdfast (hapteron), the stipe, and the lamina (blade). The holdfast and the stipe persist throughout the lifespan of the algae, which is up to 21 years, but more commonly 6–10 years (Rinde and Sjøtun, 2005; Bekkby et al., 2014b; Smale et al., 2016; Wernberg et al., 2019). The kelp usually reaches adult size before 4 years (Sjøtun et al., 1995; Christie et al., 1998). The lamina, however, is shed and renewed annually, and is therefore available as organic material to the secondary producers within the kelp forest (Norderhaug et al., 2003) or exported to adjacent ecosystems (Norderhaug and Christie, 2011; Filbee-Dexter et al., 2018; Pessarrodona et al., 2018). The lamina/stipe weight ratio is a measure of the relative allocation of growth into the lamina versus the stipe and hence determines the fraction of the kelp production that is yearly shed. The ratio also indicates how for example storm surges impact dislodgement of kelp thalli. It has long been known that kelp populations support considerable biodiversity (e.g., Moore, 1971, 1973; Edwards, 1980; Christie et al., 2003; Blight and Thompson, 2008; Teagle et al., 2018). Most of the kelp associated species live within the holdfast or amongst the numerous and diverse epiphytic algae found on the stipe, and fauna density increases with habitat size (Christie et al., 2003).
Many of the ecosystem services provided by kelp forests depend on structural and morphological characteristics, and L. hyperborea has been studied for these aspects for several decades. Such studies have shown that kelp size, morphology and forest density vary with depth (Kain, 1971a; Bekkby et al., 2009), as well as physical forces such as wave exposure (Kain, 1971a; Sjøtun et al., 1998; Pedersen et al., 2012; Smale et al., 2016; Coppin et al., 2020), ocean current speed (Kain, 1971b; Bekkby et al., 2014b, 2019) and latitude. The latter representing several environmental gradients such as temperature, irradiance and photoperiod (Rinde and Sjøtun, 2005; Smale et al., 2020). Depth, as a proxy for light availability at the sea floor, is often found to be one of the most important predictors explaining the variation in size and density of kelp (Kain, 1971a; Vigander, 2007; Bekkby et al., 2009). High wave and ocean current exposure stimulates L. hyperborea to grow larger as a response to improved conditions for growth, but also due to a need to grow stronger in order to survive in such harsh environment (Bekkby et al., 2014b). Also, the age of the individual kelp affects overall size and morphology, as well as the amount and composition of the epiphytic algae and their associated fauna (Christie et al., 1998, 2003, 2007; Norderhaug et al., 2012). Overall, biodiversity is generally found to increase with area (Connor and McCoy, 1979), which is also found in L. hyperborea forests. Old and large holdfasts and stipes thereby support a greater diversity of associated flora (e.g., red and brown epiphytic algae) and fauna (e.g., crustaceans, gastropods, and bivalves) communities than juvenile and small-sized kelp plants (Christie et al., 1998, 2003).
Despite the comprehensive portfolio of kelp studies, a broad quantitative analysis that explores multiple kelp characteristics, as well as the biomass of stipe-associated epiphytic algae along wide environmental and latitudinal gradients of canopy-forming Laminaria hyperborea, has until now not been published for the North-East Atlantic. The aim of this study was to explore and quantify how structural and morphological characteristics, including standing biomass and canopy density, vary with depth and wave exposure along the entire latitudinal gradient of the Norwegian North-East Atlantic. The Norwegian coastline covers a broad spatial and environmental gradient between 58 and 71°N, divided into the six coastal ecoregions (management units) Skagerrak, North Sea (South and North), Norwegian Sea (South and North) and Barents Sea. L. hyperborea creates extensive forests in all of these ecoregions, and together with Saccharina latissima is the most common kelp species in Norway (Araújo et al., 2016). To make our results useful for managers and policy makers in the context of blue carbon strategies, we provide quantitative estimates on selected kelp characteristics related to carbon storage, export and sequestration at the level of ecoregions (Norwegian Classification Guidance, 2018). Calculated estimates of standing biomass and carbon content are provided at the national level, so as to facilitate their applied use by managers and policy makers.
Materials and Methods
Data Compilation and Field Sampling
A comprehensive field sampling was performed in 2012 to gather data on Norwegian L. hyperborea forest characteristics along gradients of latitude, wave exposure and depth. Due to logistical reasons when aiming to cover huge areas along Norway’s 100 000 km coastline, as well as challenges of conducting safe diving in the most wave exposed areas, the 2012-study lack data from the most remote and wave exposed areas. These data were therefore supplemented with existing data collated from a range of studies, published in scientific articles and technical reports, where also sampling methods were thoroughly described (Rinde et al., 1992; Rinde and Christie, 1992; Skadsheim et al., 1993; Christie et al., 1994, 1995; Skadsheim and Rinde, 1995; Bekkby et al., 2014b) from 1991 to 2008. The final dataset consisted of 630 observations from 74 field stations (Figure 1). This provided data of L. hyperborea canopy density and individuals measured for age, length (stipe and lamina), weight (holdfast, stipe and lamina) and stipe-associated epiphytic algal biomass (all drip-dried fresh weights). The data from 2012, accounting for 51% of the total dataset, were sampled with a systematic design to cover gradients in depth, wave exposure and latitude. Five out of the six Norwegian ecoregions were covered (Figure 1). Another 44% of the dataset came from Bekkby et al. (2014b), which also followed a systematic sampling scheme along a wave exposure and ocean current gradient, although restricted to one depth (5 m) and one ecoregion only (Table A, Supplementary Material). All data were collected using scuba diving at pre-selected stations, based on maps and models of bathymetry and wave exposure covering the suitable habitat of L. hyperborea in the NE Atlantic. For kelp canopy density measurements, the number of canopy plants (easily recognized from the medium and lower understory layers by their length) per m2 was recorded for usually 10 (but see below) replicate 50 × 50 cm frames, randomly dropped along transects at 5, 10, and 15-20 m depths (15 m was chosen when kelp was not found at 20 m) recorded from the dive computer (see Table 1 for number of replicates within each ecoregion and depth interval). Measurements of relative depth were adjusted according to the time- and site-specific deviation from low tide, which in Norway is a maximum of 2.5 m in the north (Barents Sea) and less than 0.5 m in the south (Skagerrak). One representative canopy plant was randomly collected within each of three of the frames at each depth interval. The plants were brought to the surface for measurements of length (lamina and stipe), drip-dry fresh weight (lamina, stipe, holdfast, and stipe-associated epiphytic algae), and age (growth rings at stipe base, following the procedures of Kain, 1963). The compiled data from 1991 to 2008 had been sampled with five or more replicates at each station (Rinde et al., 1992; Skadsheim et al., 1993; Christie et al., 1994, 1995; Skadsheim and Rinde, 1995; Bekkby et al., 2009). The total dataset covered a spatial gradient from 58.2 to 70.7°N and from 5.4 to 30.1°E (Figure 1). Some of the northernmost parts of the coastline were heavily grazed by green sea urchins, Strongylocentrotus droebachiensis (Rinde et al., 2014), thus no sampling could be performed there. Also, the most exposed coastlines were too rough for secure diving and therefore not sampled.
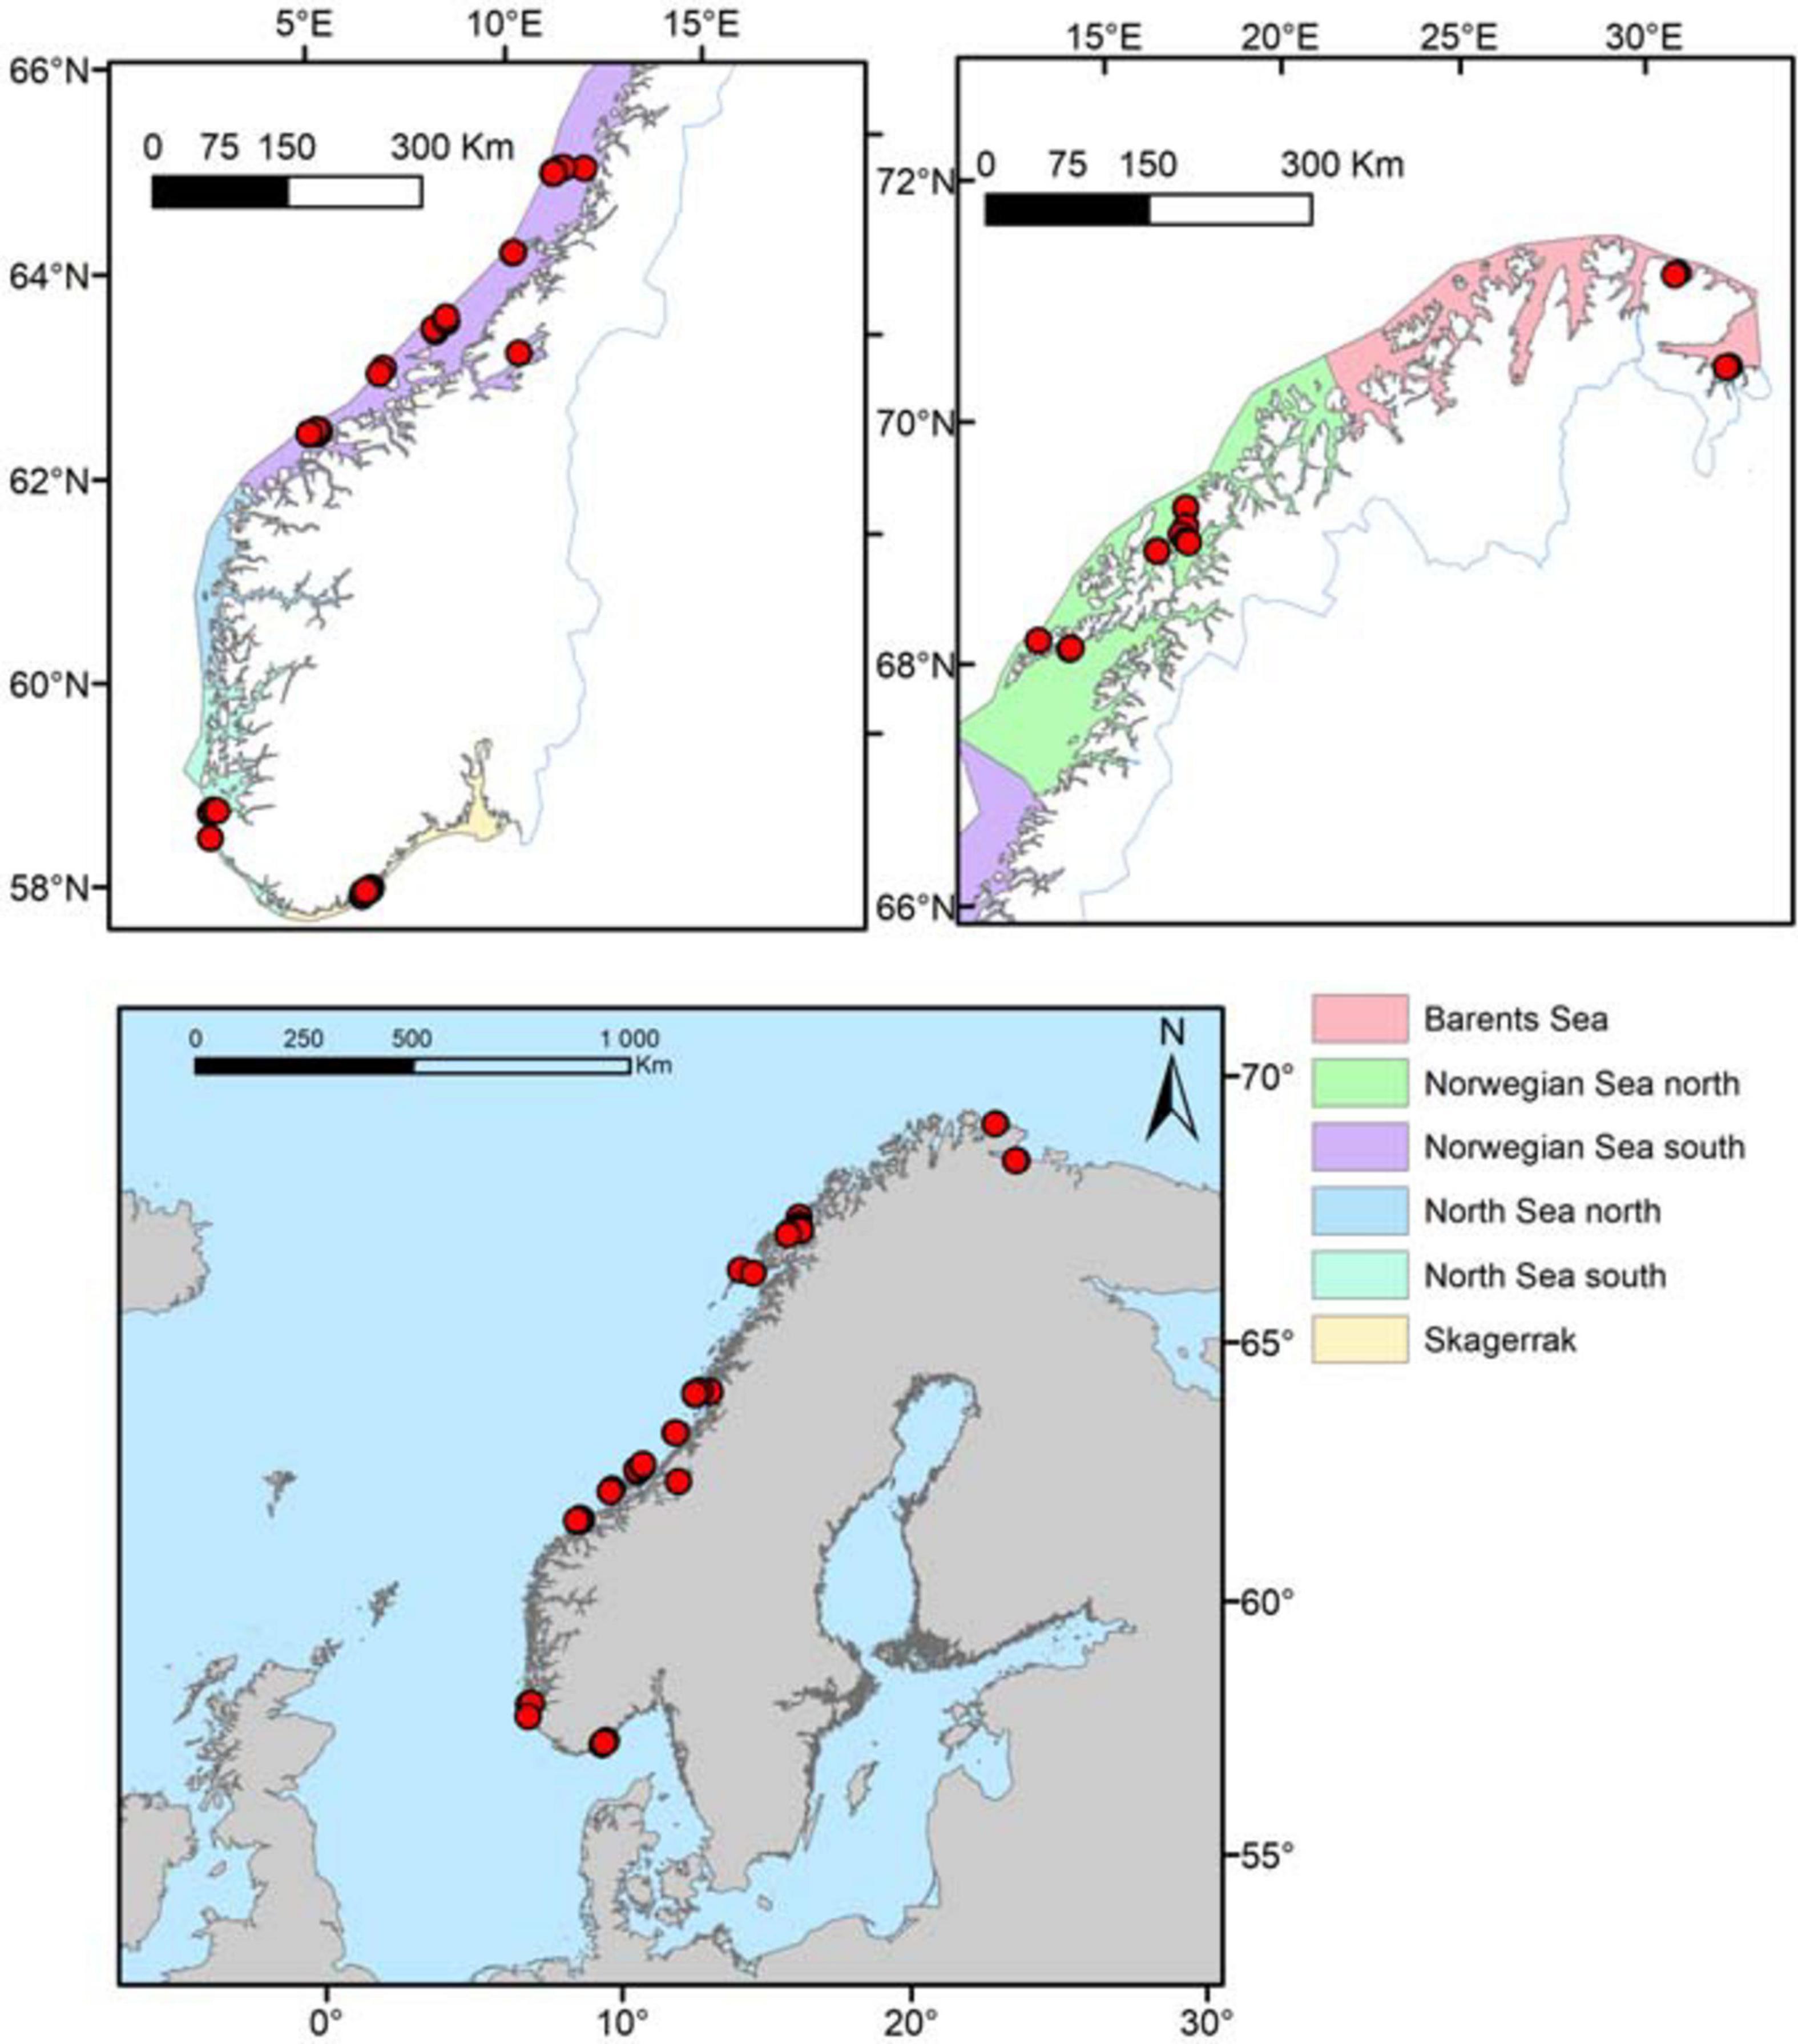
Figure 1. Location of the 74 stations (red dots) visited in this study and the six Norwegian coastal ecoregions. For more information on sample sizes, see Table 1.
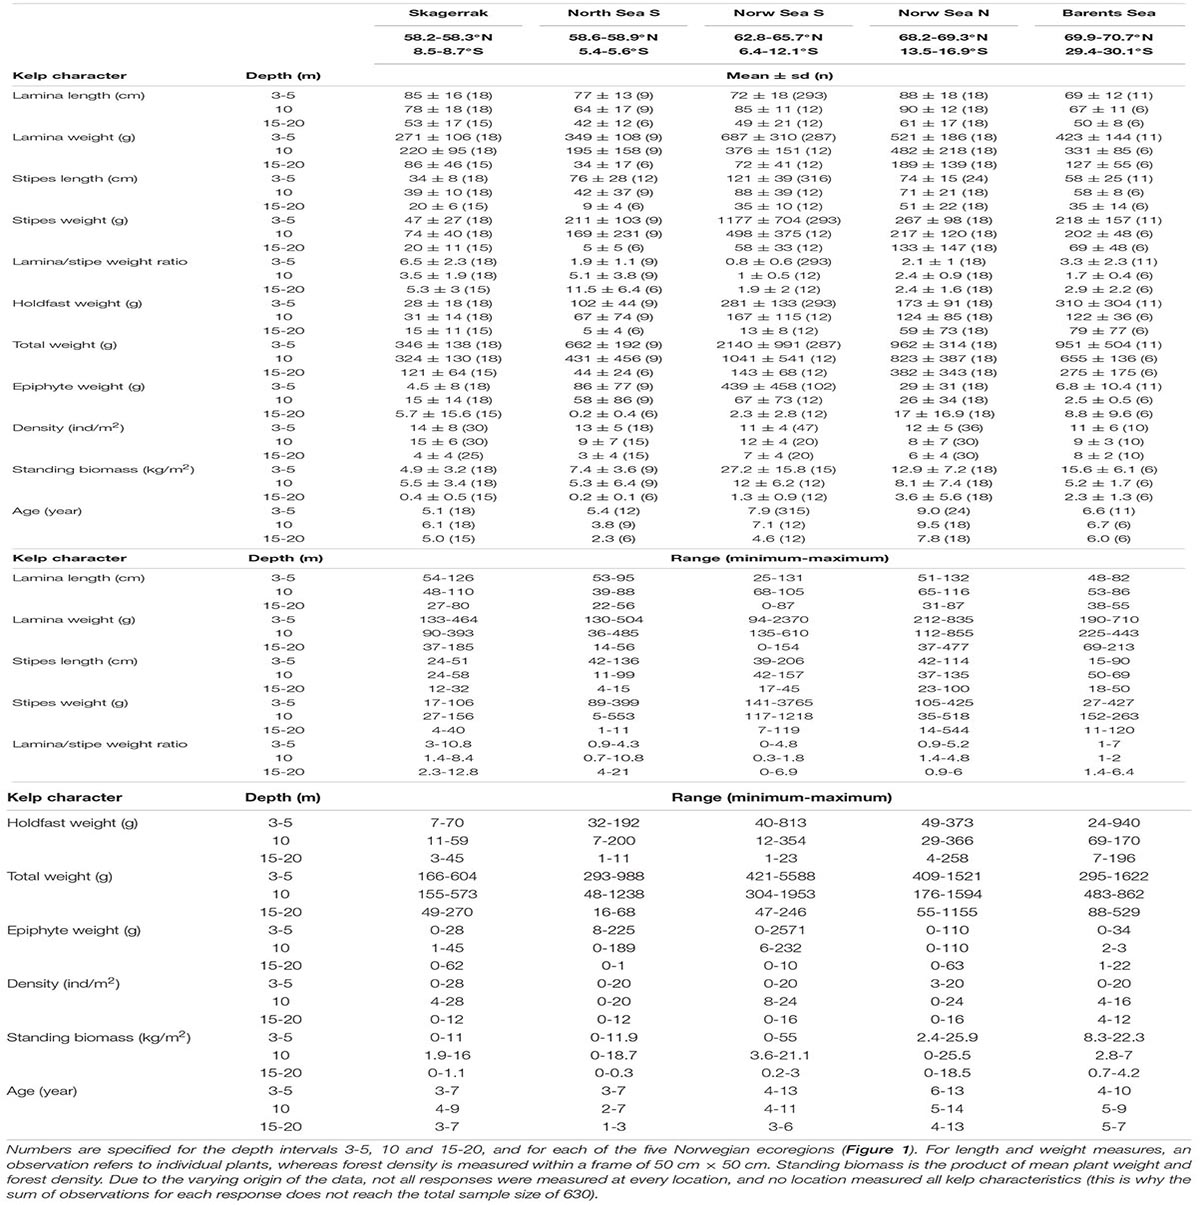
Table 1. Descriptive statistics (mean ± standard deviation, number of observations, and minimum and maximum values) of field measured length and weight of the kelp canopy plant parts, the estimated lamina/stipe weight ratio, density, standing biomass and age.
Kelp is mechanically harvested for alginate extraction in Norway (Vea and Ask, 2011). To avoid this anthropogenic impact on kelp density, kelp population characteristics and abundance of epiphytic algae, field sampling was restricted to non-trawled areas based on maps of harvesting cycles. Also, sampling was restricted to canopy plants and thus was the highly variable amount of understory plants not included in the study (Rinde and Sjøtun, 2005; Sjøtun et al., 2006). Sampling was restricted at depths down to 20 m, thus excluding the deepest part of the kelp forests which reaches around 25 m in the most wave exposed areas (Rinde et al., 2006; Bekkby et al., 2013) and where kelps occur only as scattered tiny individuals (Bekkby et al., 2019).
Statistical Analyses
Not all kelp characteristics were measured at every location, as samples were collected during multiple projects and monitoring programs. Statistical models were constructed to quantify how L. hyperborea kelp canopy structural and morphological characteristics varies with depth and wave exposure along the latitudinal gradient. The relationships were analyzed by generalized additive mixed effects models (GAMMs, Wood, 2011) using the mgcv library in R (version 3.5.2, R Core Team, 2018). This method was chosen to allow for non-linear (curvilinear or asymptotical) trends in the response (Zuur et al., 2009). Ten characteristics considered to be important for L. hyperborea’s ecological function were analyzed in separate models. These were lamina length (cm), stipe length (cm), lamina weight (g), stipe weight (g), lamina/stipe weight ratio, holdfast weight (g), total plant weight (g, calculated as the sum of lamina, stipe and holdfast weights), canopy density (calculated as the number of canopy kelp plants per m2), standing biomass (calculated as canopy density multiplied with total plant weight, kg/m2), and stipe-associated epiphytic algae weight (g) (see Bekkby et al., 2014b for more detailed description of measuring methods). The four variables used as explanatory variables in the analyses were age, depth, wave exposure and latitude. Plant age was included as a co-variable in all analyses to account for the variation in the responses being age-related. Depth and geographic position (latitude and longitude) were recorded in the field. Wave exposure values (given as km2/sec or “simplified wave model” (swm) from Isæus, 2004) were extracted from a model with a 25 m spatial resolution in ArcGIS 10.4 (ESRI, 2011). The wave exposure model is based on fetch, wind speed and wind frequency and is well-established and applied in several studies in Norway (e.g., Norderhaug et al., 2012; Pedersen et al., 2012; Bekkby et al., 2014b, 2019), Sweden (e.g., Eriksson et al., 2004), Finland (Isæus and Rygg, 2005), Denmark and the Baltic Sea (Wijkmark and Isæus, 2010). As Norway is situated in a diagonal direction between the latitude and longitude axes, a dataset covering the coast of Norway will necessarily have highly correlated X and Y coordinates. Therefore, we chose to include only latitude in the analysis as it is the most interesting of the two, representing important environmental gradients, including temperature. We checked for correlations between the explanatory variables using the concurvity function in the R library mgcv. Concurvity is the non-parametric analog to multicollinearity between explanatory factors (Ramsay et al., 2003).
Smoothing factors (k) in the Mixed GAMs were limited to maximum four to avoid overfitted curves. Station ID was included as a random factor to account for non-independence between observations taken at the same station. For count (positive integers) responses (canopy density), a Poisson distribution was assumed with a log link function. The remaining analyses assumed a normal (Gaussian) distribution and identity link function. All response variables, except lamina and stipe length, canopy density and standing biomass, were ln(x + 1)-transformed due to the lack of normal residual distribution or diverging homoscedasticity.
Thirty-two candidate models, made from all possible combinations of the four predictors age, depth, wave exposure, and latitude, were tested for each response. Preliminary analyses and earlier findings (Bekkby et al., 2014a, 2019) indicated that there was no need for interactions. As a result, and because of a low number of observations for some of the combinations of the environmental predictors (Table A, Supplementary Material), interactions were left out from the candidate models. This allowed the analyses to be simple and to provide more understandable regional predictions. The Akaike Information Criterion corrected for small samples (AICc; Burnham et al., 2011) was used to select the best among the candidate models. To preserve the principle of parsimony, the simplest (i.e., less complex) model was selected for each response among the subset with ΔAICc < 4, as these received equally good support from the data (Burnham et al., 2011).
For management purposes, we provide predicted estimates for total plant weight, canopy density and standing biomass on the level of ecoregions, which is the focal unit within the Norwegian implementation of the EU Water Framework Directive (Norwegian Classification Guidance, 2018). The six coastal ecoregions are Skagerrak, North Sea South, North Sea North, Norwegian Sea South, Norwegian Sea North and the Barents Sea (Figure 1), representing important gradients of temperature, tidal range, light regime and salinity. The compiled dataset covers all six regions except North Sea North. The kelp characteristics were predicted for each ecoregion at depth intervals of 5, 10, and 20 m, keeping age constant at 7.8 years (i.e., the average kelp canopy age in Mid-Norway) and wave exposure at 0.6 km2/sec (i.e., wave exposed, Isæus, 2004), respectively. Based on the selected kelp characteristics models, we estimated standing biomass and carbon sequestration potential at a national level (see below).
Estimating Carbon Sequestration Potential
Total plant weight (g), canopy density (ind/m2) and biomass (kg/m2) were estimated at the level of ecoregions and for the three depths 5, 10, and 20 m. The predicted values were based on the selected models, specified per ecoregion by their middle latitude and averaged for wave exposure and age. To provide estimates of standing biomass and carbon storage potential for Norway, the selected model for biomass per m2 were combined with an estimate of the depth-specific area of suitable kelp substrate (bedrock) along the coast of Norway, for each depth interval of 1 m down to 20 m below the lowest astronomical tide (LAT). Other variables were then held constant at their average values in the calculations. The estimates of the suitable area per depth interval was based on a digital depth model with 25 m horizontal resolution, provided by the Norwegian Hydrographic Service. To exclude the proportion of the area that is unsuitable due to inappropriate substrate, i.e., soft bottoms, a rough estimate of 56% coastal cliff (Young and Carilli, 2018) was used, assuming this is applicable in areas down to 20 m depth outside the Norwegian shoreline. To estimate total standing biomass for Norway, we also included wave sheltered areas dominated by Saccharina latissima. S. latissima forms extensive kelp forests in wave sheltered and shallow areas along the Norwegian coast, with an average biomass of 10-15 kg per m2 (Gundersen et al., 2011). Since we lack a biomass model for S. latissima, we developed a rough estimate using the same relationship between kelp biomass and depth as was found for L. hyperborea in this study. Carbon calculations were based on the following estimates: a 15% dry to fresh weight ratio (average of blade and lamina, Pedersen et al., 2020), 31% carbon content of dry weight (average of blade and stipe, Pedersen et al., 2020), and a carbon sequestration proportion of 25% (range 23-61) of the total export of kelp organic carbon including both particulate and dissolved matter (Krause-Jensen and Duarte, 2016; Table 4). Finally, 50 and 20% were used as estimates of non-grazed suitable kelp habitat in the Norwegian Sea North and Barents Sea, respectively. These are rough estimates based on the most recent and updated data in [Christie et al. (2019); Appendix A]. To reveal the impact of any uncertainty in these estimates on the total amount of biomass and the CO2 sequestered, we tested their sensitivities of increasing/reducing them according to their standard errors or ranges (Table 4, Table C in Supplementary Material).
Results
The longest stipe recorded was more than 2 m long, the heaviest kelp plant weighed more than 5 kg (drip-dry fresh weight) and we recorded a maximum weight of stipe-associated epiphytic algae of more than 2 kg. Data on field-measured length and weight of the kelp canopy plants, densities, the calculated lamina/stipe weight ratio and derived biomass per square units specified for each depth interval and ecoregion are shown in Table 1. This table shows the high variability among measurements of all characteristics across the three environmental gradients, and age, which are hidden in the general trends generated by the models (see later).
For all characteristics analyzed, except canopy density, the full models (i.e., the one including all predictors) were among the best models, based on AIC values (Table 2). For the size related characteristics stipe length, stipe weight, holdfast weight and total weight, the full model was the only candidate with ΔAICc less than four (see Table 2 for details). Wave exposure was included in the selected models of all responses except those related to lamina size (i.e., lamina length and weight) or epiphyte weight. Geographical variation related to latitude was in the selected models of all the individually based kelp characteristics, but not the population related responses density and biomass. Age was an important covariable in all models except that of canopy density (Table 2).
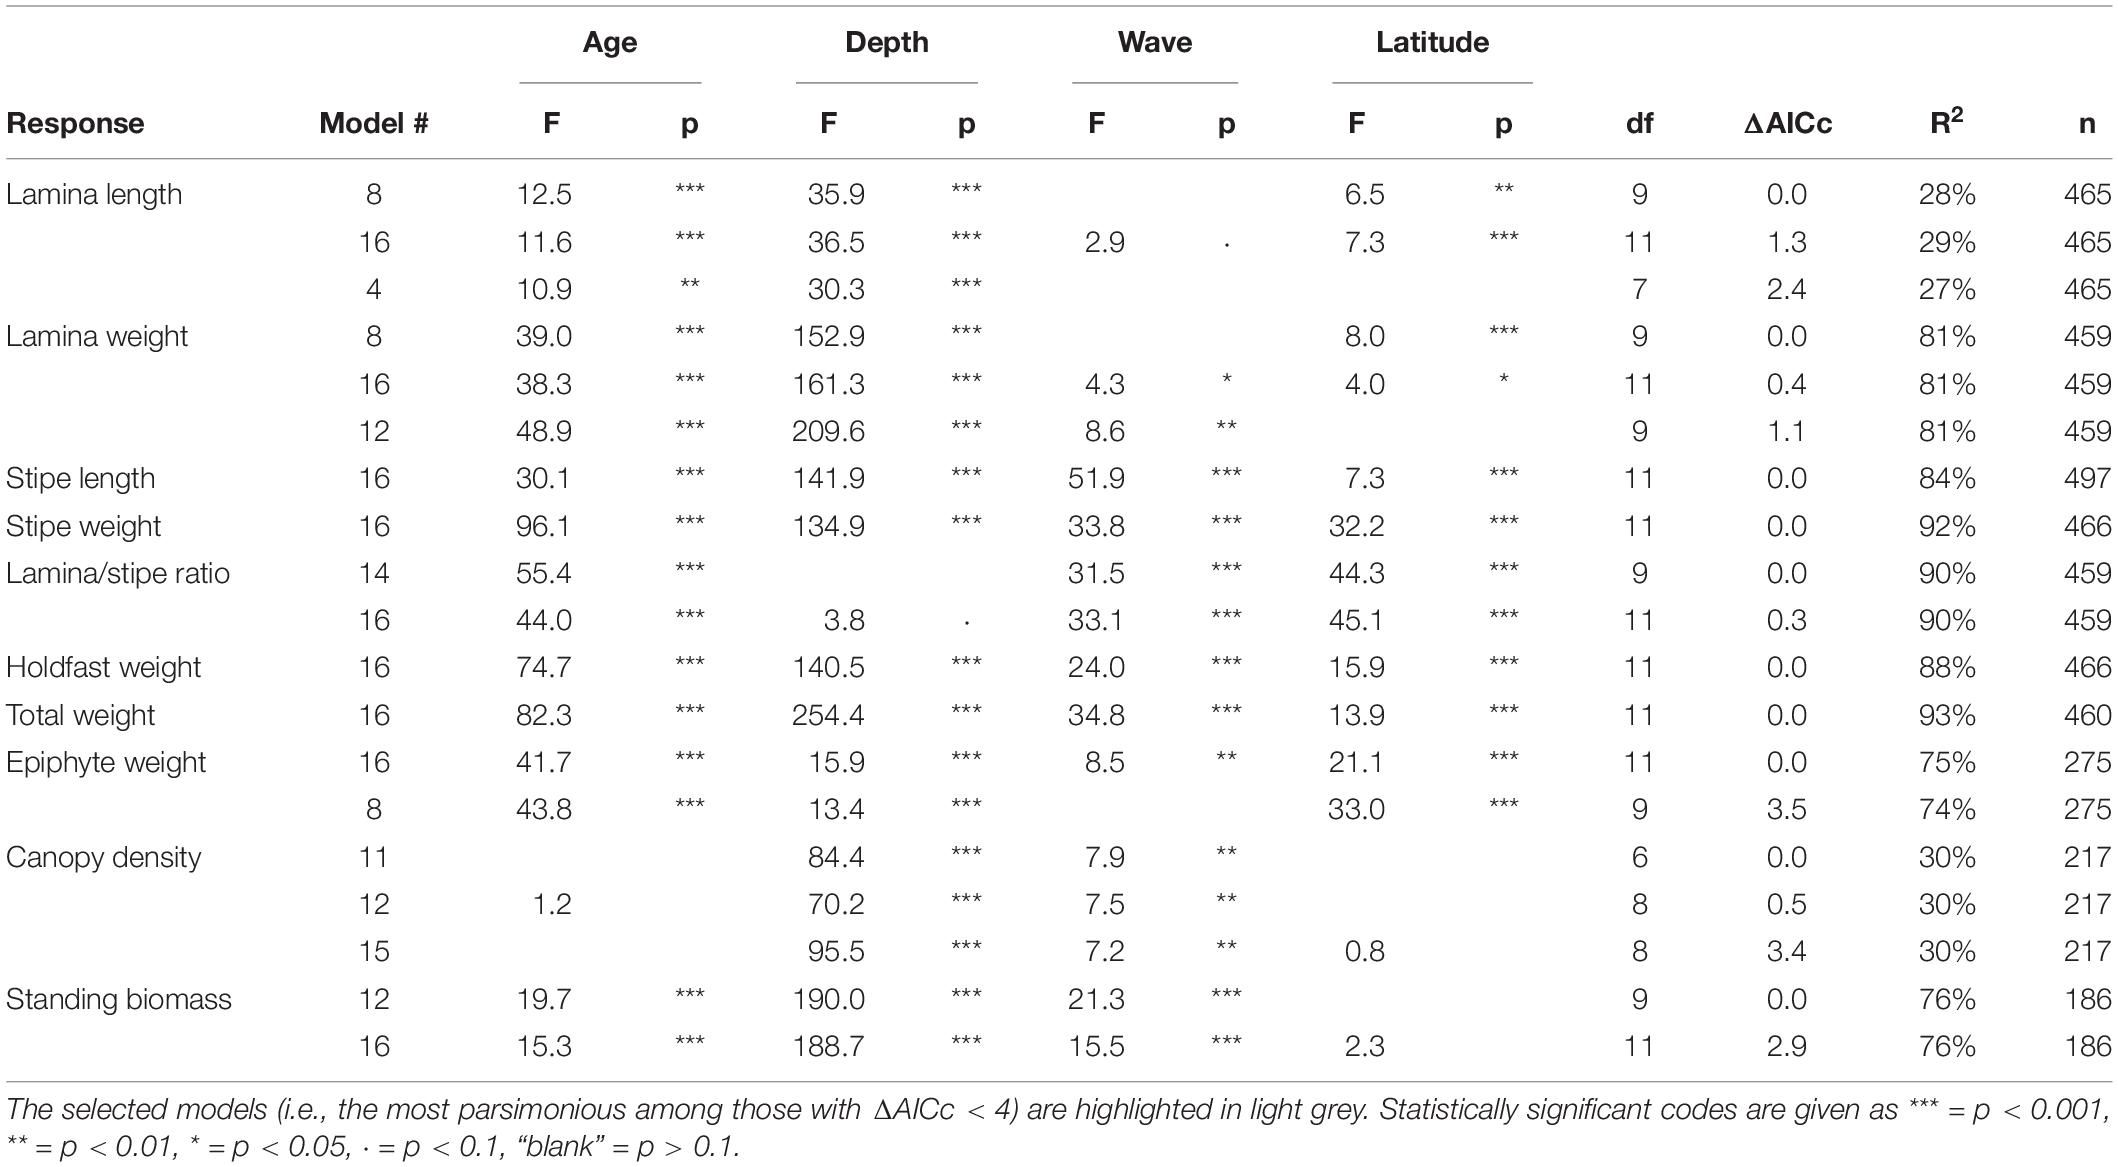
Table 2. Overview of the best candidate models (ΔAICc < 4) among those tested for kelp canopy characteristics, their performance according to AICc and R2, and associated F- and p-values for the predictors.
In general, a large proportion of the total variation was explained by the variables of the selected models (Table 2). R2adj ranged between 0.74 (lamina/stipe weight ratio) and 0.93 (total weight) for most models, except that of lamina length and canopy density, with R2adj = 0.27 and 0.30, respectively (Table 2).
The concurvity analysis revealed that the predictors were satisfactorily uncorrelated, with concurvity values (based on averages for each model of the type “estimate”) ranging between 0.06 and 0.15 (Table 3).
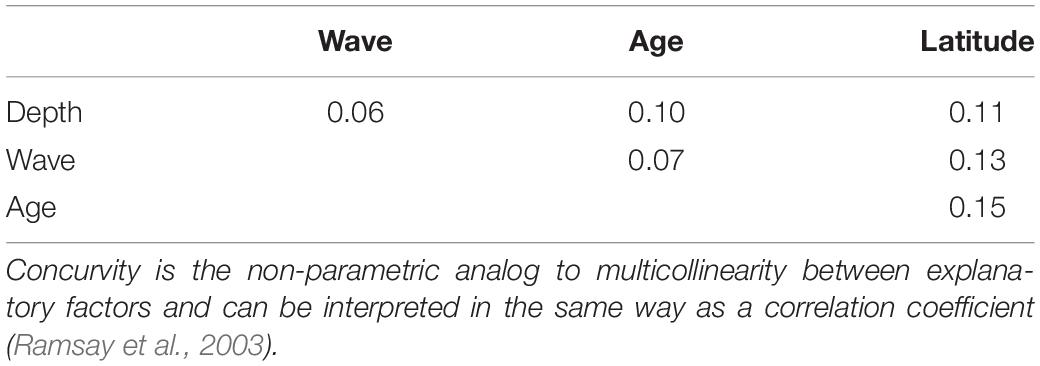
Table 3. Concurvity matrix (type “estimate” in the mgcv library) of the predictor variables, averaged for each model.
Variation in Kelp Characteristics With Depth
All kelp characteristics, except the lamina/stipe weight ratio, decreased significantly (p < 0.001) with increasing depth (Figure 2 and Table 2). The estimated average total weight of a kelp plant at 5 m was around 1.7 kg (± 0.10 se) and decreased to less than 400 g (± 31 se) at 20 m, i.e., a reduction of 81% (Figure 2). A similar decrease was estimated for the weight of the lamina (78%), stipe (81%), and holdfast (86%). Consequently, no significant change was found for the lamina/stipe weight ratio (p = 0.078), as they both decreased similarly. Lamina and stipe length were reduced from 76 (± 1.5 se) to 54 (± 3.3 se) cm (29%) and from 115 (± 3.6 se) to 72 (± 5.2 se) cm (38%), respectively, over the same depth range. Canopy density was reduced with 52% from an estimated 15 (± 1.1 se) individual plants per m2 at 5 m depth, to 7 (± 0.8 se) at 20 m. Standing biomass follows the decline of its components (canopy density and total plant weight) and declined markedly from 14 (± 1.6 se) to 2 (± 0.4 se) kg (86%). Finally, the weight of the stipe-associated epiphytes was also substantially reduced by 55%, from 314 (± 55 se) to 143 (± 40 se) g (Figure 2).
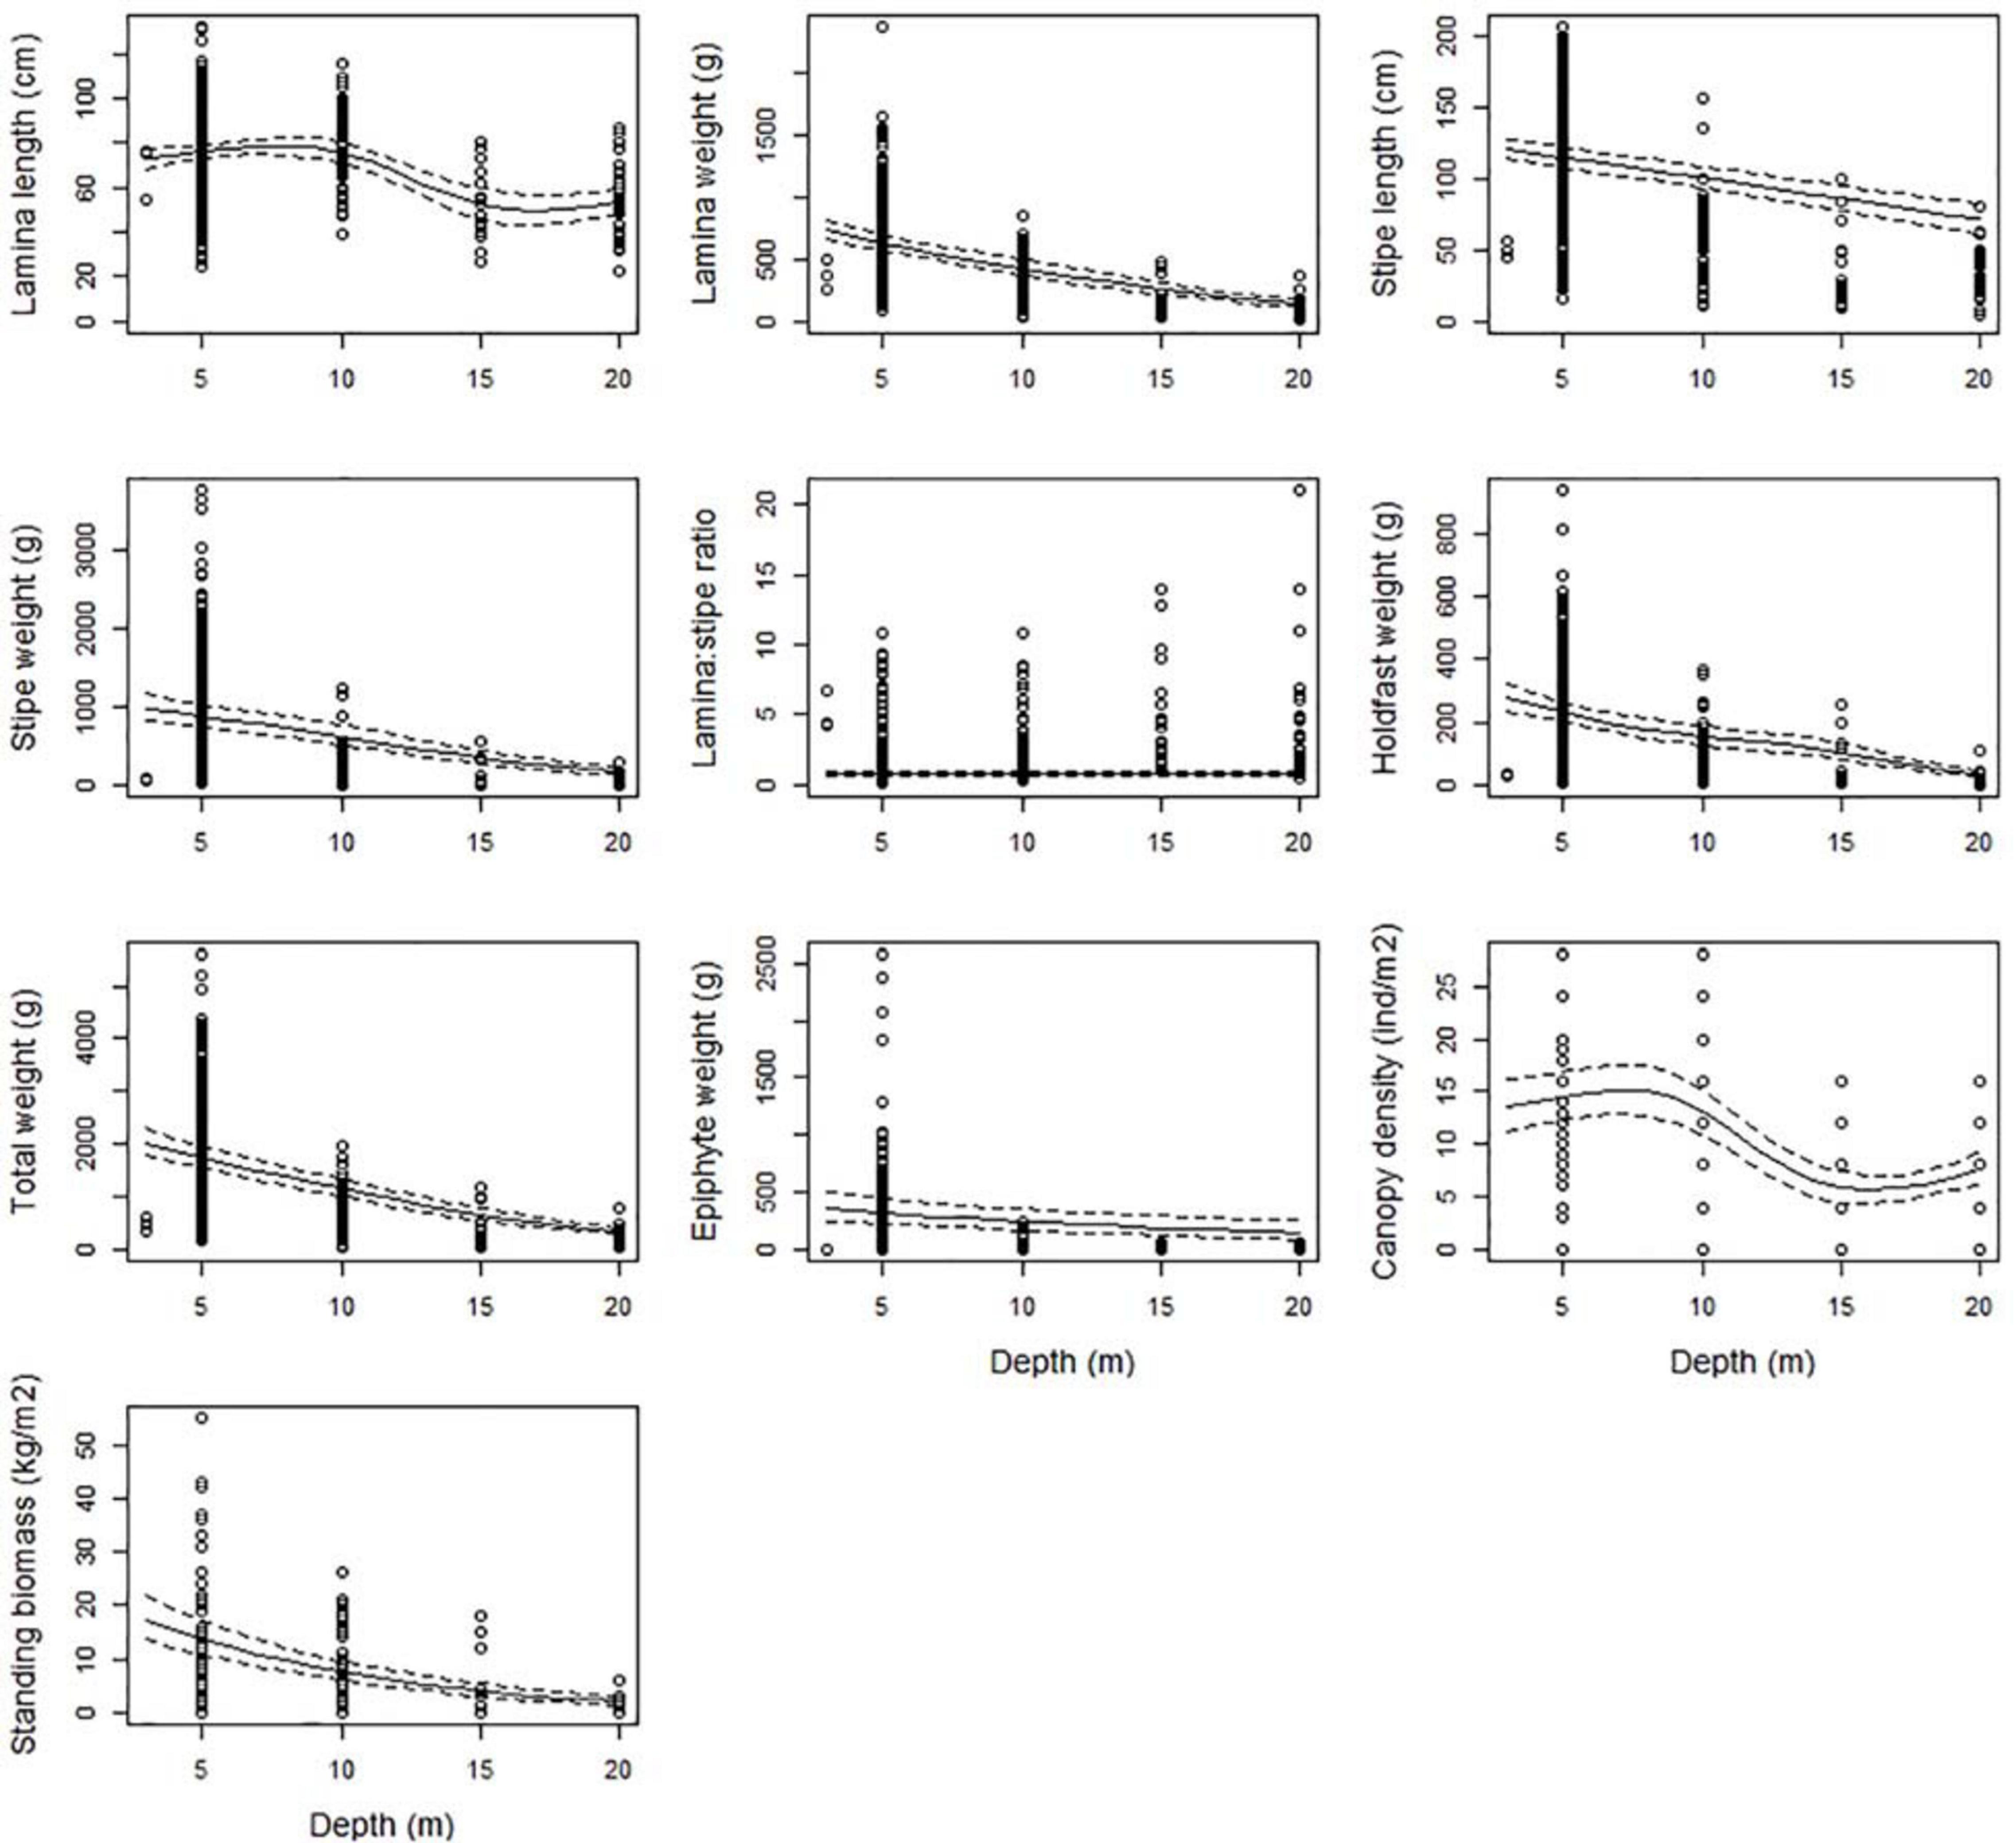
Figure 2. The partial response plots for kelp canopy characteristics as a function of depth based on the selected GAMM models of all responses (Table 2). The predicted curves (± 2 se) are standardized for a locality at the West coast of Norway (Møre, 62.83°N, 6.55°E), for wave exposure = 0.6 km2/sec (i.e., wave exposed, Isæus, 2004) and canopy kelp age = 7.8 years (i.e., the average kelp canopy age in the dataset).
Variation in Kelp Characteristics With Wave Exposure
In general, all kelp parts (lamina, stipe and holdfast) grow longer and heavier with increasing wave exposure (Figure 3 and Table 2). The relationships were significant (p < 0.05), except for lamina length (p = 0.931), and was not included in the selected model of lamina weight (p = 0.038) or epiphyte weight (although significant, p = 0.004). The predicted total weight of a kelp plant in sheltered areas (swm = 0.1 km2/sec) was around 0.9 kg (± 0.09 se) and increased to 2.3 kg (± 0.27 se) in very exposed areas (swm = 1.8 km2/sec), i.e., an increase of 156% (Figure 3). This was in particular due to the increase in stipe weight which increased by 327%, but also the weight of the holdfast (160%) contributed to this increase. The lamina/stipe weight ratio shifted from a relatively more lamina skewed (1:0.8) ratio in sheltered areas, toward a more stipe skewed (1:3.4) ratio at higher exposures. This was solely due to an increase in stipe weight, since the estimated lamina weight were constant at 0.43 kg (± 0.03 se). Stipe length almost doubled over the same exposure range from 80 (± 5.4 se) to 150 (± 6.8 se) cm (87%). Kelp canopies became 53% denser from sheltered (swm = 0.1 km2/sec) to exposed (swm = 0.8 km2/sec), with estimated densities from 7.8 (± 0.65 se) to 11.9 (± 1.09 se) individual canopy plants per m2, respectively. However, toward the most wave exposed areas; canopy density decreased to 10 (± 2.7 se) plants per m2. Due to the lack of data for several of the ecoregions in the most wave exposed areas (Table A, Supplementary Material), the decline in canopy density from exposed (0.5 - 1 km2/sec.) to very exposed (1 – 2 km2/sec.) was uncertain, as reflected by the wide confidence interval (Figure 3). The same was true for standing biomass, that according to the model increased by a factor of 8 (700%) from low to high exposure. The biomass followed the increase of its components (canopy density and total plant weight), mostly influenced by a steep increase in density in the sheltered part of the exposure range, and an increased plant weight in the exposed end.
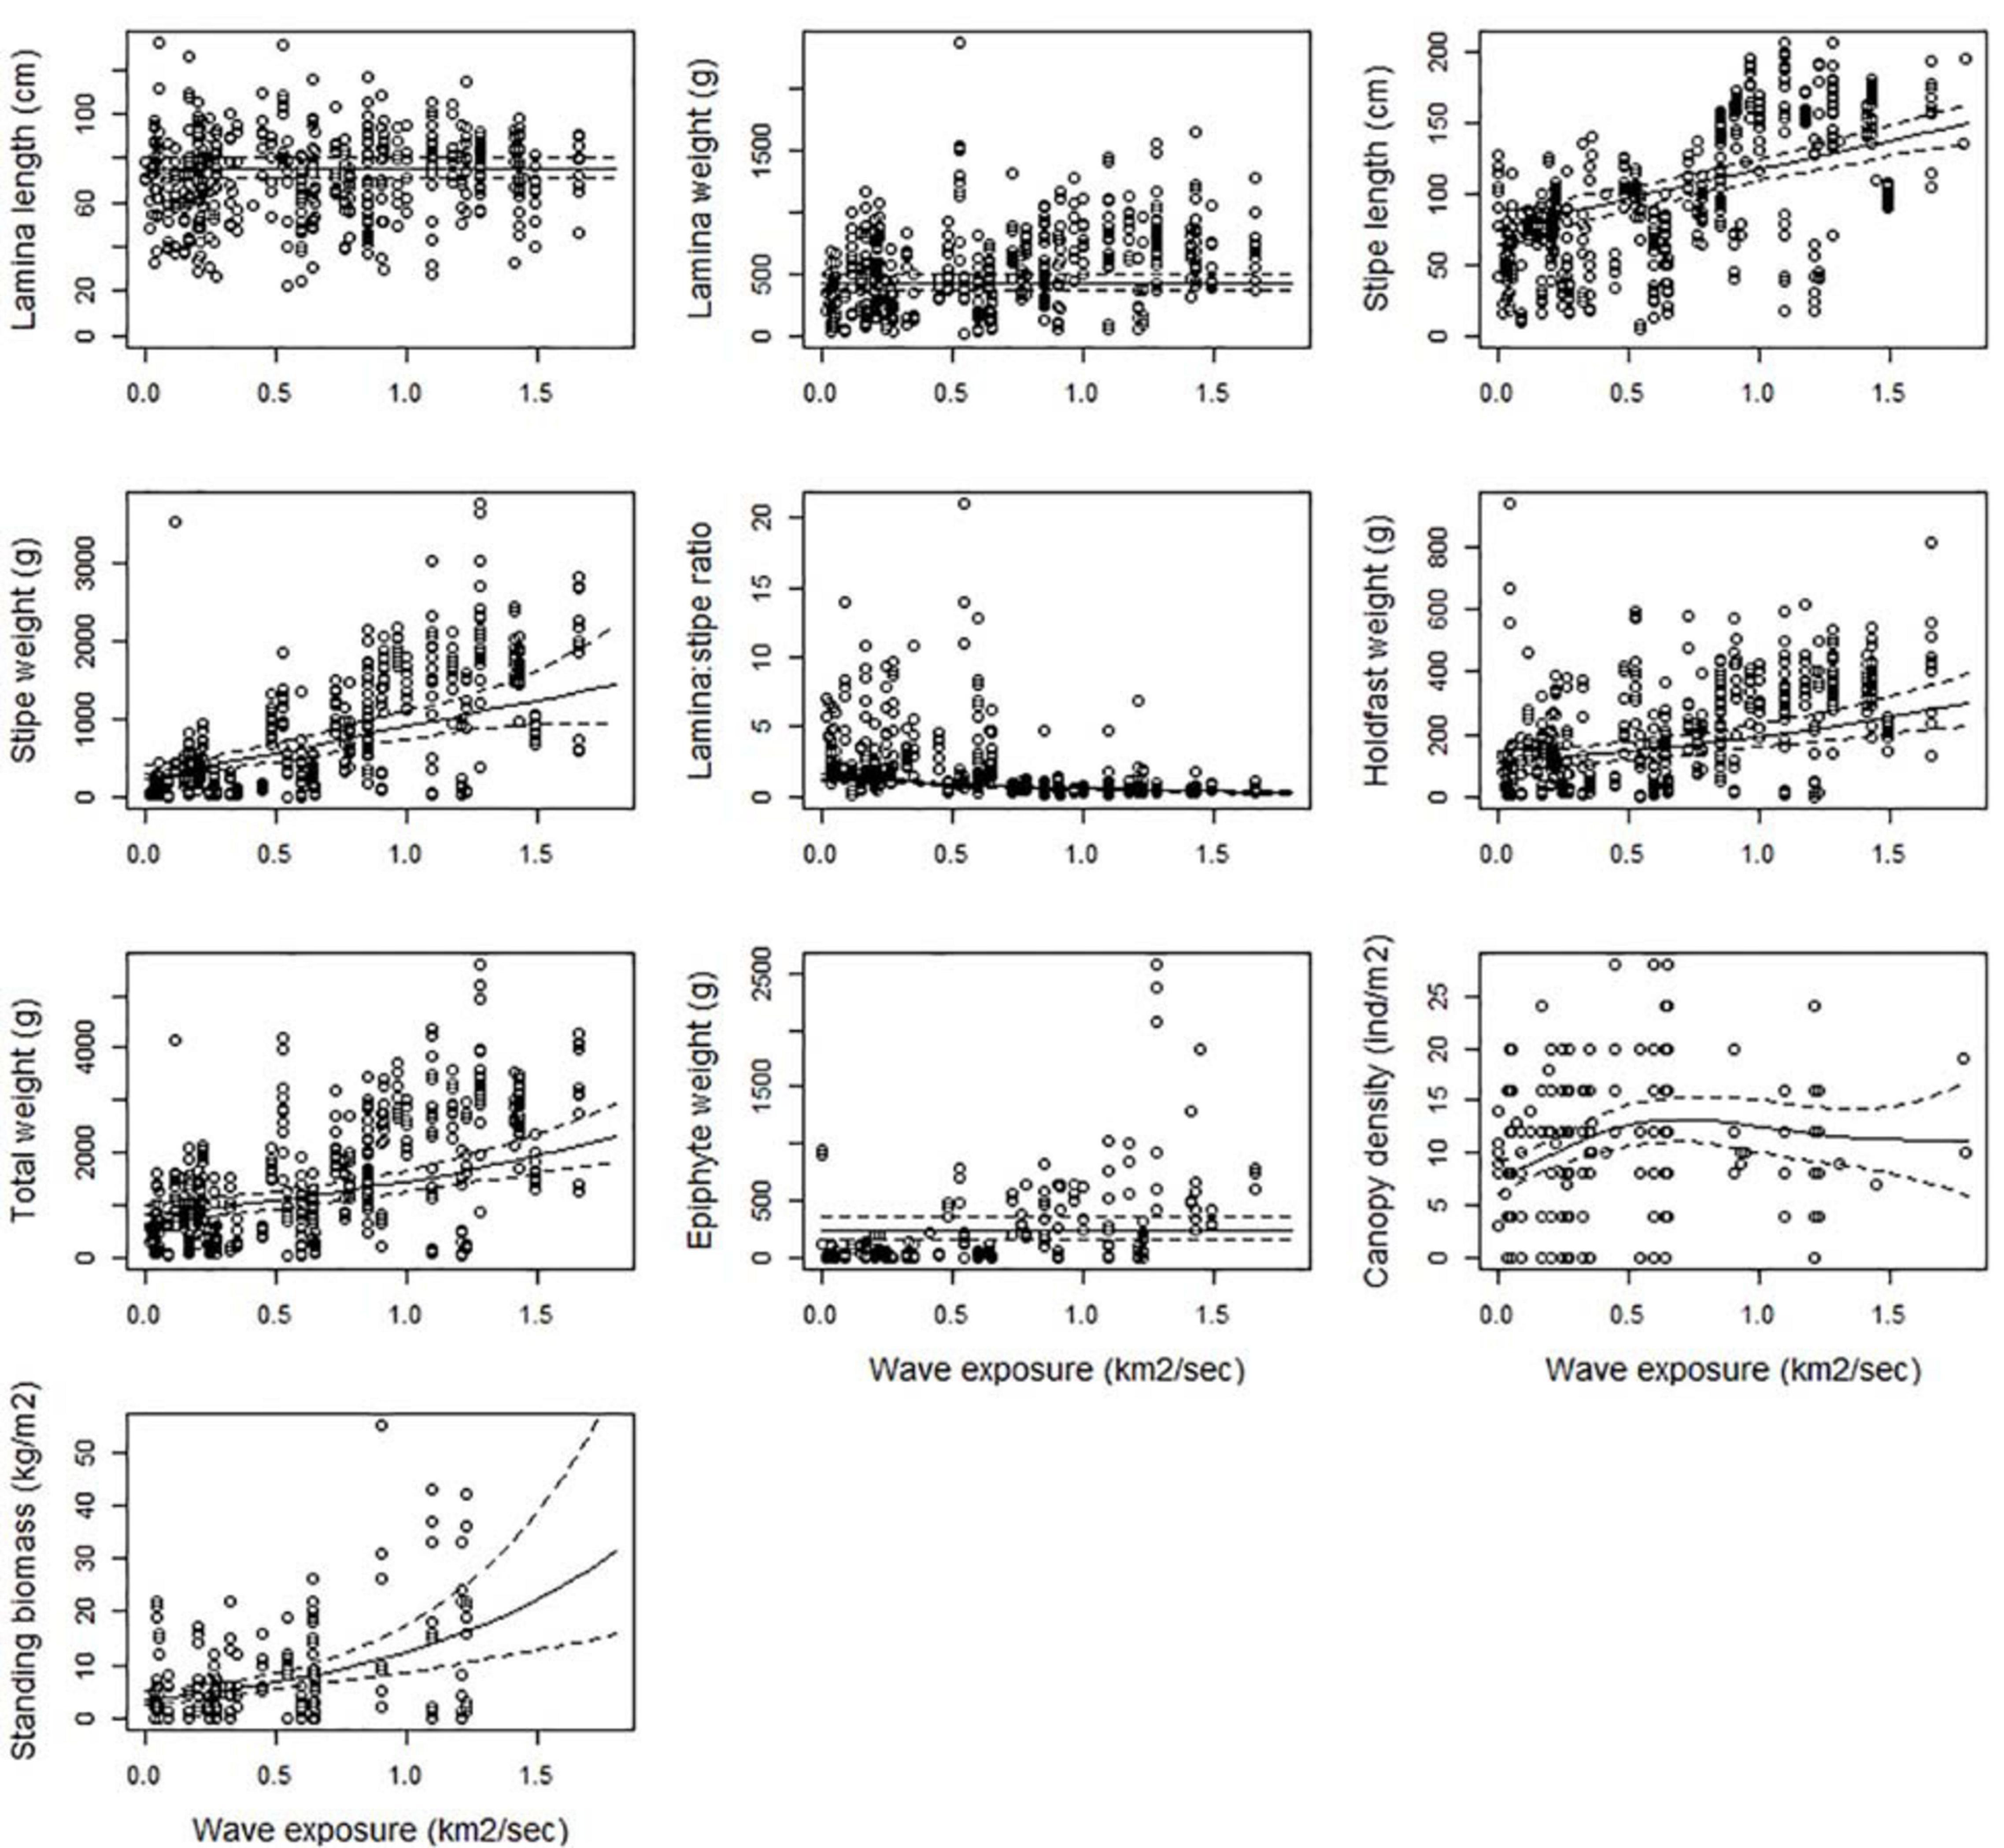
Figure 3. The partial response plots for kelp canopy characteristics for different wave exposures (km2/sec) based on the selected GAMM models of all responses (Table 2). The predicted curves (± 2 se) are standardized for a locality at the West coast of Norway (Møre, 62.83°N, 6.55°E), depth = 10 m and canopy kelp age = 7.8 years (i.e., the average kelp canopy age in the dataset).
Geographical Variation in Kelp Characteristics
For seven of the ten responses, a candidate model including latitude (all p < 0.001) were selected as the best one (Table 2). For lamina length, latitude was also highly significant (p < 0.001), however not included in the most parsimonious model. Standing biomass and canopy density were the only responses that did not change significantly along the south-north gradient.
For most of the kelp characteristics related to size (weight and length) there was an optimum in Mid-Norway (ecoregion Norwegian Sea South) (Figure 4). Lamina weight, stipe length, stipe weight, and epiphyte weight had their maximum values between 62.5 and 63.5°N. The lamina/stipe weight ratio reveals heavier stipes than blades in Mid-Norway than further south and north, further confirming Mid-Norway to house the most robust kelp plants along the Norwegian coast with the largest and heaviest canopy holdfasts and stipes. Total weight and holdfast weight were also high at these latitudes. There are also a few large observations north of 70°N, which results in an increasing trend for these characters further north. However, large confidence intervals indicate that this increase was uncertain.
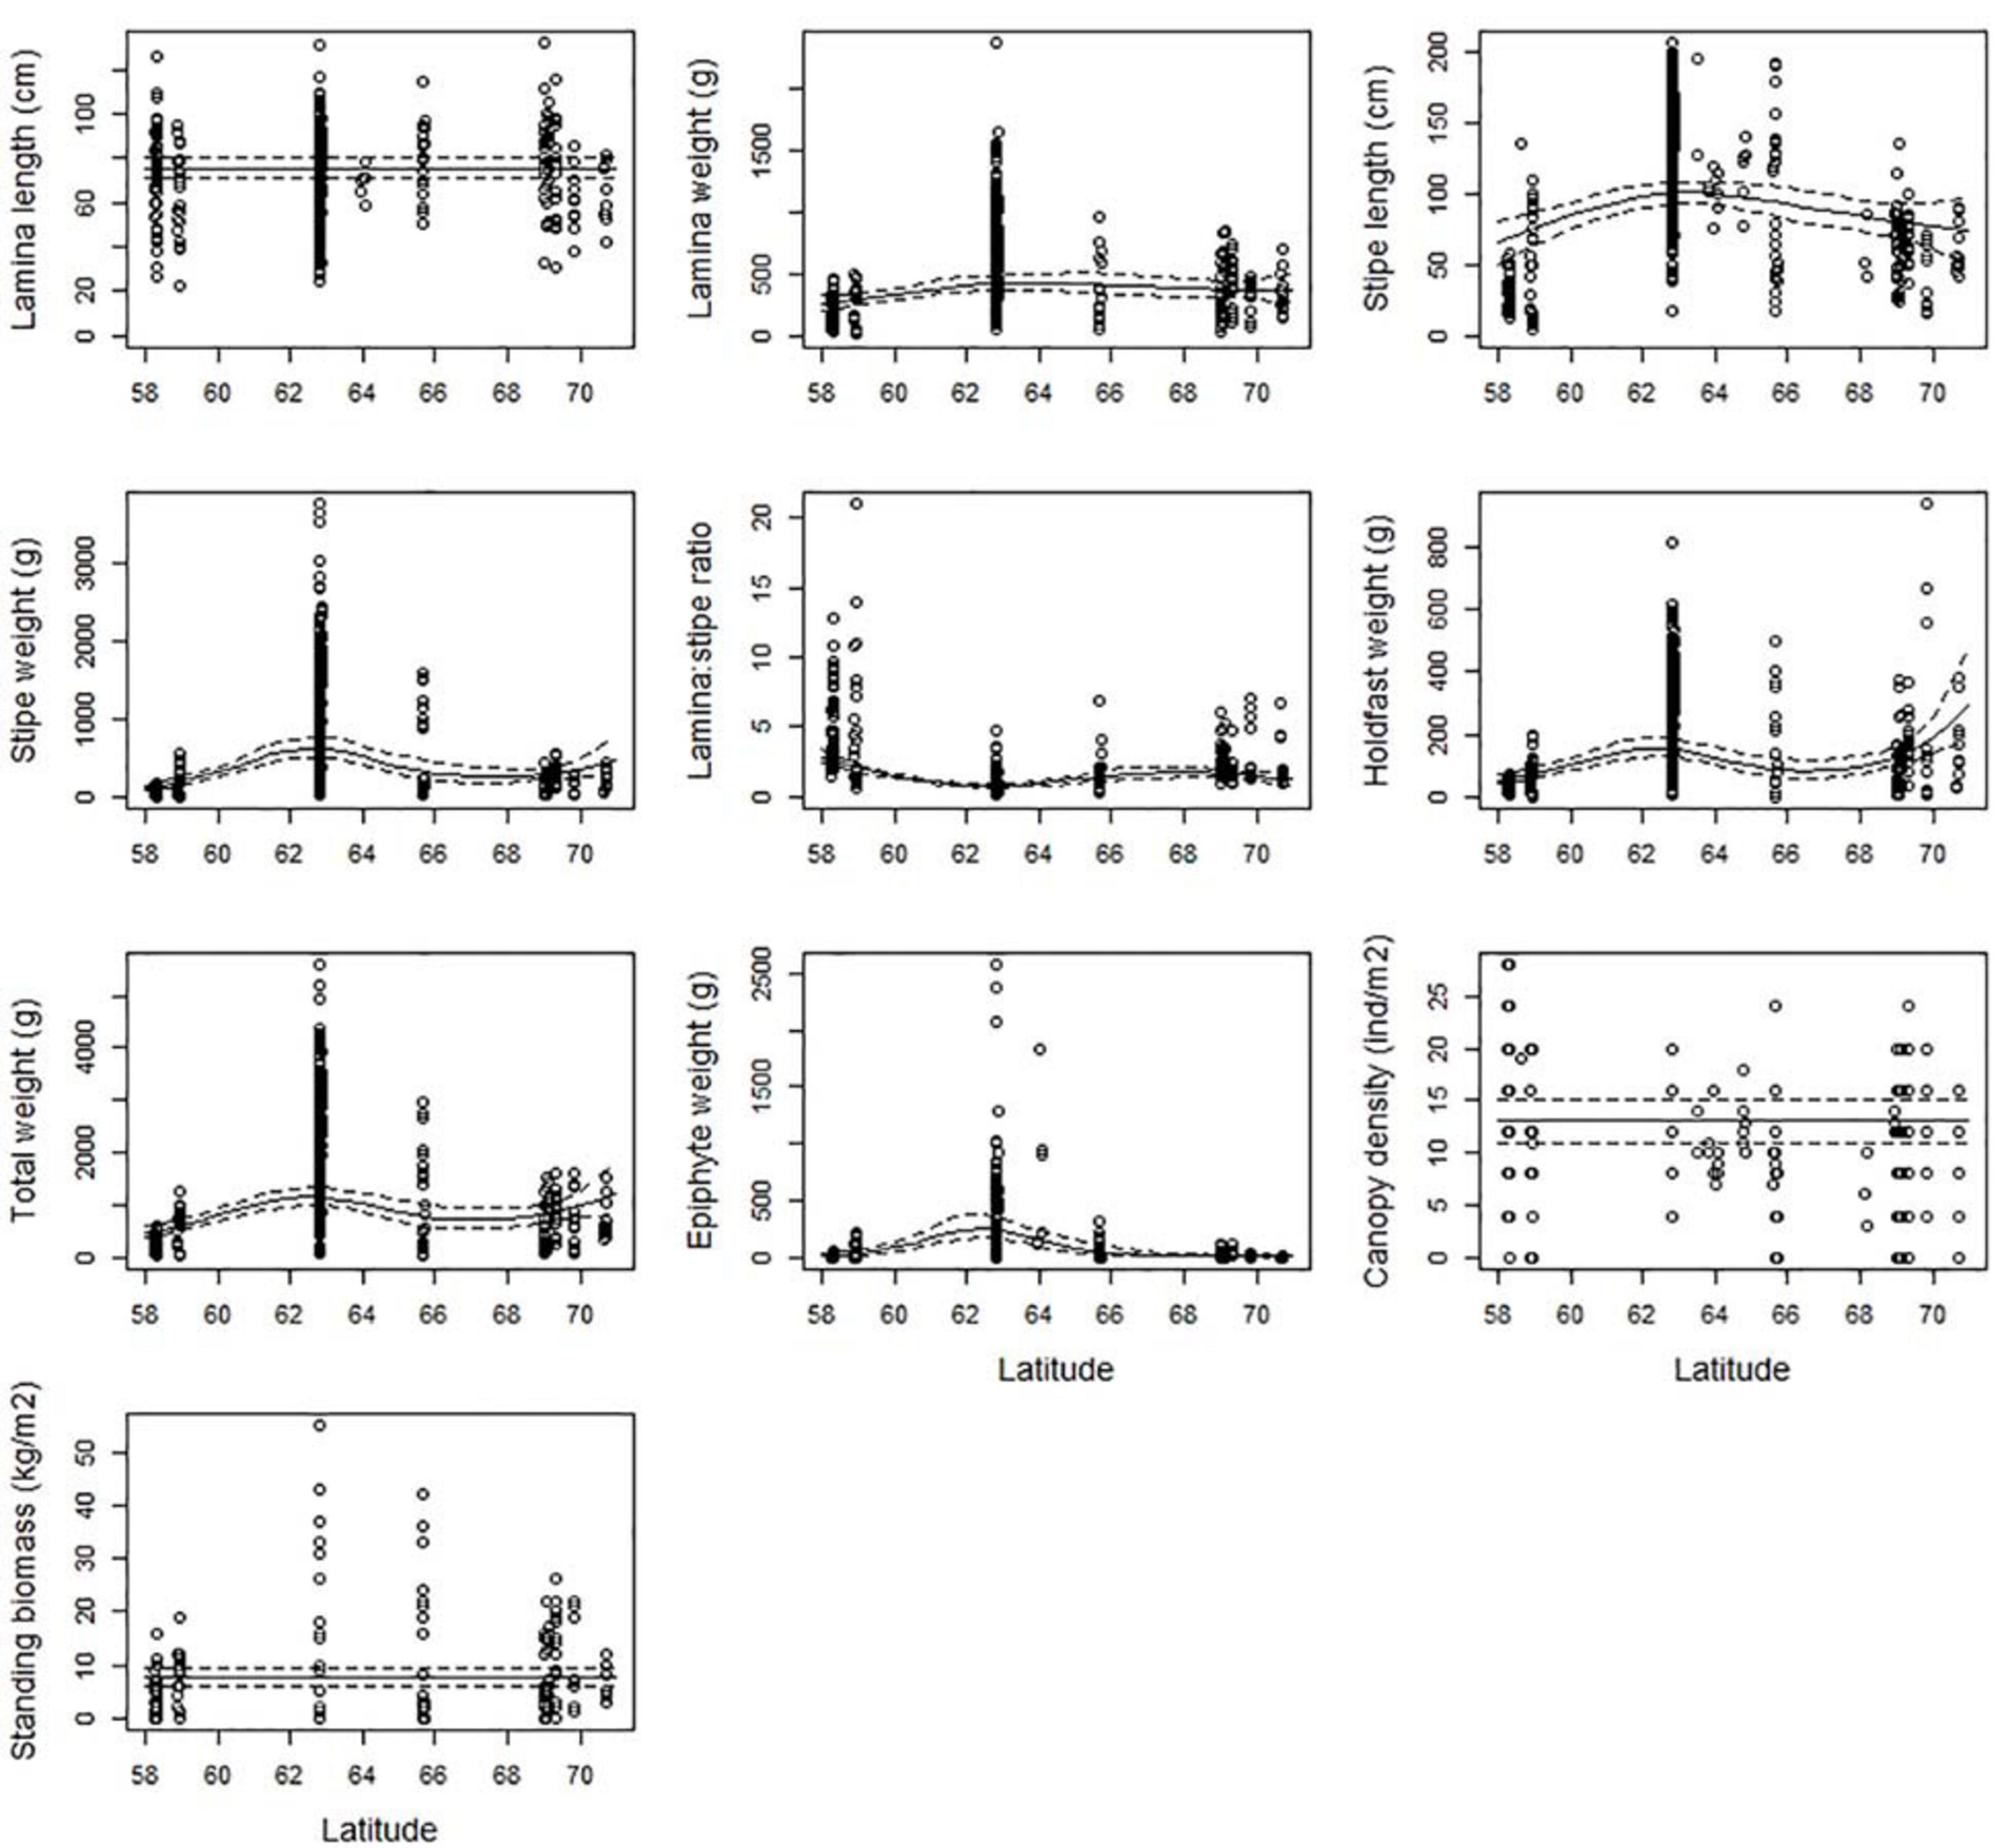
Figure 4. The partial response plots for kelp canopy characteristics for different latitudes (degrees) based on the selected GAMM models of all responses (Table 2). The predicted curves (± 2 se) are standardized at depth = 10 m, wave exposure = 0.6 km2/sec (i.e., wave exposed, Isæus, 2004), and canopy kelp age = 7.8 years (i.e., the average kelp canopy age in the dataset).
Variation in Kelp Characteristics With Age
All size-related responses, except the lamina/stipes weight ratio, were positively correlated with age, reflecting increased length and weight as the kelps get older (Figure 5). The canopy layer consists of kelp plants of different ages. When average canopy age reached approximately 10 years, there was no further increase in size afterward. This was the case for the total weight, lamina weight, holdfast weight, stipe length, stipe weight, biomass and epiphyte weight. Lamina length, however, reached maximum when average canopy age was 14 – the oldest age measured in the study. The lamina/stipe weight ratio decreased with canopy age, showing a strong skewness toward lamina weight over stipe weight in young plants (Figure 5).
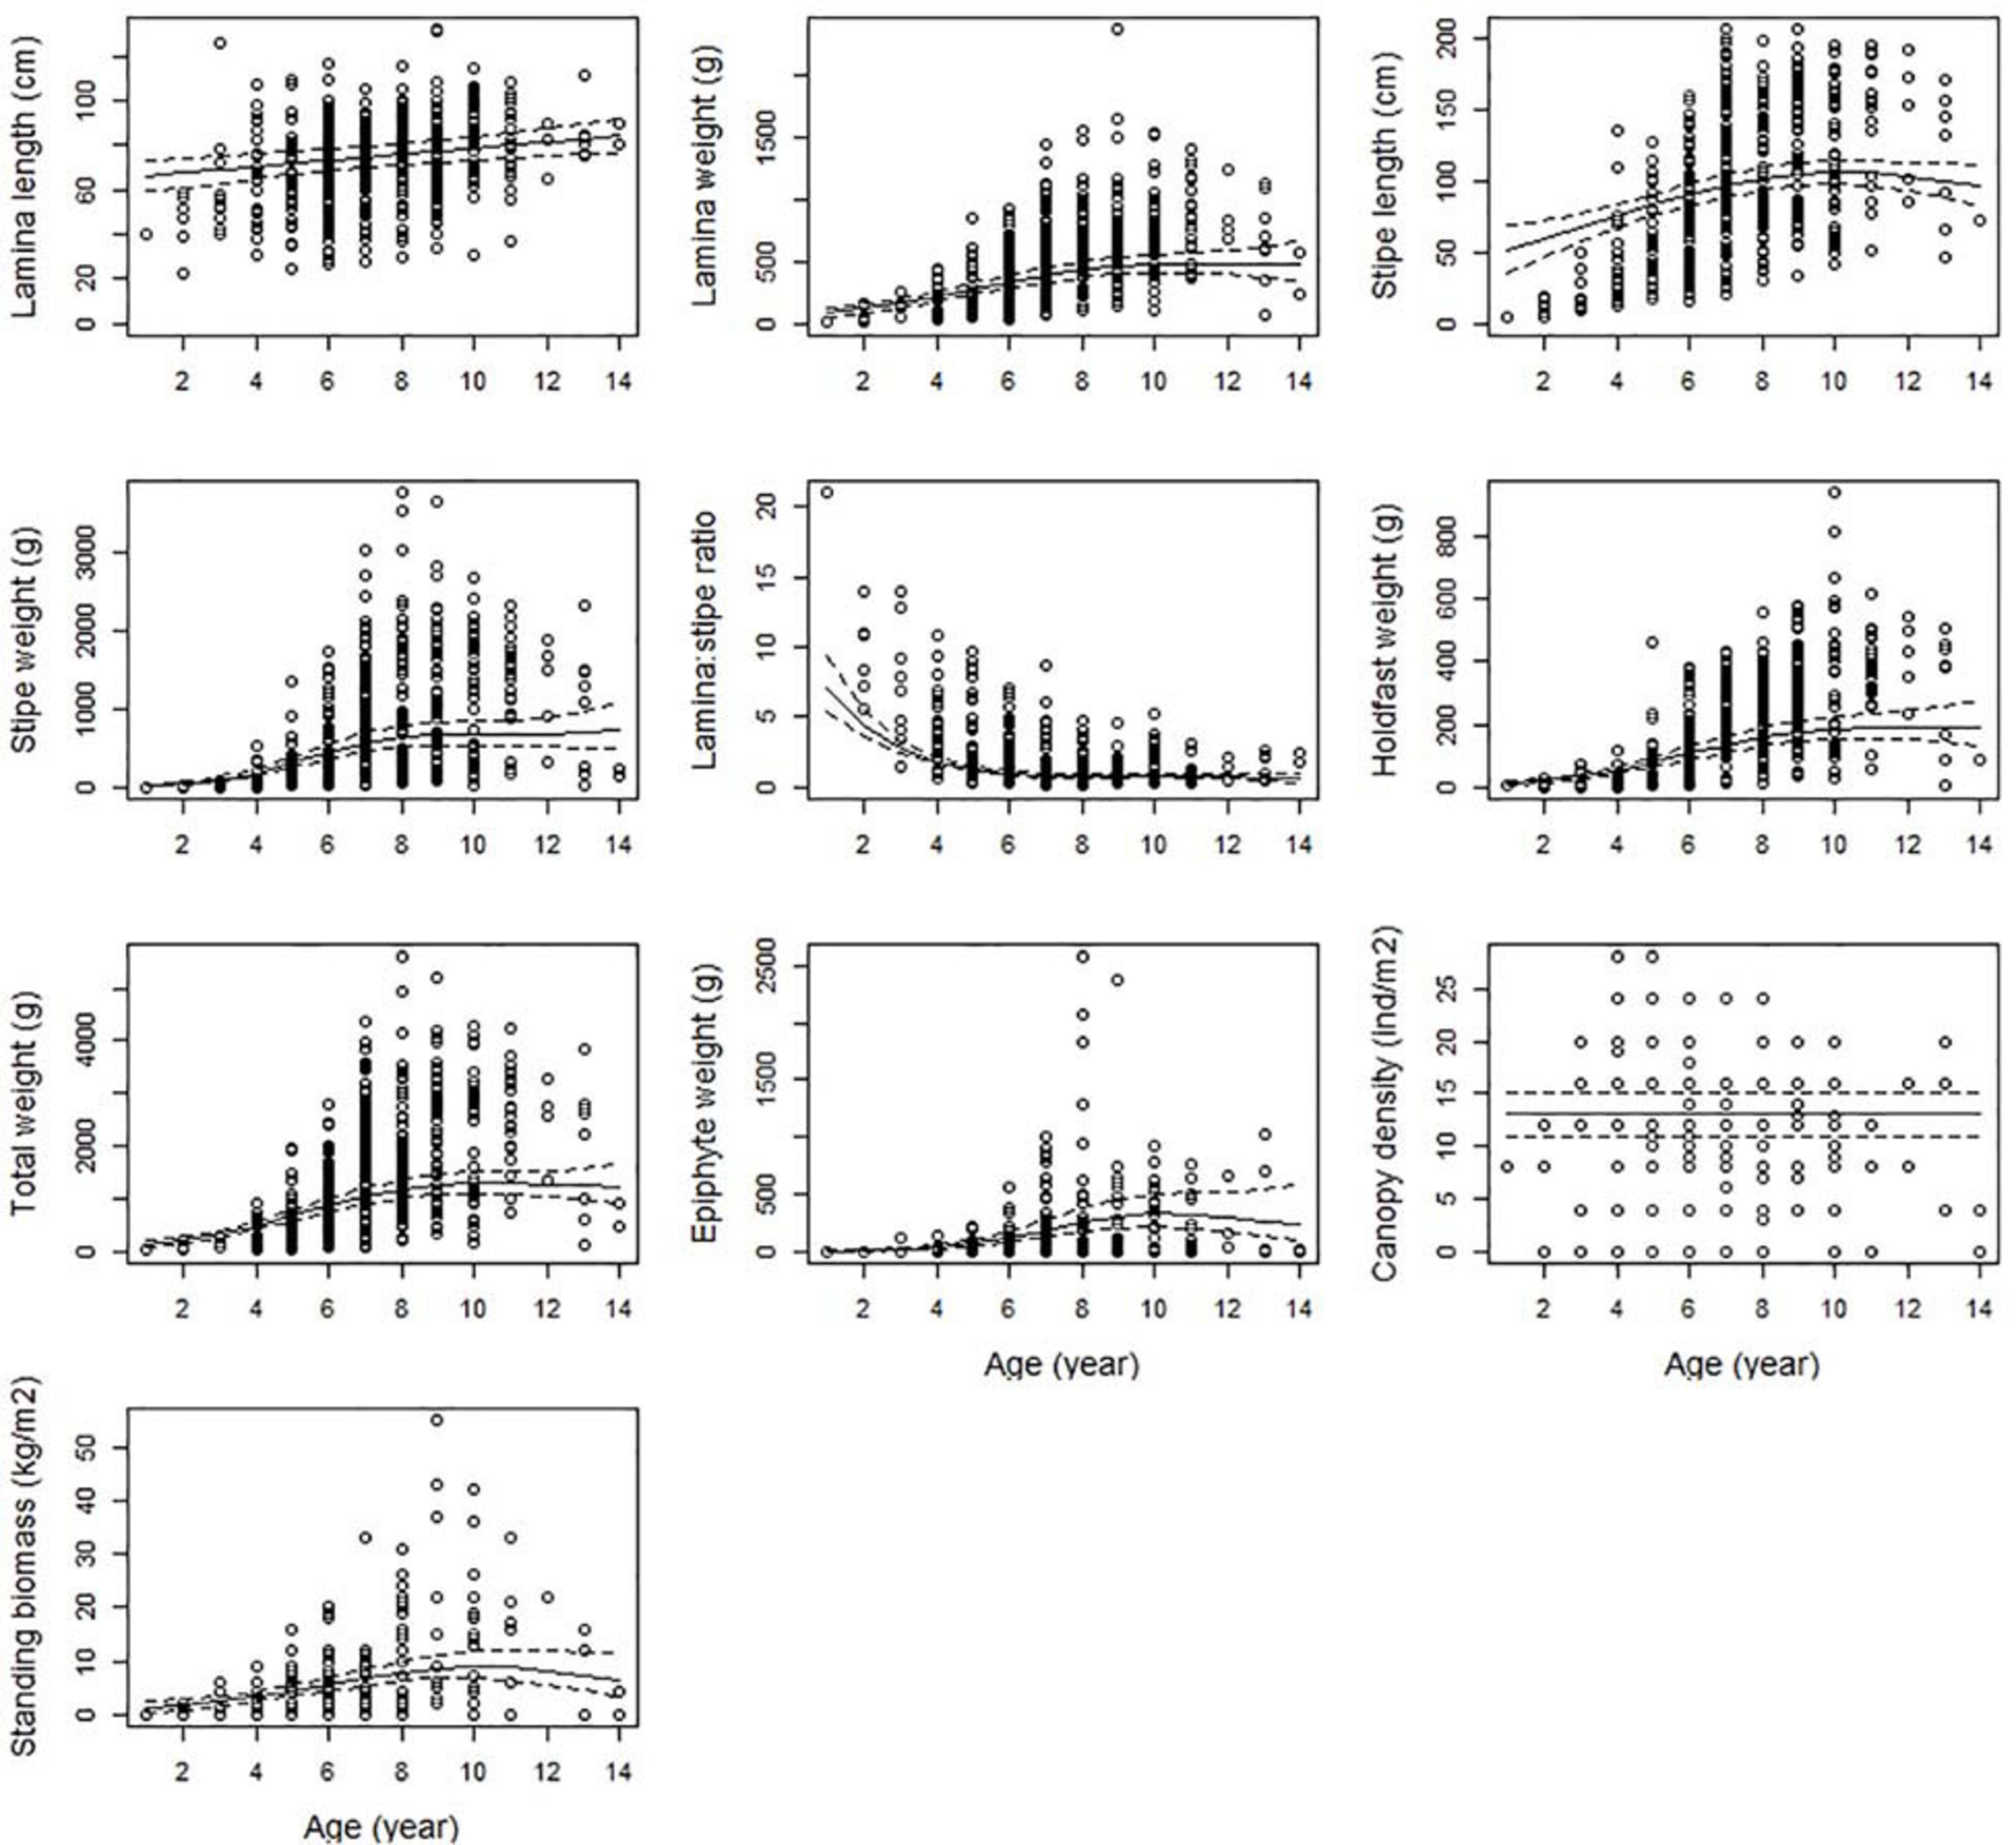
Figure 5. The partial response plots for kelp canopy characteristics for different ages (years) based on the selected GAMM models of all responses (Table 2). The predicted curves (± 2 se) are standardized for a locality at the West coast of Norway (Møre (62.83°N, 6.55°E), at depth = 10 m and wave exposure = 0.6 km2/sec (i.e., wave exposed, Isæus, 2004).
Implications for Carbon Storage, Export, and Sequestration
Based on the model output (Figures 2-4), we estimated the total plant weight per square meter at the level of ecoregions, differentiated at three depth levels (Figure 6). This was also done for canopy density and standing biomass, however due to a lack of significant effect of latitude in these models (Table 2), their estimates remained at 14.5 (± 0.56 se), 13.1 (± 0.53 se) and 7.7 (± 0.38 se) individuals per m2 at 5, 10, and 20 m depth, and at 13.7 (± 0.79 se), 7.6 (± 0.45 se) and 1.9 (± 0.20 se) kg/m2 at the same depths, across all ecoregions.
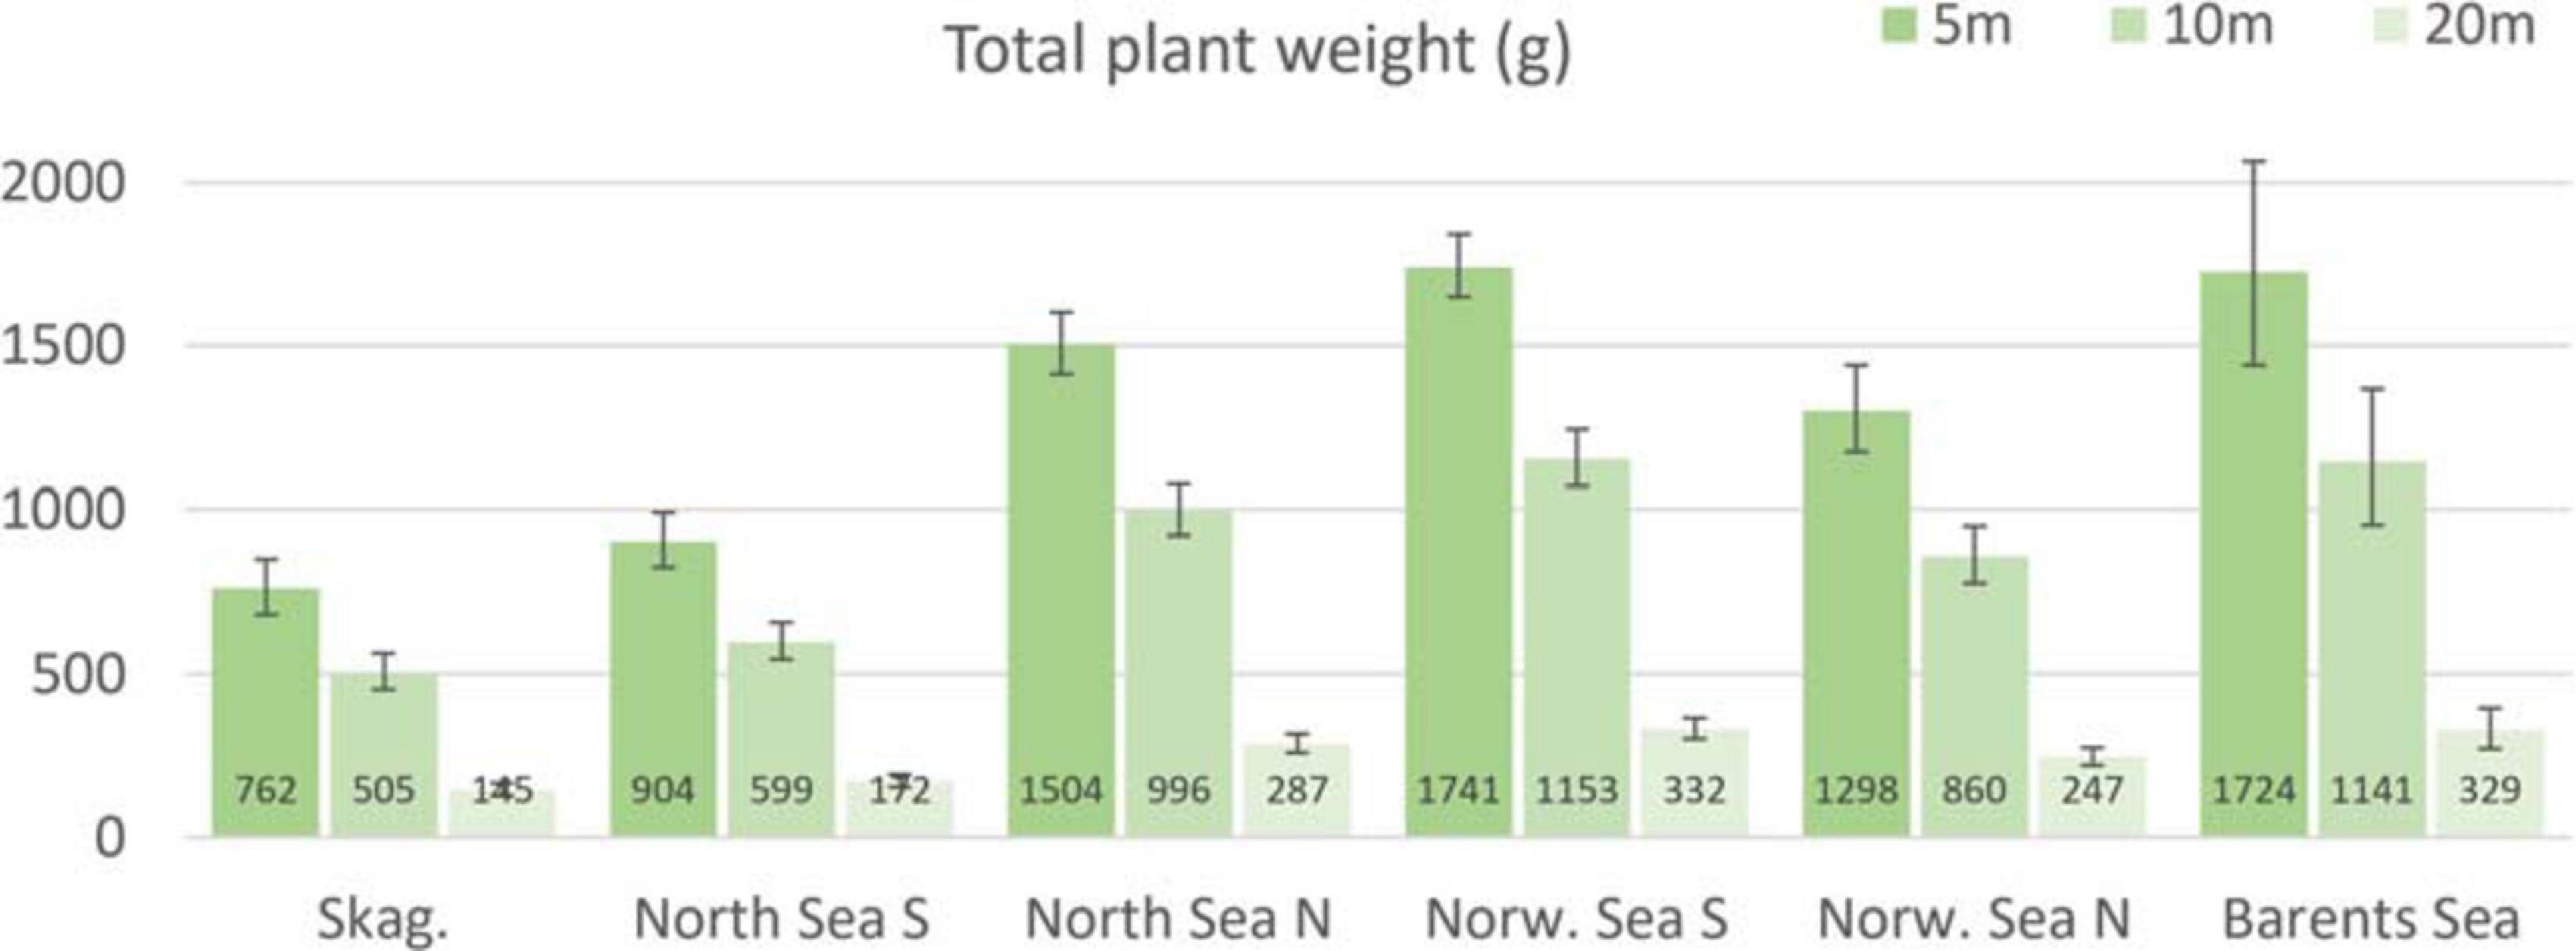
Figure 6. Predicted (± 2 se) total plant weight (g) for Norwegian kelp forest overall, based on the selected GAMM model. The predicted values are specified for each of the six ecoregions Skagerrak, North Sea South, North Sea North, Norwegian Sea South, Norwegian Sea North, and Barents Sea, by choosing representative latitudes approximately at the mid of each ecoregion. The model is standardized at wave exposure = 0.6 km2/sec (i.e., wave exposed, Isæus, 2004) and canopy kelp age = 7.8 years (the average kelp canopy age in the dataset), for comparison purposes, which may bias the results somewhat, since average wave exposure are higher for instance in the Norwegian Sea than Skagerrak, and canopy kelp plants are typically younger in Skagerrak and North Sea than further north.
The total area suitable to all Norwegian kelp forests, between 0 and 20 m depth was calculated to be 6 947 km2. This is equivalent to the area estimated to be composed of rock/hard bottom, assuming a cliff (hard bottom) proportion of 56% of the total area (12 405 km2). The suitable kelp area, multiplied by the modelled depth-specific standing biomass per square meter, yielded a Norwegian kelp standing stock of 70 million tonnes, corresponding to 3.3 million tonnes of carbon (or 12 million tonnes CO2 equivalents). Because of sea urchin grazing in northern Norway, this number was adjusted for the presence of barren grounds in the Norwegian Sea North and Barents Sea by 50 and 80%, respectively (Appendix A in Christie et al., 2019), resulting in an estimated total kelp distribution of 5 355 (5082 – 5627) km2, and a biomass of 56 (53 – 58) million tonnes fresh weigh corresponding to 2.6 (2.5 – 2.7) million tonnes carbon and 9.5 (9.1 – 9.9) million tonnes CO2 equivalents. Further details and a summary of these estimates are provided in Table 4.
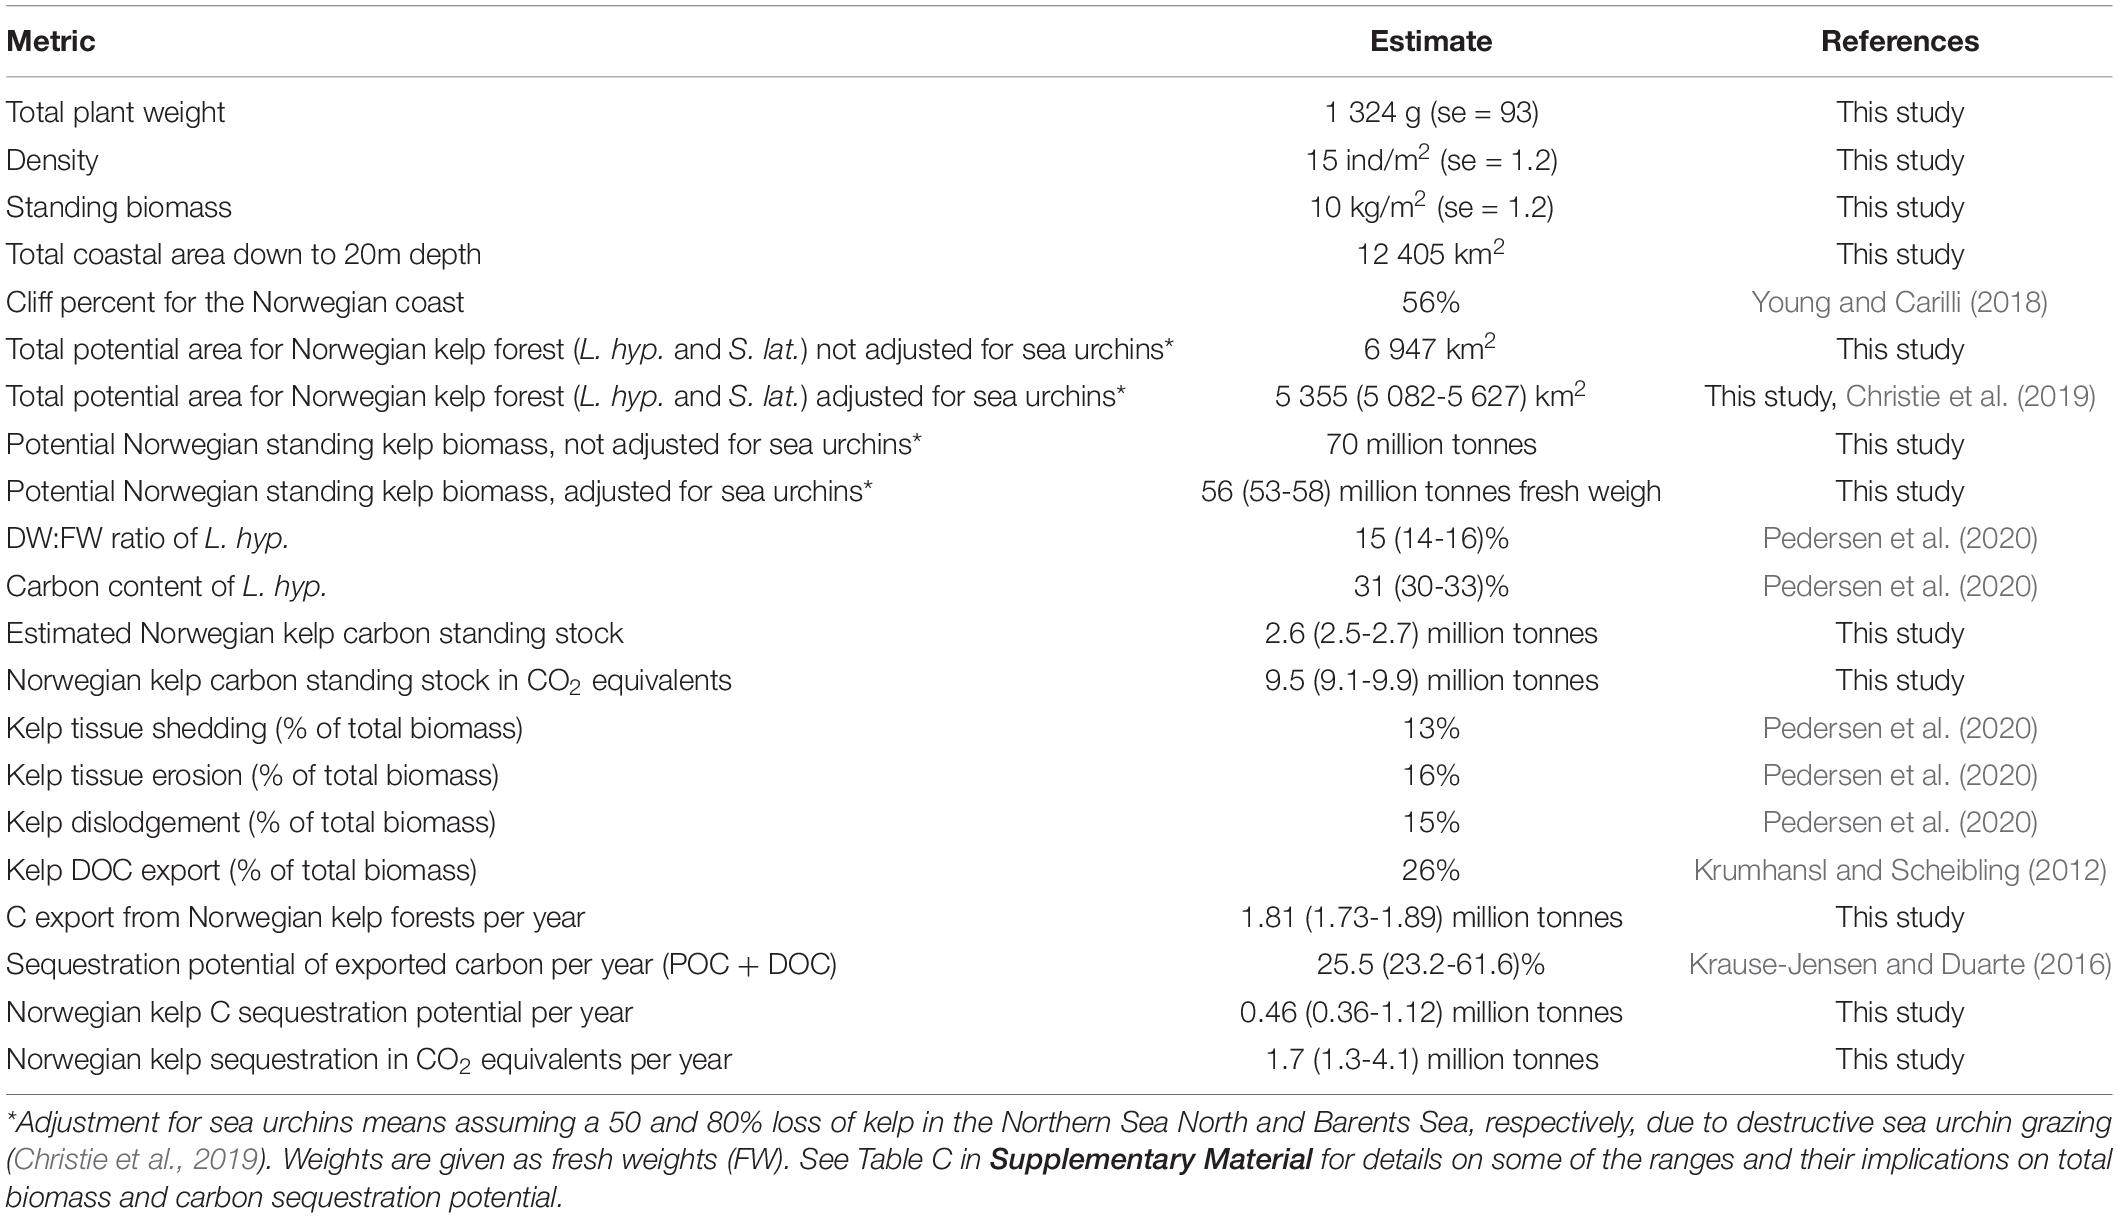
Table 4. Average kelp weight, density and biomass for the Norwegian L. hyperborea kelp forest, kelp area distribution estimates (including both L. hyperborea and S. latissima), and estimated biomass, carbon content and rates of potential carbon export and sequestration (both species but based on L. hyperborea characteristics).
The sensitivity analyses made for central parameters included in the calculation of biomass and carbon sequestration showed that the two most influential parameters are the modelled standing biomass per depth (lower confidence interval defining lower range of CO2 sequestration potential of 1.7) and sequestration potential of exported carbon (upper range given by Krause-Jensen and Duarte, 2016, defining the upper potential of 4.1) (Table C, Supplementary Material).
Discussion
By sampling data on the variation in 10 characteristics of L. hyperborea relevant for ecological function and analyzing this against depth, wave exposure and latitude in the North-East Atlantic, the results of this study can be applied to estimate all these characteristics and their associated ecosystem services at any site of interest along the core distribution area of the species, i.e., the Norwegian coastline. Despite the large variation between sites in all the measured characteristics (Table 1), the analyses revealed some clear trends along key environmental gradients. The estimates and general patterns of variation that was observed can be used to assess the role of kelp in a broader ecological perspective than previous studies (e.g., Rinde and Sjøtun, 2005; Bekkby et al., 2009, Bekkby et al., 2014b, 2019; Pedersen et al., 2012; Smale et al., 2016). The established relationships and estimates can be used to upscale numbers of relevance for managers and policy makers at national and global levels, including those relevant for carbon storage and sequestration assessments.
Kelp Characteristics Along Depth and Wave Gradients
All the measured size-related kelp canopy plant characteristics, as well as kelp canopy density, are reduced with water depth. This was in accordance with previous studies, as the amount of light that reaches the seafloor, and thus available for kelp photosynthesis, is reduced with depth (Kain, 1971a; Vigander, 2007; Bekkby et al., 2009; van Son et al., 2020). Also, the abundance of epiphytes on the stipe decreased with depth, which is most likely directly caused by light limitation for photosynthetic species. Less epiphytes with depth may be indirectly caused by lack of habitat, i.e., decreased kelp size (Christie et al., 1998), as the kelp size decreased with depth.
Kain (1971a) showed that L. hyperborea forests tended to be absent, or poorly developed in areas of low wave exposure but that they become more common and well developed as wave exposure increases. This is supported by Bekkby et al. (2019) for the southern and western coast of Norway. However, although wave exposure can stimulate the density and biomass of canopy species, there is an increasing risk of physical damage or dislodgement at the highest level of exposure, for instance during episodic storm events, as shown for Ecklonia radiata (Kennelly, 1987). This is consistent with the bell-shaped effect of wave exposure on canopy density found in the present study. However, we lacked data from highly wave exposed areas in several of the ecoregions, due to logistical challenges associated with sampling such sites, as indicated by the wider confidence interval of the response in this part of the gradient (Figure 3). We should therefore be careful with concluding on the shape of the curve in this part of the wave exposure regime. However, in the present study, less than 2% of the area suitable for kelp forest growth had a higher exposure than the highest wave exposure level sampled (1.8 km2/sec), thus the lack of data from such areas will not have biased the overall conclusions. Other Norwegian studies found up to a doubling in biomass in moderately wave exposed compared to more sheltered areas, with a levelling off toward more exposed sites (Andersen, 2007; Pedersen et al., 2012; Norderhaug et al., 2012; van Son et al., 2020). A similar, but somewhat weaker pattern was found for L. hyperborea biomass in north-western France by Gorman et al. (2013) and for canopy density in the United Kingdom (Smale et al., 2016).
There were strong positive relationships between wave exposure and several of the size related characters of kelp, such as stipe length and stipe weight, holdfast weight and total weight. These results confirmed the findings of e.g., Bekkby et al. (2014b); Wernberg and Vanderklift (2010); Miller et al. (2011) from Norway, Australia and New Zealand, respectively. High wave exposure increases light availability to different parts of the fronds by moving the kelp back and forth (Hurd et al., 2014). Further, it promotes the nutrient uptake by reducing the boundary diffusion layer (Hurd et al., 1996) on the blade, thereby creating improved conditions for photosynthesis and growth. Water movements foster strength-related responses (Bekkby et al., 2014b), including thicker stipes and more robust, i.e., larger, holdfasts. Through increased kelp size, wave exposure will also indirectly affect the abundance and diversity of associated flora and fauna (Christie et al., 1998, 2003; Teagle et al., 2017, 2018), and thus increase the kelp forests function as a habitat building structure. Due to the lack of data from the most wave exposed areas in several ecoregions, the further increase in e.g., stipe, holdfast and total weight, in the most exposed parts, has a higher uncertainty than for lower exposures.
Geographical Variations in Kelp Characteristics
This geographically wide study, offering a comprehensive dataset of measured characteristics across 12 degrees latitude, provided the opportunity to study variations along this latitudinal gradient. In general, latitude represents environmental gradients such as temperature, irradiance and photoperiod, with colder water, steeper solar angles, and more daylight during summer, toward the poles. We found the kelp stipes to be relatively small (both in length and weight) in Skagerrak and the North Sea, increasing to a maximum in the Norwegian Sea (with a peak around 64°N), and reducing in size toward the Barents Sea in the north (Figure 1 and Table 1). This geographical pattern confirmed earlier studies, that identified the coast of Mid-Norway to have the largest L. hyperborea kelp plants (e.g., Rinde and Sjøtun, 2005). This is most likely caused by optimal sea water temperatures and light conditions (both irradiance and photoperiod) in the Norwegian Sea, which enhances kelp photosynthesis and growth (Rinde and Sjøtun, 2005). Old recordings on kelp size from the Scottish west coast at 56°N, 5°W, where temperatures are somewhat lower than in Norway at similar latitudes, reports on average sizes of kelp plants at the level of mid-Norway (Jupp and Drew, 1974). Whether this is still the case today, considering sea temperature rises and other anthropogenic impacts, is not known.
Despite the geographical patterns in kelp size, and despite some very high measurements of biomass in mid-Norway, there were no significant relationship between standing biomass and latitude. We cannot rule out that the number of observations was insufficient, or the variation was too large in Mid-Norway to yield significant effects of latitude on biomass. On the other hand, if there is a real lack of geographical trends in biomass, this may have implications for kelp harvesting strategies, as kelp forests of otherwise equal depth, wave exposure and age composition will have roughly the same amount of raw material available for kelp harvesting, irrespective of where along the coast you harvest. A study from the Scottish west coast (56°N, 5°W; Jupp and Drew, 1974) support this lack of a latitudinal trend in biomass further south in the distribution area of L. hyperborea. Here, the average biomass of kelp at 9 m matches exactly the one estimated at 10 m in this study (7.7 and 7.6 kg/m2, respectively). On the French west coast (48°N, 3°W), however, average standing biomass was considerably lower than further north, at least at shallower depths (Gorman et al., 2013). Also, Pessarrodona et al. (2018) documented large differences in kelp L. hyperborea stocks along a latitudinal temperature gradient from northern (∼57°N, ∼4°W) to southern (∼51°N, ∼5°W) Great Britain.
The absence of geographical trends in canopy density may also be due to low sample size for this variable, but is probably also related to the fact that larger kelp plants in Mid-Norway take up more space and causes a thinning effect, similar to that in terrestrial forests. A similar lack of differences in canopy density for different latitudes in Great Britain was found by Pessarrodona et al. (2018). Since the biomass variable was composed of canopy density (and total weight), this may also partly explain the lack of significant geographical trends in biomass.
Our study provides baseline knowledge of the present status of kelp characteristics along the most influential environmental gradients in NE Atlantic. However, global climate change, including ocean warming, more storm events and ice-melting, are predicted to have a high influence on kelp characteristics and distribution in the future (e.g., Smale et al., 2013, 2019; Krause-Jensen and Duarte, 2014). High summer temperatures and marine heatwaves have already been shown to cause distributional shifts of canopy forming seaweeds, including L. hyperborea, along the Atlantic coast of Southern Europe (Casado-Amezúa et al., 2019) and in the North Atlantic (Filbee-Dexter et al., 2020). With increasing temperatures and more frequent and longer lasting heat waves, we can expect that kelp plants may become smaller in some regions, and some kelp forests may become less dense or even disappear in the near future (Filbee-Dexter and Wernberg, 2018). This study shows that there still seems to be optimal conditions for kelp growth in Mid-Norway at around 63°N (as described by Rinde and Sjøtun, 2005), presumably due to favorable temperatures. However, this optimum will possibly shift northwards with ocean warming and the present study provide a baseline for future studies of climate impact on kelp forest distribution.
Canopy Age – An Important Source of Variation
In this study, age represents the average age of the plants sampled from the canopy layer of the kelp forest. The age of the plants in a kelp forest might be related to a range of different environmental or historic events. For instance, a young forest might recently have been subject to a storm, harvesting, or is about to recover from destructive sea urchin grazing. Many of these factors may be outside our control, but collectively accounted for by adding age as a co-variable in the analyses, taking this important source of variation into account. Statistically, the inclusion of age in the analyses increased the ‘goodness of fit’ of the models considerably (i.e., the proportion of variation explained increased substantially). All size-related characters, including biomass, indicated that canopy kelp plants older than approximately 10 years are about the same size. This pattern is also shown in other studies (Jupp and Drew, 1974; Pedersen et al., 2012). The change in the ratio between lamina and stipe weights with age is related to the fact that kelp plants allocate relatively more in photosynthetic structures early in life, and that the stipe grows larger for every year, since it lasts throughout the lifespan (Pedersen et al., 2012). A large lamina to stipe ratio may also be a result of suboptimal light conditions often found at greater depths or in turbid water, not necessarily related to age (Table 1). The biomass of kelp per square meter are also larger when canopy plants are older than 10 years, mainly attributed to the total weight of the plants, since canopy density seems not to be related to the age of the canopy plants.
Errors, Biases, and Uncertainties
The data analyzed in this study consisted of one core dataset from 2012 (51% of the data), one data set from 2008 (44% of the data) and several smaller datasets, sampled from 1991 to 1994. Consequently, the spatial patterns can be confounded with some temporal ones. Thus, in case of any large-scale changes in kelp characters over time, for instance due to climate changes, they would be confounded with, and perhaps wrongly attributed to, the spatial variation discussed earlier. However, as only a small part of the dataset (<5%) was from the 1990s, the effect of this temporal bias was assumed to be small (Table B in Supplementary Material).
Several studies have shown that factors such as ocean currents affect kelp characteristics (e.g., Miller et al., 2011) and that ocean currents can interact with wave exposure (Eckman et al., 2003; Bekkby et al., 2014b, 2019). Data on current speed was however not available at the spatial scale and resolution necessary for this study. Also, temperature is an important predictor of kelp quality and abundance (Assis et al., 2016), but this variable was not available at a resolution suitable to capture local environmental variability.
In general, the statistical models explained a high percentage (>74%) of the total variation of most of the measured characteristics, indicating a very good ability to capture the variation in kelp characteristics by the selected explanatory variables. Two exceptions were lamina length and canopy density, where more than 70% of the variation remained unexplained. Lamina length seems more difficult to predict by the available predictors than the other characteristics, probably because it is shed annually and is more affected by occasional events such as epiphytism, grazing and storm events, which erodes the blade.
Another probable bias was the fact that large areas of previously healthy kelp forests in wave sheltered areas of northern Norway are still barren after decades of destructive grazing by green sea urchins (Strongylocentrotus droebachiensis) (Norderhaug and Christie, 2009). This implies a difficulty in finding representative kelp forests in some areas of northern Norway. However, there has been a gradual and patchy reestablishment of the kelp forest since the early 1990s (Rinde et al., 2014; Christie et al., 2019) which made it possible to sample canopy kelp plants also from this region. Nevertheless, the predictions made for northern Norway represent only parts of the region where the kelp forest has recovered, and not areas that are still barren due to ongoing sea urchin grazing.
In the prediction of ecoregion specific total plant weight (Figure 6), canopy density and standing biomass, model parameters are held constant for variables other than depth and latitude, i.e., wave exposure and average canopy age. This was done for comparison purposes, but may also to some degree bias the results, since average wave exposure are higher for instance in the Norwegian Sea than Skagerrak, and canopy kelp plants are typically younger in Skagerrak and North Sea than further north (Figure 6). A useful continuation of this study would be to make a full spatial prediction based on the present models, to estimate plant weight, canopy density and biomass for the actual depths and wave exposures along the whole coast.
Implications for Management, Including Carbon Sequestration
Managing kelp forests in a sustainable manner is crucial to maintain their biodiversity and associated ecosystem services (Wernberg et al., 2019). The present study reveals some general trends for descriptors related to ecosystem services provided by Laminaria hyperborea kelp forests in the North-East Atlantic. The three-dimensional structure of the kelp forest provides habitat and food for a vast number of organisms (Steneck et al., 2002; Christie et al., 2003, 2009; Teagle et al., 2017) and the abundance and biodiversity increases with both size and age of the plants, as well as through the growth of holdfasts and epiphytes (Christie et al., 1998, 2007, 2009). Such complex and species-rich ecosystems tend to have high resilience to disturbances and biological control against potential natural and human perturbations (Dayton, 1985; Steneck et al., 2002). Kelps are important primary producers (Dayton, 1985; Steneck et al., 2002; Smale et al., 2013) and kelp characteristics such as lamina size affect the photosynthetic production, and thereby their role for carbon storage, export production and long-term burial. Thus, the potential for kelp forest to remove and sequester atmospheric CO2 (Hill et al., 2015; Krause-Jensen and Duarte, 2016). Large, dense and continuous kelp forests may also have a role in coastal defense through dampening of waves (Løvås and Tørum, 2001).
The statistical models provided here can be used to determine the spatial distribution of various kelp derived ecosystem services, which can further be used to evaluate different management strategies by considering their impact on different focal services. This will make it possible for instance to look at trade-offs between setting aside areas for kelp harvesting versus areas to conserve biodiversity and cultural values, with the use of scientifically based methodology. Assessing the linkage between latitude and temperature, our models can also be used to identify, quantify and visualize climate-related changes in kelp characteristics and future losses or gains in ecosystem services.
To provide regional explicit numbers, we predicted total plant weights, as well as canopy density and biomass per square meter at ecoregion level. In summary, the average standing biomass of Norwegian L. hyperborea forest was between 12 and 15 kg/m2 at 5 m depth, between 6 and 9 kg/m2 at 10 m, and < 3 kg/m2 at 20 m. The ecoregions match the management units used within the Norwegian implementation of the EU Water Framework Directive (Norwegian Classification Guidance, 2018). Such estimates are useful for instance when considering the restoration potential in a degraded area, or when assessing the impact of construction work in the coastal zone.
The predictive biomass model facilitates a first attempt to estimate the carbon storage in living standing stock of Norwegian kelp forest, by multiplying the predicted standing biomass with the total spatial cover of kelp. The total coverage of kelps in Norway was estimated to 5 355 (5 082 − 5 627) km2. This corresponds to a total standing stock of 56 (53 − 58) million tonnes of fresh kelp, and a carbon storage of 2.6 (2.5 − 2.7) million tonnes, equivalent to 9.5 (9.1 − 9.9) million tonnes of CO2 (Table 4).
Likewise, the carbon storage estimate, the present study gives an estimate of the carbon sequestration potential from Norwegian kelp forests. Living kelp is continuously exporting biomass to adjacent environments as particulate organic material (POM) through tissue erosion, shedding, and whole plant dislodgement. A part of this biomass is exported from the kelp forest and long-term buried in seafloor sediments and hereby contribute to the removal of carbon from the ocean-atmospheric pool for centuries. In addition, kelp export a significant amount of dissolved organic matter (DOM) during growth. Through these two processes do kelp forests potentially contribute to sequestration of “blue carbon”. The average yearly rate of spring cast (shedding), erosion, and dislodgement has been estimated for Norwegian kelp forests to 13, 16, and 15%, respectively, summing up to a total POC export of 44% of the standing biomass (Pedersen et al., 2020). Assuming a DOC production equivalent to 26% (16 to 35%) of the biomass produced per year (measured as percent of primary production, Krumhansl and Scheibling, 2012), the yearly carbon export from Norwegian kelp forests sums to 1.8 million tonnes (70% of 2.6 mill tonnes), based on the kelp distribution predictions of this study.
The exported organic matter is either labile and consumed by secondary producers or refractive and thus has the potential to be sequestrated. Assuming a potential sequestration proportion of 25% (23-62%) of the total carbon export from kelp forests (Krause-Jensen and Duarte, 2016), the yearly carbon sequestration from Norwegian kelp forests equals 0.46 million tonnes (0.36-1.12 mill tonnes C per year), which translates into 1.7 million tonnes CO2 (1.3-4.1, Table 4). This potential includes sequestration of both particulate and dissolved organic carbon (POC and DOC) and is based on assumptions proposed by Krause-Jensen and Duarte (2016) that DOC exported below 1000 m water depth is removed from the system as it will be disconnected from the upper ocean and atmospheric carbon pools long enough to be considered as sequestrated. The estimate falls within an early estimate of 0.9-2.3 million tonnes CO2, which was based on crude rule-based GIS-models and accumulation rates of carbon in terrestrial systems (Gundersen et al., 2011). These estimates exclude an unknown contribution from understory plants and kelp forests below 20 m depth, which may add to the coarse estimate of yearly export of carbon from Norwegian kelp forests.
The detailed assessment of the standing stock of kelp biomass in this study improves the possibilities to understand coastal carbon budgets, and dynamics of carbon and energy transfer from kelp forests. As several studies have related fauna species distribution to size of holdfast and stipe epiphytes (Christie et al., 2009; Teagle et al., 2018) and further related this to secondary production (Norderhaug and Christie, 2011) the proportion of primary production consumed inside the kelp forest may be estimated. Concerning the complex energy transfer in kelp forests (Norderhaug et al., 2003) and metabolic costs from one trophic level to another, the consumption by secondary producers may take between almost nothing and up to as much as 80% of the primary production (Christie and Norderhaug, 2017), imposing a key uncertainty to the carbon export and sequestration potential.
Data Availability Statement
The raw data supporting the conclusions of this article will be made available by the authors, without undue reservation.
Author Contributions
HG, ER, TB, KH, and HC have contributed to the writing of the manuscript, while ER, TB, JG, and HC have participated during field work. HG and ER has performed the statistical analysis, and HC initiated the study and the comprehensive field sampling in 2012. All authors have discussed the scope and agreed to the conclusions and aims of the manuscript.
Funding
Much of the field work has been funded by the Norwegian Environment Agency (NEA) and the Fram Centre (High North Research Centre for Climate and the Environment) through the Flagship research program “Fjord and Coast” and by the Research Council of Norway (RCN through the projects KelpPredict #184638, OPTIMAKELP #280732 and BlueTrans #280778. The authors have also received support from RCN through KELPPRO # 267536, the NEA through the Nordic Blue Carbon Project #17080044, H2020 through #869192 (NEGEM), the Norwegian Blue Forest Network (NBFN) and NIVA to complete the manuscript.
Conflict of Interest
The authors declare that the research was conducted in the absence of any commercial or financial relationships that could be construed as a potential conflict of interest.
Acknowledgments
We thank Prof. Stein Fredriksen (University of Oslo) for assistance during diving, and students, research assistants and others that in different ways have been part of the many field campaigns. We also thank Camilla W. Fagerli and Guri S. Andersen, for useful comments on a draft of the manuscript.
Supplementary Material
The Supplementary Material for this article can be found online at: https://www.frontiersin.org/articles/10.3389/fmars.2021.578629/full#supplementary-material
References
Abdullah, M. I., and Fredriksen, S. (2004). Production, respiration and exudation of dissolved organic matter by the kelp Laminaria hyperborea along the west coast of Norway. J. Mar. Biol. Assoc. U.K. 84, 887–894. doi: 10.1017/s002531540401015xh
Andersen, G. S. (2007). Kelp Associated Floral Epiphytes – Productivity and Community Structure in Relation to Wave Exposure and Season. 88. Ph.D. thesis, University of Oslo, Oslo.
Araújo, R. M., Assis, J., Aguillar, R., Airoldi, L., Barbara, I., Bartsch, I., et al. (2016). Status, trends, and drivers of kelp forests in Europe: an expert assessment. Biodivers. Conserv. 25, 1319–1348. doi: 10.1007/s10531-016-1141-7
Assis, J., Lucas, A. V., Bárbara, I., and Serrão, E. Á (2016). Future climate change is predicted to shift long-term persistence zones in the cold-temperate kelp Laminaria hyperborea. Mar. Environ. Res. 113, 174–182. doi: 10.1016/j.marenvres.2015.11.005
Bartsch, I., Wiencke, C., Bischof, K., Buchholz, C. M., Buck, B. H., Eggert, A., et al. (2008). The genus Laminaria sensu lato: recent insights and developments. Eur. J. Phycol. 43, 1–186.
Bekkby, T., Angeltveit, G., Gundersen, H., Tveiten, L., and Norderhaug, K. M. (2014a). Red sea urchins (Echinus esculentus) and water flow influence epiphytic macroalgae density. Mar. Biol. Res. 11, 375–384. doi: 10.1080/17451000.2014.943239
Bekkby, T., Moy, F. E., Olsen, H., Rinde, E., Bodvin, T., Bøe, R., et al. (2013). “Chapter 2 the norwegian programme for mapping of marine habitats – providing knowledge and maps for ICZMP,” in Global Challenges in Integrated Coastal Zone Management, eds E. Moksness, E. Dahl, and J. Støttrup (Hoboken, NJ: Wiley-Blackwell), 21–30.
Bekkby, T., Rinde, E., Erikstad, L., and Bakkestuen, V. (2009). Spatial predictive distribution modelling of the kelp species Laminaria hyperborea. ICES J. Mar. Sci. 66, 2106–2115. doi: 10.1093/icesjms/fsp195
Bekkby, T., Rinde, E., Gundersen, H., Norderhaug, K. M., Gitmark, J., and Christie, H. (2014b). Length, strength and water flow – the relative importance of wave and current exposure on kelp Laminaria hyperborea morphology. Mar. Ecol. Prog. Ser. 506, 61–70. doi: 10.3354/meps10778
Bekkby, T., Smit, C., Gundersen, H., Rinde, E., Steen, H., Tveiten, L., et al. (2019). The abundance of kelp is modified by the combined impact of depth, waves and currents. Front. Mar. Sci. 6:475. doi: 10.3389/fmars.2019.00475
Blight, A. J., and Thompson, R. C. (2008). Epibiont species richness varies between holdfasts of a northern and southerly distributed kelp species. J. Mar. Biol. Assoc. U.K. 88, 469–475. doi: 10.1017/s0025315408000994
Burnham, K. P., Anderson, D. R., and Huyvaert, K. P. (2011). AIC model selection and multimodel inference in behavioral ecology: some background, observations, and comparisons. Behav. Ecol. Sociobiol. 65, 23–35. doi: 10.1007/s00265-010-1029-6
Casado-Amezúa, P., Araújo, R., Bárbara, I., Bermejo, R., Borja, Á, Díez, I., et al. (2019). Article distributional shifts of canopy-forming seaweeds from the Atlantic coast of Southern Europe. Biodivers. Conserv. 28, 1151–1172. doi: 10.1007/s10531-019-01716-9
Christie, H., and Norderhaug, K. M. (2017). “Secondary production,” in Marine Macrophytes As Foundation Species, ed. E. Olafsson (Boca Raton, FL: CRC Press), 161–179.
Christie, H., Fredriksen, S., and Rinde, E. (1998). Regrowth of kelp and colonisation of epiphyte and fauna community after kelp trawling at the coast of Norway. Hydrobiologia 375, 49–58. doi: 10.1007/978-94-017-2864-5_4
Christie, H., Gundersen, H., Rinde, E., Norderhaug, K. M., Fagerli, C. W., Bekkby, T., et al. (2019). Can multitrophic interactions and ocean warming influence large-scale kelp and sea urchin distribution? Ecol. Evol. 9, 2847–2862. doi: 10.1002/ece3.4963
Christie, H., Jørgensen, N. M., and Norderhaug, K. M. (2007). Bushy or smooth, high or low; importance of habitat architecture and vertical level for distribution of fauna on kelp. J. Sea Res. 58, 198–208. doi: 10.1016/j.seares.2007.03.006
Christie, H., Jørgensen, N. M., Norderhaug, K. M., and Waage-Nielsen, E. (2003). Species distribution and habitat exploitation of fauna associated with kelp (Laminaria hyperborea) along the Norwegian coast. J. Mar. Biol. Assoc. U.K. 83, 687—-699.
Christie, H., Leinaas, H. P., and Skadsheim, A. (1995). “Local patterns in mortality of the green sea urchin, Strongylocentrotus droebachiensis, at the Norwegian coast,” in Ecology of Fjords and Coastal Waters, eds H. R. Skjoldal, C. Hopkins, K. E. Erikstad, and H. P. Leinaas (Amsterdam: Elsevier Science B.V), 573–584.
Christie, H., Norderhaug, K. M., and Fredriksen, S. (2009). Macrophytes as habitat for fauna. Mar. Ecol. Prog. Ser. 396, 221–233. doi: 10.3354/meps08351
Christie, H., Rinde, E., Fredriksen, S., and Skadsheim, A. (1994). Ecological consequences of kelp trawling: reestablishment of kelp forest, epiphytes and holdfast fauna after kelp trawling at the Rogaland coast. NINA Rep. 295, 1–29. (In Norwegian with English summary).
Connor, E., and McCoy, E. (1979). The statistics and biology of the species-area relationship. Am. Nat. 113, 791–833. doi: 10.1086/283438
Coppin, R., Rautenbach, C., Ponton, T. J., and Smit, A. J. (2020). Investigating waves and temperature as drivers of kelp morphology. Front. Mar. Sci. 7:567. doi: 10.3389/fmars.2020.00567
Dayton, P. K. (1985). Ecology of kelp communities. Annu. Rev. Ecol. Syst. 16, 215–245. doi: 10.1146/annurev.es.16.110185.001243
Duarte, C. M., Losada, I. J., Hendriks, I. E., Mazarrasa, I., and Marbà, N. (2013). The role of coastal plant communities for climate change mitigation and adaptation. Nat. Clim. Chang. 3, 961–968. doi: 10.1038/nclimate1970
Eckman, J. E., Duggins, D. O., and Siddon, C. E. (2003). Current and wave dynamics in the shallow subtidal: implications to the ecology of understory and surface-canopy kelp. Mar. Ecol. Prog. Ser. 265, 45–56. doi: 10.3354/meps265045
Edwards, A. (1980). Ecological studies of the kelp, Laminaria hyperborea, and its associated fauna in South-West Ireland. Ophelia 19, 47–60. doi: 10.1080/00785326.1980.10425506
Eriksson, B. K., Sandström, A., Isæus, M., Schreiber, H., and Karås, P. (2004). Effects of boating activities on aquatic vegetation in the Stockholm Archipelago, Baltic Sea. Estuar. Coast. Shelf Sci. 61, 339–349. doi: 10.1016/j.ecss.2004.05.009
Filbee-Dexter, K., and Wernberg, T. (2018). Rise of turfs: a new battlefront for globally declining kelp forests. BioScience 68, 64–76. doi: 10.1093/biosci/bix147
Filbee-Dexter, K., and Wernberg, T. (2020). Substantial blue carbon in overlooked Australian kelp forests. Sci. Rep. 10:12341. doi: 10.1038/s41598-020-69258-7
Filbee-Dexter, K., Wernberg, T., Grace, S. P., Thormar, J., Fredriksen, S., Narvaez, C. N., et al. (2020). Marine heatwaves and the collapse of marginal North Atlantic kelp forests. Sci. Rep. 10:13388. doi: 10.1038/s41598-020-70273-x
Filbee-Dexter, K., Wernberg, T., Norderhaug, K. M., Ramirez-Llodra, E., and Pedersen, M. F. (2018). Movement of pulsed resource subsidies from kelp forests to deep fjords. Oecologia 187, 291–304. doi: 10.1007/s00442-018-4121-7
Fredriksen, S. (2003). Food web studies in a Norwegian kelp forest based on stable isotope (d13C and d15N) analysis. Mar. Ecol. Prog. Ser. 260, 71–81. doi: 10.3354/meps260071
Gorman, D., Bajjouk, T., Populus, J., Vasquez, M., and Ehrhold, A. (2013). Modeling kelp forest distribution and biomass along temperate rocky coastlines. Mar. Biol. 160, 309–325. doi: 10.1007/s00227-012-2089-0
Gundersen, H., Christie, H., de Wit, H., Norderhaug, K. M., Bekkby, T., and Walday, M. G. (2011). CO2 uptake in marine habitats – an investigation. NIVA Rep. 6070:26. (In Norwegian with English summary).
Hill, R., Bellgrove, A., Macreadie, P. I., Petrou, K., Beardall, J., Steven, A., et al. (2015). Can macroalgae contribute to blue carbon? An Australian perspective. Limnol. Oceanogr. 60, 1689–1706. doi: 10.1002/lno.10128
Hoegh-Guldberg, O., Caldeira, K., Chopin, T., Gaines, S., Haugan, P., Hemer, M., et al. (2019). The Ocean as a Solution to Climate Change: Five Opportunities for Action. Washington, DC: World Resources Institute.
Hurd, C. L., Harrison, P. J., and Druehl, L. D. (1996). Effect of seawater velocity on inorganic nitrogen uptake by morphologically distinct forms of Macrocystis integrifolia from wave-sheltered and exposed sites. Mar. Biol. 126, 205–214. doi: 10.1007/bf00347445
Hurd, C. L., Harrison, P. J., Bischof, K., and Lobban, C. S. (2014). Seaweed Ecology and Physiology, 2nd Edn. Cambridge: Cambridge University Press.
IPBES (2019). “Summary for policymakers of the global assessment report on biodiversity and ecosystem services,” in Intergovernmental Science-Policy Platform on Biodiversity and Ecosystem Services, eds S. Díaz, J. Settele, E. S. Brondizio, H. T. Ngo, M. Guèze, J. Agard, et al. (Bonn: IPBES Secretariat).
Isæus, M. (2004). Factors Structuring Fucus Communities at Open and Complex Coastlines in the Baltic Sea. 165. Ph.D. thesis, Stockholm University, Stockholm.
Isæus, M., and Rygg, B. (2005). Wave exposure calculations for the finnish coast. NIVA Rep. 5075:24.
Jupp, B. P., and Drew, E. A. (1974). Studies on the growth of Laminaria hyperborea (Gunn.) Fosl. I. Biomass and productivity. J. Exp. Mar. Biol. Ecol. 15, 185–196. doi: 10.1016/0022-0981(74)90044-6
Kain, J. M. (1963). Aspects of the biology of Laminaria hyperborea. II. Age, weight and length. J. Mar. Biol. Assoc. U.K. 43, 129–151. doi: 10.1017/s0025315400005312
Kain, J. M. (1971a). The biology of Laminaria hyperborea VI. Some Norwegian populations. J. Mar. Biol. Assoc. U.K. 51, 387–408. doi: 10.1017/s0025315400031866
Kennelly, S. J. (1987). Physical disturbances in an Australian kelp community. II. Effects on understorey species due to differences in kelp cover. Mar. Ecol. Prog. Ser. 40, 155–165. doi: 10.3354/meps040155
Krause-Jensen, D., and Duarte, C. M. (2014). Expansion of vegetated coastal ecosystems in the future Arctic. Front. Mar. Sci. 1:10. doi: 10.3389/fmars.2014.00077
Krause-Jensen, D., and Duarte, C. M. (2016). The substantial role of macroalgae in marine carbon sequestration. Nat. Geosci. 9, 737–742. doi: 10.1038/ngeo2790
Krause-Jensen, D., Lavery, P., Serrano, O., Marba, N., Masque, P., and Duarte, C. M. (2018). Sequestration of macroalgal carbon: the elephant in the Blue Carbon room. Biol. Lett. 14:20180236. doi: 10.1098/rsbl.2018.0236
Krumhansl, K. A., and Scheibling, R. E. (2012). Production and fate of kelp detritus. Mar. Ecol. Prog. Ser. 467, 281–302. doi: 10.3354/meps09940
Krumhansl, K. A., Okamoto, D. K., Rassweiler, A., Novak, M., Bolton, J. J., Cavanaugh, K. C., et al. (2016). Global patterns of kelp forest change over the past half-century. Proc. Natl. Acad. Sci. U.S.A. 113, 13785–13790.
Løvås, S. M., and Tørum, A. (2001). Effect of the kelp Laminaria hyperborea upon sand dune erosion and water particle velocities. Coast. Eng. 44, 37–63. doi: 10.1016/s0378-3839(01)00021-7
Miller, S. M., Hurd, C. L., and Wing, S. R. (2011). Variations in growth, erosion, productivity, and morphology of Ecklonia radiata (Alariaceae; Laminariales) along a fjord in southern New Zealand. J. Phycol. 47, 505–516. doi: 10.1111/j.1529-8817.201100966.x
Moore, P. G. (1971). The nematode fauna associated with holdfasts of kelp (Laminaria hyperborea) in northeast Britain. J. Mar. Biol. Assoc. U.K. 51, 589–604. doi: 10.1017/s0025315400014983
Moore, P. G. (1973). The kelp fauna of northeast Britain. II. Multivariate classification: turbidity as an ecological factor. J. Exp. Mar. Biol. Ecol. 13, 127–163. doi: 10.1016/0022-0981(73)90074-9
Norderhaug, K. M., and Christie, H. (2009). Sea urchin grazing and kelp re-vegetation in the NE Atlantic. Mar. Biol. Res. 5, 515–528. doi: 10.1080/17451000902932985
Norderhaug, K. M., and Christie, H. (2011). Secondary production in a Laminaria hyperborea kelp forest and variation according to wave exposure. Estuar. Coast. Shelf Sci. 95, 135–144. doi: 10.1016/j.ecss.2011.08.028
Norderhaug, K. M., Christie, H., Andersen, G. S., and Bekkby, T. (2012). Does the diversity of kelp forest macrofauna increase with wave exposure? J. Sea Res. 69, 36–42. doi: 10.1016/j.seares.2012.01.004
Norderhaug, K. M., Christie, H., Fosså, J. H., and Fredriksen, S. (2005). Fish-macrofauna interactions in a kelp (Laminaria hyperborea) forest. J. Mar. Biol. Assoc. U.K. 85, 1279–1286. doi: 10.1017/s0025315405012439
Norderhaug, K. M., Fredriksen, S., and Nygaard, K. (2003). The trophic importance of Laminaria hyperborea to kelp forest consumers and the importance of bacterial degradation for food quality. Mar. Ecol. Prog. Ser. 255, 135–144. doi: 10.3354/meps255135
Norwegian Classification Guidance (2018). National Group Of Directorates for WFD Implementation in Norway. Trondheim: Norwegian Classification Guidance.
Ortega, A., Geraldi, N. R., Alam, I., Kamau, A. A., Acinas, S. G., Logares, R., et al. (2019). Important contribution of macroalgae to oceanic carbon sequestration. Nat. Geosci. 12, 748–754. doi: 10.1038/s41561-019-0421-8
Pedersen, M. F., Filbee-Dexter, K., Norderhaug, K. M., Fredriksen, S., Frisk, N. L., Fagerli, C. W., et al. (2020). Detrital carbon production and export in high latitude kelp forests. Oecologia 192, 227–239. doi: 10.1007/s00442-019-04573-z
Pedersen, M. F., Nejrup, L. B., Fredriksen, S., Christie, H., and Norderhaug, K. M. (2012). Effects of wave exposure on population structure, demography, biomass and productivity in kelp Laminaria hyperborea. Mar. Ecol. Prog. Ser. 451, 45–60. doi: 10.3354/meps09594
Pessarrodona, A., Moore, P. J., Sayer, M. D. J., and Smale, D. A. (2018). Carbon assimilation and transfer through kelp forests in the NE Atlantic is diminished under a warmer ocean climate. Glob. Chang. Biol. 24, 4386–4398. doi: 10.1111/gcb.143034386
R Core Team (2018). R: A Language and Environment for Statistical Computing. Vienna: R Foundation for Statistical Computing.
Ramsay, T. O., Burnett, R. T., and Krewski, D. (2003). The effect of concurvity in generalized additive models linking mortality to ambient particulate matter. Epidemiology 14, 18–23. doi: 10.1097/00001648-200301000-00009
Rebours, C., Marinho-Soriano, E., Zertuche-González, J. A., Hayashi, L., Vásquez, J. A., Kradolfer, P., et al. (2014). Seaweeds: an opportunity for wealth and sustainable livelihood for coastal communities. J. Appl. Phycol. 26, 1939–1951. doi: 10.1007/s10811-014-0304-8
Rinde, E., and Christie, H. (1992). A survey of rocky bottom communities in the coastal area of Telemark. NINA Rep. 133, 1–23. (In Norwegian with English summary).
Rinde, E., and Sjøtun, K. (2005). Demographic variation in the kelp Laminaria hyperborea along a latitudinal gradient. Mar. Biol. 146, 1051–1062. doi: 10.1007/s00227-004-1513-5
Rinde, E., Christie, H., Fagerli, C. W., Bekkby, T., Gundersen, H., Norderhaug, K. M., et al. (2014). The influence of physical factors on kelp and sea urchin distribution in previously and still grazed areas in the NE Atlantic. PLoS One 9:e100222. doi: 10.1371/journal.pone.0100222
Rinde, E., Christie, H., Fredriksen, S., and Sivertsen, A. (1992). Ecological consequences of kelp trawling: importance of the structure of the kelp forest for abundance of fauna in the kelp holdfasts, benthic fauna and epiphytes. NINA Rep. 127, 1–37. (In Norwegian with English summary).
Rinde, E., Rygg, B., Bekkby, T., Isæus, M., Erikstad, L., Sloreid, S.-E., et al. (2006). Documentation of Marine Nature Type Models Included in Directorate of Nature Management’s Database Naturbase. First Generation Models for the Municipalities Mapping of Marine Biodiversity 2007. NIVA Report 5321-2006. 32. (Oslo: In Norwegian with English summary).
Schoschina, E. V. (1997). On Laminaria hyperborea (Laminariales, Phaeophyceae) on the Murman coast of the Barents Sea. Sarsia 82, 371–373. doi: 10.1080/00364827.1997.10413663
Sjøtun, K. K., Fredriksen, S., and Rueness, J. (1998). Effect of canopy biomass and wave exposure on growth in Laminaria hyperborea (Laminariaceae: Phaeophyta). Eur. J. Phycol. 33, 337–343. doi: 10.1017/s0967026298001838
Sjøtun, K., Christie, H., and Fosså, J. H. (2006). Effects of kelp recruitment and sea urchin grazing on stability in kelp forest (Laminaria hyperborea). Mar. Biol. Res. 2, 24–32. doi: 10.1080/17451000500537418
Sjøtun, K., Fredriksen, S., Rueness, J., and Lein, T. E. (1995). “Ecological studies of the kelp Laminaria hyperborea (Gunnerus) Foslie in Norway,” in Ecology of Fjords and Coastal Waters, eds H. R. Skjoldal, C. Hopkins, K. E. Erikstad, and H. P. Leinaas (Amsterdam: Elsevier).
Skadsheim, A., and Rinde, E. (1995). Ecological descriptions of the kelp community in Froan. NINA Rep. 354:38. (In Norwegian with English summary).
Skadsheim, A., Rinde, E., and Christie, H. (1993). Occurrence and changes in sea urchin density, sea urchin parasite and regrowth of kelp forest along the Norwegian coast from Trøndelag to Troms. NINA Impact Assess. Rep. 258, 1–39. (In Norwegian with English summary).
Smale, D. A., and Moore, P. J. (2017). Variability in kelp forest structure along a latitudinal gradient in ocean temperature. J. Exp. Mar. Biol. Ecol. 486, 255–264. doi: 10.1016/j.jembe.2016.10.023
Smale, D. A., Burrows, M. T., Evans, A. J., King, N., Sayer, M. D. J., Yunnie, A. L. E., et al. (2016). Linking environmental variables with regional-scale variability in ecological structure and standing stock of carbon within UK kelp forests. Mar. Ecol. Prog. Ser. 542, 79–95. doi: 10.3354/meps11544
Smale, D. A., Burrows, M. T., Moore, P., O’Connor, N., and Hawkins, S. J. (2013). Threats and knowledge gaps for ecosystem services provided by kelp forests: a northeast Atlantic perspective. Ecol. Evol. 3, 4016–4038. doi: 10.1002/ece3.774
Smale, D. A., Moore, P. J., Queiros, A. M., Higgs, S., and Burrows, M. T. (2018). Appreciating interconnectivity between habitats is key to Blue Carbon management. Front. Ecol. Environ. 16, 71–73. doi: 10.1002/fee.1765
Smale, D. A., Pessarrodona, A., King, N., Burrows, M. T., Yunnie, A., Vance, T., et al. (2020). Environmental factors influencing primary produvtivity of the forest-forming kelp Laminaria hyperborea in the northeast Atlantic. Sci. Rep. 10:12161. doi: 10.1038/s41598-020-69238-x
Smale, D. A., Wernberg, T., Oliver, E. C. J., Thomsen, M., Harvey, B. P., Straub, S. C., et al. (2019). Marine heatwaves threaten global biodiversity and the provision of ecosystem services. Nat. Clim. Chang. 9, 306–312. doi: 10.1038/s41558-019-0412-1
Smith, S. V. (1981). Marine macrophytes as a global carbon sink. Science 211, 838–840. doi: 10.1126/science.211.4484.838
Steneck, R. S., Graham, M. H., Bourque, B. J., Corbett, D., Erlandson, J. M., Estes, J. A., et al. (2002). Kelp forest ecosystems: biodiversity, stability, resilience and future. Environ. Conserv. 29, 436–459. doi: 10.1017/S0376892902000322
Teagle, H., Hawkins, S., Moore, P. J., and Smale, D. A. (2017). The role of kelp species as biogenic habitat formers in coastal marine ecosystems. J. Exp. Mar. Biol. Ecol. 92, 81–98. doi: 10.1016/j.jembe.2017.01.017
Teagle, H., Moore, P. J., Jenkins, H., and Smale, D. A. (2018). Spatial variability in the diversity and structure of faunal assemblages associated with kelp holdfasts (Laminaria hyperborea) in the northeast Atlantic. PLoS One 13:e0200411. doi: 10.1371/journal.pone.0200411
van Son, T. C., Nikolioudakis, N., Steen, H., Albretsen, J., Furevik, B. R., Elvenes, S., et al. (2020). Achieving reliable estimates of the spatial distribution of kelp biomass. Front. Mar. Sci. 7:107. doi: 10.3389/fmars.2020.00107
Vea, J., and Ask, E. (2011). Creating a sustainable commercial harvest of Laminaria hyperborea, in Norway. J. Appl. Phycol. 23, 489–494. doi: 10.1007/s10811-010-9610-y
Vigander, H. (2007). Epifyttiske Alger på Laminaria Hyperborea (Gunn.) Foslie Kartlagt Langs en Dybdegradient fra Skipsholmen på Mørekysten. Ph.D. thesis, University of Oslo, Oslo.
Wernberg, T., and Vanderklift, M. A. (2010). Contribution of temporal and spatial components to morphological variation in the kelp Ecklonia (Laminariales). J. Phycol. 46, 153–161. doi: 10.1111/j.1529-8817.2009.00772.x
Wernberg, T., Krumhansl, K., Filbee-Dexter, K., and Pedersen, M. F. (2019). “Status and trends for the World’s kelp forests,” in World Seas: An Environmental Evaluation, 2nd Edn, Vol. II, ed. C. Sheppard (Amsterdam: Elsevier), 932.
Wijkmark, N., and Isæus, M. (2010). Wave exposure calculations for the Baltic Sea. AquaBiota Rep. 2:37.
Wood, S. N. (2011). Fast stable restricted maximum likelihood and marginal likelihood estimation of semiparametric generalized linear models. J. R. Stat. Soc. B 73, 3–36. doi: 10.1111/j.1467-9868.2010.00749.x
Young, A. P., and Carilli, J. E. (2018). Global distribution of coastal cliffs. Earth Surf. Proc. Land. 44, 1309–1316. doi: 10.1002/esp.4574
Keywords: macroalgae, kelp, Laminaria hyperborea, morphological traits, ecological function, ecosystem services, carbon sequestration, biomass
Citation: Gundersen H, Rinde E, Bekkby T, Hancke K, Gitmark JK and Christie H (2021) Variation in Population Structure and Standing Stocks of Kelp Along Multiple Environmental Gradients and Implications for Ecosystem Services. Front. Mar. Sci. 8:578629. doi: 10.3389/fmars.2021.578629
Received: 30 June 2020; Accepted: 19 March 2021;
Published: 21 April 2021.
Edited by:
Punyasloke Bhadury, Indian Institute of Science Education and Research Kolkata, IndiaReviewed by:
Dan Smale, Marine Biological Association of the United Kingdom, United KingdomAlan T. Critchley, Cape Breton University, Canada
Copyright © 2021 Gundersen, Rinde, Bekkby, Hancke, Gitmark and Christie. This is an open-access article distributed under the terms of the Creative Commons Attribution License (CC BY). The use, distribution or reproduction in other forums is permitted, provided the original author(s) and the copyright owner(s) are credited and that the original publication in this journal is cited, in accordance with accepted academic practice. No use, distribution or reproduction is permitted which does not comply with these terms.
*Correspondence: Hege Gundersen, aGVnZS5ndW5kZXJzZW5Abml2YS5ubw==