 Juan Pablo Livore
 María M. Mendez
 Eduardo Klein
 Lorena Arribas
 Gregorio Bigatti
- 1Laboratorio de Reproducción y Biología Integrativa de Invertebrados Marinos, Instituto de Biología de Organismos Marinos (IBIOMAR-CONICET), Puerto Madryn, Argentina
- 2Instituto de Biología de Organismos Marinos (IBIOMAR-CONICET), Puerto Madryn, Argentina
- 3Universidad Nacional de la Patagonia San Juan Bosco, Puerto Madryn, Argentina
- 4Departamento de Estudios Ambientales, Universidad Simón Bolívar, Caracas, Venezuela
- 5Universidad Espíritu Santo, Samborondón, Ecuador
Identifying susceptible regions where biodiversity changes occur at fast rates is essential in order to protect and ameliorate affected areas. Large-scale coastal monitoring programs that focus on long-term variability are scarce, yet the Marine Biodiversity Observation Network Pole to Pole is currently developing a regional collaboration throughout the American continent collecting biodiversity data in coastal habitats with a standardized systematic protocol. The use of photographic methods to collect assemblage data on intertidal rocky shores can be appropriate. The goal of this study was to analyze the performance of a simple, low-cost, non-destructive and low-tech photographic method on a broad geographical scale (∼ 2,000 km) of Atlantic Patagonian coastline. Concurrently, we aimed to identify indicators whose cover, presence or condition can be followed in time and used as beacons of change in biodiversity on these rocky intertidal shores. We also explored the potential relationships between assemblage structure and environmental variables, such as seascape classes. We identified and propose cover of mytilids, Corallina spp. and bare substrate as indicators of change due to their ecological relevance in intertidal assemblages and their visible and rapid response to human stressors or changes in environmental conditions. Finally, we illustrate the practicality and usefulness of remotely accessible environmental data, for instance the seascape classes approach as an integrative tool for large-scale rocky shore studies.
Introduction
Coastal ecosystems generally present high biodiversity and provide valuable cultural, provisioning and regulating services (Galparsoro et al., 2014). Although they represent only 8% of global surface, these areas provide approximately 43% of the estimated value of ecosystem services worldwide. Concurrently, global average population density is estimated to be three times higher in coastal areas (Small and Nicholls, 2003) and these are also the most likely to be affected by natural hazards such as storm surges, hurricanes and other extreme weather events including those related to climate change (Kron, 2013). Within this context, rocky shores form more than 80% of coastal shorelines worldwide (Emery and Kuhn, 1982; Granja, 2004). Hence, monitoring for rapid changes to ecosystems on coastal rocky shores is imperative for adequate management and conservation of the services they provide.
Large-scale ecosystem monitoring programs on rocky shores are few despite the logistic advantages of these ecosystems (Miloslavich et al., 2019). Long-term, sustained, time-series of biodiversity, community structure and dynamics in this generally accessible ecosystem are few, such as MarClim in western Europe, PISCO on the west coast of the United States and SARCE in South America. Furthermore, data of the existing programs may be incomparable due to variability in the collection methods, heterogeneity in spatial and temporal sampling, and in data formats (Duffy et al., 2019; Miloslavich et al., 2019). Monitoring efforts at large spatial scales that try to integrate long-term inter-annual and seasonal community variability are scarce, mostly because they are costly, logistically complex and require much coordination by different groups of scientists. In this sense, contrasting access to resources of dedicated scientists involved in large-scale monitoring often challenges the implementation of programs at the desired scale (Bax et al., 2019). The implementation of large-scale and long-term monitoring programs is a tool for detecting changes in rocky shore communities that may provide early alarms to decision makers allowing the opportunity of a timely response action.
A recently established large-scale and long-term program is the Marine Biodiversity Observation Network Pole to Pole of the Americas (MBON P2P). It was conceived as an international network of collaborating research institutions, marine laboratories, parks, and reserves seeking to address common problems related to sustaining ecosystem services through conservation ecology. This project was built on the efforts of two previous international projects, namely the Natural Geography in Shore Areas (NaGISA) of the Census of Marine Life (CoML) program and its sequel for South America the South American Research Group on Coastal Ecosystems (SARCE) (Miloslavich et al., 2016). MBON P2P is collecting biological data in coastal habitats (rocky shores and sandy beaches) and acting as a global community of practice for sustained, operationalized measurements of marine biodiversity (Canonico et al., 2019). All data collected by the MBON P2P project are open available and contribute to other programs as the Global Ocean Observing System (GOOS- UNESCO), under the framework of Essential Ocean Variables (EOVs). Within this framework, some of the identified EOVs that are achieved by the MBON P2P program is “macroalgal canopy cover and composition,” as well as the emerging EOV “benthic invertebrate abundance and distribution,” both relevant to rocky shores (Miloslavich et al., 2018).
Along both Pacific and Atlantic South American coasts, the development of large-scale programs provided evidence of strong changes in community diversity (Cruz-Motta et al., 2020). Sea surface temperature (SST) was the main variable that explained the changes, yet local factors were also important (Cruz-Motta et al., 2020). Previously, similar programs also detected patterns in the distribution of the species assemblages on these coasts that were correlated with the SST and rainfall (Cruz-Motta et al., 2010). Atlantic Patagonia (41–55° S; 63–70° W) rocky intertidal shores were included as monitoring sites in the NaGISA-CoML and SARCE projects (Cruz-Motta et al., 2010, 2020; Rechimont et al., 2013; Miloslavich et al., 2016, among others) and are currently being included in MBON P2P. Communities within these habitats are exposed to particularly harsh environmental conditions that lead to adaptations of the local species (Bertness et al., 2006). In addition, a range of anthropogenic threats may add stress to communities and lead to changes in cover of dominant space occupiers (Mendez et al., 2017, 2021; Sorte et al., 2017).
Establishing a method that maximizes results and minimizes efforts is always a challenge for large-scale monitoring programs (Bax et al., 2019). Recently, a globally applicable and cost-effective method was tested for intertidal shore levels at two sites in northern Atlantic Patagonia by Livore et al. (2021). This method, non-destructive photographs of small parcels, showed similar results to others previously used for monitoring but required less time, knowledge and training in the field. The goal of the current study was to analyze that method’s performance on a broader geographical scale. To do so, this study sampled intertidal assemblages along ∼ 2,000 km of SW Atlantic Patagonian coastline using the afore mentioned method. The hypothesis was that the method would be capable of detecting differences among assemblages within two intertidal levels along the studied latitudinal scope as described by previous studies (Bertness et al., 2006; Rechimont et al., 2013; Raffo et al., 2014; Cruz-Motta et al., 2020). Furthermore, with the obtained data we identified biological indicators whose cover, presence or abundance can be followed in time through long-term monitoring programs on rocky intertidal shores. Finally, we explored potential relationships between the assemblages and relevant remotely sensed environmental variables (e.g., sea surface temperature, chlorophyll-a and seascape classes) as an illustration of their usefulness in long-term monitoring.
Materials and Methods
Study Area
Sampling was carried out on the rocky intertidal shores of Atlantic Patagonia from Estancia San Lorenzo, Chubut (42.094° S; 63.910° W) to Ushuaia, Tierra del Fuego (54.849° S; 68.494° W). Nine locations were sampled along >2,000 km of coast (Figure 1). Rocky intertidal platforms sampled were exposed to semidiurnal tides with tidal amplitudes that ranged from 4 to 9 m. All locations presented an intertidal biological zonation: high (HT), mid (MT) and low (LT) intertidal. At some locations the HT were covered by pebbles and were impossible to sample, hence only MT and LT were included in this study. The MT was generally dominated by a matrix of mytilids that may include the scorched mussels Brachidontes rodriguezii and Perumytilus purpuratus as well as Mytilus edulis. The LT was generally characterized by several algal species including a large proportion of calcareous algae Corallina spp. as well as gastropods Tegula patagonica and Trophon geversianus, mytilids Mytilus edulis and Aulacomya atra, limpets from the genus Nacella and pulmonate limpets from the genus Siphonaria (Bertness et al., 2006; Raffo et al., 2014; Miloslavich et al., 2016).
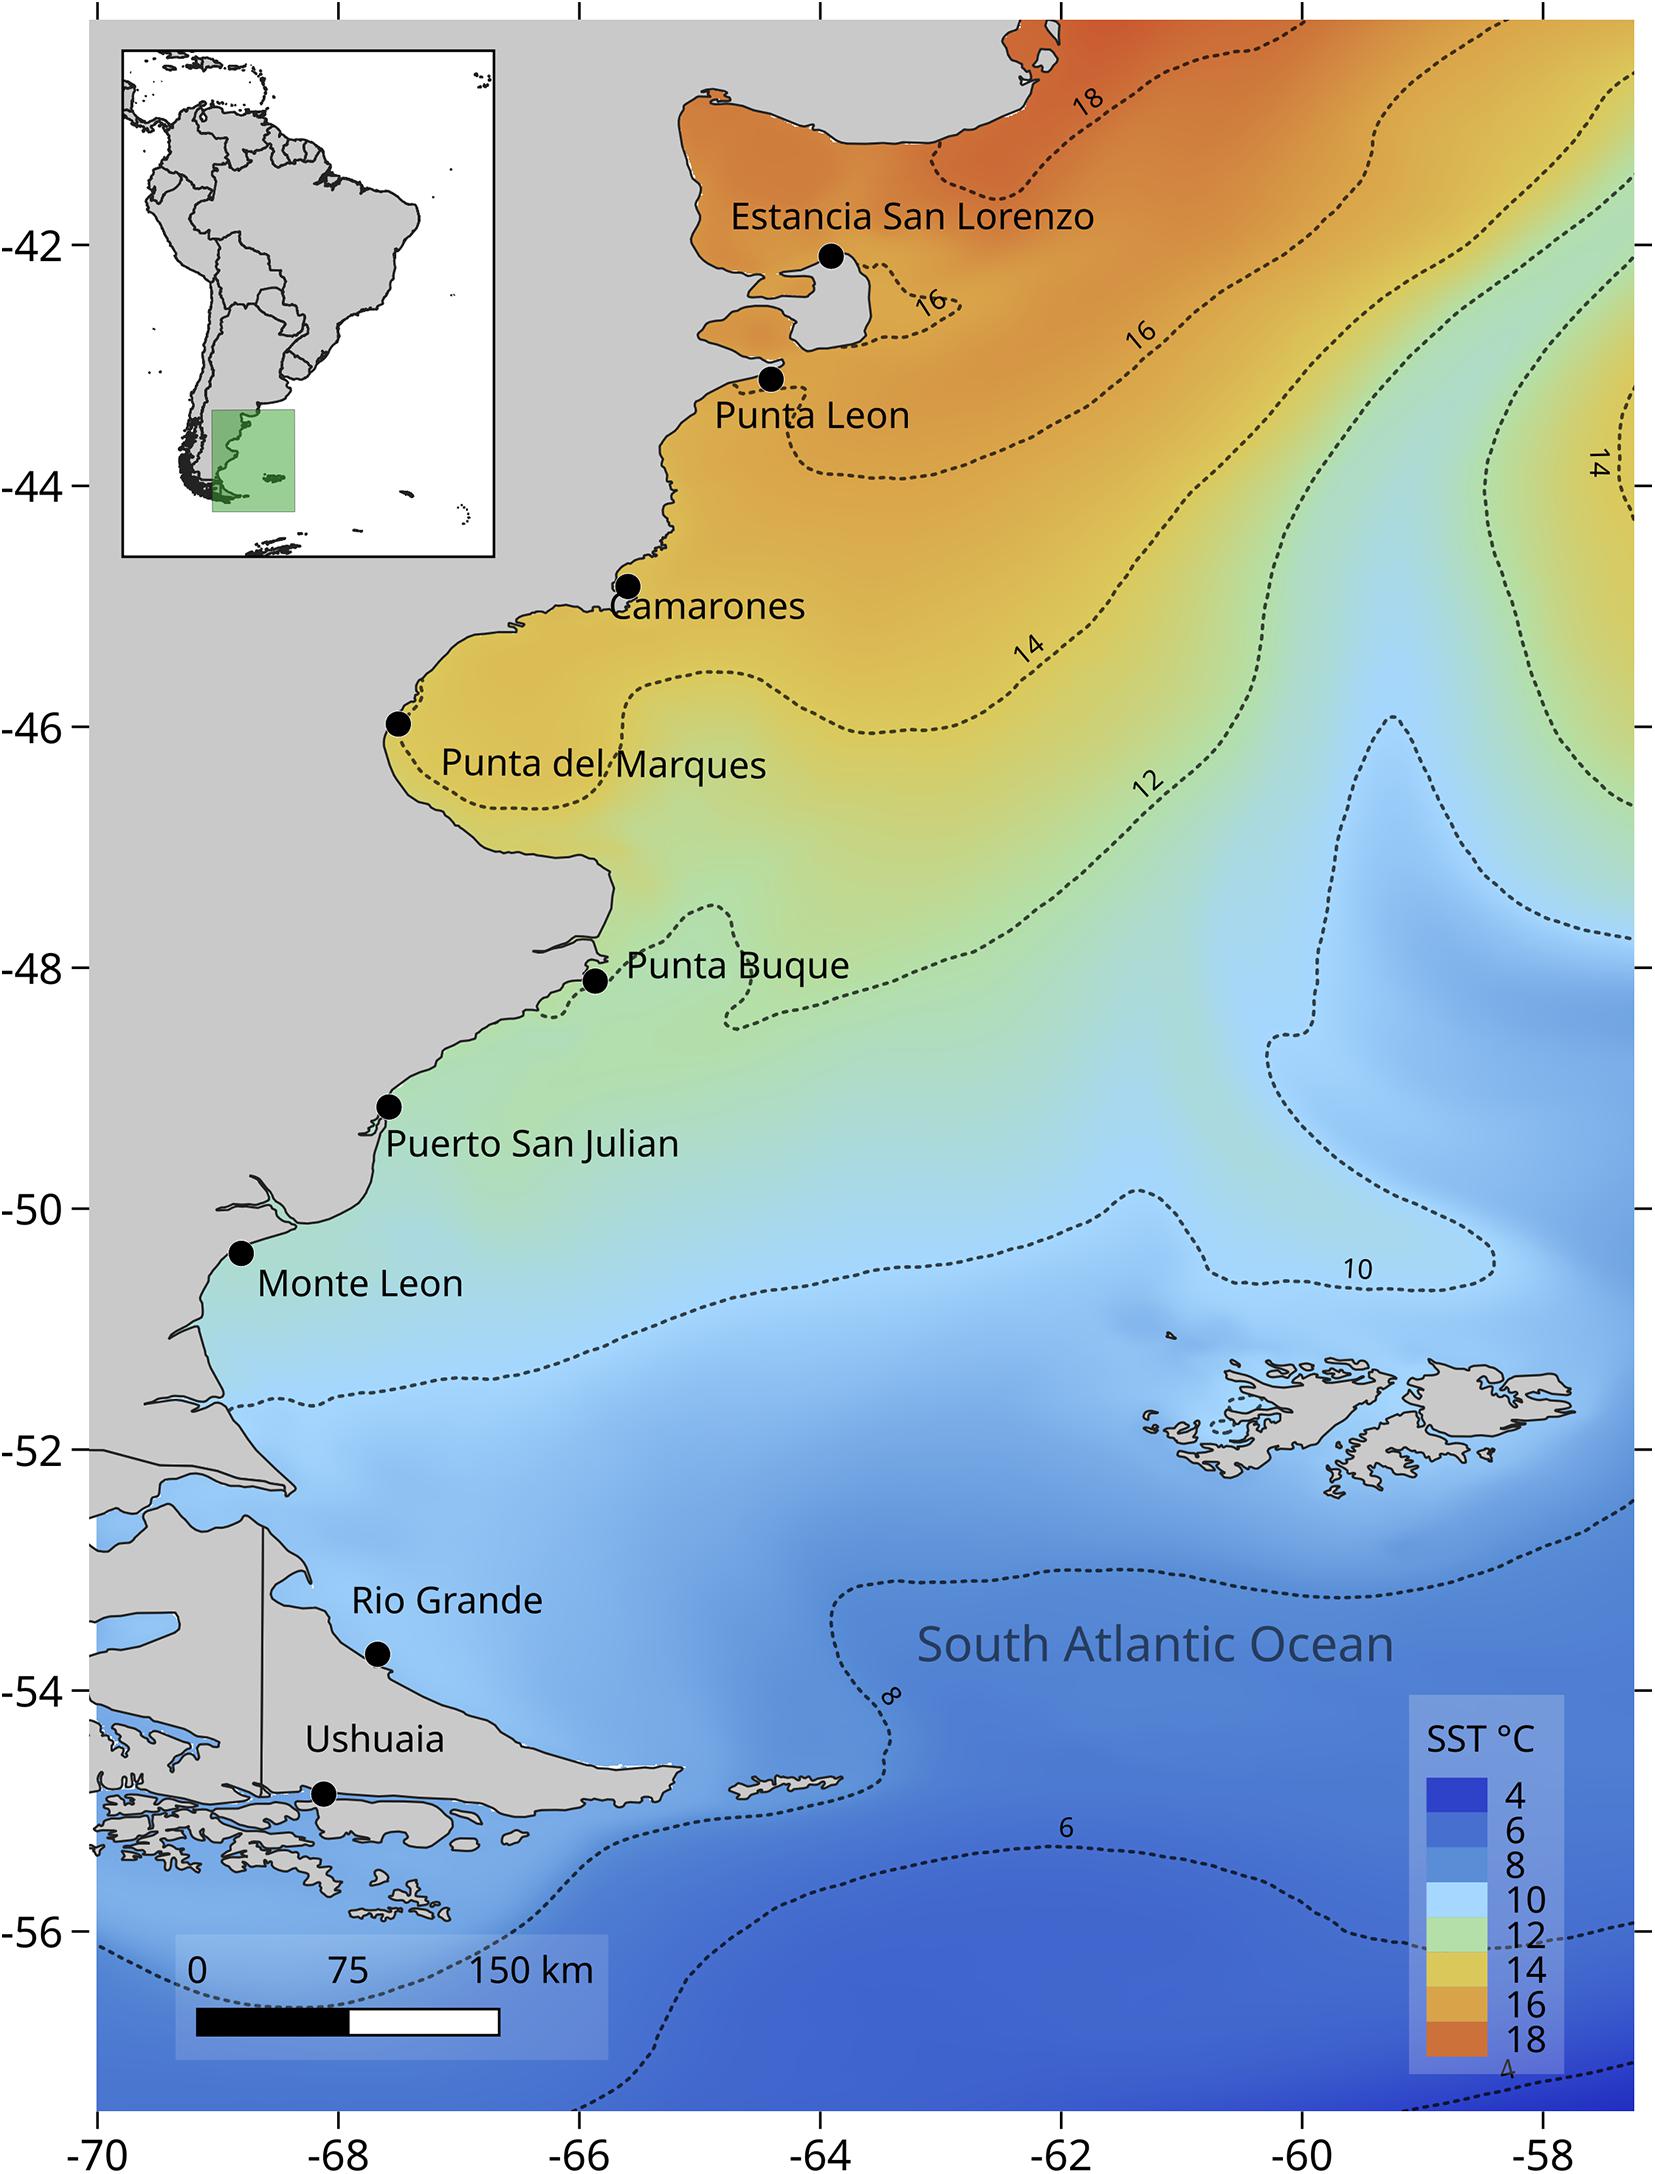
Figure 1. Sampled locations in Atlantic Patagonia: Estancia San Lorenzo (ESL), Punta León (PLE), Camarones (CAM), Punta del Marqués (PMA), Punta Buque (PBU), Puerto San Julián (SJU), Monte León (MLE), Río Grande (RGR) and Ushuaia (USH). MUR SST mean climatological temperature for January–May. Source: https://coastwatch.pfeg.noaa.gov/erddap/griddap/jplMURSST41clim.html.
Sampling
Samples were collected between February and May 2017 during diurnal low tides. Percentage cover of sessile organisms was estimated from high definition photographs of 25 × 25 cm quadrats haphazardly placed on the substrate (n = 15 per level and location; n = 255, the LT of location San Julian could not be sampled). The compact camera (Nikon Coolpix AW 130) was fixed on a purposely built pvc-tube stand to standardize distance from the substrate. No zoom was used and the same setting was used throughout sampling. Photographs were analyzed using the free software Coral Point Count (CPCe V 4.1, Kohler and Gill, 2006). One hundred equidistant points were placed over the digital image and sessile organisms observed under each point were registered to estimate cover. All organisms were identified to the lowest possible taxonomic level. Concurrently, all mobile organisms larger than ∼1 cm observed within the quadrat were also determined to the lowest possible taxonomic level and counted. For analysis, Perumytilus purpuratus, Brachidontes rodriguezii, Aulacomya atra, and Mytilus edulis were grouped within the category Mytilids, as identification to species level through photographs is unreliable. The same occurred for the red algae Ceramium sp. and Polysiphonia sp. and the pulmonate limpets Siphonaria lessonii and S. lateralis.
Environmental Variables
Following the results of the SARCE project (Cruz-Motta et al., 2020), sea surface temperature (SST), chlorophyll-a concentration, photosynthetic active radiation (PAR), daily rainfall and air temperature, were extracted from different remote sensing sources (see Supplementary Table S1 in the Supplementary Material). Data from 1 January 2016 to 31 May 2017 was used for all variables. Virtual stations were located up to 5 km offshore of the sampling station to avoid land interference and the land mask imposed by some of the products. The spatial resolution varied according to the data source, from 1 degree (air temperature) to 1 km [Multi-sensor Ultra-high Resolution (MUR)]. We included the novel seascape classification of the marine environment, as a multiscale, and synoptic characterization of the SST, salinity, chlorophyll-a and chromophoric dissolved organic matter (CDOM) represented as a catalog of classes (Kavanaugh et al., 2016).
Data Analysis
Non-metric multi-dimensional scaling (nMDS) was used to visualize multivariate patterns in benthic assemblages cover at various scales. Benthic assemblage cover data were analyzed separately for each location and shore level using permutational analysis of variance (PERMANOVA) with the PERMANOVA extension in Primer v6.1.7 software (Anderson et al., 2008). Similarity matrices based on Bray-Curtis measure were generated on square-root transformed data for the analyses, which used 9,999 permutations of residuals under a reduced model (Anderson et al., 2008). PERMANOVA model had two factors: Location (Lo, random, 9 levels) and Intertidal Level (IL, fixed, 2 levels: MT and LT). Pairwise comparisons were performed among all pair of locations within each level to identify differences. SIMPER analyses were used to determine which taxa contributed more to similarity within samples. DistLM analyses were performed MT and LT assemblage data to identify and visualize taxa that contributed most (>0.60 correlation) to the observed differences for each level.
A Kruskal-Wallis test was used to analyze differences in cover of the dominant categories for each intertidal level (i.e., Mytilids and bare substrate for MT and Coralline algae and bare substrate for LT), as they may be used as Environmental Ocean Variables in monitoring programs.
Abundances of mobile organisms that were recorded at five or more locations and exceeded a mean of 10 individuals m–2 across all locations, were compared through Kruskal-Wallis to analyze differences among locations. Taxa that were recorded at fewer than five locations or had mean abundances <10 individuals m–2 were not considered.
A correlation analysis between the Bray Curtis similarity matrix and the environmental variable matrix (using Gower similarity index) was performed with the BioEnv algorithm to establish potential relationships between both ordination arrangements (Clarke and Ainsworth, 1993).
Results
The photoquadrat protocol used in this study detected a total of 26 taxa for which cover was estimated from the MT and LT levels across more than 2,000 km of Atlantic Patagonian intertidal rocky shores. Four of these taxa were sessile invertebrates that include four species of mytilids (Brachidontes rodriguezii, Perumytilus purpuratus, Mytilus edulis, and Aulacomya atra) which were grouped for analysis and three species of barnacles (Notobalanus flosculus, Notochthamalus scabrosus, and Balanus glandula), whilst the remaining taxa were macroalgae.
The assemblages from the MT level were significantly different from the assemblages from the LT and among sampling Locations [PERMANOVA. LoxIL: pseudo-F = 27.82, df = 7, p(perm) < 0.001]. Pairwise comparisons showed that intertidal levels within each location differed significantly [all comparison (p(perm) > 0.001)]. In the same way, nm-MDS analysis showed separation of samples by intertidal level, with the LT of Ushuaia as the only assemblage that was clearly separate from all others (Figure 2). A high similarity within the studied range of both MT and LT was detected, with 84.92 and 76.71%, respectively. Within each level very few categories explained >80% of the dissimilarity (Table 1). Those categories were Mytilids and to a lesser degree bare substrate in the MT. In the LT Corallina spp. was consistently the most explanatory category with several other categories with much lower values alternating among locations (Table 1).
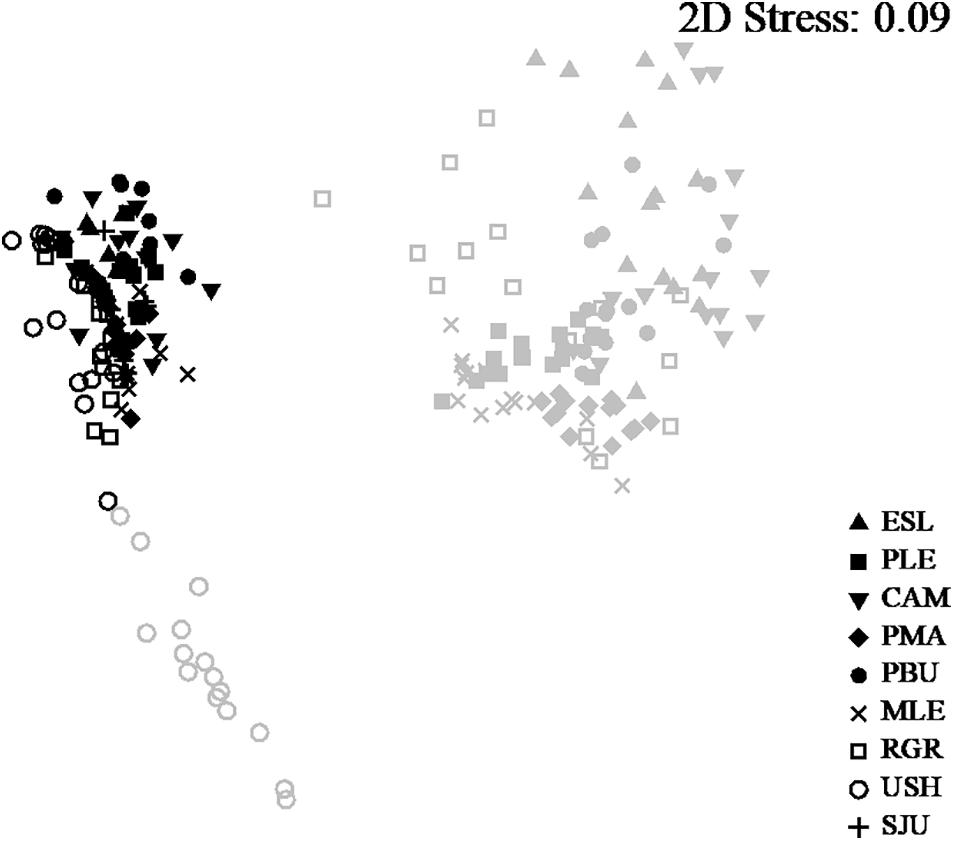
Figure 2. n-MDS of all locations and both intertidal levels. Samples from LT in gray and MT in black.
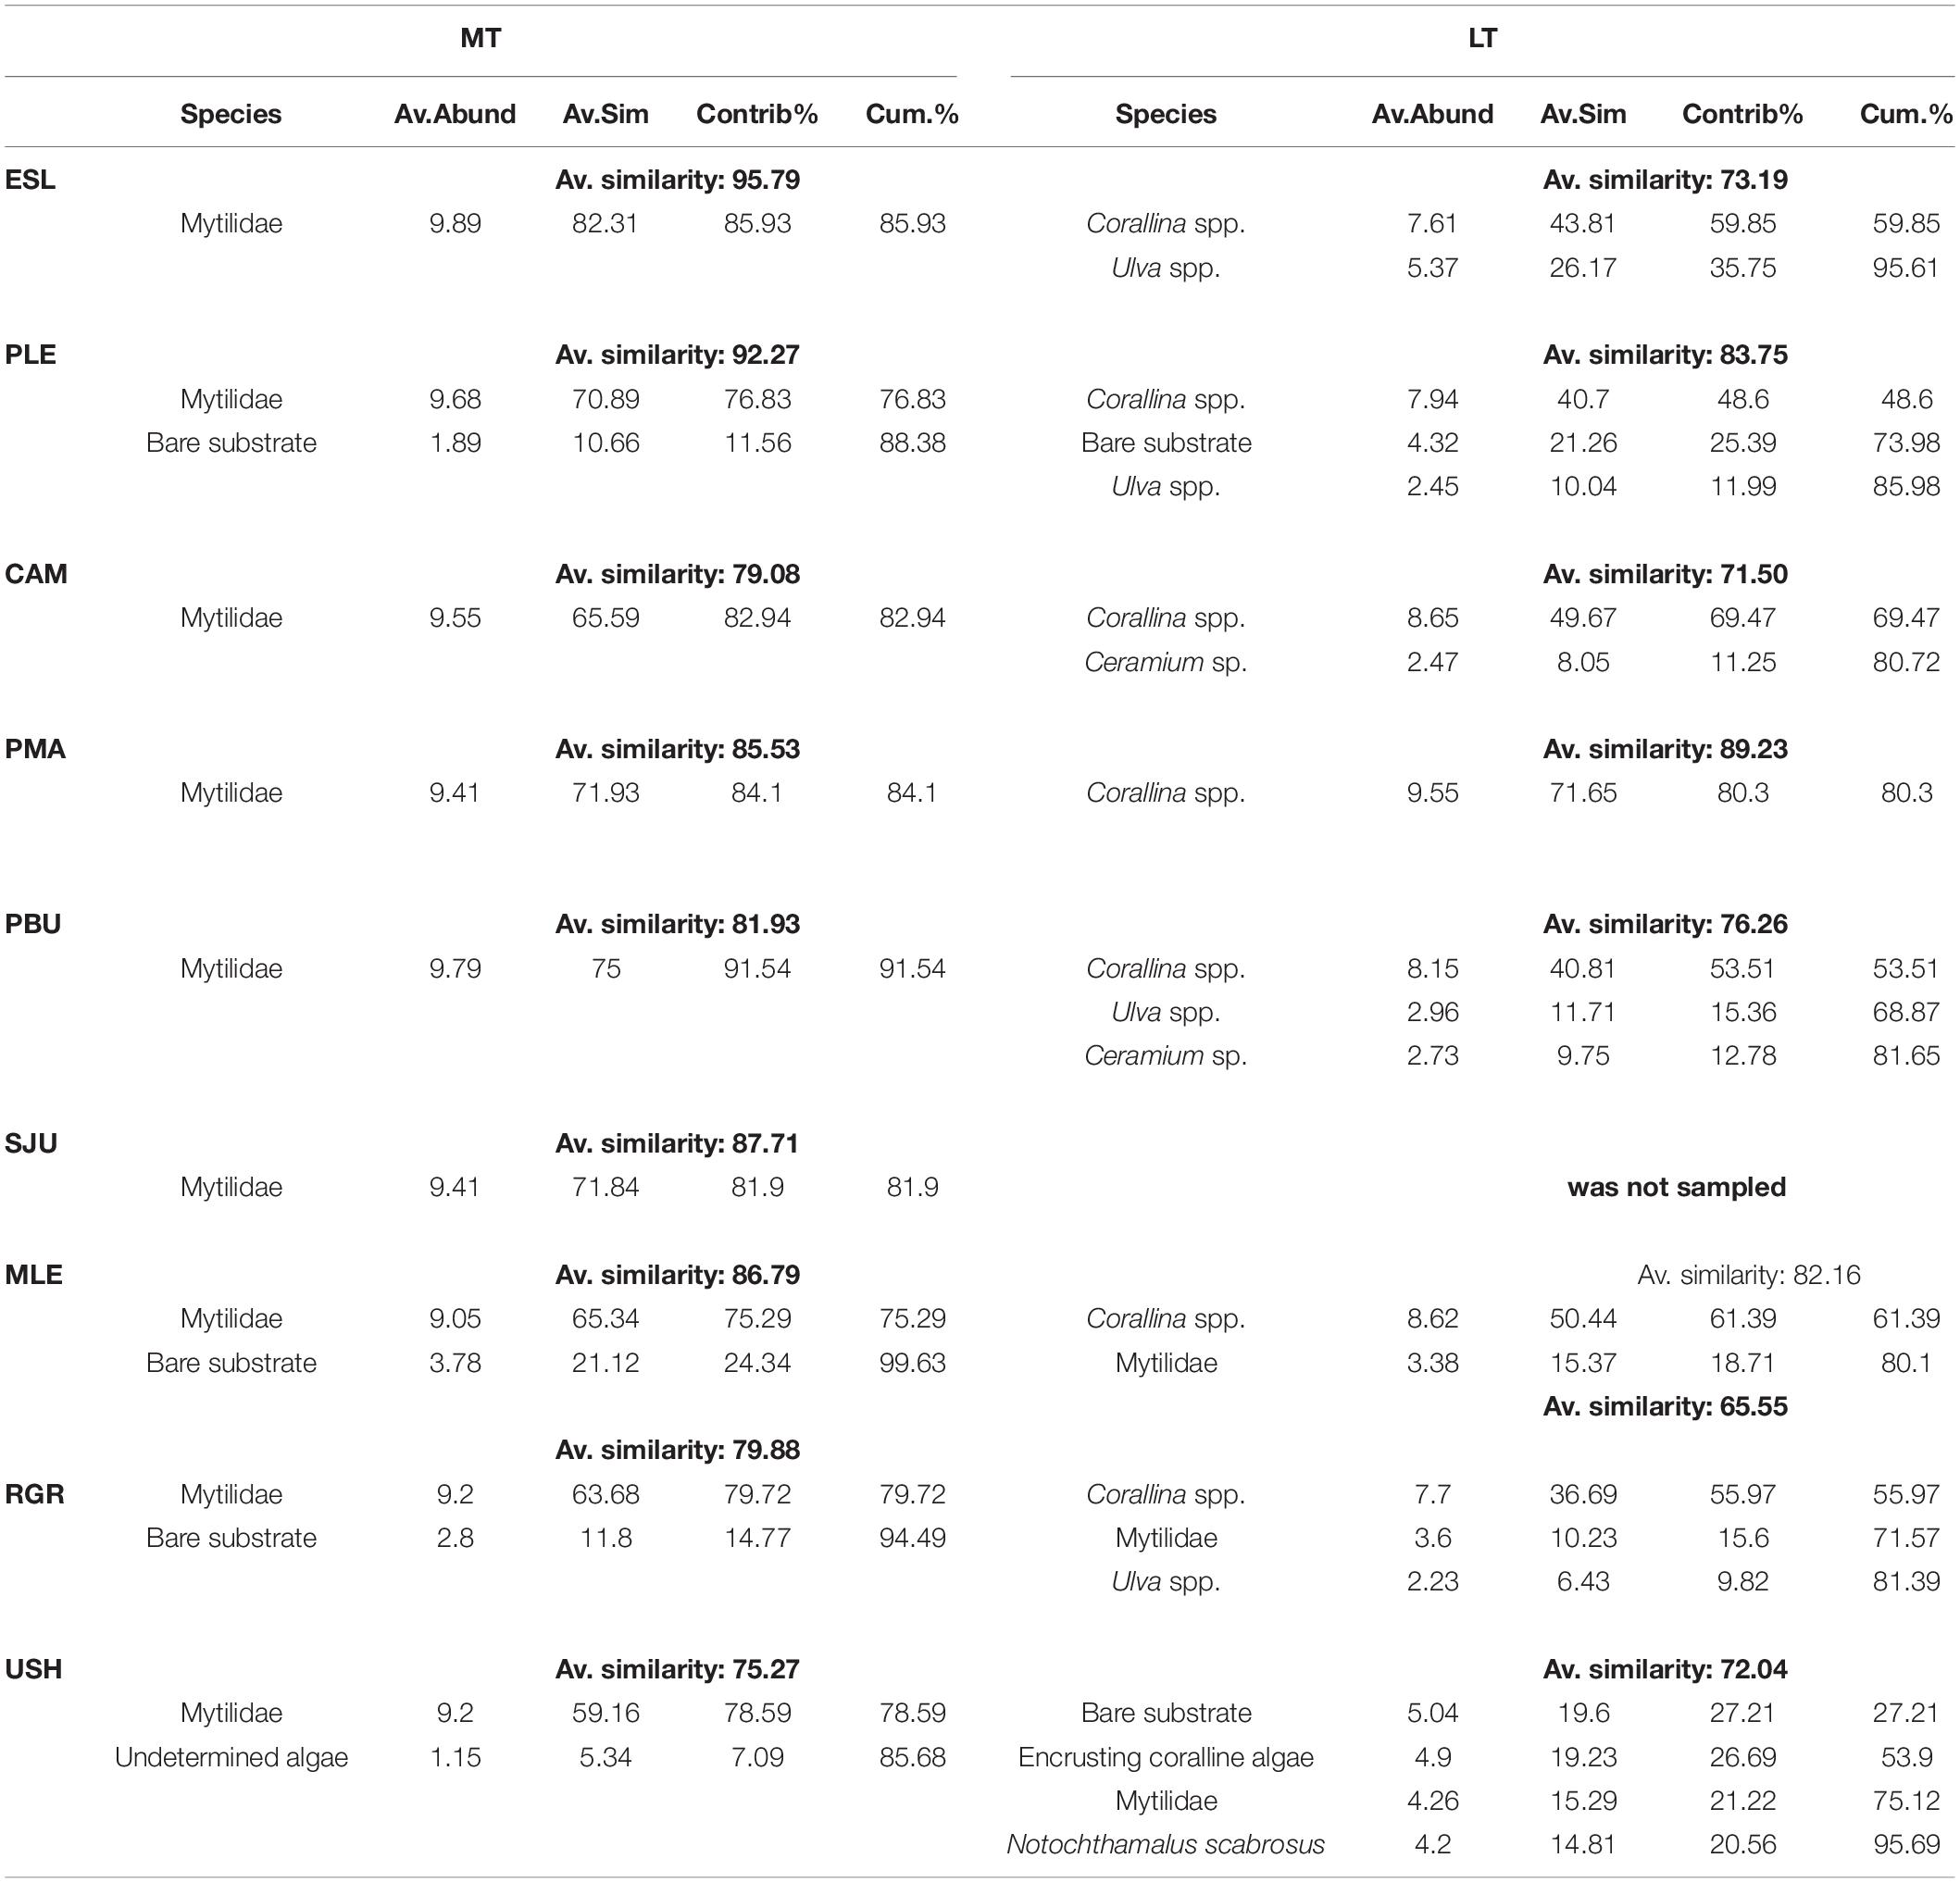
Table 1. Results of SIMPER analysis for each location in the two tidal levels.
Cover in MT was consistently dominated by mytilids with average cover ranging from 82 to 98%, yet differences were detected among groups (H = 32.917, df = 8, p < 0.001) (Figure 3). Bare substrate cover differed within the studied geographical range (H = 52.978, df = 8, p < 0.001) and ranged from 0.27 to 16.53% (MLE > PMA = SJU = RGR > USH > PLE > CAM > PBU > ESL). In the MT bare substrate (50%), the alga Pyropia sp. (14%) and the two barnacles Balanus glandula (11%) and Notochthamalus scabrosus (10%) explained 85% of the observed variation (Figure 4A).
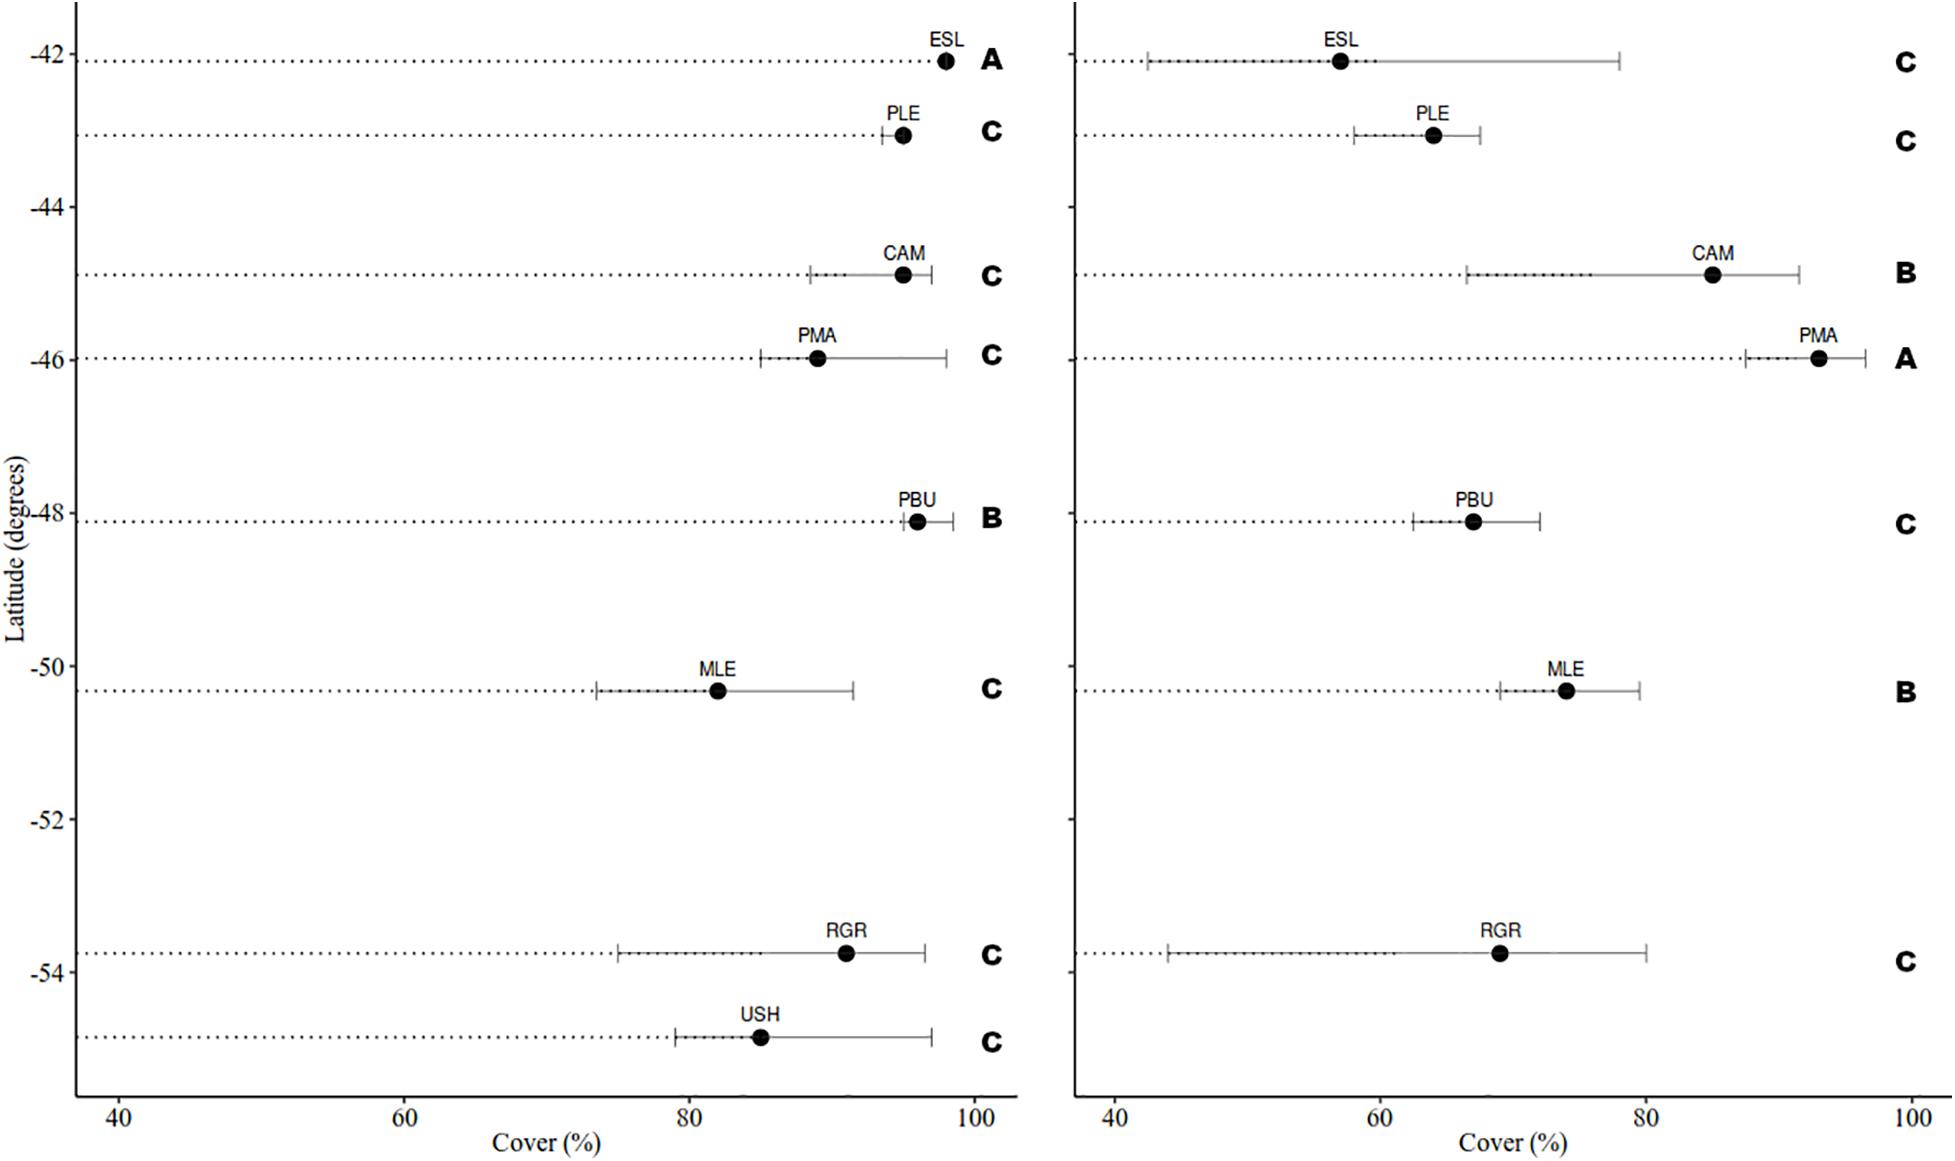
Figure 3. Median cover (%) of mytilids in the mid intertidal level (left) and Corallina spp. in the low intertidal level (right). Bars represent the 25 and 75% percentile. Letters indicate differences among groups based on pairwise multiple comparison procedures (Student-Newman-Keuls Method).
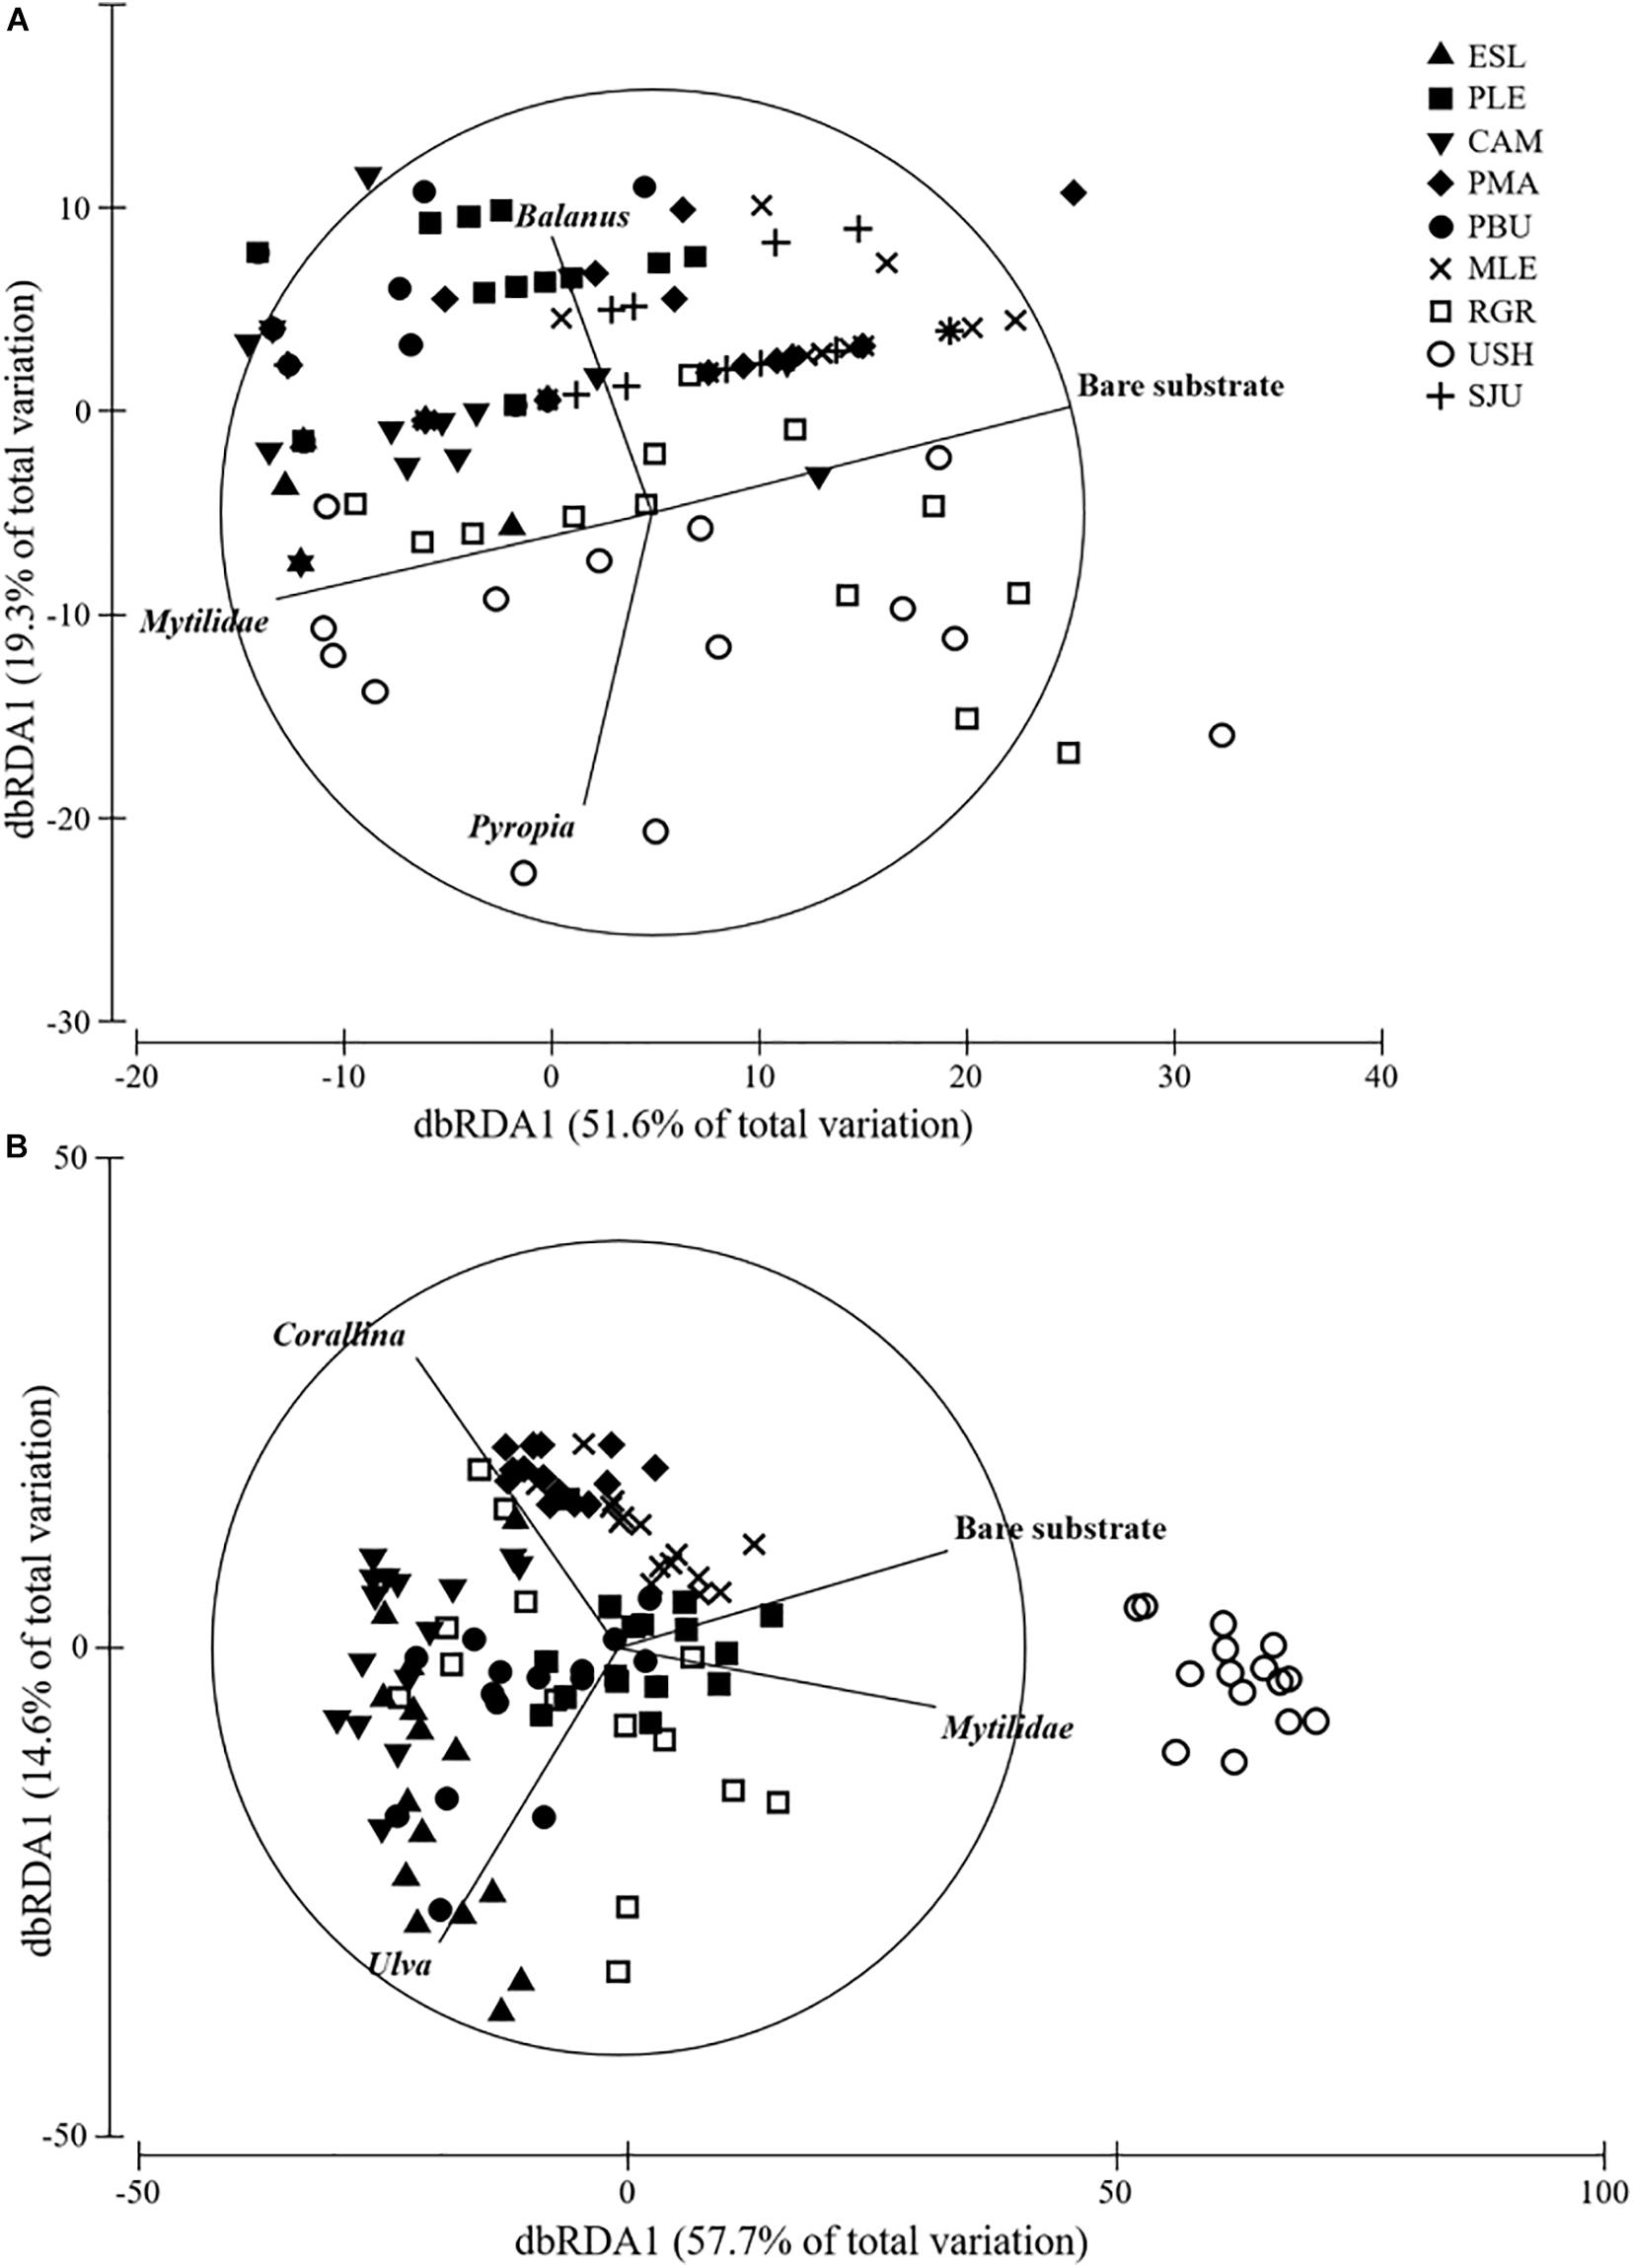
Figure 4. DistLM analysis of (A) MT and (B) LT assemblages. Vectors show variables that had >0.6 correlation (Spearman).
Cover in the LT was generally dominated by the alga Corallina spp. except in USH where mytilids had larger cover (mean: 21.33%). Corallina spp. cover, when present, ranged from 60 to 91% and differences among groups were detected (H = 69.530, df = 7, p < 0.001) (Figure 3). Bare substrate cover also differed within the studied area (H = 85.123, df = 7, p < 0.001) and ranged from 27.80 to 0.40% (USH = PLE > MLE > PMA = PBU > RGR > CAM = ESL). In the LT Corallina spp. (47%), Ulva spp. (18%), Ceramium sp. and Polysiphonia sp. (10%), mytilids (8%), and bare substrate (7%) accounted for 90% of the observed variation (Figure 4B).
A total of 13 taxa of mobile macroinvertebrates were found within all the study locations: the sea anemones Parabunodactis imperfecta and Bunodactis octoradiata, the gastropods Siphonaria lessonii, S. lateralis, Nacella magellanica, Pareuthria fuscata, Tegula patagonica, Fissurella radiosa, and Trophon geversianus, undetermined chitons that were grouped, the isopod Exosphaeroma sp. and the sea urchin Arbacia dufresnii. Abundances of only Siphonaria spp. (S. lessonii and S. lateralis) in MT and N. magellanica in LT were of relevance (mean abundance >10 individuals m–2) for statistical analysis. Abundance of Siphonaria spp. ranged from 0 to 512 individuals m–2 and differed among locations (H = 113.282, df = 8, p < 0.001. SJU > MLE = USH > PLE > CAM = PMA = PBU > ESL = RGR). N. magellanica ranged from 0 to 204 individuals m–2 being highest in USH and different than all other locations (H = 77.253, df = 7, p < 0.001).
Three seascape classes were observed in the region during the studied period (Table 2). Among all the studied environmental variables, the number of seascapes classes alone, number of seascapes classes and PAR, and SST, number of seascapes classes and number of switches between seascapes classes were the models that best explained assemblage variability present at each sampling location during the 2017 summer (BioEnv r = 0.60, 0.59, and 0.56, respectively).
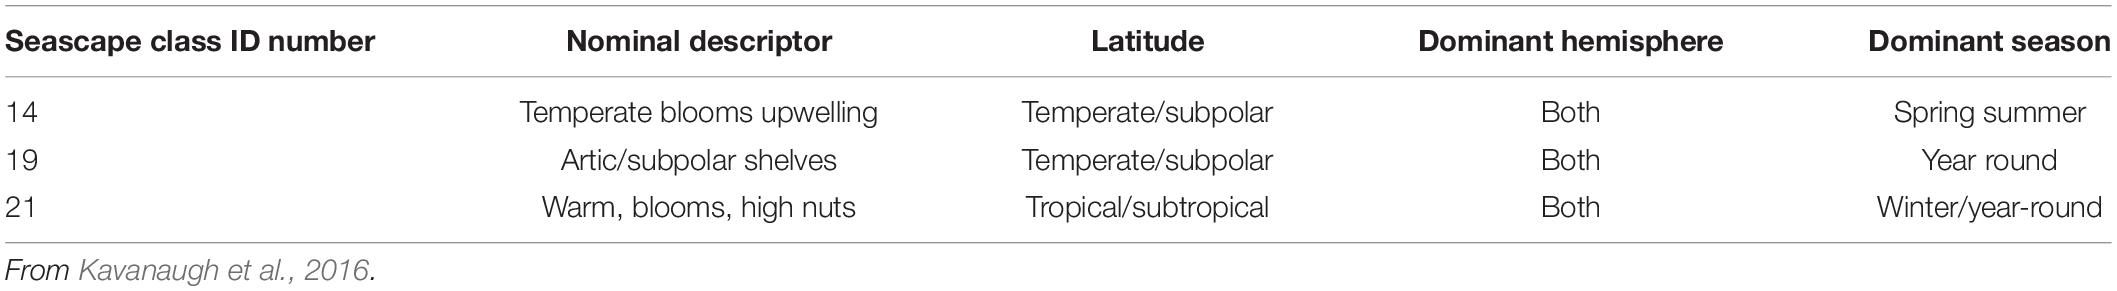
Table 2. Seascapes classes present in the study region during the period January 2016–May 2017.
Discussion
The results of this study demonstrate that the simple, low-cost, low-tech method used here is capable of detecting differences in assemblage structure along an extension of ∼2,000 kilometers of Atlantic Patagonian coast. Differences among assemblages from two levels of air exposure within this broad geographic scale were clearly identified. Despite the low variability in each exposure level, the method was able to detect differences among assemblages and in the dominant taxa percentage cover. The method allows for the adequate collection of useful cover data of sessile species and abundance of some slow moving taxa which can be linked to remotely accessible environmental data.
Visual methods performed in situ, such as the NaGISA protocols (Rigby et al., 2007) used in previous large-scale programs, can take up to 2 days at a single site to obtain the desired data whilst the method employed here required a single day. This non-destructive method can be repeated at the same locations throughout an extended period of time and can be applied by scientist globally due its simplicity and low cost. Concurrently, it is suitable to determine changes in cover or abundance in several indicators as reported here. Identification of organisms to a low taxonomic level and the impossibility of viewing primary cover when dense algal stands are present are the most important limitations the used method has (Livore et al., 2021). Hence, for detailed description of intertidal communities, such as species richness and diversity, this may not be suitable. However, for large-scale long-term studies focusing on major changes in primary space occupying species this method should be broadly applicable.
This study identified taxa whose changes in cover largely explained the changes in assemblage structure at the two described intertidal levels. For the mid intertidal mytilids, bare substrate and Balanus glandula were the variables that better explained the observed patterns, whilst for the low intertidal Corallina spp., bare substrate and mytilids, explained most of the variability. We propose mytilids and Corallina spp., in particular, as biological indicators for broad scale monitoring programs because they are cosmopolitan taxa with a conspicuous presence, they have a low probability of misidentification, they are ecologically relevant (i.e., habitat forming species that sustain many other dependent species) and they respond to human stressors or changes in environmental conditions (Kelaher, 2003; Liuzzi and López Gappa, 2008; Buschbaum et al., 2009; Olabarria et al., 2016; Vinagre et al., 2016). Concurrently, bare substrate is proposed as another indicator because changes in this variable reflect either settlement or disappearance of primary space holders, which are often also habitat forming species. Hence, changes in the relative cover of bare substrate directly indicate changes in assemblage structure (Pickett and White, 2013; Mendez et al., 2019). Two algae, Pyropia sp. and Ulva spp. also contributed to the observed patterns in the mid and low intertidal, respectively. However, the high natural fluctuation along with the limited distribution of these taxa suggest they may be less appropriate indicators for long-term, large-scale studies (Raffo et al., 2014). There may be other suitable indicators that may be considered upon application of the method along the American coastline.
The use of this simple method also allows the possibility of relating assemblages with remotely obtained environmental variables. This study was able to detect a correlation between seascape classes and biotic assemblages of individual locations. Linking environmental variables collected from remote sensing platforms offshore the sampling sites may represent a potential source of error (Turner et al., 2003). However, this feature provides easily accessible environmental data for remote locations where almost no local continuous environmental data exists. The global seascape classes appear as a very promising environmental predictor as they summarize the interaction and variability in time of multiple variables in a typology of pelagic realms (Kavanaugh et al., 2016). The correlation between the classes and the community structure of pelagic communities has recently been demonstrated (Montes et al., 2020). However, this is the first time that pelagic seascapes are related to rocky shores assemblages. The alternation between the predominant classes might result in a robust predictor for the changes in cover/abundance of the main groups that form the intertidal coastal communities. In this sense, long-term monitoring programs will provide replication in time of assemblage data and seascape information which combined, as in this study, can be used as a synoptic and integrating assessment tool.
The macroecology approach brought together ecology and biogeography in the early 1990s in the sense that ecologists recognized that external influences may strongly affect community structure, whilst biogeographers acknowledged that community events may have broad significance on distribution patterns (Briggs, 2007). Within this framework, regional scale studies with consistent and extensive local sampling that describe assemblages are needed to appropriately address ecological process and geographic distribution. Without this knowledge there is a risk of a continuous description of heterogeneity without the capability of integration to address broader scale problems (Connell and Irving, 2008). The current study is a step in that direction, describing dissimilarities in assemblages along ∼ 2,000 kilometers of largely unexplored coasts of Atlantic Patagonia. In our study changes in the assemblages were moderately associated to four environmental variables. The lack of a more distinct pattern in the studied assemblages could be suggesting that biodiversity of these rocky intertidal habitats is likely driven by a combination of factors that operate at different spatiotemporal scales as has been suggested for other marine communities (Witman et al., 2004; Connell and Irving, 2008; Cruz-Motta et al., 2020).
Whilst recent efforts are encouraging and supporting long-term and large-scale monitoring programs that integrate scientist at the continental level, they are still scarce (Canonico et al., 2019 and references therein). This could be due, at least in part, to the difficulties of finding methodologies that are both scientifically robust, practically achievable and logistically inexpensive in order for it to be accessible and feasible to a wider range of potential participants (Stephenson et al., 2017). The method employed here complies with all the above mentioned attributes and is therefore suggested for use in long-term and broad-scale monitoring programs such as MBON P2P. Its application within the MBON P2P will provide information on the associations among assemblages along the American coastline and test the proposed ecological indicators. When coupled with environmental variables that are remotely and easily accessible they could provide the tools for an integrative approach to an informed coastal management.
Data Availability Statement
The raw data supporting the conclusions of this article will be made available by the authors, without undue reservation.
Author Contributions
JL conceived the project, participated in data collection in the field and lab, data processing, and wrote the manuscript with contribution from all authors. MM conceived the project, participated in data collection in the field and lab, and reviewed the manuscript. LA participated in data collection in the field and lab, and reviewed the manuscript. EK collected and processed environmental and seascape data and reviewed the manuscript. GB conceived the project and reviewed the manuscript.
Funding
This work was financially supported by the Conservation, Food and Health Foundation, ANPCyT-FONCyT (PICT 2015-0841 and PICT 2018-0969).
Conflict of Interest
The authors declare that the research was conducted in the absence of any commercial or financial relationships that could be construed as a potential conflict of interest.
Acknowledgments
We would like to thank Carmen Gilardoni for organization and support for field trips. We also thank Florencia Cremonte, Muriel Demetrio, Joaquin Vietto, Tabare Barreto, Lucía Epherra, and Jose Fernandez Alfaya for field collaborations. The manuscript was improved by the comments of two reviewers. Special thanks to the provincial authorities of Chubut, Santa Cruz, and Tierra del Fuego, and Administración de Parques Nacionales for allowing us to work inside natural protected areas (permit number 143-SsCyAP/16). We also thank Estancia San Lorenzo for access to that sampling location. This is publication #153 of the Laboratorio de Reproducción y Biología Integrativa de Invertebrados Marinos (LARBIM).
Supplementary Material
The Supplementary Material for this article can be found online at: https://www.frontiersin.org/articles/10.3389/fmars.2021.589489/full#supplementary-material
Supplementary Table 1 | List of environmental variables used in analyses.
References
Anderson, M., Gorley, R., Clarke, K., Anderson, M., Gorley, R., Clarke, K., et al. (2008). PERMANOVA+ for PRIMER. Guide to Software and Statistical Methods. Plymouth: PRIMER-E.
Bax, N. J., Miloslavich, P., Muller-Karger, F. E., Allain, V., Appeltans, W., Batten, S. D., et al. (2019). A response to scientific and societal needs for marine biological observations. Front. Mar. Sci. 6:395. doi: 10.3389/fmars.2019.00395
Bertness, M. D., Crain, C. M., Silliman, B. R., Bazterrica, M. C., Reyna, M. V., Hildago, F., et al. (2006). The community structure of Western Atlantic Patagonian rocky shores. Ecol. Monogr. 76, 439–460.
Briggs, J. C. (2007). Marine biogeography and ecology: invasions and introductions. J. Biogeogr. 34, 193–198. doi: 10.1111/j.1365-2699.2006.01632.x
Buschbaum, C., Dittmann, S., Hong, J.-S., Hwang, I.-S., Strasser, M., Thiel, M., et al. (2009). Mytilid mussels: global habitat engineers in coastal sediments. Helgol. Mar. Res. 63, 47–58.
Canonico, G., Buttigieg, P. L., Montes, E., Muller-Karger, F. E., Stepien, C., Wright, D., et al. (2019). Global observational needs and resources for marine biodiversity. Front. Mar. Sci. 6:367. doi: 10.3389/fmars.2019.00367
Clarke, K. R., and Ainsworth, M. (1993). A method of linking multivariate community structure to environmental variables. Mar. Ecol. Progr. Ser. 92, 205–219.
Connell, S. D., and Irving, A. D. (2008). Integrating ecology with biogeography using landscape characteristics: a case study of subtidal habitat across continental Australia. J. Biogeogr. 35, 1608–1621.
Cruz-Motta, J. J., Miloslavich, P., Guerra-Castro, E., Hernández-Agreda, A., Herrera, C., Barros, F., et al. (2020). Latitudinal patterns of species diversity on South American rocky shores: local processes lead to contrasting trends in regional and local species diversity. J. Biogeogr. 47, 1966–1979. doi: 10.1111/jbi.13869
Cruz-Motta, J. J., Miloslavich, P., Palomo, G., Iken, K., Konar, B., Pohle, G., et al. (2010). Patterns of spatial variation of assemblages associated with intertidal rocky shores: a global perspective. PLoS One 5:e14354. doi: 10.1371/journal.pone.0014354
Duffy, J. E., Benedetti-Cecchi, L., Trinanes, J., Muller-Karger, F. E., Ambo-Rappe, R., Boström, C., et al. (2019). Toward a coordinated global observing system for seagrasses and marine macroalgae. Front. Mar. Sci. 6:317. doi: 10.3389/fmars.2019.00317
Emery, K. O., and Kuhn, G. G. (1982). Sea cliffs: their processes, profiles, and classification. GSA Bulletin 93, 644–654.
Galparsoro, I., Borja, A., and Uyarra, M. C. (2014). Mapping ecosystem services provided by benthic habitats in the European North Atlantic Ocean. Front. Mar. Sci. 1:23. doi: 10.3389/fmars.2014.00023
Granja, H. M. (2004). “Rocky coasts,” in Coastal Zone And Estuaries, eds F. I. Isla and O. Iribarne (Oxford: EOLSS Publishers), 135–163.
Kavanaugh, M. T., Oliver, M. J., Chavez, F. P., Letelier, R. M., Muller-Karger, F. E., and Doney, S. C. (2016). Seascapes as a new vernacular for pelagic ocean monitoring, management and conservation. ICES J. Mar. Sci. 73, 1839–1850.
Kelaher, B. P. (2003). Changes in habitat complexity negatively affect diverse gastropod assemblages in coralline algal turf. Oecologia 135, 431–441.
Kohler, K. E., and Gill, S. M. (2006). Coral point count with excel extensions (CPCe): a visual basic program for the determination of coral and substrate coverage using random point count methodology. Comput. Geosci. 32, 1259–1269. doi: 10.1016/j.cageo.2005.11.009
Kron, W. (2013). Coasts: the high-risk areas of the world. Nat. Hazards 66, 1363–1382. doi: 10.1007/s11069-012-0215-4
Liuzzi, M. G., and López Gappa, J. (2008). Macrofaunal assemblages associated with coralline turf: species turnover and changes in structure at different spatial scales. Mar. Ecol. Progr. Ser. 363, 147–156.
Livore, J. P., Mendez, M. M., Miloslavich, P., Rilov, G., and Bigatti, G. (2021). Biodiversity monitoring in rocky shores: challenges of devising a globally applicable and cost-effective protocol. Ocean Coast. Manag. 205:105548.
Mendez, M. M., Livore, J. P., and Bigatti, G. (2019). Interaction of natural and anthropogenic stressors on rocky shores: community resistance to trampling. Mar. Ecol. Progr. Ser. 631, 117–126.
Mendez, M. M., Livore, J. P., Calcagno, J. A., and Bigatti, G. (2017). Effects of recreational activities on Patagonian rocky shores. Mar. Environ. Res. 130, 213–220.
Mendez, M. M., Livore, J. P., Márquez, F., and Bigatti, G. (2021). Mass mortality of foundation species on rocky shores: testing a methodology for a continental monitoring program. Front. Mar. Sci. 8:620866. doi: 10.3389/fmars.2021.620866
Miloslavich, P., Bax, N. J., Simmons, S. E., Klein, E., Appeltans, W., Aburto-Oropeza, O., et al. (2018). Essential ocean variables for global sustained observations of biodiversity and ecosystem changes. Glob. Chang. Biol. 24, 2416–2433. doi: 10.1111/gcb.14108
Miloslavich, P., Cruz-Motta, J. J., Hernández, A., Herrera, C., Klein, E., Barros, F., et al. (2016). Benthic assemblages in South American intertidal rocky shores: biodiversity, services, and threats. Mar. Benthos 83–137.
Miloslavich, P., Seeyave, S., Muller-Karger, F., Bax, N., Ali, E., Delgado, C., et al. (2019). Challenges for global ocean observation: the need for increased human capacity. J. Operat. Oceanogr. 12(sup2), S137–S156. doi: 10.1080/1755876X.2018.1526463
Montes, E., Djurhuus, A., Muller-Karger, F. E., Otis, D., Kelble, C. R., and Kavanaugh, M. T. (2020). Dynamic satellite seascapes as a biogeographic framework for understanding phytoplankton assemblages in the Florida Keys National Marine Sanctuary, United States. Front. Mar. Sci. 7:575. doi: 10.3389/fmars.2020.00575
Olabarria, C., Gestoso, I., Lima, F. P., Vázquez, E., Comeau, L. A., Gomes, F., et al. (2016). Response of Two Mytilids to a Heatwave: The Complex Interplay of Physiology, Behaviour and Ecological Interactions. PLoS One 11:e0164330. doi: 10.1371/journal.pone.0164330
Pickett, S. T., and White, P. S (Eds.) (2013). The Ecology of Natural Disturbance And Patch Dynamics. New York, NY: Elsevier.
Raffo, M. P., Lo Russo, V., and Schwindt, E. (2014). Introduced and native species on rocky shore macroalgal assemblages: zonation patterns, composition and diversity. Aquat. Bot. 112, 57–65. doi: 10.1016/j.aquabot.2013.07.011
Rechimont, M. E., Galván, D. E., Sueiro, M. C., Casas, G., Piriz, M. L., Diez, M. E., et al. (2013). Benthic diversity and assemblage structure of a north Patagonian rocky shore: a monitoring legacy of the NaGISA project. J. Mar. Biol. Assoc. U. K. 93, 2049–2058. doi: 10.1017/S0025315413001069
Rigby, P. R., Iken, K., and Shirayama, Y. (2007). Sampling Biodiversity in Coastal Communities: NaGISA Protocols for Seagrass and Macroalgal Habitats. Singapore: NUS Press.
Small, C., and Nicholls, R. J. (2003). A global analysis of human settlement in coastal zones. J. Coast. Res. 19, 584–599.
Sorte, C. J., Davidson, V. E., Franklin, M. C., Benes, K. M., Doellman, M. M., Etter, R. J., et al. (2017). Long-term declines in an intertidal foundation species parallel shifts in community composition. Glob. Chang. Biol. 23, 341–352.
Stephenson, P. J., Bowles-Newark, N., Regan, E., Stanwell-Smith, D., Diagana, M., Höft, R., et al. (2017). Unblocking the flow of biodiversity data for decision-making in Africa. Biol. Conserv. 213, 335–340. doi: 10.1016/j.biocon.2016.09.003
Turner, W., Spector, S., Gardiner, N., Fladeland, M., Sterling, E., and Steininger, M. (2003). Remote sensing for biodiversity science and conservation. Trends Ecol. Evol. 18, 306–314.
Vinagre, P. A., Pais-Costa, A. J., Gaspar, R., Borja, Á, Marques, J. C., and Neto, J. M. (2016). Response of macroalgae and macroinvertebrates to anthropogenic disturbance gradients in rocky shores. Ecol. Indic. 61, 850–864. doi: 10.1016/j.ecolind.2015.10.038
Keywords: biodiversity, rocky shores, monitoring, intertidal, Patagonia
Citation: Livore JP, Mendez MM, Klein E, Arribas L and Bigatti G (2021) Application of a Simple, Low-Cost, Low-Tech Method to Monitor Intertidal Rocky Shore Assemblages on a Broad Geographic Scale. Front. Mar. Sci. 8:589489. doi: 10.3389/fmars.2021.589489
Received: 30 July 2020; Accepted: 08 March 2021;
Published: 26 March 2021.
Edited by:
Juan Carlos Azofeifa-Solano, University of Costa Rica, Costa RicaReviewed by:
Iacopo Bertocci, University of Pisa, ItalyIsabel Sousa Pinto, University of Porto, Portugal
Copyright © 2021 Livore, Mendez, Klein, Arribas and Bigatti. This is an open-access article distributed under the terms of the Creative Commons Attribution License (CC BY). The use, distribution or reproduction in other forums is permitted, provided the original author(s) and the copyright owner(s) are credited and that the original publication in this journal is cited, in accordance with accepted academic practice. No use, distribution or reproduction is permitted which does not comply with these terms.
*Correspondence: María M. Mendez, bWVuZGV6QGNlbnBhdC1jb25pY2V0LmdvYi5hcg==