 Chiara Piroddi1*Ekin Akoglu2Eider Andonegi3Jacob W. Bentley4,5Igor Celić6Marta Coll7Donna Dimarchopoulou8,9René Friedland1Kim de Mutsert10,11Raphael Girardin12Elisa Garcia-Gorriz1Bruna Grizzetti1P.-Y. Hernvann13,14,15Johanna J. Heymans16Bärbel Müller-Karulis17Simone Libralato6Christopher P. Lynam18
 Diego Macias1,19Svetla Miladinova1Fabien Moullec20Andreas Palialexis1Ove Parn1Natalia Serpetti6,21Cosimo Solidoro6
 Jeroen Steenbeek22Adolf Stips1Maciej T. Tomczak17Morgane Travers-Trolet23Athanassios C. Tsikliras8
- 1European Commission, Joint Research Centre, Ispra, Italy
- 2Institute of Marine Sciences, Middle East Technical University, Erdemli, Turkey
- 3AZTI, Marine Research, Basque Research and Technology Alliance (BRTA), Sukarrieta, Spain
- 4UN Environment World Conservation Monitoring Centre, Cambridge, United Kingdom
- 5School of Anthropology and Conservation, Durrell Institute of Conservation and Ecology (DICE), University of Kent, Canterbury, United Kingdom
- 6National Institute of Oceanography and Applied Geophysics—OGS, Trieste, Italy
- 7Institute of Marine Science (ICM-CSIC), Barcelona, Spain
- 8Laboratory of Ichthyology, School of Biology, Aristotle University of Thessaloniki, Thessaloniki, Greece
- 9Department of Fisheries, Animal and Veterinary Sciences, College of the Environment and Life Sciences, University of Rhode Island, Kingston, RI, United States
- 10Department of Environmental Science & Policy, George Mason University, Fairfax, VA, United States
- 11Division of Coastal Sciences, School of Ocean Science and Engineering, The University of Southern Mississippi, Ocean Springs, MS, United States
- 12Ifremer, Unité de Halieutique Manche Mer du Nord (HMMN), Boulogne-sur-mer, France
- 13Ifremer, Unité de Sciences et Technologies Halieutiques (STH), Lorient, France
- 14ESE, Ecology and Ecosystem Health, Institut Agro, INRAE, Rennes, France
- 15Institute of Marine Sciences, University of California, Santa Cruz, Santa Cruz, CA, United States
- 16European Marine Board, Oostende, Belgium
- 17Baltic Sea Centre, Stockholm University, Stockholm, Sweden
- 18Lowestoft Laboratory, Centre for Environment, Fisheries and Aquaculture Science (Cefas), Lowestoft, United Kingdom
- 19Instituto de Ciencias Marinas de Andalucía, Consejo Superior de Investigaciones Científicas, Avenida República Saharaui, Puerto Real, Spain
- 20Center for Earth System Research and Sustainability (CEN), Institute for Marine Ecosystem and Fisheries Science (IFM), University of Hamburg, Hamburg, Germany
- 21Scottish Association for Marine Science, Scottish Marine Institute, Oban, United Kingdom
- 22Ecopath International Initiative (EII) Research Association, Barcelona, Spain
- 23Ifremer, Unité de Ecologie et Modèles pour l’Halieutique (EMH), Nantes, France
Eutrophication is one of the most important anthropogenic pressures impacting coastal seas. In Europe, several legislations and management measures have been implemented to halt nutrient overloading in marine ecosystems. This study evaluates the impact of freshwater nutrient control measures on higher trophic levels (HTL) in European marine ecosystems following descriptors and criteria as defined by the Marine Strategy Framework Directive (MSFD). We used a novel pan-European marine modeling ensemble of fourteen HTL models, covering almost all the EU seas, under two nutrient management scenarios. Results from our projections suggest that the proposed nutrient reduction measures may not have a significant impact on the structure and function of European marine ecosystems. Among the assessed criteria, the spawning stock biomass of commercially important fish stocks and the biomass of small pelagic fishes would be the most impacted, albeit with values lower than 2.5%. For the other criteria/indicators, such as species diversity and trophic level indicators, the impact was lower. The Black Sea and the North-East Atlantic were the most negatively impacted regions, while the Baltic Sea was the only region showing signs of improvement. Coastal and shelf areas were more sensitive to environmental changes than large regional and sub-regional ecosystems that also include open seas. This is the first pan-European multi-model comparison study used to assess the impacts of land-based measures on marine and coastal European ecosystems through a set of selected ecological indicators. Since anthropogenic pressures are expanding apace in the marine environment and policy makers need to use rapid and effective policy measures for fast-changing environments, this modeling framework is an essential asset in supporting and guiding EU policy needs and decisions.
Introduction
Eutrophication is one of the most important anthropogenic pressures on coastal and estuarine waters (Cloern, 2001; Desmit et al., 2018), seriously threatening the functioning and structure of marine ecosystems (Diaz and Rosenberg, 2008; Nixon, 2009; Doney, 2010; Cai et al., 2011), due to an excessive amount of nutrients from agricultural run-off and sewage. In Europe, several pieces of legislation have been implemented to prevent negative effects of eutrophication, either directly with the Urban Wastewater Treatment (UWWTD CEC, 1991), the Nitrates (ND, CEC, 1991), and the Water Framework (WFD 2000/60/EC) Directives, or within an ecosystem context with the Marine Strategy Framework Directive (MSFD 2008/56/EC). Eutrophication is one of the eleven qualitative descriptors of the MSFD established by the European Commission (EC) to assess the environmental status of EU marine waters (European Commission, 2008; Cardoso et al., 2010). Despite the legislation to mitigate the negative impacts of nutrient discharge in European waters, countries have not been compliant and the measures have not been effective enough to achieve the ultimate goals of the regulations. One of the main obstacles is that marine and coastal ecosystems receiving these impacts are so complex that they prevent stakeholders from observing pressure-impact relationships between nutrient discharges and marine ecosystem state.
Ecological models are powerful tools to address the complexity of these systems and highlight these relationships (Hyder et al., 2015; Lynam et al., 2016; Heymans et al., 2018). Decades of experience and acquired knowledge resulted in a strong progress of ecological modeling, allowing e.g., to better simulate the different components of the marine environment and explore the ecological responses that might occur if alternative management scenarios were implemented (IPBES, 2016; Zandersen et al., 2019). Within this context, the scientific community has been working to build a robust and reliable “End to End Models” (E2EMs) framework, which simulate the main processes that influence the dynamics of marine ecosystems (Fulton, 2010). This framework includes different types of spatially temporally explicit models, as (1) Hydrological models: providing information on river discharge in terms of flow and nutrients; (2) Hydrodynamic models: simulating marine water transport; (3) Biogeochemical models (lower trophic level, LTL): assessing transported nutrients and nutrient processes within phytoplankton/zooplankton; and (4) Food-web/multispecies models (or higher trophic level, HTL): simulating biomass dynamics, the distribution of marine organisms (from phytoplankton to top predators) and fisheries.
Several studies have used the E2EM framework to assess the impact of nutrient reduction or other stressors on HTL organisms and ecosystem functioning (Libralato and Solidoro, 2009; Rose et al., 2010; Peck et al., 2018). In this study we explore the impact of nutrient management scenarios at the European Sea scale by running an ensemble of different HTL models, forced by an existing coupled hydrological and hydrodynamic-biogeochemical framework (see details below) covering specific areas of European regional seas. This was done to achieve a pan-European assessment of the impact of such measures in marine ecosystems while evaluating consistencies or divergences in predictions among different types of models and applications.
In particular we assess how changes in nutrient inputs and concentrations and consequently planktonic groups might impact the structure and function of the upper trophic levels of the food web. Classical food web theory suggests that nutrient enrichment affects the food web from the bottom-up along with top-down effects, through predation, controlling the biomass of all trophic levels of a system (Oksanen et al., 1981; Borer et al., 2006). Several studies have investigated these synergetic effects on terrestrial and marine ecosystems (Worm et al., 2002; Isbell et al., 2013) highlighting that a decrease in nutrients would decrease the biomass of autotrophic organisms while the possible resulting decrease in the biomass of herbivores and carnivores would depend on the complexity (trophic linkages: Abrams, 1993; Leibold et al., 1997; Ward and McCann, 2017) and on the nature of the ecosystem (e.g., at mature or developmental stage and/or in oligotrophic or eutrophic conditions: Odum, 1969; Proulx and Mazumder, 1998; Schlenger et al., 2019). However, it is still unclear how biodiversity changes in relation to nutrients and which type of relationship this might be (Waide et al., 1999; Kondoh, 2001; Jara et al., 2006; Groendahl and Fink, 2017). Recent empirical and modeling studies have also suggested that net primary production is a key factor explaining fisheries yield and limiting fishery production potential (e.g., Stock et al., 2017; Link and Watson, 2019).
Our assessment follows MSFD descriptors (mainly the biodiversity related descriptors) and methodological standards, developed and agreed upon in the framework of European or international conventions (European Commission, 2017). We included additional indices, as suggested by previous studies (Shannon et al., 2014; Coll et al., 2016), to complement the assessment of the marine environment.
The use of an ensemble of models is crucial to increase the reliability of model predictions, account for prediction uncertainty and better inform decision-makers about the range of effects of selected pressures/measures on biodiversity, ecosystems and their services in general (Gårdmark et al., 2013; Maxwell et al., 2015; Bauer et al., 2019; Lotze et al., 2019). The overall aim of this paper is to utilize the pan-European model ensemble to address the impact of eutrophication on the European seas. Similar exercises have been done on regional scale (Bauer et al., 2018), but to our knowledge, this is the first pan-European multi-model comparison used to assess the impacts of land-based management measures (in this case the reduction of nutrients) on marine and coastal HTL ecosystems.
Materials and Methods
Nutrient Scenarios
Hydrological and Hydrodynamic-Biogeochemical Models
The hydrodynamic-biogeochemical dynamics of the European seas resulting from different river scenarios have been simulated using an End to End Model called Modeling Framework (MF), developed at the European Commission by its science Directorate-General (DG), the Joint Research Centre (JRC). The MF consists of coupled (either offline or online) hydrological, hydrodynamic-biogeochemical, and food-web models (Supplementary Figure S1). These models have been implemented and validated at different spatial (regional and sub-regional) and temporal (past and future) scales (Garcia-Gorriz et al., 2016; Macias et al., 2018b) across Europe.
The MF has been designed to simulate changes in the state of European marine ecosystems and derived services in response to different pressures and management scenarios with the overall goal of providing explicit support to the decision-making process. In particular, in relation to eutrophication, the MF has investigated two realistic nutrient management scenarios, following measures reported and suggested by Member States within the WFD implementation plans. The two scenarios covering inland water quantity and quality (nutrients) in Europe include: (1) actual nutrient loads from river discharge (reference scenario, REF) and (2) maximum technically feasible reduction (MTFR scenario) of nutrient input to surface water. The nutrient reductions can be achieved by, e.g., keeping the nutrient surplus in agricultural areas to a minimum, optimizing mineral fertilizer applications and upgrading waste water treatments to the highest level of nutrient removal (Grizzetti et al., 2021).
The water flow and the effectiveness of measures for preventing water scarcity were simulated by the LISFLOOD model (De Roo et al., 2020); a GIS-based hydrological rainfall-runoff-routing model used to simulate the hydrological processes that occur in a river basin. Annual total nitrogen and total phosphorus loads reaching the sea were estimated by the GREEN model (Geospatial Regression Equation for European Nutrient losses; Grizzetti et al., 2012); a statistical regression model that represents the processes of nutrient transport and retention in the river basin as well as the nutrient sources and physical characteristics that influence nutrient processes. GREEN was coupled to LISFLOOD by incorporating the modeled water flow, to simulate annual nutrient loads for the period 2005–2012, corresponding to the most recent spatial data homogeneously available at the European scale (Grizzetti et al., 2021).
The MTFR scenario comprised increased water use efficiency in irrigation and domestic usage, changes in cooling water requirements and the implementation of wastewater re-use for irrigation (De Roo et al., 2020). Measures to reduce nutrient pollution in the water consisted of upgrading all waste water treatment plans in the EU to a high level of nutrient removal (i.e., a tertiary treatment with an enhanced reduction of phosphorus) and lowering the mineral fertilization in agricultural fields by setting maximum nitrogen surplus in agricultural areas to 10%, but without changing the current level of livestock and manure production (Grizzetti et al., 2021). The simulation of nutrient inputs and measures was implemented in a high spatial resolution grid (catchments of 7 km2 average size). The simulated annual river flow and nutrient concentrations estimated by GREEN, for both scenarios, were then coupled to the LTL module of the MF to assess how changes in nutrient load might impact nutrient and plankton concentrations at sea.
The LTL module consisted of 3D hydrodynamic-biogeochemical models representing the four main MSFD regions (Mediterranean Sea, Black Sea, Baltic Sea and North East Atlantic). Details of the hydrodynamic-biogeochemical models can be found in Garcia-Gorriz et al. (2016) and Macias et al. (2018b). The mean difference in nutrient concentrations between the two scenarios (MTFR and REF) estimated by the hydrological model for the land-sea interface, and integrated for the assessed period (2005–2012), ranged from −2 to −31.8% for riverine total nitrogen and from −4 to −46.3% for total phosphorus, depending on the assessed ecosystem (Table 1). Relative changes in nutrient concentrations and primary production at sea estimated by the hydrodynamic-biochemical models were smaller but varied according to the HTL marine ecosystem considered.
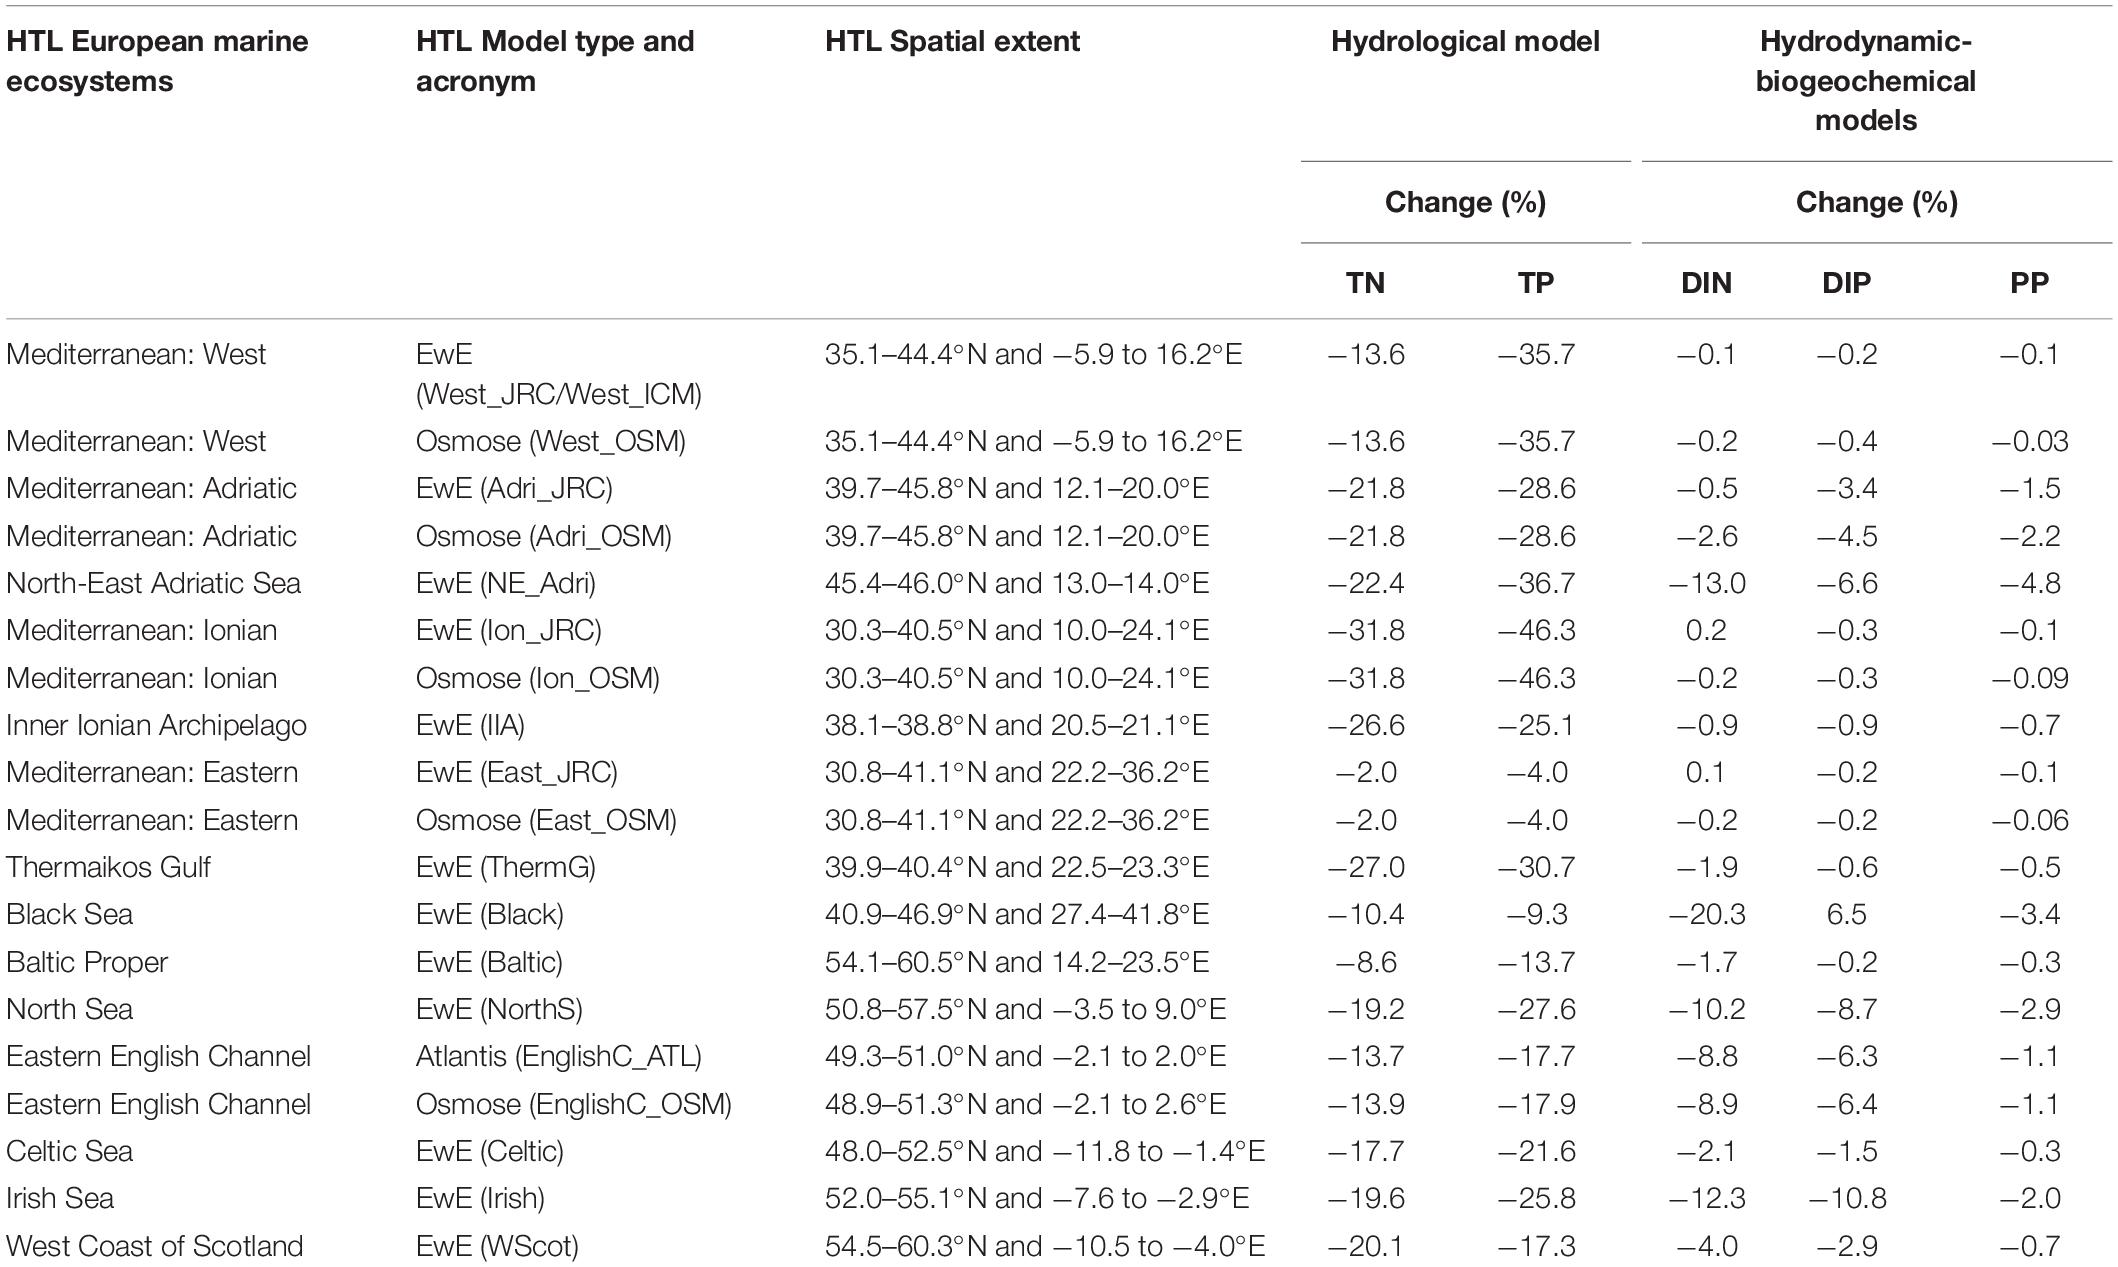
Table 1. The HTL European marine ecosystems, HTL model type, acronym and HTL spatial extent (ranges of latitude and longitude), which was used to extract LTL models outputs (details in Supplementary Table S1). Relative changes (%) between the two scenarios (MTFR and REF) of riverine total nitrogen (TN) and total phosphorus (TP) loads estimated by the hydrological model (Grizzetti et al., 2021), and total nitrate (DIN), phosphate (DIP) and primary production (PP) at sea estimated by the hydrodynamic-biogeochemical models (Friedland et al., 2021) for the period 2005–2012.
In addition, an example of the spatial output scenarios produced by the hydrological and hydrodynamic-biogeochemical models for the Mediterranean Sea, and integrated for the assessed period (2005–2012), is presented in Supplementary Figure S2. The full Pan-European assessment for the hydrological and LTL modules can be found in Grizzetti et al. (2021) and Friedland et al. (2021), respectively.
HTL Models
Fourteen HTL models were used to run the nutrient management scenarios, all covering either full MSFD regions, sub-regions, or smaller zones within single MSFD areas (Figure 1 and Supplementary Table S1). The criteria used to select these models were that they were validated, fitted to observed data, and published in peer-reviewed scientific literature. The model types included in this assessment were: food-webs (79%, Ecopath with Ecosim or EwE: Christensen and Walters, 2004), multispecies/individual-based (14%, Osmose: Shin et al., 2005) and end-to-end (7%, Atlantis: Fulton et al., 2011) models, which corresponded to the main modeling tools used in Europe to assess HTL compartments of marine ecosystems (Piroddi et al., 2015). A detailed description of these models is given in Supplementary Table S1. As shown in Supplementary Table S1, the HTL models were all different in complexity and structure depending on their specific goals e.g., number of functional groups, temporal/spatial scale, and environmental/anthropogenic drivers (e.g., fishing pressure, primary production, temperature). Yet, a commonality across these tools was the ability to capture historic (hindcast) ecosystem dynamics using environmental variables (e.g., nutrients concentrations, phytoplankton biomass or primary production) as drivers. This was an essential prerequisite for exploring the effect of nutrient scenarios on these ecosystems.
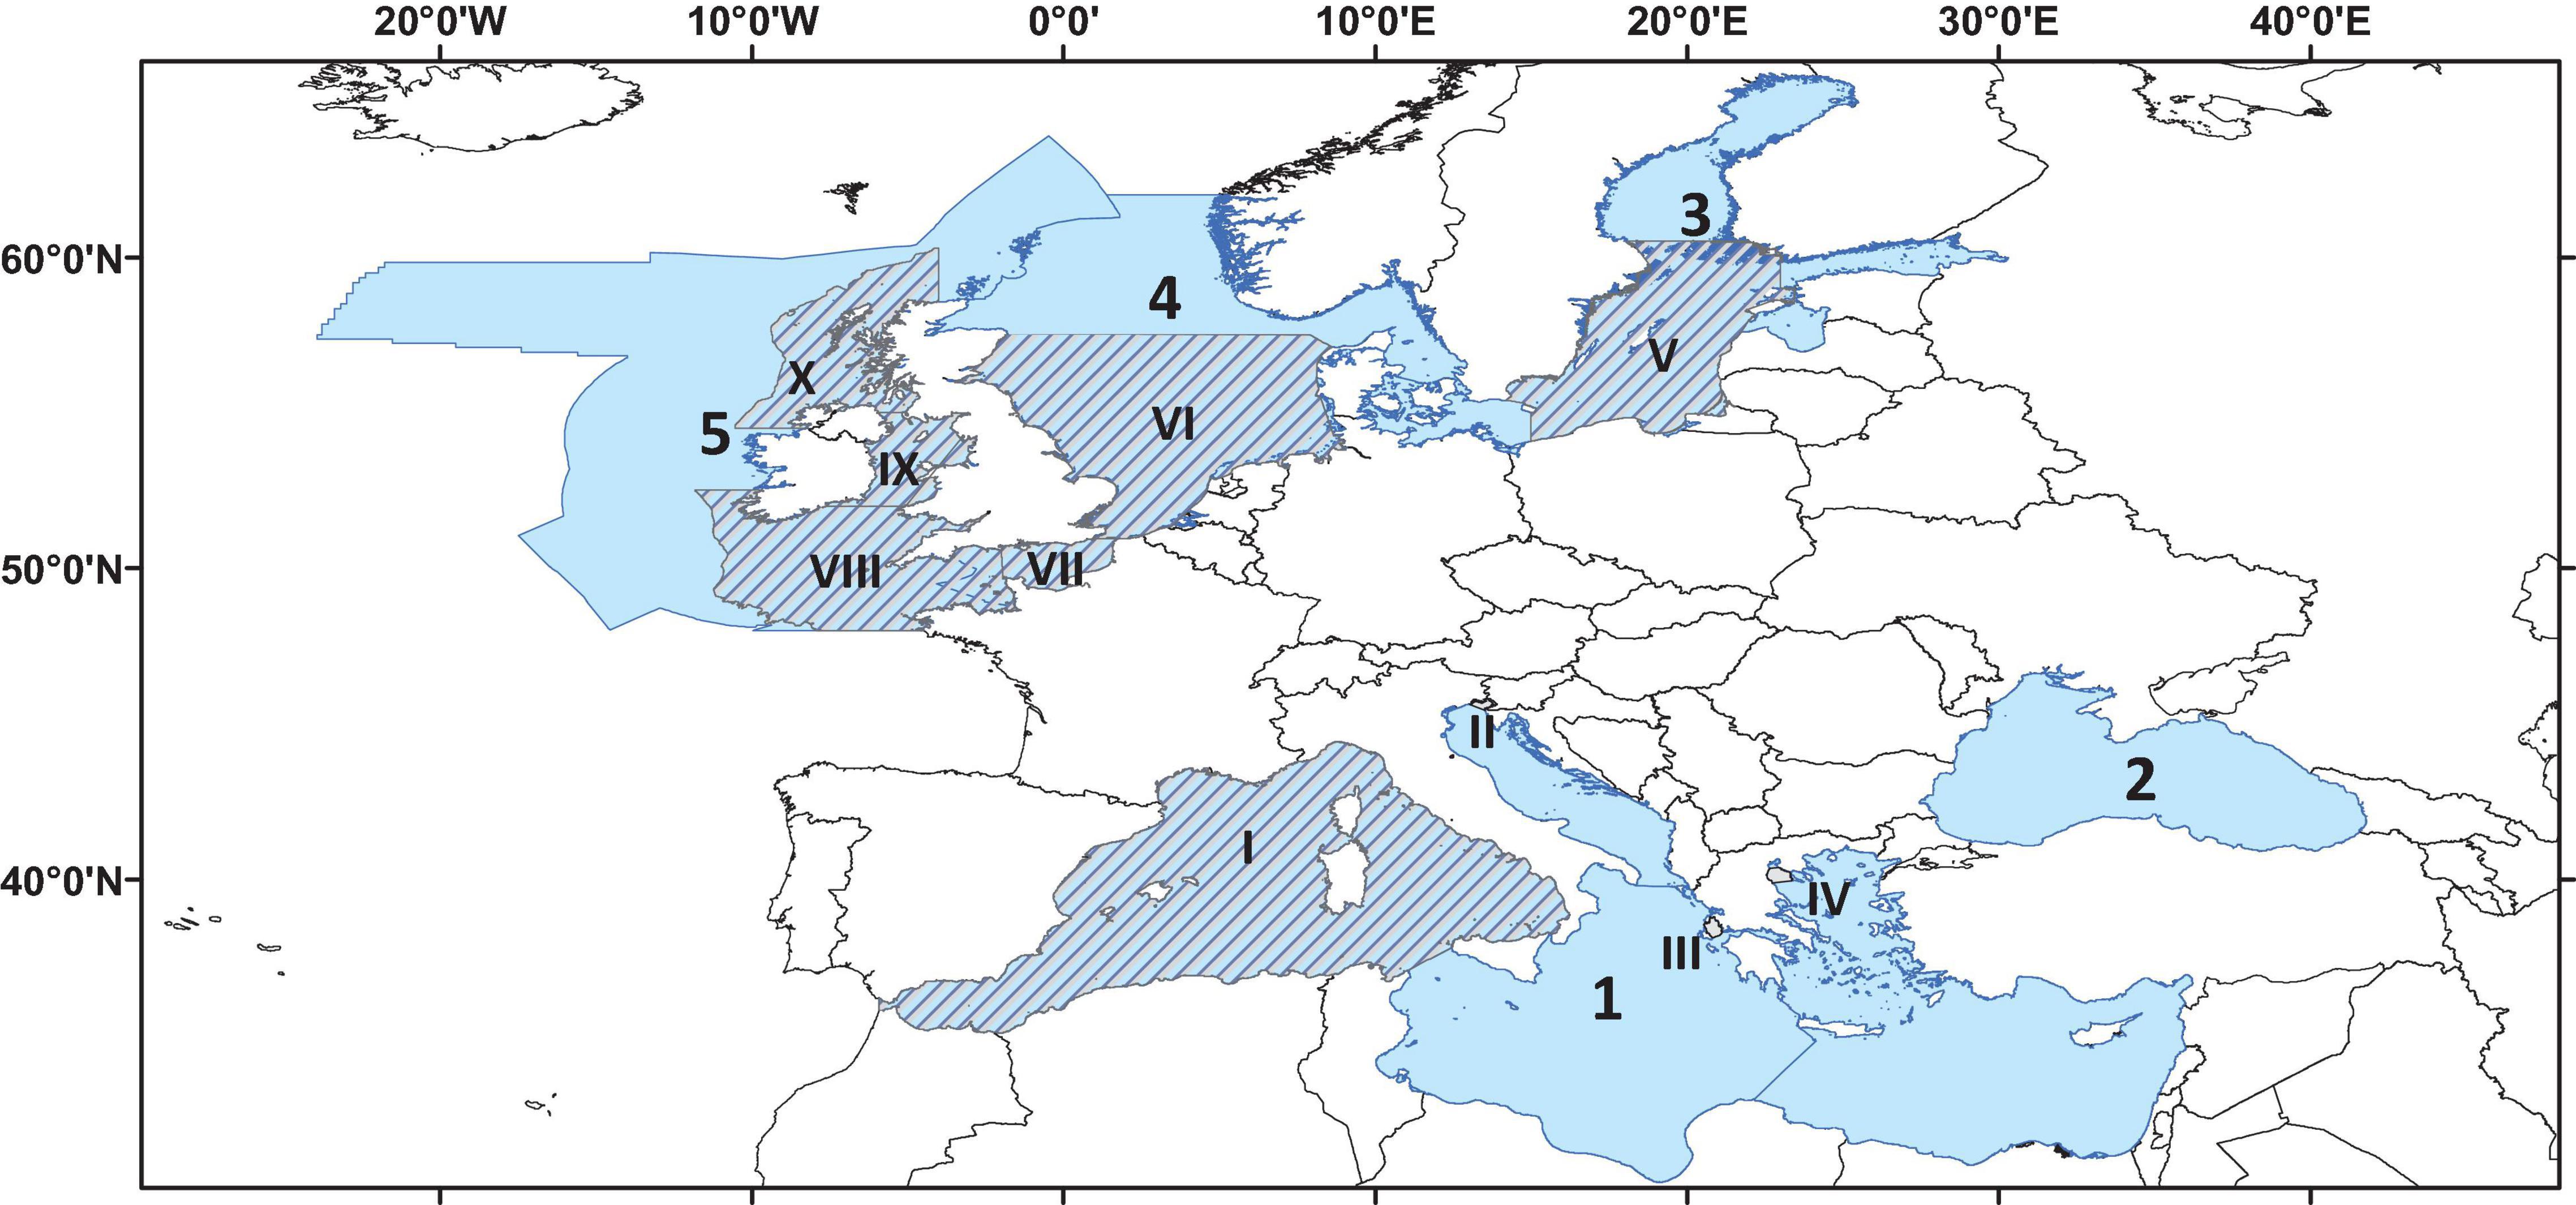
Figure 1. Map showing the location and spatial extent of the 14 ecosystems models included in the analysis. Light-blue background and Arabic numbers correspond to MSFD regions and sub-regions (1 = Mediterranean Sea; 2 = Black Sea; 3 = Baltic Sea; 4 = North Sea; 5 = Celtic Seas) while dashed background and Roman numbers refer to smaller areas within an MSFD region/sub-region (I = Western Mediterranean; II = North-East Adriatic; III = Inner Ionian Archipelago; IV = Thermaikos Gulf; V = Baltic Proper; VI = North Sea; VII = English Channel; VIII = Celtic Sea; IX = Irish Sea; X = West Coast of Scotland).
To run the nutrient simulations, each HTL model was forced with specific environmental output from the REF and MTFR scenarios of the MF hydrodynamic-biogeochemical module covering the 2005–2012 period. Each scenario was run separately by the individual HTL models using the 8-years (2005–2012) simulations from the LTL models as “forecast” scenarios (Supplementary Table S1), keeping the hindcast from the original settings, as the main goal of this study was to detect changes between the two scenarios. The types of drivers provided correspond to the drivers utilized by the specific HTL models to hindcast the historical observations. For example, simulated phytoplankton biomass or primary production were used to simulate nutrients in the EwE models while simulated nutrients at sea were used in the Atlantis model (Supplementary Table S1). The other forcing (e.g., fishing mortality/effort, temperature) already incorporated in each HTL model were kept unchanged as the purpose of the exercise was to assess changes in the HTL ecosystems impacted solely by changes in nutrient management (Supplementary Table S1).
Metrics for Assessing HTL Responses
MSFD Criteria
To assess the impact of the nutrient management scenarios, a set of criteria from MSFD Descriptor 3 (D3: Commercially exploited species) and Descriptor 4 (D4: Food webs) were used. In particular, we chose criteria and species that would likely have a direct response to these scenarios, such as small pelagic fishes (e.g., herrings, sardines, anchovies) bottom-up controlled by primary production, and criteria that would be able to capture changes within the food web (e.g., species diversity). To be able to compare output across regions and models, we selected criteria common to most of the models (Table 2). MSFD Descriptor 1 (D1: biodiversity) was not used because the majority of the models were not able to capture dynamics of non-commercial iconic species such as marine mammals and seabirds. The full list of criteria is shown in Table 2.
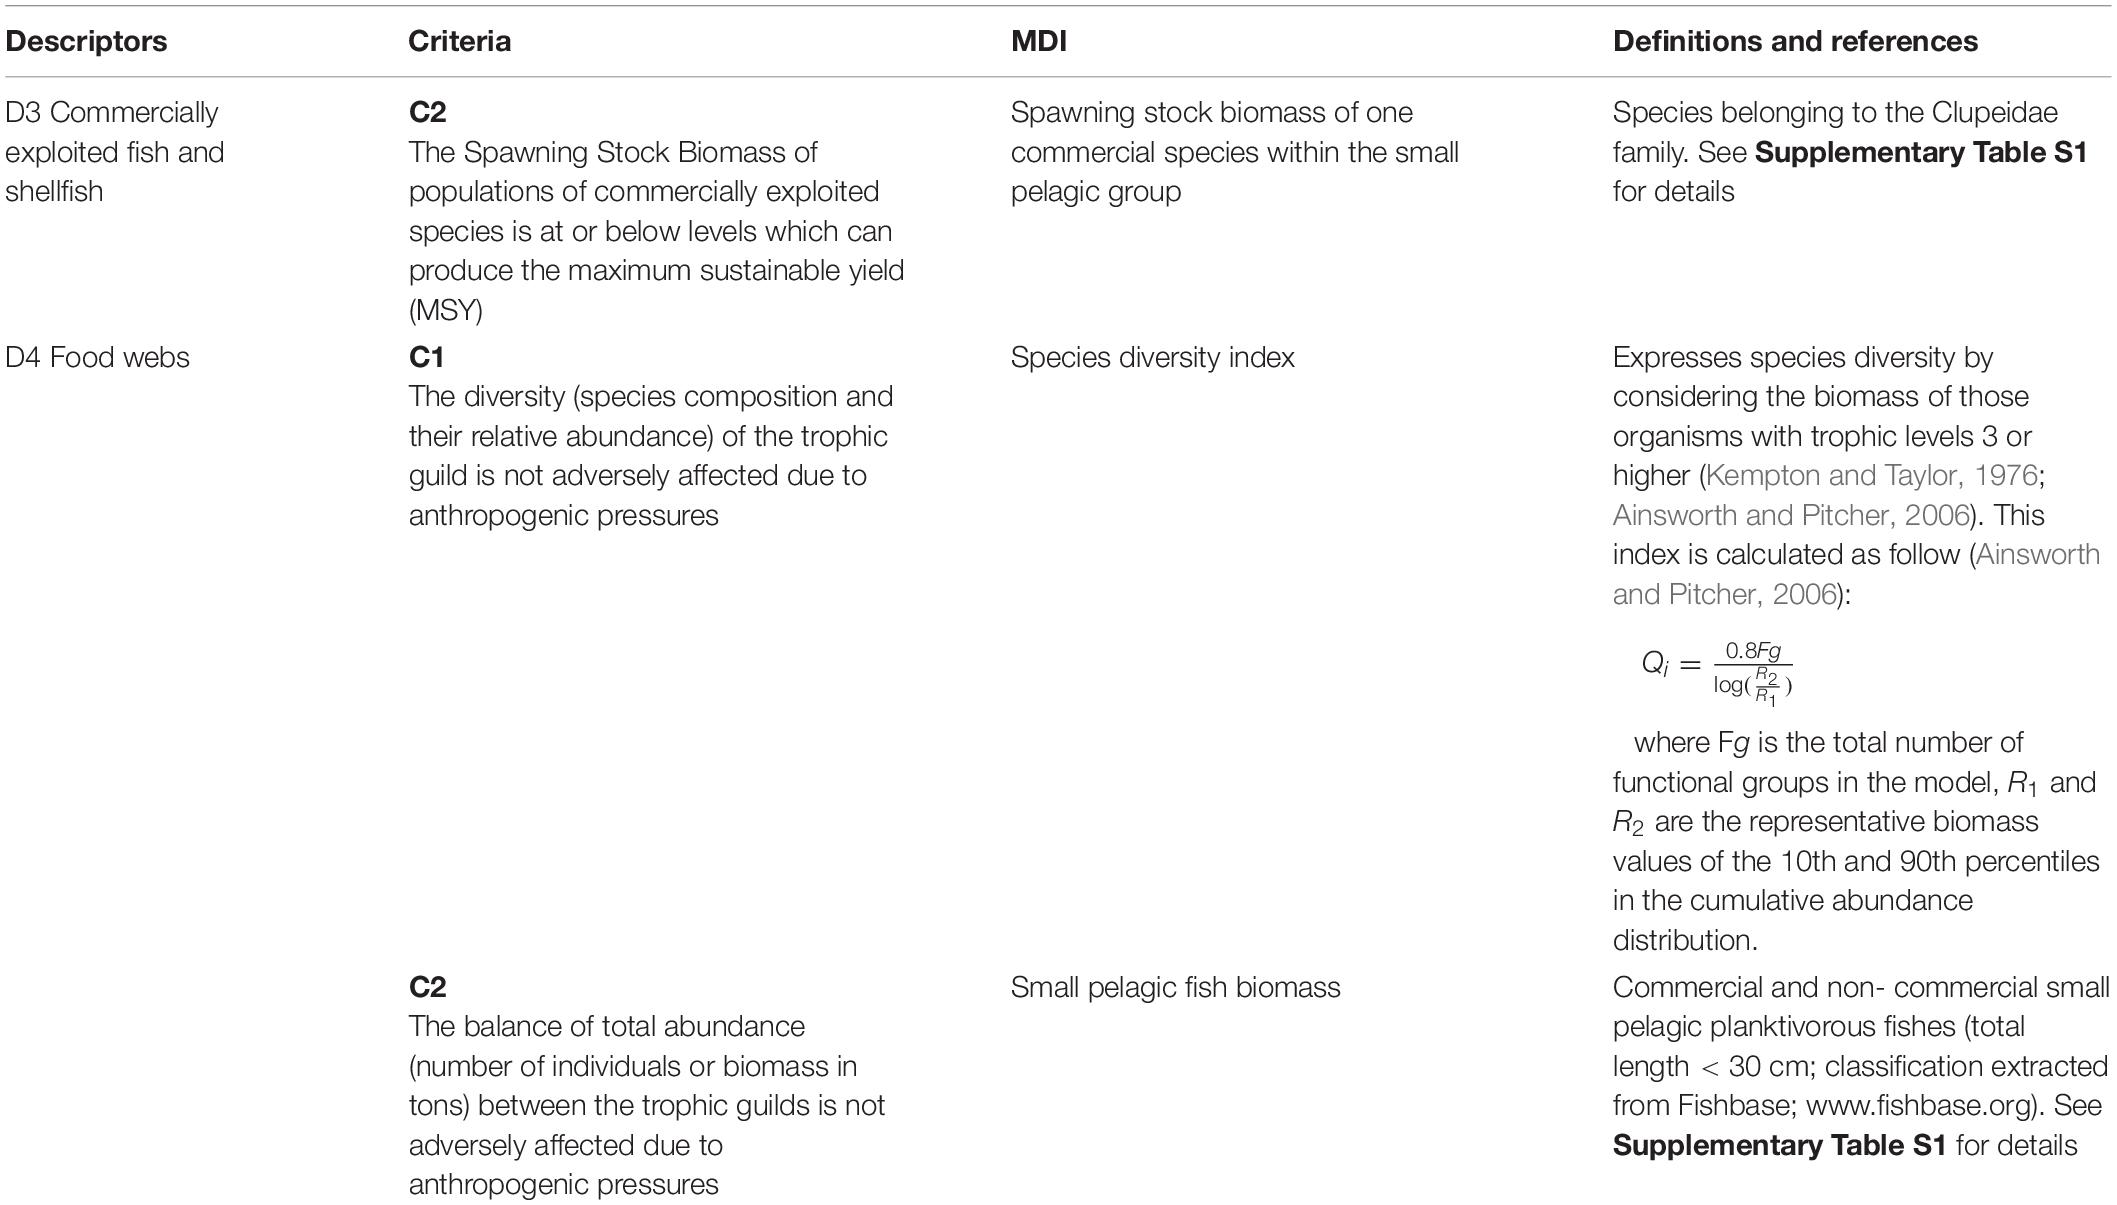
Table 2. List of selected descriptors/criteria as defined by the MSFD (2017/848/EC) together with the modeled derived indicators (MDI), definitions and references.
Trophic-Based Indicators
In addition to the MSFD criteria, two other indicators were assessed to test if nutrient scenarios would have an impact on the trophic structure of the ecosystems. These include the trophic level (TL) of the community, excluding TL < 2 (mTLco) (Shannon et al., 2014), calculated as:
where TB is total biomass, Bi is the biomass of species i and TLi is the trophic level of species i (note: TB, Bi and TLi vary in time); and the TL of the landed catches (TLc) (Christensen, 1996; Pauly et al., 1998), calculated as:
where YL is total landings, Yi is the landing of species i and TLi is the trophic level of species i (note: YL, Yi and TLi vary in time).
Modeled criteria and indicators (I) were extracted annually (for the 8 years of simulations) for each HTL model and for both REF and MTFR scenarios. The relative mean change between these scenarios was calculated as:
and presented per descriptor-criterion/TL indicator and per model. For D3 the scale of assessment required by the GES (Good Environmental Status) Decision (European Commission, 2017) is at stock level (typically at one or more geographical subareas [GSAs1 /ICES2 ] as defined by FAO) and for D4 it is at MSFD regional/sub-regional scale. As the models in this assessment had different spatial scales (Figure 1 and Table 1) depending on their final goals, the estimation of the mean change of the selected criteria was done using the original scale of each model, not following, thus, GES requirements. The same scale was also applied for trophic level indicators.
Metrics Over Space
Only six of the HTL models used in this assessment had a spatial component; of these, three were built for the Mediterranean Sea, two covering the entire basin and one set up for the Western Mediterranean Sea (Supplementary Table S1). For the purpose of comparing the spatial predictions from the models and assessing their consistencies/divergences, the Western Mediterranean Sea was used as a reference study. In particular, the relative difference between the two scenarios for each model was calculated as the relative mean change per grid cell. Food-web criteria and their relative changes were presented per model for the whole sub-basin, for shelf (<200 m) and open water (>200 m) areas; the same scale was also applied for trophic level indicators. For criterion D3C2 (the spawning stock biomass of the European pilchard, Sardina pilchardus), the relative mean change was presented at geographic subarea (GSAs) level. D4C1 and D3C2 were not available for the Osmose model.
Finally, coherence maps were created for the three indicators (the small pelagic fishes [D4C2] and the TLs) common to the models to evaluate the coherence of the projections. Trends of relative changes were compared per grid cell and per model, looking at the signs, indicating whether an increase (or decrease) in the selected indicator occurred under the MTFR scenario. The percentage of coherence was calculated for the whole sub-basin, the shelves (<200 m) and open waters (>200 m).
Results
MSFD Criteria–Mean Change
The scenario outputs showed differences between and commonalities among models, criteria, size and locations (Figure 2). In particular, at MSFD regional scale, the Spawning Stock Biomass [SSB] of commercial small pelagic fishes (D3C2) showed a slight decrease in all the areas, with the exception of the English Channel (Osmose; +0.7%), with average values ranging between −1.3 and −2.0% (Figure 2A). The Baltic Proper (the only model available for the Baltic Sea used to represent the entire MSFD region) showed a decrease but also a high level of variability in the modeled SSB values. The Mediterranean Sea models highlighted a reduction in the SSB in all the models/areas considered (from sub-regional to localized coastal/shelf level). Overall, the most impacted MSFD sub-region was the Adriatic Sea (−3.0%), and among smaller areas within an MSFD region/sub-region, the North Sea (−5.5%) and the West Coast of Scotland (−3.3%).
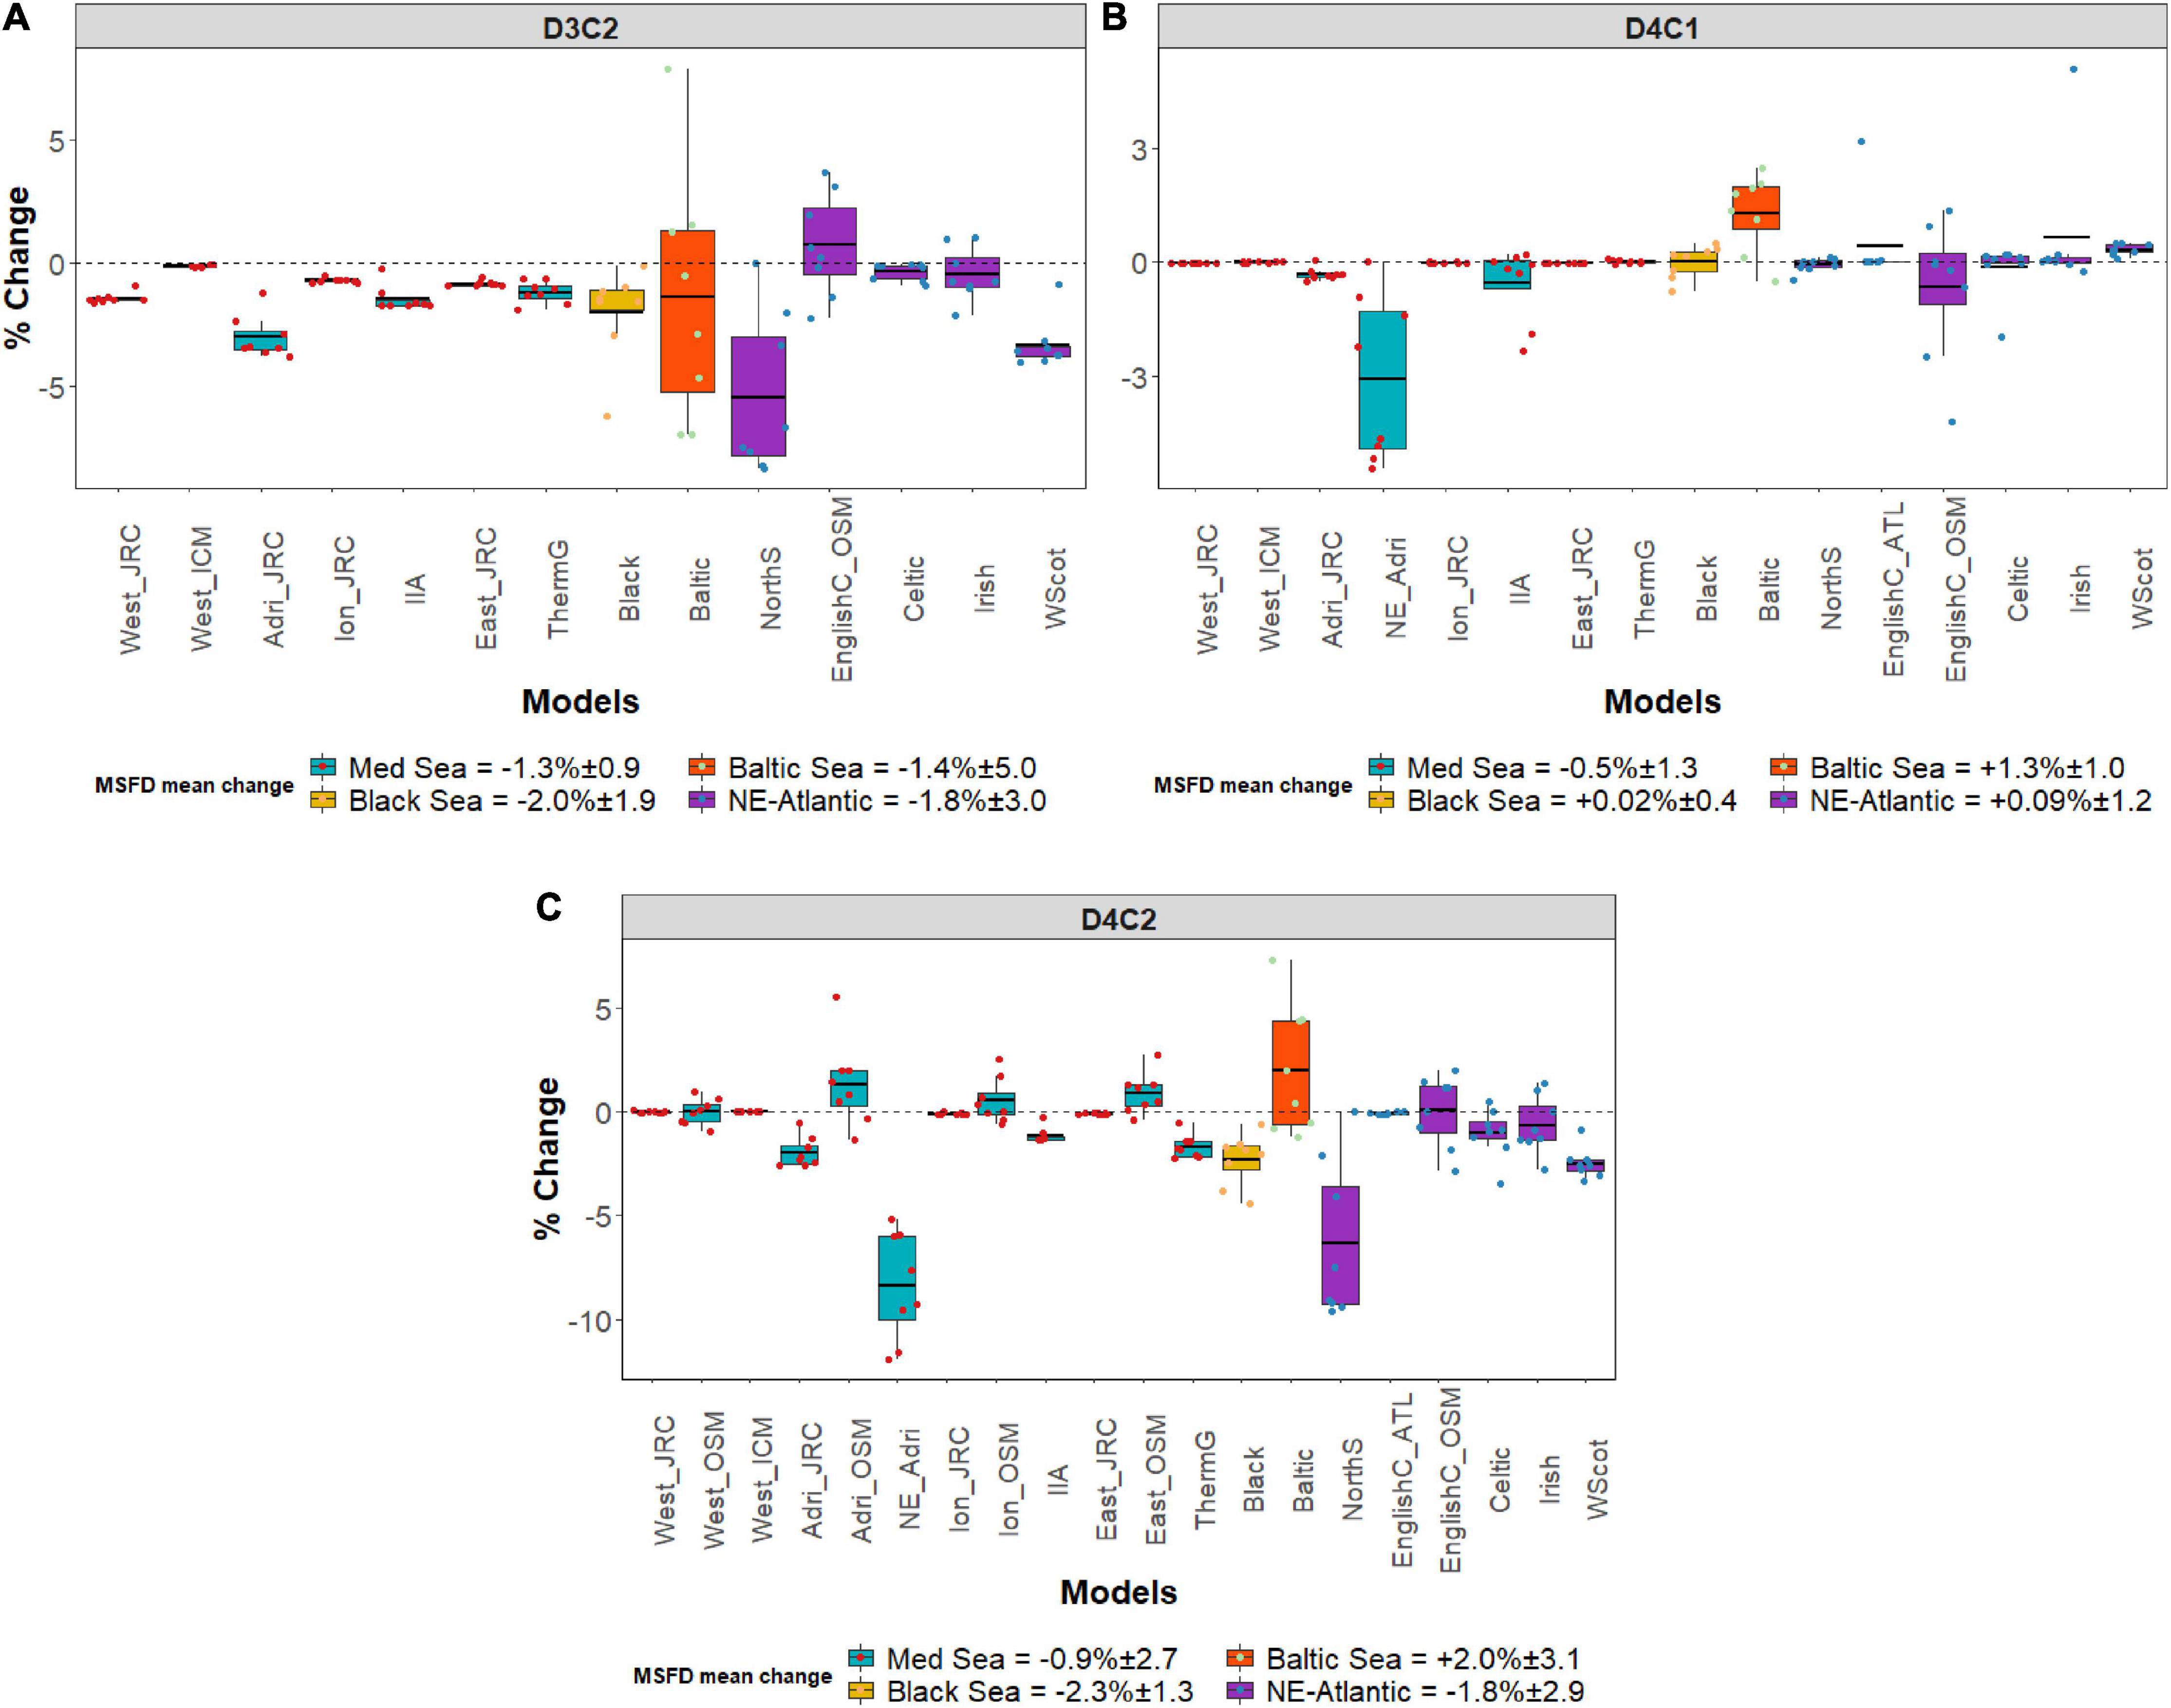
Figure 2. Box plots representing the mean change (%) and standard deviation between MTFR and REF scenario for the selected MSFD criteria: (A) Spawning stock biomass (SSB) of a commercially important small pelagic fish (D3C2); (B) Species diversity index (D4C1) and (C) Small pelagic fish biomass (D4C2) for every MSFD region/sub-region and smaller areas within an MSFD region/sub-region (the acronyms correspond to those given in Table 1). Yearly modeled data points are plotted as colored circles. D3C2 is not displayed for Med-Osmose and NE_Adri as not available, same for D4C1 and Med-Osmose.
Species diversity (D4C1) did not show a significant change (Figure 2B) among the MSFD regions except for the Baltic Sea where a slight increase of +1.3% was observed, and for the North-East Adriatic Sea where a decrease (−3.1%) was found. Small pelagic fish biomass (D4C2) had the highest variability among the areas/models (Figure 2C). At MSFD regional scale, this criterion decreased (−2.3%) in the Black Sea followed by the North East Atlantic and the Mediterranean Sea with slight decreases between −1.8 and −0.9%. In contrast, the biomass of small pelagic fish in the Baltic Sea increased slightly (+2.0%). At sub-regional level, the Adriatic Sea from the MF-Mediterranean model (Adri_JRC) was the area with the highest reduction (−2.0%). Conversely, the Osmose model for the Adriatic Sea (Adri_OSM) projected an increase (+1.3%). For the other Mediterranean sub-regions (the Western, the Ionian and the Eastern) the available models agreed on the marginal impact of the nutrient scenarios for these regions, with an agreement in the mean change for the Western Mediterranean Sea [JRC_EwE (−0.015%); ICM_EwE (−0.011%) and Osmose (−0.017%)] and a disagreement in trend for the other two sub-regions [Ionian: JRC_EwE (−0.1%), and Osmose (0.5%); Eastern: JRC_EwE (−0.09%), and Osmose (0.86%)]. Regarding ecosystems at smaller scales within an MSFD region/sub-region, in the Mediterranean Sea, the North-East Adriatic Sea showed the highest reduction (−8.4%) in small pelagic fish biomass (D4C2) followed by the Thermaikos Gulf (−1.7%) and the Inner Ionian Sea (−1.2%). In the North-East Atlantic, the North Sea was the area most impacted by the nutrient reduction with a −7.5% decrease followed by the West Coast of Scotland (−2.5%), the Celtic Sea (−1.05%) and the Irish Sea (−0.67%), while for the English Channel, the two available models highlighted that the change was minimal (Atlantis: −0.08%; Osmose: +0.04%).
TL Indicators–Mean Change
Overall, the TL indicators did not show clear changes between the two nutrient scenarios (Figure 3). For the MSFD regions, both indicators showed a mean change very close to zero. At sub-regional level, some small increases (<0.5%) were observed through the Mediterranean Osmose model and, for the mTLco, also through the Western Mediterranean Sea from ICM (West_ICM) (Figure 3A). Looking at mTLco, the highest negative changes were observed at smaller scale with a reduction in the North-East Adriatic (−0.7%) followed by the North East Atlantic models (West Coast of Scotland (−0.41%), Celtic Sea (−0.36%) and English Channel in case of the Osmose model (English Channel_OSM; −0.3%) (Figure 3A). Similarly, small reductions in TLc were observed in the North-East Adriatic (−0.2%) and two areas of the North-East Atlantic Sea, the West Coast of Scotland (−0.29%) and the English Channel_OSM (−0.24%) (Figure 3B).
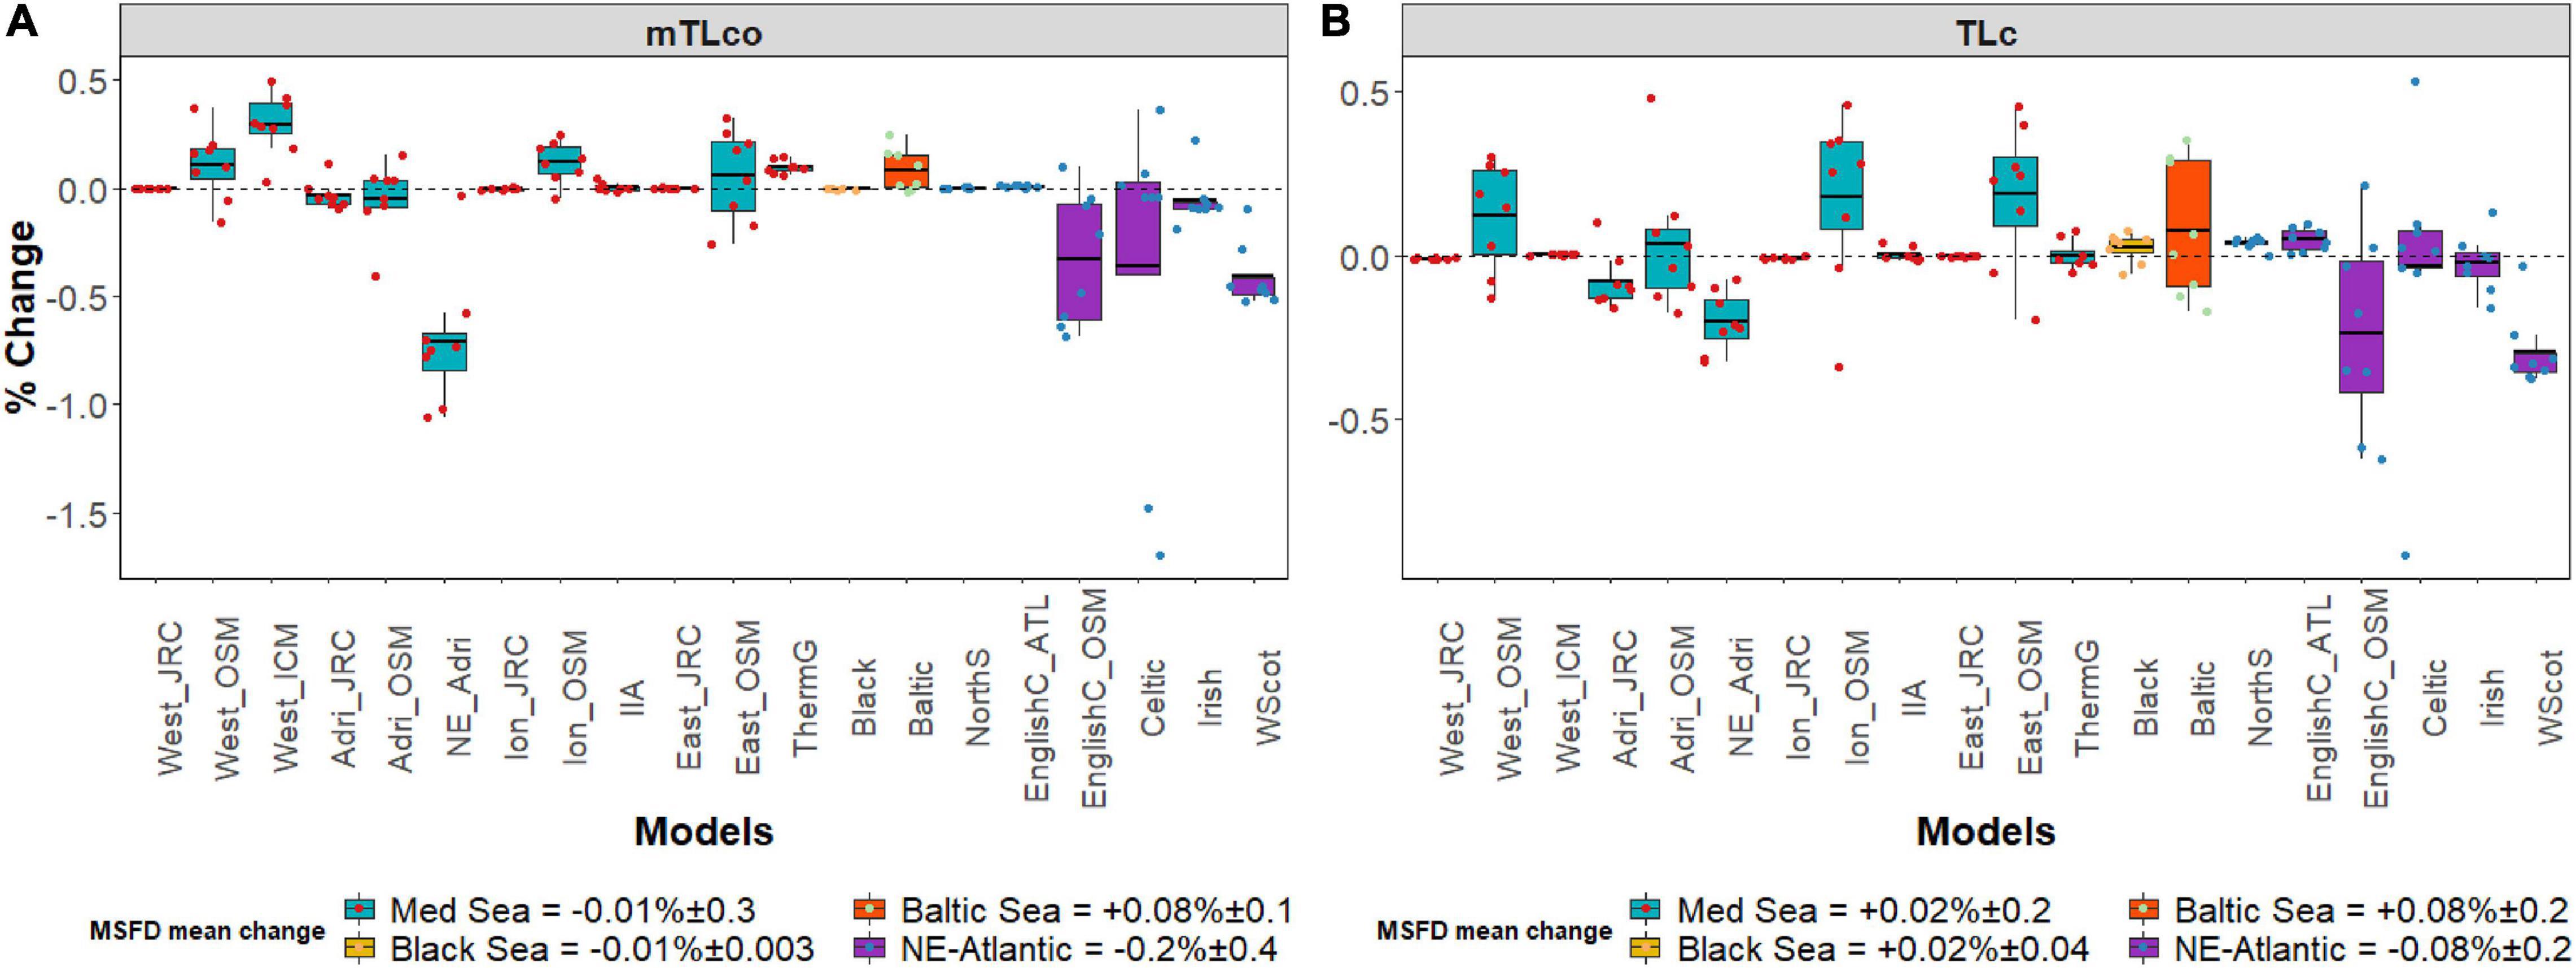
Figure 3. Box plots representing the mean change (%) and standard deviation for TL indicators: (A) Mean trophic level of the community (mTLco); (B) Mean Trophic Level of the Catch (TLc) for every MSFD region/sub-region and smaller areas within an MSFD region/sub-region (the acronyms correspond to those given in Table 1). Yearly modeled data points are plotted as colored circles.
MSFD Criteria Over Space
The spatial outputs produced by the HTL models for the two scenarios in the Western Mediterranean Sea highlighted differences and commonalities among models, criteria/indicators, and between the whole subregion, shelf areas and open waters (Figures 4, 5 and Supplementary Figure S3). SSB (D3C2) results showed a slight reduction for European pilchard with values that, depending on the model considered, ranged between −0.07 and −6% (Figure 4). Looking at GSAs (refer to Figure 4 for the names of the different GSA regions), the highest reductions were found in the Balearic Islands (GSA5: −3.1%) and Algeria (GSA4: −2.2%) using the Western Mediterranean Sea from the JRC (West_JRC) model and the Gulf of Lion (GSA7: −0.39%) from the West_ICM model (Supplementary Table S2).
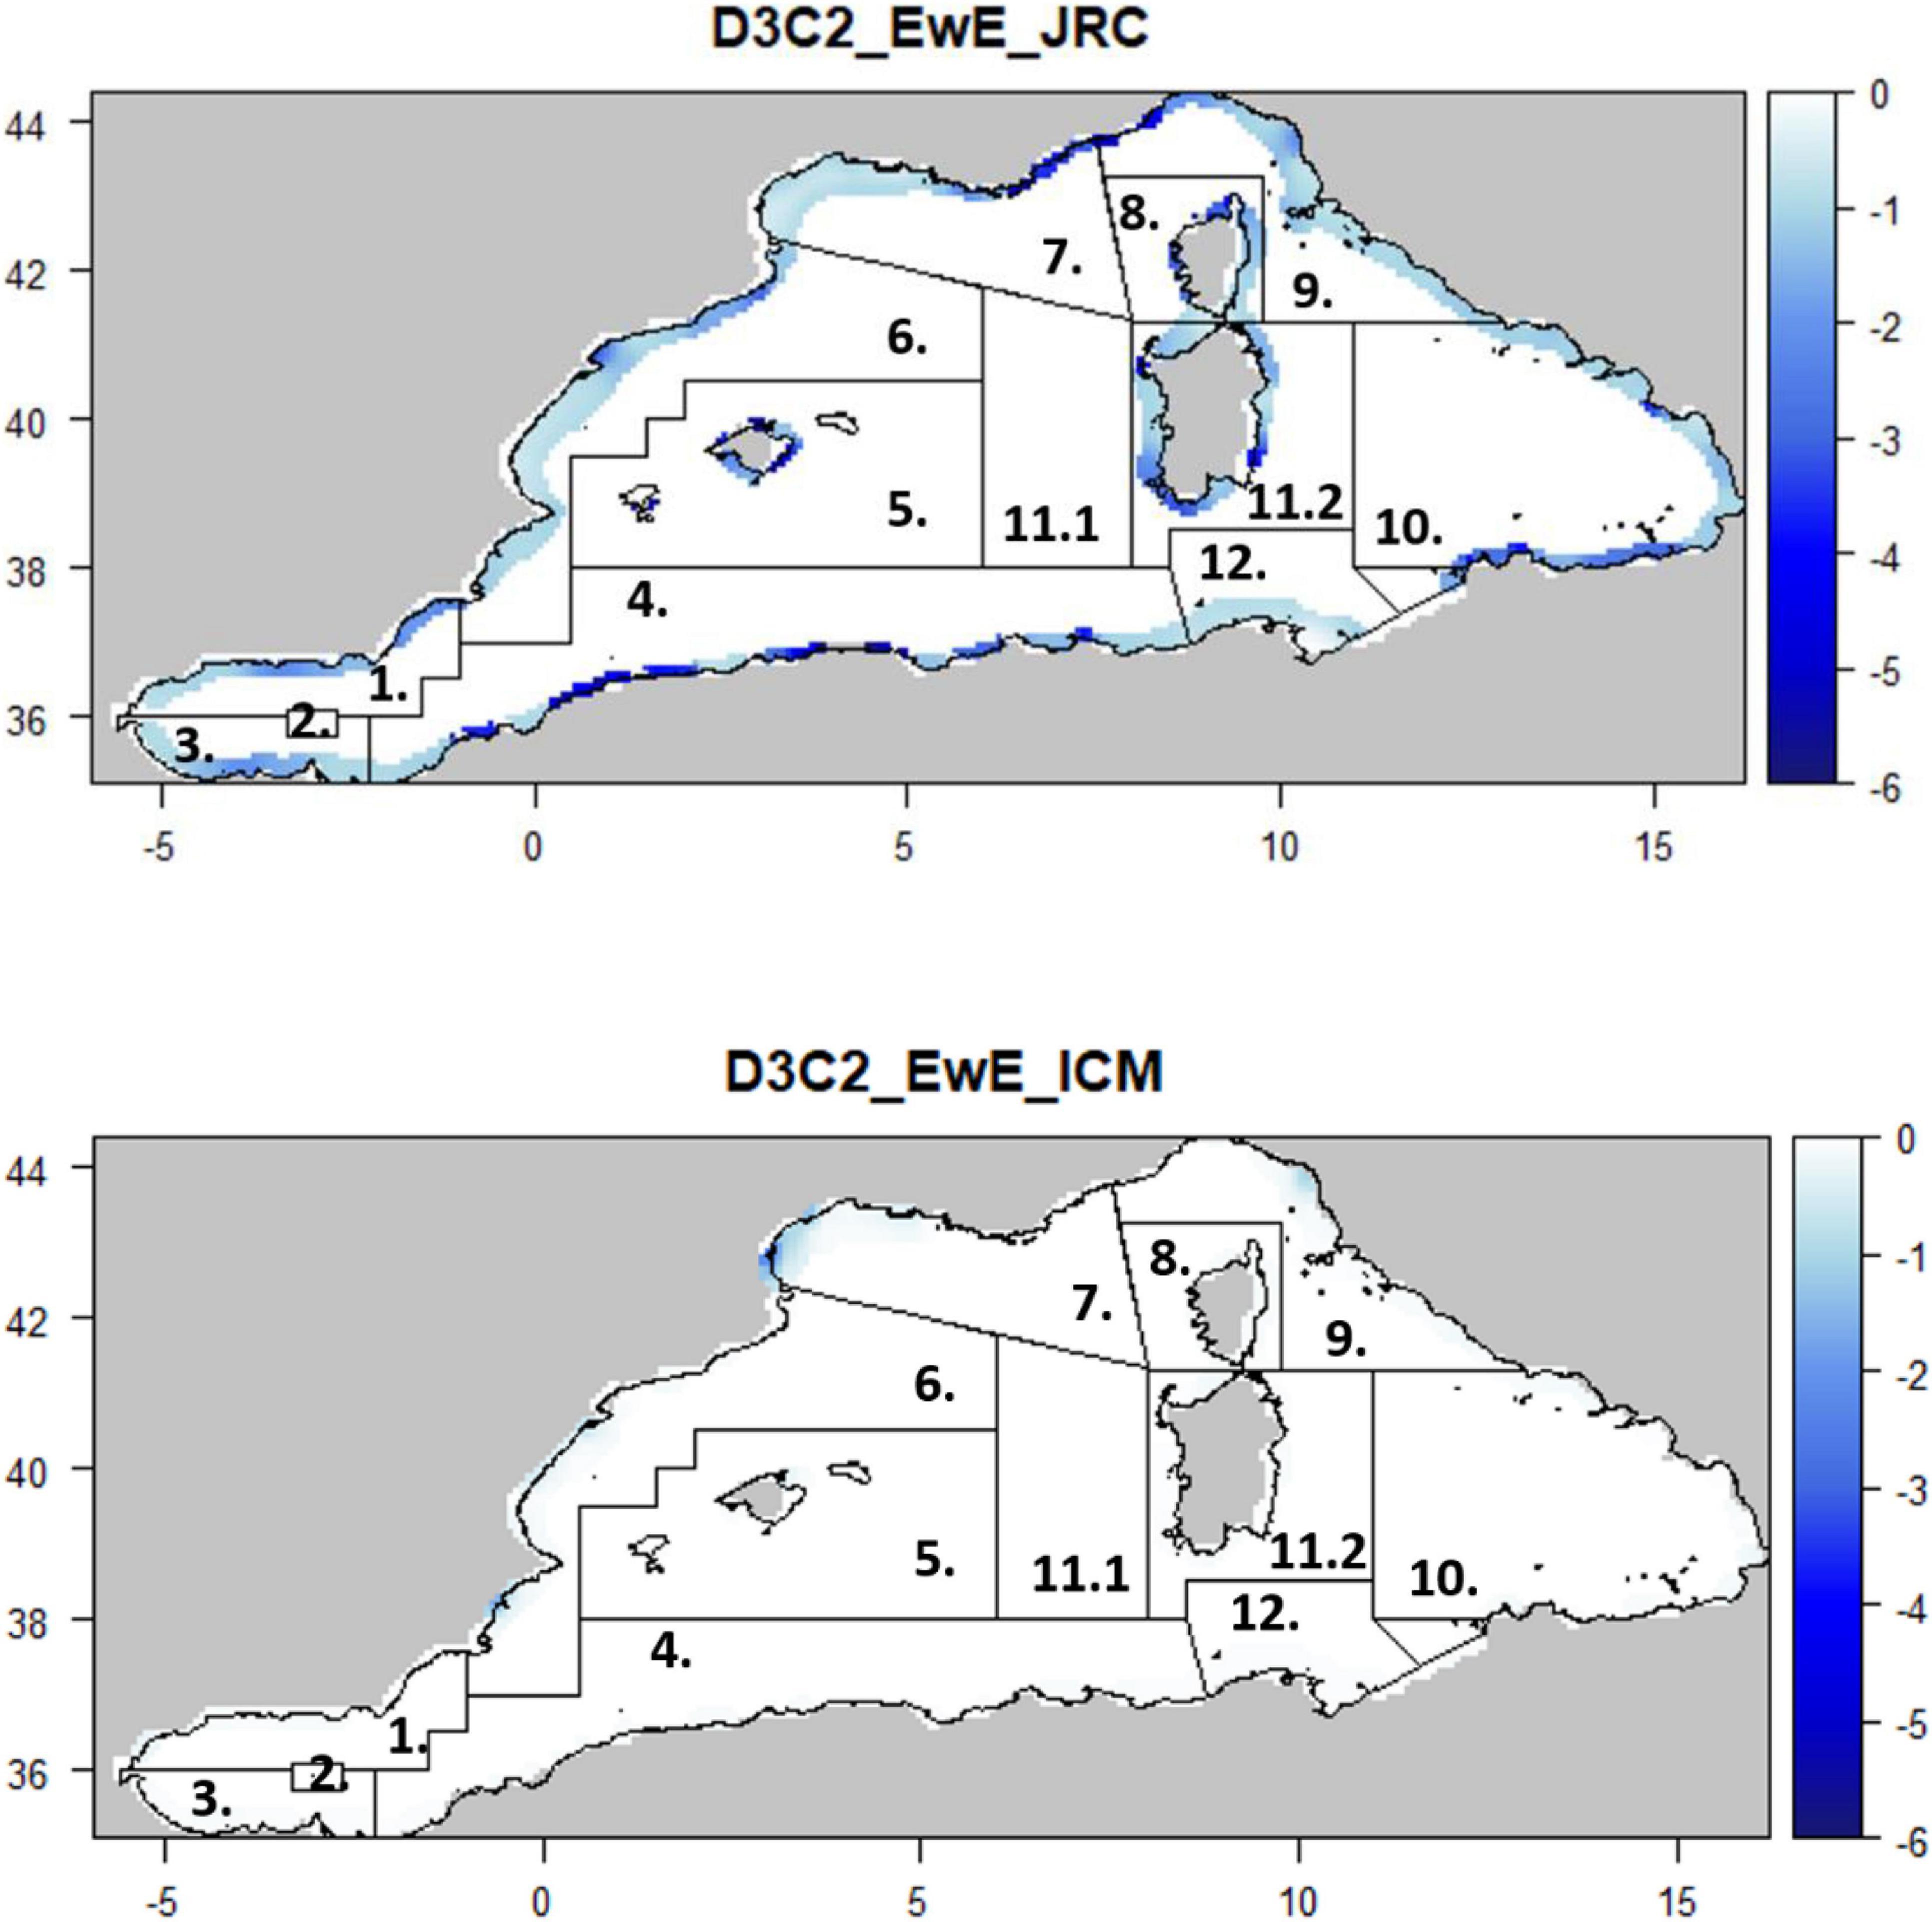
Figure 4. Maps representing the mean change (%) for the Spawning stock biomass of a commercially important small pelagic fish (D3C2) per GSA (# 1. Northern Alboran Sea; 2. Alboran Island; 3. Southern Alboran Sea; 4. Algeria; 5. Balearic Islands; 6. Northern Spain; 7. Gulf of Lion; 8. Corsica; 9. Ligurian and Tyrrhenian Seas; 10. South and Central Tyrrhenian; 11.1. Sardinia West; 11.2. Sardinia East; 12. Northern Tunisia) and per model type.
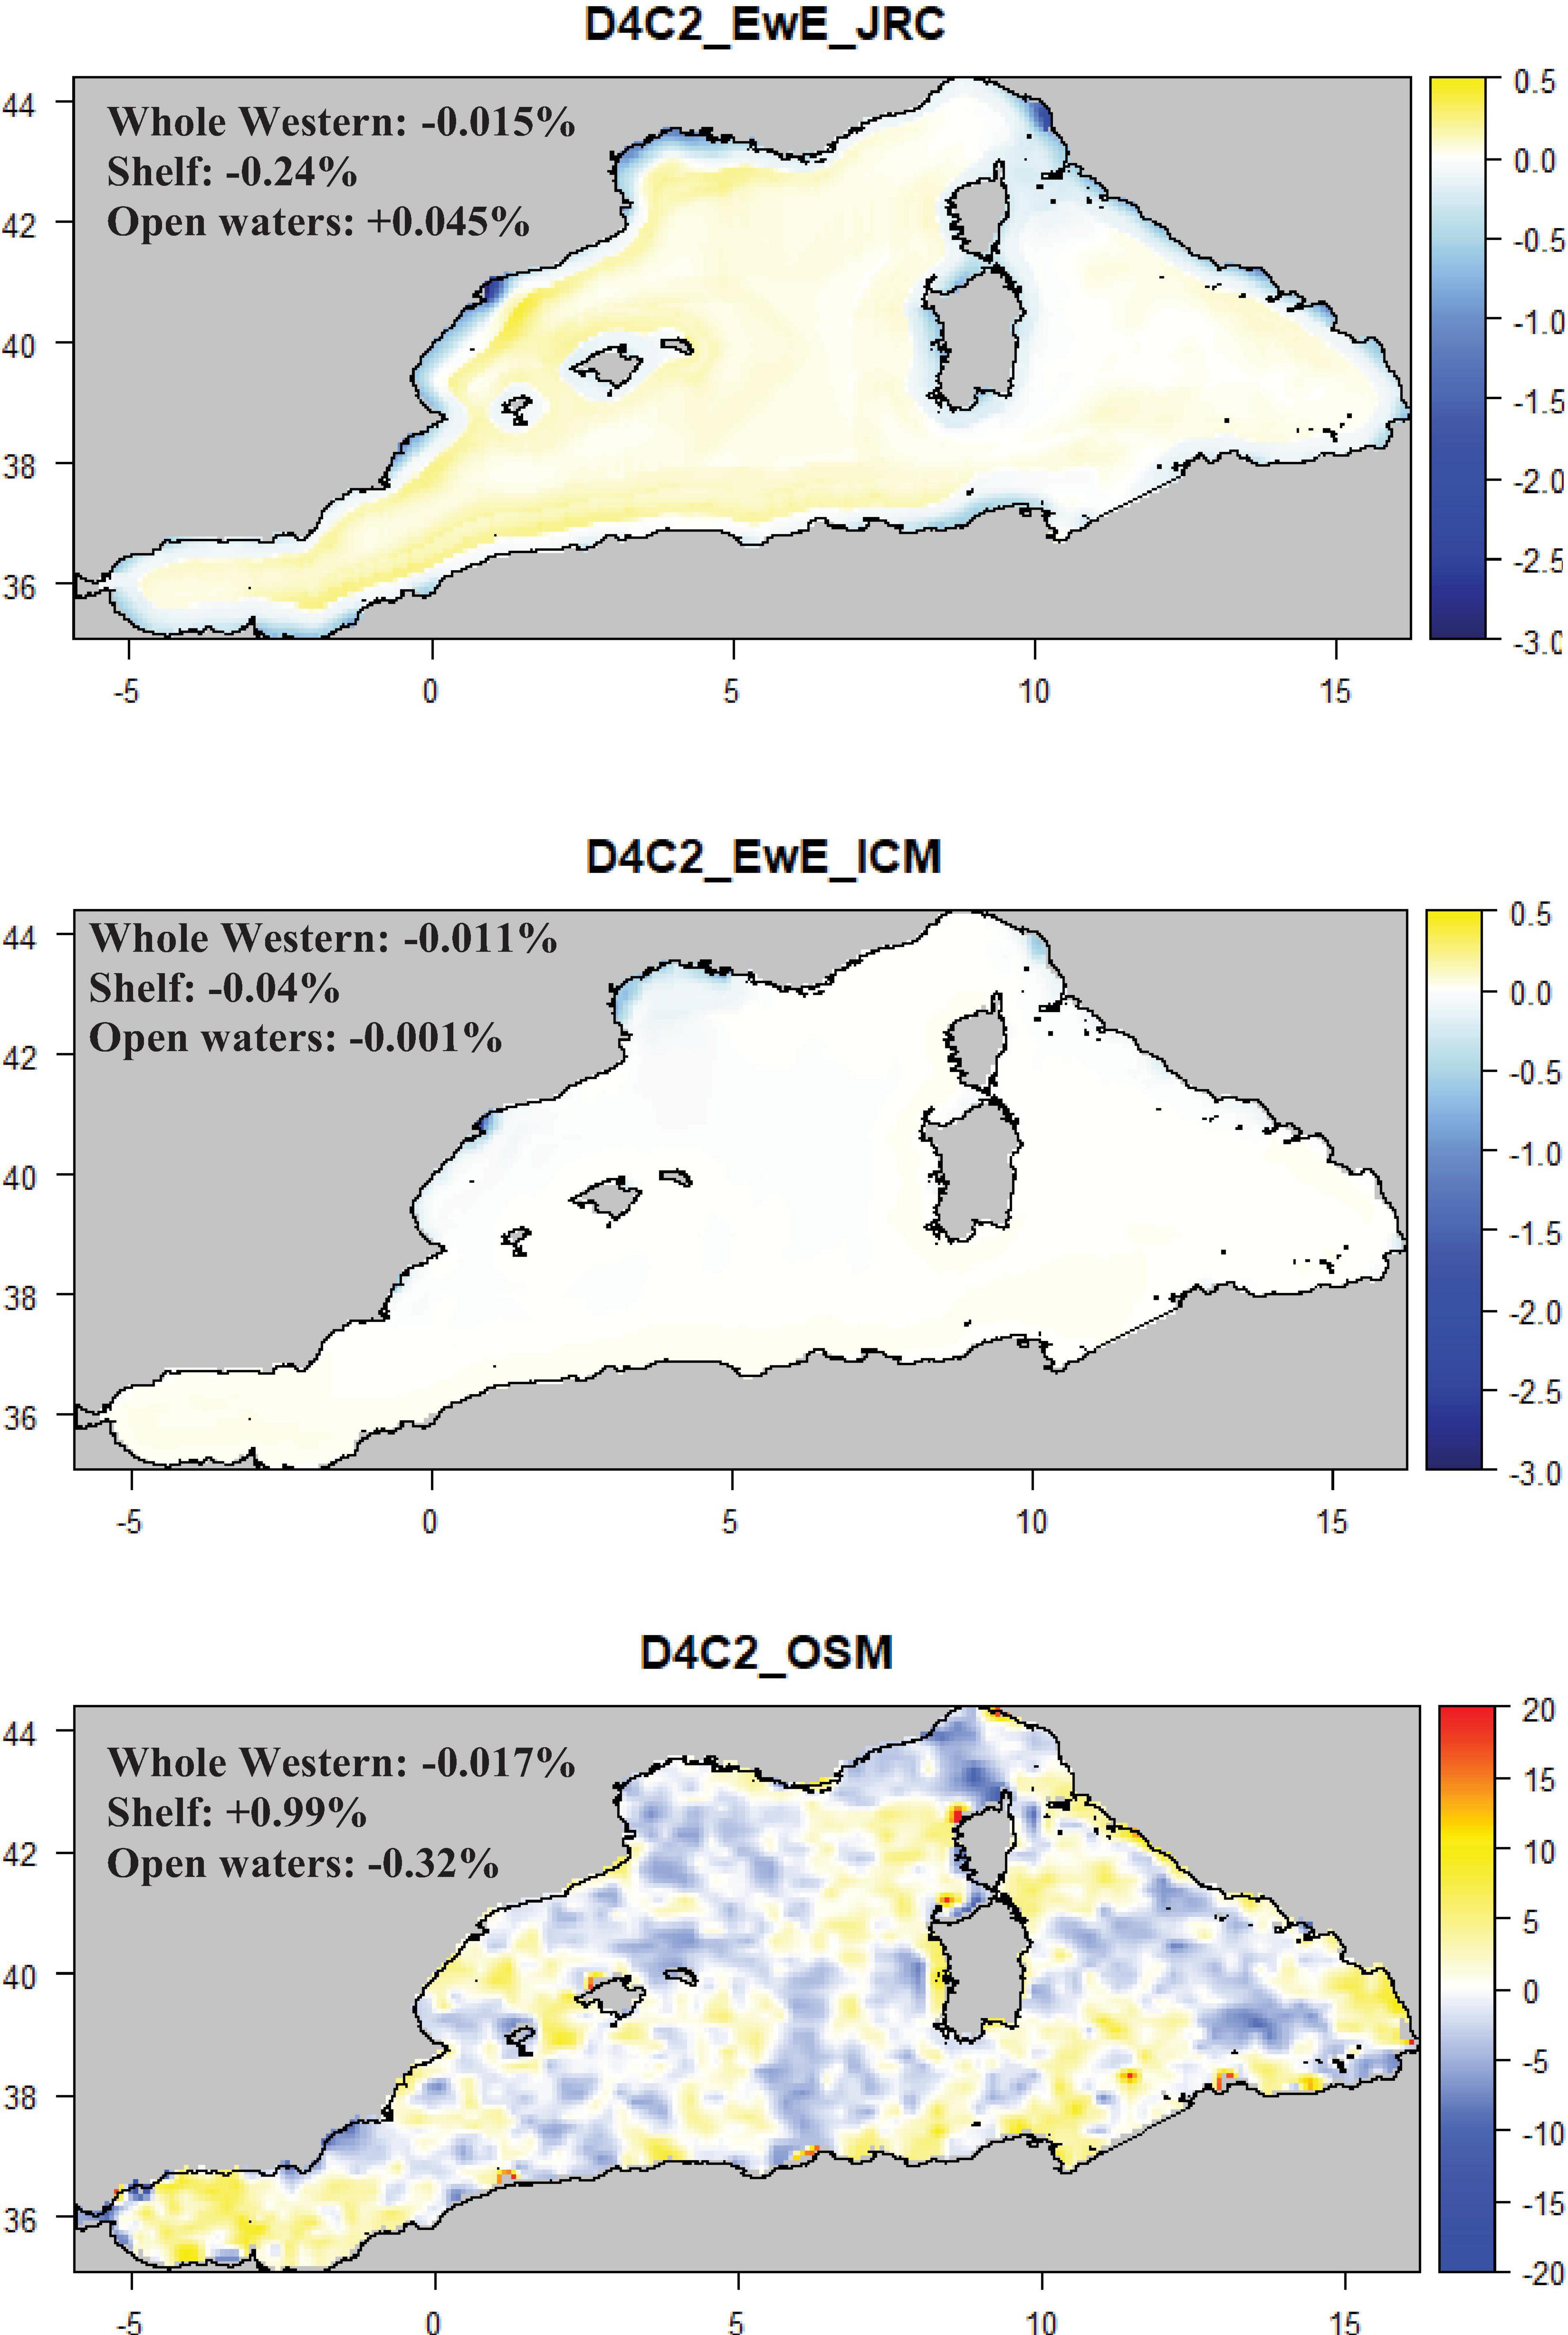
Figure 5. Maps representing the mean change (%) for the Small pelagic fish biomass (D4C2) per model type. Mean values were calculated considering the whole Western sub-region, shelves (<200 m) and open waters (>200 m). Note that the color scale of D4C2_OSM is different from the one of D4C2_EwE_JRC/ICM.
The species diversity index (D4C1) (Supplementary Figure S3) showed good agreement in the direction of change but differences in the amplitude. Only a marginal reduction (between −0.1 and −2%) was depicted by the available models around the continental shelf of the Gulf of Lion, Northern Spain and the Balearic islands and a slight increase along the coasts of the Gulf of Lion and the North Tyrrhenian Sea. For the small pelagic fish biomass (D4C2), two out of the three available models showed a decrease along European coastlines with the highest negative values (around −3%) concentrated around the Gulf of Lion, Northern Spain and the North Tyrrhenian region (Figure 5). In these models the continental shelves were the most negatively impacted areas. A different pattern was found using the Western Mediterranean Sea from the Osmose (West_OSM) model, where high variability was observed in the whole sub-region with open waters more impacted than shelf areas (Figure 5).
The spatial coherence for the small pelagic fish biomass was heterogeneous for the whole sub-region with an approximate equal percentage of decrease (45%) and increase (55%) (Figure 6 and Supplementary Figure S6). When looking at shelves and open waters, all or most models showed that 69% of the grid cells were associated with a decrease (shelves) and 61% associated to an increase (open waters) (Figure 6 and Supplementary Figure S6).
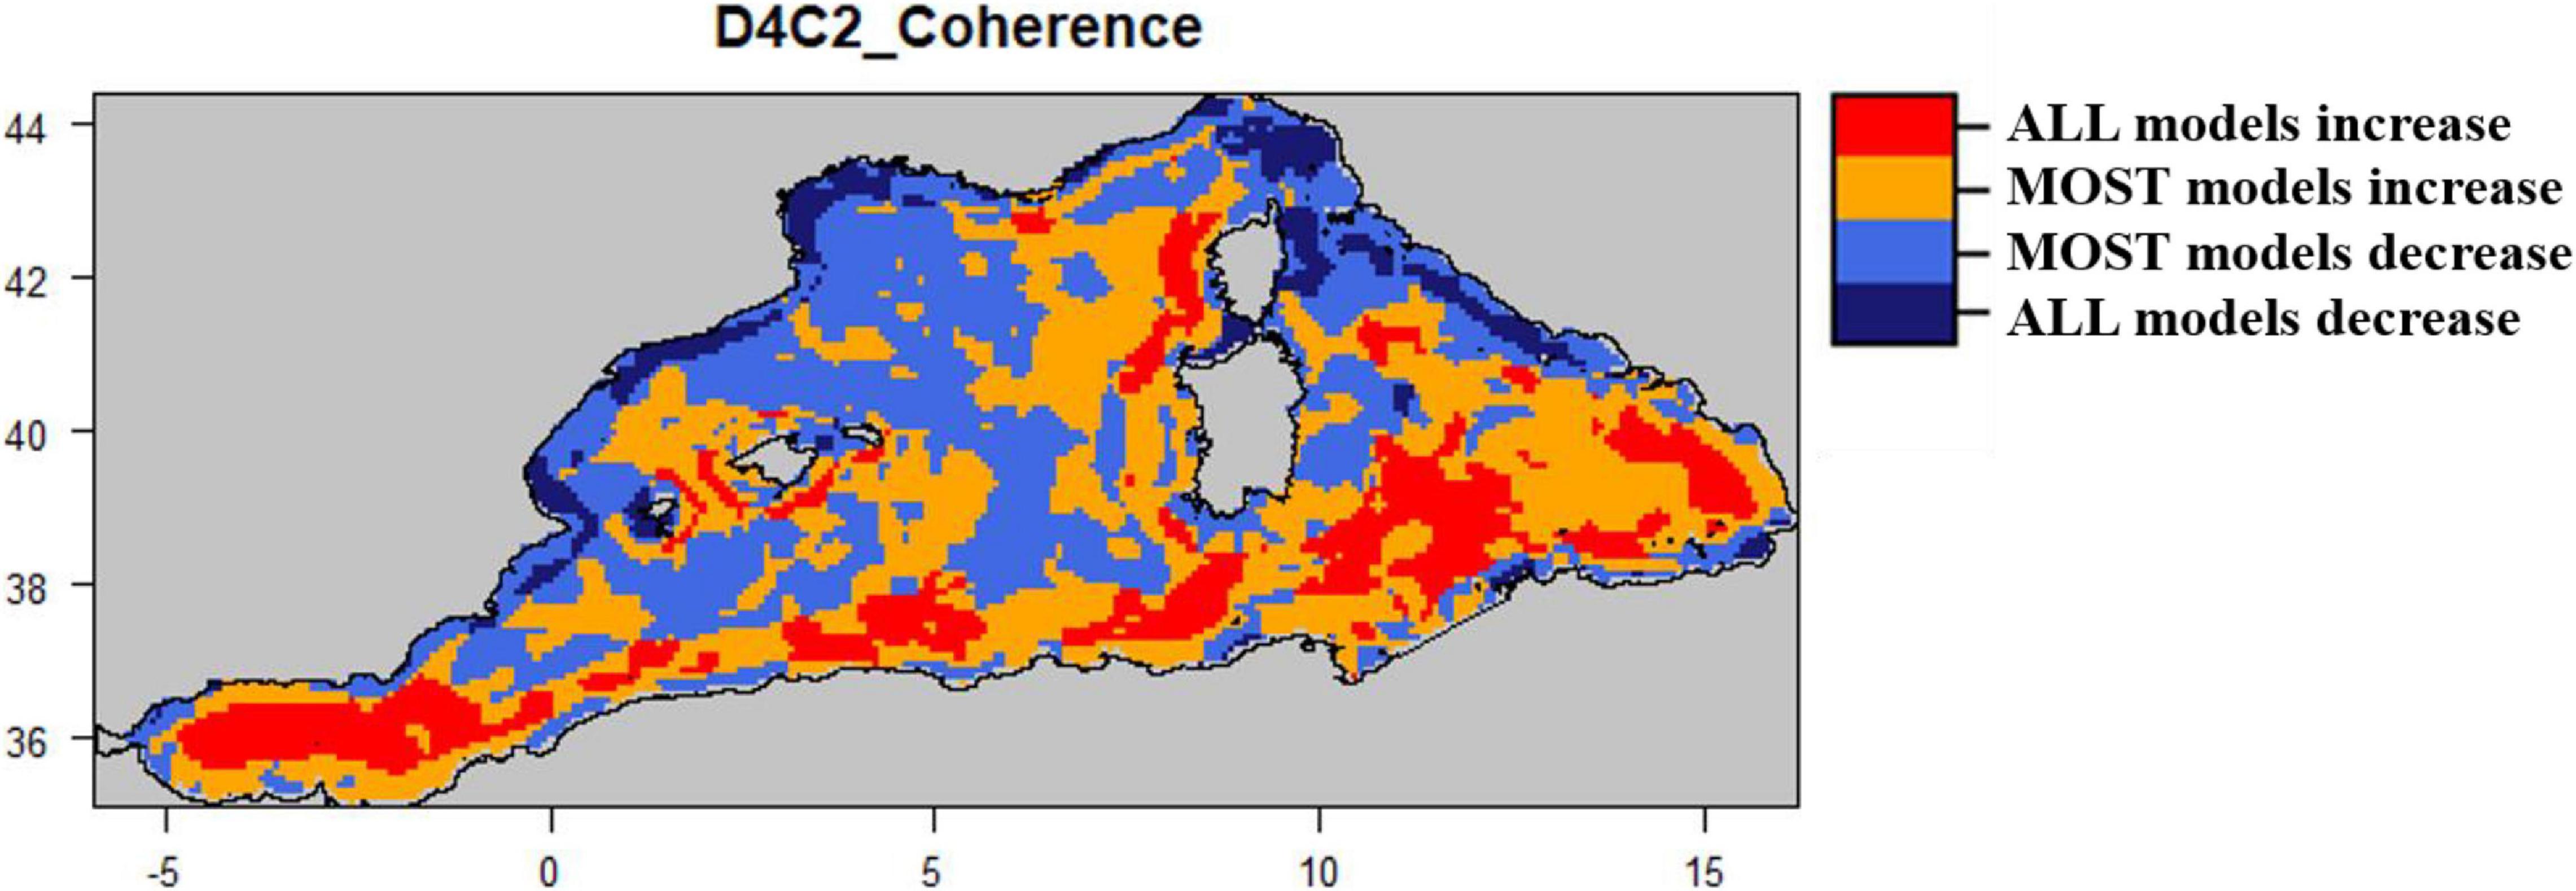
Figure 6. Coherence map for Small pelagic fish biomass (D4C2) which shows where all or most models (2 out of three) agree on the relative change trend.
TL Indicators—Spatial Scale
The West_OSM and West_ICM models suggested a slight increase of both trophic level indicators (Figure 7 and Supplementary Figure S4) in all the assessed areas (whole region, shelf, open waters) with high variability in both models for the TL of the community (mTLco; between −4 and +10%) (Figure 7) and for TL of the catches in the Osmose model (mTLc; between −6% and +4%) (Supplementary Figure S4). Conversely, the West_JRC model showed a slight decrease in mTLco and mTLc particularly in the shelf areas (mTLco: ∼−0.011%; mTLc: ∼−0.016%) and around the coastal areas of the Gulf of Lion, Northern Spain and the North Tyrrhenian Sea (mTLco: ∼−0.3%; mTLc: ∼ −0.2%).
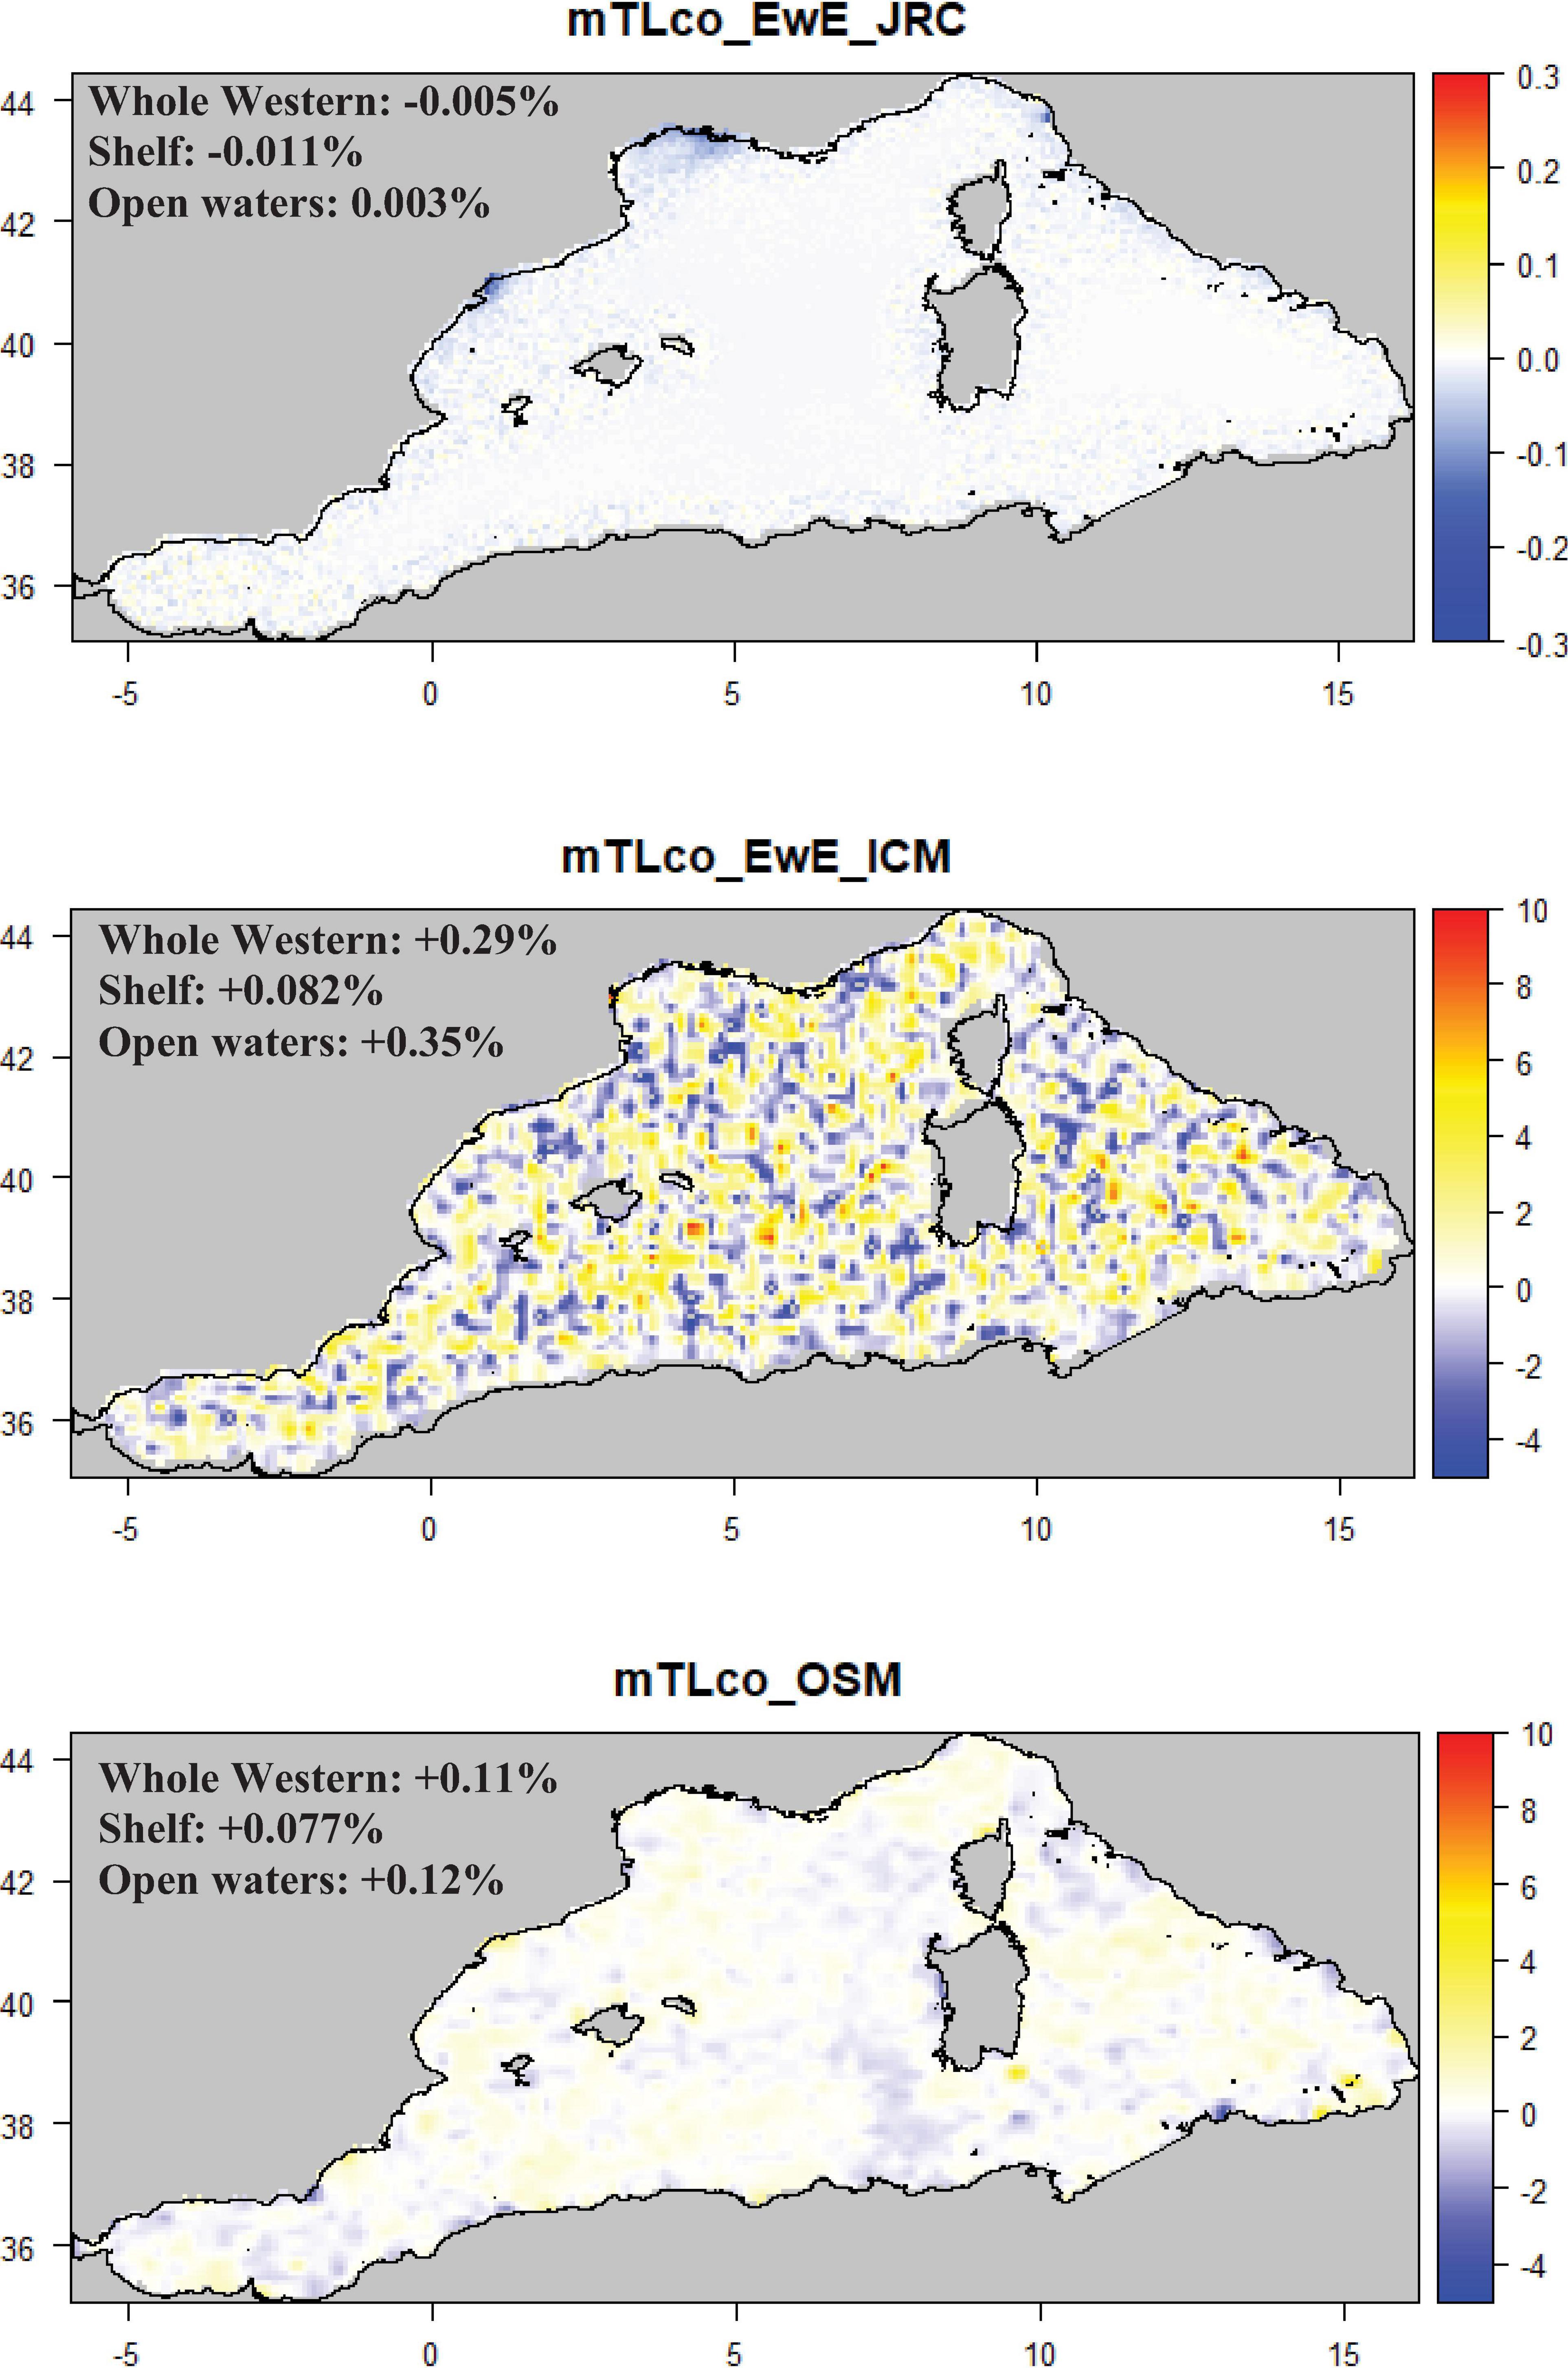
Figure 7. Maps representing the mean change (%) for the Mean trophic level of the community (mTLco) per model type. Mean values were calculated considering the whole Western sub-region, shelves (<200 m) and open waters (>200 m). Note that the color scale of mTLco_EwE_JRC is different from the one of mTLco_EwE_ICM and mTLco_OSM.
The spatial coherence for the mTLco was extremely heterogeneous for all the areas (the whole sub-region, shelves and open waters). Here, 55% of the grid cells were associated with a decrease in mTLco while 45% were associated with an increase (Supplementary Figures S5, S6). In all models, ca. 70% of the cell were associated with a decrease in TLc (Supplementary Figures S5, S6).
Discussion
Mean Change in MSFD Criteria and TL Indicators
This study provides a first pan-European assessment of the impact of nutrient management scenarios on marine ecosystems and related marine resources. The reduction of nutrients from river run-off showed no substantial changes in the structure and function of the HTL ecosystem models included. From a regional MSFD perspective, the mean change of SSB of commercially important small pelagic fish species (D3C2) and small pelagic fish biomass (D4C2) showed the highest decrease if only with values below 2.5%. Interestingly, all the available models confirmed a decline in the biomass of commercial small pelagic fish species among the main MSFD regions, suggesting that a reduced primary production as a result of nutrient reductions (Table 1), might negatively influence the dynamics of these fish stocks, although only modestly.
This phenomenon has already been observed in other systems as shown by Breitburg et al. (2009) and de Mutsert et al. (2016). Population dynamics of small pelagic fishes are tightly coupled to the dynamics of their food; i.e., plankton. If nutrient levels do not lead to strong adverse environmental impacts such as anoxia, harmful algal blooms and shifts in the zooplankton community, then a reduction in nutrients eventually leads to a reduction in food availability for small pelagic fishes. When fishing pressure (top down effect) on small pelagics is combined with this reduced resource availability (bottom up effect), then a decline of small pelagic fishes can be expected (Ramírez et al., 2018). Biomass variability of small pelagic species may be linked to overexploitation, climate change and other environmental factors. Because of their rapid growth and short lifespan, small pelagic fishes, and especially their recruitment success (Brosset et al., 2017), are vulnerable to climate and environmental forcing (Alheit et al., 2019; Saraux et al., 2019; Tsikliras et al., 2019). However, the potential decrease in SSB of commercially important stocks might be largely compensated by a decrease in fishing mortality (Froese et al., 2018), assuming low predator pressure, and improved size selectivity of the fisheries, notably in the Mediterranean Sea (e.g., Colloca et al., 2013).
When looking at the biomass of commercial stocks and non-commercial small pelagic fish species, the pattern was similar to the mean change of SSB of commercially important stocks (D3C2), but with larger variability across regions/sub-regions/small areas within an MSFD region. Variability across models might be related to the structure of the available models (e.g., some models might have more commercially important small pelagics than non-commercial species, or vice versa). Within each model, the higher variability for small pelagic fish biomass could be driven either by the different strength of species responses to lower productivity, and/or by the temporal variability of the responses. For example, in the West Coast of Scotland, this study showed that the biomass of small pelagic fishes (herring, sprat and horse mackerel) declined with lower ecosystem productivity (bottom-up control). However, sprat, which has a relatively healthy stock and a high turnover rate in this ecosystem, quickly increased again after the initial decline due to an overall reduction in predation pressure (top-down controls). Despite differences in the way models were constructed, which could cause fundamental differences when comparing ecosystems (Libralato et al., 2010; Heymans et al., 2014), the majority of the ecosystem models projected decreases in small pelagic fish biomass. Hence, the differences in the structures of the models utilized in this study did not prevent diagnosing the most likely direction of change in European marine ecosystems under the nutrient reduction scenario.
For species diversity (D4C1), no clear responses were observed at a regional or sub-regional scale, except in the Baltic Sea with a slight increase and in the North-East Adriatic Sea with a decrease in diversity. The Baltic Proper was the only area that showed a slight increase in the two food-web criteria compared to the reference scenario; this might be related to the highly eutrophic nature of this ecosystem and the fact that a reduction of nutrient inputs might lead to an improvement of the marine environment e.g., better bottom oxygen levels, as observed in Saraiva et al. (2019) and Friedland et al. (2021), and thus better spawning conditions, leading to an increase in the Eastern Baltic cod stock. This response was not observed in other ecosystems that are also considered to be eutrophic such as the North-East Adriatic Sea, the Black Sea and the whole Adriatic Sea (from the JRC model) where nutrients reduction, mainly from the Po and Danube rivers, would reduce the assessed D3 and D4 criteria (Figure 2). The reduction in dissolved nutrients and primary production indicated by the biogeochemical models (Table 1) reflect these differences. In these systems the decrease in nutrient loads resulted in an average reduction in the primary production of 0.3% for the Baltic Sea, 3.4% for the Black Sea and 4.8% for the North-East Adriatic Sea. The differential changes observed in the marine environment of these food webs are reflected in the assessed HTL criteria.
The reason why these systems responded differently to a reduction in nutrient load is probably because the level of eutrophication observed in the Baltic Sea is worse than in other regional seas, as shown also by McQuatters-Gollop et al. (2009), and oxygen is one of the main ecosystem drivers (Ehrnsten et al., 2019) thus, the system is more prone to improve, even if little as in this case, than the others. Theoretical studies suggest that an increase in species diversity might occur when productivity shifts from high (eutrophic) to intermediate levels and predator and/or fishing pressure stays low to medium (Kondoh, 2001; Worm et al., 2002). In the case of the Baltic Proper, the increase was due to a reduction of nutrient input and partially to a lower predator pressure (seals) on cod, which increased due to improved oxygen conditions. By contrast, species diversity might decrease if the reduction of productivity is combined with high level of predation (predators and/or fishing), as in the case of the Black Sea and the Adriatic Sea.
The size and location of the studied ecosystems are also important. Coastal and shelf areas are more sensitive to environmental changes than larger sub-regional or regional ecosystems, since the former are at the interface between land and sea, and are subjected to a variety of anthropogenic pressures (e.g., eutrophication, fishing pressure, pollutants; Halpern et al., 2019; Duarte et al., 2020). The North-East Adriatic Sea, a small shelf and coastal ecosystem where bottom up processes are fundamental in the structure and function of the food web (Celić et al., 2018), is one of the most impacted marine system in the overall assessment (Table 1 and Figures 2, 3). The apparent susceptibility to the variation of nutrient input of this small shelf/coastal ecosystem might be also a consequence of the difficulties in compromising the spatial resolution of the LTL model with the small area represented. Adequate spatial resolution for both LTL and HTL would improve the representation of ecosystem dynamics for small shelves and coastal areas (Solidoro et al., 2010).
The relative contribution of river input in the total provision of nutrients, and hence primary production in the marine environment, may also control to a large extent the intensity of impacts affecting the pelagic fish community. For instance, the larger decline in small pelagic fishes observed in the North Sea compared to the Celtic Sea might be the result of the North Sea having proportionally larger riverine discharges and greater levels of mixing (Heath and Beare, 2008; Holt et al., 2012) stimulating pelagic production and the pelagic pathway in the ecosystem (Heath, 2005).
However, Pérez-Ruzafa et al. (2019, 2020) showed that in coastal lagoons and coastal areas the pelagic productivity might not reflect changes in nutrient input at sea. This is because the system could channel the production and main fluxes toward the benthic system (Agnetta et al., 2019 and Cresson et al., 2020), retaining excessive production in the sediment or exporting it outside the system (e.g., through species migration). These mechanisms might impede observing clear changes in the ecosystem (mainly in the pelagic indicators) despite fluctuations in nutrient input. Furthermore, although the surface of the shelf in each model domain was considered to account for the observed changes, the different proportion of coastal environments and coastal areas included in each model might have inevitable effects on coastal biogeochemical processes (Table 1) cascading up in the food webs (Figures 2, 3) and partially explaining the observed differential changes.
In addition, the stronger reduction in total nitrogen and phosphorus in the land-sea interface rather than in the dissolved nutrients at sea, [as shown in Table 1 and in more details in Friedland et al. (2021)], indicate that marine biogeochemical systems depend not only on total nitrogen and phosphorus from riverine inputs, but also on the internal nutrient dynamics, e.g., mixing and stratification of DIN and DIP from deeper layers. Therefore, it is expected that reducing one input source (river) does not relate to a 1:1 reduction of marine (dissolved) nutrients at sea. This could explain the little reduction of primary production and the little impact of these changes on the HTL criteria/indicators.
The TL indices assessed in this study, the trophic level of the community (mTLco) and the trophic level of landed catches (TLc), showed little variation (depending on the scale considered) when applying these nutrient management measures. Shannon et al. (2014) already reported no clear pattern or response of TL-based indicators to changes in Chl-a, suggesting also that these indicators might not necessarily reflect changes at the bottom of the food web. According to Heymans et al. (2014), the trophic level of the catch is highly influenced by ecosystem traits such as latitude, basins and depth, which should be taken into account when evaluating these indicators as proxy of food web dynamics. Coll et al. (2016) highlighted the usefulness of the trophic level of the community indicator in assessing the impact of fishing on the whole ecosystem. However, our study shows that this index is not sensitive enough to capture changes in the food web from environmental drivers, such as nutrients and associated ecosystem productivity, as is also observed by Fu et al. (2019). This result might be related to the fact that bottom-up modifications, such as those induced by changes in nutrient inputs, are not as evident in the food chain as top-down forces, which generally resonate beyond the planktivore level, causing trophic cascades (Borer et al., 2006).
In addition, the weak responses of some of the criteria/indicators to changes in nutrients might be due to the short time series of forcing data utilized in this assessment. It is well known that ecosystems that accumulated nutrients during eutrophication require long recovery times to see large effects of load changes on ecosystem dynamics (Moloney et al., 2010; Murray et al., 2019). Thus, limiting the simulations to 8 years could have impeded a clear cause-effect relationship. This limitation was also highlighted in the results of LTL modules (Friedland et al., 2021; Grizzetti et al., 2021) which showed that 8 years of simulations were not enough to reach a new equilibrium. The internal nutrient dynamics and long residence times hampered the effect of the nutrient input reductions in the assessed ecosystems. Further efforts should be made to assess the potential impact of longer time series of changed nutrient loads in the various EU ecosystems.
It is also important to acknowledge that coastal processes are not well represented by the spatial models available here (which include both HTL and LTL models), e.g., the responses of species fished near the coast such as European seabass, Dicentrarchus labrax, or Black seabream, Spondyliosoma cantharus, are not well captured in these models. Similarly, potential improvements due to reductions in eutrophication in the pelagic habitat of coastal spawning species such as pikeperch, Stizostedion lucioperca, are not captured by the whole-sea models. The impact of bottom up forces on the marine food web might also be difficult to predict if inedible autotroph species are not properly modeled. These, in fact, might act as trophic dead-end species (Akoglu et al., 2014) or nutrient “sponges” (Murdoch et al., 1998), reducing the carrying capacity of edible species and, consequently, their trophic role (Murdoch et al., 1998; Borer et al., 2006; Akoglu et al., 2014). Finally, most of the models used in this exercise did not account for changes in dissolved oxygen (DO) impacting benthic and pelagic organisms/functional groups (e.g., impact on metabolism and recruitment success), which is another important component of eutrophication. This requires further research in the future.
Mean Change in MSFD Criteria and TL Indicators at Spatial Scale
This study assessed the impact of changes in nutrient concentrations on the spatially explicit ecosystem model of the Western Mediterranean sub-region. Our analysis confirmed that coastal and shelf ecosystems will be the most impacted when nutrients are reduced. Two out of three models suggested a slight decrease, more or less pronounced depending on the model/area considered, along the coasts/shelves of the Western Mediterranean Sea. These results are in line with previous studies that showed how freshwater pollution control measures will not impact the NW Mediterranean marine ecosystem at large, given the relatively smaller importance of river-borne nutrients for the marine productivity in the area (Macias et al., 2018a).
When inspecting change in the spawning stock biomass of European pilchard (D3C2) or the biomass of small pelagic fishes (D4C2), the two available spatial EwE models confirmed a slight decline along the continental shelf for both criteria and a marginal increase in open waters for small pelagic fishes. Yet, spatial differences were detected between the two models which could be related to the model structure and/or to the drivers used to spatially distribute the marine species and condition growth and consumption (such as changes in sea temperature). Ecosystem productivity, together with other environmental drivers such as temperature and salinity, are important factors affecting the distribution of small pelagic fishes (Bonanno et al., 2014; Quattrocchi et al., 2016; Quattrocchi and Maynou, 2017) so, including or excluding these factors may produce different outputs. The Osmose model, on the other hand, showed a different picture from the two EwE models, highlighting no clear spatial patterns among the criterion and TL indicators assessed. There are three main explanations for these differences. First, Osmose and EwE models differed in terms of model structure, process formulations (e.g., trophic assumptions) and parameterization (e.g., spatial distribution of species), which can lead to marked differences in the projections (Travers et al., 2010; Smith et al., 2015). Second, in the Osmose model, predation is a size-based and opportunistic process, which tends to buffer and dilute, via the numerous trophic links, the direct effects of changes in primary and secondary productions on the biomass of predators such as small pelagic fishes (Travers et al., 2010; Smith et al., 2015). As suggested by Travers et al. (2010), this predation formulation makes the system modeled by Osmose more variable and resilient to perturbations (nutrients reduction measures here). Third, the Osmose model was forced by the biomass of six phyto- and zoo-planktonic groups. Each group responded differently in time and space to changes in nutrient concentrations, which may have led to more heterogeneous spatio-temporal changes in the criteria considered. The spatial analysis confirmed the results obtained from the mean change for the TL indices and the species diversity index (see section “Mean Change in MSFD Criteria and TL Indicators”), with weak signals in all the assessed spatial compartments.
Overall our study confirmed that spatial modeling is still a challenging component of HTL ecosystem approaches as previously shown (Piroddi et al., 2015). Yet, because it is a fundamental aspect for guiding policy decisions (Liquete et al., 2016), its importance has increased considerably in recent years. Despite their ascertained importance in supporting policy and policy makers, spatial ecosystem models covering the entire food web from nutrients, phytoplankton to top predators, particularly at large scale, have hardly ever been utilized in the policy making process because of their high level of uncertainty (Fulton, 2010). Several studies have suggested possible ways (e.g., Bayesian network; Paradinas et al., 2015; Coll et al., 2019) to reduce specific aspects of such uncertainty. One of these approaches is the use of model ensembles to increase the reliability of model predictions, estimate the associated uncertainty (e.g., lack of spatial distribution data for many fish species and many marine ecosystems) and better assist our policies (Boyce et al., 2020). Our study, while going in this direction, highlights current challenges to fully implement such an ensemble framework in the context of the European Regional seas, because of the limited number of available spatial HTL models. The same area is rarely covered by more than one model, and existing models are not structured following a standardized approach for inter-comparison of results. Future work should address these shortcomings, benefiting from recent novel modeling developments (Spence et al., 2018), protocols for comparative modeling ensembles (Tittensor et al., 2018), and future opportunities for modeling development under the new Decade of Ocean Science for Sustainable Development (2021–2030) (Heymans et al., 2020).
Using Ecosystem Models to Support EU Marine Policies
This study investigated the effects of applied inland management measures that aim to reduce nutrient pollution in the marine environment. Using a broad set of HTL marine ecosystem models covering most of the European seas, this study was able to assess the response of these marine ecosystems to land-based measures using the criteria defined by the GES Decision (European Commission, 2017). The MSFD Descriptors and criteria have been designed to directly support and facilitate Member States in the assessment and reporting of GES. When trying to align the available modeling tools to such regulation, some difficulties were encountered. For example, not all models included species diversity explicitly (such as single species of dolphins or seabirds) and for this reason, D1 criteria could not be assessed in this study. However, the species diversity indices, which in the legislation are associated to the integrative Food Web Descriptor (D4), could also be used to evaluate the state of D1. Other modeled indicators have the potential to be useful for assessing GES (Tam et al., 2017), if easily interpretable, capable of describing food web changes and sensitivity to pressures and should be provided to policy makers to complement the assessments of the marine environment. In addition, the scale of assessments defined by the different policies (e.g., Common Fisheries Policy [CFP], MSFD, WFD) is specific for specific indicators (e.g., for eutrophication, one of the required scales is the coastal zone defined as one nautical mile from the coast; for fisheries, the scale is the FAO divisions/subdivisions) and should be assessed, if possible, using the existing modeling tools but it is not a binding requirement. Such scales are, in fact, used by Member States in their monitoring programs and reporting of GES. Overall, the role and strength of marine ecosystem models in support policies should be to: (1) highlight issues that cut across criteria/indicators and descriptors; (2) evaluate the responses of indicators to single or multiple stressors; (3) provide decision makers with a tool that can assess compartments of the marine ecosystems not directly measurable by current monitoring programs; and (4) evaluate the response of ecosystems to potential management measures.
Another important aspect where ecosystem models can support policy is in the setting of meaningful threshold/target values. As highlighted by Piroddi et al. (2015), there is a lack of tested and validated threshold/target values compliant with specific legal requirements. This is mainly due to disagreements among stakeholders in the settings of targets, which currently limits the full assessment of specific measures on marine ecosystems using the modeling tools.
Conclusion and Perspectives
This study suggests that improved nutrient management, in line within European directives to preserve and/or recover the status of coastal and marine water status, will have little impact on the assessed HTL marine ecosystems. Riverine nutrient discharge, though, is just one of many stressors impacting our seas and further modeling studies should investigate the impact from synergistic and antagonistic stressors. Pressures like climate change, overfishing, chemical pollutants and plastics are expanding rapidly throughout the world (Halpern et al., 2019; Duarte et al., 2020). Thus, a holistic approach to marine management, such as that provided by the MSFD, is essential. Mechanistic modeling tools, like the ones used in this study, have the capabilities of assessing and providing useful information on the impacts of cumulative anthropogenic pressures on every trophic level of a marine ecosystem, and evaluating short/long term forecast of selected policy measures. This pan-European ensemble modeling study represents the first exercise for large scale policy evaluation within the EU framework. This work gives indications for further improvement of modeling tools, such as standardization of model evaluation, their sensibility and creation of model ensembles that will provide reasonable confidence intervals for policy making decisions.
In 2019, the United Nations (UN) declared the Decade on Ecosystem Restoration with the purpose of “recognizing the need to massively accelerate global restoration of degraded ecosystems, to fight the climate heating crisis, enhance food security, provide clean water and protect biodiversity on the planet” and in 2021, the UN Decade of Ocean Science for Sustainable Development will begin, aiming to “developing scientific knowledge, building infrastructure and fostering relationships for a sustainable and healthy ocean.” It is now time to utilize these modeling tools to better guide and support decisions making by managers and policy makers.
Data Availability Statement
The original contributions presented in the study are included in the article/Supplementary Material, further inquiries can be directed to the corresponding author/s.
Author Contributions
CP developed the protocol, led the data analysis, plotting, and writing of the manuscript. BG provided riverine nutrient inputs. DM, EG-G, RF, SM, and OP provided nutrients and phytoplankton data at sea. All authors contributed to the writing of the article, provided model results and, discussions on the analysis.
Funding
BM-K acknowledges funding from EU-H2020 project ClimeFish (grant agreement 677039), CL received support from the project CAMPUS funded by the Natural Environment Research Council and Defra (grant agreement NERC UK NE/RE007241/1). FM was funded by the SOMBEE project of the joint BiodivERsA and Belmont Forum call “BiodivScen 2018” (ANR-18-EBI4-0003-01). KD received support from the National Academies of Sciences Engineering and Medicine Gulf Research Program (Early Career Research Fellowship). MC acknowledges partial funding from the European Union’s Horizon 2020 Research and Innovation Programme under grant agreement no 869300 (FutureMARES project). This work acknowledges institutional support of the ‘Severo Ochoa Centre of Excellence’ accreditation (CEX2019-000928-S).
Conflict of Interest
The authors declare that the research was conducted in the absence of any commercial or financial relationships that could be construed as a potential conflict of interest.
Supplementary Material
The Supplementary Material for this article can be found online at: https://www.frontiersin.org/articles/10.3389/fmars.2021.596797/full#supplementary-material
Footnotes
- ^ Geographical Sub-Areas: http://www.fao.org/gfcm/data/maps/gsas/en/
- ^ International Council for the Exploration of the Sea: http://www.fao.org/fishery/area/Area27/en
References
Abrams, P. A. (1993). Effect of increased productivity on the abundances of trophic levels. Am. Nat. 141, 351–371. doi: 10.1086/285478
Agnetta, D., Badalamenti, F., Colloca, F., D’anna, G., Di Lorenzo, M., Fiorentino, F., et al. (2019). Benthic-pelagic coupling mediates interactions in Mediterranean mixed fisheries: an ecosystem modeling approach. PLoS One 14:e0210659. doi: 10.1371/journal.pone.0210659
Ainsworth, C. H., and Pitcher, T. J. (2006). Modifying Kempton’s species diversity index for use with ecosystem simulation models. Ecol. Indic. 6, 623–630. doi: 10.1016/j.ecolind.2005.08.024
Akoglu, E., Salihoglu, B., Libralato, S., Oguz, T., and Solidoro, C. (2014). An indicator-based evaluation of Black Sea food web dynamics during 1960–2000. J. Mar. Syst. 134, 113–125. doi: 10.1016/j.jmarsys.2014.02.010
Alheit, J., Gröger, J., Licandro, P., Mcquinn, I. H., Pohlmann, T., and Tsikliras, A. C. (2019). What happened in the mid-1990s? The coupled ocean-atmosphere processes behind climate-induced ecosystem changes in the Northeast Atlantic and the Mediterranean. Deep Sea Res. Part II Top. Stud. Oceanogr. 159, 130–142. doi: 10.1016/j.dsr2.2018.11.011
Bauer, B., Horbowy, J., Rahikainen, M., Kulatska, N., Müller-Karulis, B., Tomczak, M. T., et al. (2019). Model uncertainty and simulated multispecies fisheries management advice in the Baltic Sea. PLoS One 14:e0211320. doi: 10.1371/journal.pone.0211320
Bauer, B., Meier, H. M., Casini, M., Hoff, A., Margoński, P., Orio, A., et al. (2018). Reducing eutrophication increases spatial extent of communities supporting commercial fisheries: a model case study. ICES J. Mar. Sci. 75, 1306–1317. doi: 10.1093/icesjms/fsy003
Bonanno, A., Giannoulaki, M., Barra, M., Basilone, G., Machias, A., Genovese, S., et al. (2014). Habitat selection response of small pelagic fish in different environments. Two examples from the oligotrophic Mediterranean Sea. PLoS One 9:e101498. doi: 10.1371/journal.pone.0101498
Borer, E. T., Halpern, B. S., and Seabloom, E. W. (2006). Asymmetry in community regulation: effects of predators and productivity. Ecology 87, 2813–2820. doi: 10.1890/0012-9658(2006)87[2813:aicreo]2.0.co;2
Boyce, D. G., Lotze, H. K., Tittensor, D. P., Carozza, D. A., and Worm, B. (2020). Future ocean biomass losses may widen socioeconomic equity gaps. Nat. Commun. 11:2235.
Breitburg, D. L., Craig, J. K., Fulford, R. S., Rose, K. A., Boynton, W. R., Brady, D. C., et al. (2009). Nutrient enrichment and fisheries exploitation: interactive effects on estuarine living resources and their management. Hydrobiologia 629, 31–47. doi: 10.1007/s10750-009-9762-4
Brosset, P., Fromentin, J.-M., Van Beveren, E., Lloret, J., Marques, V., Basilone, G., et al. (2017). Spatio-temporal patterns and environmental controls of small pelagic fish body condition from contrasted Mediterranean areas. Prog. Oceanogr. 151, 149–162. doi: 10.1016/j.pocean.2016.12.002
Cai, W.-J., Hu, X., Huang, W.-J., Murrell, M. C., Lehrter, J. C., Lohrenz, S. E., et al. (2011). Acidification of subsurface coastal waters enhanced by eutrophication. Nat. Geosci. 4:766. doi: 10.1038/ngeo1297
Cardoso, A. C., Cochrane, S., Doerner, H., Ferreira, J. G., Galgani, F., Hagebro, C., et al. (2010). “Scientific support to the European commission on the marine strategy framework directive,” in Management Group Report, ed. H. Piha (Luxembourg: European Commission and International Council for the Exploration of the Sea).
Celić, I., Libralato, S., Scarcella, G., Raicevich, S., Marèeta, B., and Solidoro, C. (2018). Ecological and economic effects of the landing obligation evaluated using a quantitative ecosystem approach: a Mediterranean case study. ICES J. Mar. Sci. 75, 1992–2003. doi: 10.1093/icesjms/fsy069
Christensen, V. (1996). Managing fisheries involving predator and prey species. Rev. Fish Biol. Fish. 6, 417–442. doi: 10.1007/bf00164324
Christensen, V., and Walters, C. J. (2004). Ecopath with Ecosim: methods, capabilities and limitations. Ecol. Model. 172, 109–139. doi: 10.1016/j.ecolmodel.2003.09.003
Cloern, J. E. (2001). Our evolving conceptual model of the coastal eutrophication problem. Mar. Ecol. Prog. Ser. 210, 223–253. doi: 10.3354/meps210223
Coll, M., Pennino, M. G., Steenbeek, J., Solé, J., and Bellido, J. M. (2019). Predicting marine species distributions: complementarity of food-web and Bayesian hierarchical modelling approaches. Ecol. Model. 405, 86–101. doi: 10.1016/j.ecolmodel.2019.05.005
Coll, M., Shannon, L., Kleisner, K., Juan-Jordá, M., Bundy, A., Akoglu, A., et al. (2016). Ecological indicators to capture the effects of fishing on biodiversity and conservation status of marine ecosystems. Ecol. Indic. 60, 947–962. doi: 10.1016/j.ecolind.2015.08.048
Colloca, F., Cardinale, M., Maynou, F., Giannoulaki, M., Scarcella, G., Jenko, K., et al. (2013). Rebuilding Mediterranean fisheries: a new paradigm for ecological sustainability. Fish Fish. 14, 89–109. doi: 10.1111/j.1467-2979.2011.00453.x
Cresson, P., Chouvelon, T., Bustamante, P., Bãnaru, D., Baudrier, J., Le Loc’h, F., et al. (2020). Primary production and depth drive different trophic structure and functioning of fish assemblages in French marine ecosystems. Prog. Oceanogr. 186:102343. doi: 10.1016/j.pocean.2020.102343
de Mutsert, K., Steenbeek, J., Lewis, K., Buszowski, J., Cowan, J. H. Jr., and Christensen, V. (2016). Exploring effects of hypoxia on fish and fisheries in the northern Gulf of Mexico using a dynamic spatially explicit ecosystem model. Ecol. Model. 331, 142–150. doi: 10.1016/j.ecolmodel.2015.10.013
De Roo, A., Bisselink, B., Guenther, S., Gelati, E., and Adamovic, M. (2020). “Assessing the effects of water saving measures on Europe’s water resources,” in BLUE2 project – Freshwater quantity. JRC Technical Report, (Ispra: Joint Research Centre).
Desmit, X., Thieu, V., Billen, G., Campuzano, F., Dulière, V., Garnier, J., et al. (2018). Reducing marine eutrophication may require a paradigmatic change. Sci. Total Environ. 635, 1444–1466. doi: 10.1016/j.scitotenv.2018.04.181
Diaz, R. J., and Rosenberg, R. (2008). Spreading dead zones and consequences for marine ecosystems. Science 321, 926–929. doi: 10.1126/science.1156401
Doney, S. C. (2010). The growing human footprint on coastal and open-ocean biogeochemistry. Science 328, 1512–1516. doi: 10.1126/science.1185198
Duarte, C. M., Agusti, S., Barbier, E., Britten, G. L., Castilla, J. C., Gattuso, J.-P., et al. (2020). Rebuilding marine life. Nature 580, 39–51.
Ehrnsten, E., Bauer, B., and Gustafsson, B. G. (2019). Combined effects of environmental drivers on marine trophic groups – A systematic model comparison. Front. Mar. Sci. 6:492. doi: 10.3389/fmars.2019.00492
European Commission (2008). Directive 2008/56/EC of the European Parliament and the Council Establishing a Framework for Community Action in the Field of Marine Environmental Policy (Marine Strategy Framework Directive). L 164/19-40. Brussels: European Commission.
European Commission (2017). Commission Decision (EU) 2017/848 of 17 May 2017 Laying Down Criteria and Methodological Standards on Good Environmental Status of Marine Waters and Specifications and Standardized Methods for Monitoring and Assessment, and Repealing Decision 2010/477/EU. L 125/43. Brussels: European Commission.
Friedland, R., Macias, D., Cossarini, G., Daewel, U., Estournel, C., Garcia-Gorriz, E., et al. (2021). Effects of nutrient management scenarios on marine eutrophication indicators: a Pan-European, multi-model assessment in support of the Marine Strategy Framework Directive. Front. Mar. Sci. 8:596126. doi: 10.3389/fmars.2021.596126
Froese, R., Winker, H., Coro, G., Demirel, N., Tsikliras, A. C., Dimarchopoulou, D., et al. (2018). Status and rebuilding of European fisheries. Mar. Pol. 93, 159–170. doi: 10.1016/j.marpol.2018.04.018
Fu, C., Xu, Y., Bundy, A., Grüss, A., Coll, M., Heymans, J. J., et al. (2019). Making ecological indicators management ready: assessing the specificity, sensitivity, and threshold response of ecological indicators. Ecol. Indic. 105, 16–28. doi: 10.1016/j.ecolind.2019.05.055
Fulton, E. A. (2010). Approaches to end-to-end ecosystem models. J. Mar. Syst. 81, 171–183. doi: 10.1016/j.jmarsys.2009.12.012
Fulton, E. A., Link, J. S., Kaplan, I. C., Savina−Rolland, M., Johnson, P., Ainsworth, C., et al. (2011). Lessons in modelling and management of marine ecosystems: the Atlantis experience. Fish Fish. 12, 171–188. doi: 10.1111/j.1467-2979.2011.00412.x
Garcia-Gorriz, E., Macias, D., Stips, A., and Miladinova-Marinova, S. (2016). JRC Marine Modelling Framework in Support of the Marine Strategy Framework Directive: Inventory of Models, Basin Configurations and Datasets. Luxemburg: European Commission.
Gårdmark, A., Lindegren, M., Neuenfeldt, S., Blenckner, T., Heikinheimo, O., Müller-Karulis, B., et al. (2013). Biological ensemble modeling to evaluate potential futures of living marine resources. Ecol. Appl. 23, 742–754. doi: 10.1890/12-0267.1
Grizzetti, B., Bouraoui, F., and Aloe, A. (2012). Changes of nitrogen and phosphorus loads to European seas. Glob. Change Biol. 18, 769–782. doi: 10.1111/j.1365-2486.2011.02576.x
Grizzetti, B., Vigiak, O., Udias, A., Aloe, A., Zanni, M., Bouraoui, F., et al. (2021). How EU policies could reduce nutrient pollution in European inland and coastal waters? EarthArXiv 10, 1–24. doi: 10.31223/X5CC91
Groendahl, S., and Fink, P. (2017). Consumer species richness and nutrients interact in determining producer diversity. Sci. Rep. 7, 1–8.
Halpern, B. S., Frazier, M., Afflerbach, J., Lowndes, J. S., Micheli, F., O’hara, C., et al. (2019). Recent pace of change in human impact on the world’s ocean. Sci. Rep. 9, 1–8.
Heath, M. R. (2005). Regional variability in the trophic requirements of shelf sea fisheries in the Northeast Atlantic, 1973–2000. ICES J. Mar. Sci. 62, 1233–1244. doi: 10.1016/j.icesjms.2005.04.010
Heath, M. R., and Beare, D. J. (2008). New primary production in northwest European shelf seas, 1960–2003. Mar. Ecol. Prog. Ser. 363, 183–203. doi: 10.3354/meps07460
Heymans, J. J., Bundy, A., Christensen, V., Coll, M., De Mutsert, K., Fulton, E., et al. (2020). The ocean decade: a true ecosystem modelling challenge. Front. Mar. Sci. 7:554573. doi: 10.3389/fmars.2020.554573
Heymans, J. J., Coll, M., Libralato, S., Morissette, L., and Christensen, V. (2014). Global patterns in ecological indicators of marine food webs: a modelling approach. PLoS One 9:e95845. doi: 10.1371/journal.pone.0095845
Heymans, J. J., Skogen, M., Schrum, C., and Solidoro, C. (2018). “Enhancing Europe’s capability in marine ecosystem modelling for societal benefit,” in European Marine Board Future Science Brief, eds K. E. Larkin, J. Coopman, A. Muñiz Piniella, P. Kellett, C. Simon, C. Rundt, et al. (Oostende: European Marine Board).
Holt, J., Butenschon, M., Wakelin, S., Artioli, Y., and Allen, J. (2012). Oceanic controls on the primary production of the northwest European continental shelf: model experiments under recent past conditions and a potential future scenario. Biogeosciences 9, 97–117. doi: 10.5194/bg-9-97-2012
Hyder, K., Rossberg, A. G., Allen, J. I., Austen, M. C., Barciela, R. M., Bannister, H. J., et al. (2015). Making modelling count-increasing the contribution of shelf-seas community and ecosystem models to policy development and management. Mar. Pol. 61, 291–302. doi: 10.1016/j.marpol.2015.07.015
IPBES (2016). “The methodological assessment report on scenarios and models of biodiversity and ecosystem services,” in Scenarios and Models Assessment, eds S. Ferrier, K. N. Ninan, P. Leadley, R. Alkemade, L. A. Acosta, H. R. Akçakaya, et al. (Bonn: Secretariat of the Intergovernmental Science-Policy Platform on Biodiversity and Ecosystem Services). doi: 10.1007/978-94-007-7088-1_16
Isbell, F., Reich, P. B., Tilman, D., Hobbie, S. E., Polasky, S., and Binder, S. (2013). Nutrient enrichment, biodiversity loss, and consequent declines in ecosystem productivity. Proc. Natl. Acad. Sci. U.S.A. 110, 11911–11916. doi: 10.1073/pnas.1310880110
Jara, V. C., Miyamoto, J. H. S., Da Gama, B. A., Molis, M., Wahl, M., and Pereira, R. C. (2006). Limited evidence of interactive disturbance and nutrient effects on the diversity of macrobenthic assemblages. Mar. Ecol. Prog. Ser. 308, 37–48. doi: 10.3354/meps308037
Kempton, R., and Taylor, L. (1976). Models and statistics for species diversity. Nature 262, 818–820. doi: 10.1038/262818a0
Kondoh, M. (2001). Unifying the relationships of species richness to productivity and disturbance. Proc. R. Soc. Lond. B Biol. Sci. 268, 269–271. doi: 10.1098/rspb.2000.1384
Leibold, M. A., Chase, J. M., Shurin, J. B., and Downing, A. L. (1997). Species turnover and the regulation of trophic structure. Annu. Rev. Ecol. Syst. 28, 467–494. doi: 10.1146/annurev.ecolsys.28.1.467
Libralato, S., Coll, M., Tempesta, M., Santojanni, A., Spoto, M., Palomera, I., et al. (2010). Food-web traits of protected and exploited areas of the Adriatic Sea. Biol. Conserv. 143, 2182–2194. doi: 10.1016/j.biocon.2010.06.002
Libralato, S., and Solidoro, C. (2009). Bridging biogeochemical and food web models for an End-to-End representation of marine ecosystem dynamics: The Venice lagoon case study. Ecol. Model. 220, 2960–2971. doi: 10.1016/j.ecolmodel.2009.08.017
Link, J. S., and Watson, R. A. (2019). Global ecosystem overfishing: Clear delineation within real limits to production. Sci. Adv. 5:eaav0474. doi: 10.1126/sciadv.aav0474
Liquete, C., Piroddi, C., Macías, D., Druon, J.-N., and Zulian, G. (2016). Ecosystem services sustainability in the Mediterranean Sea: assessment of status and trends using multiple modelling approaches. Sci. Rep. 6:34162.
Lotze, H. K., Tittensor, D. P., Bryndum-Buchholz, A., Eddy, T. D., Cheung, W. W., Galbraith, E. D., et al. (2019). Global ensemble projections reveal trophic amplification of ocean biomass declines with climate change. Proc. Natl. Acad. Sci. U.S.A. 116, 12907–12912.
Lynam, C. P., Uusitalo, L., Patrício, J., Piroddi, C., Queirós, A. M., Teixeira, H., et al. (2016). Uses of innovative modeling tools within the implementation of the Marine Strategy Framework Directive. Front. Mar. Sci. 3:182. doi: 10.3389/fmars.2016.00182
Macias, D., Garcia−Gorriz, E., and Stips, A. (2018a). Major fertilization sources and mechanisms for Mediterranean Sea coastal ecosystems. Limnol. Oceanogr. 63, 897–914. doi: 10.1002/lno.10677
Macias, D., Piroddi, C., Miladinova-Marinova, S., Garcia-Gorriz, E., Friedland, R., Parn, O., et al. (2018b). JRC Marine Modelling Framework in Support of the Marine Strategy Framework Directive: Inventory of Models, Basin Configurations and Datasets. Update 2018. Luxembourg: Publications Office of the European Union.
Maxwell, S. M., Hazen, E. L., Lewison, R. L., Dunn, D. C., Bailey, H., Bograd, S. J., et al. (2015). Dynamic ocean management: Defining and conceptualizing real-time management of the ocean. Mar. Pol. 58, 42–50. doi: 10.1016/j.marpol.2015.03.014
McQuatters-Gollop, A., Gilbert, A. J., Mee, L. D., Vermaat, J. E., Artioli, Y., Humborg, C., et al. (2009). How well do ecosystem indicators communicate the effects of anthropogenic eutrophication? Estuar. Coast. Shelf Sci. 82, 583–596. doi: 10.1016/j.ecss.2009.02.017
Moloney, C., Jarre, A., Kimura, S., Mackas, D., Maury, O., Murphy, E., et al. (2010). “Dynamics of marine ecosystems: ecological processes,” in Marine Ecosystems and Global Change, eds M. Barange, J. G. Field, R. P. Harris, E. E. Hofmann, R. I. Perry, and F. Werner (Oxford: Oxford University Press), 179–218. doi: 10.1093/acprof:oso/9780199558025.003.0007
Murdoch, W., Nisbet, R., Mccauley, E., Deroos, A., and Gurney, W. (1998). Plankton abundance and dynamics across nutrient levels: tests of hypotheses. Ecology 79, 1339–1356. doi: 10.1890/0012-9658(1998)079[1339:paadan]2.0.co;2
Murray, C. J., Müller-Karulis, B., Carstensen, J., Conley, D. J., Gustafsson, B. G., and Andersen, J. H. (2019). Past, present and future eutrophication status of the Baltic Sea. Front. Mar. Sci. 6:2. doi: 10.3389/fmars.2019.00002
Nixon, S. W. (2009). “Eutrophication and the macroscope,” in Eutrophication in Coastal Ecosystems, eds J. H. Andersen and D. J. Conley (Dordrecht: Springer), 5–19. doi: 10.1007/978-90-481-3385-7_2
Odum, E. P. (1969). The strategy of ecosystem development. Science 164, 262–270. doi: 10.1126/science.164.3877.262
Oksanen, L., Fretwell, S. D., Arruda, J., and Niemela, P. (1981). Exploitation ecosystems in gradients of primary productivity. Am. Nat. 118, 240–261. doi: 10.1086/283817
Paradinas, I., Conesa, D., Pennino, M. G., Muñoz, F., Fernández, A. M., López-Quílez, A., et al. (2015). Bayesian spatio-temporal approach to identifying fish nurseries by validating persistence areas. Mar. Ecol. Prog. Ser. 528, 245–255. doi: 10.3354/meps11281
Pauly, D., Christensen, V., Dalsgaard, J., Froese, R., and Torres, F. (1998). Fishing down marine food webs. Science 279, 860–863. doi: 10.1126/science.279.5352.860
Peck, M. A., Arvanitidis, C., Butenschön, M., Canu, D. M., Chatzinikolaou, E., Cucco, A., et al. (2018). Projecting changes in the distribution and productivity of living marine resources: a critical review of the suite of modelling approaches used in the large European project VECTORS. Estuar. Coast. Shelf Sci. 201, 40–55. doi: 10.1016/j.ecss.2016.05.019
Pérez-Ruzafa, A., Campillo, S., Fernández-Palacios, J. M., Garcia-Lacunza, A., Garcia-Oliva, M., Ibanez, H., et al. (2019). Long-term dynamic in nutrients, chlorophyll a, and water quality parameters in a coastal lagoon during a process of eutrophication for decades, a sudden break and a relatively rapid recovery. Front. Mar. Sci. 6:26. doi: 10.3389/fmars.2019.00026
Pérez-Ruzafa, A., Morkune, R., Marcos, C., Perez-Ruzafa, I. M., and Razinkovas-Baziukas, A. (2020). Can an oligotrophic coastal lagoon support high biological productivity? Sources and pathways of primary production. Mar. Environ. Res. 153:104824. doi: 10.1016/j.marenvres.2019.104824
Piroddi, C., Teixeira, H., Lynam, C., Smith, C., Alvarez, M., Mazik, K., et al. (2015). Using ecosystem models to assess biodiversity indicators in support of the EU Marine strategy framework directive. Ecol. Indic. 58, 175–191. doi: 10.1016/j.ecolind.2015.05.037
Proulx, M., and Mazumder, A. (1998). Reversal of grazing impact on plant species richness in nutrient−poor vs. nutrient−rich ecosystems. Ecology 79, 2581–2592. doi: 10.1890/0012-9658(1998)079[2581:rogiop]2.0.co;2
Quattrocchi, F., Mamouridis, V., and Maynou, F. (2016). Occurrence of adult anchovy in Catalonia (NW Mediterranean) in relation to sea surface conditions. Sci. Mar. 80, 457–466. doi: 10.3989/scimar.04413.24a
Quattrocchi, F., and Maynou, F. (2017). Environmental drivers of sardine (Sardina pilchardus) in the Catalan Sea (NW Mediterranean Sea). Mar. Biol. Res. 13, 1003–1014. doi: 10.1080/17451000.2017.1331039
Ramírez, F., Coll, M., Navarro, J., Bustamante, J., and Green, A. J. (2018). Spatial congruence between multiple stressors in the Mediterranean Sea may reduce its resilience to climate impacts. Sci. Rep. 8, 1–8.
Rose, K. A., Allen, J. I., Artioli, Y., Barange, M., Blackford, J., Carlotti, F., et al. (2010). End-to-end models for the analysis of marine ecosystems: challenges, issues, and next steps. Mar. Coast. Fish. 2, 115–130. doi: 10.1577/c09-059.1
Saraiva, S., Meier, H. M., Andersson, H., Höglund, A., Dieterich, C., Gröger, M., et al. (2019). Baltic Sea ecosystem response to various nutrient load scenarios in present and future climates. Clim. Dyn. 52, 3369–3387. doi: 10.1007/s00382-018-4330-0
Saraux, C., Van Beveren, E., Brosset, P., Queiros, Q., Bourdeix, J.-H., Dutto, G., et al. (2019). Small pelagic fish dynamics: a review of mechanisms in the Gulf of Lions. Deep Sea Res. II Top. Stud. Oceanogr. 159, 52–61. doi: 10.1016/j.dsr2.2018.02.010
Schlenger, A., Libralato, S., and Ballance, L. (2019). Temporal variability of primary production explains marine ecosystem structure and function. Ecosystems 22, 331–345. doi: 10.1007/s10021-018-0272-y
Shannon, L., Coll, M., Bundy, A., Gascuel, D., Heymans, J. J., Kleisner, K., et al. (2014). Trophic level-based indicators to track fishing impacts across marine ecosystems. Mar. Ecol. Prog. Ser. 512, 115–140. doi: 10.3354/meps10821
Shin, Y.-J., Rochet, M.-J., Jennings, S., Field, J. G., and Gislason, H. (2005). Using size-based indicators to evaluate the ecosystem effects of fishing. ICES J. Mar. Sci. 62, 384–396. doi: 10.1016/j.icesjms.2005.01.004
Smith, M., Fulton, E., Day, R., Shannon, L., and Shin, Y.-J. (2015). Ecosystem modelling in the southern Benguela: comparisons of Atlantis, Ecopath with Ecosim, and OSMOSE under fishing scenarios. Afr. J. Mar. Sci. 37, 65–78. doi: 10.2989/1814232x.2015.1013501
Solidoro, C., Cossarini, G., Libralato, S., and Salon, S. (2010). Remarks on the redefinition of system boundaries and model parameterization for downscaling experiments. Prog. Oceanogr. 84, 134–137. doi: 10.1016/j.pocean.2009.09.017
Spence, M. A., Blanchard, J. L., Rossberg, A. G., Heath, M. R., Heymans, J. J., Mackinson, S., et al. (2018). A general framework for combining ecosystem models. Fish Fish. 19, 1031–1042. doi: 10.1111/faf.12310
Stock, C. A., John, J. G., Rykaczewski, R. R., Asch, R. G., Cheung, W. W., Dunne, J. P., et al. (2017). Reconciling fisheries catch and ocean productivity. Proc. Natl. Acad. Sci. U.S.A. 114, E1441–E1449.
Tam, J. C., Link, J. S., Rossberg, A. G., Rogers, S. I., Levin, P. S., Rochet, M.-J., et al. (2017). Towards ecosystem-based management: identifying operational food-web indicators for marine ecosystems. ICES J. Mar. Sci. 74, 2040–2052. doi: 10.1093/icesjms/fsw230
Tittensor, D. P., Eddy, T. D., Lotze, H. K., Galbraith, E. D., Cheung, W., Barange, M., et al. (2018). A protocol for the intercomparison of marine fishery and ecosystem models: Fish-MIP v1. 0. Geosci. Model Dev. 11, 1421–1442.
Travers, M., Watermeyer, K., Shannon, L., and Shin, Y.-J. (2010). Changes in food web structure under scenarios of overfishing in the southern Benguela: comparison of the Ecosim and OSMOSE modelling approaches. J. Mar. Syst. 79, 101–111. doi: 10.1016/j.jmarsys.2009.07.005
Tsikliras, A. C., Licandro, P., Pardalou, A., Mcquinn, I. H., Gröger, J. P., and Alheit, J. (2019). Synchronization of Mediterranean pelagic fish populations with the North Atlantic climate variability. Deep Sea Res. II Top. Stud. Oceanogr. 159, 143–151. doi: 10.1016/j.dsr2.2018.07.005
Waide, R., Willig, M., Steiner, C., Mittelbach, G., Gough, L., Dodson, S., et al. (1999). The relationship between productivity and species richness. Annu. Rev. Ecol. Syst. 30, 257–300.
Ward, C. L., and McCann, K. S. (2017). A mechanistic theory for aquatic food chain length. Nat. Commun. 8:2028.
Worm, B., Lotze, H. K., Hillebrand, H., and Sommer, U. (2002). Consumer versus resource control of species diversity and ecosystem functioning. Nature 417, 848–851. doi: 10.1038/nature00830
Keywords: ecological modeling, hydrological modeling, hydrodynamic and biogeochemical modeling, higher trophic level modeling, ecological indicators, criteria, policy support
Citation: Piroddi C, Akoglu E, Andonegi E, Bentley JW, Celić I, Coll M, Dimarchopoulou D, Friedland R, de Mutsert K, Girardin R, Garcia-Gorriz E, Grizzetti B, Hernvann P-Y, Heymans JJ, Müller-Karulis B, Libralato S, Lynam CP, Macias D, Miladinova S, Moullec F, Palialexis A, Parn O, Serpetti N, Solidoro C, Steenbeek J, Stips A, Tomczak MT, Travers-Trolet M and Tsikliras AC (2021) Effects of Nutrient Management Scenarios on Marine Food Webs: A Pan-European Assessment in Support of the Marine Strategy Framework Directive. Front. Mar. Sci. 8:596797. doi: 10.3389/fmars.2021.596797
Received: 20 August 2020; Accepted: 11 February 2021;
Published: 23 March 2021.
Edited by:
Xosé Anxelu G. Morán, King Abdullah University of Science and Technology, Saudi ArabiaReviewed by:
Samuli Korpinen, Finnish Environment Institute (SYKE), FinlandAngel Pérez-Ruzafa, University of Murcia, Spain
Copyright © 2021 Piroddi, Akoglu, Andonegi, Bentley, Celić, Coll, Dimarchopoulou, Friedland, de Mutsert, Girardin, Garcia-Gorriz, Grizzetti, Hernvann, Heymans, Müller-Karulis, Libralato, Lynam, Macias, Miladinova, Moullec, Palialexis, Parn, Serpetti, Solidoro, Steenbeek, Stips, Tomczak, Travers-Trolet and Tsikliras. This is an open-access article distributed under the terms of the Creative Commons Attribution License (CC BY). The use, distribution or reproduction in other forums is permitted, provided the original author(s) and the copyright owner(s) are credited and that the original publication in this journal is cited, in accordance with accepted academic practice. No use, distribution or reproduction is permitted which does not comply with these terms.
*Correspondence: Chiara Piroddi, Y2hpYXJhLnBpcm9kZGlAZWMuZXVyb3BhLmV1; Y3Bpcm9kZGlAaG90bWFpbC5jb20=