Abstract
Passive acoustic monitoring is a well-established tool for researching the occurrence, movements, and ecology of a wide variety of marine mammal species. Advances in hardware and data collection have exponentially increased the volumes of passive acoustic data collected, such that discoveries are now limited by the time required to analyze rather than collect the data. In order to address this limitation, we trained a deep convolutional neural network (CNN) to identify humpback whale song in over 187,000 h of acoustic data collected at 13 different monitoring sites in the North Pacific over a 14-year period. The model successfully detected 75 s audio segments containing humpback song with an average precision of 0.97 and average area under the receiver operating characteristic curve (AUC-ROC) of 0.992. The model output was used to analyze spatial and temporal patterns of humpback song, corroborating known seasonal patterns in the Hawaiian and Mariana Islands, including occurrence at remote monitoring sites beyond well-studied aggregations, as well as novel discovery of humpback whale song at Kingman Reef, at 5∘ North latitude. This study demonstrates the ability of a CNN trained on a small dataset to generalize well to a highly variable signal type across a diverse range of recording and noise conditions. We demonstrate the utility of active learning approaches for creating high-quality models in specialized domains where annotations are rare. These results validate the feasibility of applying deep learning models to identify highly variable signals across broad spatial and temporal scales, enabling new discoveries through combining large datasets with cutting edge tools.
Introduction
In the marine environment, where limited light transmission restricts visual cues, cetaceans utilize sound for every aspect of their day-to-day lives, with all species of whales and dolphins making some sort of vocalization. Many cetacean vocalizations are identifiable to the species or even population level, enabling use of passive acoustic recorders to examine species occurrence and seasonality (e.g., Clark et al., 2002; Širović et al., 2003; Munger et al., 2008), population movements (e.g., Stafford et al., 1999; Burtenshaw et al., 2004), seasonality of call types (e.g., Winn and Winn, 1978; Oleson et al., 2007), and abundance (e.g., McDonald and Fox, 1999; Marques et al., 2013; Küsel et al., 2016). In particular, autonomous acoustic recorders can monitor remote or logistically difficult-to-reach ocean regions without the costly need for direct human observation. Long-term recording sites can also provide insights into historical changes in population occurrence and movement patterns (e.g., Davis et al., 2017), which is particularly important in light of increasing human impacts on the marine environment.
Improvements in passive acoustic recording technologies and reduction in equipment costs have resulted in exponentially increasing volumes of high-resolution acoustic data. New discoveries are now often limited by the time it takes to analyze the data rather than by the data collection itself. To address this challenge, scientists have been working to speed acoustic data analysis by automating cetacean call identification (Bittle and Duncan, 2013). For some species with stereotyped, repetitive calls, energy-based or statistical methods for detection and classification work quite well (Mellinger and Clark, 2000; Širović et al., 2003). However, many species have highly variable call types that require significant manual input to correctly classify (Bittle and Duncan, 2013), and automated detection of these vocalizations still often requires either initial fine tuning of the detector or post-processing of the detections in order to remove a high number of incorrectly identified calls.
Humpback whale (Megaptera novaeangliae) song presents a particularly challenging classification task. Male humpback whales sing long, complex songs (Payne and McVay, 1971; Winn and Winn, 1978). These songs are typically unique to each breeding population and year, with all males singing a similar song within each year at each breeding site (Winn et al., 1981; Payne, 1983; Garland et al., 2017). The complex nature of humpback song and its temporal population-level variability makes designing a generalized automated detector that can identify song across years, breeding sites, and different recording equipment and conditions extremely difficult. For this reason, evaluation of long term trends in humpback whale song presence is often conducted using coarse time scale manual assessment (e.g., Munger et al., 2012), power spectral density computation combined with manual annotation (e.g., Au et al., 2000; Ryan et al., 2019), frequency contour algorithms (e.g., Magnúsdóttir et al., 2014), or spectrogram cross-correlation (e.g., Vu et al., 2012). However, each method has drawbacks, including significant user input, high false positive rates, or low resolution. Helble et al. (2012) designed a generalized power-law (GPL) algorithm that addresses many of these limitations but which has limited classification ability when other biological signals are present in overlapping spectral bands.
Machine learning techniques have recently begun to provide improved detection and classification methods for a large variety of fields that were previously limited by challenges similar to those found in marine mammal acoustic monitoring. Deep learning (DL) is a recent advancement that combines feature extraction and selection, which was performed manually in conventional machine learning, and detection or classification into a single end-to-end model (LeCun et al., 2015). Convolutional neural networks (CNNs) rival human performance in some cases (LeCun et al., 2015), with residual networks (ResNets) providing marked improvements (He et al., 2016). These developments have led to significant advances across all sectors, with a growing number of ecological studies beginning to utilize CNNs (Weinstein, 2018). DL techniques have recently been applied to passive acoustic monitoring of marine mammals (Harvey, 2018), with models trained for classification of vocalizations of killer whales (Bergler et al., 2019), belugas (Zhong et al., 2020), sperm whales (Bermant et al., 2019), and right whales (Kirsebom et al., 2020; Shiu et al., 2020). However, one limitation of DL is the large number of human-annotated examples required to train a robust classifier that generalizes well to new data.
To date, marine mammal DL classifiers have focused on a single call type or region or were deployed on a relatively small dataset (a few hundred to a few thousand hours). We present here the development of a deep machine learning CNN model, using a process called active learning to increase the size and focus of the training data, to classify humpback whale vocalizations in an acoustic dataset of unprecedented temporal and spatial scale. The dataset (187,000 h of recordings) was collected across a diverse set of recording locations throughout the central and western Pacific over a long time scale (2005 to 2019). This is a particularly challenging classification task given the inter-population variability in humpback song type, as well as intra-population variability across years. Humpback whales within this region include at least two separate populations, though migratory movements are complex and detections within this network may also include whales from other populations. Efficient processing of our long-term dataset using DL provided a detailed view of the seasonal and long-term occurrence of whales within both known breeding areas and in regions where visual surveys are not feasible, and contributed to new insights into population movements and new hypotheses about population structure.
Materials and Methods
Acoustic recordings were collected at 13 sites in the North Pacific (Figure 1) using bottom-mounted High Frequency Acoustic Recording Packages (HARPs; Wiggins and Hildebrand, 2007). HARPs are equipped with an omni-directional hydrophone, with a flat (±2 dB) hydrophone sensitivity from 10 Hz to 100 kHz of −200 dB re V/μPa. Recording effort began in 2005 with long-term monitoring (>6 years) at 5 of the 13 sites. Monitoring duration at an individual site varied from just over a month to 13 years, with recording schedules ranging from continuous to 5 min of recording every 40 min. Recording files consisted of a sequence of 75 s blocks of audio, hereafter referred to as segments, with start times prescribed by the duty cycle. HARPs were deployed at depths between 111 and 1,266 m with an average deployment depth of 730 m. The raw data were typically sampled at 200 kHz but were low-pass filtered and decimated to 10 kHz, resulting in an effective bandwidth of 10 Hz to 5 kHz. In total, across all 13 recording sites, over 187,000 h (12 TB at 10 kHz) of continuous recordings have been collected since 2005. We refer to the entire unlabeled dataset as the corpus.
FIGURE 1
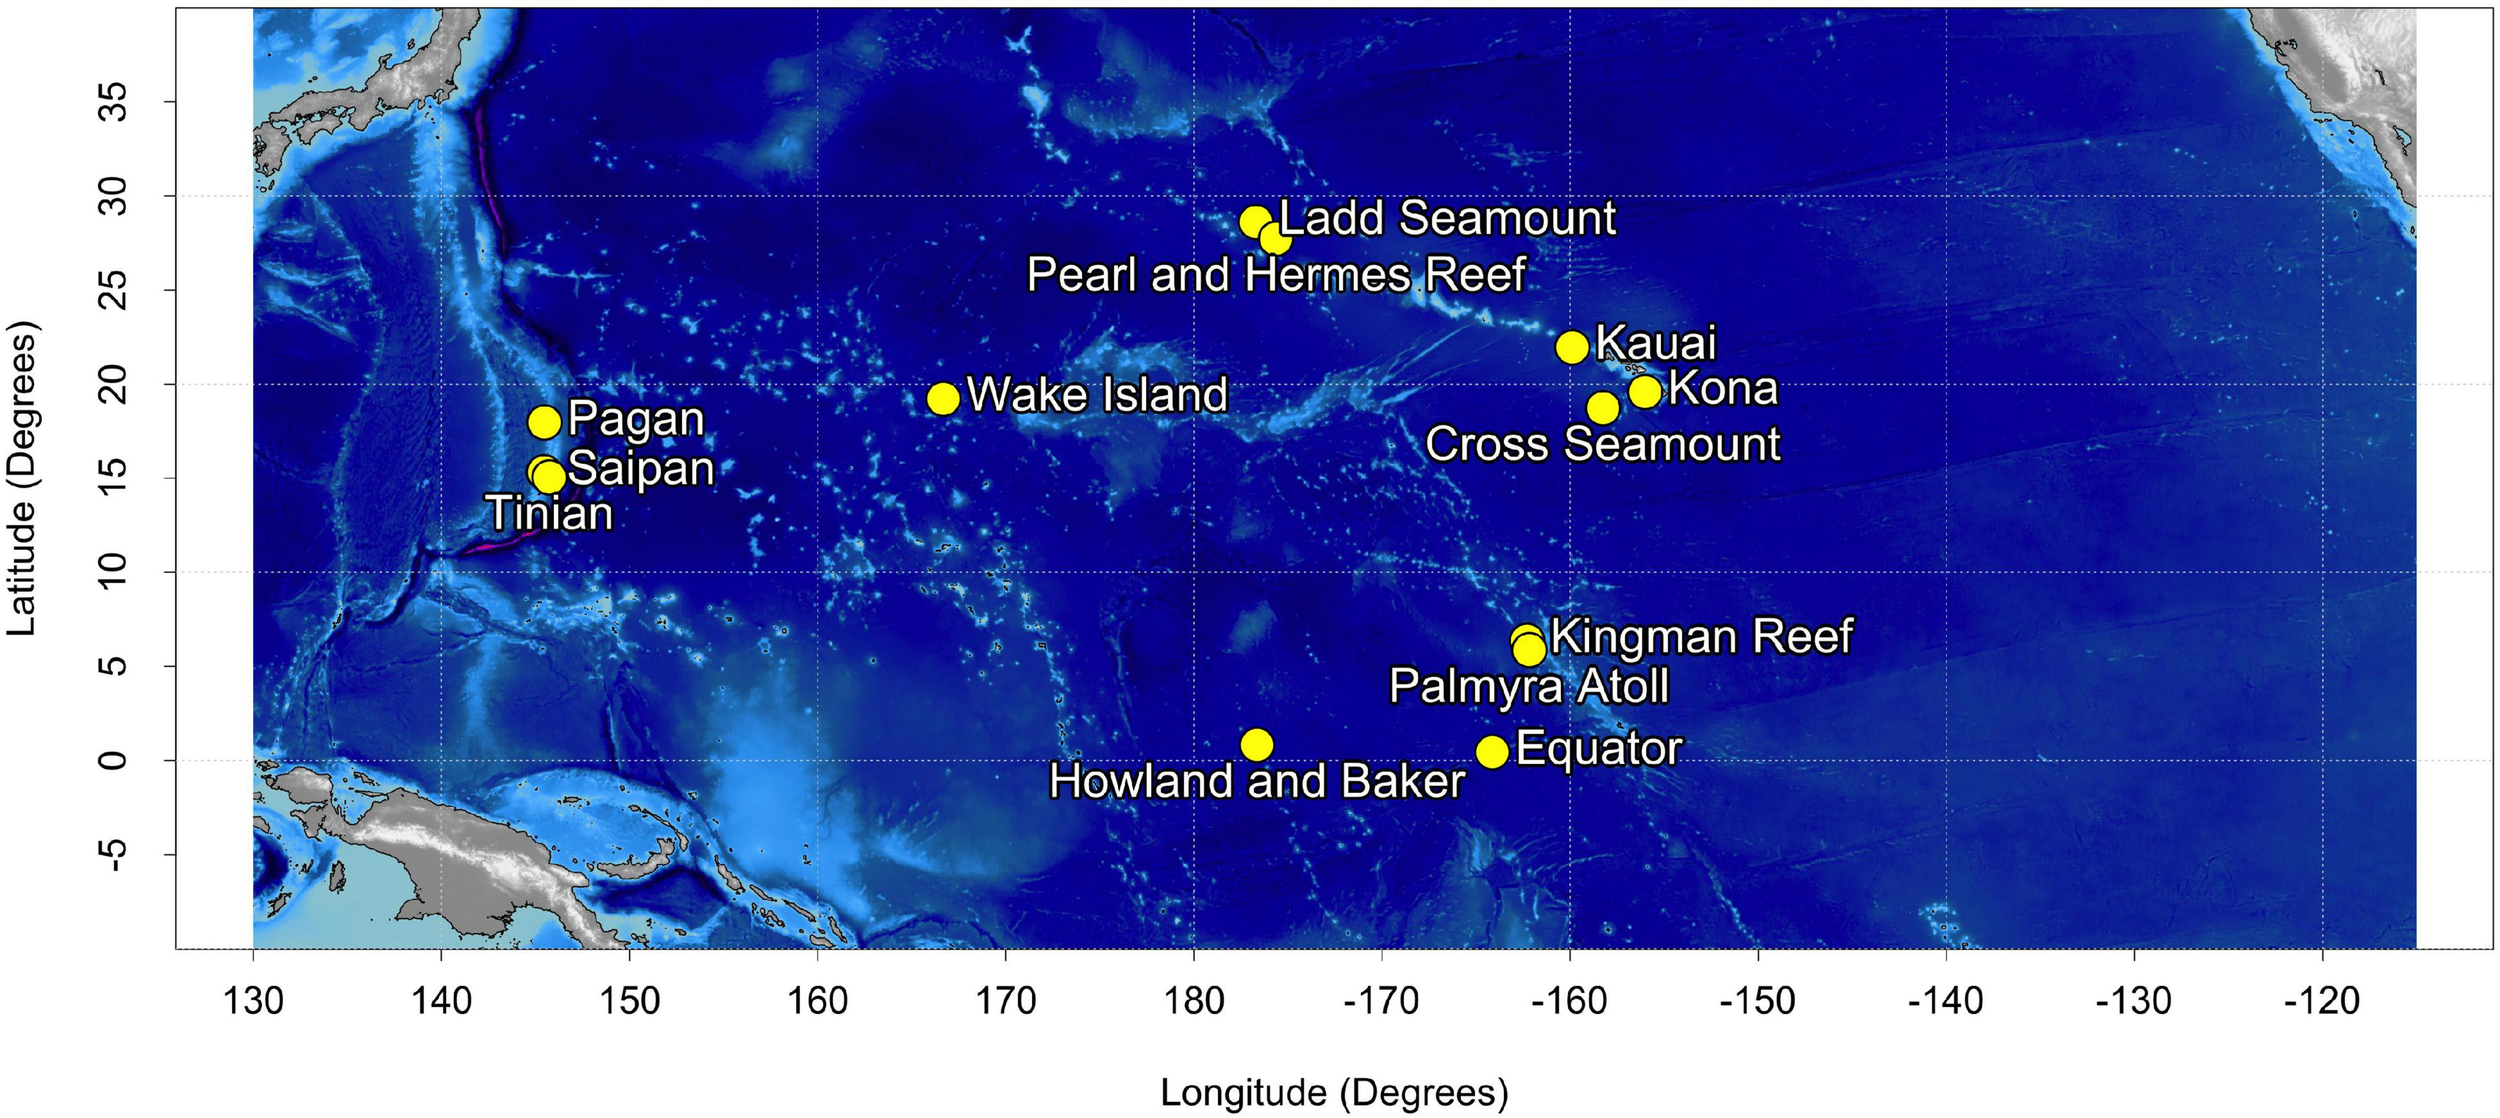
Map of the 13 acoustic recording locations.
CNN Model
Broadly, the model we developed transforms audio to spectrograms in a phase called the “front end” and then feeds the spectrograms into a neural network architecture originally developed for image classification. The problem is then framed as binary image classification according to whether the spectrogram contained humpback song, but with no attempt to predict the number of calls or the number of animals. We experimented with front end settings including time scale, frequency range, and compression. To correct error types not covered by the initial batch of labels, we used active learning, which uses the output of candidate models to guide further rounds of human annotation. We then evaluated model metrics, iterated on model configuration to improve performance, and finally compared the final model to energy-based detectors as a baseline.
Treating audio event detection as spectrogram classification is a well-known high-level approach, so the following subsections focus on ways of tuning for our dataset. Two aspects in particular were responsible for most of the quality improvement: primarily, active learning, and secondarily, per-channel energy normalization applied to the spectrograms (PCEN; Wang et al., 2017).
Acoustic Front End
The transformation from audio to a spectrogram is performed by a system component referred to as the acoustic front end, since it sits in front of the neural network. Our front end first applies to the input waveform a standard short-time Fourier transform (STFT) with a Hann window of length 1,024 samples (∼100 ms for our 10 kHz audio). With the output size fixed at 128×96 (time, frequency) bins, we experimented with stride lengths of 10, 30, and 50 ms – equivalent to context window lengths of 1.28, 3.84, and 6.4 s. (The term context window refers to the duration of audio the model required for a single instance of input). Along the frequency axis, all trials were binned using a triangular mel filterbank over squared FFT magnitudes.
We explored three different amplitude compression functions: log, root, and PCEN (Wang et al., 2017). The log and root compression were applied componentwise to each STFT bin. The specific form of log compression we used is f(x) = min[ln(x),−30]. The specific form of root compression we used is f(x) = x0.2.
Per-channel energy normalization first normalizes by componentwise dividing the STFT with a temporally smoothed version of the same STFT and then applies a stabilized root compression. The smoothing is done for each channel (frequency bin) independently, and the compression parameters can also vary per-channel. We used a non-trainable smoothing constant s = 0.04. The rest of the parameters were trainable per-channel variables initialized as: gain normalization ln(α)∼N(0.9,ln(0.95/0.9)), offset ln(δ)∼N(2.0,ln(2.5/2.0)), and exponent ln(1/r)∼N(2.0,ln(2.5/2.0)). (The choice of log domain forces the parameters to be positive).
We also experimented with mel filterbank bounds of 0 Hz–5 kHz, 100 Hz–1 kHz, and 50 Hz–2 kHz and the addition of fixed-amplitude time-domain Gaussian noise.
The compression experiment was done with STFT stride fixed at 30 ms and frequency range fixed at 0 Hz–5 kHz. The remaining experiments fixed the compression method as PCEN and applied grid search across frequency bounds and STFT stride durations.
Neural Network Architecture
The spectrogram classification component of the model was the architecture that Hershey et al. (2017) found best at detecting hundreds of audio event classes in YouTube videos. Specifically, we used a ResNet-50 convolutional neural network (He et al., 2016), modified by reducing the stride of the initial 7×7 convolution layer (conv1) from 2 to 1, since our spectrograms are lower-resolution than the ImageNet images considered in He et al. (2016).
Residual network architectures have proven to produce state-of-the-art results on general-purpose audio classification benchmarks (Hershey et al., 2017; Kong et al., 2020). This makes them a solid default choice for our retrospective analysis where computational budget is not limited. However, lighter-weight alternatives have been recently proposed that can maintain similar classification performance in resource constrained settings, e.g., on-device processing (Sandler et al., 2018; Tan and Le, 2019). Model distillation (Hinton et al., 2015) is also a standard strategy for reducing computational complexity, which in many cases outperforms training a lightweight architecture from scratch.
On-the-Fly Data Augmentation
The input pipeline read entire segments at once and sliced them into context windows. For data augmentation and time shift-invariance, the context window starts were perturbed by ±16 spectrogram time bins relative to a non-overlapping grid. This slicing was done dynamically during model training (on-the-fly), so the perturbations in different epochs were independent. The slicing came after the front end and before the input layer of the CNN. PCEN, when used, was applied to the entire segment before the context windows were extracted. This avoids edge effects from the smoothing filter. A 2,048-context-window shuffle buffer followed the slicing stage to avoid mini batches consisting of context windows from only a few audio segments. Mixture augmentation was not used. Time-domain Gaussian noise augmentation was tried but had no impact and was not used in the final model.
Audit Efforts and Active Learning
An initial uniform sample of hour-long ranges was manually audited by expert annotators to train and evaluate the first model candidate. Inference on the entire dataset revealed out-of-sample error modes such as vessel noise, platform self-noise, and minke whale calls. To correct these, we turned to active learning, a standard iterative strategy that improves an existing classifier by using it to select the most valuable examples for additional human annotation and subsequent retraining. In each round, our model-dependent samples were taken from per-site score ranges chosen to make each sample contain about 50% false positives. The rounds of annotation are summarized in Table 1. Details on annotations, broken down by site, effort, and total duration can be found in Supplementary Tables 1, 2.
TABLE 1
| Effort | Sampling strategy | Implicit negatives |
| Initial | Each individual call annotated in random hour-long intervals | Yes |
| Model- dependent 1 | Uniform subsample from corpus-wide top scoring context windows under first candidate model | No |
| Model- dependent 2 | Top-scoring context windows under the second candidate model, with three different score thresholds (lower for the sites with less audio or lower average prevalence) | No |
| Segments | Visual scanning of spectrograms of 75 s segments with the highest mean-pooled score under the second candidate model | Yes |
| Model- dependent 3 | Uniform subsample from corpus-wide top scoring context windows under the third candidate model | No |
| Model- dependent 4 | Site-stratified sample taken to make point estimates of precision at fixed thresholds for sites where the third candidate model underperformed | No |
| Validation | Stratified sample with three hundred 75 s segments uniformly sampled from each site | Yes |
| Expansion of Test Set | Uniform sample of segments from peak season, from sites with few positives in validation, and from new data collected after the final model was trained | Yes |
Audit efforts and their sampling strategies.
Context windows from time intervals with no annotations in these efforts were inferred to contain no humpback song and are called implicit negatives. The model-dependent samples selected isolated high-scoring context windows, which were individually annotated as positive or negative. Positive annotations confirmed the model’s correctness; negative annotations provided hard negatives for the next round of training. (Hard negatives are highly confusable false alarms that receive high scores under the candidate model).
The training set for the final model consisted of the union of all the audit efforts, excluding any overlap with the validation or test sets. The validation set was a stratified sample of 300 segments from each site, for a total of 6.25 h of audio. All humpback calls were annotated, but many segments were seen to contain no calls and were therefore a source of implicit negatives. Since the sampling for the initial effort skewed toward just a few sites and toward encounters where the singing whale was distant, site-stratified sampling was an important design consideration for the validation set. It also compensated for the uneven distribution of total recording time across sites. The test set used to produce the site-specific performance metrics consisted of the union of the validation set and an additional annotation effort referred to as Expansion of Test Set in Table 1.
Combined, the training, validation, and test datasets totaled 291.8 h of audited data. Though a significant effort, this still only comprised 0.12% of the corpus (Supplementary Table 2). Almost 25% of annotated data came from the recording site at Kona, from which almost 30% of the total recordings were collected (Supplementary Table 1).
Evaluation Metrics
Overall performance was evaluated using area under the receiver operating characteristic curve (AUC-ROC) and average precision (or area under the precision/recall curve). All metrics were computed at the segment level by averaging (mean pooling) the scores of non-overlapping context windows covering the segment and considering any segment with at least one humpback annotation to be positive.
Baselines
To provide context for the model performance, we computed metrics on the same test set using two other detection algorithms: first, our own reimplementation of the generalized power-law detection algorithm for humpback vocalizations (GPL) (Helble et al., 2012), and second, a simple band-limited energy detector.
For the GPL algorithm, we used the powers ν1 = 2.0 and ν2 = 0.5, the thresholds ηthresh = 0.0794 and ηnoise = 0.00501, and the iterative rethresholding algorithm described in Section IV of Helble et al. (2012). We applied mean pooling after assigning a score of zero to all of the non-call snapshots. Iterative rethresholding outperformed fixed thresholds, and mean pooling outperformed max pooling.
For the band-limited energy detector, we applied a Butterworth band pass filter of order 8 with critical frequencies at 150 and 1,800 Hz to entire segments and framed the output into 200 ms frames with 50% overlap. For frame scores we used the mean squared amplitude of the in-frame signal. For segment scores we max pooled the frame scores which outperformed mean pooling.
Humpback Occurrence
Site-specific detection thresholds were chosen from the validation set precision-threshold curves, targeting roughly 90% precision (Table 2). The segments scoring above these thresholds were then presumed positive for song and analyzed for patterns of occurrence throughout the recording sites. In order to account for differences in duty cycles and recording durations, occurrence was calculated as the percentage of the total recording time that was positive for humpback song, on a weekly scale. For those sites with seasonal humpback song present, the start and end of the season were taken to be the dates that the percentage of time with humpback song first and last crossed the 1% threshold. For those sites with consistently low detection levels, manual spot checking of positives was used to evaluate whether there was any low level, previously unknown occurrence of humpback song.
TABLE 2
| Site | Number of segments | Average precision | AUC- ROC | Threshold | Precision | Recall |
| Kona | 588 | 0.99 | 1.00 | 0.19 | 0.97 | 0.93 |
| Kauai | 455 | 0.99 | 1.00 | 0.19 | 0.99 | 0.95 |
| Cross SM | 470 | 0.95 | 0.98 | 0.11 | 0.91 | 0.82 |
| Pearl and Hermes Reef | 906 | 0.97 | 0.99 | 0.13 | 0.95 | 0.80 |
| Saipan | 781 | 0.95 | 0.99 | 0.17 | 0.92 | 0.82 |
| Tinian | 755 | 0.95 | 0.99 | 0.15 | 0.88 | 0.72 |
| Pagan | 349 | 1.00 | 1.00 | 0.06 | 0.98 | 0.95 |
| Wake Island | 740 | 0.93 | 0.99 | 0.12 | 0.93 | 0.82 |
| Ladd SM | 683 | 0.93 | 1.00 | 0.08 | 0.85 | 0.85 |
Site-specific performance metrics for our model at sites containing humpback song.
Average precision (or area under the precision recall curve) and Area Under the Curve of Receiver Operating Characteristics (AUC-ROC) characterize overall performance independent of threshold. The columns with point threshold, precision, and recall report performance at the site-specific operating points used in Humpback Occurrence.
One of the significant strengths of combining our long-term historical dataset with ML algorithms is the ability to evaluate changes and trends in humpback occurrence over time. Annual visual surveys of humpback whales at well-known Hawaiian aggregation sites noted a significant decline in humpback presence beginning in winter 2014–2015 (Gabriele et al., 2017; Cartwright et al., 2019). Our dataset in the Hawaiian Archipelago overlaps with this period of change, and therefore allows for evaluation of long-term trends in occurrence for over a decade. We examined the detection rate at Kona before and after May 2015 to assess whether a similar decline could be found within the acoustic data. We conducted a mixed effects logistic regression analysis on all segments from Kona, with random effects for the recording hour and day to adjust for the correlation between frames within the same time periods.
Results
CNN Model
Model Performance
Model performance varied between sites, but the model generalized well across most locations, with overall average precision of 97% (Table 2 and Figure 2). Performance metrics could not be calculated for those sites where few (<20) to no positive examples were found (Equator, Palmyra Atoll, Kingman Reef, Howland Island). The lowest average precision was at Ladd Seamount, which had only 20 positive test examples.
FIGURE 2
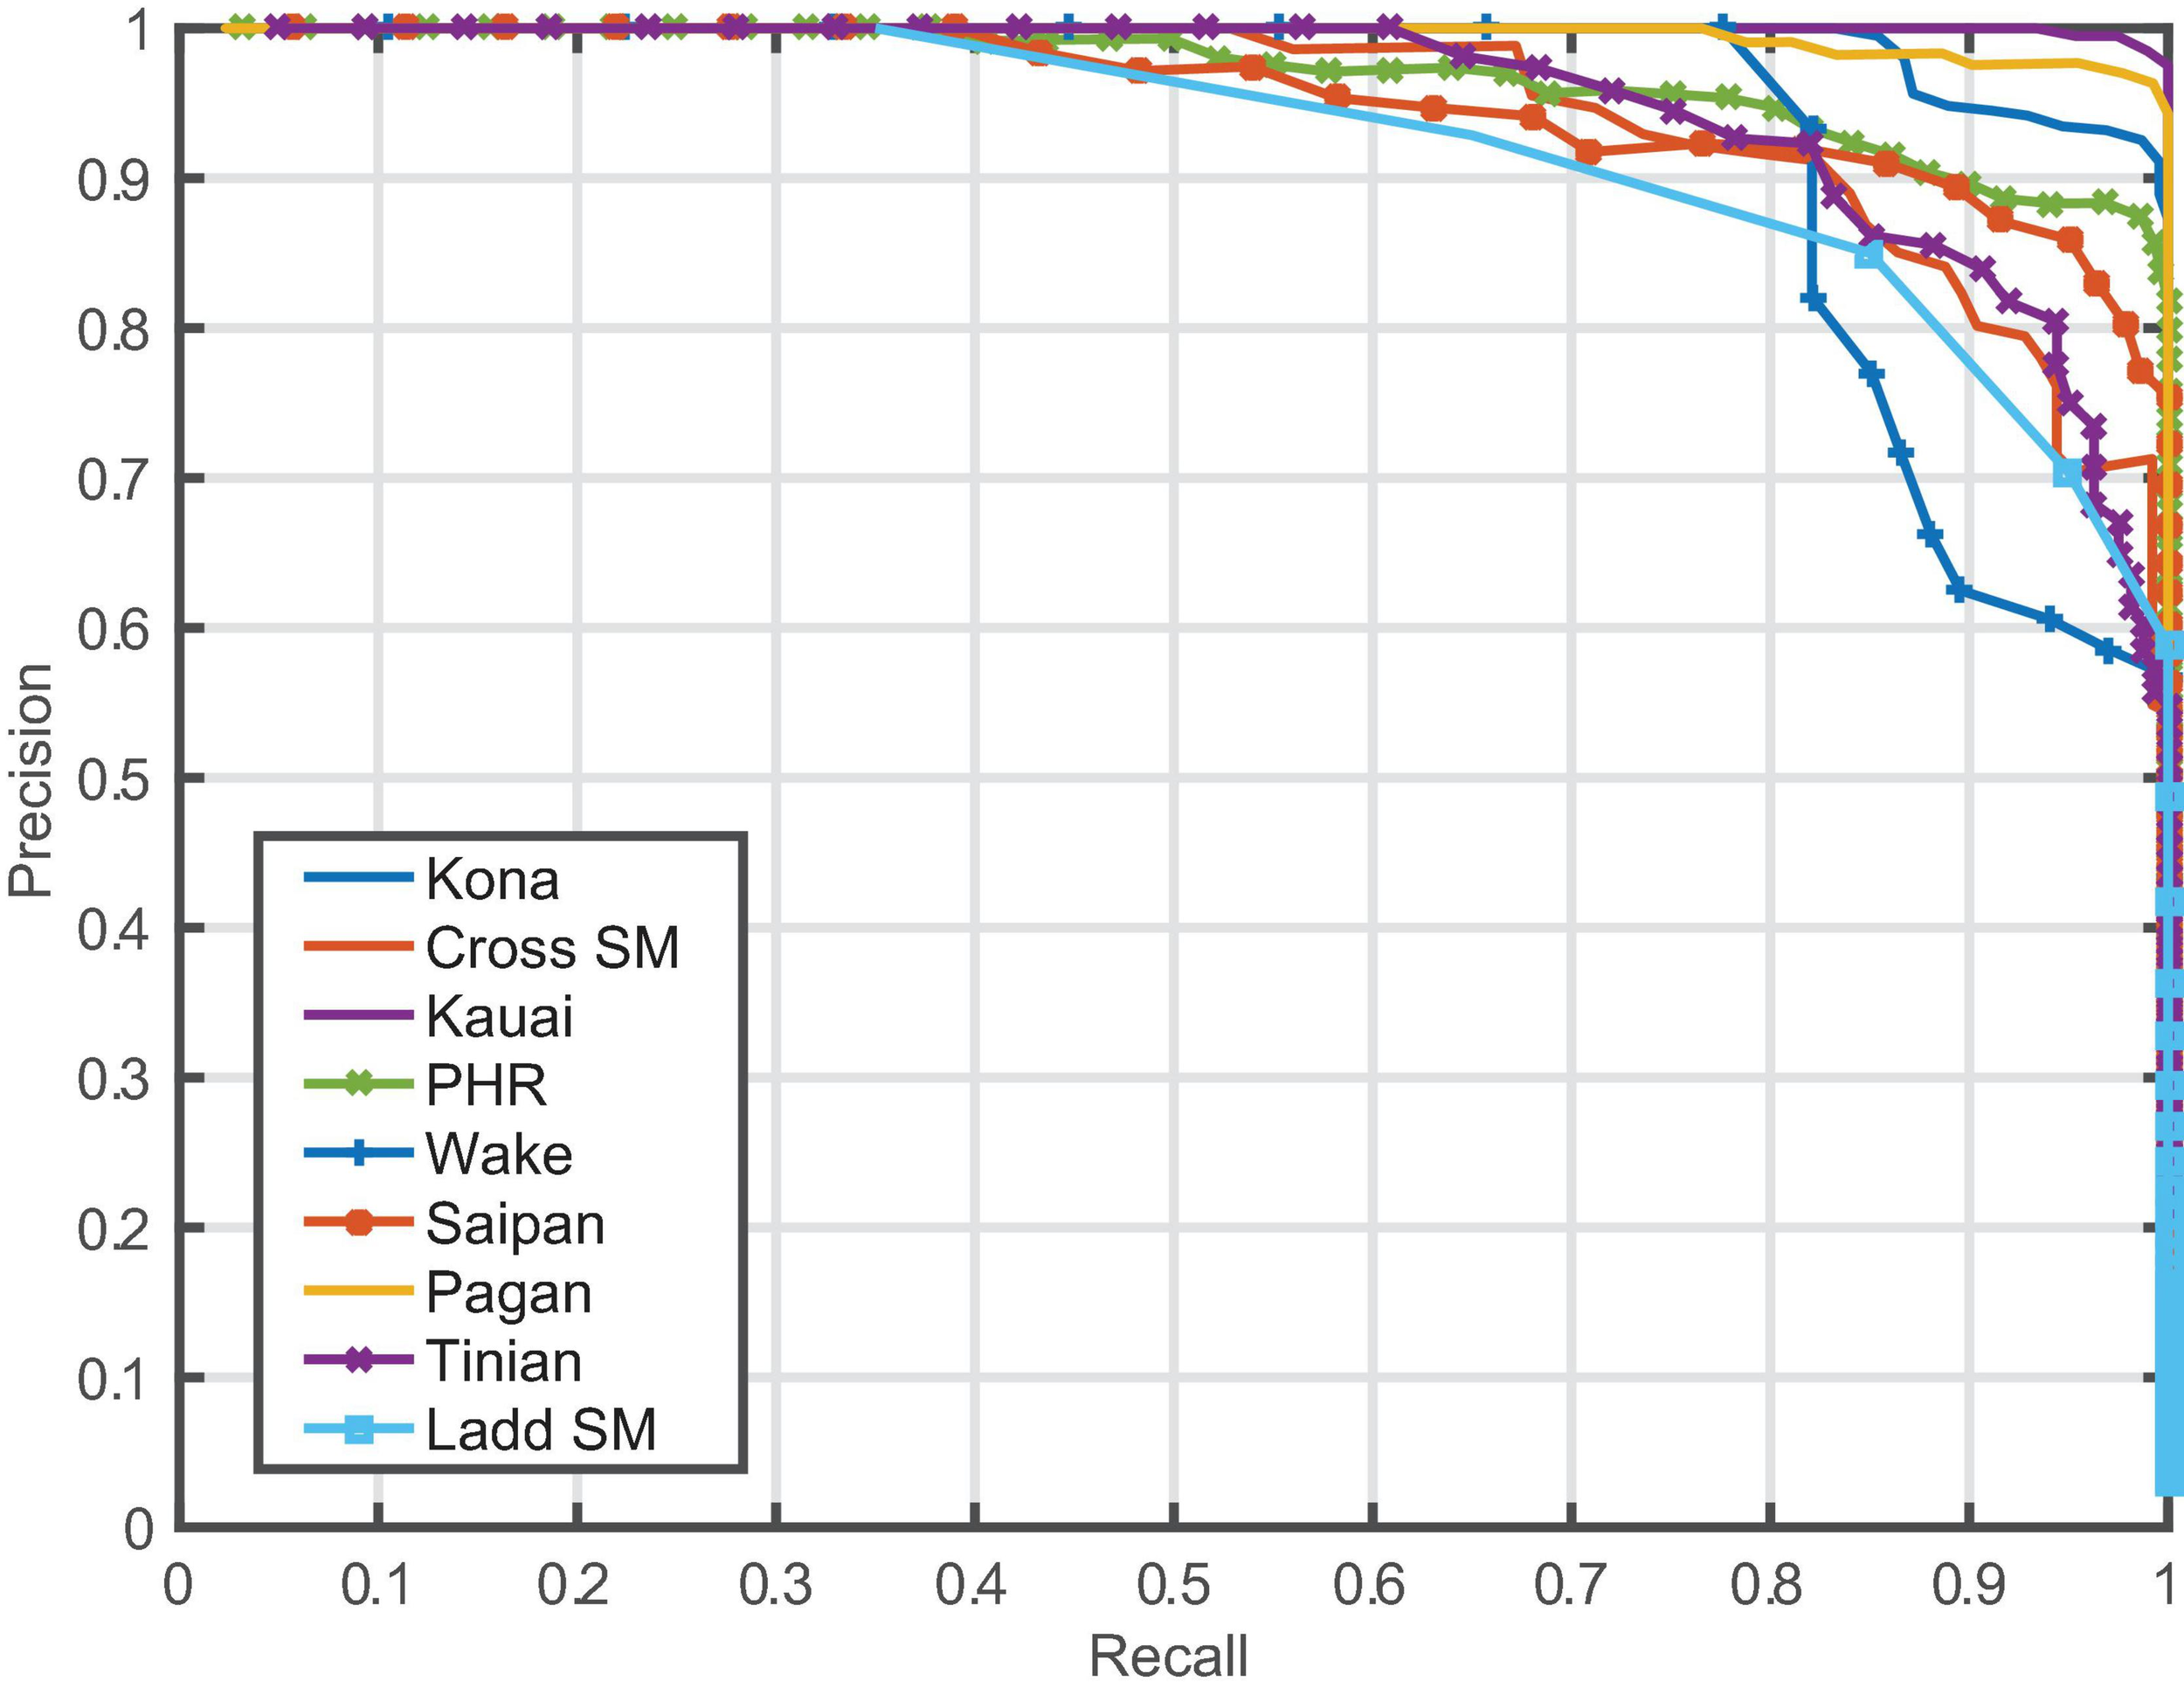
Precision/recall curves for each site with humpback song.
The CNN outperformed both the GPL and energy detector on the segment-level detection problem. The fraction of positive segments in the test set, or equivalently the baseline average precision of random scores, was 0.20. The energy detector did not do much better than this, with an average precision of 0.22 and an AUC-ROC of 0.48 (worse than random). The GPL algorithm achieved an average precision of 0.74 and AUC-ROC of 0.91. Our model achieved an average precision of 0.97 and AUC-ROC of 0.992.
Front End Experiments
We found that PCEN outperformed both log and root compression, providing an increase in both average precision and AUC-ROC. The outperformance of PCEN is likely largely due to the automatic gain control that it provides; in particular, it removed stationary, band-limited noise that was present in some but not all of the corpus. Context window duration also impacted model performance, with a 3.84 s window performing best, but there were not large differences in the performance of the shorter or longer context window. We found no effect from limiting the mel filterbank frequency range or adding time-domain Gaussian noise. Validation set metrics for front end experiments are reported in Supplementary Table 3.
Humpback Occurrence
Across the 13 recording sites, there was a clear seasonal occurrence pattern corresponding to the typical North Pacific humpback breeding season at seven of the recording sites: Kona, Kauai, Pearl and Hermes Reef (PHR), and Cross Seamount (CSM) (Figure 3 and Table 3); and Saipan, Tinian, and Pagan (Figure 4 and Table 3).
FIGURE 3
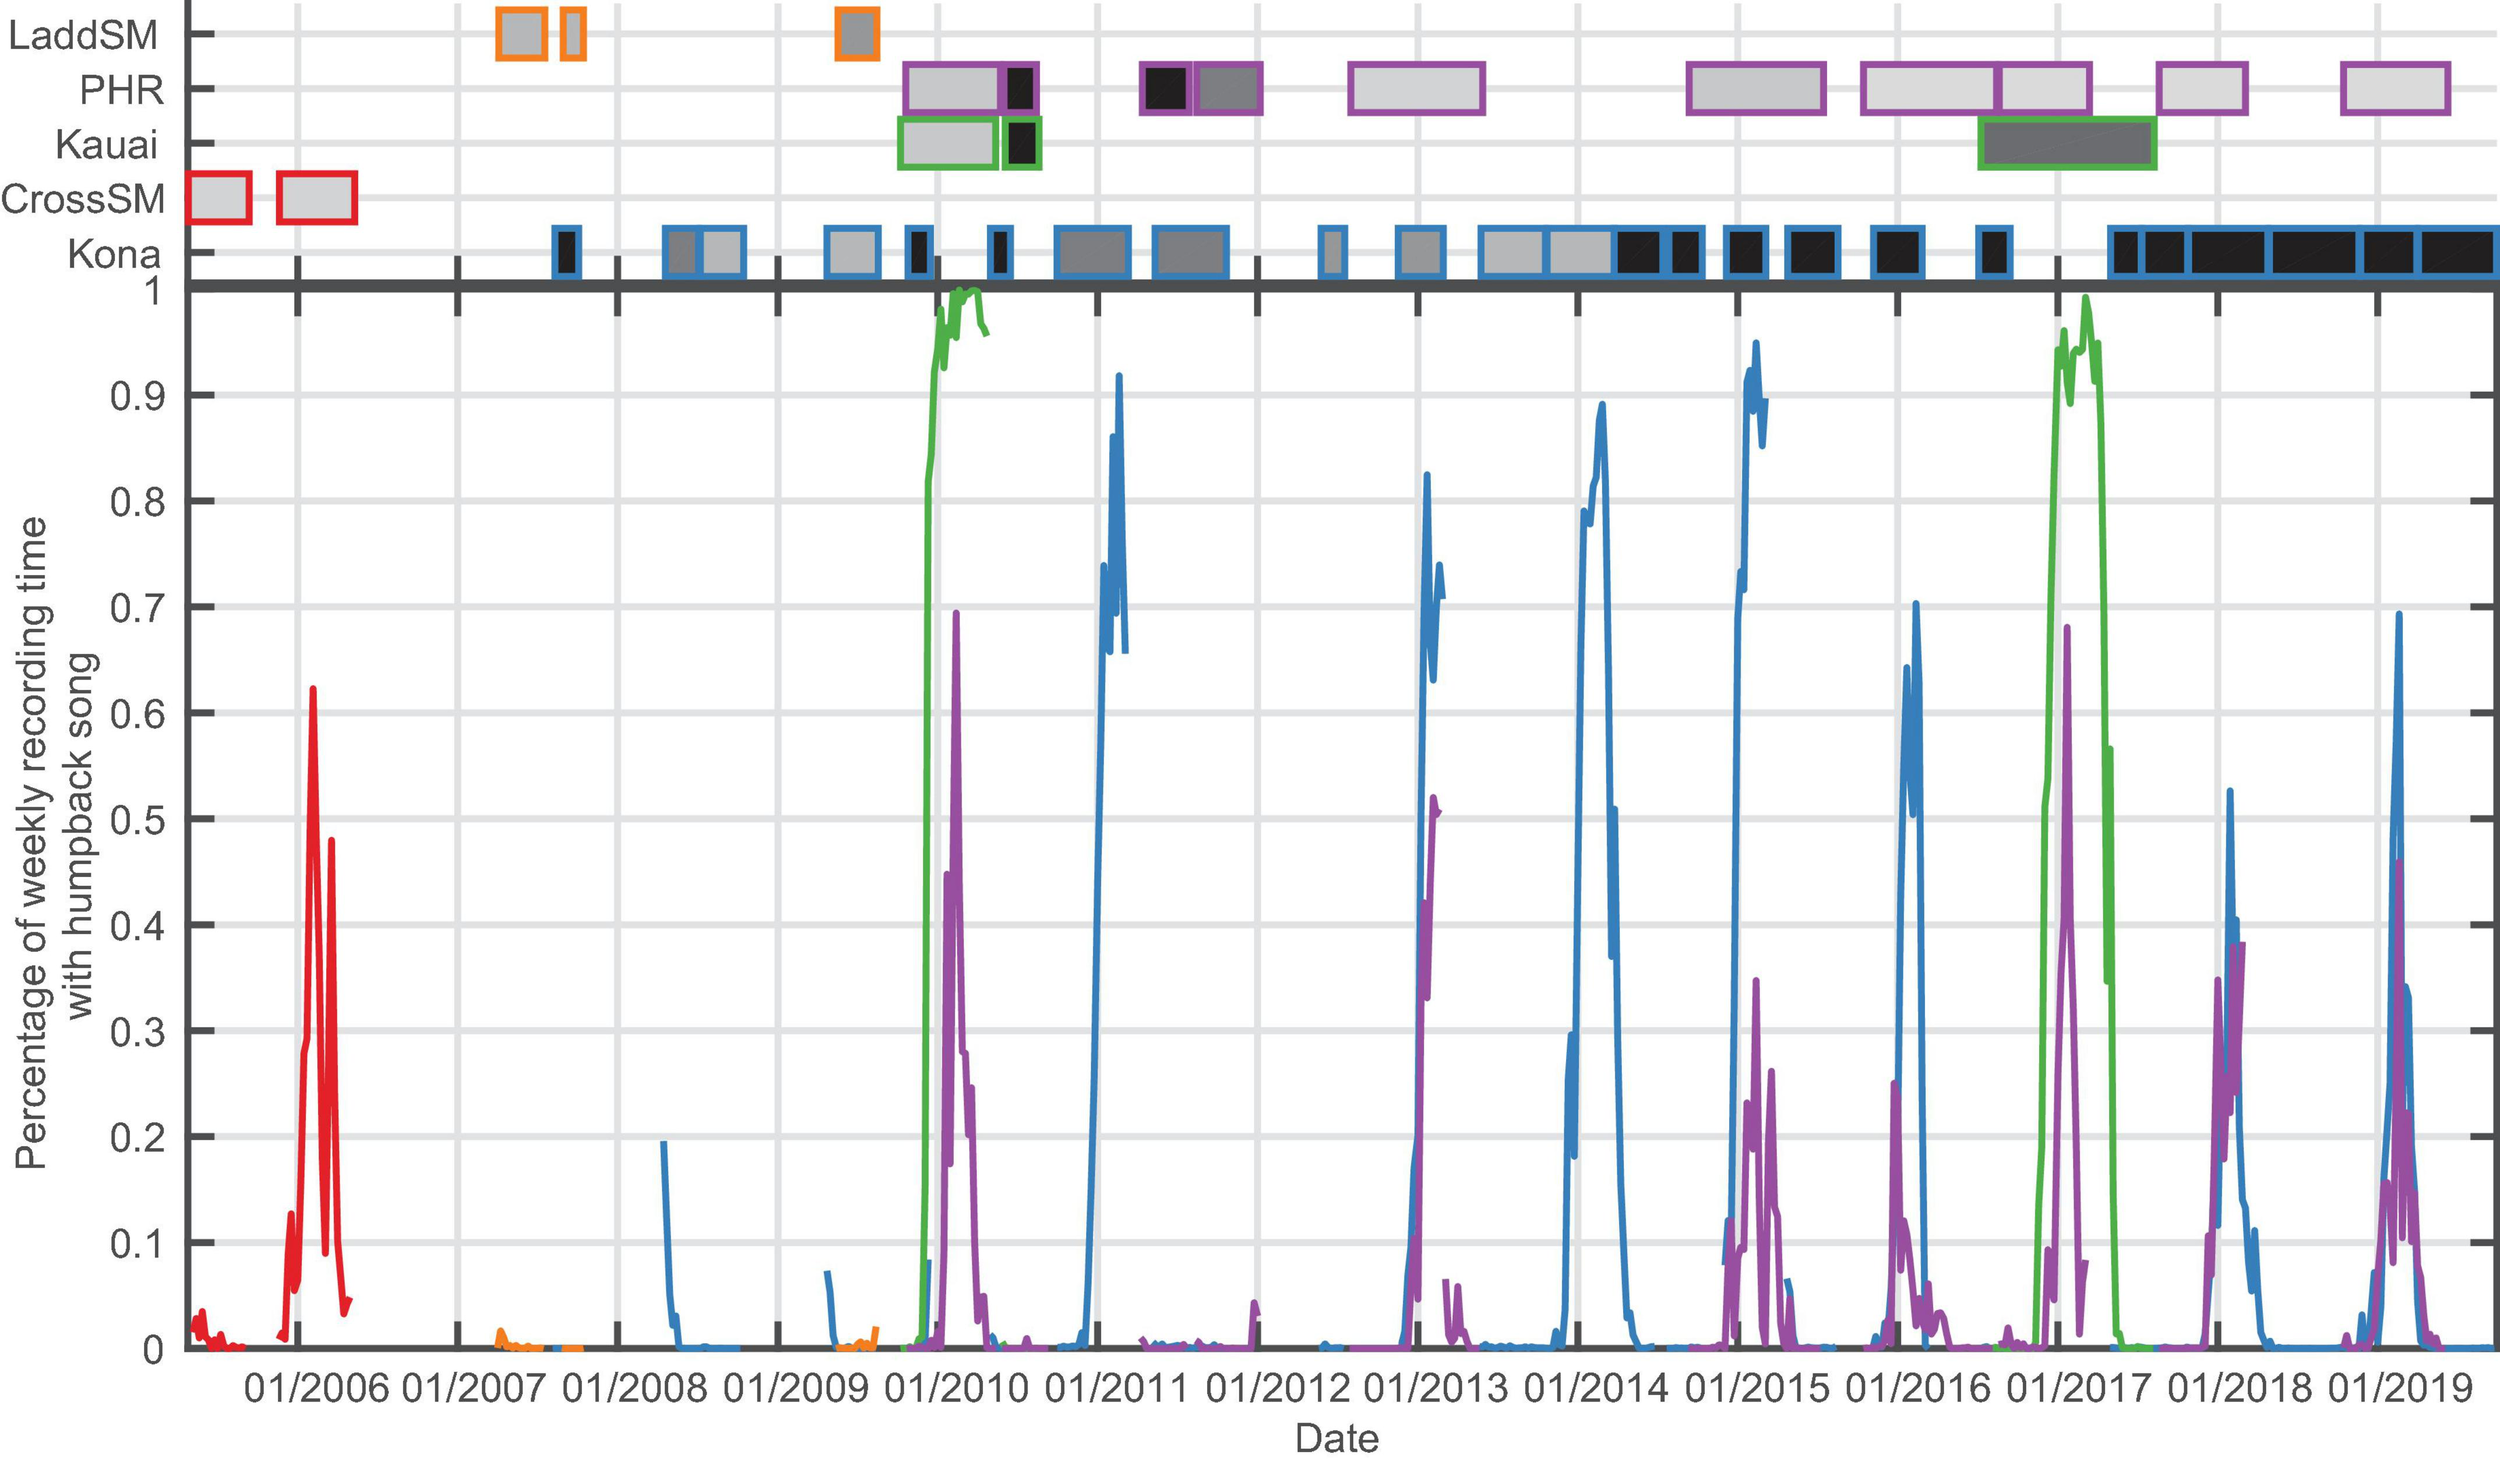
Bottom panel: Percentage of recording time with humpback song per week for the for Hawaiian archipelago sites (Ladd Seamount, Pearl and Hermes Reef (PHR), Kauai, Cross Seamount, Kona). Top panel: Shaded boxes represent the time periods with recordings for each site, with outer color corresponding to the recording site, and shading indicating duty cycle which ranged from 12.5% recording time (light gray) to continuous (black).
TABLE 3
| Site | Season start | Season end | Max song presence | Season peak date | Season duration (days) |
| Kona | 19-Nov | 23-Apr | 79% | 12-Feb | 155 |
| CSM | *19-Nov | — | *62% | *5-Feb | — |
| Kauai | 10-Nov | *28-May | 100% | 16-Mar | 199 |
| PHR | 10-Dec | 3-May | 48% | 4-Feb | 144 |
| Saipan | 19-Dec | 6-Apr | 47% | 24-Jan | 108 |
| Tinian | 12-Jan | 24-Mar | 6% | 12-Feb | 71 |
| Pagan | 31-Dec | 16-Mar | 25% | 5-Feb | 75 |
Summarized season data for the recording sites with seasonal humpback song.
*Taken from only one data point.
All metrics are averaged across all years of data for a given site.
FIGURE 4
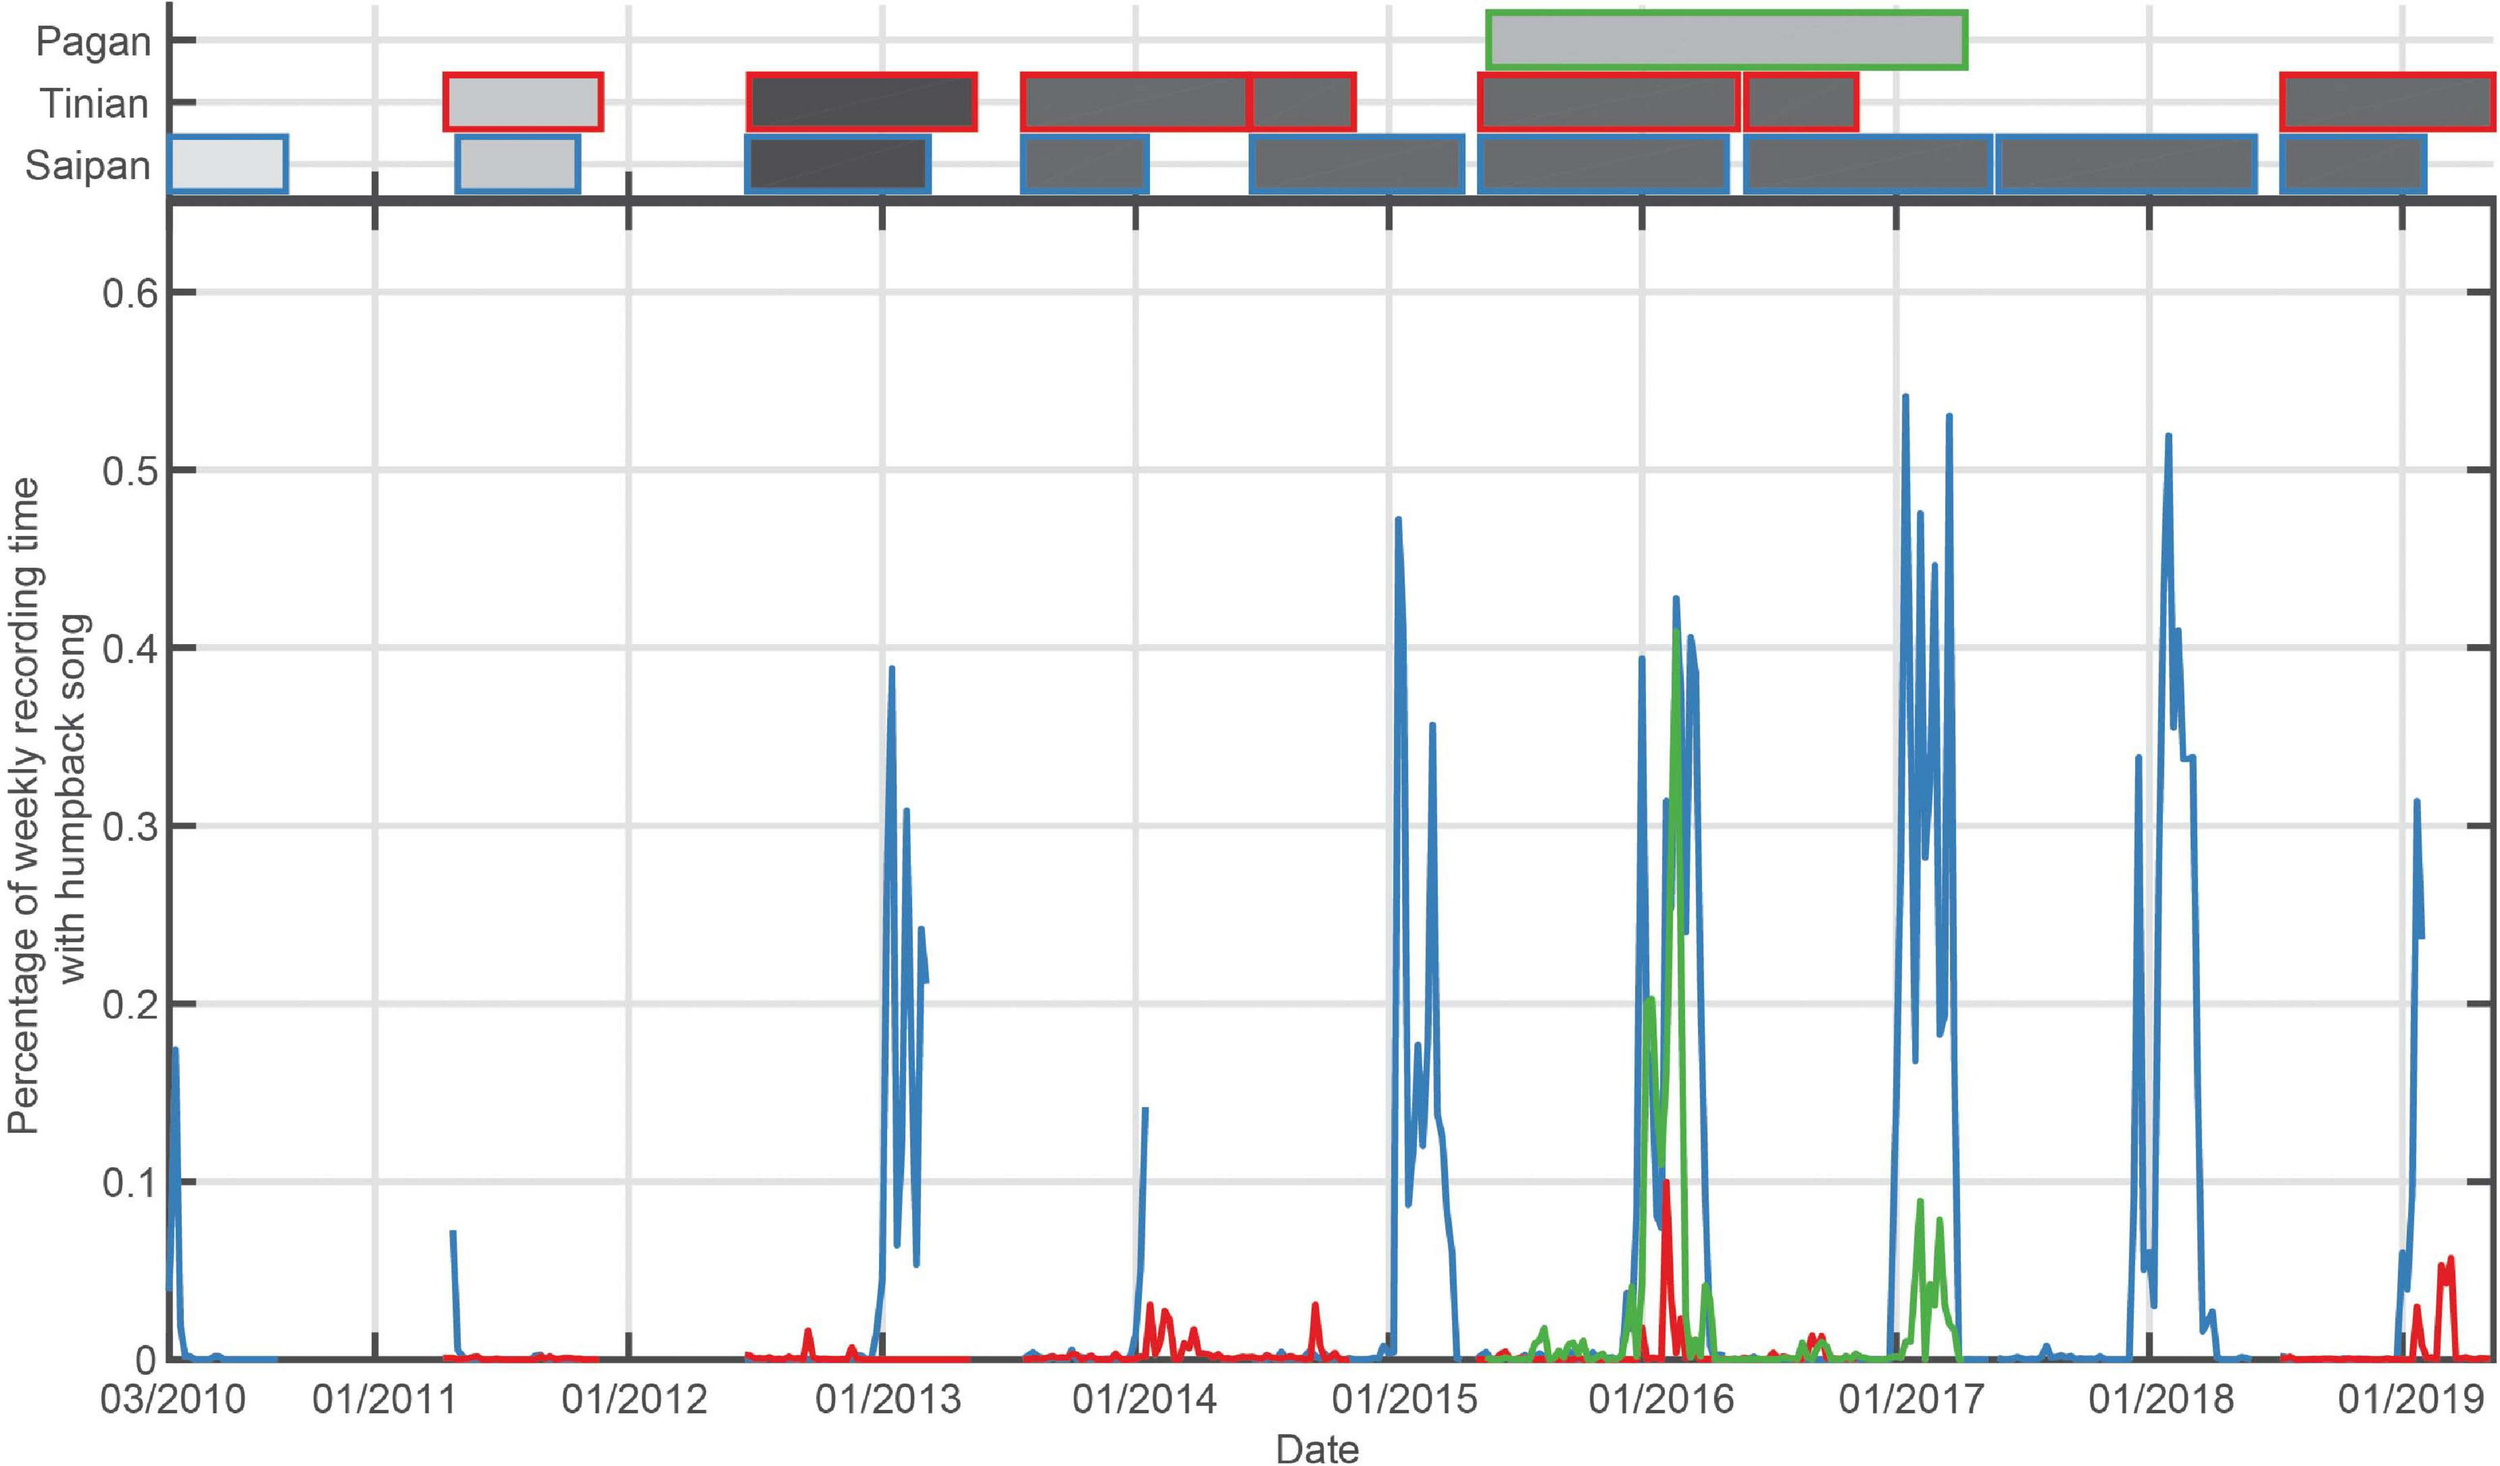
Bottom panel: Percentage of recording time with humpback song per week for the Mariana Islands. Top panel: Shaded boxes represent the time periods that have recordings, with outer color corresponding to the recording site, and shading indicating duty cycle that ranged from 12.5% recording time (light gray) to continuous (black).
Within the main Hawaiian Islands (MHI), CSM had only a single year of winter recordings available (2005/2006) but exhibited a season duration similar to Kona and Kauai, although the data ended (May 11, 2006) before song levels dropped below 1% (Figure 3 and Table 3). Kauai had the longest song season with 199 days of singing on average and song presence reaching 100% of recording time in both years of data. In the Northwestern Hawaiian Islands (NWHI), song started at PHR on average 3 to 4 weeks later than in the MHI, with a shorter average season length than the MHI (Table 3). There were only brief periods of humpback song found at Ladd Seamount, likely because the recording period had only brief overlap with the winter humpback season.
There was a marked decrease in the percentage of time with humpback song at Kona beginning in the 2015/2016 season. The maximum song presence declined from an average of 90% for the period from 2007/2008 to 2014/2015 to 64% starting in the 2015/2016 season, and the average season length was reduced by 26 days from 160 to 134 days. The mixed effects logistic regression analysis found that data recorded at Kona prior to May 2015 were approximately twice as likely to contain calls than frames recorded after May 2015 [adjusted odds ratio = 2.02; 95% CI: (1.75, 2.33)].
The timing of humpback whale song occurrence in the Mariana Archipelago was consistent with other northern hemisphere breeding grounds, although the season length was shorter than in the Hawaiian Archipelago (Figure 4 and Table 3). Saipan exhibited the longest season of the sites in the Mariana Islands an average of 108 days of singing, with an average peak of 47% of recording time with song. The full winter and spring periods were sampled for only four seasons at Tinian. In those years, humpback whale song was heard only in the last three (2014/2015; 2015/2016; 2018/2019), with peak song occurrence quite low, with a maximum of 10% in 2015/2016. At Pagan, humpback song began in late December/early January and continued through early- to mid-April with peaks in weekly occurrence of 41 and 9%, respectively (Figure 4).
The remaining six recording sites did not have consistent seasonal humpback song presence (Supplementary Figures 1–4). Humpback whale song was recorded at Wake Island for brief periods during the winter season, though occurrence was far less consistent than at sites in Hawaii and the Marianas. When examined on the daily scale, there were brief (1–2 days) periods of song occurrence, consistent with the passage of an individual whale (Supplementary Figure 1).
The CNN identified a small number of positives at Equator, Howland, Kingman Reef, and Palmyra. All were within the expected false positive rate of the model (1–5%). Manual evaluation of these time periods at Equator, Howland, and Palmyra revealed most to contain fish sounds and ship noise. However, at Kingman Reef all of the positives between December 8, 2011 and March 5, 2012 contained faint humpback song. There was a total of 18 days with song, several of which contained multiple singing bouts scattered throughout the day. In total, 0.19% of the audio from Kingman Reef was positive for humpback song. To compare detectors, an additional Kingman Reef-only audit effort was conducted, sampling from segments in a single season with the highest scores under our final model. It found 706 positive segments; the remaining 100,164 segments from the season were considered explicit negatives. For the CNN, GPL detector, and energy detector, the areas under the ROC curve were 0.973, 0.946, and 0.279, respectively, while the average precision scores were 0.456, 0.221, and 0.004, respectively.
Discussion
This study represents the largest scale application of deep learning to recognize marine mammal bioacoustics signals to date, as measured by dataset size and variability. This public-private partnership brought industrial cloud computing capacity to bear on a large scientific dataset, enabling parallel inference on terabyte-scale unlabeled audio within hours, a timescale unmatchable by historical analysis methods.
CNN Model
We demonstrate here the effective application of a CNN for identifying complex acoustic signals in an extremely large and heterogeneous passive acoustic dataset. The model was trained on a relatively small set of labels, biased toward signals from only a few recording sites. Yet, after a few active learning loops it generalized well to other recordings despite the large spatial and temporal scale of the data and the associated variation in humpback whale song structure, as well as number and loudness of singers, and large variations in background soundscape, including differing recorder depth, propagation conditions, and ambient noise presence. Active learning methods are a common approach to focus human annotation resources on the most impactful regions of large unlabeled datasets. In this way, common false positives are more quickly labeled as hard negatives, reducing the rate of misfires on error modes of early model candidates. Additionally, inclusion of implicit negatives greatly sped and simplified the annotation effort, allowing for entire segments of the dataset to be labeled as negative, providing many more training examples than if every negative needed to be hand annotated.
Marine passive acoustic monitoring datasets often contain a large range of signal-to-noise ratios and absolute noise levels. The wide variety of locations and time periods in this study means that each recording site has a unique noise field, recorder depth, propagation conditions, and different types and levels of interfering anthropogenic, biological, and physical noises. Fluctuating noise fields often hinder performance of an automated detector/classifier, and they certainly impacted the performance of this CNN, but PCEN – originally conceived for far-field speech processing – appeared to partially compensate for this variation, and the model performed well across all soundscapes in the corpus.
Model performance varied by site, likely due to several contributing factors including the amount of training data from that site and the site-specific soundscape and propagation conditions. Although active learning helped correct the most common types of false positives, some error modes still remain, including passing boat traffic and chorusing fish species, and the model performs better at sites without the presence of these interfering sounds. Additionally, while there was some variation in recorder depth (∼100 to 1300 m), there were no recordings from very shallow regions, which often contain greater overall ambient noise levels and significantly different propagation conditions. However, there was significant enough variation in propagation conditions that we cannot assume that humpback song was detectable at similar ranges between different recording sites.
Overall, the model generalized well across the differing soundscapes, song types, and number of singers present in the recordings, providing a high average precision and AUC-ROC and outperforming both GPL and band-limited energy detectors. However, the GPL algorithm does not require any training data and is less computationally intensive while still providing reasonably good average precision. This tradeoff is an important consideration when weighing analysis time versus the required precision needed for a particular study.
Humpback Occurrence
Seasonal and Geographic Trends in Humpback Whale Song Occurrence
Humpback whales in Hawaii are primarily known from well-studied aggregations in the MHI, particularly on shallow banks off Maui and Kauai (Shallenberger, 1977; Au et al., 2000). Animals typically start arriving in November, peak in February, and depart by May (Shallenberger, 1977; Cerchio, 1998; Au et al., 2000). Our acoustic data from the MHI match this pattern well.
Although we have only a single year of acoustic data from Cross Seamount, the timing and magnitude of song detections match well with those observed nearshore in the MHI. The proximity of this seamount to the island chain (270 km southeast of Hawaii Island), suggests that the area is an extension of the Hawaiian breeding grounds rather than a transit corridor. A previous passive acoustic glider survey among the seamounts south and west of the MHI revealed near constant detection of humpback whales in the region (Klinck et al., 2015), though the proximity of the whales to these seamounts is not known. Our data, together with the glider data, indicate that whales have been using the offshore waters west of the archipelago during the breeding season for at least a decade. The extent of use cannot be readily examined here but is worth further study.
Additionally, relatively little is known about humpback presence in the NWHI. The Hawaiian Archipelago extends over 1,800 km to the northwest of the MHI and includes similar habitat to well-known breeding grounds in the MHI (Johnston et al., 2007). A springtime line transect visual and acoustic survey for humpback whales (Johnston et al., 2007) and a year of acoustic recordings at eight sites along the archipelago (Lammers et al., 2011) represent the only recent published records of humpback whale presence in the NWHI. In their survey, Johnston et al. (2007) found humpbacks present in shallow water habitat, with the northernmost encounters at Lisianski Island, 270 km southeast of PHR. Humpback whales were not seen at PHR or Ladd Seamount. Lammers et al. (2011) found strong seasonal humpback song at their recording sites as far north as Lisianski Island, with greatly reduced levels of detection at and to the north of PHR. In contrast, we found a consistent seasonal presence of humpback song at PHR. This difference is possibly due to the shallow, nearshore location of the recorders in Lammers et al. (2011). PHR was one of the longer datasets in the current study, with recordings between 2009 and 2019. The season duration at PHR is shorter, mostly driven by a later start, and the magnitude of song occurrence is lower than that found in the MHI. This shorter seasonal presence, in combination with the decreasing occurrence with increasing distance to the north was found in Johnston et al. (2007), Lammers et al. (2011), and here. Photo ID matches between the NWHI and MHI (K.M. Yano, Unpublished Data) indicate that these animals may arrive at the MHI first and then move northward up the archipelago.
Recordings from Wake Island indicate that humpback whales are not common there, with only a few instances of humpback song during the months of January to April, likely from transiting whales enroute to Hawaiian or other North Pacific breeding locations. Singing generally persisted for 1–2 days, a reasonable detection period for a transiting animal. There is evidence of movement between western Pacific and Hawaiian breeding grounds (Darling and Cerchio, 1993) and also of migration between western Pacific breeding grounds and Bering Sea or western Gulf of Alaska feeding grounds (Calambokidis et al., 2008) that could bring singing whales within detection range of Wake Island.
Of particular note is the discovery of humpback song at Kingman Reef, an event that would likely not have been possible without the CNN approach. This discovery demonstrates the benefit of using DL to find extremely rare signals within large datasets. Only 0.19% of the total audio from Kingman Reef was positive for humpback song, and all detections were very faint, making it likely that previous annotation methods, both automatic and manual, would have missed these instances of song. The discovery of song at Kingman Reef is unprecedented, as no historical records indicate humpback presence in this region of the world. The nearest known breeding area is the Hawaiian Islands, 1,500 km away. No song was detected at any other equatorial sites, including Palmyra Atoll located just 60 km away. Song at Kingman Reef is sporadic but occurs repeatedly throughout the recording period with timing corresponding to the North Pacific breeding season, suggesting a link to one of these populations. We cannot conclude from a single year of data if these animals are a returning breeding population, or an isolated instance of one or several wandering animals, as hypothesized to explain song detections between Hawaii and Mexico (Darling et al., 2019).
There are several known breeding grounds for humpback whales in the western Pacific, with photo ID and genetic evidence suggesting two populations may use this broader region (Bettridge et al., 2015). Limited anecdotal and whaling data suggested possible humpback presence in the Mariana Archipelago (Fulling et al., 2011). Hill et al. (2020) found consistent seasonal humpback presence on shallow banks west and north of Saipan. Genetic and photo ID evidence suggests that these whales are part of a second “unknown” western Pacific breeding population (Hill et al., 2020). Our data provide further evidence of consistent seasonal humpback occurrence in the Marianas Archipelago, including previously unreported presence at Pagan Island. The season durations at all three Mariana sites were shorter than in the Hawaiian Islands. The Western Pacific humpback population is notably smaller than that in Hawaii (Bettridge et al., 2015), such that this shorter season may reflect consolidated migratory movements to and from northern feeding grounds in winter and spring or may reflect the specific use of the Mariana Islands by a portion of the broader population.
Long Term Temporal Humpback Trends
In addition to providing insights for remote and hard-to-monitor sites, one benefit of long-term acoustic recordings is the ability to identify long-term trends in animal presence. Starting in 2014, scientists in Hawaii and Alaska noticed a significant decrease in humpback whale sightings in several areas of known high abundance, coinciding with the Pacific decadal oscillation, Northeast Pacific heatwave, and an El Niño event in 2016 (Gabriele et al., 2017; Cartwright et al., 2019). An acoustic study from Maui showed a decline in daily song levels starting in the 2015/2016 season and persisting through 2018/2019 when levels increased again at some sites (Kügler et al., 2020). Our data show a similar decline in humpback song presence at Kona, beginning in the 2015/2016 season and persisting until the end of the data in 2019, with a concurrent reduction in season length. The reduction in song presence lags the reduced presence of whales noted by visual surveys (Cartwright et al., 2019). This may reflect the specific distribution of whales within MHI breeding grounds, as acoustic measurements are taken at a single location and are averaged over longer time scales than visual surveys. Additionally, our CNN model only predicts whether humpback song is present in a data segment and does not differentiate between a single song unit or many, such that the number of singers would need to decline sharply before we would observe a decline in the percentage of recording time with song.
Conclusion
We demonstrate here the power of applying state-of-the-art deep machine learning to quantitatively and comprehensively analyze a diverse, long-term passive acoustic dataset with a high level of precision. This study is unique in the scale of application of a CNN to a large marine acoustic dataset and demonstrates the ability of a CNN trained on a relatively small dataset to generalize well to a highly variable call type across a varied range of recording and noise conditions. By leveraging machine learning, we gained insights into the seasonal and long-term occurrence of whales both within known breeding areas and in regions where visual surveys are not feasible. Notably, machine learning facilitated the discovery of humpback song at a novel location, found at a considerable distance from any known humpback aggregations, which would not have been possible with previous manual or automatic acoustic annotation methods.
Our current method is limited by its ability to only classify a time segment as either positive or negative for humpback song. Future models that could distinguish between individual song units or transcribe entire songs could provide further information on population linkages between some of the remote recording sites and known breeding areas. However, when examining data over such a large time and space including very remote locations, acoustic whale call presence/absence adds discerning power and longevity to visual and other survey methods beyond what is possible when human presence is needed for data collection.
Statements
Data availability statement
The entire acoustic dataset and all annotations used in this analysis are available at doi: 10.25921/Z787-9Y54. The trained machine learning model is openly available at: https://tfhub.dev/google/humpback_whale/1. Further inquiries can be directed to the corresponding author.
Ethics statement
Ethical review and approval was not required for the animal study because no experimental studies or direct interactions with any vertebrate species were conducted. All data are purely observational.
Author contributions
AA, EO, and KM collected, processed, and prepared the acoustic data. MH, LH, and AJ developed the machine learning model. AA, MH, and LH analyzed the output data. AA and MH wrote the manuscript. All authors contributed to the concept and design of the conducted work, provided critical feedback, and helped shape the research, analysis, and manuscript.
Funding
The funding for acoustic monitoring efforts and analysis was provided by the Protected Species and Ecosystems and Oceanography Divisions at NMFS and PIFSC, the Ocean Acoustics program at NMFS Office of Science and Technology, the US Navy CNO-N45, and the National Geographic Society. HARP deployments were permitted at Ladd Seamount and Pearl and Hermes Reef by the Papahānaumokuākea Marine National Monument under permits PMNM-2008-020 and PMNM-2010-042, and the Co-Managers permit since 2015 and at Palmyra Atoll under USFWS Special-Use permit #12533.
Acknowledgments
Special thanks for HARP development, deployment, recovery, and data processing to: Scripps Whale Acoustics Lab, Scripps Acoustic Ecology Lab, PIFSC technicians and field staff, Cascadia Research Collective, Ben Sablan, Dan McSweeney, The Nature Conservancy, Palmyra Atoll Research Consortium, the US Fish and Wildlife Service, and the officers and crews of the NOAA ships Sette and Hi’ialakai, as well as other “ships of opportunity.”
Conflict of interest
MH, LH, AJ, and JC were employed by Google, Inc. KM was employed by Lynker Technologies LLC. The remaining authors declare that the research was conducted in the absence of any commercial or financial relationships that could be construed as a potential conflict of interest.
Supplementary material
The Supplementary Material for this article can be found online at: https://www.frontiersin.org/articles/10.3389/fmars.2021.607321/full#supplementary-material
References
1
AuW. W. L.MobleyJ.BurgessW. C.LammersM. O.NachtigallP. E. (2000). Seasonal and diurnal trends of chorusing humpback whales wintering in waters off western Maui.Mar. Mamm. Sci.16530–544. 10.1111/j.1748-7692.2000.tb00949.x
2
BerglerC.SchröterH.ChengR. X.BarthV.WeberM.NöthE.et al (2019). ORCA-SPOT: an automatic killer whale sound detection toolkit using deep learning.Sci. Rep.9:10997. 10.1038/s41598-019-47335-w
3
BermantP. C.BronsteinM. M.WoodR. J.GeroS.GruberD. F. (2019). Deep machine learning techniques for the detection and classification of sperm whale bioacoustics.Sci. Rep.9:12588. 10.1038/s41598-019-48909-4
4
BettridgeS. O. M.BakerC. S.BarlowJ.ClaphamP.FordM. J.GouveiaD.et al (2015). Status Review of the Humpback Whale (Megaptera novaeangliae) Under the Endangered Species Act. NOAA technical memorandum NMFS NOAA-TM-NMFS-SWFSC-540.Washington, DC: U.S. Department of Commerce, National Oceanic and Atmospheric Administration, National Marine Fisheries Service.
5
BittleM.DuncanA. (2013). “A review of current marine mammal detection and classification algorithms for use in automated passive acoustic monitoring,” in Proceedings of Acoustics,ed.McMinnT. (Victor Harbor, SA: Australian Acoustical Society) 8.
6
BurtenshawJ. C.OlesonE. M.HildebrandJ. A.McDonaldM. A.AndrewR. K.HoweB. M.et al (2004). Acoustic and satellite remote sensing of blue whale seasonality and habitat in the Northeast Pacific.Deep Sea Res. II Top. Stud. Oceanogr.51967–986. 10.1016/j.dsr2.2004.06.020
7
CalambokidisJ.FalconeE. A.QuinnT. J.BurdinA. M.ClaphamJ. K.GabrieleC. M.et al (2008). SPLASH: Structure of Populations, Levels of Abundance and Status of Humpback Whales in the North Pacific. Unpublished report AB133F-03-RP-0078 submitted by Cascadia Research Collective to USDOC.Seattle, WA: U.S. Dept of Commerce.
8
CartwrightR.VenemaA.HernandezV.WyelsC.CesereJ.CesereD. (2019). Fluctuating reproductive rates in Hawaii’s humpback whales, Megaptera novaeangliae, reflect recent climate anomalies in the North Pacific.R. Soc. Open Sci.6:181463. 10.1098/rsos.181463
9
CerchioS. (1998). Estimates of humpback whale abundance off Kauai, 1989 to 1993: evaluating biases associated with sampling the Hawaiian Islands breeding assemblage.Mar. Ecol. Prog. Ser.17523–34. 10.3354/meps175023
10
ClarkC. W.BorsaniJ. F.Notarbartolo-Di-sciaraG. (2002). Vocal activity of fin whales, Balaenoptera physalus, in the Ligurian Sea.Mar. Mamm. Sci.18286–295. 10.1111/j.1748-7692.2002.tb01035.x
11
DarlingJ. D.CerchioS. (1993). Movement of a humpback whale (Megaptera novaeangliae) between Japan and Hawaii.Mar. Mamm. Sci.984–88. 10.1111/j.1748-7692.1993.tb00430.x
12
DarlingJ. D.GoodwinB.GoodoniM. K.TaufmannA. J.TaylorM. G. (2019). Humpback whale calls detected in tropical ocean basin between known Mexico and Hawaii breeding assemblies.J. Acoust. Soc. Am.145EL534–EL540. 10.1121/1.5111970
13
DavisG. E.BaumgartnerM. F.BonnellJ. M.BellJ.BerchokC.Bort ThorntonJ.et al (2017). Long-term passive acoustic recordings track the changing distribution of North Atlantic right whales (Eubalaena glacialis) from 2004 to 2014.Sci. Rep.7:13460. 10.1038/s41598-017-13359-3
14
FullingG. L.ThorsonP. H.RiversJ. (2011). Distribution and abundance estimates for cetaceans in the waters off Guam and the commonwealth of the Northern Mariana Islands.Pac. Sci.65321–343. 10.2984/65.3.321
15
GabrieleC. M.NeilsonJ. L.StraleyJ. M.BakerC. S.CedarleafJ. A.SaraccoJ. F. (2017). Natural history, population dynamics, and habitat use of humpback whales over 30 years on an Alaska feeding ground.Ecosphere8:e01641. 10.1002/ecs2.1641
16
GarlandE. C.RendellL.LamoniL.PooleM. M.NoadM. J. (2017). Song hybridization events during revolutionary song change provide insights into cultural transmission in humpback whales.Proc. Natl. Acad. Sci. U.S.A.1147822–7829. 10.1073/pnas.1621072114
17
HarveyM. (2018). Acoustic Detection of Humpback Whales Using a Convolutional Neural Network. Google AI Blog. Available online at: http://ai.googleblog.com/2018/10/acoustic-detection-of-humpback-whales.html(accessed July 6, 2020).
18
HeK.ZhangX.RenS.SunJ. (2016). “Deep residual learning for image recognition,” in Proceedings of the 2016 IEEE Conference on Computer Vision and Pattern Recognition (CVPR), (Las Vegas, NV: IEEE), 770–778. 10.1109/CVPR.2016.90
19
HelbleT. A.IerleyG. R.D’SpainG. L.RochM. A.HildebrandJ. A. (2012). A generalized power-law detection algorithm for humpback whale vocalizations.J. Acoust. Soc. Am.1312682–2699. 10.1121/1.3685790
20
HersheyS.ChaudhuriS.EllisD. P. W.GemmekeJ. F.JansenA.MooreR. C.et al (2017). “CNN architectures for large-scale audio classification,” in Proceedings of the 2017 IEEE International Conference on Acoustics, Speech and Signal Processing (ICASSP), (New Orleans, LA) 131–135. 10.1109/ICASSP.2017.7952132
21
HillM.BradfordA.SteelD.BakerC.LigonA.AdamÜ, et al. (2020). Found: a missing breeding ground for endangered western North Pacific humpback whales in the Mariana Archipelago.Endanger. Species Res.4191–103. 10.3354/esr01010
22
HintonG.VinyalsO.DeanJ. (2015). Distilling the knowledge in a neural network.arXiv[Preprint]. arXiv:1503.02531
23
JohnstonD.ChaplaM.WilliamsL.MattilaD. (2007). Identification of humpback whale (Megaptera novaeangliae) wintering habitat in the Northwestern Hawaiian Islands using spatial habitat modeling.Endanger. Species Res.3249–257. 10.3354/esr00049
24
KirsebomO. S.FrazaoF.SimardY.RoyN.MatwinS.GiardS. (2020). Performance of a deep neural network at detecting North Atlantic right whale upcalls.J. Acoust. Soc. Am.1472636–2646. 10.1121/10.0001132
25
KlinckH.NieukirkS. L.FregosiS.KlinckK.MellingerD. K.LastukaS.et al (2015). Cetacean Studies on the Hawaii Range Complex in December 2014 - January 2015: Passive Acoustic Monitoring of Marine Mammals Using Gliders. Final Report. under Contract No. N62470-10-D-3011, Task Order KB25, issued to HDR Inc. October 2015. Honolulu, HI: Naval Facilities Engineering Command (NAVFAC) Pacific, Pearl Harbor.
26
KongQ.CaoY.IqbalT.WangY.WangW.PlumbleyM. D. (2020). PANNs: large-scale pretrained audio neural networks for audio pattern recognition.282880–2894. 10.1109/TASLP.2020.3030497
27
KüglerA.LammersM.ZangE.KaplanM.MooneyT. (2020). Fluctuations in Hawaii’s humpback whale Megaptera novaeangliae population inferred from male song chorusing off Maui.Endanger. Species Res.43421–434. 10.3354/esr01080
28
KüselE. T.SideriusM.MellingerD. K. (2016). Single-sensor, cue-counting population density estimation: average probability of detection of broadband clicks.The Journal of the Acoustical Society of America1401894–1903. 10.1121/1.4962753
29
LammersM.Fisher-PoolP.AuW.MeyerC.WongK.BrainardR. (2011). Humpback whale (Megaptera novaeangliae) song reveals wintering activity in the Northwestern Hawaiian Islands.Mar. Ecol. Prog. Ser.423261–268. 10.3354/meps08959
30
LeCunY.BengioY.HintonG. (2015). Deep learning.Nature521436–444. 10.1038/nature14539
31
MagnúsdóttirE. E.RasmussenM. H.LammersM. O.SvavarssonJ. (2014). Humpback whale songs during winter in subarctic waters.Polar Biol.37427–433. 10.1007/s00300-014-1448-3
32
MarquesT. A.ThomasL.MartinS. W.MellingerD. K.WardJ. A.MorettiD. J.et al (2013). Estimating animal population density using passive acoustics: passive acoustic density estimation.Biol. Rev.88287–309. 10.1111/brv.12001
33
McDonaldM. A.FoxC. G. (1999). Passive acoustic methods applied to fin whale population density estimation.J. Acoust. Soc. Am.1052643–2651. 10.1121/1.426880
34
MellingerD. K.ClarkC. W. (2000). Recognizing transient low-frequency whale sounds by spectrogram correlation.J. Acoust. Soc. Am.1073518–3529. 10.1121/1.429434
35
MungerL. M.LammersM. O.Fisher-PoolP.WongK. (2012). Humpback whale (Megaptera novaeangliae) song occurrence at American Samoa in long-term passive acoustic recordings, 2008–2009.J. Acoust. Soc. Am.1322265–2272. 10.1121/1.4747014
36
MungerL. M.WigginsS. M.MooreS. E.HildebrandJ. A. (2008). North Pacific right whale (Eubalaena japonica) seasonal and diel calling patterns from long-term acoustic recordings in the southeastern Bering Sea, 2000-2006.Mar. Mamm. Sci.24795–814. 10.1111/j.1748-7692.2008.00219.x
37
OlesonE.CalambokidisJ.BurgessW.McDonaldM.LeDucC.HildebrandJ. (2007). Behavioral context of call production by eastern North Pacific blue whales.Mar. Ecol. Prog. Ser.330269–284. 10.3354/meps330269
38
PayneK. (1983). “Progressive changes in the songs of humpback whales: a detailed analysis of two seasons in Hawaii,” in Communication and Behavior of Whales,ed.PayneR. (Boulder, CO: Westview Press) 9–57.
39
PayneR. S.McVayS. (1971). Songs of humpback whales.Science173585–597. 10.1126/science.173.3997.585
40
RyanJ. P.ClineD. E.JosephJ. E.MargolinaT.SantoraJ. A.KudelaR. M.et al (2019). Humpback whale song occurrence reflects ecosystem variability in feeding and migratory habitat of the northeast Pacific.PLoS One14:e0222456. 10.1371/journal.pone.0222456
41
SandlerM.HowardA.ZhuM.ZhmoginovA.ChenL. C. (2018). “MobileNetV2: inverted residuals and linear bottlenecks,” in Proceedings of the 2018 IEEE/CVF Conference on Computer Vision and Pattern Recognition, (Salt Lake City, UT: IEEE) 4510–4520. 10.1109/CVPR.2018.00474
42
ShallenbergerE. (1977). “Humpback whales in Hawaii population distribution,” in Proceedings of the OCEANS ’77 Conference Record,Los Angeles, CA738–744. 10.1109/OCEANS.1977.1154398
43
ShiuY.PalmerK. J.RochM. A.FleishmanE.LiuX.NosalE. M.et al (2020). Deep neural networks for automated detection of marine mammal species.Sci. Rep.10:607. 10.1038/s41598-020-57549-y
44
ŠirovićA.HildebrandJ. A.WigginsS. M.MooreS. E.McDonaldM. A.ThieleD. (2003). “Seasonality of blue and fin whale calls west of the Antarctic Peninsula,” in Proceedingds of the Oceans 2003. Celebrating the Past. Teaming Toward the Future(IEEE Cat. No.03CH37492)Vol. 2 (San Diego, CA: IEEE) 818. 10.1109/OCEANS.2003.178423
45
StaffordK. M.NieukirkS. L.FoxC. G. (1999). An acoustic link between blue whales in the eastern tropical Pacific and the Northeast Pacific.Mar. Mamm. Sci.151258–1268. 10.1111/j.1748-7692.1999.tb00889.x
46
TanM.LeQ. (2019). “EfficientNet: rethinking model scaling for convolutional neural networks,” in Proceedings of the 36th International Conference on Machine Learning (PMLR),Long Beach, CA6105–6114.
47
VuE.RischD.ClarkC.GaylordS.HatchL.ThompsonM.et al (2012). Humpback whale song occurs extensively on feeding grounds in the western North Atlantic Ocean.Aquat. Biol.14175–183. 10.3354/ab00390
48
WangY.GetreuerP.HughesT.LyonR. F.SaurousR. A. (2017). “Trainable frontend for robust and far-field keyword spotting,” in Proceedings of the 2016 IEEE International Conference on Acoustics, Speech and Signal Processing (ICASSP),New Orleans, LA5670–5674. 10.1109/ICASSP.2017.7953242
49
WeinsteinB. G. (2018). A computer vision for animal ecology.J. Anim. Ecol.87533–545. 10.1111/1365-2656.12780
50
WigginsS. M.HildebrandJ. A. (2007). “High-frequency Acoustic Recording Package (HARP) for broad-band, long-term marine mammal monitoring,” in Proceedings of the 2007 Symposium on Underwater Technology and Workshop on Scientific Use of Submarine Cables and Related Technologies, (Tokyo: IEEE) 551–557. 10.1109/UT.2007.370760
51
WinnH. E.ThompsonT. J.CummingsW. C.HainJ.HudnallJ.HaysH.et al (1981). Song of the humpback whale- population comparisons.Behav. Ecol. Sociobiol.841–46. 10.1007/BF00302842
52
WinnH. E.WinnL. K. (1978). The song of the humpback whale (Megaptera novaeangliae) in the West Indies.Mar. Biol.4797–114. 10.1007/BF00395631
53
ZhongM.CastelloteM.DodhiaR.Lavista FerresJ.KeoghM.BrewerA. (2020). Beluga whale acoustic signal classification using deep learning neural network models.J. Acoust. Soc. Am.1471834–1841. 10.1121/10.0000921
Summary
Keywords
deep machine learning, convolutional neural network, humpback whale (Megaptera novaeangliae), seasonal occurrence, Hawaii, Mariana Islands, Kingman Reef, passive acoustic monitoring
Citation
Allen AN, Harvey M, Harrell L, Jansen A, Merkens KP, Wall CC, Cattiau J and Oleson EM (2021) A Convolutional Neural Network for Automated Detection of Humpback Whale Song in a Diverse, Long-Term Passive Acoustic Dataset. Front. Mar. Sci. 8:607321. doi: 10.3389/fmars.2021.607321
Received
16 September 2020
Accepted
09 February 2021
Published
17 March 2021
Volume
8 - 2021
Edited by
Miles James Parsons, Australian Institute of Marine Science (AIMS), Australia
Reviewed by
Sofie Van Parijs, Northeast Fisheries Science Center (NOAA), United States; Stefan Kahl, Cornell Lab of Ornithology, United States
Updates
Copyright
© 2021 Allen, Harvey, Harrell, Jansen, Merkens, Wall, Cattiau and Oleson.
This is an open-access article distributed under the terms of the Creative Commons Attribution License (CC BY). The use, distribution or reproduction in other forums is permitted, provided the original author(s) and the copyright owner(s) are credited and that the original publication in this journal is cited, in accordance with accepted academic practice. No use, distribution or reproduction is permitted which does not comply with these terms.
*Correspondence: Ann N. Allen, ann.n.allen@gmail.com
This article was submitted to Marine Megafauna, a section of the journal Frontiers in Marine Science
Disclaimer
All claims expressed in this article are solely those of the authors and do not necessarily represent those of their affiliated organizations, or those of the publisher, the editors and the reviewers. Any product that may be evaluated in this article or claim that may be made by its manufacturer is not guaranteed or endorsed by the publisher.