 Sara Hajbane1,2*†‡
 Bruna Calmanovici1,3†‡
 Julia Reisser1,3‡
 Adam Jolly3
 Vyvyan Summers3‡
 Francesco Ferrari4
 Anas Ghadouani1,2‡
 Charitha Pattiaratchi1,2‡
- 1UWA Oceans Institute, The University of Western Australia, Perth, WA, Australia
- 2Oceans Graduate School, The University of Western Australia, Perth, WA, Australia
- 3Minderoo Foundation, Perth, WA, Australia
- 4The Ocean Cleanup Foundation, Rotterdam, Netherlands
Millions of tons of buoyant plastic materials enter oceans annually, the majority originating from terrestrial sources and transported to oceans where oceanographic processes disperse or accumulate them. Some of these materials beach while others accumulate in convergent zones in coastal seas and the open ocean. Although accumulations associated with subtropical gyres, for example, the “Great Pacific Garbage Patch” (GPGP) are well-known, coastal accumulation zones have received less attention. Here we report quantities and characteristics of plastics accumulated in fronts encountered within the Ashmore Reef marine park (Pulau Pasir), northern Australia. These areas, as well as surrounding waters, were sampled using Manta trawls, drone, and snorkel surveys conducted in October 2018. With mean plastic concentrations of 523,146 pieces km−2 for plastics > 500 micron these hotpots contained plastic concentrations an order of magnitude higher than surrounding waters (16,561 pieces km−2) and comparable to the largest known accumulation zone: the GPGP. Furthermore, the mean mass within hotspots was 5,161 g km–2 vs. 9 g km–2 in surrounding waters. Therefore, we classify the features described in this study as types of “Coastal Garbage Patches” (CGPs). Importantly, the coastal fronts accumulating plastics in CGPs are key habitats for many marine species. Biomass outnumbered plastics by weight, with a ratio of 0.521 in CGPs and 0.016 in surrounding waters vs. 287.7 recorded in the GPGP. Polymer types found between the CGPs and GPGP were similar, but plastic films vastly dominated in the CGPs, whilst they were amongst the rarest types found in the GPGP. This study demonstrates the existence of CGPs coinciding with high priority conservation zones in coastal waters and highlights a need for further research into these environments.
Introduction
Fossil fuel-based polymers are a group of very useful materials commonly known as plastics. Through reusing and recycling processes, these materials offer many societal and economic benefits (Andrady and Neal, 2009). However, the current reality is that the vast majority of the plastics produced are only used once, before they are either burned or disposed of in landfills, dumps, waterways, and oceans (Geyer et al., 2017). Environmental, societal, and economic consequences of this linear process of production, use, and disposal are significant. They include air pollution, marine transport of invasive species, pathogens, and other pollutants, as well as damage to organisms via plastic entanglement and ingestion (Lemieux et al., 2004; Gregory, 2009; Wright et al., 2013; Zettler et al., 2013; Vethaak and Leslie, 2016; Viršek et al., 2017).
Global plastic production has been growing exponentially, from 2 million metric tonnes (Mt) in 1950–380 Mt in 2015 (Geyer et al., 2017). Polyethylene (PE) and polypropylene (PP) are the most common polymers, making up nearly 50% of all plastics, with 2015 production of 116 and 68 Mt, respectively (Geyer et al., 2017). Due to their relatively low density and high production percentages, PE and PP are by far the most common polymer types found floating in the world’s oceans (Morét-Ferguson et al., 2010; Hidalgo-Ruz et al., 2012; Reisser et al., 2013, 2014; Cózar et al., 2014; Lebreton et al., 2018). With more than 8 million Mt of plastics entering the oceans annually from coastal populations, and assuming that production proportions are a good indicator for waste proportions, at least 4 million Mt of buoyant PE and PP would annually enter and accumulate in sea surface environments (Jambeck et al., 2015). Yet a global assessment estimates that there is only 250,000 Mt of plastic floating in sea surface waters (Eriksen et al., 2014). The discrepancy between these values poses one of the most elusive questions to plastic pollution researchers (Thompson et al., 2004). A few recent studies have sought out potential explanations for this discrepancy, such as pelagic particle feeders transporting plastic particles vertically (Choy et al., 2019), nano-fragmentation due to weathering (Ter Halle et al., 2016), and the beaching and accumulation of plastic debris on sandy shores (Eriksson et al., 2013). However, these mechanisms do not sufficiently explain the ∼4 orders of magnitude discrepancy between plastics outputs to oceans and those found floating at sea (Lebreton et al., 2019). This is particularly enigmatic, as plastics have been found to be far more persistent in surface waters than previously thought (Erni-Cassola et al., 2019). A key reason for the discrepancy of inputs and plastics found in the neuston layer is hypothesised to be due to greater research focus on large-scale convergence areas. While oceanic gyres and basin-wide studies have sampled and modelled accumulation and retention of plastics in the neuston layer of accumulation zones in offshore areas for a number of years, there is little to no comparable research effort in coastal convergence areas (Vegter et al., 2014; Lebreton et al., 2019).
Most plastics entering the ocean originate from land and are transported to the sea by rivers (GESAMP, 2017). Once at sea, physical processes that lead to convergent flows are one of the most important features for buoyant material transport and accumulation. Convergent flows promote downwelling conditions, but as buoyant materials do not sink, they accumulate along the boundary. The formation of garbage patches at the centre of sub-tropical gyres are due to such largescale convergent flows. Here, wind driven Ekman transport converges at the centre of the sub-tropical gyres creating downwelling conditions. In the open ocean, as well as on continental shelves, convergent flows occur along fronts. By definition, fronts form a boundary between two distinct water masses, or a region where the rate of change of selected physical properties is much greater than the surrounding areas (Bowman and Esaias, 1977; Belkin et al., 2009). Fronts occur on a variety of spatiotemporal scales: from hundreds of meters to many thousands of kilometres. Some are short-lived, but most are quasi-stationary and emerge at the same location when conditions are favourable, and some at seasonal time scales (Belkin et al., 2009). Fronts are considered oases in the ocean, where enhanced nutrient supply through convergence stimulates an increase in biological production at different trophic levels, as well as increasing the export of carbon to deeper waters and overall biogeochemical cycling (Owen, 1981; Belkin et al., 2009; Sarma et al., 2015; Woodsona and Litvinb, 2015; Baltar et al., 2016; Sarkar et al., 2019). Aggregations of plankton, larvae, eggs, and buoyant debris are often found at the surface, whilst predators such as fish, birds, turtles and mammals are found above and beneath the front (GESAMP, 2017). The same mechanisms that create these oases, flow convergence, also act to accumulate buoyant plastics (Van Sebille et al., 2020; Pattiaratchi et al., 2021). Coastal fronts and their potential to accumulate and retain debris, have been less of a focus at meso and sub-mesoscales. Albeit being studied through numerical simulations (D’Asaro et al., 2018), more targeted research has been proposed to understand patterns of pollution in coastal environments over time and interactions with biological productivity (Clark et al., 2016).
There are many types of fronts, which form through different physical processes. They include river plumes, both at the bottom (Acha et al., 2003) and at the surface (Luketina and Imberger, 1989; O’Donnell et al., 1998; Karati et al., 2018; Cole et al., 2020), shelf-sea tidal fronts (Simpson and Hunter, 1974; Nahas et al., 2005; Sharples and Simpson, 2009), shelf break fronts (Sharples and Simpson, 2009), upwelling fronts (Brink, 1987), and those formed through interaction between flow and topography (Wolanski and Hamner, 1988; Pattiaratchi, 1994). Thus, buoyant plastic material discharged from a river may accumulate at a number of different frontal systems in surface waters before they sink, reach oceanic gyres, or beach.
Here we describe and characterise plastic pollution hotspots within coastal fronts we encountered around Ashmore Reef (Pulau Pasir), hereafter “Coastal Garbage Patches” (CGPs). Firstly, we quantified, characterised, and compared plastic within CGPs to surrounding waters at Ashmore Reef. Secondly, we compared quantities and characteristics of CGP plastics to those from the largest accumulation zone in the open ocean: the Great Pacific Garbage Patch (GPGP).
Materials and Methods
Study Site
Ashmore Reef (Pulau Pasir) is an IUCN class 1a Marine reserve located at the edge of the Indian Ocean and Timor Sea, approximately 170 kilometres south of the Indonesian Island of Roti and 320 kilometres northwest of Australia (Parks, 2013; The Department Of Infrastructure Transport Cities and Regional Development, 2016). Ashmore Reef falls within Australian EEZ waters granting traditional access rights to Indonesians for fishing and gravesite visits. It has achieved its protection status due to (1) the high biodiversity of significant fauna, ranging from coral and other invertebrates to pelagic vertebrates, such as endangered locally nesting sea turtles and sea birds, and (2) its extraordinary cultural value to Rotenese traditional fishermen (Richards et al., 2009). Ashmore Reef is located in the Eastern Indian Ocean between Indonesia and Australia (Figure 1). This area dominated by geostrophic flows from the Pacific into the Indian Ocean (Molcard et al., 1994; Yit Sen Bull and van Sebille, 2016). It has a number of interconnected lagoons with several outflows. As described by Wolanski and Hamner (1988) in areas like this, where topography interacts with a prevailing current, complex secondary downstream currents form through a phenomenon known as the island mass effect (Hamner and Hauri, 1981). Particularly reefs that consist of lagoons, where water may separate from the ocean and the physical characteristics of the lagoon waters may change. For example, temperature may change due to heating, as well as salinity due to evaporation. The water may also become more turbid through the presence of organic and/or inorganic material. Thus, when the water exits the lagoon it has different water characteristics to the surrounding ocean water. As a result, coastal fronts are formed creating slicks at their boundaries (Wolanski and Hamner, 1988). The outflows from the lagoon dissipate with the tide to either side of the island depending on the dominant wind regime and create multiple fronts, however, these fronts are not primarily wind driven, and can exist in the absence of winds as well (Wolanski and Hamner, 1988).
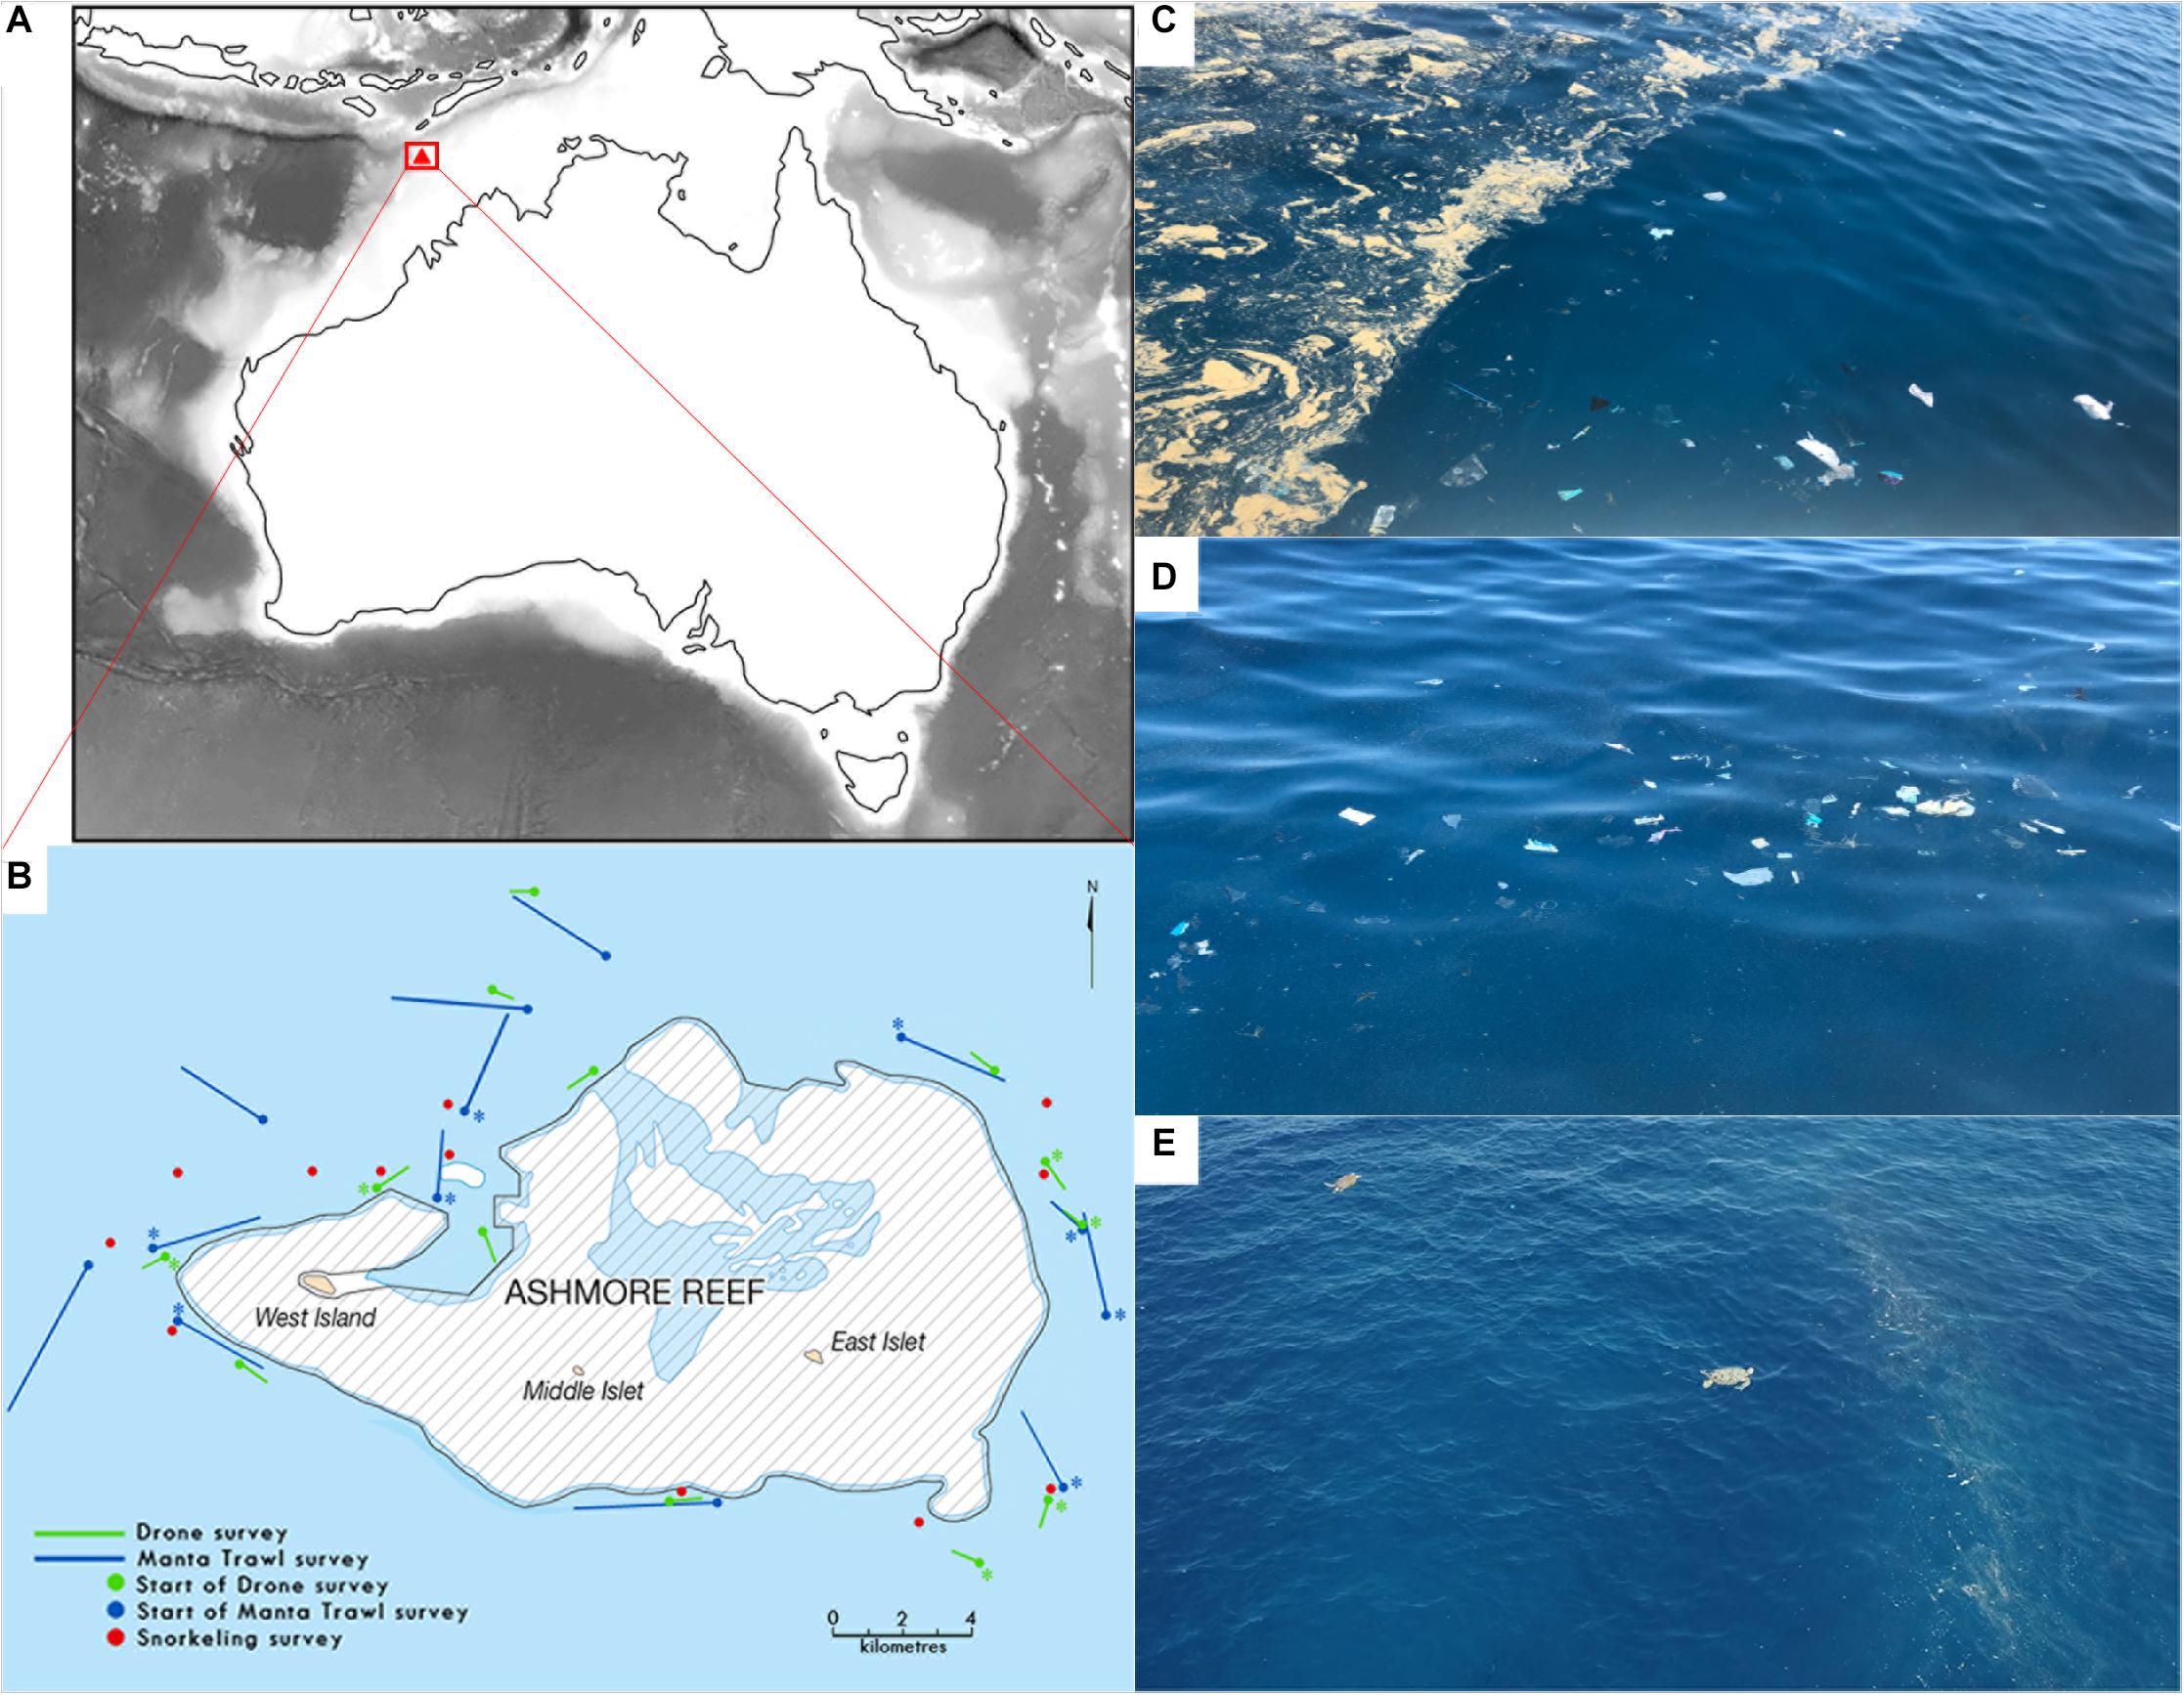
Figure 1. Study area: (A) Map of Australia showing the location of Ashmore Reef (Pulau Pasir). (B) Ashmore Reef, showing sites surveyed via drone flights (n = 13), Manta net tows (n = 13), and snorkelling surveys (n = 12). Locations of coastal garbage patches (CGPs) sampled are indicated with asterisks (∗). Scale in bottom right corner = 4 km; (C,D) close-up photographs of the CGPs taken from the vessel. (E) Still photograph from drone footage capturing two sea turtles feeding along a CGP.
Field Methods
From the 2nd to the 7th of October 2018, we conducted a field campaign aboard the MY Pangaea Ocean Explorer that sampled various sites at Ashmore Reef (Pulau Pasir), located in north-western waters of the Australian EEZ (Figure 1). Here, a number of CGPs were encountered with visible accumulated plastics, organisms, and feeding megafauna. We subsequently targeted these CGPs for sampling, alongside randomly selected areas in surrounding waters (Figure 1). We carried out 13 sea surface net tows using manta trawls (n = 8 in CGPs, n = 5 in surrounding waters), 13 drone surveys using a Phantom 4 Pro v2 (n = 6 in CGPs, n = 7 in surrounding waters) and 12 snorkel surveys (n = 6 in CGPs, n = 6 in surrounding waters).
Sea surface net tows were carried out for ∼0.5 h each while navigating at ∼ 3 knots in a straight line using a Manta trawl (500 micron mesh = 0.05 cm minimum plastic size retention, 90 cm × 15 cm mouth). Recordings included GPS coordinates for the start and end of each tow, date, duration, wind speed, wave height, and sea state (Beaufort state). All sampling occurred during daytime hours. To minimise cross-contamination the following steps were taken after each net tow: first, the tow net was rinsed with seawater, the single-use cod-end detached, securely sealed and placed in an individually labelled zip-lock bag. The zip-lock bags were then stored in a −20°C freezer and later transported to the laboratory for further analysis. Whenever the scientific crew of the Pangaea Ocean Explorer visually identified a CGP, the crew navigated to the centre of the CGP and sampled in a straight line following the direction of the front boundary. Sampling in a straight line is common procedure with manta nets as it facilitates less error in calculating area covered. However, since the boundaries at fronts curve and meander, rather than present in straight lines, sections of the convergent boundaries were missed during sampling by design. This means that this sampling procedure will give a conservative estimate of total plastics accumulated within the CGPs.
Whenever the wind was lower than 19 knots, drone surveys were conducted at the same dates and locations as the Manta trawl surveys. These aerial surveys utilised a Phantom 4 Pro v2 drone to quantify debris > 5 cm. Each aerial survey had ∼0.25 h duration. The drone flew in automatic mode at 20 m altitude. Each flight started and ended above a ruler placed on a support vessel’s lowest deck—near water level. The ruler was used to ensure consistency in altitude and to calibrate measurements. NADIR images were taken with 85% frontal overlap at equal time intervals. After each aerial survey, the footage was transferred to an external hard drive and the initial and final coordinates of the survey flight, date, and duration were recorded in Excel.
A total of 12 snorkelling surveys were carried out around Ashmore Reef (Figure 1B). Snorkelers randomly collected plastic pieces found at or just underneath the sea surface to gather more large debris. The plastics were stored in separate zip lock bags for each location and the coordinates, date, time and sample ID were recorded. Snorkelling samples were stored in a freezer until ready to be transferred to the laboratory.
Laboratory Methods
Each trawl sample was defrosted and sieved into the following size categories: 0.05–0.15 cm, 0.15–0.5 cm, 0.5–1.5 cm, and > 1.5 cm. Plastic pieces > 1.5 cm were measured with a ruler and further divided into size categories of 1.5–5 cm, 5–10 cm, 10–50 cm, and > 50 cm. Once re-floated with artificial seawater, samples in each sieve were visually inspected for a minimum of 30 min (by BC, SH, and volunteers). To avoid cross-contamination all sieves used to separate size classes were thoroughly washed after each use. Each piece was counted and visually sorted into the following types and subtypes: H type (hard plastic, plastic sheet or film), N type (plastic lines, ropes or fishing nets), P type (pre-production plastic pellets), F type (foam material), O type (other). Plastics within our smallest size class (0.05–0.15 cm) were not categorised by subtype due to the difficulty in handling these small fragments. Then plastics were stored by type in separate, pre-weighted single use petri dishes or aluminium trays to avoid cross-contamination. Samples were dried in the oven at 60°C for 3 h and their dry weight used for all analyses. Additionally, the biomass collected in each sieve size was weighed, both wet and after drying for 12 h. The scales were cleaned thoroughly between each sample of plastic and biomass weighted. Five pieces for each size and type class physically sampled at Ashmore Reef (n = 30 pieces) were randomly selected for polymer composition analysis using Fourier transform infrared spectrometry (FT-IR) and compared against spectra from the Perkin-Elmer ATR of Polymers Library.
Two trained observers (SH, BC) analysed all the DJI Phantom 2 drone footage to record plastics in the size classes 10–50 cm and > 50 cm. The observers took a conservative approach: they only logged debris when they were very confident with its identification. To begin with, a subset of images was analysed by SH and then separately reanalysed by BC. Comparison of the identified objects showed good overlap, assuring reproducibility between observers. Following the same procedure as used in Lebreton et al. (2018), the maximum length and width of plastics were measured using pixel to centimetre conversion (Pix4D, 2019). Top-view length and width were measured and used for mass estimations following the predictive functions shown in Lebreton et al.’s (2018) Supplementary Material, as well as a new predictive function for type “film” plastics (Supplementary Figure 1 in Supplementary Material). For this new function, a subsample (n = 31) containing various plastic film sizes collected during our snorkelling survey were selected, measured in their maximum dimensions and dry-weighted. This plastic film dimensions x weight data was used to create a linear regression (r2 = 0.88) yielding weight estimates for film debris found in the drone imagery, which were previously lacking due to paucity of film debris in the GPGP.
Snorkel samples followed a similar protocol to trawl samples for size, type, colour, and weight recording. Importantly, the recording protocol for snorkel samples focused more specifically on written information found on plastics to determine likely source countries from inscriptions. We recorded production and expiry dates, “made in” country statement, language and polymer type, before returning samples back to the freezer.
Data Analyses
Numerical (pieces km–2) and mass (kg km–2) concentrations of plastic were calculated by dividing the number and mass of plastics within each type and size category by the total area covered by the survey (Manta trawl or drone flight). Additionally, numerical and mass concentrations were corrected for wind mixing following Lebreton et al.’s (2018) (Supplementary Table 7). To calculate proportions of different plastic subtypes, such as films, CGP debris in the size categories 0.05–0.15 cm and > 50 cm were excluded, due to difficulty of distinguishing microscopic debris and lack of sufficient sample size, respectively. To calculate concentrations we included debris from Manta trawls for sizes 0.05–5 cm and from drone surveys for debris > 5 cm.
Results
Quantities
In waters surrounding CGPs the mean numerical and mass concentrations of plastics (> 500 micron) was 16,561 pieces km–2 (min—max range = 1,873–49,909 pieces km–2, median = 7,005 pieces km–2) and 9 g km–2 (2–16 g km–2, median = 5 g km–2), respectively. Mean numerical and mass concentrations within the CGPs were 523,146 pieces km–2 (50,537–2,337,963 pieces km–2, median = 56,045 pieces km–2, Figure 2A) and 5,161 g km–2 (24–31,849 g km–2, median = 577 g km–2), respectively. The mean biomass available in CGPs was 173 g (median = 137, max = 702, min = 14) vs. 57 g (median = 9, max = 230, min = 3) in surrounding waters. The average plastic to biomass ratio for the CGPs was 0.521 (median = 0.101, max = 2.491, min = 0.003, std = 0.87), while in surrounding waters it was 0.016 (median = 0.007, max = 0.03, min = 0.001, std = 0.02). This means that CGP waters contain ∼ three times as much biomass as surrounding waters. They also contain ∼ twice as much biomass as plastic (Figure 2B), whereas in surrounding waters plastic makes up under 2% of the mass. The average areas covered by the trawl (n = 13) and drone (n = 13) surveys were 0.0025 km2 (range = 0.001–0.0038, median = 0.0025 km2) and 0.0203 km2 (range = 0.013–0.024, median = 0.021 km2), respectively.
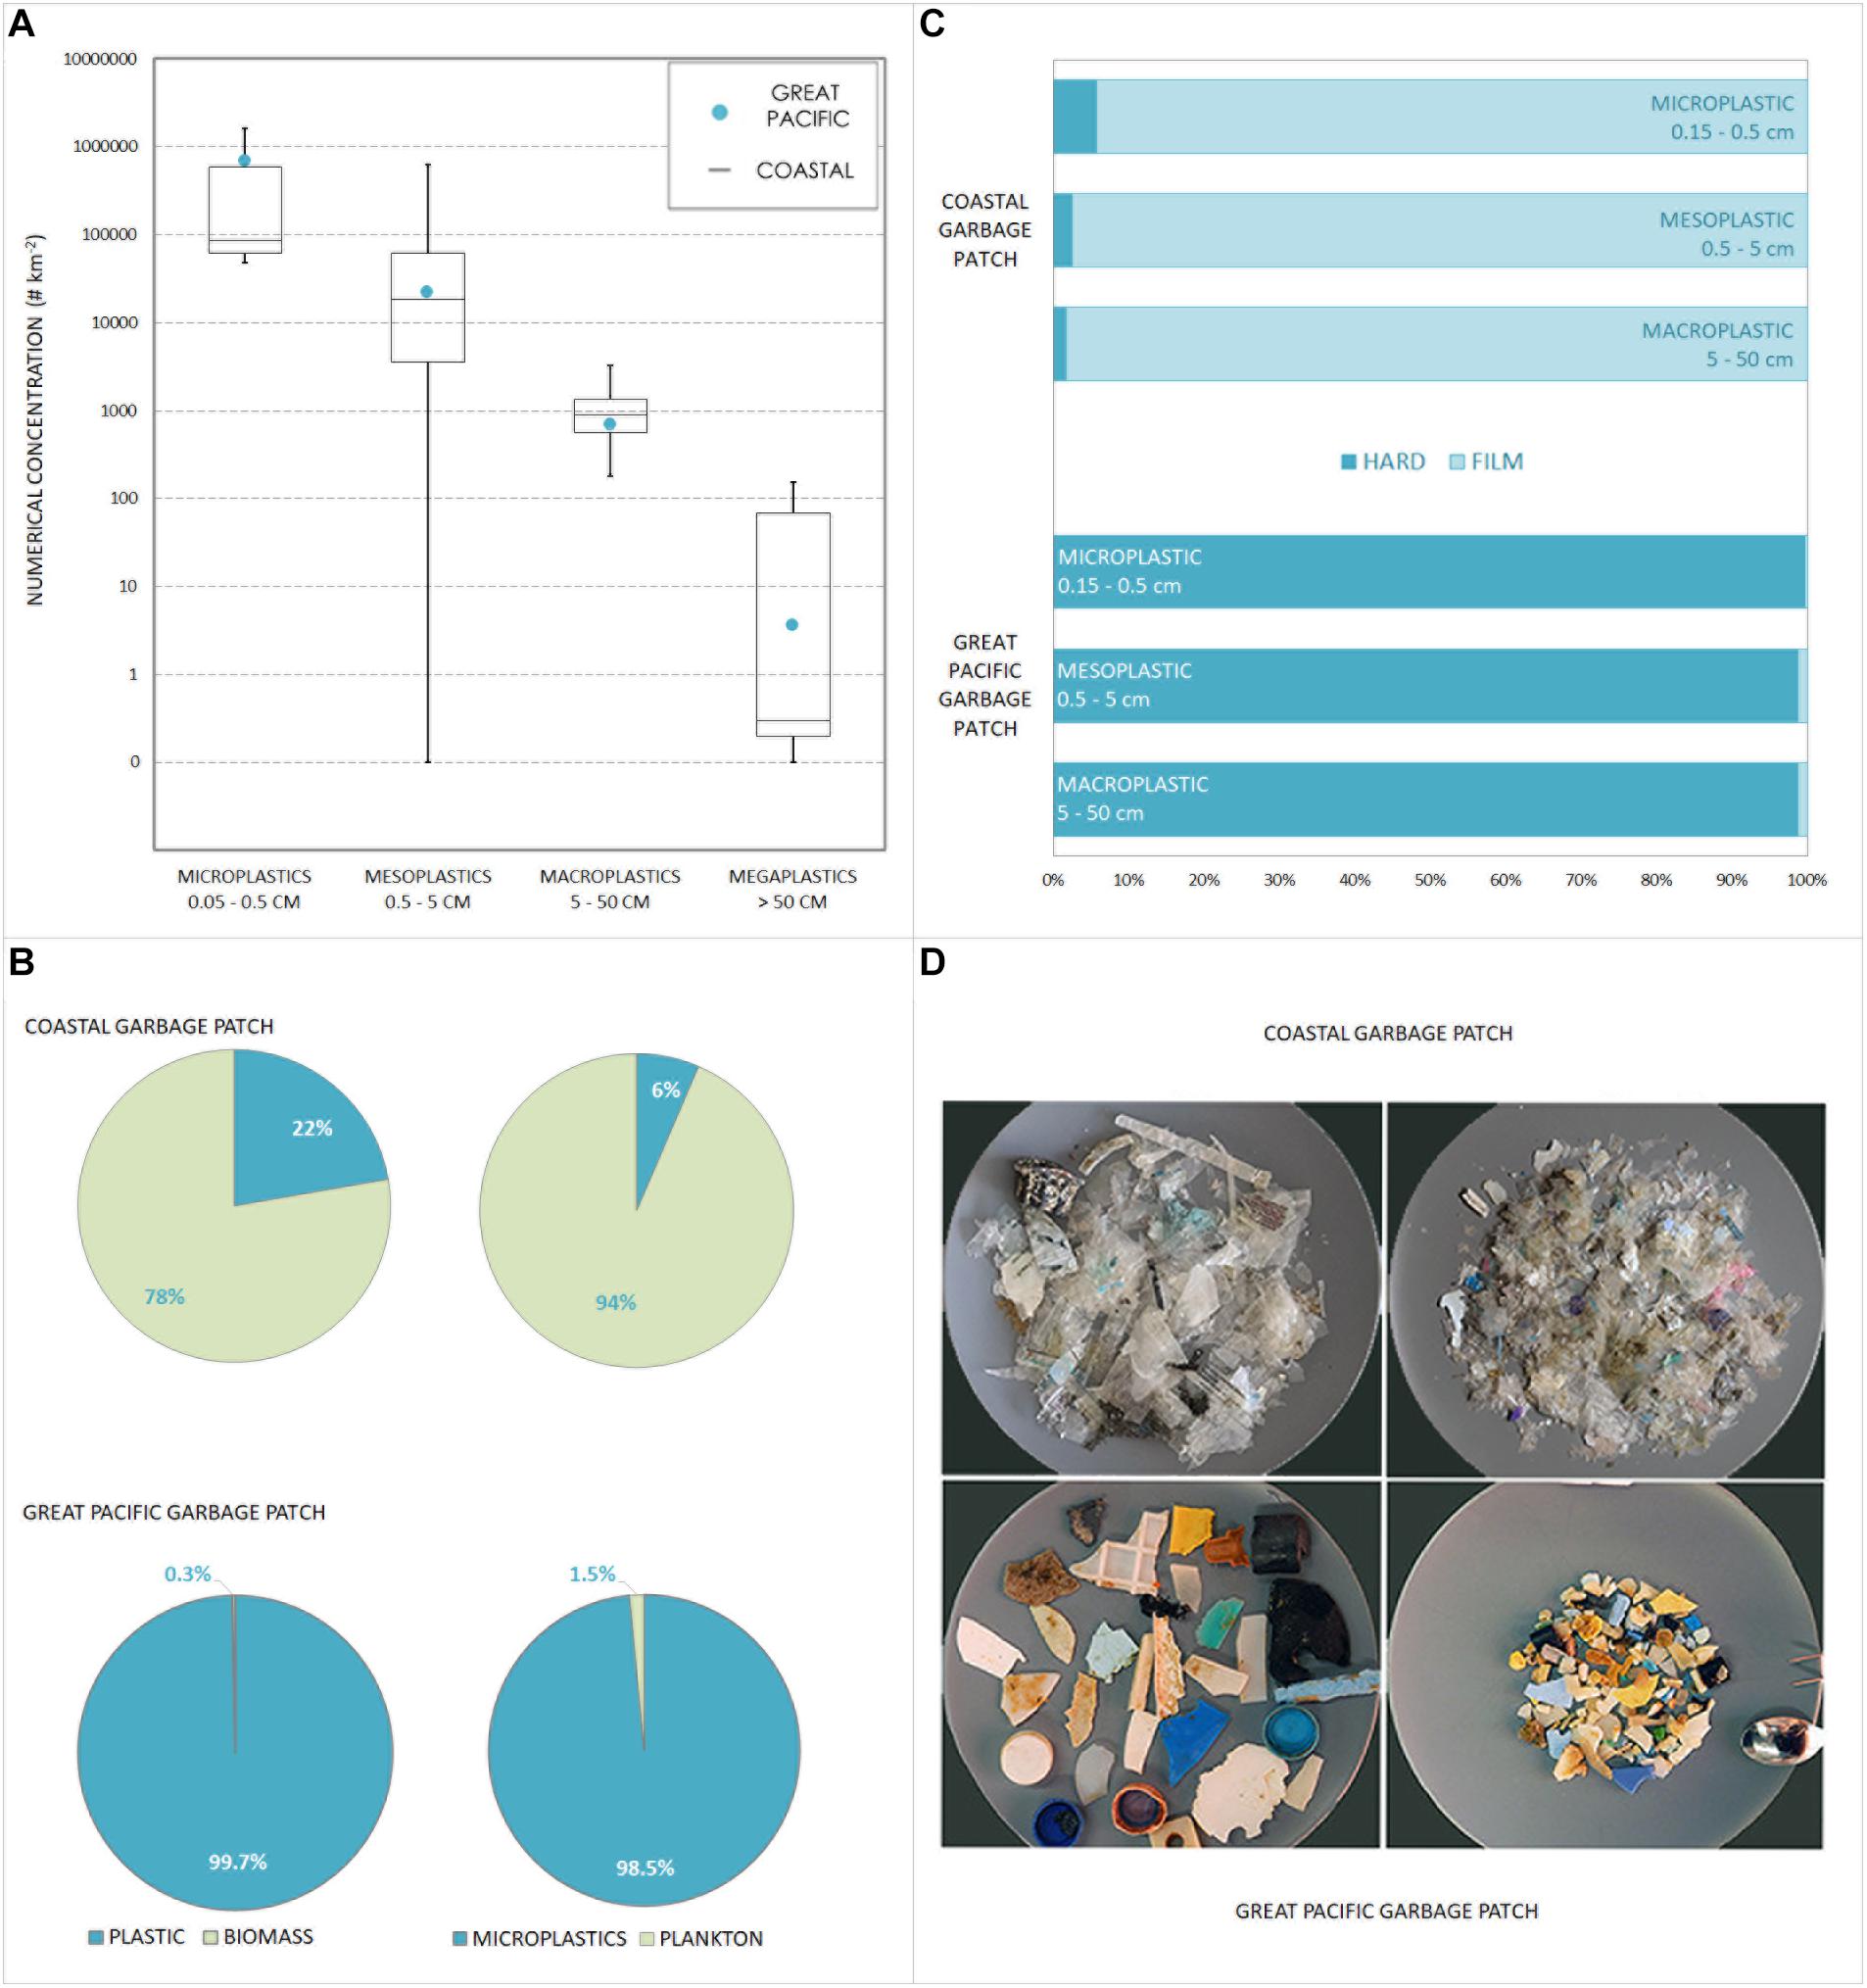
Figure 2. Plastics within a coastal and an oceanic plastic pollution hotspot. (A) Plastic concentrations (pieces/km−2) within a coastal (Ashmore Reef) and an oceanic (Great Pacific Garbage Patch–GPGP) “garbage patch” showing comparable orders of magnitude and proportions across all size classes (micro-, meso-, macro-, and megaplastics). Boxplots represent numerical concentrations for CGP (min, med, max, and SE), and blue dots are mean numerical concentrations for GPGP, as reported by Lebreton et al. (2018). (B) Proportion (in dry weight) of plastics and biota (>0.5 mm), as well as microplastics and plankton (0.5–5 mm) from within CGPs (“coastal”) and GPGP (“oceanic,” Chen et al., 2017). (C) Frequency of occurrence of plastic films and hard plastics within plastic type H collected in Ashmore Reef CGPs (“coastal”) and the GPGP (“oceanic”). (D) Photographs of some plastics type H collected within Ashmore front (“coastal”) and GPGP (“oceanic”), demonstrating the dominance of hard plastics within GPGP and plastic films within CGPs.
Characterisation
Out of the CGP subsample analysed by FT-IR, 73.3% were PE and 23.3% were PP. The dominant type of plastics found in the CGPs sampled for this study was film (2,974 pieces, 83.6%). Other plastics included 5.7% hard/rigid (202 items), and 0.4% foam fragments (13 items) (Figure 2C). Identifiable plastic objects found in the CGP were predominantly single use packaging films, followed by Styrofoam cups and bottle lids in much lesser numbers (Figure 2D). Some debris collected during snorkelling surveys included production or expiry dates and geographical origin evidence. We found items with expiry dates of 2012, 2016, 2018, and 2019. One third of all snorkel survey objects recorded (n = 124) had legible writing (n = 41). Hundred percent of those either stated that the object was “Made in Indonesia” (54%) or had other inscriptions in Indonesian language (46%).
Discussion
Quantities
The most outstanding finding of our field campaign was the encounter of Coastal Garbage Patches (CGPs), i.e., hotspots with concentrations an order of magnitude higher than concentrations in surrounding waters. CGPs had densities of 523,146 pieces km–2 (range = 50,537–2,337,963 pieces km–2) vs. surrounding waters with 16,561 pieces km–2 (1,873–49,909 pieces km–2). The mean concentration in waters surrounding CGPs was within the range of pollution previously found in various coastal areas around the continent (Reisser et al., 2013; Hajbane and Pattiaratchi, 2017; Rudduck et al., 2017). The CGPs are a result of coastal fronts within shallow waters of the Ashmore Reef Marine Park (Richards et al., 2009). Ocean colour images indicated that fronts were a common occurrence along edge of the island, particularly to the west of the reef (Figure 3). These features were present on different days predating and following our sampling, when cloud-free satellite imagery were available in the absence of cloud cover, although not directly coinciding with the sampling period. The sea bed bathymetry around the island is uniform and greater than 200 m depth within 5 km of the atoll, and we are confident that there are no sub-surface features that may contaminate the upwelling light signal at that distance from shore. Using the suspended matter in the outflow as a passive tracer, we could follow the water circulation (e.g., Pattiaratchi et al., 1987; Pattiaratchi, 1994). The imagery indicates that outflow from the lagoon to the north was transported by the prevailing wind and tidal conditions along the northern and eastern shore and was visible as a plume of water to the west, as the lagoon water had different water colour. Chlorophyll levels detected during days of our field campaign also show these fronts (Figure 3B). Evaluation of the composition of the suspended matter (i.e., suspended sediment and/or phytoplankton) is outside the scope of this study.
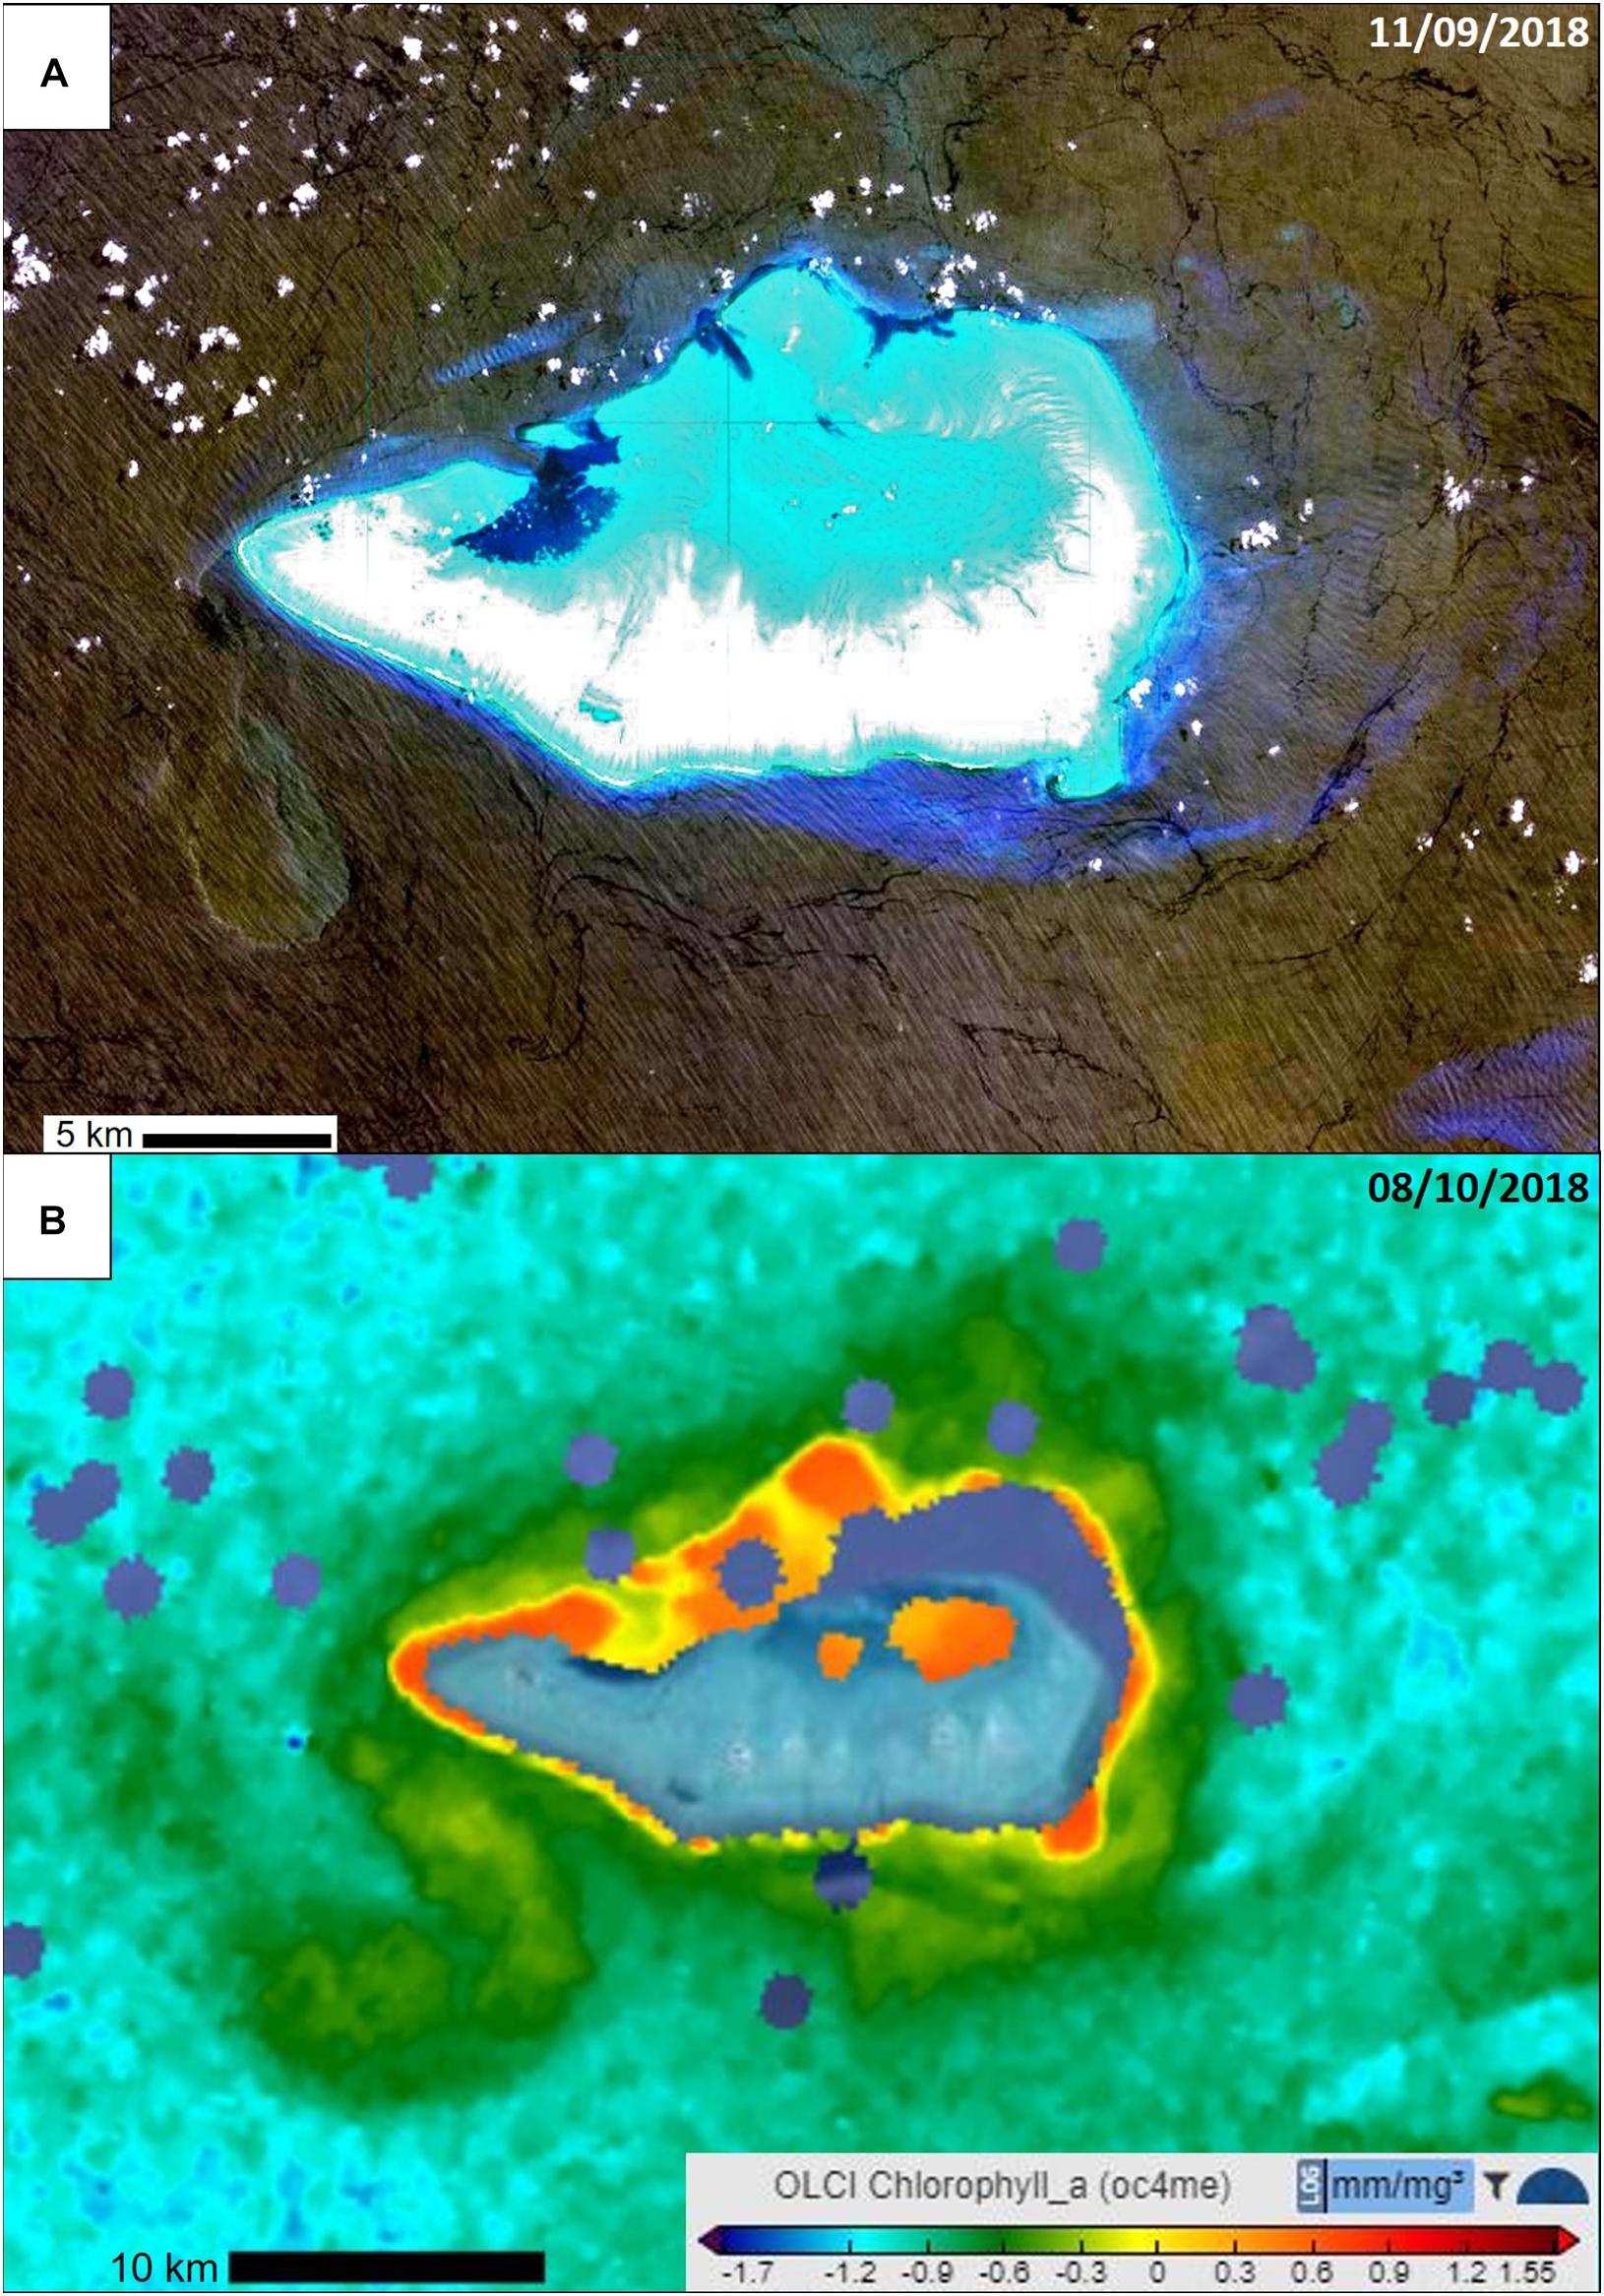
Figure 3. Satellite images of Ashmore Reef showing presence of fronts. (A) False colour composite image taken by Landsat 8 Satellite on the 11/09/18, showing the difference in reflectance associated with frontal boundaries at various points around Ashmore Reef nearly a month before our field campaign (available online: https://eos.com/landsat-8/). (B) A 3 day composite image from Sentinel 3 of Chlorophyll a concentrations around Ashmore reef from the 6-8/10/18 showing the frontal structures around Ashmore Reef and their associated higher productivity (available online: https://s3view.oceandatalab.com/).
Both mean and maximum numerical concentrations within these CGPs were of the same order of magnitude as within the GPGP: CGPs with 523,146 pieces km–2 (range = 50,537–2,337,963 pieces km–2) and GPGP with 700,886 pieces km–2 (4,884–4,847,988 pieces km–2, Lebreton et al., 2018). Sampling CGPs differed from Lebreton et al. (2018), most significantly in terms of the scale of convergent features sampled. We targeted multiple sub-mesoscale features (coastal fronts) rather than one large synoptic feature (subtropical gyre) exhibiting the same convergent processes (Pattiaratchi et al., 2021). Despite the difference in scale, CGP concentrations were of the same order of magnitude as GPGP concentrations across all size classes (Figure 2A; Lebreton et al., 2018). CGP concentrations also exceed the 334,271 pieces km–2 (31,983–969,777 pieces km–2) previously reported by Moore et al. (2001) for the GPGP, and the maximum of 580,000 pieces km–2 reported by Law et al. (2010) for the North Atlantic. It is important to highlight, however, that in terms of mass, the GPGP plastic weight estimate is significantly higher at 69.58 kg km–2 vs. 5.16 kg km–2 for Ashmore Reef CGPs (Lebreton et al., 2018).
Whilst numerical plastic loads in this CGP are comparable to the GPGP, its plastic to biomass ratio is considerably lower: 0.521 (Figure 2B). In the GPGP, the averaged ratio is 287.7 (max = 488.5, min = 129.2, std = 107.9). This means that comparably more prey than plastic is available to sea surface feeders in the CGP, which may have implications to potential plastic-related chemical impacts (Koelmans et al., 2014, 2016). The chemical implications of ocean plastic pollution are still poorly understood and more data on the ratio of plastic and biota are needed to glean a better understanding of specific exposure in different marine regions (Chen et al., 2017).
At Ashmore Reef, surface feeders have ∼twice as much biomass available for consumption as plastic within CGPs, whereas in surrounding waters plastic makes up under 2% of the mass. This is significant, as many marine vertebrates associate with frontal zones for foraging due to their highly accessible biomass productivity, which is in stark contrast with nutrient poor open ocean waters (Scales et al., 2014). This is particularly true for productive coastal fronts, which are accessible to a larger variety of vertebrates, rather than only far-ranging oceanic predators and cetaceans (Scales et al., 2014; Woodsona and Litvinb, 2015). This is supported by our observations of sea turtles feeding in the CGP (Figure 1E) highlighting concerns that interactions between plastics and animals are more likely to occur in coastal areas. Whilst frequency and spatial location of interactions between marine fauna and plastics are still poorly understood, they are conceivably exacerbated where the abundance and diversity of both marine fauna and plastics are the highest (Critchell et al., 2019). Entanglement for example, has already been reported in relation to nesting Brown Booby (Sula leucogaster) colonies at Ashmore Reef (Lavers et al., 2013). Suspected effects of plastics in regions of high productivity have been reported for red phalaropes (Phalaropus fulicarius) as early as the early 1980s (Connors and Smith, 1982). Physical impacts of plastic pollution, such as entanglement and ingestion, are likely to occur more frequently in coastal convergence zones, making them a key focus area for future plastic impact assessments. Protected species of non-selective filter feeders, such as manta rays and whale sharks, are known to aggregate and feed in frontal zones, where they may encounter and ingest plastics in high concentrations (Germanov et al., 2019). Whilst sampling during daytime hours exclusively presents limitations on the capture of biota within our sampling regime, the spatial variability in plastic concentration and well as plastic to biomass ratios in CGPs compared to surrounding waters is remarkable. Future research would benefit from additionally addressing diurnal patterns of plastic and biomass in coastal hotspots to further our understanding of these systems, as would studies on the structure of biofouling organisms, both of which were outside the scope of this paper (Bravo et al., 2011; Fazey and Ryan, 2016a). The relatively understudied Indian Ocean is famous for its high plastic waste input sources, and the formation of frequent oceanic fronts, therefore research into CGPs in Indian Ocean fronts in particular is highly recommended (Jambeck et al., 2015; van der Mheen et al., 2019, 2020).
Characterisation
The majority of CGP plastics analysed by FT-IR were PE (73.3%) and PP (23.3%). These findings are comparable with proportions found in the GPGP, with 63.6% PE and 20.5% PP (Lebreton et al., 2018). Whilst FTIR spectra showed no deviations in the sampled polymer proportions between the CGPs and GPGP, we found markedly different plastic types (Figure 2C and Supplementary Figure 2). In contrast to widely sampled oceanic accumulation zones, the dominant type of plastics found in the CGPs was film (93%), whereas hard plastic made up merely 5.7%. In the GPGP the most dominant type is hard plastics (151,579 pieces, 94.5%), whereas films were rare (1,008 pieces, 0.6%, Lebreton et al., 2018). In surrounding waters of Ashmore Reef, hard plastic was marginally more common with 45% hard plastics and 37% films. In contrast to the GPGP both the CGPs (1%) and surrounding waters (14%) showed low presence of fishing related debris in the shape of plastic lines or buoys, indicating low fisheries related pollution sources. This partially explains the outstanding difference in mass between CGPs and the GPGP. We attribute this to the predominant CGP subtype of film having lower density and weight than hard plastics and fishing lines. These types dominated in the GPGP, where large ropes and “ghostnets” made up 52% of the overall mass (Lebreton et al., 2018). No exceptionally large and heavy ghost nets were found in the Ashmore Reef study area.
The low detection of plastic films is also evident in other open ocean basins (Morris, 1980; Law et al., 2010; Morét-Ferguson et al., 2010; Eriksen et al., 2013). To date films or soft plastics are often only reported as fragments or filaments, even when identified as plastic bags or sheets, and particularly when fragmented (Ryan, 1988; Chubarenko et al., 2016; Gewert et al., 2017). Due to this significant inconsistency in the reporting and quantification of films, it is unclear whether similarly high proportions as found here are common in coastal waters globally, despite evidence that open ocean waters lack high proportions of plastic films at a global scale (Morris, 1980; Law et al., 2010; Morét-Ferguson et al., 2010; Eriksen et al., 2013). However, most studies that do report high proportions of plastic films in surface waters are located in shallow coastal areas, with the notable exception of the Bay of Bengal (Nash, 1991; Thiel et al., 2003; Ryan, 2013; Germanov et al., 2019). Fragmentation rates of films suspended in seawater are low, and whilst it is possible for plastics in coastal accumulation zones to beach and fragment on sandy shores, films do not make up the majority of plastic types washed up on beaches in the Indian Ocean (Duhec et al., 2015; Imhof et al., 2017; Kalogerakis et al., 2017). Therefore, we hypothesise that sinking is the most significant process for removing plastic films from coastal waters, before they reach oceanic basins in large quantities. Studies have shown that thinner buoyant micro plastics in an experimental setup have much shorter surface longevity than their thicker counterparts (Fazey and Ryan, 2016a). Additionally, a clear trend in films decreasing dramatically away from source locations was observed in South Africa (Ryan, 2015). Films found sunk to the seafloor in large quantities, because of biofilm formation over short time periods have been reported as early as the 1970s in coastal environments (Holmström, 1975; Lobelle and Cunliffe, 2011; Chubarenko et al., 2016). This process may be exacerbated in regions of high biological production along coastal frontal systems, due to biofilm formation causing more rapid sedimentation for particles with low buoyancy (Ryan, 2015; Fazey and Ryan, 2016a,b). Yet, an interesting finding here is that debris with an expiry date dating 6 years back was found during our field campaign. More thorough investigations of specific plastic or object types, such as in Ryan (2020), could also be applied to various CGP’s around the world in future research. Ongoing research is required to improve our understanding of biofilm growth and the effects on rates of sinking across different plastic types in free-floating rather than tethered experimental setups (Fazey and Ryan, 2016a). Another factor that could explain films being removed from surface waters before reaching oceanic gyres is that fauna may interfere and exacerbate the process. A number of species, such as a variety of sea turtles selectively target and ingest films in particular, and could contribute to the breakdown and removal of films before they reach oceanic waters (Mrosovsky et al., 2009; Tourinho et al., 2010; Duncan et al., 2019).
Irrespective of the cause of plastic film losses from coastal waters, the mismatch in film proportions between CGPs and GPGP waters, in conjunction with the numerical concentrations comparable to the GPGP found here is noteworthy. It may be a possible clue to understanding global plastic distributions in surface waters better, and coming closer to solving the mystery of the “missing plastics.” Trapping and eventual removal of films in CGPs associated with fronts all around the world could partially explain the discrepancy between the 8 million Mt of plastics entering oceans annually, and the ∼250,000 tons of buoyant estimated to be floating at sea from open ocean estimates (Eriksen et al., 2014). Especially when we consider that roughly half (∼4 million Mt) are non-buoyant plastics that sink immediately, and films are dominant in coastal waters of various places around the world (Nash, 1991; Thiel et al., 2003; Germanov et al., 2019). Plastic film production is roughly 37% of all PE and PP plastics produced annually, therefore out of 381 million Mt produced annually about 80 million are buoyant plastic films (ECI, 2016a,b; Geyer et al., 2017). Assuming that production proportions roughly equal emission proportions for the ∼8 million Mt entering our oceans annually, this would amount to around 1.7 million Mt of plastic film entering coastal waters every year. This figure is likely an underestimation, as plastic films are of low value for recycling streams and therefore rarely salvaged from waste streams (Merkl et al., 2015). When considering these figures and that fronts commonly occur in coastal areas and at many scales around the world, we may need to consider that current modelling and fieldwork planning approaches may not detect or lead effective capture of these environments.
All samples collected during snorkel surveys with legible writing, had either Indonesian writing or “Made in Indonesia” statements. This this result is expected given the location of the study site being close to the Indonesian mainland and downstream of Indonesian Throughflow currents (van Sebille et al., 2014; Yit Sen Bull and van Sebille, 2016; Wijeratne et al., 2018). It is notable that this result indicates a single source of debris, as opposed to mixed sources encountered in other areas of comparable plastic loads such as the GPGP. The closest major population area is Kupang in West Timor at 230 km, making it the most likely primary source of plastics encountered. The next closest cities are Dili in East Timor at 490 km and Darwin in Australia’s Northern Territory at 850 km. These locations are sources of lesser likelihood, respectively, given the dominance of Indonesian writing and “Made in” statements on debris recovered during snorkel surveys. Additionally, recent modelling confirms that the majority of transboundary plastics making their way into Australian waters come from Indonesia (Galaiduk et al., 2020). Mitigation and management of single sources of plastic are conceivably far less complex than multi-source accumulations once plastics reach open ocean waters. The shared access nature of Ashmore Reef Marine Park under a Memorandum of Understanding between Australia and Indonesia means that this mutually important location can present a particularly interesting starting point to develop and implement direly needed international collaboration and transboundary governance approaches (Vince and Hardesty, 2017; Galaiduk et al., 2020).
Final Remarks
In this paper we describe plastic accumulation hotspots in Australian waters with concentrations comparable to the largest accumulation zone in the open ocean; the so-called “Great Pacific Garbage Patch” (GPGP, Lebreton et al., 2018). We compared the characteristics of the observed CGPs, with those of GPGP. In addition to high concentrations of plastics, the sites sampled coincided with visible coastal fronts, which are considered priority conservation areas, due to their ecological role as foraging and migration habitats for mobile marine vertebrates (Scales et al., 2014; Woodsona and Litvinb, 2015). The sampled waters had much higher biological productivity and therefore lower plastic to biomass ratio than the GPGP (Moore et al., 2001). The differences observed between CGPs and surrounding waters, as well as between CGPs and the GPGP are remarkable. Furthermore, we found that while PE and PP in the form of films dominated the CGPs, these debris types were rare in the GPGP, in which PE and PP items with low surface to volume ratio (i.e., hard plastics and bundled fishing nets) were dominant.
Here we identified coastal fronts as accumulation zones of buoyant plastics and these results may be applicable to similar regions globally. We highly recommend the research community to increase a research focus on various types of fronts, and to ensure their findings are well integrated with global analyses of plastic loads at the sea surface.
Data Availability Statement
The datasets presented in this study can be found in online repositories. The names of the repository/repositories and accession number(s) can be found below: https://figshare.com/articles/dataset/Plastic_Metadata_xlsx/12433823/3.
Author Contributions
JR, AJ, and VS designed and undertook fieldwork for this manuscript as part of a larger field campaign. SH and BC performed the laboratory analyses under guidance of JR, CP, and FF, and processed all data. SH wrote the manuscript and produced the figures with help and inputs from all co-authors. All authors contributed to the article and approved the submitted version.
Funding
This project was funded by the University of Western Australia, UWA Oceans Institute and the Minderoo Foundation. SH was supported by the UWA University Postgraduate Award and Australian Research Training Program scholarships.
Conflict of Interest
The authors declare that the research was conducted in the absence of any commercial or financial relationships that could be construed as a potential conflict of interest.
The reviewer VM-V declared a past co-authorship with one of the authors JR to the handling editor.
Acknowledgments
We are thankful to the technical field crew of the expedition: Nikki DeCampe and Claire Raphael, the crew of the MY Pangaea Ocean Explorer, as well as our lab volunteers: Chao Lyu, Gabriel Kovesi, and Eilish Jones. Further, we would like to thank Jessica Meeuwig, Andrew Forrest, and Rory McAuley. We acknowledge the UWA Oceans Institute, as well as the Centre for Microscopy, Characterisation and Analysis for their laboratory facilities, and scientific and technical assistance.
Supplementary Material
The Supplementary Material for this article can be found online at: https://www.frontiersin.org/articles/10.3389/fmars.2021.613399/full#supplementary-material
References
Acha, E. M., Mianzan, H. W., Iribarne, O., Gagliardini, D. A., Lasta, C., and Daleo, P. (2003). The role of the rio de la plata bottom salinity front in accumulating debris. Mar. Pollut. Bull. 46, 197–202. doi: 10.1016/s0025-326x(02)00356-9
Andrady, A. L., and Neal, M. A. (2009). Applications and societal benefits of plastics. Philos. Trans. R. Soc. B Biol. Sci. 364, 1977–1984. doi: 10.1098/rstb.2008.0304
Baltar, F., Currie, K., Stuck, E., Roosa, S., and Morales, S. E. (2016). Oceanic fronts: transition zones for bacterioplankton community composition. Environ. Microbiol. Rep. 8, 132–138. doi: 10.1111/1758-2229.12362
Belkin, I. M., Cornillon, P. C., and Sherman, K. (2009). Fronts in large marine ecosystems. Progr. Oceanogr. 81, 223–236. doi: 10.1016/j.pocean.2009.04.015
Bowman, M. J., and Esaias, W. E. (1977). Coastal jets, fronts, and phytoplankton patchiness. Elsevier Oceanogr. Ser. 19, 255–268. doi: 10.1016/s0422-9894(08)70846-8
Bravo, M., Astudillo, J. C., Lancellotti, D., Luna-Jorquera, G., Valdivia, N., and Thiel, M. (2011). Rafting on abiotic substrata: properties of floating items and their influence on community succession. Mar. Ecol. Prog. Ser. 439, 1–17. doi: 10.3354/meps09344
Brink, K. H. (1987). Upwelling fronts: implications and unknowns. S. Afr. J. Mar. Sci. 5, 3–9. doi: 10.2989/025776187784522315
Calmanovici, B., Hajbane, S., Reisser, J., Jolly, A., Summers, V., Ferrari, F., et al. (2020). Ocean Plastic Data from the 2018–2019 Voyages Aboard RV Pangaea. Australia: Figshare. doi: 10.6084/m9.figshare.12433823.v3
Chen, Q., Reisser, J., Cunsolo, S., Kwadijk, C., Kotterman, M., Proietti, M., et al. (2017). Pollutants in plastics within the North Pacific subtropical gyre. Environ. Sci. Technol. 52, 446–456. doi: 10.1021/acs.est.7b04682
Choy, C. A., Robison, B. H., Gagne, T. O., Erwin, B., Firl, E., Halden, R. U., et al. (2019). The vertical distribution and biological transport of marine microplastics across the epipelagic and mesopelagic water column. Sci. Rep. 9:7843.
Chubarenko, I., Bagaev, A., Zobkov, M., and Esiukova, E. (2016). On some physical and dynamical properties of microplastic particles in marine environment. Mar. Pollut. Bull. 108, 105–112. doi: 10.1016/j.marpolbul.2016.04.048
Clark, J. R., Cole, M., Lindeque, P. K., Fileman, E., Blackford, J., Lewis, C., et al. (2016). Marine microplastic debris: a targeted plan for understanding and quantifying interactions with marine life. Front. Ecol. Environ. 14, 317–324. doi: 10.1002/fee.1297
Cole, K. L., Macdonald, D. G., Kakoulaki, G., and Hetland, R. D. (2020). River plume source-front connectivity. Ocean Model. 101571, 1–11.
Connors, P. G., and Smith, K. G. (1982). Oceanic plastic particle pollution: suspected effect on fat deposition in red phalaropes. Mar. Pollut. Bull. 13, 18–20. doi: 10.1016/0025-326x(82)90490-8
Cózar, A., Echevarría, F., González-Gordillo, J. I., Irigoien, X., Úbeda, B., Hernández-León, S., et al. (2014). Plastic debris in the open ocean. Proc. Natl. Acad. Sci. U.S.A. 111, 10239–10244.
Critchell, K., Hamann, M., Wildermann, N., and Grech, A. (2019). Predicting the exposure of coastal species to plastic pollution in a complex island archipelago. Environ. Pollut. 252, 982–991. doi: 10.1016/j.envpol.2019.06.031
D’Asaro, E. A., Shcherbina, A. Y., Klymak, J. M., Molemaker, J., Novelli, G., and Guigand, C. M. (2018). Ocean convergence and the dispersion of flotsam. Proc. Natl. Acad. Sci. U.S.A. 115, 1162–1167. doi: 10.1073/pnas.1718453115
Duhec, A. V., Jeanne, R. F., Maximenko, N., and Hafner, J. (2015). Composition and potential origin of marine debris stranded in the Western Indian Ocean on remote Alphonse Island. Seychelles Mar. Pollut. Bull. 96, 76–86. doi: 10.1016/j.marpolbul.2015.05.042
Duncan, E. M., Arrowsmith, J. A., Bain, C. E., Bowdery, H., Broderick, A. C., Chalmers, T., et al. (2019). Diet-related selectivity of macroplastic ingestion in green turtles (Chelonia mydas) in the eastern Mediterranean. Sci. Rep. 9:11581.
ECI (2016a). Uses of Poly(Ethene) (Polyethylene). York, Uk: University of York Centre for Industry Education Collaboration.
ECI (2016b). Uses of Poly(Propene) (Polypropylene). York, Uk: University of York Centre for Industry Education Collaboration.
Eriksen, M., Lebreton, L. C., Carson, H. S., Thiel, M., Moore, C. J., Borerro, J. C., et al. (2014). Plastic pollution in the world’s oceans: more than 5 trillion plastic pieces weighing over 250,000 tons afloat at sea. PLoS One 9:e111913. doi: 10.1371/journal.pone.0111913
Eriksen, M., Maximenko, N., Thiel, M., Cummins, A., Lattin, G., Wilson, S., et al. (2013). Plastic pollution in the South Pacific subtropical gyre. Mar. Pollut. Bull. 68, 71–76. doi: 10.1016/j.marpolbul.2012.12.021
Eriksson, C., Burton, H., Fitch, S., Schulz, M., and Van Den Hoff, J. (2013). Daily accumulation rates of marine debris on sub-Antarctic island beaches. Mar. Pollut. Bull. 66, 199–208. doi: 10.1016/j.marpolbul.2012.08.026
Erni-Cassola, G., Zadjelovic, V., Gibson, M. I., and Christie-Oleza, J. A. (2019). Distribution of plastic polymer types in the marine environment; a meta-analysis. J. Hazard. Mater. 369, 691–698. doi: 10.1016/j.jhazmat.2019.02.067
Fazey, F. M., and Ryan, P. G. (2016a). Biofouling on buoyant marine plastics: an experimental study into the effect of size on surface longevity. Environ. Pollut. 210, 354–360. doi: 10.1016/j.envpol.2016.01.026
Fazey, F. M., and Ryan, P. G. (2016b). Debris size and buoyancy influence the dispersal distance of stranded litter. Mar. Pollut. Bull. 110, 371–377. doi: 10.1016/j.marpolbul.2016.06.039
Galaiduk, R., Lebreton, L., Techera, E., and Reisser, J. (2020). Transnational plastics: an australian case for global action. Front. Environ. Sci. 8:115.
Germanov, E. S., Marshall, A. D., Hendrawan, I. G., Admiraal, R., Rohner, C. A., Argeswara, J., et al. (2019). Microplastics on the menu: plastics pollute Indonesian manta ray and whale shark feeding grounds. Front. Mar. Sci. 6:679.
GESAMP (2017). Imo/Fao/Unesco-Ioc/Unido/Wmo/Iaea/Un/Un Environment/Undp Joint Group of Experts on the Scientific Aspects of Marine Environmental Protection.. 2017, Report of the forty-fourth session of Gesamp, 4 to 7 September 2017. Rep. Stud. Gesamp No. 96/Gaw Report No. 237. Geneva
Gewert, B., Ogonowski, M., Barth, A., and Macleod, M. (2017). Abundance and composition of near surface microplastics and plastic debris in the Stockholm Archipelago. Baltic Sea. Mar. Pollut. Bull. 120, 292–302. doi: 10.1016/j.marpolbul.2017.04.062
Geyer, R., Jambeck, J. R., and Law, K. L. (2017). Production, use, and fate of all plastics ever made. Sci. Adv. 3:e1700782. doi: 10.1126/sciadv.1700782
Gregory, M. R. (2009). Environmental implications of plastic debris in marine settings—entanglement, ingestion, smothering, hangers-on, hitch-hiking and alien invasions. Philos. Trans. R. Soc. B Biol. Sci. 364, 2013–2025. doi: 10.1098/rstb.2008.0265
Hajbane, S., and Pattiaratchi, C. B. (2017). Plastic pollution patterns in offshore, nearshore and estuarine waters: a case study from Perth, Western Australia. Front. Mar. Sci. 4:63.
Hamner, W. M., and Hauri, I. R. (1981). Effects of island mass: water flow and plankton pattern around a reef in the great barrier reef lagoon. Aust. Limnol. Oceanogr. 26, 1084–1102. doi: 10.4319/lo.1981.26.6.1084
Hidalgo-Ruz, V., Gutow, L., Thompson, R. C., and Thiel, M. (2012). Microplastics in the marine environment: a review of the methods used for identification and quantification. Environ. Sci. Technol. 46, 3060–3075. doi: 10.1021/es2031505
Holmström, A. (1975). Plastic films on the bottom of the Skagerack. Nature 255, 622–623. doi: 10.1038/255622a0
Imhof, H. K., Sigl, R., Brauer, E., Feyl, S., Giesemann, P., Klink, S., et al. (2017). Spatial and temporal variation of macro-, meso-and microplastic abundance on a remote coral island of the Maldives, Indian Ocean. Mar. Pollut. Bull. 116, 340–347. doi: 10.1016/j.marpolbul.2017.01.010
Jambeck, J. R., Geyer, R., Wilcox, C., Siegler, T. R., Perryman, M., Andrady, A., et al. (2015). Plastic waste inputs from land into the ocean. Science 347, 768–771. doi: 10.1126/science.1260352
Kalogerakis, N., Karkanorachaki, K., Kalogerakis, G., Triantafyllidi, E. I., Gotsis, A. D., Partsinevelos, P., et al. (2017). Microplastics generation: onset of fragmentation of polyethylene films in marine environment mesocosms. Front. Mar. Sci. 4:84.
Karati, K. K., Vineetha, G., Raveendran, T. V., Muraleedharan, K. R., Habeebrehman, H., Philson, K. P., et al. (2018). River plume fronts and their implications for the biological production of the Bay of Bengal, Indian Ocean. Mar. Ecol. Prog. Ser. 597, 79–98. doi: 10.3354/meps12607
Koelmans, A. A., Bakir, A., Burton, G. A., and Janssen, C. R. (2016). Microplastic as a vector for chemicals in the aquatic environment: critical review and model-supported reinterpretation of empirical studies. Environ. Sci. Technol. 50, 3315–3326. doi: 10.1021/acs.est.5b06069
Koelmans, A. A., Besseling, E., and Foekema, E. M. (2014). Leaching of plastic additives to marine organisms. Environ. Pollut. 187, 49–54. doi: 10.1016/j.envpol.2013.12.013
Lavers, J. L., Hodgson, J. C., and Clarke, R. H. (2013). Prevalence and composition of marine debris in Brown Booby (Sula leucogaster) nests at ashmore reef. Mar. Pollut. Bull. 77, 320–324. doi: 10.1016/j.marpolbul.2013.09.026
Law, K. L., Morét-Ferguson, S., Maximenko, N. A., Proskurowski, G., Peacock, E. E., Hafner, J., et al. (2010). Plastic accumulation in the North Atlantic subtropical gyre. Science 329, 1185–1188. doi: 10.1126/science.1192321
Lebreton, L., Egger, M., and Slat, B. (2019). A global mass budget for positively buoyant macroplastic debris in the ocean. Sci. Rep. 9:1814.
Lebreton, L., Slat, B., Ferrari, F., Sainte-Rose, B., Aitken, J., Marthouse, R., et al. (2018). Evidence that the great pacific garbage patch is rapidly accumulating plastic. Sci. Rep. 8:4666.
Lemieux, P. M., Lutes, C. C., and Santoianni, D. A. (2004). Emissions of organic air toxics from open burning: a comprehensive review. Prog. Energy Combust. Sci. 30, 1–32. doi: 10.1016/j.pecs.2003.08.001
Lobelle, D., and Cunliffe, M. (2011). Early microbial biofilm formation on marine plastic debris. Mar. Pollut. Bull. 62, 197–200. doi: 10.1016/j.marpolbul.2010.10.013
Luketina, D. A., and Imberger, J. (1989). Turbulence and entrainment in a buoyant surface plume. J. Geophys. Res. Oceans 94, 12619–12636. doi: 10.1029/jc094ic09p12619
Merkl, A., Stuchtey, M., Russel, S., Crow, A., Simon, E., Wooster, J., et al. (2015). Stemming the Tide: Land-Based Strategies for a Plastic-Free Ocean. Washington, DC: Ocean Conservancy.
Molcard, R., Fieux, M., Swallow, J. C., Ilahude, A. G., and Banjarnahor, J. (1994). Low frequency variability of the currents in Indonesian channels (Savu-Roti and Roti-Ashmore Reef). Deep Sea Res. I Oceanogr. Res. Pap. 41, 1643–1661. doi: 10.1016/0967-0637(94)90066-3
Moore, C. J., Moore, S. L., Leecaster, M. K., and Weisberg, S. B. (2001). A comparison of plastic and plankton in the North Pacific central gyre. Mar. Pollut. Bull. 42, 1297–1300. doi: 10.1016/s0025-326x(01)00114-x
Morét-Ferguson, S., Law, K. L., Proskurowski, G., Murphy, E. K., Peacock, E. E., and Reddy, C. M. (2010). The size, mass, and composition of plastic debris in the western North Atlantic Ocean. Mar. Pollut. Bull. 60, 1873–1878. doi: 10.1016/j.marpolbul.2010.07.020
Morris, R. J. (1980). Plastic debris in the surface waters of the South Atlantic. Mar. Pollut. Bull. 11, 164–166. doi: 10.1016/0025-326x(80)90144-7
Mrosovsky, N., Ryan, G. D., and James, M. C. (2009). Leatherback turtles: the menace of plastic. Mar. Pollut. Bull. 58, 287–289. doi: 10.1016/j.marpolbul.2008.10.018
Nahas, E. L., Pattiaratchi, C. B., and Ivey, G. N. (2005). Processes controlling the position of frontal systems in Shark Bay, Western Australia. Estuar. Coast. Shelf Sci. 65, 463–474. doi: 10.1016/j.ecss.2005.06.017
Nash, A. D. (1991). Marine debris and fishing off irian jaya. Environ. Conserv. 18, 80–80. doi: 10.1017/s0376892900021408
O’Donnell, J., Marmorino, G. O., and Trump, C. L. (1998). Convergence and downwelling at a river plume front. J. Phys. Oceanogr. 28, 1481–1495. doi: 10.1175/1520-0485(1998)028<1481:cadaar>2.0.co;2
Owen, R. W. (1981). “Fronts and eddies in the sea: mechanisms, interactions and biological effects,” in Analysis of Marine Ecosystems, ed. A. R. (London: Longhurst Academic Press), 197–233. Available online at: https://swfsc-publications.fisheries.noaa.gov/publications/CR/1981/8149.PDF)
Parks, D. O. N. (2013). North-West Commonwealth Marine Reserves Network Management Plan 2014-24. Canberra: Director of National Parks.
Pattiaratchi, C. B. (1994). “Physical oceanographic aspects of the dispersal of coral spawn slicks: a review,” in The Bio-Physics of Marine Larval Dispersal. Coastal and Estuarine Studies, vol. 45, eds PW Sammarco and ML Heron (Washington, Dc: American Geophysical Union), 89–105. doi: 10.1029/ce045p0089
Pattiaratchi, C. B., James, A. E., and Collins, M. B. (1987). Island wakes and headland eddies: a comparison between remotely sensed data and laboratory experiments. J. Geophys. Res. Oceans 92, 783–794. doi: 10.1029/jc092ic01p00783
Pattiaratchi, C. B., Van Der Mheen, M., Schlundt, C., Narayanaswamy, B. E., Sura, A., Hajbane, S., et al. (2021). Plastics in the Indian Ocean – sources, fate, distribution and impacts. Ocean Sci. Discuss. [preprint] doi: 10.5194/os-2020-127
Pix4D (2019). Ground Sampling Distance Calculator. Available online at: https://support.pix4d.com/hc/en-us/articles/202560249-Tools-Gsd-calculator (accessed October 1, 2019).
Reisser, J., Shaw, J., Wilcox, C., Hardesty, B. D., Proietti, M., Thums, M., et al. (2013). Marine plastic pollution in waters around Australia: characteristics, concentrations, and pathways. PLoS One 8:e80466. doi: 10.1371/journal.pone.0080466
Reisser, J., Slat, B., Noble, K., Du Plessis, K., Epp, M., Proietti, M., et al. (2014). The vertical distribution of buoyant plastics at sea. Biogeosci. Discuss. 11, 16207–16226.
Richards, Z., Beger, M., Hobbs, J.-P., Bowling, T., Chong-Seng, K., and Pratchett, M. (2009). Ashmore Reef National Nature Reserve and Cartier Island Marine Reserve Marine Survey 2009. Australia: Arc Centre of Excellence for Coral Reef Studies.
Rudduck, O.-A., Lavers, J. L., Fischer, A. M., Stuckenbrock, S., Sharp, P. B., and Banati, R. B. (2017). Inter-annual variation in the density of anthropogenic debris in the tasman sea. Mar. Pollut. Bull. 124, 51–55. doi: 10.1016/j.marpolbul.2017.07.010
Ryan, P. G. (1988). The characteristics and distribution of plastic particles at the sea-surface off the southwestern Cape province, South Africa. Mar. Environ. Res. 25, 249–273. doi: 10.1016/0141-1136(88)90015-3
Ryan, P. G. (2013). A simple technique for counting marine debris at sea reveals steep litter gradients between the Straits of Malacca and the Bay of Bengal. Mar. Pollut. Bull. 69, 128–136. doi: 10.1016/j.marpolbul.2013.01.016
Ryan, P. G. (2015). Does size and buoyancy affect the long-distance transport of floating debris? Environ. Res. Lett. 10:084019. doi: 10.1088/1748-9326/10/8/084019
Ryan, P. G. (2020). Land or sea? what bottles tell us about the origins of beach litter in Kenya. Waste Manag. 116, 49–57. doi: 10.1016/j.wasman.2020.07.044
Sarkar, K., Aparna, S. G., Dora, S., and Shankar, D. (2019). Seasonal variability of sea-surface temperature fronts associated with large marine ecosystems in the North Indian Ocean. J. Earth Syst. Sci. 128, 1–8.
Sarma, V. V. S. S., Delabehra, H. B., Sudharani, P., Remya, R., Patil, J. S., and Desai, D. V. (2015). Variations in the inorganic carbon components in the thermal fronts during winter in the northeastern Arabian Sea. Mar. Chem. 169, 16–22. doi: 10.1016/j.marchem.2014.12.009
Scales, K. L., Miller, P. I., Hawkes, L. A., Ingram, S. N., Sims, D. W., and Votier, S. C. (2014). On the front line: frontal zones as priority at-sea conservation areas for mobile marine vertebrates. J. Appl. Ecol. 51, 1575–1583. doi: 10.1111/1365-2664.12330
Sharples, J., and Simpson, J. H. (2009). “Shelf sea and shelf slope fronts,” in Encyclopedia of Ocean Sciences, 2nd Edn, eds J. H. Steele, K. K. Turekian, and S. A. E. Thorpe (Amsterdam: Elesevier).
Simpson, J. H., and Hunter, J. R. (1974). Fronts in the Irish sea. Nature 250, 404–406. doi: 10.1038/250404a0
Ter Halle, A., Ladirat, L., Gendre, X., Goudounèche, D., Pusineri, C., Routaboul, C., et al. (2016). Understanding the fragmentation pattern of marine plastic debris. Environ. Sci. Technol. 50, 5668–5675. doi: 10.1021/acs.est.6b00594
The Department Of Infrastructure Transport Cities and Regional Development (2016). Ashmore and Cartier Islands. Australian: The Department Of Infrastructure, Transport, Cities And Regional Development.
Thiel, M., Hinojosa, I., Vásquez, N., and Macaya, E. (2003). Floating marine debris in coastal waters of the Se-Pacific (Chile). Mar. Pollut. Bull. 46, 224–231. doi: 10.1016/s0025-326x(02)00365-x
Thompson, R. C., Olsen, Y., Mitchell, R. P., Davis, A., Rowland, S. J., John, A. W. G., et al. (2004). Lost at sea: where is all the plastic? Science 304:838. doi: 10.1126/science.1094559
Tourinho, P. S., Do Sul, J. A. I., and Fillmann, G. (2010). Is marine debris ingestion still a problem for the coastal marine biota of southern Brazil? Mar. Pollut. Bull. 60, 396–401. doi: 10.1016/j.marpolbul.2009.10.013
van der Mheen, M., Pattiaratchi, C., and Van Sebille, E. (2019). Role of Indian Ocean dynamics on accumulation of buoyant debris. J. Geophys. Res. Oceans 124, 2571–2590. doi: 10.1029/2018jc014806
van der Mheen, M., Pattiaratchi, C., Cosoli, S., and Wandres, M. (2020). Depth-dependent correction for wind-driven drift current in particle tracking applications. Front. Mar. Sci. 7:305.
Van Sebille, E., Aliani, S., Law, K. L., Maximenko, N., Alsina, J. M., Bagaev, A., et al. (2020). The physical oceanography of the transport of floating marine debris. Environ. Res. Lett. 15:23003.
van Sebille, E., Sprintall, J., Schwarzkopf, F. U., Sen Gupta, A., Santoso, A., England, M. H., et al. (2014). Pacific-to-Indian ocean connectivity: tasman leakage, indonesian throughflow, and the role of Enso. J. Geophys. Res. Oceans 119, 1365–1382. doi: 10.1002/2013jc009525
Vegter, A. C., Barletta, M., Beck, C., Borrero, J., Burton, H., Campbell, M., et al. (2014). Global research priorities to mitigate plastic pollution impacts on marine wildlife. Endang. Species Res. 25, 225–247. doi: 10.3354/esr00623
Vethaak, A. D., and Leslie, H. A. (2016). Plastic Debris is a Human Health Issue. Washington, DC: Acs Publications.
Vince, J., and Hardesty, B. D. (2017). Plastic pollution challenges in marine and coastal environments: from local to global governance. Restor. Ecol. 25, 123–128. doi: 10.1111/rec.12388
Viršek, M. K., Lovšin, M. N., Koren, Š, KrŽan, A., and Peterlin, M. (2017). Microplastics as a vector for the transport of the bacterial fish pathogen species Aeromonas salmonicida. Mar. Pollut. Bull. 125, 301–309. doi: 10.1016/j.marpolbul.2017.08.024
Wijeratne, S., Pattiaratchi, C., and Proctor, R. (2018). Estimates of surface and subsurface boundary current transport around Australia. J. Geophys. Res. Oceans 123, 3444–3466. doi: 10.1029/2017jc013221
Wolanski, E., and Hamner, W. M. (1988). Topographically controlled fronts in the ocean and their biological influence. Science 241, 177–181.
Woodsona, C. B., and Litvinb, S. Y. (2015). Ocean fronts drive marine fishery production and biogeochemical cycling. Proc. Natl. Acad. Sci. USA 112, 1710–1715.
Wright, S. L., Thompson, R. C., and Galloway, T. S. (2013). The physical impacts of microplastics on marine organisms: a review. Environ. Pollut. 178, 483–492.
Yit Sen Bull, C., and van Sebille, E. (2016). Sources, fate, and pathways of leeuwin current water in the Indian Ocean and great Australian bight: a Lagrangian study in an eddy-resolving ocean model. J. Geophys. Res. Oceans 121, 1626–1639.
Keywords: fronts, plastic pollution, marine debris, garbage patch, films, coastal hotspot
Citation: Hajbane S, Calmanovici B, Reisser J, Jolly A, Summers V, Ferrari F, Ghadouani A and Pattiaratchi C (2021) Coastal Garbage Patches: Fronts Accumulate Plastic Films at Ashmore Reef Marine Park (Pulau Pasir), Australia. Front. Mar. Sci. 8:613399. doi: 10.3389/fmars.2021.613399
Received: 02 October 2020; Accepted: 22 March 2021;
Published: 16 April 2021.
Edited by:
Isabel Iglesias, University of Porto, PortugalReviewed by:
Victor Martinez-Vicente, Plymouth Marine Laboratory, United KingdomPeter Geoffrey Ryan, University of Cape Town, South Africa
Copyright © 2021 Hajbane, Calmanovici, Reisser, Jolly, Summers, Ferrari, Ghadouani and Pattiaratchi. This is an open-access article distributed under the terms of the Creative Commons Attribution License (CC BY). The use, distribution or reproduction in other forums is permitted, provided the original author(s) and the copyright owner(s) are credited and that the original publication in this journal is cited, in accordance with accepted academic practice. No use, distribution or reproduction is permitted which does not comply with these terms.
*Correspondence: Sara Hajbane, c2FyYS5oYWpiYW5lQGdtYWlsLmNvbQ==
†These authors have contributed equally to this work
‡ORCID: Sara Hajbane, orcid.org/0000-0001-6644-4585; Bruna Calmanovici, orcid.org/0000-0002-6329-6991; Julia Reisser, orcid.org/0000-0002-1785-1042; Vyvyan Summers, orcid.org/0000-0002-1183-9827; Anas Ghadouani, orcid.org/0000-0002-1252-4851; Charitha Pattiaratchi, orcid.org/0000-0003-2229-6183