 Chenying Guo1
 Shin-ichi Ito1*
 Michio Yoneda2Hajime Kitano3
 Hitoshi Kaneko4
 Megumi Enomoto1Tomoya Aono1
 Masahiro Nakamura2
 Takashi Kitagawa1
 Nicholas C. Wegner5
 Emmanis Dorval6
- 1Atmosphere and Ocean Research Institute, The University of Tokyo, Kashiwa, Japan
- 2National Research Institute of Fisheries and Environment of Inland Sea, Japan Fisheries Research and Education Agency, Imabari, Japan
- 3Marine Fisheries Research and Development Center, Japan Fisheries Research and Education Agency, Yokohama, Japan
- 4Mutsu Institute for Oceanography, Japan Agency for Marine-Earth Science and Technology (JAMSTEC), Mutsu, Japan
- 5Southwest Fisheries Science Center, National Marine Fisheries Service, NOAA, La Jolla, CA, United States
- 6Lynker Technologies, LLC., Under Contract to Southwest Fisheries Science Center, NOAA, La Jolla, CA, United States
Species-specific ecological traits in fishes are likely to vary between populations or stocks due to differences in regional oceanic conditions, such as latitudinal temperature. We examined potential intraspecific differences in the swimming performance and metabolism of Pacific chub mackerel (Scomber japonicus) from the Northwest and Northeast Pacific stocks, which are distributed on opposite sides of the North Pacific at similar latitudes, but where the temperature contrast is large. Swimming bioenergetics and metabolic data of Northwest stock mackerel were measured at 14, 18, and 24°C using variable-speed swim-tunnel respirometers, and then the resulting bioenergetic parameters were compared with previous findings from the Northeast stock. At a given size, the maximum sustainable swimming speed (Umax) of the Northwest stock showed no significant difference compared to the Northeast stock at 18 and 24°C, but was lower at 14°C. In addition, the oxygen consumption rate (MO2) of the Northwest stock showed lower mass dependence and different temperature dependence at a given swimming speed than in the Northeast stock. Combined with stock-specific data on growth and experienced temperatures in the wild, these bioenergetic differences indicate that the swimming performance and metabolism of the two stocks are specific to their local environment to maximize bioenergetic efficiency.
Introduction
Many marine species, particularly fish, show differentiated traits corresponding to their environment. Generally, fish at higher latitudes reach larger body sizes (Conover, 1992; Trip et al., 2014), have increased number of vertebrae (Wisner, 1960; McDowall, 2008), and have seasonally faster growth rates (Conover and Present, 1990) than conspecifics at lower latitude. These traits can partially be attributed to the latitudinal gradient and the length of the growing season. Since sea surface temperature (SST) decreases with latitude because of lower irradiance and heat absorption at higher latitudes, these latitudinal variations in ecological traits are usually suggested to be related to temperature. For example, Munch and Salinas (2009) showed that within species, fish at higher latitudes usually have longer lifespans associated with temperature as explained by the metabolic theory of ecology. However, other environmental factors including day length, salinity, and dissolved oxygen also often vary with latitude, potentially obscuring the relationship between temperature and ecological traits in wild populations.
Marine species that have oceanic-scale distributions are ideal for investigating the potential variation in ecological traits associated with temperature, as large ocean basins have distinct east–west temperatures. Even at the same latitude, habitat temperature can be significantly different due to ocean circulation patterns, such as western boundary currents and eastern boundary upwellings. In the coastal areas of the North Pacific, the warm and strong Kuroshio western boundary current affects the growth and distribution of many important commercial pelagic species in the Northwest Pacific (i.e., Nakata et al., 2000; Sassa et al., 2006; Kaneko et al., 2019). In contrast, fish in the Northeast Pacific generally experience lower temperatures and highly productive environments due to upwelling (Bograd et al., 2009). Consequently, the relative relationship of spawning temperature optima between northern anchovy (Engraulis mordax) and California sardine (Sardinops sagax) in the California Current system is different than that of Japanese anchovy (E. japonicus) and Japanese sardine (S. melanostictus) in the Northwest Pacific: sardine prefer warmer conditions than anchovy in the California Current system but vice versa in the Northwest Pacific (Takasuka et al., 2008). Even within the same species, growth of Pacific herring (Clupea pallasii) in the North Pacific shows not only latitudinal but also zonal variation (Hay et al., 2008), and is characterized by the geographic specificity of bioenergetics parameters as well as location-specific variation in temperature and food (Ito et al., 2015). For these small pelagic species, zonal differences in ecological traits (growth, metabolism, spawning, etc.) are likely a result of life history strategies reflecting adaptation to local environments.
Because metabolism is the primary means of energy dissipation and is directly related to residual energy available for growth, understanding a species' metabolism can provide critical insight into other ecological traits and life history strategy. In small pelagic fish, metabolism is generally affected by biotic (e.g., body size) and abiotic (e.g., temperature) factors (Clarke and Johnston, 1999; Killen et al., 2010; Ikeda, 2016), as well as by movement and activity level (including migration), which are related to swimming ability (Brett, 1964; Mandal et al., 2016; Norin and Clark, 2016). Latitudinal variation of metabolic traits has also been shown in several fish species (Clarke, 2003); for example, cold-adapted populations of perciform fishes can increase the volume and surface density of mitochondrial clusters to enhance metabolic function under cold water conditions (Johnston et al., 1998). To observe adaptive evolution in response to ecological factors, comparing the metabolic scaling within individual species or conspecific stocks, each from a specific environment, is likely more useful than a general cross-taxa comparison (Glazier, 2005).
Therefore, in this study we focused on zonal comparison of metabolic traits in Pacific chub mackerel (Scomber japonicus; hereafter, chub mackerel), a small pelagic fish species widely distributed throughout the coastal areas of the Pacific. In the North Pacific, there are two stocks: the Northwest stock around Japan using the Kuroshio Current, and the Northeast stock which utilizes the California Current system (Collette et al., 2011). These two stocks have a similar spawning season, primarily from March to May, and well as similar directional migrations, usually migratring from south to north in the summer and from north to south in the winter (MBC Applied Environmental Sciences, 1987; Yukami et al., 2019). Both stocks also experience cyclical periods of notable changes in abundance like other small pelagic fish such as sardine and anchovy (Takasuka et al., 2008; Crone et al., 2019). For the Northeast stock, the oxygen consumption rate (a proxy for the aerobic component of metabolic rate) has been measured over a range of activity levels (swimming speeds) and temperatures from 14 to 24°C (Sepulveda and Dickson, 2000; Dickson et al., 2002; Guo et al., 2019), and Guo et al. (2019) synthesized these data to estimate respiration parameters for bioenergetic modeling. For the Northwest stock, the full bioenergetics budget of chub mackerel has only been studied using aquaculture juveniles (Ohnishi et al., 2016). Although we hypothesize that chub mackerel from the Northwest and Northeast stock may show variation in their bioenergetic parameters to maximize their growth and survival within their local environment, additional data from the Northwest stock are needed to make this comparison.
The aim of this study was thus to determine if the Pacific chub mackerel shows an adaptive strategy in its swimming performance and metabolism in response to local environmental conditions. Specifically, we designed an experiment to evaluate the metabolism and swimming performance of fish collected from the Northwest stock and analyzed the relationship of these bioenergetics parameters with temperature, growth stage (mass), and activity level (swimming speed). The results were compared with those of the Northeast stock under the known climatic environment each stock regularly encounters to examine potential differences in the metabolism and swimming performance between the two stocks associated with their local habitat.
Materials and Methods
Fish Collection and Husbandry
Chub mackerel from the Northwest stock were collected from the wild and supplied from two hatchery operations in order to compile a relatively large body-size range for respirometry trials (5.5–18.6 cm FL, 1.7–94.8 g). The smallest chub mackerel used in respirometry trials (5.5–6.0 cm, 1.7–3.4 g, n = 13) were hatchery-produced from sixth-generation artificial fertilization in June, 2018 at the Fisheries Research Institute of Karatsu, Department of Joint Research, Faculty of Agriculture, Kyushu University (here after Karatsu, Figure 1A). At 30 days post hatch, ~100 small juveniles were randomly selected and moved to two circular 100 L tanks (about 50 individuals per tank). The water temperature of the tanks was adjusted from ambient (~21°C) by 1°C per day until arriving at the target experimental temperatures of 18 and 24°C. These fish were fed about 5% body weight per day with a formulated diet (Ambrose 100–200: protein 53%, oil 8%, ash 15%, and fiber 3%, calcium 2%, phosphorus 1.4%; FEED ONE, Yokohama, Japan) during the experimental period. Following respirometry trials at this small size, all the fish were reared in a single tank to 5 months old for respirometry trials at a larger size. During growout, the water was manually cooled to an average of 24°C until the end of September and then kept at ambient temperature from October to November (Supplementary Figure 1).
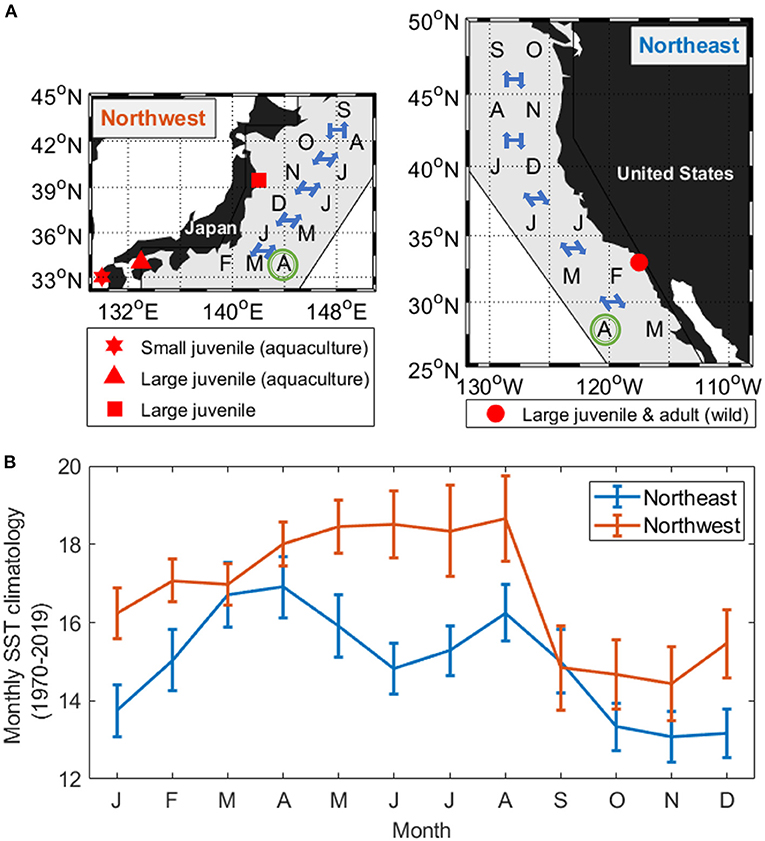
Figure 1. (A) Pacific chub mackerel collection sites (red markers) in relation to the species distribution area (gray polygon), assumed hatch month (April, green circle), and the mean monthly latitude position shift of the Northwest stock (left) and Northeast stock (right). (B) Mean monthly sea surface temperature (SST climatology averaged from 1970 to 2019 ± standard deviation) experienced by the mean latitudinal position of the two stocks.
Large juvenile chub mackerel used in respirometry experiments (13.8–18.6 cm, 23.0–94.8 g, n = 13) came from fertilized eggs spawned by 3-year-old fish under captive conditions in June, 2018 at the National Research Institute of Fisheries and Environment of Inland Sea, Fisheries Research and Education Agency (here after Hakatajima) (14.7–18.6 cm, 36.4–94.8 g, n = 3), combined with the individuals grown up from Karatsu (13.8–18.1 cm, 23.0–73.0 g, n = 10) and transported to Hakatajima in November, 2018, about 1 month before respirometry trials. Because fish from Karatsu were not individually marked, a few were possibly used both for the small and large juvenile experiments. Fish from different sources were kept in separate circular 2-KL tanks and fed with Mojako GF No2 (protein 50%, lipid 10%, ash 18%, fiber 6%, calcium 2%, phosphorus 1.2%; Feed One, Yokohama, Japan) about 0.5% body weight per day in order to control body size but still be able to maintain basic metabolic requirements.
Lastly, wild juvenile chub mackerel (10.8–15.8 cm, 11.7–38.2 g, n = 17) were captured using hook and line along the coast of Otsuchi Bay, Iwate prefecture in July 2019. The sea surface temperature at capture was ~19°C. Fish were then held in a 1-KL circular tank at 18°C at least 7 days prior to experiments at the International Coastal Research Centre, Atmosphere and Ocean Research Institute, The University of Tokyo. Respirometry trials were first conducted at 18°C. Following trials at 18°C, the water temperature was adjusted 1°C per day to 24°C and kept at 24°C for another 3 days before additional trials were run on different individuals at this warmer temperature acclimation. Fish were fed with New-Arteck K4 (protein 52%, lipid 11%, ash 18%, fiber 3%, calcium 2%, phosphorus 1.5%; Marubeni Nisshin Feed, Tokyo, Japan) about 2% of total weight each day.
All individuals were held at constant temperature for at least 3 days before the respirometry experiments and were fasted for at least 24 h prior to the beginning of each trial (Guo et al., 2019).
Respirometry Measurement
Oxygen consumption rates of individuals from the Northwest stock were measured at several swimming speeds up to their maximum sustainable swimming speed (Umax) following procedures used for the Northeast stock (Sepulveda and Dickson, 2000; Dickson et al., 2002; Guo et al., 2019). Two variable-speed, temperature-controlled swim-tunnel respirometers (a 280-mL Blazka-type for small juveniles (5.5–6.5 cm, 1.7–3.4 g) and a 5-L Brett-style with a 30 cm test section for large juveniles (10.8–19.6 cm, 11.7–94.8 g) Loligo Systems, Denmark) were used. The length of test section of the Blazka-type respirometers was extended to 17 cm by replacing the originally 10 cm one from 170-mL Blazka-type respirometers to create more space for fish to swim. In all experiments, the dissolved oxygen concentration (DO) of the water in the respirometer was recorded every second using a Fibox 3 fiber optic oxygen transmitter (PreSens Precision Sensing GmbH, Regensburg, Germany). Following placement in the swim tunnel respirometer, a fish was allowed to adjust for 2–4 h to recover from handling at 12–15 cm s−1 (small juvenile) or 25–30 cm s−1 (large juvenile). The exact duration of the acclimation period was determined through examining the MO2 (oxygen consumption rate) of the fish on a 15-min cycle, which included an 8–10-min flush period (in which the respirometer was continually flushed with fresh seawater from the surrounding buffer tank), a 1–2 min wait period (respirometer closed off to the seawater supply but DO data were excluded from MO2 estimation), and a 5-min measurement period (respirometer kept closed and DO data used for MO2 estimation). Immediately following each cycle, MO2 was calculated automatically by linear regression of water DO vs. time by Autoresp ® (Loligo Systems, Denmark). The acclimation period ended once the fish could swim in the middle of the chamber without showing any significant signs of stress (e.g., irregular tailbeat frequency or cessation of swimming) and the MO2 for that individual stabilized (defined as estimated MO2 not varying more than 10% from the mean over three consecutive 15 min measurement cycles).
Following the acclimation period, each fish swam for sequential 30-min periods at increasing swimming speed steps, with an interval increase of 2–4 cm s−1 (small juveniles) or 5–7.5 cm s−1 (large juveniles). The measurement continued until the fish was exhausted, as described by Guo et al. (2019). Umax for each fish was defined as the preceding speed at which the fish maintained normal cruise swimming for 30-min (Dickson et al., 2002).
Following respirometry measurements, fish were removed from the swim tunnel, and their fork length, total length, girth, and mass (wet weight) were measured. The chamber was resealed to measure the background oxygen consumption rate, which was subtracted from the fish oxygen consumption rate. For data quality control, MO2 data were excluded from further analysis if the fish showed signs of stress by irregular swimming, hitting the chamber wall, and or stopping swimming more than three times once the incremental swimming speed steps started. All handling, care, and experimentation were performed following the animal-experimentation manual of The University of Tokyo (No. A19-15).
Swimming Speed Correction, Oxygen Consumption Rate, and Parameter Estimation for Bioenergetic Modeling
The flow speed of the swim-tunnel respirometer was calibrated preceding each experiment. Test velocities and fish swimming speeds were corrected for the solid-blocking effect of the vane probe and the fish following Bell and Terhune (1970). Each swimming speed step allowed for two 15 min measurement cycles (as conducted during acclimation) and the MO2 at each test speed was defined as the lower value (better performance and presumably lower stress status) between the two measurements. The daily mass-specific MO2 (R, g O2 g fish−1 day−1) was expressed as:
where SMR is the standard metabolic rate of each fish estimated by extrapolating the MO2 – swimming speed relationship to a speed of zero (e.g., Dewar and Graham, 1994). Activity is a function of swimming speed (U, cm·s−1):
where dR is a coefficient for swimming speed vs. R that is estimated for each individual by exponential regression analysis of the relationship between R and U.
SMR can then be calculated by removing the activity effect from MO2. In general, SMR is related to body mass (W, g) and water temperature (T, °C) (Stewart and Binkowski, 1986). However, the aquaculture-reared fish used in this study had a different body shape than the wild caught fish (for example, the cross-sectional area at a given mass was significantly higher in the aquaculture-reared fish) (Figure 2A). Because this difference in body shape could lead to a different water drag effect and consequently result in different mass-specific MO2 (Figure 2B, details in the result section), a correction term of cross-sectional area at the largest girth (A, cm2) was added to the function of SMR to eliminate the body-shape effect resulting in the equation:
where aR is constant and represents the MO2 of a 1-g fish at rest at ∞°C, bR is the slope of the allometric mass function for R, cR is a coefficient relating water temperature to R. Aa and Aw are the estimated cross-sectional area (A, cm2) of aquaculture-reared (Aa = 0.407 W0.679, r2 = 0.993, p < 0.0001) and wild-caught fish (Aw = 0.548 W0.555, r2 = 0.854, p < 0.0001) (Figure 2A). Factor q is the correction parameter for the ratio of Aa and Aw which is applied only for aquaculture-reared individuals (q is assumed to be 0 for wild-caught individuals).
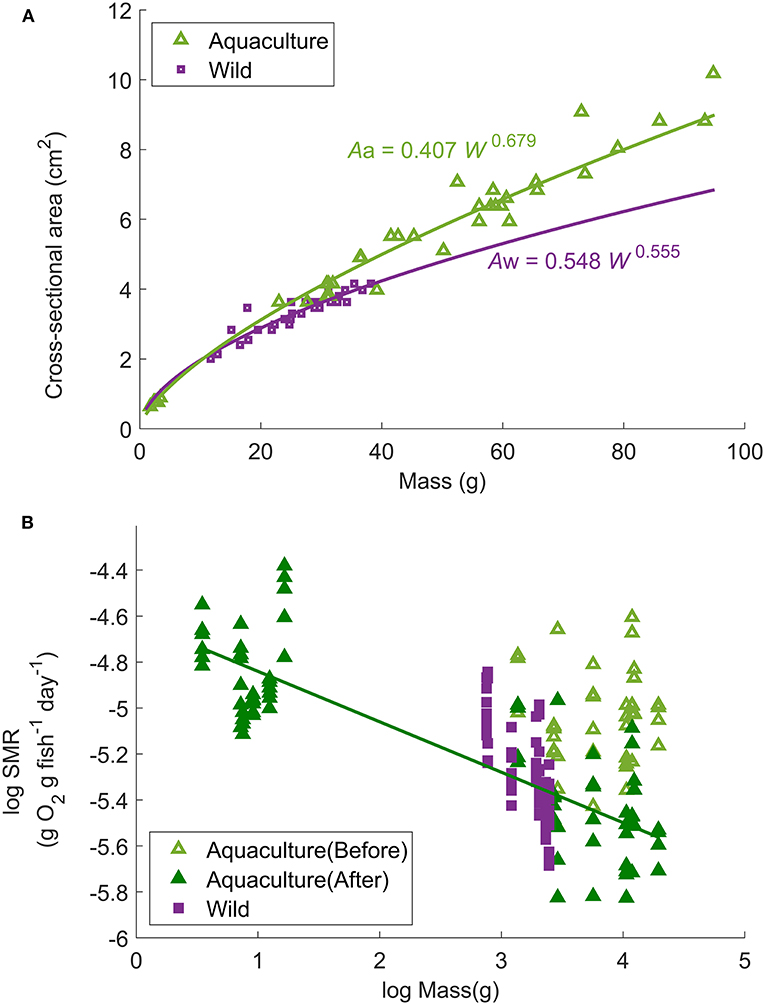
Figure 2. (A) Relationship between fish mass (W, g) and cross-sectional area at the largest girth (A, cm2) of all Northwest stock individuals used in the experimental trials. The curves represent the power regressions: Aa = 0.407 W0.679 (r2 = 0.993, p < 0.0001, n = 44) for aquaculture-reared individuals and Aw = 0.548 W0.555 (r2 = 0.854, p < 0.0001, n = 30) for wild-caught individuals. (B) Relationship between standard metabolic rate and body mass (W, g) of aquaculture-reared large juveniles before and after correction (non-corrected = light green open triangle; corrected = dark green solid triangle) in comparison to wild-caught (non-corrected, purple solid square) individuals at 18°C. The solid line represents the linear regression of logarithmic fish mass (W, g) and logarithmic activity effected removed mass-specific MO2: log (SMR18) = −0.219 log (W) – 4.62 (r2 = 0.616, p < 0.0001).
Since the correction term of body shape is also a function of W, correction factor q for aquaculture individuals and the mass-dependence parameter (bR) were estimated simultaneously by multivariate non-linear regression. Because SMR is only related to mass (W, g) at a given temperature, the temperature was fixed at 18°C while applying the regression because of the relatively wider size range of aquaculture-reared individuals compared to other temperatures and available data from the wild-caught individuals at 18°C for correction. The value of q and bR were determined when the regression obtained minimum RMSE, and were substituted into Equation (3) to remove the mass effect of SMR. Then the temperature-dependence parameter (cR) and constant aR were estimated using non-linear regression of the corrected SMR and temperature. Because the number of data points differed greatly among the different temperatures (Table 1), to ensure the same contribution to parameter estimation, the data were weighted by the reciprocal of the number of available measurements at each temperature. The weighting ratio at each temperature was 1/35:1/148:1/147 for 14, 18, and 24°C, respectively.
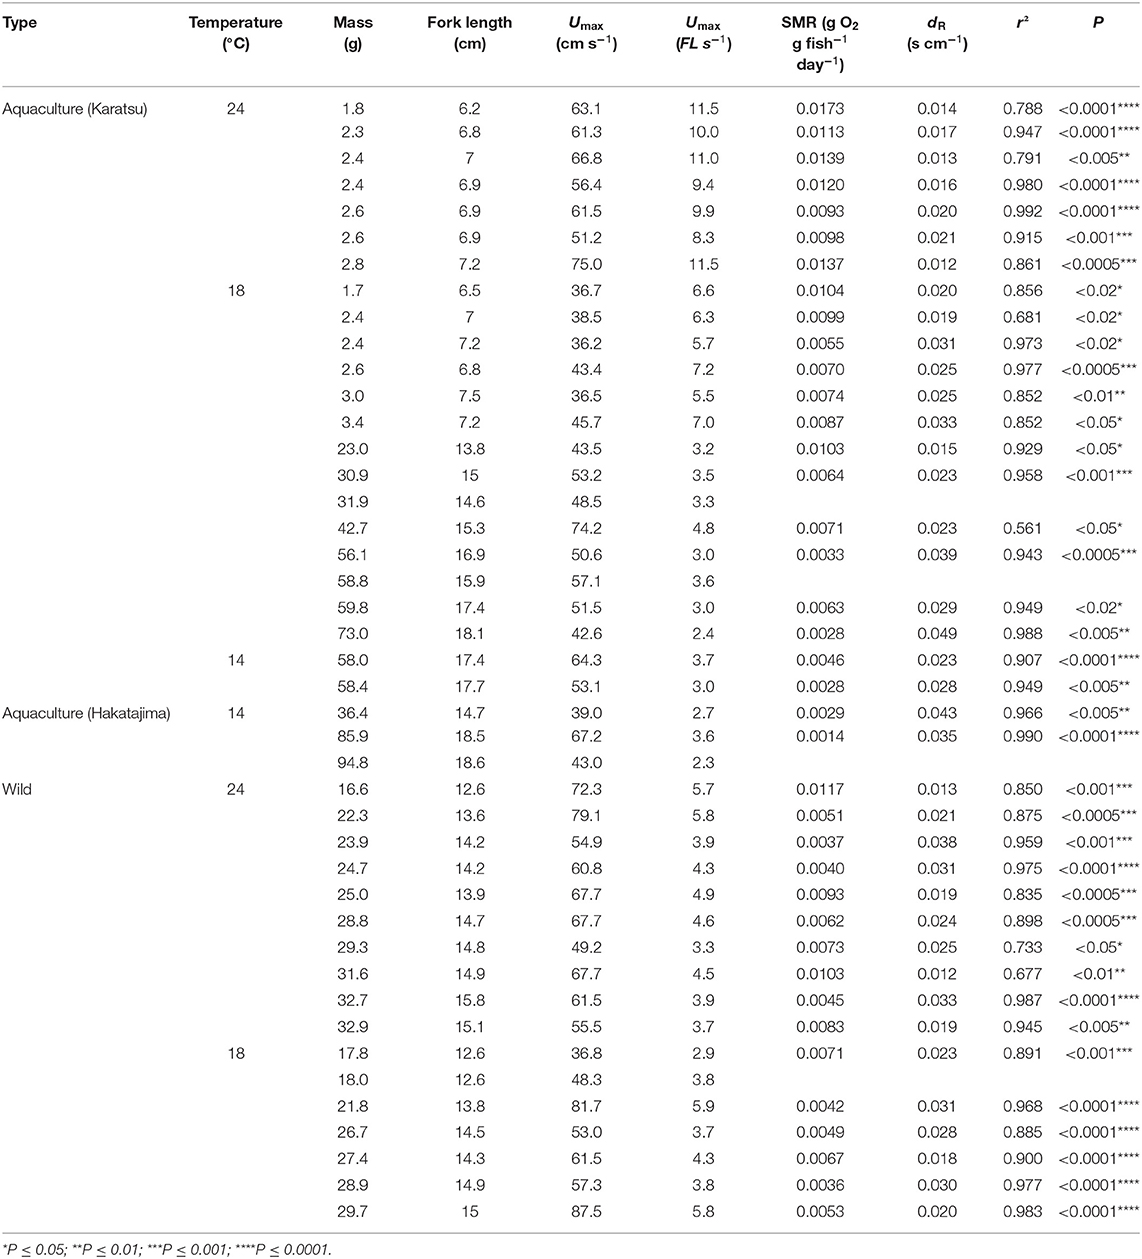
Table 1. Source, size, and bioenergetics data for Northwestern stock Pacific chub mackerel individuals examined in the present study including collection location (source), experimental temperature (°C), fish mass (W, g), fork length (FL, cm), maximum sustainable swimming speed (Umax, cm s−1, and FL s−1), and exponential regression equations of mass-specific MO2 (R, gO2 g fish−1 day−1) vs. U (cm s−1): .
Finally, the estimation error (Eerr) was calculated to assess the accuracy of the resulting modeled equation for R as Eerr = (measured value – estimated value)/(estimated value), following the methods of Guo et al. (2019). The optimal swimming speed (Uopt, FL s−1), which is defined as the swimming speed with the minimum gross cost of transport (COT), was typically applied in fish growth-migration models as the default cruising swimming speed. Since COT can be estimated with Equation (1) divided by U, Uopt was estimated as U, where the first derivative of R/U by U becomes zero with the minimum COT.
Comparison Between the Northwest and Northeast Stock
Swimming and metabolic data determined for the Northwest stock in this study were compared with raw data from the Northeast stock (Sepulveda and Dickson, 2000; Dickson et al., 2002; Guo et al., 2019). Because of differences in body shape between aquaculture and wild individuals of Northwest stock in the present study, dR and Umax values between these two groups were first compared by analysis of variance (ANOVA) before comparison with the Northeast stock. Because dR and Umax did not differ significantly between the aquaculture-reared and wild-caught fish at 18°C (p = 0.109; p = 0.286), the Northwest individuals tested at the same temperature were regarded as a single group for subsequent comparison of dR and Umax with the Northeast stock. Potential differences in the relationship of Umax, dR values and fish size (fork length, FL) between stocks was assessed at a given temperature by analysis of covariance (ANCOVA).
To investigate whether the dependence of chub mackerel metabolism on temperature and body mass is specific to the environment in which the stocks are distributed, the assumed environmental temperature experienced in the wild and the growth trajectories of age 0–5 fish of the two stocks were used to calculate the consumed energy in relation to SMR. Since chub mackerel migrate within their distribution area and the migration routes may interannually shift according to the environmental fluctuations, for simplicity, the migration routes of the two stocks were fixed between years (Figure 1A). The monthly latitude positions of migration were based on the observations made by Crone et al. (2019) for the Northeast stock and Yukami et al. (2019) for the Northwest stock, while the distribution area of each stock was defined as ~400 km from the coastline at that latitude. The monthly SST of the latitude within the distribution area was calculated from ERSST (2° ×2° grid, monthly averaged, https://www.ncdc.noaa.gov/data-access/marineocean-data/extended-reconstructed-sea-surface-temperature-ersst-v5) from 1970 to 2019 (Figure 1B, details in section Results). Fish mass data at age 0–5 during 1970–2018 for the Northwest stock was obtained from Yukami et al. (2019), while mass data at age 0–5 for the Northeast stock during 1983–2018 came from Crone and Hill (2015) and Crone et al. (2019). The mass at each month from age 0 (6 months) to 5 years (66 months) was estimated by linear regression. To prevent error from extrapolation, growth trajectory from 0 to 6 months was derived using the Gompertz growth curve as parameterized by Takahashi et al. (2014):
where W is the fish mass at age t (year old); W∞ is the asymptotic weight at the end of the first year of growth (0-year-class) obtained from the maximum mass of age 0 individuals of each stock; k is the growth coefficient, and t0 is the point of inflection (age of maximum growth rate). Using the length–weight relationship of all wild-caught individuals used in this study, the slope of allometric mass b and the biological intercept W0 were estimated. Thus, t0 and k were calculated by substituting two fixed points, W0 at t = 0 and W6month at t = 0.5, into Equation (4):
Finally, hatch dates were expected to be in April, and the experienced temperature at each growth stage and estimated parameters of the Northwest stock and the Northeast stock (data from Guo et al., 2019) were introduced into Equations (1)–(3) for comparison. Unless indicated, all linear or non-linear regression analyses used a significance level of p < 0.05 and were applied in MATLAB (version 2019b).
Results
Maximum Sustainable Swimming Speed
In total, 43 individuals successfully acclimated to the swim tunnel respirometer providing useful bioenergetic data about the Northwest stock (Table 1). The Umax values for chub mackerel at 24°C were 62.2 ± 7.5 cm s−1 or 9.1 ± 1.1 FL s−1 for small juveniles and 63.6 ± 9.0 cm s−1 or 4.5 ± 0.8 FL s−1 for large juveniles, with no significant relationship between Umax and fork length or mass (Figure 3A). At 18°C, Umax for small juveniles was 39.5 ± 4.1 cm s−1 or 5.6 ± 0.6 FL s−1, while the Umax of the large juveniles was 56.5 ± 14.4 cm s−1 or 3.8 ± 1.0 FL s−1 (52.6 ± 9.9 cm s−1, or 3.3 ± 0.7 FL s−1 for the aquaculture-reared individuals and 60.9 ± 18.6cm s−1 or 4.3 ± 1.1 FL s−1 for the wild-caught individuals), and showed a significant linear relationship with fork length: Umax = 1.864FL + 27.94 (r2 = 0.252, p < 0.05, Figure 3B). The Umax for large juveniles at 14°C was 53.3 ± 12.5 cm s−1 or 3.1 ± 0.6 FL s−1, with no significant relationship with fork length or mass (Figure 3C). While Umax was significantly higher at 24°C than at 18°C for the small juvenile stage (ANOVA, p < 0.001), Umax showed no significant difference among temperatures for the large juveniles (ANOVA, p = 0.251).
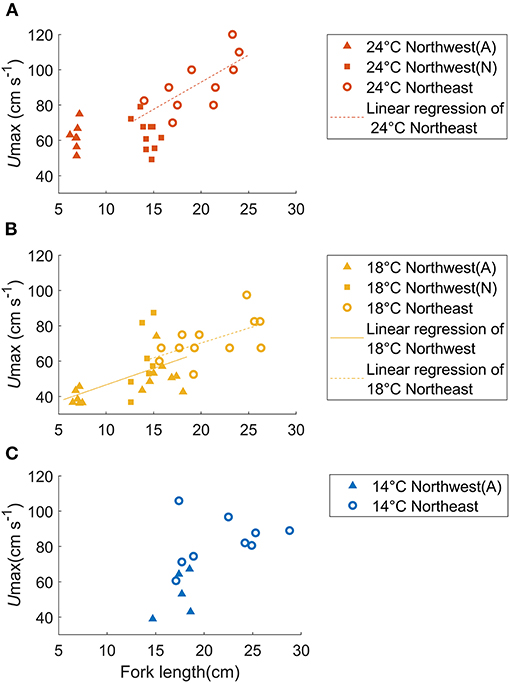
Figure 3. Relationship between fish mass and Umax for aquaculture-reared (A, solid triangles) and wild-caught (W, solid squares) chub mackerel from the Northwest stock in comparison to individuals of the Northeast stock (open circles) compared over three temperatures: (A) 24°C, (B) 18°C, and (C) 14°C. The linear regressions of Umax as a function of fish size are shown as solid (Northwest stock) and dashed (Northeast stock) lines. At 18°C, Umax = 1.864FL + 27.94 (r2 = 0.252, p < 0.05) for the Northwest stock and Umax = 1.682FL + 36.64, (r2 = 0.333, p < 0.05) for the Northeast stock (Dickson et al., 2002). The slopes of these two regression lines were not significantly different.
The Umax of Northwest stock only showed a significant relationship with fork length at 18°C (Figure 3B, ANCOVA, p < 0.005), and the slope of this relationship was not significantly different than that of the Northeast stock at 18°C (ANCOVA, p = 0.873). Likewise, at a given fish size, Umax of the two stocks at 18°C did not differ significantly (ANCOVA, p = 0.390).
Oxygen Consumption Rate and Respiration-Related Parameters
Mass-specific MO2 showed a significant exponential relationship with U for all fish following Equations (1) and (2), except for four individuals of the Northwest stock, which were excluded from further analysis (Table 1). The value of activity dependence (dR) ranged from 0.012 to 0.049 and was distributed normally (Lilliefors test). dR did not differ significantly between temperatures (ANOVA, p = 0.060) or between the aquaculture-reared and wild-caught fish at 18°C (ANOVA, p = 0.109). However, for small juvenile individuals, the values of dR at 24°C were significantly lower than those at 18°C (ANOVA, p = 0.001), which resulted in a positive linear relationship between dR and fish mass at 24°C (r2 = 0.303, p = 0.022, Figure 4). For simplicity, the parameter dR was estimated as 0.0252 s cm−1, which is the expected value of the normal distribution across temperatures and fish size. After the mass effect of the Northwest and Northeast stock were removed, the dR of the two stocks did not differ significantly (ANOVA, p = 0.324).
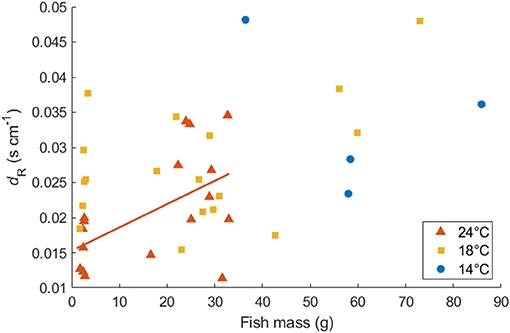
Figure 4. Relationship between dR (s cm−1) and body mass for Northwest stock Pacific chub mackerel at 24, 18, and 14°C. The solid red line represents the linear regression of dR at 24°C as a function of fish mass: dR = 0.00033W + 0.015 (r2 = 0.303, p = 0.022).
The relationship between fish mass (W) and SMR at 18°C (after removing the activity effect from MO2) of wild-caught individuals as well as aquaculture-reared individuals following correction is shown in Figure 2B. When q = 2.27, the regression obtained minimum RMSE: log (SMR18) = −0.219 log (W) – 4.62 (r2 = 0.616, p < 0.0001). Therefore, bR, the parameter of mass dependence, was defined as −0.219. After SMR was corrected and the mass dependence was removed, the constant aR and temperature dependence cR were defined as 0.0290 g O2 g fish−1 day−1 and −21.42°C−1, respectively, resulting in the best regression Equation (3): SMR/(W−0.219A2.27) = 0.0290e(−21.42/T) (r2 = 0.489, p < 0.0001, Figure 5). Compared with the Northeast stock, the Northwest stock had a significantly higher aR and bR, and a different type of cR. However, within the habitat temperature from 13 to 19°C, the Northwest stock always had a lower temperature dependence [f(t) in Table 2].
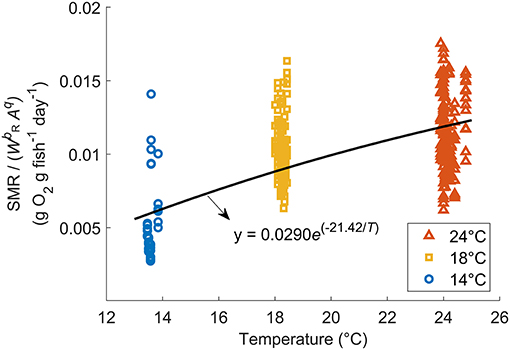
Figure 5. Relationship between SMR without mass dependence [SMR/] and temperature for Northwest stock Pacific chub mackerel. The solid curve is represented by the exponential regression: SMR/(W−0.219Aq) = 0.0290e(−21.42/T) (r2 = 0.489, p < 0.0001).
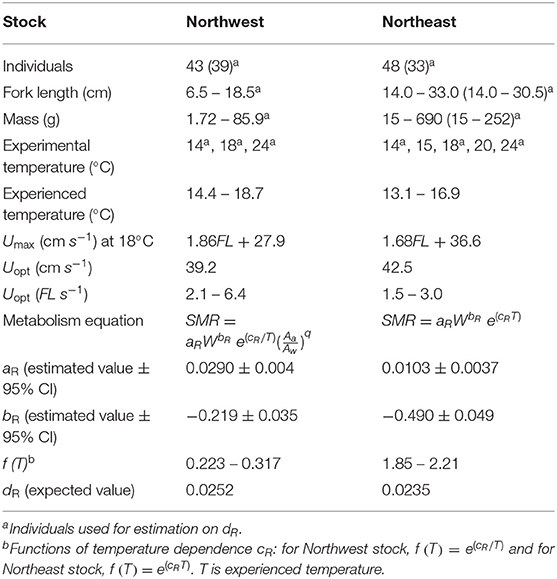
Table 2. Comparison between the Northwest (present study) and Northeast (Guo et al., 2019) stocks of Pacific chub mackerel including individual numbers, fork length (FL, cm), fish mass (W, g), experimental temperature (°C), mean seasonal temperature range experienced by each stock (°C), maximum sustainable swimming speed (Umax, cm s−1) at 18°C, optimum swimming speed (Uopt, cm s−1, and FL s−1), metabolism equation and related parameters: estimated constant aR and mass dependence bR with 95% confidence intervals, temperature dependence f(t) within the range of mean experienced temperature, and activity dependence dR.
Finally, the oxygen consumption rates estimated using Equation (1) were compared to actual R values determined from the experiments for the Northwest stock. Most of the estimated values fell within the 95% confidence intervals of the actual data, and the RMSE of Eerr was 32%. According to Equation (1), R/U = 0.0290W−0.219 e (−21.42/T) e (0.0252U)/U, where Uopt (U at the minimum COT) was 39.2 cm s−1 (2.1–6.4 FL s−1), regardless of temperature and fish mass, which was similar to 42.5 cm s−1 (1.5–3.0 FL s−1) of the Northeast stock.
Experienced Temperature and Energy Consumed
The length-weight relationship of all wild-caught individuals was W = 0.0058FL3.16 (r−2 = 0.989, n = 64). Therefore, the biological intercept W0 and the slope of allometric mass b in Equation (4) were set as 0.0058 g and 3.16, respectively. For the Northwest stock, the relationship of age (t) and mass (W) was estimated as W = 123t + 64.2 (n = 294, r2 = 0.838, p < 0.0001) from age 0 to 5, and the Gompertz growth curve for the first 6 months was W = 207[e−e−3.85(t+0.010)]3.16. For the Northeast stock, the relationship of age (t) and mass (W) was estimated as W = 117t + 57.5 (n = 216, r2 = 0.911, p < 0.0001) from age 0 to 5 and W = 218[e−e−3.36(t+0.011)]3.16 for the first 6 months (Figure 6). The annual experienced temperature of the Northwest stock was 16.8 ± 1.6°C, higher than the Northeast stock of 14.9 ± 1.4°C, as was the range of seasonal fluctuation (14.4–18.7°C compared with 13.1–16.9°C, respectively). In addition, the standard deviation of the monthly temperature anomaly of the Northwest stock, which ranged from 0.5°C (Mar.) to 1.1°C (Jul.), was wider than that of the Northeast stock from 0.6°C (Oct.) to 0.8°C (Mar.) (Figure 1B). Since the activity dependence of the two stocks did not differ significantly, only the SMR of the two stocks was compared by substituting the temperature at each growth stage (relationship with fish mass, Figure 7A) in Equation (3). The SMR of the two stocks both showed seasonal fluctuation and decreased with mass. Compared to the Northeast stock, SMR of the Northwest stock was generally higher (except at ages <2 months), decreased less as the fish grew, and showed more obvious seasonal variation (Figure 7B). Accumulated consumed oxygen, which is the integration of the product of SMR and fish mass from hatch to a given size, was very similar between the two stocks until the fish reached maturity (over 200 g, age 2), at which point the Northwest stock showed an increase in accumulated consumed oxygen as fish mass increased (Figure 7C).
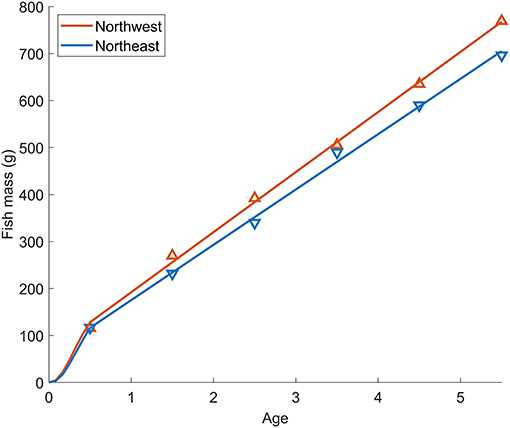
Figure 6. Relationship between fish age and mass for Pacific chub mackerel from the Northwest (red) and Northeast (blue) stocks. Triangle markers are the mean mass at age 0–5 for the Northwest stock during 1970–2018 and Northeast stock during 1983–2018. Lines-of-best-fit from age 0–5 represent the relationship of age (t) and mass (W) of Northwest stock: W = 123t + 64.2 (n = 294, r2 = 0.838, p < 0.0001) and Northeast stock: W = 117t + 57.5 (n = 216, r2 = 0.911, p < 0.0001). The growth curves for the first 6 months are shown as Gompertz functions: W = 207[e−e−3.85(t+0.010)]3.16 for Northwest stock, and W = 218[e−e−3.36(t+0.011)]3.16 for Northeast stock.
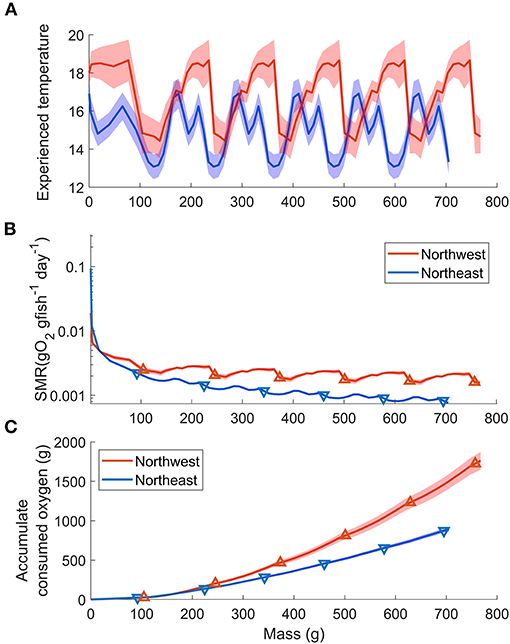
Figure 7. Stock comparisons of the relationship between Pacific chub mackerel mass (growth stage) and (A) experienced temperature (B) SMR (g O2 g fish−1 day−1) and (C) accumulate consumed oxygen (g). Red and blue stand for Northwest and Northeast stocks, respectively. Triangle markers in (B) and (C) are values at age 0–5. The colored shadow represents the standard deviation of temperature in (A) and the associated error in (B,C).
Discussion
This study reports the first robust dataset of Pacific chub mackerel metabolism and swimming bioenergetics from the Pacific Northwest stock, providing information from small to large juveniles over a 10°C temperature range. These parameterized metabolic characteristics and estimated swimming-ability (Umax, Uopt) data were then compared with previous findings from the Northeast stock (Guo et al., 2019). In this section, we discuss similarities and differences between the Northwest and Northeast stocks in terms of differences in the environmental conditions of their habitats, swimming performance, and the effects of mass, temperature and activity on metabolism to determine if oceanic conditions may contribute to stock-specific differences in ecological traits.
Maximum Swimming Speed
At 18°C, Umax at a given fish size, and the rate of increase of Umax with body size did not vary significantly between the Northwest and Northeast stocks (Figure 3B), suggesting that the two stocks have a similar swimming ability at this temperature. At 24°C, Umax of the Northwest stock did not show a significant relationship with fish size as found in the Northeast stock. However, estimates of Umax using the linear relationship of the Northeast stock (Sepulveda and Dickson, 2000) fell within the range of values determined in the present study for the Northwest stock when compared at the same size (Figure 3A), although additional experiments over a wider size range (especially additional mature individuals from Northwest stock and small juveniles from the Northeast stock) would help confirm this relationship. In contrast to the warmer temperatures, Umax values at 14°C did not show a significant relationship with fish size in either stock, and Umax values for the Northwest stock at 14°C were significantly lower than those of slightly larger juveniles of the Northeast stock (ANOVA, p = 0.004, Figure 3C). This difference in swimming performance may reflect mean habitat temperature differences between the two stocks. Generally, the Northwest stock experiences relatively higher temperatures (mean seasonal variation of 14.4–18.7°C), while the Northeast stock typically experiences lower temperatures (13.1–16.9°C) (Figure 1B), suggesting that the Northeast stock may be better adapted for fast swimming speeds at the lower temperatures they more regularly encounter. However, the Umax values at 14°C of the Northwest stock were only obtained from aquaculture juveniles, which experienced higher temperatures than the wild individuals. Because of our limited sample size, the wild individuals from the Northwest stock were only tested at 18 and 24°C, and therefore, we were not able to directly verify if there were any differences in the swimming performance of wild and aquaculture individuals from the Northwest stock at 14°C. Additional experiments on Northwest stock wild individuals are needed to support this conspecific comparison at low temperature in the future work.
Similar to the Northeast stock (Dickson et al., 2002), we found a general increase in the Umax from the Northwest stock when temperature increased from 18 to 24°C. This was particularly noticeable for the smallest juveniles (Figures 3A,B). Generally, higher temperatures increase metabolism and promote swimming activity by the Q10 effect. Since Scomber spp. are highly susceptible to starvation (Mendiola et al., 2007), an increase in swimming performance at high temperatures may be essential to capture sufficient prey to sustain higher levels of metabolism associated with warm temperatures, especially at the early juvenile stage. In contrast, the Umax of larger juveniles from both the Northwest and Northeast stock (Guo et al., 2019) did not significantly increase from 14 to 18°C. While this may be partially attributed to the relatively small experimental temperature difference between 14 and 18°C, it may also reflect the typical water temperatures experienced by chub mackerel in the wild. During the large juvenile stage (July–September), the typical sea surface temperature experienced by the two stocks ranges from 15 to 19°C, and thus our results suggest that chub mackerel have a relatively stable swimming ability within this natural range of habitat temperature.
Activity Dependence on Metabolism
The dR (indicating the swimming speed dependence of respiration) of the Northwest stock had a positive relationship with fish mass at 24°C, but did not show mass dependence at 18 and 14°C (Figure 4). In contrast, Guo et al. (2019) showed a negative relationship between fish mass and dR. regardless of temperature in the Northeast stock. However, after removing the effect of mass, the value of dR did not differ significantly between the two stocks, suggesting that the increase in metabolic rate due to swimming activity did not differ between the stocks. The different mass dependence on dR between the two stocks may reflect the different size range of fish examined in this study (2–94 g) in comparison to Guo et al. (2019) (26–252 g). We are not aware of other studies that have directly investigated mass dependence of dR. However, Brett (1965) considered changes in metabolic rate in response to both swimming speed and large changes in body mass for sockeye salmon as pointed out by Halsey et al. (2018). Brett (1965) showed a size dependence of the ratio between the maximum metabolic rate and Umax for sockeye salmon. At Umax, the activity effect of the oxygen consumption rate could also be represented as the ratio of maximum metabolic rate to SMR. Thus, we calculated the dR of sockeye salmon by substituting metabolic rate data and Umax data given by Brett (1965) into Equation (2). The best regression of the relationship between dR and mass suggested that dR of sockeye salmon decreased significantly as mass increased: dR_salmon = −0.000004W + 0.0134 (r2 = 0.725, p = 0.031, Figure 8). However, the slope coefficient was very small and the dR of the 3-month old individual (first data point at 3.38 g) was relatively low compared with that at later juvenile stages. Therefore, the mass dependence of dR_salmon seemed positive for early stages but turned negative for later stages. This difference in the mass dependence of dR by life stage thus appears similar to the pattern observed in the present study for chub mackerel when considering the Northwest and Northeast datasets together. Relatedly, the effect of temperature (18 vs. 24°C) on SMR and dR were only significant in small juvenile individuals, indicating that the temperature effect on metabolism and swimming energetics was more obvious at the early life stage. This finding appears related to the Umax of small juveniles at 24°C, which was significantly higher than that measured at 18°C. Thus, while a higher temperature increases SMR, a lower dR. enables the fish to swim more efficiently at a relatively high speed at warmer temperatures, potentially saving energy when searching for prey or on longer movements and migration. However, additional studies on larger mature individuals of the Northwest stock should be considered to support this trend.
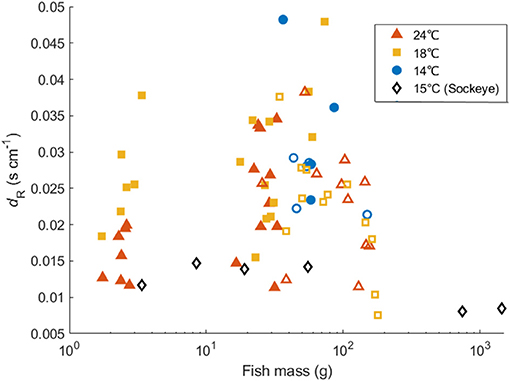
Figure 8. Comparison of the relationship between fish mass and dR among Pacific chub mackerel from the Northwest (solid markers) and Northeast (open markers) stocks in comparison to sockeye salmon (Oncorhynchus nerka, black diamonds) derived from Brett (1965).
Mass Dependence and Temperature Dependence on Metabolism
Since no significant difference was found in the activity dependence of metabolism and optimal swimming speed (Uopt) between the two stocks (Table 2), the difference in oxygen consumption could be attributed to the mass dependence and temperature dependence on metabolism. Generally, temperature dependence of fish follows the temperature coefficient Q10, and the metabolic rate increases faster at higher temperatures (Hegarty, 1973; Videler, 1993), as seen in the Northeast stock of chub mackerel (Guo et al., 2019). However, the metabolic rate of the Northwest stock increased slower at higher temperatures and the temperature dependence fitted better as Equation (3), with a higher r2 and lower RMSE (Figure 5). Since the Northwest stock typically experience a relatively higher temperature than the Northeast stock, especially at the early growth stage of the first 6 months after hatch (Figure 1B), the lower thermal dependence of metabolism at high temperatures could help larvae and juveniles of the Northwest stock conserve energy. Compared to the Northeast stock, the Northwest stock had much lower temperature dependence within the habitat temperature (Table 2), indicating that they may be better adapted to deal with a warmer environment.
In addition to a lower thermal dependence, the Northwest stock also showed lower mass dependence (higher bR) on metabolism compared to the Northeast stock (Table 2), which could help to reduce SMR with growth, especially at the larval and early juvenile stage. Although the Northwest stock usually experiences higher temperatures than the Northeast stock (Figure 7A), the SMR of the Northwest stock is predicted to be lower than that of the Northeast stock for fish under 21 g (about 2 months after hatch) because of the combining effect of aR, bR and temperature dependence (Figure 7B). The wild-caught individuals from the Northwest stock measured in this study were from larvae that likely hatched around the Izu Islands and would have been transported by the Kuroshio and the Kuroshio Extension, where the temperature is relatively higher than that of the California Current system. Thus, the lower mass dependence on SMR could help the Northwest stock larvae maintain a relatively lower metabolic demand at an early stage. In addition, a lower increase in metabolism with higher temperatures could also conserve additional energy for growth at the higher temperatures they typically experience. The analysis of stable oxygen isotope ratios of otoliths and larger juvenile chub mackerel collected in the Kuroshio–Oyashio transition region indicates that faster growing fish proactively enter cooler water areas, accessing a highly nutritious diet resulting in further rapid growth (“growth positive spiral” hypothesis; Higuchi et al., 2019). The relatively cooler water temperature and good prey environment could balance the higher mass dependence on metabolism after the early growth stage. Similarly, the cool and highly productive upwelling environment of the California Current system likely provides the Northeast stock with greater prey availability to obtain the energy required to balance their high metabolic demand during the early growth stage. Although the mass dependence and temperature dependence of the two stocks were different, the accumulated SMR was similar between the two stocks until the fish reached maturity at about 2 years of age (Figure 7C). This suggests that the mass dependence and temperature dependence on the metabolism of the two stocks are specific to their environment for lower energy consumption, especially for early life stages before they experience first reproduction.
Conclusions
In conclusion, the two stocks of chub mackerel showed a similar swimming ability (Umax) at temperatures regularly encountered within their habitat. In addition, the similar optimal swimming speed (Uopt) of the two stocks suggests that the chub mackerel prefers to maintain a similar migration speed regardless of habitat. Consequently, the activity dependence on oxygen consumption rate may have different mass dependence, but after removing the mass effect, the activity dependence of the two stocks did not differ significantly. Compared to the Northeast stock, the Northwest stock had a relatively lower mass dependence and a lower rate of increase in oxygen consumption as temperature increased. These characteristics could represent the adaptation of the Northwest stock to grow faster at a relatively warmer and less-prey abundant environment under the influence of a warm western boundary current. Thus, while the swimming ability and migration speed are similar, fish from different stocks possibly adapt to their local environment by specializing their metabolism for less energy dissipation.
Data Availability Statement
The original contributions presented in the study are included in the article/Supplementary Material, further inquiries can be directed to the corresponding author.
Ethics Statement
The animal study was reviewed and approved by Life science research and safety committee of the university of Tokyo. Written informed consent was obtained from the owners for the participation of their animals in this study.
Author Contributions
CG, SI, NW, and ED devised the project, the main conceptual ideas, and proof outline. CG and SI conceived and planned all experiments and carried out the experiments with HKi (on aquaculture-reared small juveniles), MY, MN, and HKa (on aquaculture-reared larger juveniles), and ME, TA, and TK (on wild-caught larger juveniles). CG and SI processed the experimental data, performed the analysis, and designed the figures. CG wrote the manuscript with input from all authors. All authors discussed the results and commented on the manuscript.
Funding
This work was supported by KAKENHI (Grant-in-Aid for Scientific Research on Innovative Areas) Grant Number JP15H05823 (OMIX project) and JP18H03956.
Conflict of Interest
ED was employed by Lynker Technologies, LLC under contract to Southwest Fisheries Science Center, NOAA.
The remaining authors declare that the research was conducted in the absence of any commercial or financial relationships that could be construed as a potential conflict of interest.
Acknowledgments
We would like to thank all the staff from Karatsu, Hakatajima, and Otsuchi for their assistance with fish care. We appreciate the invaluable suggestions from the editor and two reviewers.
Supplementary Material
The Supplementary Material for this article can be found online at: https://www.frontiersin.org/articles/10.3389/fmars.2021.613965/full#supplementary-material
References
Bell, W., and Terhune, L. (1970). Water Tunnel Design for Fisheries Research. Technical Report 195. Fisheries Research Board of Canada, 1–69.
Bograd, S. J., Schroeder, I., Sarkar, N., Qiu, X., Sydeman, W. J., and Schwing, F. B. (2009). Phenology of coastal upwelling in the California Current. Geophys. Res. Lett. 36:L01602. doi: 10.1029/2008GL035933
Brett, J. R. (1964). The respiratory metabolism and swimming performance of young Sockeye Salmon. J. Fish. Res. Board Canada 21, 1183–1226. doi: 10.1139/f64-103
Brett, J. R. (1965). The relation of size to rate of oxygen consumption and sustained swimming speed of sockeye salmon (oncorhynchus nerka). J. Fish. Res. Board Canada 22, 1491–1501. doi: 10.1139/f65-128
Clarke, A. (2003). Costs and consequences of evolutionary temperature adaptation. Trends Ecol. Evol. 18, 573–581. doi: 10.1016/j.tree.2003.08.007
Clarke, A., and Johnston, N. M. (1999). Scaling of metabolic rate with body mass and temperature in teleost fish. J. Anim. Ecol. 68, 893–905. doi: 10.1046/j.1365-2656.1999.00337.x
Collette, B. B., Acero, A., Canales Ramirez, C., Cardenas, G., Carpenter, K. E., Chang, S. K., et al. (2011). Scomber japonicus. IUCN Red List Threat. Species 2011:e.T170306A6737373. doi: 10.2305/IUCN.UK.2011-2.RLTS.T170306A6737373.en
Conover, D. O. (1992). Seasonality and the scheduling of life history at different latitudes. J. Fish Biol. 41, 161–178. doi: 10.1111/j.1095-8649.1992.tb03876.x
Conover, D. O., and Present, T. M. C. (1990). Countergradient variation in growth rate: compensation for length of the growing season among Atlantic silversides from different latitudes. Oecologia 83, 316–324. doi: 10.1007/BF00317554
Crone, P. R., and Hill, K. T. (2015). Pacific Mackerel (Scomber japonicus) Stock Assessment for USA Management in the 2015–16 Fishing Year. Pacific Fishery Management Council, 131.
Crone, P. R., Hill, K. T., Zwolinski, J. P., and Kinney, M. J. (2019). Pacific Mackerel (Scomber japonicus) Stock Assessment for U.S. Management in the 2019–20 and 2020–21 Fishing Years (p. 112). Portland, OR: Pacific Fishery Management Council.
Dewar, H., and Graham, J. (1994). Studies of tropical tuna swimming performance in a large water tunnel. III. kinematics. J. Exp. Biol. 192, 45–59.
Dickson, K., Donley, J., Sepulveda, C., and Bhoopat, L. (2002). Effects of temperature on sustained swimming performance and swimming kinematics of the chub mackerel Scomber japonicus. J. Exp. Biol. 205, 969–980.
Glazier, D. S. (2005). Beyond the “3/4-power law”: variation in the intra- and interspecific scaling of metabolic rate in animals. Biol. Rev. Camb. Philos. Soc. 80, 611–662. doi: 10.1017/S1464793105006834
Guo, C., Ito, S., ichi Wegner, N. C., Frank, L. N., Dorval, E., Dickson, K. A., et al. (2019). Metabolic measurements and parameter estimations for bioenergetics modelling of Pacific Chub Mackerel Scomber japonicus. Fish. Oceanogr. 29, 215–226. doi: 10.1111/fog.12465
Halsey, L. G., Killen, S. S., Clark, T. D., and Norin, T. (2018). Exploring key issues of aerobic scope interpretation in ectotherms: absolute versus factorial. Rev. Fish Biol. Fish. 28, 405–415. doi: 10.1007/s11160-018-9516-3
Hay, D. E., Rose, K. A., Schweigert, J., and Megrey, B. A. (2008). Geographic variation in North Pacific herring populations: Pan-Pacific comparisons and implications for climate change impacts. Prog. Oceanogr. 77, 233–240. doi: 10.1016/j.pocean.2008.03.015
Hegarty, T. W. (1973). Temperature coefficient (Q10), seed germination, and other biological processes. Nature 243, 305–306. doi: 10.1038/243305a0
Higuchi, T., Ito, S., Ishimura, T., Kamimura, Y., Shirai, K., Shindo, H., et al. (2019). Otolith oxygen isotope analysis and temperature history in early life stages of the chub mackerel Scomber japonicus in the Kuroshio–Oyashio transition region. Deep Sea Res. Part II Top. Stud. Oceanogr. 169–170:104660. doi: 10.1016/j.dsr2.2019.104660
Ikeda, T. (2016). Routine metabolic rates of pelagic marine fishes and cephalopods as a function of body mass, habitat temperature, and habitat depth. J. Exp. Mar. Biol. Ecol. 480, 74–86. doi: 10.1016/j.jembe.2016.03.012
Ito, S., Rose, K. A., Megrey, B. A., Schweigert, J., Hay, D., Werner, F. E., et al. (2015). Geographic variation in Pacific herring growth in response to regime shifts in the North Pacific Ocean. Prog. Oceanogr. 138, 331–347. doi: 10.1016/j.pocean.2015.05.022
Johnston, I. A., Calvo, J., Guderley, H., Fernandez, D., and Palmer, L. (1998). Latitudinal variation in the abundance and oxidative capacities of muscle mitochondria in perciform fishes. J. Exp. Biol. 201, 1–12.
Kaneko, H., Okunishi, T., Seto, T., Kuroda, H., Itoh, S., Kouketsu, S., et al. (2019). Dual effects of reversed winter–spring temperatures on year-to-year variation in the recruitment of chub mackerel (Scomber japonicus). Fish. Oceanogr. 28, 212–227. doi: 10.1111/fog.12403
Killen, S. S., Atkinson, D., and Glazier, D. S. (2010). The intraspecific scaling of metabolic rate with body mass in fishes depends on lifestyle and temperature. Ecol. Lett. 13, 184–93. doi: 10.1111/j.1461-0248.2009.01415.x
Mandal, P., Cai, L., Tu, Z., Johnson, D., and Huang, Y. (2016). Effects of acute temperature change on the metabolism and swimming ability of juvenile sterlet sturgeon (Acipenser ruthenus, Linnaeus 1758). J. Appl. Ichthyol. 32, 267–271. doi: 10.1111/jai.13033
MBC Applied Environmental Sciences (1987). Ecology of Important Fisheries Species Offshore California. Costa Mesa, CA: MBC Applied Environmental Sciences.
McDowall, R. M. (2008). Jordan's and other ecogeographical rules, and the vertebral number in fishes. J. Biogeogr. 35, 501–508. doi: 10.1111/j.1365-2699.2007.01823.x
Mendiola, D., Ibaibarriaga, L., and Alvarez, P. (2007). Thermal effects on growth and time to starvation during the yolk-sac larval period of Atlantic mackerel Scomber scombrus L. J. Fish Biol. 70, 895–910. doi: 10.1111/j.1095-8649.2007.01353.x
Munch, S. B., and Salinas, S. (2009). Latitudinal variation in lifespan within species is explained by the metabolic theory of ecology. Proc. Natl. Acad. Sci. U.S.A. 106, 13860–13864. doi: 10.1073/pnas.0900300106
Nakata, H., Funakoshi, S., and Nakamura, M. (2000). Alternating dominance of postlarval sardine and anchovy caught by coastal fishery in relation to the Kuroshio meander in the Enshu-nada Sea. Fish. Oceanogr. 9, 248–258. doi: 10.1046/j.1365-2419.2000.00140.x
Norin, T., and Clark, T. D. (2016). Measurement and relevance of maximum metabolic rate in fishes. J. Fish Biol. 88, 122–151. doi: 10.1111/jfb.12796
Ohnishi, T., Biswas, A., Kaminaka, K., Murata, O., and Takii, K. (2016). Energy partitioning in cultured juvenile chub mackerel (Scomber japonicas) fed with diet composed of enzyme treated fish meal. Fish. Sci. 82, 473–480. doi: 10.1007/s12562-016-0975-y
Sassa, C., Konishi, Y., and Mori, K. (2006). Distribution of jack mackerel (Trachurus japonicus) larvae and juveniles in the East China Sea, with special reference to the larval transport by the Kuroshio Current. Fish. Oceanogr. 15, 508–518. doi: 10.1111/j.1365-2419.2006.00417.x
Sepulveda, C., and Dickson, K. A. (2000). Maximum sustainable speeds and cost of swimming in juvenile kawakawa tuna (Euthynnus affinis) and chub mackerel (Scomber japonicus). J. Exp. Biol. 203, 3089–3101.
Stewart, D. J., and Binkowski, F. P. (1986). Dynamics of consumption and food conversion by lake michigan alewives: an energetics-modeling synthesis. Trans. Am. Fish. Soc. 115, 643–661. doi: 10.1577/1548-8659(1986)115<643:DOCAFC>2.0.CO;2
Takahashi, M., Yoneda, M., Kitano, H., Kawabata, A., and Saito, M. (2014). Growth of juvenile chub mackerel Scomber japonicus in the western North Pacific Ocean: with application and validation of otolith daily increment formation. Fish. Sci. 80, 293–300. doi: 10.1007/s12562-013-0698-2
Takasuka, A., Oozeki, Y., and Kubota, H. (2008). Multi-species regime shifts reflected in spawning temperature optima of small pelagic fish in the western North Pacific. Mar. Ecol. Prog. Ser. 360, 211–217. doi: 10.3354/meps07407
Trip, E. D. L., Clements, K. D., Raubenheimer, D., and Choat, J. H. (2014). Temperature-related variation in growth rate, size, maturation, and life span in a marine herbivorous fish over a latitudinal gradient. J. Anim. Ecol. 83, 866–875. doi: 10.1111/1365-2656.12183
Videler, J. J. (1993). “Fish swimming” in Fish and Fisheries Series (Vol. 10). doi: 10.1007/978-94-011-1580-3
Wisner, R. L. (1960). Evidence of a northward movement of stocks of the Pacific sardine based on the number of vertebrae. Calif. Coop. Ocean. Fish. Invest. Rep. 8, 75–82.
Yukami, R., Nishijima, S., Isu, S., Watanabe, C., Kamimura, Y., and Furuichi, S. (2019). “Stock assessment and evaluation for the Pacific stock of chub mackerel (fiscal year 2018),” in Marine Fisheries Stock Assessment and Evaluation for Japanese Waters (Fiscal Year 2018/2019) (Yokohama: Fisheries Research and Education Agency of Japan), 163–208. Available online at: http://abchan.fra.go.jp/digests2018/details/201805.pdf (accessed January 10, 2020).
Keywords: Pacific chub mackerel, Scomber japonicus, bioenergetics modeling, metabolism, oxygen consumption rate, temperature, swimming speed, small pelagic fish
Citation: Guo C, Ito S, Yoneda M, Kitano H, Kaneko H, Enomoto M, Aono T, Nakamura M, Kitagawa T, Wegner NC and Dorval E (2021) Fish Specialize Their Metabolic Performance to Maximize Bioenergetic Efficiency in Their Local Environment: Conspecific Comparison Between Two Stocks of Pacific Chub Mackerel (Scomber japonicus). Front. Mar. Sci. 8:613965. doi: 10.3389/fmars.2021.613965
Received: 04 October 2020; Accepted: 14 January 2021;
Published: 09 February 2021.
Edited by:
Enric Gisbert, Institute of Agrifood Research and Technology (IRTA), SpainReviewed by:
Peter Allen, Mississippi State University, United StatesBarbara Zorica, Institute of Oceanography and Fisheries (IZOR), Croatia
Copyright © 2021 Guo, Ito, Yoneda, Kitano, Kaneko, Enomoto, Aono, Nakamura, Kitagawa, Wegner and Dorval. This is an open-access article distributed under the terms of the Creative Commons Attribution License (CC BY). The use, distribution or reproduction in other forums is permitted, provided the original author(s) and the copyright owner(s) are credited and that the original publication in this journal is cited, in accordance with accepted academic practice. No use, distribution or reproduction is permitted which does not comply with these terms.
*Correspondence: Shin-ichi Ito, Z29pdG9AYW9yaS51LXRva3lvLmFjLmpw