 Ah Ran Kim
 Tae-Ho Yoon
 Chung Il Lee
 Chang-Keun Kang
 Hyun-Woo Kim
- 1Interdisciplinary Program of Biomedical, Mechanical and Electrical Engineering, Pukyong National University, Busan, South Korea
- 2Aquatic Living Resources Division, FIRA (Korea Fisheries Resources Agency), Busan, South Korea
- 3Department of Marine Bioscience, Gangneung-Wonju National University, Gangneung, South Korea
- 4School of Earth Sciences and Environmental Engineering, Gwangju Institute of Science and Technology, Gwangju, South Korea
- 5Department of Marine Biology, Pukyong National University, Busan, South Korea
The spatiotemporal distribution of fish larvae and eggs is fundamental for their reproduction and recruitment in aquatic ecosystems. Here, a metabarcoding strategy was employed as an alternative to a conventional ichthyoplankton survey, which requires a considerable amount of time, labor, and cost. First, a piscine-specific universal primer set (FishU) was designed to amplify the region, flanking the highly conserved mitochondrial 12S and 16S ribosomal genes, and it was optimized for the MiSeq platform. Based on both in silico and in vitro analyses, the newly designed FishU primers outperformed the two previously reported fish-specific universal primer sets (ecoPrimer and MiFish) in taxon coverage, specificity, and accuracy in species identification. The metabarcoding results by FishU primers successfully presented the diversity of ichthyoplankton directly from the zooplankton net samples in the East/Japan Sea, presenting more accurate and plentiful species numbers than those by MiFish primers. Thus, the metabarcoding analysis of ichtyoplankton using the newly designed FishU primers is a promising tool for obtaining useful data to understand the reproduction of fish, such as spawning sites, reproductive periods, population structures, feeding ecology, and diet.
Introduction
DNA metabarcoding is a recently established technique that makes it possible to conduct taxonomic identification of entire assemblages in environmental samples via high-throughput sequencing (Yu et al., 2012). Because of its reliable results with relatively low cost and labor, this technique has become one of the most widely used methods in ecological studies, including biodiversity assessment (Valentini et al., 2016; Bylemans et al., 2018), the detection of invasive species (Borrell et al., 2017; Klymus et al., 2017), and feeding ecology (Iwanowicz et al., 2016; Yoon et al., 2017; Hawlitschek et al., 2018). The environmental DNA (eDNA) derived from organisms in water samples can also be directly analyzed by eDNA metabarcoding, another promising method that has little impact on the ecosystem during sample collection (Thomsen et al., 2012; Sigsgaard et al., 2017; Yamamoto et al., 2017; Bylemans et al., 2019; McDevitt et al., 2019). As a result, metabarcoding is now being considered by many researchers as a reliable alternative to replace time-consuming and laborious traditional survey methods (Berry et al., 2015; Aylagas et al., 2016; Shaw et al., 2016; Watts et al., 2019).
Most metabarcoding analyses are currently based on the assemblage of PCR products amplified by a universal primer for specific taxa. Several fish-specific universal primers have been developed targeting 12S rRNA regions, such as EcoPrimers (Riaz et al., 2011) and MiFish (Miya et al., 2015), 16S rRNA region primers (Evans et al., 2016; Shaw et al., 2016), cytochrome b (Minamoto et al., 2012; Thomsen et al., 2012) and cytochrome c oxidase I (Balasingham et al., 2018; Collins et al., 2019). Among them, the primers targeting the 12S rRNA and 16S rRNA regions generally showed higher performance in the broader taxonomic range and species-level assignment than the primers targeting the cytochrome b region (Zhang et al., 2020). The MiFish primer set demonstrated reliability for fish biodiversity analysis of eDNA samples for both seawater (Ushio et al., 2017; Yamamoto et al., 2017) and freshwater (Sato et al., 2018). The bioinformatics tool, web-based MiFish pipeline1 also provides a standardized and convenient bioinformatic platform, which has helped researchers obtain reliable metabarcoding data without considering the complicated bioinformatics processes from the raw reads generated by the sequencer (Sato et al., 2018). Therefore, the MiFish platform is now being widely used for the study of fish biodiversity using eDNA metabarcoding analysis (Andruszkiewicz et al., 2017; Yamamoto et al., 2017; Bylemans et al., 2019). In particular, owing to its small amplicon size (∼170 bp), the MiFish platform is currently considered one of most reliable tools for the eDNA metabarcoding analysis of fish taxa. However, the small amplicon size of MiFish is a double-faceted property. Although it may increase the chance of detection rate, its small amplicon size may not have enough sequence to discriminate a species from the closely related ones (Bylemans et al., 2018; Zhang et al., 2020). In fact, MiFish sequences could not discriminate species in several genera, including Sebastes and Takifugu (Yamamoto et al., 2017). In addition, the short MiFish sequence may require sufficient reference sequences in the database for the local fish assemblage, which would be another barrier to adopting the MiFish platform directly for local analysis. Even a single nucleotide difference in the region may result in the assignment of a wrong species in the MiFish platform (Yamamoto et al., 2017). Therefore, it was necessary to design a primer set covering larger barcode sequences for higher discrimination power.
Ichthyoplankton refers to the eggs and larvae of fish, which is usually found at depths of less than 200 m, in what is known as the epipelagic zone. Their surveys have been conducted for a long time in the East/Japan Sea to obtain information about fish resources, ranging from the spawning areas and seasons to the estimated numbers of spawning stocks and changes in the distribution of certain species (Keller et al., 1999; Shoji et al., 2011). Due to the simple coastlines, fisheries in the East/Japan Sea have been strongly affected by the collision of two main currents along with the Korean peninsula: the North Korea cold current (NKCC) from the North and East Korea warm current (EKWC), a branch of the Tsushima current (Kim et al., 2007b). In addition, the transport processes of eggs and larvae are largely dependent on the variability in these two currents, affecting the recruitment and productivity of each fish stock (Yatsu et al., 2005). Therefore, ichthyoplankton surveys have been one of the main methods to understand fisheries in the East/Japan Sea. However, traditional ichthyoplankton surveys depend mainly on microscopic morphological observations, which require a considerable amount of time and effort to sort and count the eggs and larval fish from the zooplankton net samples. In addition, morphological identification of several fish larvae and eggs remains a challenge even for experienced specialists. These drawbacks have been a major bottleneck in conducting large-scale ichthyoplankton surveys.
Therefore, there is a need for the use of metabarcoding analysis for ichthyoplankton surveys. However, the use of short barcodes, such as MiFish, often results in the misidentification of exotic species due to ichthyoplankton being transported from distant locations by currents. To avoid potential issues with identification, an accurate species analysis using longer barcodes was needed. In this study, we designed novel fish-specific universal primers (FishU) to analyze ichthyoplankton from the zooplankton net samples. FishU yields longer amplicons that have a higher taxon specificity than MiFish. Their reliability was compared with previously designed fish-specific universal primers, including ecoPrimer and MiFish. We also compared the metabarcoding data generated by two primers, MiFish and FishU, using zooplankton samples obtained from the East/Japan Sea. These data show the FishU primer set provides a higher accuracy in species assignment and recovers more species than the MiFish primer set. Thus, the newly developed FishU primers represent a useful tool for ichthyoplankton surveys in countries with relatively limited reference sequence information, facilitating a molecular strategy in fishery surveys.
Materials and Methods
Design of Universal Primer Set for Fish Taxa
A pair of universal fish primer sets (FishU) was designed to meet three goals: (i) wide taxon coverage to present most of the fish species, (ii) a high degree of taxon specificity to amplify fish DNA from mixed zooplankton samples, and (iii) an optimized amplicon size for the Illumina MiSeq platform (300–500 bp). FishU primers were designed to amplify the region between the end of 12S and 16S based on the multiple alignment of 1,808 fish mitogenome sequences obtained from the MITOFISH database (Iwasaki et al., 2013) (Supplementary data 1). The expected amplicon size by FishU was approximately 373 bp (Figure 1).
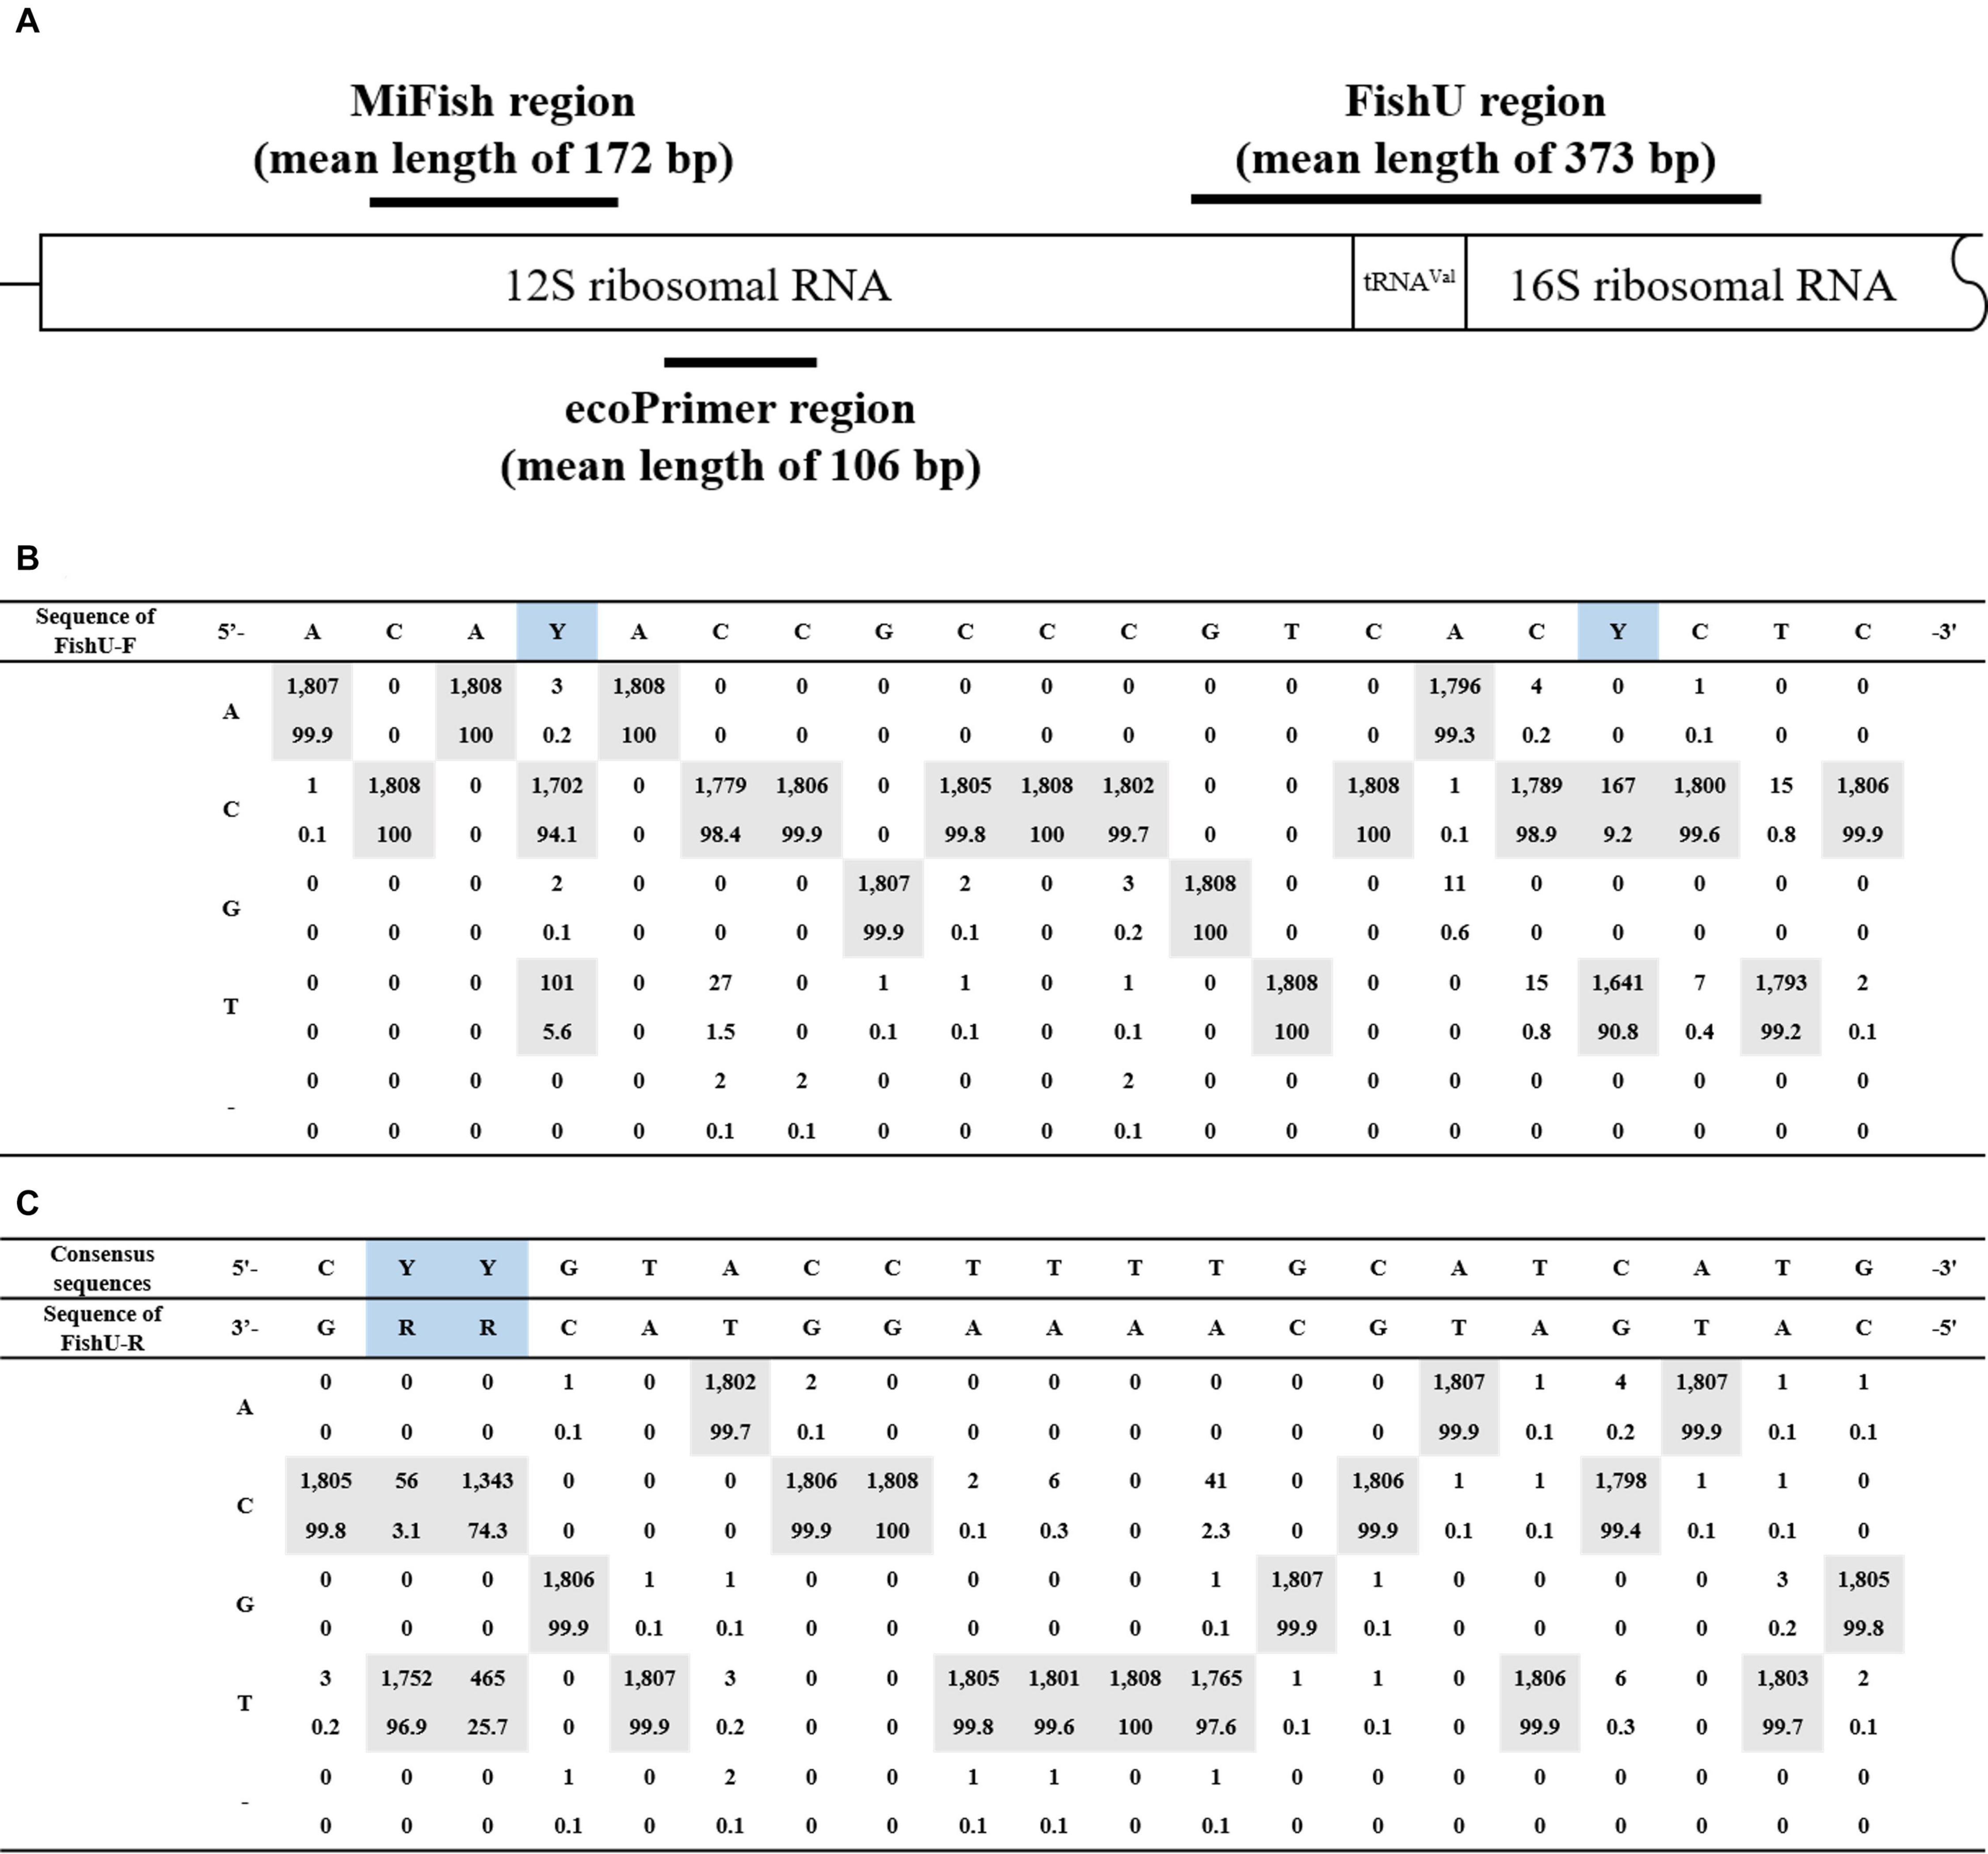
Figure 1. Primer region schematic representation. (A) The position of the primer used in this study is represented in the structure of general mtDNA, including 12S and 16S rRNA genes. MiFish has a mean length of 172 bp; FishU has a mean length of 373 bp. (B) Consensus nucleotide sequences of the forward primer. (C) Consensus nucleotide sequences of the reverse primer.
The FishU primers were validated by in silico analysis using 1,808 fish mitogenome sequences in the database. The OBITools software (Boyer et al., 2016) was used to calculate the amplified species numbers according to the mismatched nucleotide numbers of the three universal primers (ecoPrimer, MiFish, and FishU). Taxonomic resolutions amplified by three primers were calculated by in silico PCR using the ecotaxspecificity script of OBITools (Boyer et al., 2016).
Examination of the Reliability of the FishU Primer Set
The taxon specificity of the FishU primer set was examined by PCR analysis (Figure 2). The amplification by FishU was tested with 51 individual fish samples collected from Korean waters, which covered 50 genera, 37 families, and 14 orders. Specificity for fish species was tested by PCR with the most abundant invertebrate taxa in the zooplankton net samples, including Metridia pacifica (copepod), Euphausia pacifica (krill), Sagitta elegans (arrow worm), and Penaeus monodon (shrimp). Genomic DNA was extracted using the AccuPrep® Genomic DNA Extraction Kit (Bioneer, Republic of Korea) following the manufacturer’s instructions. PCR amplification was performed with extracted DNA as templates and three different primer sets (ecoPrimer, MiFish, and FishU). PCR amplification with the FishU primer set was conducted using the following cycling conditions: initial denaturation at 94°C for 3 min, followed by 35 cycles of 94°C for 30 s, 48°C for 30 s, and 72°C for 30 s with a final extension at 72°C for 3 min. PCR conditions with MiFish and ecoPrimer sets were the same as above except for the annealing step at 50°C for 10 s. The PCR reaction mixture (20 μL) contained 100 ng template, 1 μL of each primer (10 pmol), 2 μL of dNTPs (10 mM), 0.2 μL exTaq HS (Takara, Japan), and 2 μL of 10 × buffer and distilled water to a final volume of 20 μL. The amplification products were separated by 1.5% agarose gel electrophoresis and stained with loading star dye (Dynebio, Republic of Korea).
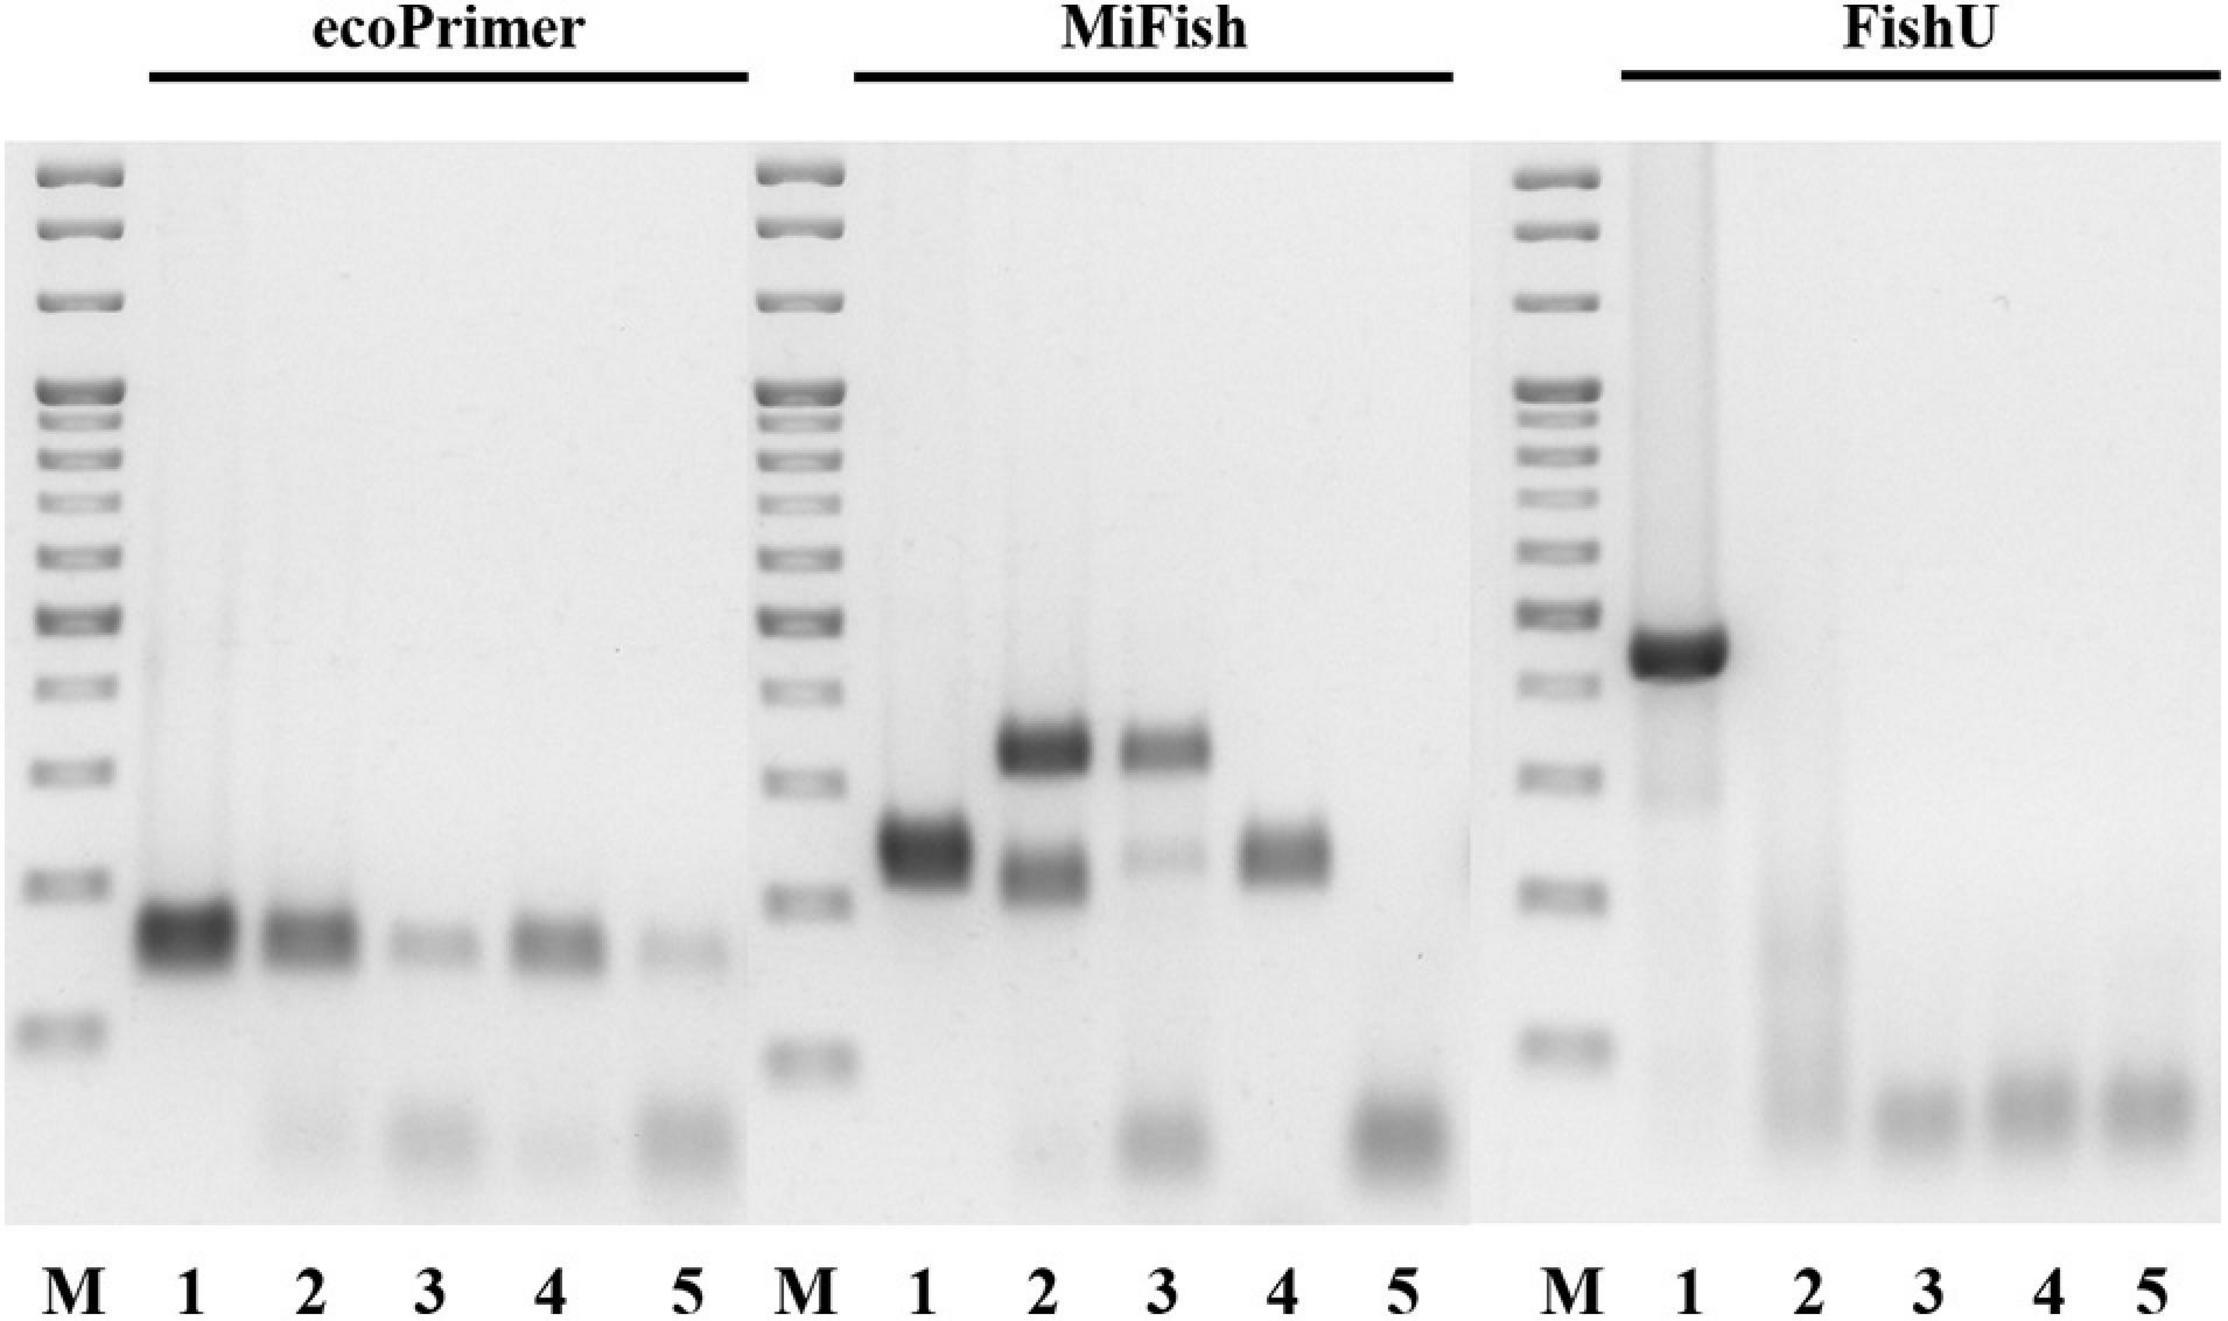
Figure 2. Cross-reactivity of three primers. Merged image of three RT-PCR results by respective primer set. Lane M: 100 bp ladder molecular weight marker (Solgent, Korea). Lane 1: Engraulis japonicus (Positive control). Lane 2: Sagitta elegans. Lane 3: Euphausia pacifica. Lane 4: Metridia pacifica. Lane 5: Penaeus monodon.
The taxon coverage and specificity of the three primers was also compared through metabarcoding analysis. The library for MiSeq sequencing was constructed using the Nextera XT index kit (Illumina, United States). Genomic DNA (200 ng) in two random zooplankton samples was amplified using three primer sets with the adapter. The first PCR conditions of FishU involved initial denaturation at 94°C for 3 min, followed by 30 cycles of 94°C for 30 s, 48°C for 30 s, and 72°C for 30 s with a final extension at 72°C for 3 min. The first PCR amplification was performed with a 20 μL reaction volume containing 200 ng of template, 1 μL of each FishU with adapter primer (20 pmol), 0.5 μL of dNTPs (10 mM), 0.2 μL of ex hot start Taq (TaKaRa, Japan), and 2 μL of 10 × exTaq buffer. The PCR reaction mixture and conditions with the MiFish and ecoPrimer set were identical to the FishU mixture except for the primer with adapter (each 5 pmol). The first amplicons were visualized by 1.5% agarose gel electrophoresis, and the fragment of expected size was collected. The collected fragments of each primer set were purified using the AccuPrep® Gel Purification Kit (Bioneer, Republic of Korea) and eluted with 20 μL of elution buffer. The purified products were used to construct a library using the Nextera XT index kit (Illumina, United States) according to the manufacturer’s instructions. Nextera libraries were purified using the AccuPrep® Gel Purification Kit (Bioneer, Republic of Korea). After the quality and quantity of the library were measured using the 2100 Bioanalyzer (Agilent Technologies, United States) and qubit dsDNA HS Assay Kit (Invitrogen, United States), sequencing was performed using the Illumina MiSeq (2 × 300 bp pair ends).
Metabarcoding Analysis of Ichthyoplankton From Zooplankton Net Sample
Zooplankton net samples were collected from 12 sample stations from the coastal waters along the Korean Peninsula as part of a project funded by the Ministry of Oceans and Fisheries, Korea (Figure 3, Supplementary Table 1). Plankton samples were collected by oblique tows using a bongo net (60 cm in diameter, 330 μm in mesh size) monthly from January to June 2016. The collected zooplankton samples were immediately stored in five volumes of 99.5% ethanol (Daejung Chemicals & Metals Co., Ltd., Republic of Korea), transferred to the laboratory, and stored at −20°C until further analysis.
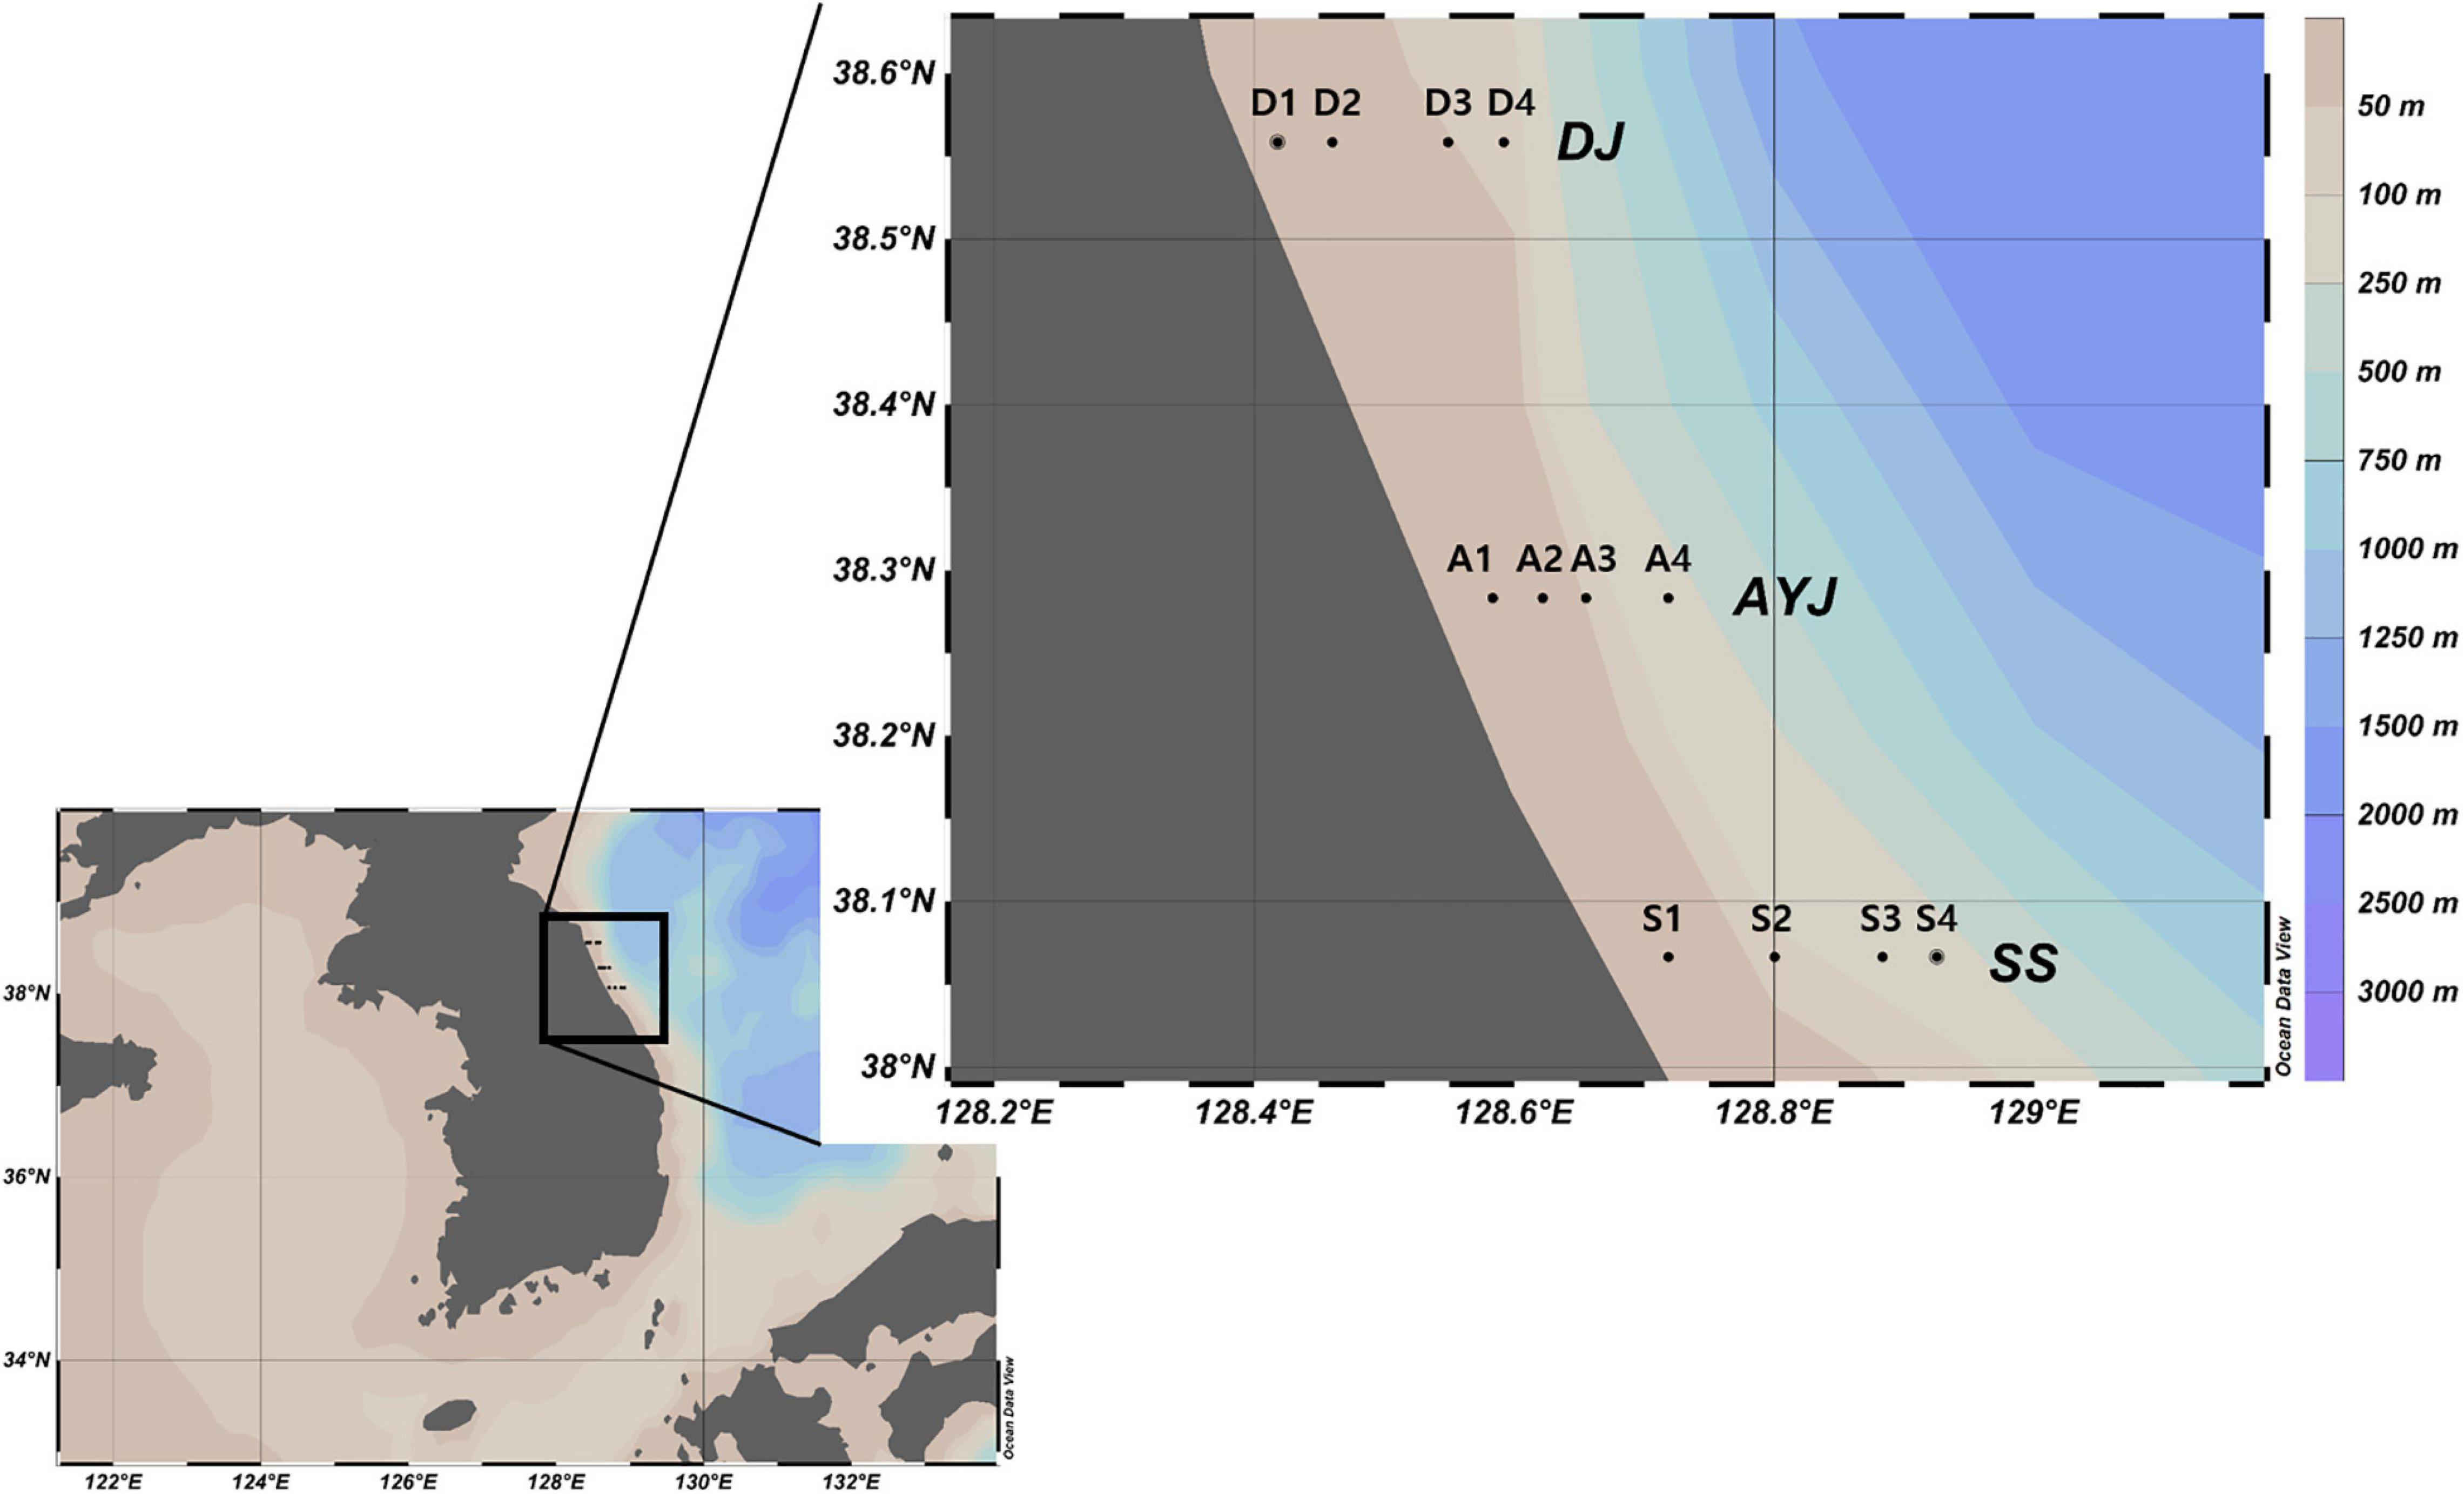
Figure 3. Sample collection stations. The 12 sample collection stations were the coastal waters of three cities including Daejin (D1, D2, D3, and D4), Ayajin (A1, A2, A3, and A4), and Susan (S1, S2, S3, and S4). Maps created using Ocean data view v. 4.7.8 (Schlitzer, 2016, Ocean Data View, https://odv.awi.de).
After rinsing with distilled water using a sieve (pore size, 200 μm), each zooplankton net sample was divided into two halves. The wet weight of half of the sample was measured, and six volumes of lysis buffer (Biosesang, Republic of Korea) were added for genomic DNA extraction. Genomic DNA was extracted with 700 μL of homogenized sample using an AccuPrep® genomic DNA extraction kit (Bioneer, Republic of Korea) following the manufacturer’s instructions. The isolated DNA was quantified using a NanoDropTM 1,000 Spectrophotometer (Thermo Fisher Scientific, United States) and qualified by agarose gel electrophoresis. The other half of the sample was used for the measurement of dry weight, according to a previous study (Jacobs and Grant, 1978). The comparisons of biodiversity between FishU and MiFish for ichthyoplankton were determined by NGS analysis. The library was constructed as mentioned above, but the first PCR products were pooled monthly and purified. Nextera libraries were sequenced from Illumina using 2 × 300 bp sequencing on MiSeq.
NGS Data Analysis
Using the CLC Genomic Workbench v.8.0 (CLC Bio, United States), the short reads (<100 bp) and low-quality sequences (QV <20) were trimmed from the raw data. Paired-end reads of FishU sequences were assembled using Mothur software (Schloss et al., 2009). From the assembled reads, the reads that overlapped by >6 bp, no mismatches, and sizes between 350 and 500 bp were filtered. The reads that could not be matched with options were discarded. The sequences of the forward and reverse primer regions were trimmed with one nucleotide mismatch option. Using the UCHIME software package (Edgar et al., 2011), operational taxonomic units (OTUs) were assigned at 99.7% identity from the obtained paired-end contigs, and chimeric sequences were removed based on de novo chimera detection. After OTUs with fewer than 10 contigs were removed, the species name was assigned using the BLASTn algorithm of BLAST + 2.2.38 (Camacho et al., 2009) against the NCBI non-redundant nucleotide database (accession date: 09/04/2019). The top-scored species name was assigned for each OTU with >97% sequence identity to the database. OTUs between 95 and 97% identity to the database were described as “genus name with highest score” followed by “sp.” OTUs with an identity of less than 95% were classified as “unknown.” MiFish raw reads were processed using the MiFish pipeline with default settings (Sato et al., 2018). The OTUs obtained from MiFish were assigned to the highest blast score species at the species level with at least 97% sequence identity, and those between 95 and less than 97% sequences were assigned to the same genus. The representative haplotypes of two primers were designated in OTUs with abundances of more than 10% in each species, and these OTUs were subjected to phylogenetic analysis by maximum-likelihood algorithm using MEGA-X (Kumar et al., 2018). To compare the species resolution between the two primers, we calculated the genetic distance using MEGA-X based on the pairwise distances (p-distance).
Results
Design of Fish-Specific Universal Primer, FishU
After comparing the mitochondrial rRNA sequences from 1808 fish species in the database, a universal primer set, FishU, was designed to amplify the variable region between the highly conserved mitochondrial 12S and 16S ribosomal sequences (Figure 1). The predicted size of PCR products amplified by the FishU primer ranged from 300 to 400 bp with an average of 373 bp, which was optimized to the MiSeq platform. Unusually large amplicons were identified in only 14 species, including Hoplolatilus cuniculus (818 bp), Centropyge multicolor (558 bp), and Centropyge joculator (558 bp).
The amplification efficiency of the newly developed FishU primers was compared with two previously designed fish-specific universal primers, ecoPrimer and MiFish. The recovered species numbers by the different mismatched bases within the primer sequences were compared (Table 1 and Supplementary Tables 2–4). When PCR was conducted without any mismatch, the highest number of species was amplified by the FishU primer set, in which 1,529 species out of a total of 1,683 examined bony fish species (Actinopteri) were able to be recovered (90.85%). Although the ecoPrimer set also amplified 82.06% of them, only 7.13% of the examined species were amplified using MiFish, and only 7.13% of the examined species were amplified using MiFish primers (Table 1). When one mismatch was allowed, the percentage recovered by the MiFish primer increased up to 81.28% while 94 and 98.10% of the examined species could be amplified by ecoPrimer and FishU primer, respectively. As the mismatch numbers increased to three, the amplification success rates became similar among all three compared primers (94.18% by ecoPrimer, 97.39% by MiFish, and 98.46% by FishU). In contrast to the other two universal primers, the FishU primer also showed a high recovery percentage in the Chondrichthyes, up to 98.99% (Table 1). However, only 0–13.13% of the Chondrichthyes species could be amplified by ecoPrimer and MiFish primer sets with up to one mismatch.
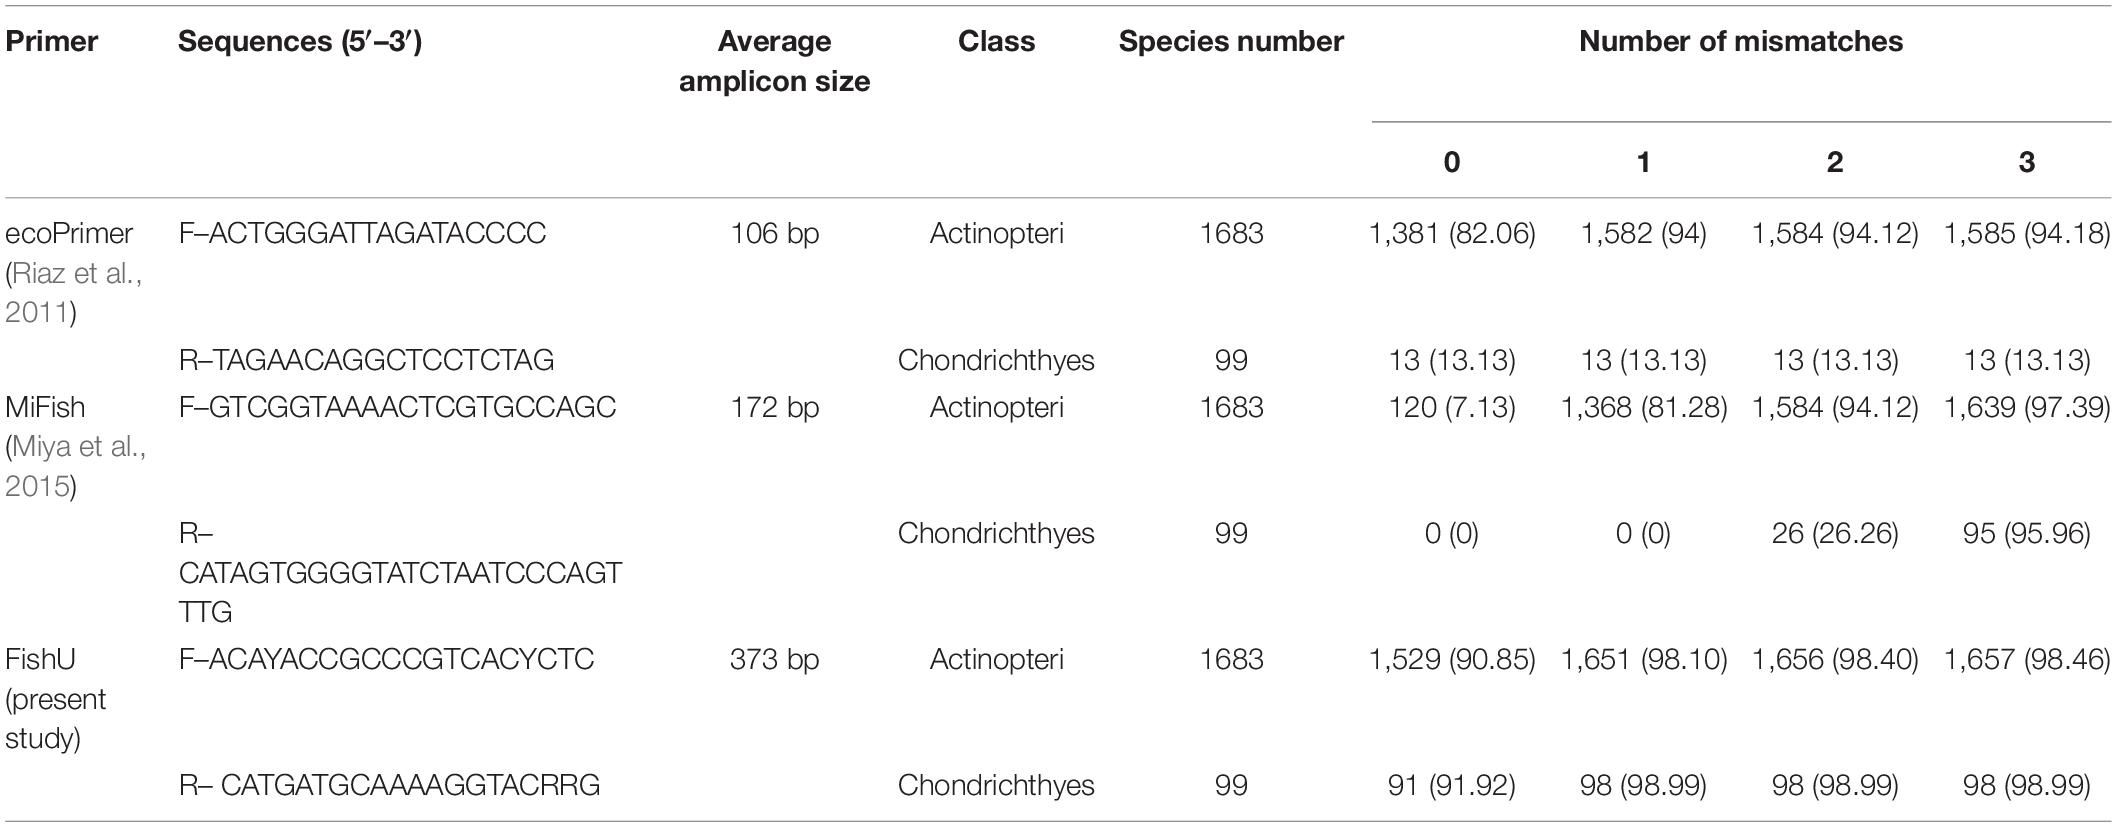
Table 1. The numbers and percentage (in parentheses) of the amplified species by in silico PCR with three fish-specific universal primers.
The taxonomic resolutions of the region amplified by the three universal primers were compared (Table 2). The sequence variations and the length of the barcode region by each universal primer set are key to the high degree of taxonomic resolution. The percentage of correctly assigned species numbers by different universal primers was calculated. Barcodes using ecoPrimer showed the highest misidentification percentage by one nucleotide mismatch with 42.37% misassigned rates (Table 2). By contrast, only 10.15% were misidentified by one nucleotide mismatch in the FishU primer. Even in five nucleotide mismatches, 78.56% of the barcodes by FishU were correctly assigned, and only 27.12% of those by ecoPrimer were adequately assigned. Compared with those by ecoPrimer, barcodes by MiFish showed a much higher accuracy in the taxon assignment ranging from 81.15 to 60.50% according to the number of mismatches. However, its rates were lower than those by FishU (Table 2).
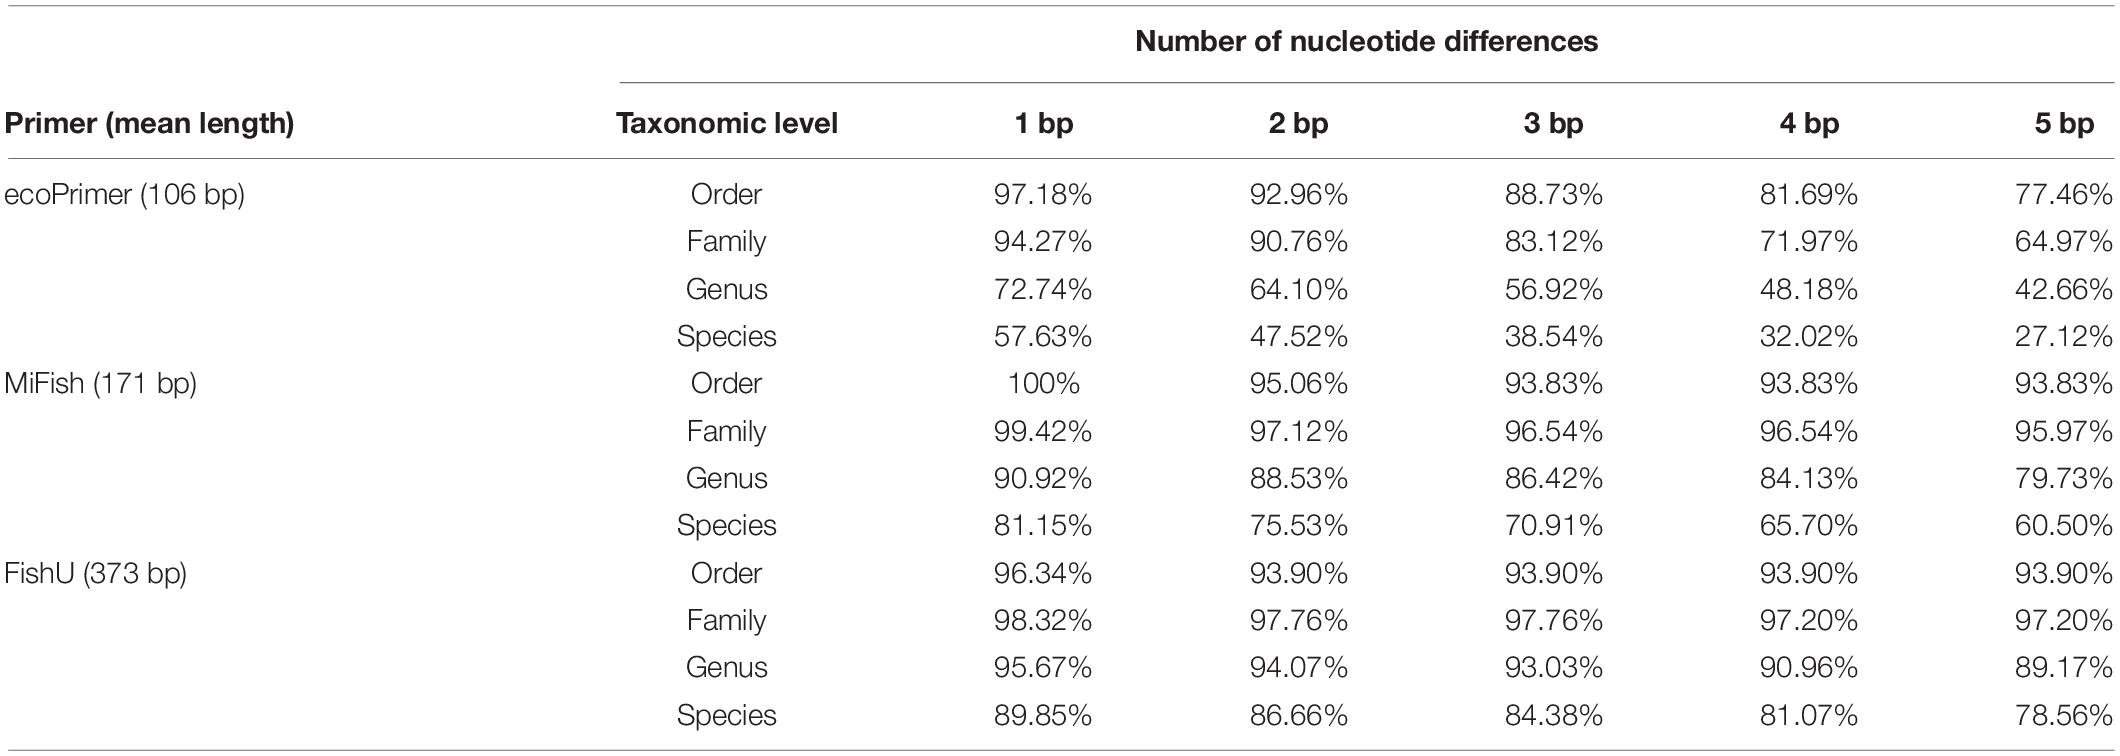
Table 2. Percentage of accurately assigned taxa in three fish barcodes by the different mismatches.
The taxon specificity of the three fish universal primers, namely ecoPrimer, MiFish, and FishU, were compared with four individual zooplankton, which were among the most abundant taxa in the zooplankton net samples (Figure 2). FishU amplified only Engraulis japonicus (415 bp), and ecoPrimer and MiFish showed a high degree of cross-reactivity in the examined invertebrate species, including Sagitta elegans, Euphausia pacifica, Metridia pacifica, and Penaeus monodon (Figure 2). The metabarcoding analysis of the zooplankton net samples was performed with three fish-specific universal primer sets to analyze the ichthyoplankton assemblage (Table 3). Only ecoPrimer showed cross-reactivity with low proportions of Arthropoda (1.2 and 5.2%), Mammalian (0.002% in S2), and Enteropneusta (0.1 and 0.03%). In contrast, both MiFish and FishU presented only fish taxa. These results indicate that FishU primers are useful for examining the assemblage of ichthyoplankton directly from zooplankton net samples with a long barcode size, a low cross-reactivity, and a high specificity for fish taxa.

Table 3. Relative abundances of the different phyla detected from three primers.
Comparative Analysis of Ichthyoplankton Survey in East/Japan Sea by Two Universal Primers: MiFish and FishU
Metabarcoding analyses of ichthyoplankton from the zooplankton net samples were conducted using two fish-specific universal primer sets (MiFish and FishU). A total of 1,816,585 and 4,383,919 raw reads from 6 month samples were generated using the MiFish and FishU primer set, respectively (Table 4). On average, 203,551 merged reads were obtained using the MiFish primer after eliminating the low-quality reads, accounting for approximately 67% of the raw reads. All processed merged reads were identified as fish taxa (Table 4). Compared with those by MiFish, only 35% (220,909) of raw reads by the FishU primer were successfully merged, representing a 2.01-fold decrease compared with those by MiFish. An average of 75% of merged reads were identified as fish barcodes in those by FishU primer (Table 4).
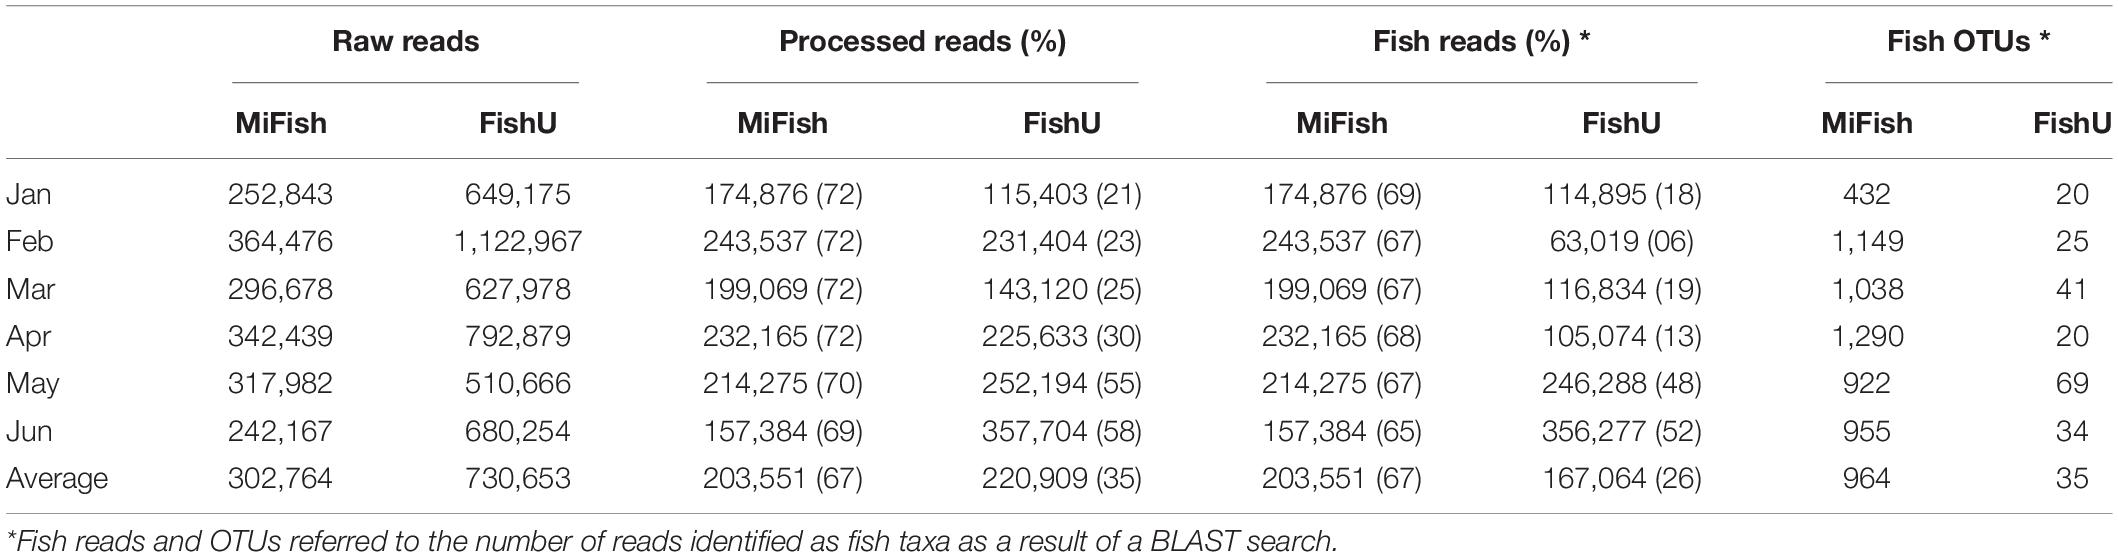
Table 4. Summary of read numbers generated from three primers during the bioinformatics process.
A total of 180 representative haplotypes were obtained from the MiFish primer set, including 42 species in 22 families in 6 orders. Forty-seven haplotypes from 33 species in 21 families in 9 orders were obtained by the FishU primer set, which was fewer than those from the MiFish primer set (Figures 4–6). Among them, only 16 species were commonly identified by the two primers, which were 38.1 and 48.5% of those by MiFish and FishU, respectively. In the order Perciformes, 46 (8 families) and 18 haplotypes (7 families) were obtained using the MiFish and FishU primers, respectively (Figure 4). Three (Seriola quinqueradiata, Chirolophis japonicus, and Uranoscopus japonicus) and two (Suruga fundicola and Chirolophis saitone) species were detected only by the FishU and MiFish primers, respectively (Table 5). MiFish generated a higher number of haplotypes in each species compared with those by FishU primers. In particular, haplotypes with a low identity to the reference database, such as those in the Stichaeidae and Trichodontidae, were more difficult to assign to their correct species (Figure 4B). In contrast, multiple haplotypes were identified in only a limited number of species in those by FishU primers. Some haplotypes were assigned different species names, presumably based on different reference data. For example, only a single nucleotide was different between Chirolophis saitone by MiFish and Chirolophis japonicus by FishU (Figure 4). The reference sequence of C. saitone for the FishU barcode has not yet been deposited in the database, and it should be supplemented.
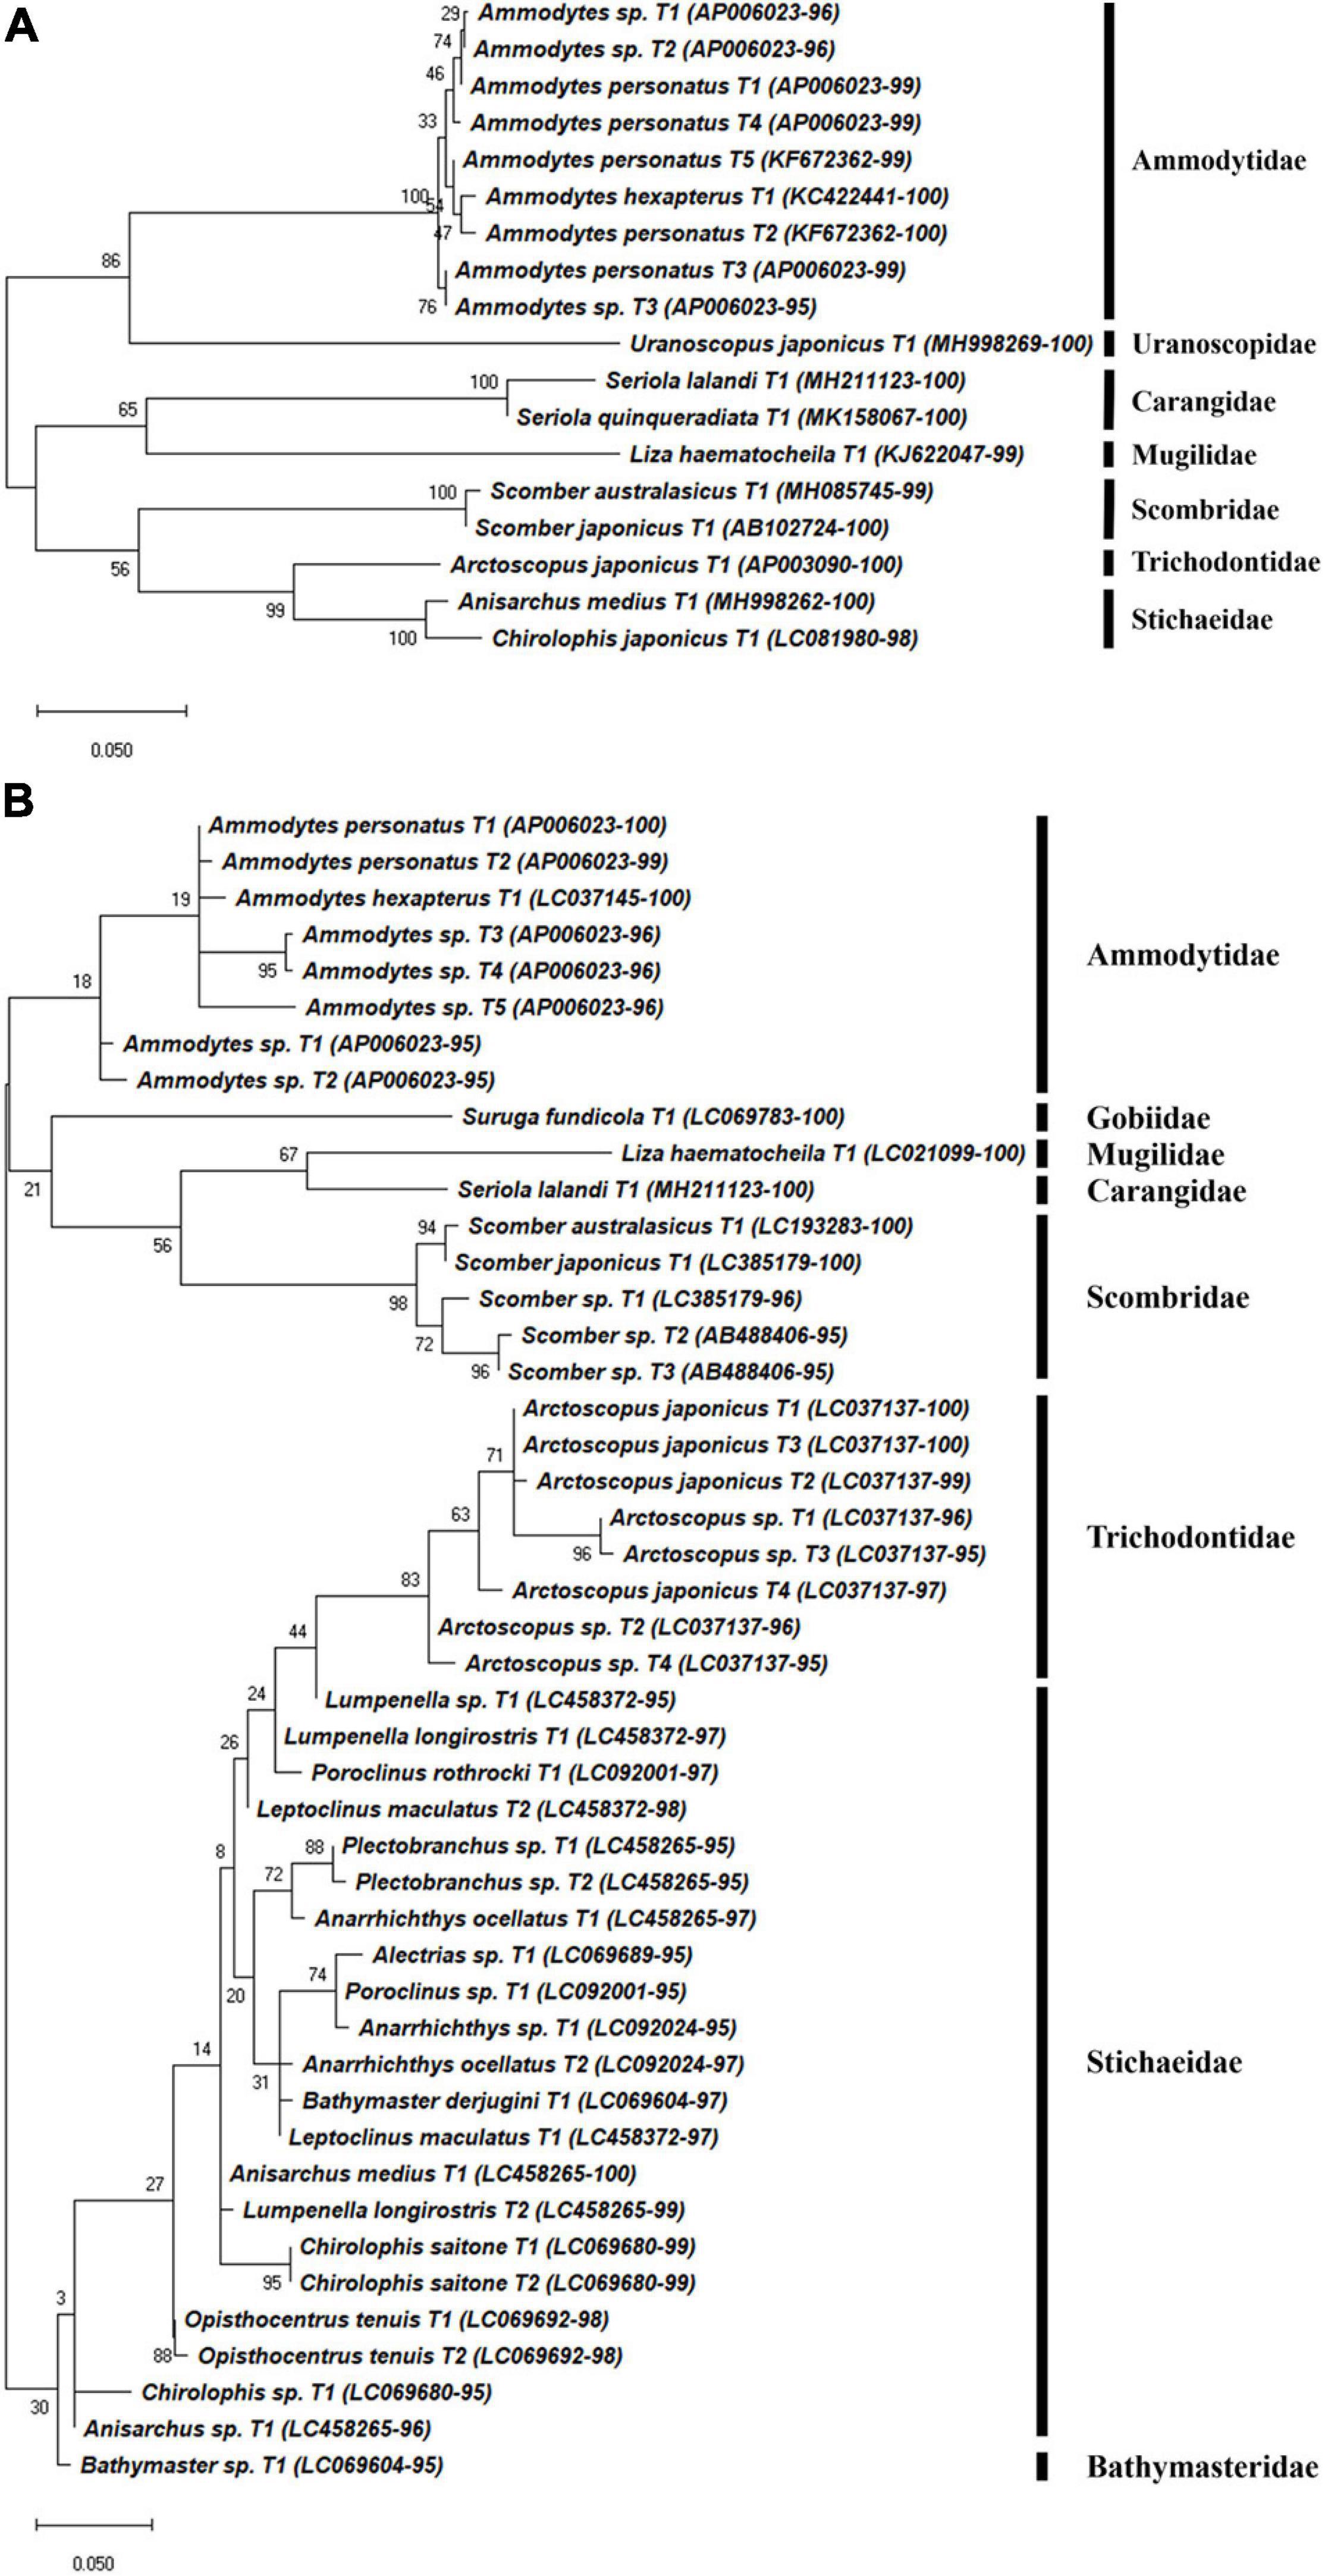
Figure 4. Phylogenetic analysis of representative Perciforms haplotypes generated by (A) FishU primers and (B) MiFish primers in East/Japan Sea, 2016. Phylogenetic tree was constructed by maximum-likelihood algorithm (MEGA-X) under 1000 bootstrap replications.
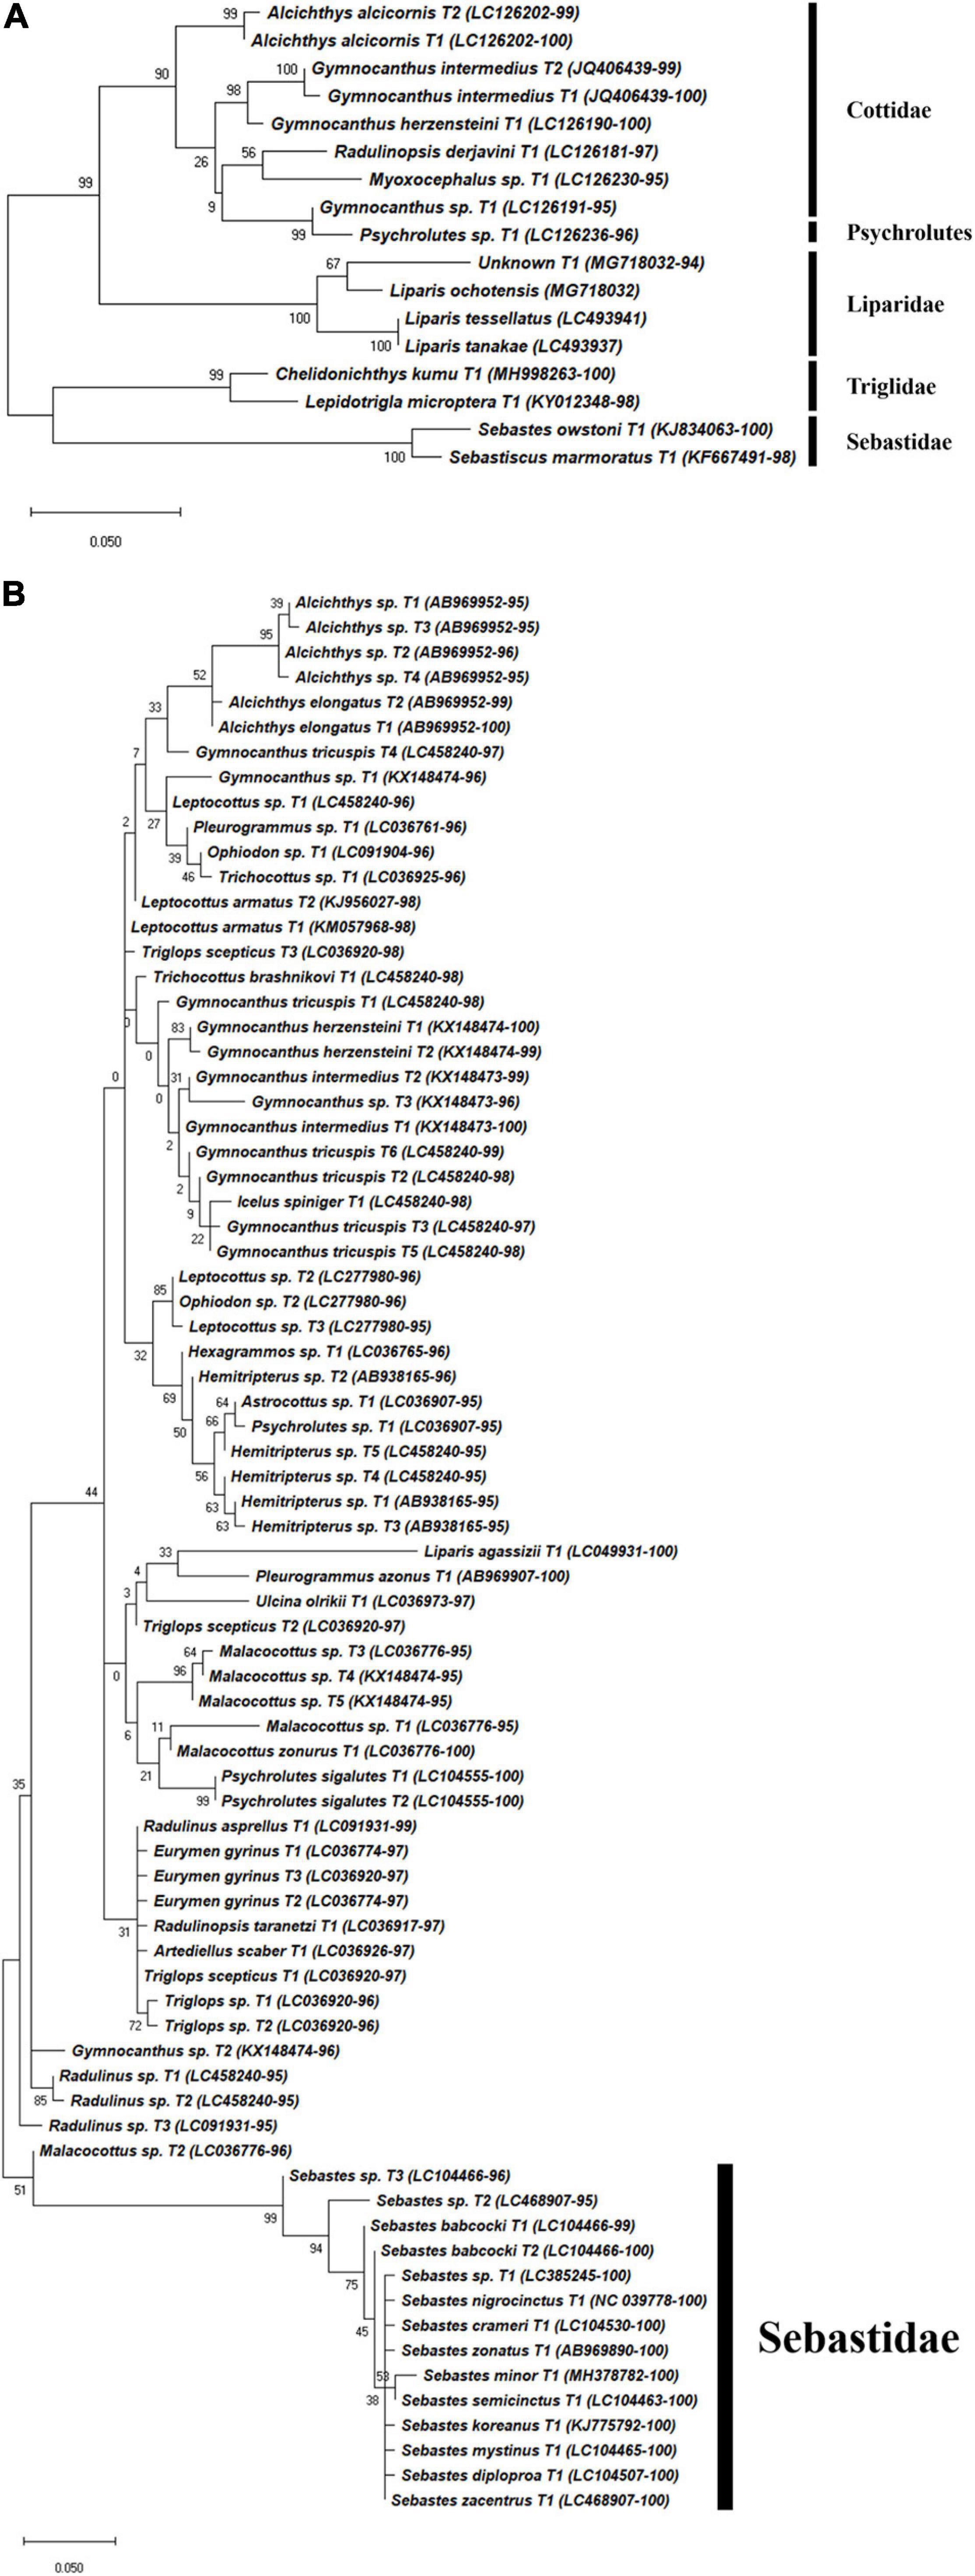
Figure 5. Phylogenetic analysis of representative Scorpaeniformes haplotypes generated by (A) FishU primers and (B) MiFish primers. Phylogenetic tree was constructed by maximum-likelihood algorithm (MEGA-X) under 1000 bootstrap replications.
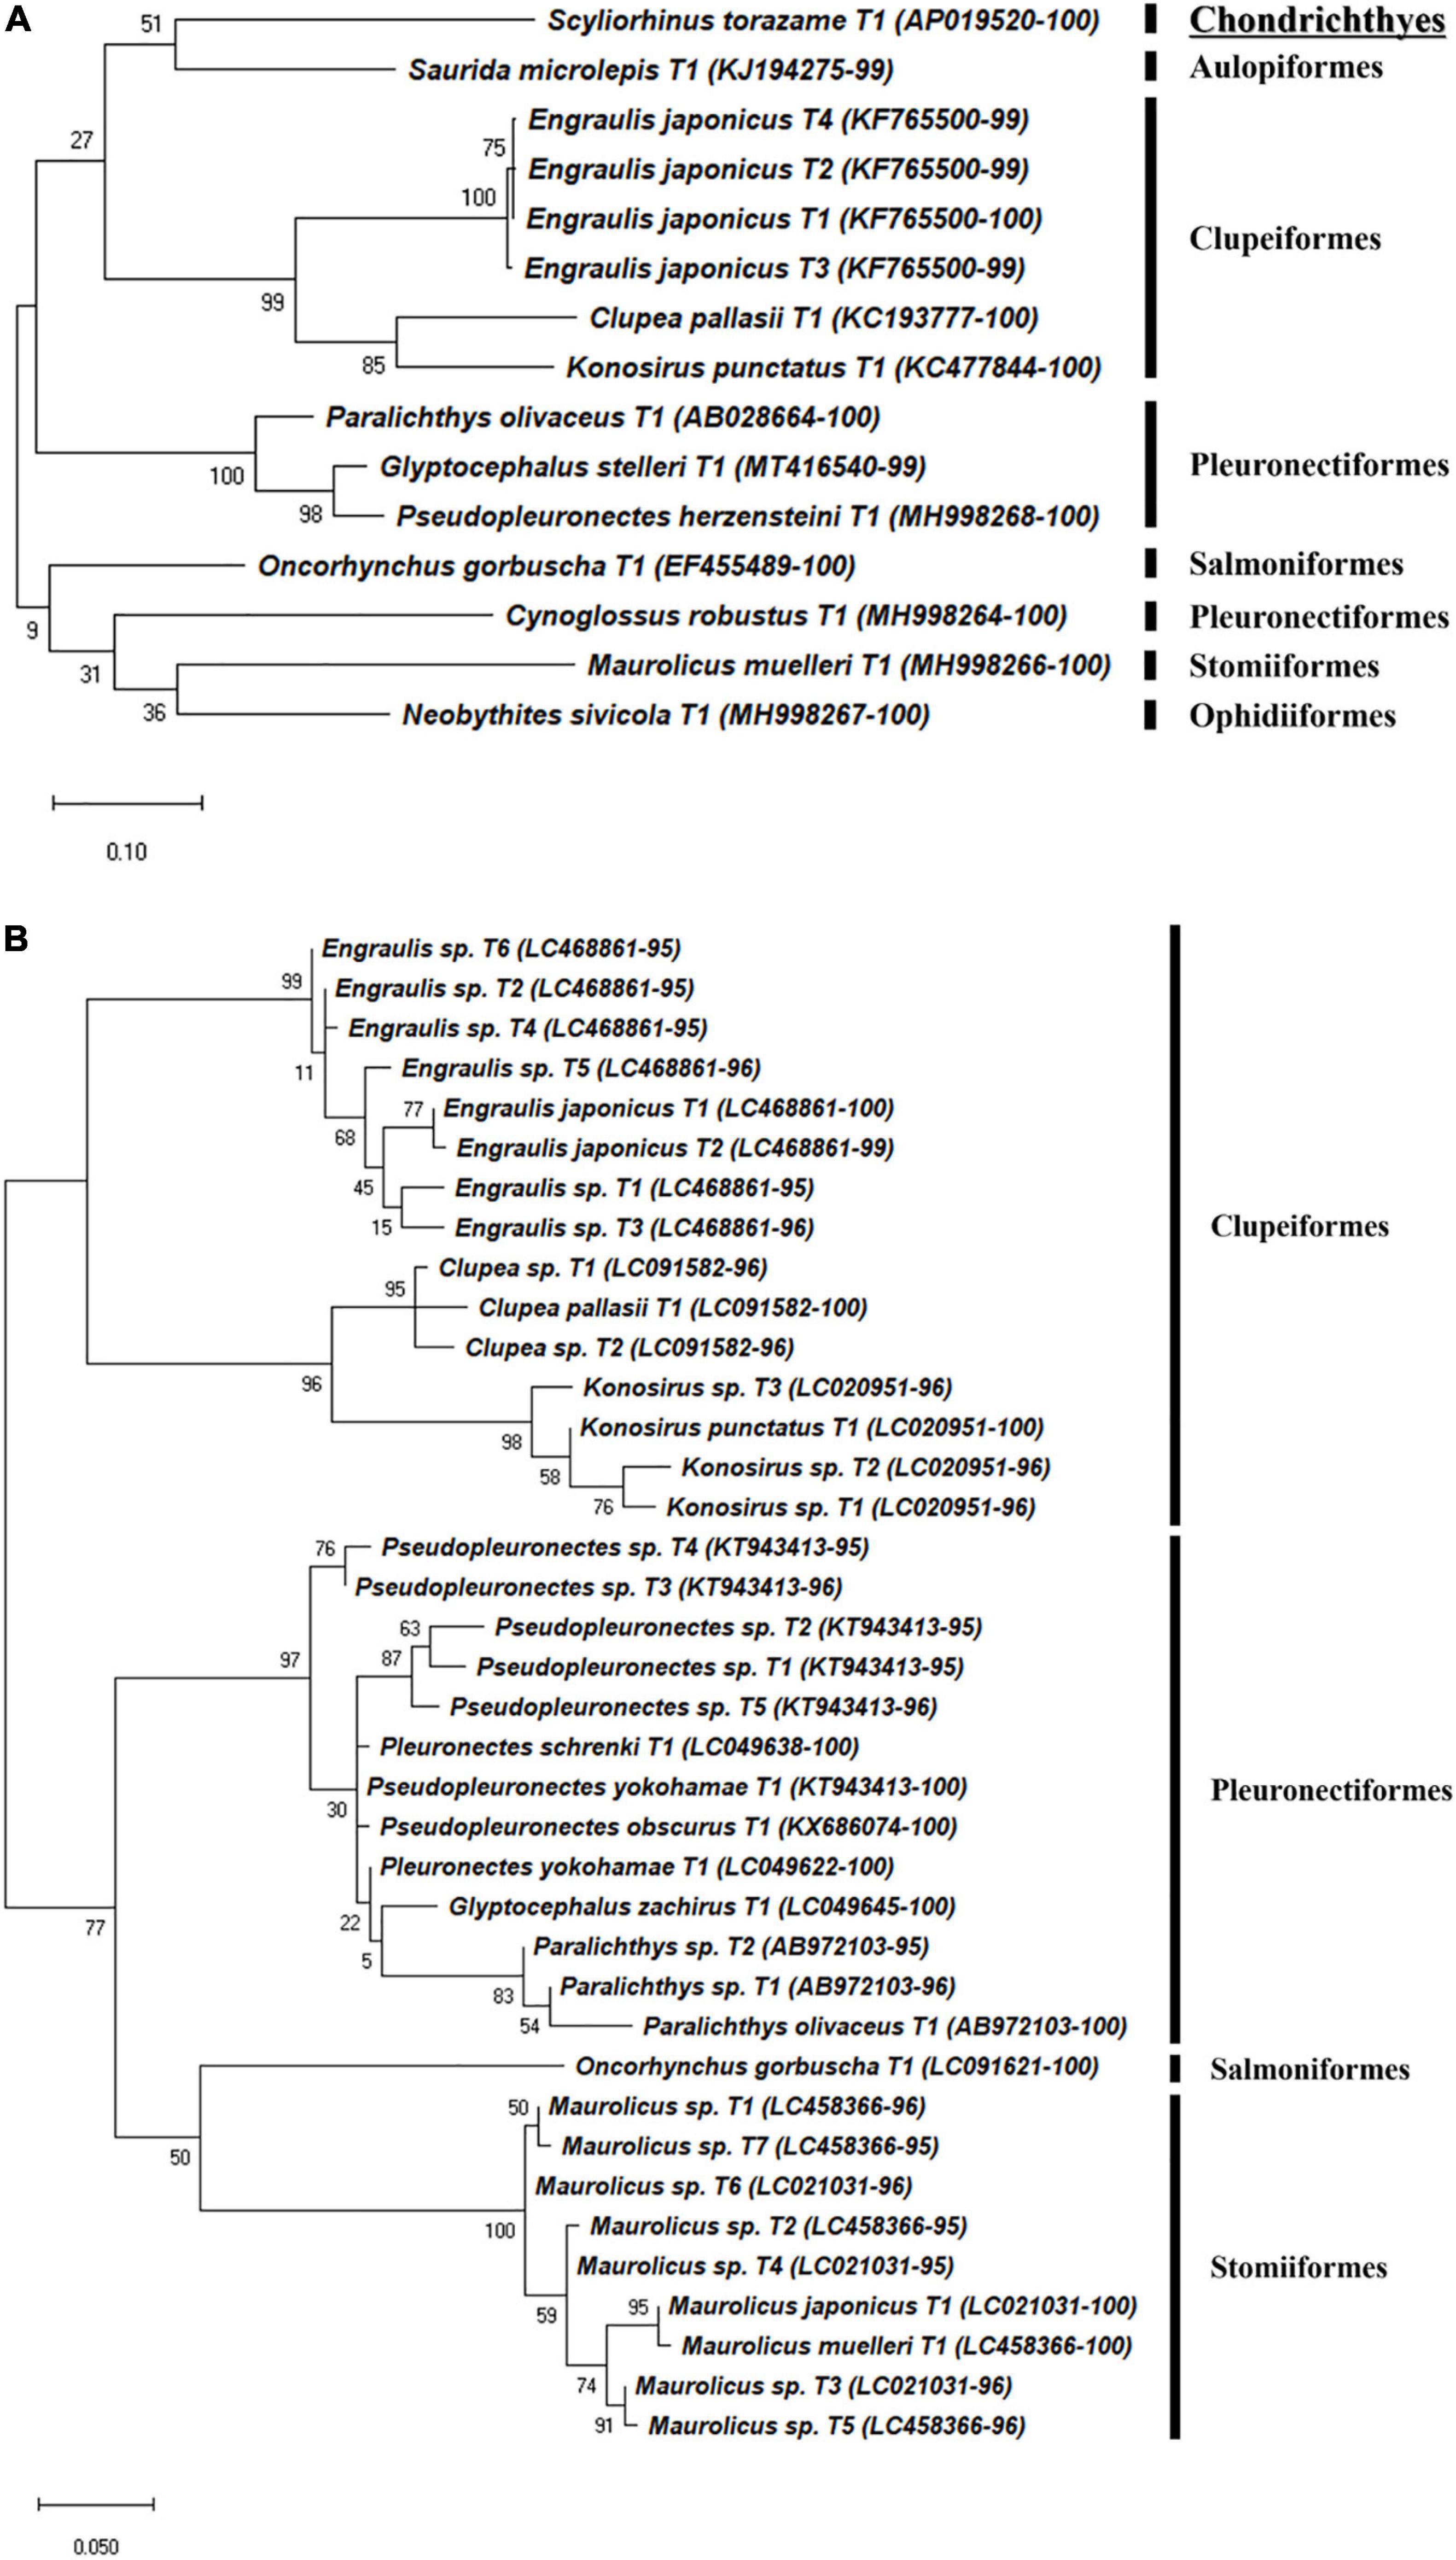
Figure 6. Phylogenetic analysis of representative haplotypes belongs to eight orders generated by (A) FishU primers and (B) MiFish primers. Phylogenetic tree was constructed by maximum-likelihood algorithm (MEGA-X) under 1000 bootstrap replications.
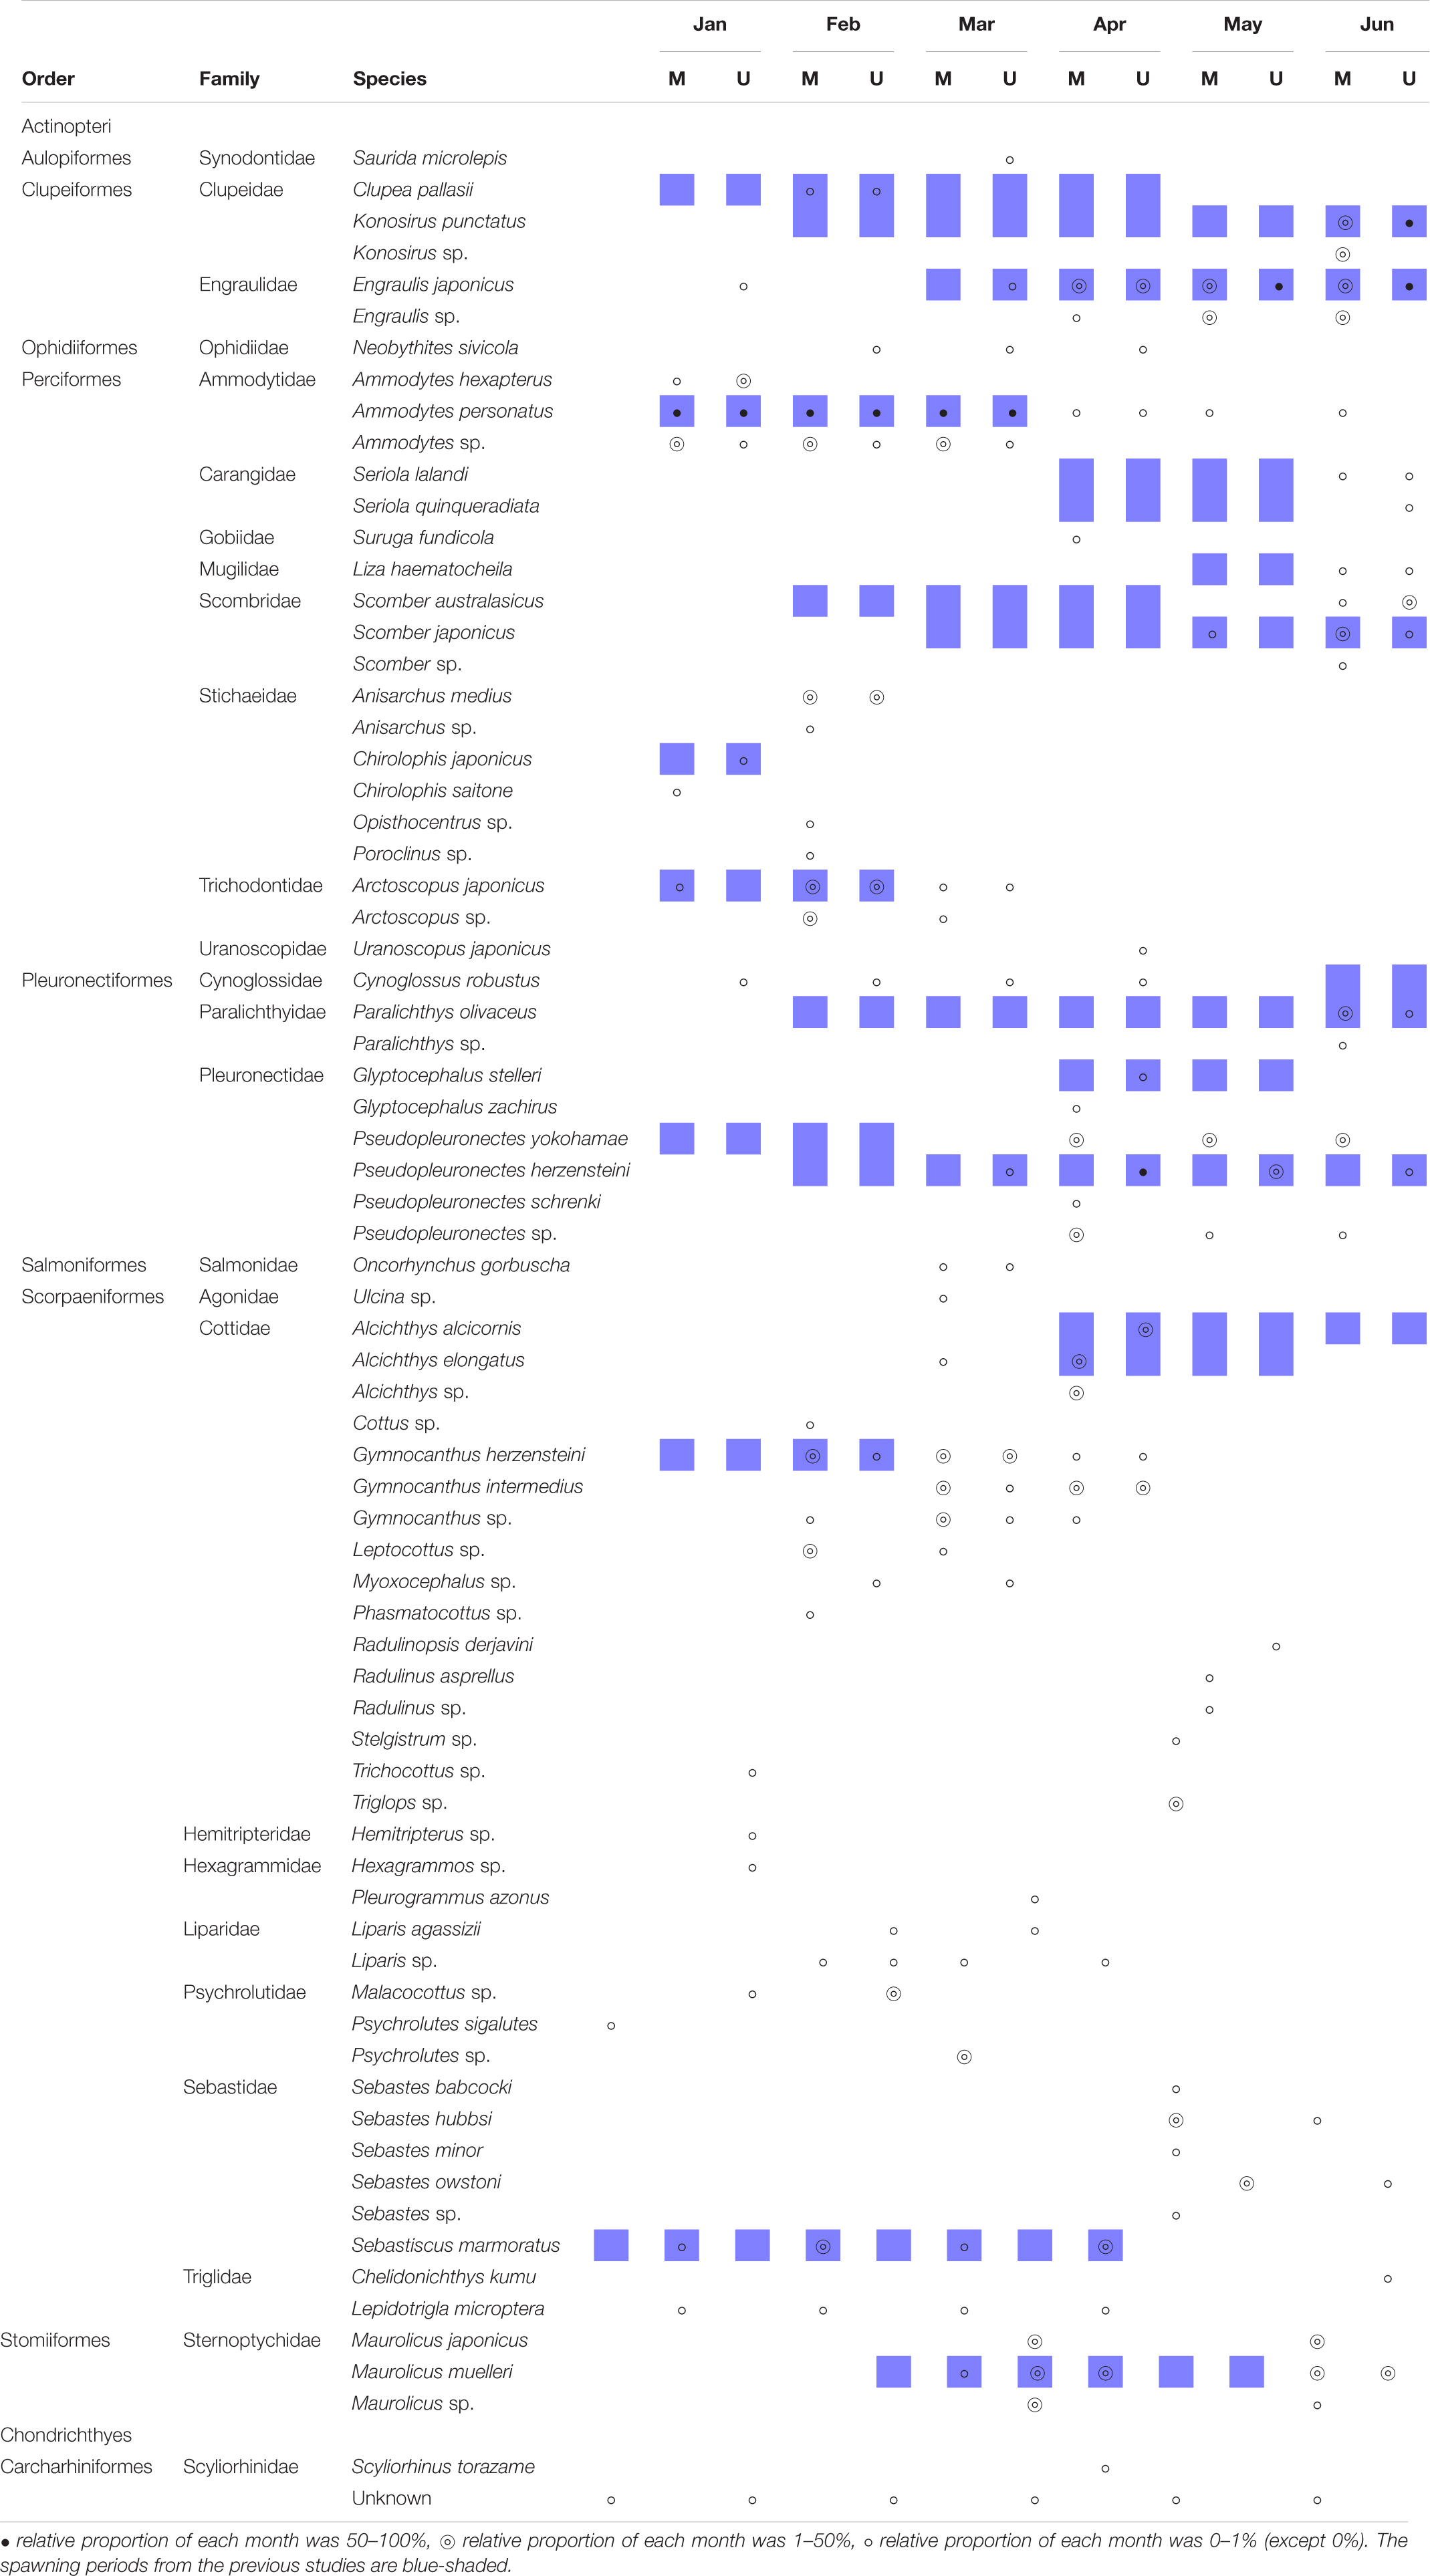
Table 5. Detection of ichthyoplankton in each month by metabarcoding analysis with two universal primers, MiFish (M) and FishU (U).
Haplotypes in the Scorpaeniformes, especially those in the families Cottidae and Psychrolutidae, showed a low identity to the reference database in both primers, indicating that the reference data in the family should be supplemented in the East Sea (Figure 5). In addition, haplotypes in the family Sebastidae by MiFish showed a 100% identity to multiple species, indicating the low resolution of the MiFish region to distinguish those taxa (Figure 5B), which was also identified in a previous study (Yamamoto et al., 2017). In contrast, two sebastids, Sebastes owstoni and Sebastiscus marmoratus, were clearly assigned by FishU with 99% identity to the database (Figure 5A), which was supported by a previous conventional survey (Sohn et al., 2014). In addition, the assignment of species in Pleuronectidae were highly different between MiFish and FishU. Two species, P. yokohamae and G. zachirus, were assigned by the MiFish pipeline, and P. herzensteini and G. stelleri were assigned by FishU (Figure 6). The habitats of these two pleuronectid species by MiFish did not match the information of FishBase2. For example, G. zachirus is distributed from the Kuril Island to the Bering Sea coasts of Russia, not the coastal water of the East/Japan Sea, suggesting an incorrect species assignment by the MiFish pipeline. In addition to those in the family Sebastidae, species in the Pleuronectidae assigned by the MiFish pipeline should be manually checked before their use in regional/local surveys.
Based on the metabarcoding analysis of zooplankton net samples using the two primers, the spawning period of each species was estimated in the East/Japan Sea (Table 5). The average species richness by MiFish was 8.3, ranging from 5 to 13, and 9.8 by FishU, ranging from 4 to 14. Four species, including Konosirus punctatus, Engraulis japonicus, Ammodytes personatus, and Scomber japonicus, were detected with a similar pattern by both primers. Although the spawning periods for two related species, S. lalandi and S. quinqueradiata, were similar to each other from April to May along the Korean waters (Shiraishi et al., 2010; Miura et al., 2020), ichthyoplankton for S. quinqueradiata were detected only by the FishU primer in June (Table 5). Chirolophis japonicus and Liza haematocheila were also detected in January and June as reported in previous studies (Kim et al., 2015; Park et al., 2015). In the species belonging to Pleuronectiformes, two species were identified in the genus Glyptocephalus: Glyptocephalus stelleri by FishU and Glyptocephalus zachirus by MiFish (Figure 6). According to the previous study, the main spawning season for G. stelleri is from April to May (Cha et al., 2008). Two species belonging to the genus Pseudopleuronectes were also detected from March to June: Pseudopleuronectes herzensteini by FishU and Pseudopleuronectes yokohamae by MiFish. The previously reported reproduction periods of P. herzensteini eggs also support the correct species assignment by the metabarcoding of the FishU primer (Lee and Kim, 2016). Collectively, the FishU primers outperformed MiFish in icthyoplankton metabarcoding analysis because of the longer barcode, allowing for a clearer species assignment and a broader taxon coverage, representing more taxa, including Synodontidae, Ophidiidae, Uranoscopidae, Cynoglossidae, and Triglidae.
The ichthyoplankton metabarcoding results and previous records for the spawning season were compared (Table 5). Because most of the studies on the spawning seasons have been conducted in commercially important species, including Scomber japonicus, Ammodytes personatus, and Engraulis japonicus, our comparisons were limited to these species (Table 5; shown in blue). The detection of ichthyoplankton generally reflects the spawning season. For instance, Sebastiscus marmoratus and Maurolicus muelleri showed spawning periods similar to those reported in previous studies (Yuuki, 1982; Takano et al., 1991). Metabarcoding analysis successfully discriminated the spawning season of two relative species, Ammodytes peronatus and Ammodytes hexapterus (Table 5). However, the onset time of larval detection in other species was often identified some months after the previous records. For instance, the spawning period of Konosirus punctatus was known to be from March (Kim et al., 2007a), and its larvae were first identified in June (Table 5). Similarly, two species belonging to the genera Scomber, S. japonicas, and S. australasicus, were detected in June, 3 months after their recorded reproduction periods. The spawning period of G. herzensteini was known from December to February (Park et al., 2007), but was detected from February to April.
Our ichthyoplankton metabarcoding analyses also revealed unreported spawning seasons of some species. For instance, we were able to detect the larvae of Cynoglossus robustus in the East/Japan Sea from January to April, and it was previously found on the southeastern coast of Korean peninsula from June to July (Park et al., 2013). In addition, the spawning seasons of several species, including Suruga fundicola, Anisarchus medius, Uranoscopus japonicus, Lepidotrigla microptera, and Neobythites sivicola, were first estimated in this study. Collectively, the metabarcoding analysis of ichthyoplankton shows great potential for understanding the reproduction of fish species around the Korean peninsula. However, further study is needed to produce data comparable to the conventional ichthyoplankton surveys.
Discussion
In the present study, we designed a novel fish-specific universal primer set, FishU, for the metabarcoding analysis of ichthyoplankton and compared its reliability with two currently used universal primers, ecoPrimer and MiFish. Because most of the current metabarcoding analyses are conducted based on PCR analysis amplified by universal primers, the choice of the universal primer is crucial. FishU outperformed the other two fish-specific universal primers for the ichthyoplankton survey in several aspects. First, the FishU primer showed a high degree of taxon specificity, amplifying almost exclusively fish taxa directly from the zooplankton net samples. In addition to the sequence specificity within the primer region, the barcode region amplified by FishU contained tRNAval flanked by the 12S and 16S regions, a characteristic structure of the fish mitogenome (Figure 2). Therefore, each primer can land on different genes, 12S and 16S, respectively, lowering the chance of amplifying different taxa. By contrast, ecoPrimer and MiFish primers have been designed within the 12S gene, increasing the chance of amplifying a similar sequence of other taxa (Figures 1, 2). Copepods, euphausiid, and Chaetognatha species are among the major zooplankton taxa (Iguchi, 2004), and even a low degree of cross-reactivity to those species would be problematic for the metabarcoding of ichthyoplankton directly from the net sample.
In addition to taxon specificity, the longer barcodes of the FishU primer contributed to a higher accuracy in species identification by both in silico and zooplankton net sample analyses. The average length of the barcodes generated by FishU was 373 bp, which represents a 3.5- and 2.2-fold increase compared with those generated by ecoPrimer (106 bp) and MiFish (172 bp), respectively. Although 200 bp or smaller sizes have been reported as the ideal length for metabarcoding to maximize the recovered species numbers (Coissac et al., 2012; Clarke et al., 2017), these small-sized barcodes may trade off the accuracy of species identification. For example, a single base substitution in the barcodes by ecoPrimers resulted in almost half of the barcode not being able to correctly assign species (Table 2). In addition, the short length of the MiFish barcode may not be variable enough to discriminate between closely related species, especially in Pleuronectiformes or Scorpaeniformes, as reported in previous studies (Yamamoto et al., 2017). By contrast, Pseudopleuronectes herzensteini and Sebastes owstoni in those orders were accurately assigned only by FishU, which was supported by previous studies (Sohn et al., 2014; Lee and Kim, 2016). In addition to these two orders, two related species in each genus, Alcichthys alcicornis and Alcichthys elongatus and Maurolicus japonicus and Maurolicus muelleri, should be reexamined.
The application of the MiFish pipeline requires careful attention from those who would like to use the data directly from its bioinformatic analysis for the analysis of local fish assemblages. Although much higher haplotypes (180) and species numbers (42) were obtained by the MiFish pipeline in this study compared with those by the FishU platform (51 haplotypes and 31 species), most of the species assigned only by MiFish showed a low similarity to the database (Table 5). Those assigned as genus names, such as Konosirus sp., Engraulis sp., or Ammodytes sp., may have come from the short barcode length. When merging each pair read generated by the MiSeq platform, it was especially challenging to eliminate chimeric sequences for multiple haplotypes, species with a high degree of genetic similarity, or lack of a reference database. For instance, three species in the genus Ammodytes could not be adequately assigned by the MiFish pipeline, generating a high number of haplotypes with low similarities, mainly due to the genetic similarity among those species and the lack of the local reference sequences in the database (Figure 4). The chimeric sequences generated by MiFish would be problematic, exaggerating the species numbers for countries without a sufficiently large reference database. In contrast, the barcodes by FishU showed no chimeric haplotypes with long read lengths. In fact, all the species exclusively identified by FishU primers showed a high sequence identity, with an identity of more than 99% to the database, which included Clupea pallasii, Neobythites sivicola, Seriola quinqueradiata, Uranoscopus japonicus, and Radulinopsis derjavini (Table 5). This result indicates that FishU provides species information with a high degree of accuracy in ichthyoplankton metabarcoding analysis. The longer barcode size by FishU was not a problem, at least for ichthyoplankton metabarcoding. Instead, FishU outperformed the other two fish-specific universal primers in the ichthyoplankton survey with higher accuracy and reliability.
Compared with the other two fish-specific universal primers, the use of FishU for the ichthyoplankton metabarcoding has several advantages, including higher taxon coverage and specificity and accurate species identification. However, there are still several shortcomings in adopting the primer. The barcode region by FishU includes the tRNA-valine flanked by the partial 12S rRNA and 16S rRNA, whose reference sequences are fewer than those of the typically used barcodes, such as COI or MiFish region. Notably, there is much less information regarding those that have little commercial value. Because taxonomic identification in metabarcoding is entirely dependent on the reference database, the reference sequences for the FishU region, especially those for the local or indigenous species, should be supplemented. The recent fast growth of complete mitochondrial DNA information of various fish taxa is also helpful to compensate for these shortcomings (Iwasaki et al., 2013). Another factor to consider in choosing FishU is the low yield of merged reads from the raw data (Table 5). The proportions of the average merged fish barcode numbers generated by the FishU primer were 35%, which was twofold lower than that by MiFish. These results are mainly due to the low merged rates for the longer barcodes by the FishU primer (Elbrecht and Leese, 2017). These low merged-read rates can be compensated by the increased raw reads. To obtain processed merged reads similar to those of MiFish in this study, approximately twofold higher raw read numbers were required in the FishU platform (Table 4). Because longer barcodes have many advantages in ichthyoplankton metabarcoding, metabarcoding analysis by FishU would trade off the shortcoming in the cost. Storage after sample collection may also affect the recovery of longer barcodes by FishU, and we cannot rule out that the low merged-read numbers from January to April may have arisen due to the degradation of DNA after a long period of storage (Table 4) because it is widely known that DNA can be degraded over long storage times (Vamos et al., 2017). Therefore, higher merged reads could be achieved by metabarcoding immediately after the extraction of total genomic DNA.
Here, we attempted to determine the spawning season based on the metabarcoding analysis of ichthyoplankton from zooplankton net samples. The metabarcoding analysis of ichthyoplankton provides many useful data to understand the reproduction of fish, including details of their spawning sites, reproductive periods, and population structures, at relatively low cost and labor. The large amount of data obtained by metabarcoding analysis can be used for various purposes not previously possible using conventional ichthyoplankton surveys, including the effects of climate change during the spawning season in each species, an understanding of the reproduction of rare species, or the genetic populations of ichthyoplankton. In addition, the transport routes of fish eggs and larvae in the East/Japan Sea can also be understood by its larval metabarcoding analysis. Waters in the East/Japan Sea are the place where two main currents along the Korean peninsula, the NKCC from the north and EKWC, collide. Therefore, transportation and settlement of ichthyoplankton are largely dependent on the dynamics of these currents. In fact, we were able to identify a small number of tropical and cold-water fish larvae, which are further used as indicators of the spatiotemporal dynamics of these currents. For instance, Saurida microlepis and Chelidonichthys kumu have been conveyed from the South Pacific Ocean by the Kuroshio warm current and Tsushima current entering the East/Japan Sea through the Korean Strait. Because the Kuroshio current begins with the water around the Philippines and Taiwan, which is known to be the spawning site of many fish species, the abundance of these tropical fish would explain the effects of the warm current on fisheries in the East/Japan Sea. In contrast, some species detected during the winter season may have been conveyed from the NKCC. For example, Anisarchus medius is a demersal species, preferring water at temperatures below 0°C, and its larvae were only found in February although A. hexapterus was originally distributed in cold waters from Arctic Alaska to the northern Pacific. Therefore, changes in the abundance of tropical or cold ichthyoplankton help explain the effects of the dynamics of the two main currents on fisheries in the East/Japan Sea.
Although it is a useful tool for the ichthyoplankton survey, metabarcoding analysis is not likely to replace currently used methods in the near future. In addition to diversity, several data, such as morphological or developmental parameters, can be obtained only using the conventional ichthyoplankton survey. For example, egg or larval fish abundances cannot be obtained by metabarcoding analysis using the current methodology. It is also unclear whether metabarcoding analysis can explain the behavioral characteristics, such as diurnal vertical migrations, of fish larvae or spawning ecology. Quantitative analysis is another issue to establish the correlation between metabarcoding analysis and conventional survey. Although it is generally accepted that there is a quantitative relationship between the sequence reads and biomass (Deagle et al., 2019; Lamb et al., 2019), a clear consensus has yet to be reached with regards to the quantification methodology and continues to vary between research groups. Furthermore, there are many chances for bias throughout the metabarcoding pipeline from the sample collection to the bioinformatic processes, making it more difficult to achieve an accurate quantification (Juen and Traugott, 2006; Plummer et al., 2015; Smith et al., 2017). We also identified the delayed detection of ichthyoplankton in many species compared with the previously known spawning season (Table 5). The reproductive period of a species is usually estimated by the combination of gonad maturation and ichthyoplankton survey (Murua et al., 2003; Lowerre-Barbieri et al., 2011). The delayed detection can be explained by the lower chance of detection in eggs, which have lower copies of DNA, compared with those of larvae. As cell numbers increase from eggs to fish larvae during the developmental stages, the chance of detection is much higher for the larval stage than for eggs (Takeuchi et al., 2019). Therefore, further studies should be conducted to identify the spawning seasons more precisely via the metabarcoding analysis of ichthyoplankton.
Despite its current limitations, the metabarcoding analysis of ichthyoplankton remains a promising strategy to supplement conventional surveys. As the data accumulates by comparative analysis with conventional microscopic observation, this technique provides more reliable data. Once a universal and automated metabarcoding platform is established, cost-effective and long-term ichthyoplankton surveys with a higher degree of statistical reliability will be possible, which would provide useful information for the scientific management of local fish resources.
Data Availability Statement
The sequencing data from this study has been deposited in BioProject (accession: PRJNA682864).
Author Contributions
AK designed the experiments, performed the experiments, analyzed the data, prepared figures and tables, and wrote the manuscript. T-HY designed the experiments, analyzed the data, and prepared figures and tables. CL and C-KK conceived and designed the experiments, contributed reagents, materials, and analysis tools. H-WK conceived and designed the experiments, performed the experiments, analyzed the data, contributed reagents, materials, analysis tools, prepared figures and tables, authored and reviewed drafts of the manuscript, and approved the final draft. All authors contributed to the article and approved the submitted version.
Funding
This research was a part of the project titled “Walleye Pollock stock management based on Marine Information and Communication Technology,” funded by the Ministry of Oceans and Fisheries, Korea and partly supported by Basic Science Research Program through the National Research Foundation of Korea (NRF) funded by the Ministry of Education (2020R1I1A3072978).
Conflict of Interest
The authors declare that the research was conducted in the absence of any commercial or financial relationships that could be construed as a potential conflict of interest.
Supplementary Material
The Supplementary Material for this article can be found online at: https://www.frontiersin.org/articles/10.3389/fmars.2021.614394/full#supplementary-material
Footnotes
References
Andruszkiewicz, E. A., Starks, H. A., Chavez, F. P., Sassoubre, L. M., Block, B. A., and Boehm, A. B. (2017). Biomonitoring of marine vertebrates in Monterey Bay using eDNA metabarcoding. PLoS One 12:e0176343. doi: 10.1371/journal.pone.0176343
Aylagas, E., Borja, A., Irigoien, X., and Rodríguez-Ezpeleta, N. (2016). Benchmarking DNA metabarcoding for biodiversity-based monitoring and assessment. Front. Mar. Sci. 3:96. doi: 10.3389/fmars.2016.00096
Balasingham, K. D., Walter, R. P., Mandrak, N. E., and Heath, D. D. (2018). Environmental DNA detection of rare and invasive fish species in two Great Lakes tributaries. Mol. Ecol. 27, 112–127. doi: 10.1111/mec.14395
Berry, O., Bulman, C., Bunce, M., Coghlan, M., Murray, D. C., and Ward, R. D. (2015). Comparison of morphological and DNA metabarcoding analyses of diets in exploited marine fishes. Mar. Ecol. Prog. Ser. 540, 167–181. doi: 10.3354/meps11524
Borrell, Y. J., Miralles, L., Do Huu, H., Mohammed-Geba, K., and Garcia-Vazquez, E. (2017). DNA in a bottle—Rapid metabarcoding survey for early alerts of invasive species in ports. PLoS One 12:e0183347. doi: 10.1371/journal.pone.0183347
Boyer, F., Mercier, C., Bonin, A., Le Bras, Y., Taberlet, P., and Coissac, E. (2016). obitools: a unix-inspired software package for DNA metabarcoding. Mol. Ecol. Resour. 16, 176–182. doi: 10.1111/1755-0998.12428
Bylemans, J., Gleeson, D. M., Duncan, R. P., Hardy, C. M., and Furlan, E. M. (2019). A performance evaluation of targeted eDNA and eDNA metabarcoding analyses for freshwater fishes. Environ. DNA 1, 402–414. doi: 10.1002/edn3.41
Bylemans, J., Gleeson, D. M., Hardy, C. M., and Furlan, E. (2018). Toward an ecoregion scale evaluation of eDNA metabarcoding primers: a case study for the freshwater fish biodiversity of the murray-darling basin (Australia). Ecol. Evol. 8, 8697–8712. doi: 10.1002/ece3.4387
Camacho, C., Coulouris, G., Avagyan, V., Ma, N., Papadopoulos, J., Bealer, K., et al. (2009). BLAST+: architecture and applications. BMC Bioinformatics 10:421. doi: 10.1186/1471-2105-10-421
Cha, H. K., Kwon, H. C., Lee, S. I., Yang, J. H., Chang, D. S., and Chun, Y. Y. (2008). Maturity and spawning of korean flounder Glyptocephalus stelleri (Schmidt) in the East Sea of Korea. Korean J. Ichthyol. 20, 263–271.
Clarke, L. J., Beard, J. M., Swadling, K. M., and Deagle, B. E. (2017). Effect of marker choice and thermal cycling protocol on zooplankton DNA metabarcoding studies. Ecol. Evol. 7, 873–883. doi: 10.1002/ece3.2667
Coissac, E., Riaz, T., and Puillandre, N. (2012). Bioinformatic challenges for DNA metabarcoding of plants and animals. Mol. Ecol. 21, 1834–1847. doi: 10.1111/j.1365-294X.2012.05550.x
Collins, R. A., Bakker, J., Wangensteen, O. S., Soto, A. Z., Corrigan, L., Sims, D. W., et al. (2019). Non-specific amplification compromises environmental DNA metabarcoding with COI. Methods Ecol. Evol. 10, 1985–2001. doi: 10.1111/2041-210X.13276
Deagle, B. E., Thomas, A. C., Mcinnes, J. C., Clarke, L. J., Vesterinen, E. J., Clare, E. L., et al. (2019). Counting with DNA in metabarcoding studies: how should we convert sequence reads to dietary data? Mol. Ecol. 28, 391–406. doi: 10.1111/mec.14734
Edgar, R. C., Haas, B. J., Clemente, J. C., Quince, C., and Knight, R. (2011). UCHIME improves sensitivity and speed of chimera detection. Bioinformatics 27, 2194–2200. doi: 10.1093/bioinformatics/btr381
Elbrecht, V., and Leese, F. (2017). Validation and development of COI metabarcoding primers for freshwater macroinvertebrate bioassessment. Front. Environ. Sci. 5:11. doi: 10.1371/journal.pone.0177643
Evans, N. T., Olds, B. P., Renshaw, M. A., Turner, C. R., Li, Y., Jerde, C. L., et al. (2016). Quantification of mesocosm fish and amphibian species diversity via environmental DNA metabarcoding. Mol. Ecol. Resour. 16, 29–41. doi: 10.1111/1755-0998.12433
Hawlitschek, O., Fernandez-Gonzalez, A., Balmori-De La Puente, A., and Castresana, J. (2018). A pipeline for metabarcoding and diet analysis from fecal samples developed for a small semi-aquatic mammal. PLoS One 13:e0201763. doi: 10.1371/journal.pone.0201763
Iguchi, N. (2004). Spatial/temporal variations in zooplankton biomass and ecological characteristics of major species in the southern part of the Japan Sea: a review. Prog. Oceanogr. 61, 213–225. doi: 10.1016/j.pocean.2004.06.007
Iwanowicz, D. D., Vandergast, A. G., Cornman, R. S., Adams, C. R., Kohn, J. R., Fisher, R. N., et al. (2016). Metabarcoding of fecal samples to determine herbivore diets: a case study of the endangered pacific pocket mouse. PLoS One 11:e0165366. doi: 10.1371/journal.pone.0165366.g005
Iwasaki, W., Fukunaga, T., Isagozawa, R., Yamada, K., Maeda, Y., Satoh, T. P., et al. (2013). MitoFish and MitoAnnotator: a mitochondrial genome database of fish with an accurate and automatic annotation pipeline. Mol. Biol. Evol. 30, 2531–2540. doi: 10.1093/molbev/mst141
Jacobs, F., and Grant, G. C. (1978). Guidelines for Zooplankton Sampling in Quantitative Baseline and Monitoring Programs. Jacksonville, FL: National Information Service.
Juen, A., and Traugott, M. (2006). Amplification facilitators and multiplex PCR: tools to overcome PCR-inhibition in DNA-gut-content analysis of soil-living invertebrates. Soil Biology Biochem. 38, 1872–1879. doi: 10.1016/j.soilbio.2005.11.034
Keller, A. A., Klein-Macphee, G., and Burns, J. S. O. (1999). Abundance and distribution of ichthyoplankton in Narragansett Bay, Rhode Island, 1989–1990. Estuaries 22, 149–163. doi: 10.2307/1352935
Kim, S., Han, K.-H., Lee, J.-H., Lee, S.-H., Kim, C.-C., Ko, H.-J., et al. (2007a). Egg development and morphology of larva and juvenile of the konoshiro gizzard shad, Konosirus punctatus. Dev. Reprod. 11, 127–135.
Kim, S., Zhang, C.-I., Kim, J.-Y., Oh, J.-H., Kang, S., and Lee, J. B. (2007b). Climate variability and its effects on major fisheries in Korea. Ocean Sci. J. 42, 179–192. doi: 10.1007/BF03020922
Kim, M.-K., Choi, K.-S., Shin, M.-K., Kim, B.-P., and Han, K.-N. (2015). Age and Growth of Redlip Mullet (Chelon haematocheilus) in the Han River Estuary, Korea. Korean J. Ichthyol. 27, 133–141.
Klymus, K. E., Marshall, N. T., and Stepien, C. A. (2017). Environmental DNA (eDNA) metabarcoding assays to detect invasive invertebrate species in the Great Lakes. PLoS One 12:e0177643. doi: 10.1371/journal.pone.0177643
Kumar, S., Stecher, G., Li, M., Knyaz, C., and Tamura, K. (2018). MEGA X: molecular evolutionary genetics analysis across computing platforms. Mol. Biol. Evol. 35, 1547–1549. doi: 10.1093/molbev/msy096
Lamb, P. D., Hunter, E., Pinnegar, J. K., Creer, S., Davies, R. G., and Taylor, M. I. (2019). How quantitative is metabarcoding: a meta-analytical approach. Mol. Ecol. 28, 420–430. doi: 10.1111/mec.14920
Lee, S. J., and Kim, J.-K. (2016). Morphological characteristics and distribution of Pleuronectidae (Pisces) eggs in the western margin of the East Sea. Ocean Sci. J. 51, 13–20. doi: 10.1007/s12601-016-0002-3
Lowerre-Barbieri, S. K., Ganias, K., Saborido-Rey, F., Murua, H., and Hunter, J. R. (2011). Reproductive timing in marine fishes: variability, temporal scales, and methods. Mar. Coast. Fish. 3, 71–91. doi: 10.1080/19425120.2011.556932
McDevitt, A. D., Sales, N. G., Browett, S. S., Sparnenn, A. O., Mariani, S., Wangensteen, O. S., et al. (2019). Environmental DNA metabarcoding as an effective and rapid tool for fish monitoring in canals. J. Fish Biol. 95, 679–682. doi: 10.1111/jfb.14053
Minamoto, T., Yamanaka, H., Takahara, T., Honjo, M. N., and Kawabata, Z. I. (2012). Surveillance of fish species composition using environmental DNA. Limnology 13, 193–197. doi: 10.1007/s10201-011-0362-4
Miura, C., Hayashi, D., and Miura, T. (2020). Relationship between gonadal maturation and kyphosis in cultured yellowtail (Seriola quinqueradiata). Aquaculture 520:734667. doi: 10.1016/j.aquaculture.2019.734667
Miya, M., Sato, Y., Fukunaga, T., Sado, T., Poulsen, J. Y., Sato, K., et al. (2015). MiFish, a set of universal PCR primers for metabarcoding environmental DNA from fishes: detection of more than 230 subtropical marine species. R. Soc. Open Sci. 2:150088. doi: 10.1098/rsos.150088
Murua, H., Kraus, G., Saborido-Rey, F., Witthames, P., Thorsen, A., and Junquera, S. (2003). Procedures to estimate fecundity of marine fish species from field samples in relation to reproductive strategy. J. Northw. Atlantic Fish. Sci. 33, 33–54. doi: 10.2960/J.v33.a3
Park, J. M., Hashimoto, H., Jeong, J. M., Kim, H. J., and Baeck, G. W. (2013). Age and growth of the robust tonguefish Cynoglossus robustus in the Seto Inland Sea. Jpn. Anim. Cells Syst. 17, 290–297. doi: 10.1080/19768354.2013.826281
Park, J. M., Lee, S. H., Choi, J. Y., and Han, K. H. (2015). Spawning behavior and morphological development of the eggs and larvae of the fringed blenny, Chirolophis japonicus from Korea (Pisces: Stichaeidae). Korean J. Ichthyol. 27, 63–70.
Park, K. Y., Park, K. H., Lee, S. I., Park, H. W., Hong, S. E., Yang, J. H., et al. (2007). Maturity and spawning of black edged sculpin, Gymnocanthus herzensteini in the East Sea. Korean J. Ichthyol. 19, 101–106.
Plummer, E., Twin, J., Bulach, D. M., Garland, S. M., and Tabrizi, S. N. (2015). A comparison of three bioinformatics pipelines for the analysis of preterm gut microbiota using 16S rRNA gene sequencing data. J. Proteom. Bioinform. 8, 283–291. doi: 10.4172/jpb.1000381
Riaz, T., Shehzad, W., Viari, A., Pompanon, F., Taberlet, P., and Coissac, E. (2011). ecoPrimers: inference of new DNA barcode markers from whole genome sequence analysis. Nucleic Acids Res. 39:e145. doi: 10.1093/nar/gkr732
Sato, Y., Miya, M., Fukunaga, T., Sado, T., and Iwasaki, W. (2018). MitoFish and MiFish pipeline: a mitochondrial genome database of fish with an analysis pipeline for environmental DNA metabarcoding. Mol. Biol. Evol. 35, 1553–1555. doi: 10.1093/molbev/msy074
Schloss, P. D., Westcott, S. L., Ryabin, T., Hall, J. R., Hartmann, M., Hollister, E. B., et al. (2009). Introducing mothur: open-source, platform-independent, community-supported software for describing and comparing microbial communities. Appl. Environ. Microbiol. 75, 7537–7541. doi: 10.1128/AEM.01541-09
Shaw, J. L. A., Clarke, L. J., Wedderburn, S. D., Barnes, T. C., Weyrich, L. S., and Cooper, A. (2016). Comparison of environmental DNA metabarcoding and conventional fish survey methods in a river system. Biol. Conserv. 197, 131–138. doi: 10.1016/j.biocon.2016.03.010
Shiraishi, T., Ohshimo, S., and Yukami, R. (2010). Age, growth and reproductive characteristics of gold striped amberjack 1 Seriola lalandi in the waters off western Kyushu, Japan. N. Zeal. J. Mar. Freshw. Res. 44, 117–127. doi: 10.1080/00288330.2010.488787
Shoji, J., Toshito, S.-I., Mizuno, K.-I., Kamimura, Y., Hori, M., and Hirakawa, K. (2011). Possible effects of global warming on fish recruitment: shifts in spawning season and latitudinal distribution can alter growth of fish early life stages through changes in daylength. ICES J. Mar. Sci. 68, 1165–1169. doi: 10.1093/icesjms/fsr059
Sigsgaard, E. E., Nielsen, I. B., Carl, H., Krag, M. A., Knudsen, S. W., Xing, Y., et al. (2017). Seawater environmental DNA reflects seasonality of a coastal fish community. Mar. Biol. 164:128. doi: 10.1007/s00227-017-3147-4
Smith, K. F., Kohli, G. S., Murray, S. A., and Rhodes, L. L. (2017). Assessment of the metabarcoding approach for community analysis of benthic-epiphytic dinoflagellates using mock communities. N. Zeal. J. Mar. Freshw. Res. 51, 555–576. doi: 10.1080/00288330.2017.1298632
Sohn, M. H., Yoon, B. S., Park, J.-H., Choi, Y. M., and Yang, J. H. (2014). Species composition and distribution of trammel net catches in the coastal waters of Gangwon province, Korea. Korean J. Fish. Aquat. Sci. 47, 945–959. doi: 10.5657/KFAS.2014.0945
Takano, K., Takemura, A., Furihata, M., Nakanishi, T., and Hara, A. (1991). “Annual reproductive and spawning cycles of female Sebastiscus marmoratus,” in Rockfishes of the Genus Sebastes: Their Reproduction and Early Life History, eds J. Yamada and G. W. Boehlert (Berlin: Springer), 39–48. doi: 10.1007/978-94-011-3792-8_5
Takeuchi, A., Iijima, T., Kakuzen, W., Watanabe, S., Yamada, Y., Okamura, A., et al. (2019). Release of eDNA by different life history stages and during spawning activities of laboratory-reared Japanese eels for interpretation of oceanic survey data. Sci. Rep. 9, 1–9. doi: 10.1038/s41598-019-42641-9
Thomsen, P. F., Kielgast, J., Iversen, L. L., Møller, P. R., Rasmussen, M., and Willerslev, E. (2012). Detection of a diverse marine fish fauna using environmental DNA from seawater samples. PLoS One 7:e41732. doi: 10.1371/journal.pone.0041732
Ushio, M., Murakami, H., Masuda, R., Sado, T., Miya, M., Sakurai, S., et al. (2017). Quantitative monitoring of multispecies fish environmental DNA using high-throughput sequencing. bioRxiv [Preprint]. doi: 10.3897/mbmg.2.23297
Valentini, A., Taberlet, P., Miaud, C., Civade, R., Herder, J., Thomsen, P. F., et al. (2016). Next-generation monitoring of aquatic biodiversity using environmental DNA metabarcoding. Mol. Ecol. 25, 929–942. doi: 10.1111/mec.13428
Vamos, E. E., Elbrecht, V., and Leese, F. (2017). Short COI markers for freshwater macroinvertebrate metabarcoding. PeerJ 1:e14625. doi: 10.3897/mbmg.1.14625
Watts, C., Dopheide, A., Holdaway, R., Davis, C., Wood, J., Thornburrow, D., et al. (2019). DNA metabarcoding as a tool for invertebrate community monitoring: a case study comparison with conventional techniques. Austral. Entomol. 58, 675–686. doi: 10.1111/aen.12384
Yamamoto, S., Masuda, R., Sato, Y., Sado, T., Araki, H., Kondoh, M., et al. (2017). Environmental DNA metabarcoding reveals local fish communities in a species-rich coastal sea. Sci. Rep. 7:40368. doi: 10.1038/srep40368
Yatsu, A., Watanabe, T., Ishida, M., Sugisaki, H., and Jacobson, L. D. (2005). Environmental effects on recruitment and productivity of Japanese sardine Sardinops melanostictus and chub mackerel Scomber japonicus with recommendations for management. Fish. Oceanogr. 14, 263–278. doi: 10.1111/j.1365-2419.2005.00335.x
Yoon, T. H., Kang, H. E., Lee, S. R., Lee, J. B., Baeck, G. W., Park, H., et al. (2017). Metabarcoding analysis of the stomach contents of the Antarctic Toothfish (Dissostichus mawsoni) collected in the Antarctic Ocean. PeerJ 5:e3977. doi: 10.7717/peerj.3977
Yu, D. W., Ji, Y., Emerson, B. C., Wang, X., Ye, C., Yang, C., et al. (2012). Biodiversity soup: metabarcoding of arthropods for rapid biodiversity assessment and biomonitoring. Methods Ecol. Evol. 3, 613–623. doi: 10.1111/j.2041-210X.2012.00198.x
Yuuki, Y. (1982). Spawning and maturity of a sternoptychid fish Maurolicus muelleri in the south western waters of the Sea of Japan. Bull. Jpn. Soc. Sci. Fish. 48, 749–753. doi: 10.2331/suisan.48.749
Keywords: metabarcoding, ichthyoplankton, Korea, next-generation sequencing, environmental DNA
Citation: Kim AR, Yoon T-H, Lee CI, Kang C-K and Kim H-W (2021) Metabarcoding Analysis of Ichthyoplankton in the East/Japan Sea Using the Novel Fish-Specific Universal Primer Set. Front. Mar. Sci. 8:614394. doi: 10.3389/fmars.2021.614394
Received: 06 October 2020; Accepted: 03 February 2021;
Published: 17 March 2021.
Edited by:
Dominique Pelletier, Institut Français de Recherche pour l’Exploitation de la Mer (IFREMER), FranceReviewed by:
Simo Njabulo Maduna, Norwegian Institute of Bioeconomy Research (NIBIO), NorwayKa Yan Ma, Sun Yat-sen University, China
Copyright © 2021 Kim, Yoon, Lee, Kang and Kim. This is an open-access article distributed under the terms of the Creative Commons Attribution License (CC BY). The use, distribution or reproduction in other forums is permitted, provided the original author(s) and the copyright owner(s) are credited and that the original publication in this journal is cited, in accordance with accepted academic practice. No use, distribution or reproduction is permitted which does not comply with these terms.
*Correspondence: Hyun-Woo Kim, a2ltaHdAcGtudS5hYy5rcg==