 Andreas Klügel1*
 Miriam Römer1,2
 Paul Wintersteller1,2
 Kai-Frederik Lenz3
 Sebastian Krastel3
 Heinrich Villinger1
 Norbert Kaul1
- 1Fachbereich Geowissenschaften, Universität Bremen, Bremen, Germany
- 2MARUM - Center for Marine Environmental Sciences, Bremen, Germany
- 3Institut für Geowissenschaften, Christian-Albrechts-Universität zu Kiel, Kiel, Germany
Introduction
Until the year 2019 only around 15% of the Earth's seafloor were mapped at fine spatial resolution (<800 m) by multibeam echosounder systems (Wölfl et al., 2019). Most of our knowledge of global bathymetry is based on depths predicted by gravity observations from satellite altimeters. These predicted depths are combined with shipboard soundings to produce global bathymetric grids. The first topographic map of the world's oceans so produced (Smith and Sandwell, 1997) had a resolution between 1 and 12 km, and subsequent improvements in data and filtering techniques led to several updates. The latest bathymetric grid of the General Bathymetric Chart of the Oceans (GEBCO_2020) uses the SRTM15+V2.0 data set, which has a grid spacing of 15 arc sec, equivalent to about 500 × 500 m at the equator (Tozer et al., 2019). This resolution does not imply that reliable depth data are available for each grid cell. There are vast areas of the oceans where the accuracy of these grids is limited by lacking shipborne multibeam data, which are needed for calibrating and ground-truthing predicted depths (Smith and Sandwell, 1994).
The resolution and accuracy of the bathymetric grids are critical factors for global estimates of the number and size distribution of seamounts, in particular for small edifices of <1,000 m height (Wessel, 2001; Hillier and Watts, 2007; Kim and Wessel, 2011). A case in point is Le Gouic Seamount, located in the NE Atlantic about 100 km SW of Tropic Seamount on ca. 152 Ma crust, close to magnetic isochrone M24 (Bird et al., 2007). The seamount belongs to the Canary Island Seamount Province (CISP; van den Bogaard, 2013), also termed Western Saharan Seamount Province (WSSP) by some workers (e.g., Josso et al., 2019). It is listed in the Kim and Wessel (2011) seamount census with the ID KW-00902, located at 21.26216°W/23.0199°N, with a height of 498 m; hence it appears as a tiny cone in pre-2019 bathymetric grids (Figure 1a). After first mapping of large parts of the seamount by the French oceanographic survey vessel “Beautemps-Beaupré” in 2013, it is represented at its full height in the actual GEBCO_2020 grid, which is based on the SRTM15+V2.0 data set (Tozer et al., 2019).
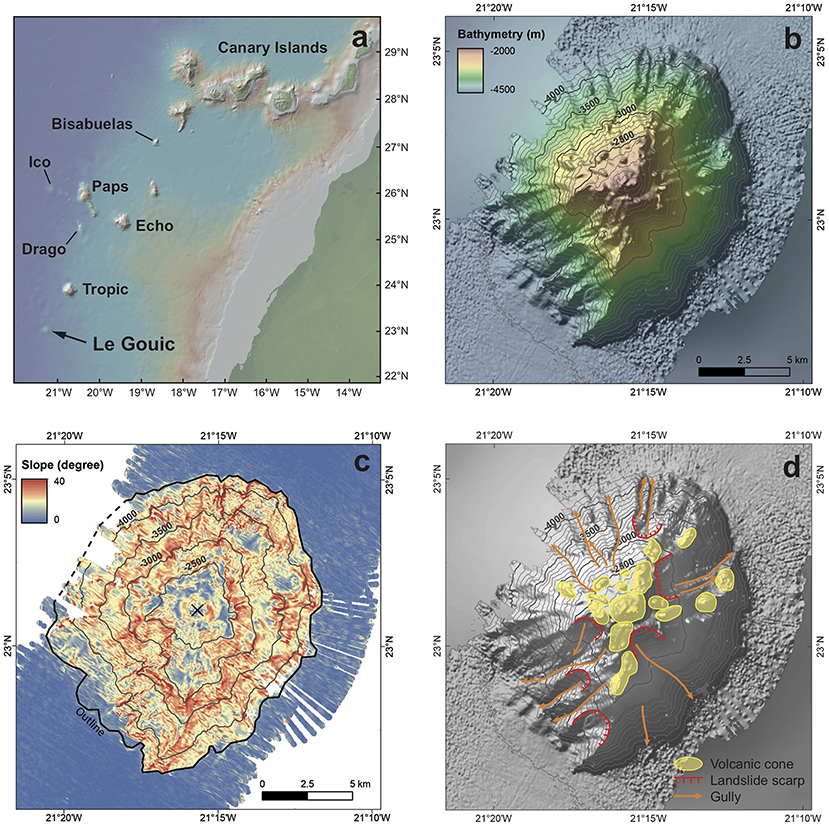
Figure 1. (a) Overview map of the Canary Island Seamount Province (CISP); seamount names after Palomino et al. (2016) and van den Bogaard (2013). Map produced using GeoMapApp (Ryan et al., 2009), with bathymetry based on GEBCO 2014. (b) Bathymetric map of Le Gouic Seamount based on the multibeam data reported here. (c) A slope map of the seamount illustrates the lack of a summit plateau, but more gentle slopes in the summit area and south of it. (d) Provisionally identified morphological features of Le Gouic Seamount.
In this data report we present new multibeam bathymetric data for Le Gouic Seamount, mapping its full extent for the first time. The data were obtained during a transit of R/V METEOR cruise M146 in 2018. We also present a reflection seismic profile across the seamount that was shot during the mapping, and seafloor heatflow data obtained on a profile near the northeastern seamount base and co-located on the reflection profile. On the basis of this data we can place constraints on the age of the seamount, and speculate about possible rejuvenated magmatic activity.
Methods
Multibeam Data Acquisition
Bathymetric and backscatter mapping of the seafloor used the Kongsberg EM122 multibeam echosounder systems (MBES) onboard R/V Meteor. The system consists of two linear transducer arrays in a Mills cross configuration with separate units for transmit and receive. The nominal sonar frequency is 12 kHz with an angular coverage sector of up to 150° and 288 beams per ping across-track; the acoustical footprint is 1° (TX) along track and 2° (RX) across track. During cruise M146 the swath width was set to 120° (60° port and starboard), and up to 864 soundings in combination of high-density equidistant and dual-swath mode, corresponding to a coverage of about 3.4 times the water depth. Mapping speed was 4 knots. An inertial navigation system (Seapath 320+), which was augmented by differential GPS-signals, a motion reference unit (MRU5+) and accurate heading information (GPS), provided GPS and attitude data simultaneously to the multibeam echosounder system. A sound velocity profile (SVP) was generated by deploying an Applied Microsystems SV Plus V2 probe; the SVP was applied to the Kongsberg's acquisition software SIS.
For the processing of the multibeam data we used the free and open source software packages MB-System (Caress and Chayes, 2017) and GMT (Wessel and Smith, 1995). A detailed description of the MBES acquisition, post-processing and the creation of products can be found in Wintersteller et al. (2018). Global Mapper™ was used for on-board geographical data compilation and visualization, and Esri ArcGIS™ served to create final maps, morphometric analysis, and a sustainable data management.
Reflection Seismics
The seismic source was a standard Sercel GI-Gun (2 × 1.7 L) shot in a harmonic mode. The injector of the gun was triggered with a delay of 50 ms with respect to the generator signal, which basically eliminated the bubble signal. The gun was operated with a pressure of 160 bar. The shooting interval was 5–9 s depending on water depth, resulting in a shot point distance of 10–18 m at 4 knots surveying speed.
The seismic signals were received by a digital Geometrics GeoEel streamer consisting of a tow cable (80 m, 40 m in water), one 10 m long vibration isolation section, 9 active sections of 12.5 m each, a vibration isolation section at the end of the streamer, and an end buoy. An active section contained eight channels (spacing of 1.56 m), resulting in 72 channels within the streamer. The processing included a band pass filter, a fk-filter, CMP-binning at 3.125 m bin distance, a static correction, a Normal-Move-Out correction with a constant velocity of 1,500 m/s, stacking, and a finite differences time migration.
Heat Flow Determinations
The 6 m long Bremen heat flow probe operated in a pogo-style mode was used for the heat flow survey. A Posidonia pinger mounted to the coring wire 50 meters above the instrument allowed to monitor the exact position of the heat probe at depth. The probe is constructed in the classical “violin bow” design (Hyndman et al., 1979; Villinger et al., 2010), with 21 thermistors distributed over an active length of 5.2 m and mounted in 0.26 m intervals inside an oil-filled hydraulic tube. The sensor tube also contains a heater wire for the generation of heat pulses for in-situ thermal conductivity measurements. The signal of the temperature sensors was measured at a sample rate of 1 Hz and a final temperature resolution of better than 0.001 K at ambient seafloor temperatures. A calibrated PT-100 seawater sensor on top of the weight stand allowed to measure the absolute bottom water temperature and to check the calibration of the sensor string in deep water with high accuracy. Inclination and acceleration of the probe were measured to monitor the penetration process into the sediments and potential disturbances during the actual measurement period. Because the penetration generated a thermal disturbance due to frictional heating, and the sensor string had to come into thermal equilibrium with the sediment, the decay was recorded during 7–8 min. The final temperature was derived by a theoretical decay model (Villinger and Davis, 1987). In-situ thermal conductivity was determined by applying a heat pulse on the order of 800 J/m on the sensor string for 20 s and measuring the temperature decay for 8 min (Lister, 1970). Determination of the heat flow followed the method described in Villinger et al. (2010).
Data Presentation
Morphological Features of Le Gouic Seamount
The summit of Le Gouic Seamount is at 2019 m water depth, equivalent to an edifice height of 2,387 m when vertically projected to the seafloor plane at 4,406 m water depth (Figure 1b). It is slightly elongated in SW-NE direction with diameters between 13.5 and 17 km. The seamount is cone-shaped with mean slope angles between summit and seafloor plane from 15° to 20° (Figure 1c). The seamount morphology is characterized by a number of radiating gullies and ridges, and by some broader embayments with steep headwalls, which likely represent scarps of landslide events (cf. Mitchell, 2001). Pronounced ridges indicating volcanic rift zones are lacking. The summit region is devoid of a plateau, but is characterized by more gentle slopes and a number of elongated or near-circular hummocks some hundred meters in width that may represent small volcanic cones (Figure 1d). In some of these inferred cones a crater structure may be discernible. In size and overall morphology, including slopes and the concentration of presumed volcanic cones in the summit region, Le Gouic Seamount resembles the Drago and Ico seamounts located ca. 100–160 km north of Tropic Seamount (Figure 1a), which were recently discovered and are also part of the CISP (Palomino et al., 2016; Marino et al., 2017).
The volume of Le Gouic Seamount relative to the calculated seafloor plane, as calculated from our bathymetric data, is ~160 km3. The volume increases considerably if the sediment-covered part is also taken into account: if we approximate the sub-seafloor geometry by a regular cone that is extrapolated to 1,000 m sediment cover (minimum thickness based on our seismic data, see below), we obtain a total volume of ~460 km3.
Reflection Seismic Profile
A SW-NE orientated reflection seismic profile across the peak of Le Gouic Seamount reveals the extension of the edifice below the seafloor and some characteristics of the adjacent sediments. The seamount-sediment boundary can be traced to more than 10 km distance from the morphological seamount base and reaches a depth of 7.1 s TWT (two-way travel time) (Figure 2). The thickness of the overlying sediment is at least 1.3 s TWT to the southwest and 1.4 s TWT to the northeast, which is equivalent to 1,040–1,120 m if a P-wave velocity of 1,600 ms−1 is assumed. The sediment-basement boundary, however, could not be imaged due to the limited source strength in relation to the thick sediment cover.
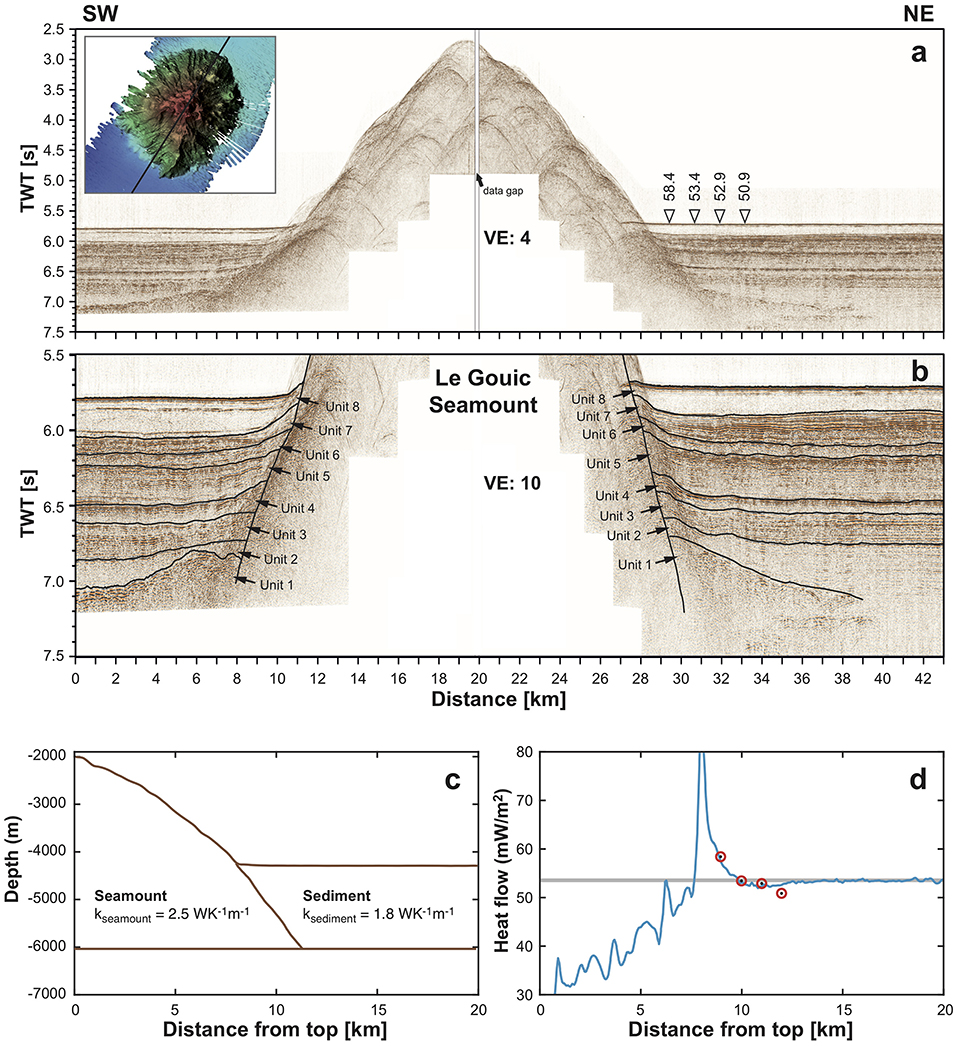
Figure 2. (a) Southwest-northeast orientated seismic profile across Le Gouic Seamount (vertical exaggeration ca. 4x), showing different sediment patterns to the SW and NE of the seamount. Inset shows profile location, triangles with numbers indicate locations and values (in mW/m2) of heat flow determinations. The profile illustrates the near-conical shape and prominent peak of the seamount. (b) Expanded section (vertical exaggeration ca. 10x) and interpretation of the seismic profile, with subdivision into 8 main units that are present both to the SW and NE of the seamount. (c) Geometry and thermal conductivities of the heat flow model as based on the seismic profile. The model assumes a basal heat flow similar to that predicted for 152 Ma old oceanic crust (Hasterok, 2013). (d) Comparison of modeled (blue solid line) and measured seafloor heat flow (red circles).
The sedimentary units are well-stratified and show minor differences southwest and northeast of the seamount (Figure 2). The lowermost unit (Unit 1) is characterized by semi-continuous and subparallel reflections. Due to limited acoustic penetration, the bottom of this unit and its boundary to the seamount flanks cannot be unequivocally identified. Units 2, 4, and 6 are semi-transparent and locally show chaotic reflections, suggesting that they represent comparatively fine-grained mass-flow deposit (e.g., Barrett et al., 2020, and references therein). They are thinner than the other units, except for the thickening of Unit 2 to the northeast of the seamount. Units 3, 5, and 7 are well-stratified with subparallel reflectors; these units separate the more transparent units. They resemble unit 4.1 of Palomino et al. (2016) and are interpreted to represent deposits from turbidity currents and (hemi)pelagic sedimentation. Unit 8 is transparent with some chaotic reflections and a continuous reflector at the bottom. It is the topmost unit and is capped by a strong continuous reflector. In the SW the unit is separated by two strong continuous reflectors into three subunits; in the NE a subdivision is less clear. The transparency of Unit 8 suggests an origin by mass-flow deposits, probably with multiple events in the SW.
The slightly different sediment patterns to the southwest and northeast of Le Gouic Seamount can be explained by lateral variations of predominantly NW-directed mass flows originating from the continental slope, similar to what is observed at nearby Tropic Seamount (Palomino et al., 2016). Remarkably, most reflectors bend upward toward Le Gouic Seamount by up to 100 m over 1–2 km length. Although mass-flow deposits resulting from massive instabilities of the continental slope have been described for the CISP area (Palomino et al., 2016), it is unlikely that the bending of sediment layers reflects mass-flow runup because it is not accompanied by changes in layer thickness (Figure 2). The most plausible explanation is uplift of the seamount by ca. 100 m, which is likely caused by magmatic intrusions (cf. Ramalho et al., 2010). The uplift must have occurred rather recently, because it has affected all but the topmost sediment layers.
Constraints on the Age of Le Gouic Seamount
Known radiometric ages from seamounts of the CISP vary from 142 to 91 Ma in the southwesthern area, from 133 to 0.2 Ma in the Canary Islands area, and from 68 to 18 Ma in the northeast (van den Bogaard, 2013). This author suggested shallow plate-bound mantle convection as a main cause for intraplate magmatism in this region. Ferromanganese crusts recovered from some seamounts of the southwestern CISP gave maximum ages of 30–99 Ma (Marino et al., 2017, 2018). The age of Le Gouic Seamount may be bracketed by comparing the thickness of the sediment overlying its flanks to the entire sediment thickness in its vicinity. Based on Figure 3 of Patriat and Labails (2006), the seamount is located at the 7.5 s TWT basement isochron. The sediments overlying the seamount range from 5.8 to ≥7.1 s TWT (Figure 2), hence the pre-seamount sediments (below Unit 1) extend from ≥7.1 to 7.5 s TWT, equivalent to ≤ 24% of the entire sediment thickness. If we assume a constant sedimentation rate since formation of the 152 Ma ocean crust, we obtain a minimum seamount age of 116 Ma as a rough estimate, which is very close to the radiometric age of Tropic Seamount to the northeast (119 Ma; van den Bogaard, 2013).
The time period for the formation of Le Gouic Seamount may be estimated using eruption rates of other Atlantic intraplate volcanoes. For eruption rates of 0.2–0.5 km3/ka as for the present shield stages of the westernmost Canary Islands (Ancochea et al., 1994), the seamount would have needed 0.9–2.3 Ma to grow to its inferred volume of 460 km3. Two observations suggest that the seamount may have had rejuvenated volcanic activity in the recent past. First, the small volcanic cones and possibly craters that were provisionally identified in our bathymetric data and are indicated in Figure 1d would be hard to recognize anymore if they had formed >100 Ma ago. Second, the inferred recent uplift of the sediments around the seamount may have its root in rejuvenated activity.
Heat Flow
Heat flow was determined northeast of Le Gouic Seamount at four localities spaced ca. 1 km apart along a SW-NE trending traverse (Figure 2). At each locality the probe fully penetrated the sediment and the signals from all 21 thermistors could be used to determine thermal conductivity and heat flow. Calculated heat flows increase toward the seamount, from 50.9 mW/m2 at about 4 km distance from the seamount base to 58.4 mW/m2 at about 1 km distance (Supplementary Table 1). This systematic increase can be explained by thermal refraction and decreasing sediment thickness toward the seamount base.
We simulated the conductive heat flow around Le Gouic Seamount with a two-dimensional axial-symmetric finite element model, using the Partial Differential Equation (PDE) Toolbox based on Matlab®, and compared it to the measured surface heat flow. The model assumes a basal heat flow of 53.5 mW/m2 and thermal conductivities as shown in Figure 2c. The modeled surface heat flow sharply increases toward the flank of the seamount due to sediment thinning and thermal refraction, and agrees very well with the measured data (Figure 2d). Overall the determined basal heat flows agree well with the value of 53.5 mW/m2, predicted by the model of Hasterok (2013) for conductive cooling of 152 Ma crust. The good agreement between measured and modeled heat flow is a strong indication that Le Gouic Seamount is not hydrothermally active.
Data Availability Statement
The bathymetric and seismic datasets analyzed for this study can be found in the Pangaea data base (https://doi.pangaea.de/10.1594/PANGAEA.893939 and https://doi.pangaea.de/10.1594/PANGAEA.919699), and the report of cruise M146 is available at https://doi.org/10.2312/cr_m146.
Author Contributions
AK, HV, SK, and MR conceived the project. PW and MR collected and processed the multibeam data. HV and NK collected and processed the heat flow data. SK and K-FL collected and processed the seismic data. AK wrote most of the text. All authors were actively involved in the discussion, interpretation of the data, and preparation of the manuscript.
Funding
This research was funded by the Deutsche Forschungsgemeinschaft (DFG, grant KL1313/18-1), and MR was funded by the DFG under Germany's Excellence Strategy - EXC-2077- 390741603.
Conflict of Interest
The authors declare that the research was conducted in the absence of any commercial or financial relationships that could be construed as a potential conflict of interest.
Acknowledgments
We are grateful to Captain R. Hammacher, the crew and the shipboard scientific party of METEOR cruise M146 for their great commitment and pleasant working atmosphere to achieve a successful cruise, and the Leitstelle Deutsche Forschungsschiffe for overall support. The constructive comments for two reviewers helped to improve the manuscript.
Supplementary Material
The Supplementary Material for this article can be found online at: https://www.frontiersin.org/articles/10.3389/fmars.2021.617927/full#supplementary-material
References
Ancochea, A., Hernán, F., Cendrero, A., Cantagrel, J. M., Fúster, J. M., Ibarrola, E., et al. (1994). Constructive and destructive episodes in the building of a young Oceanic Island, La Palma, Canary Islands, and genesis of the Caldera de Taburiente. J. Volcanol. Geother. Res. 60, 243–262.
Barrett, R., Lebas, E., Ramalho, R., Klaucke, I., Kutterolf, S., Klügel, A., et al. (2020). Revisiting the tsunamigenic volcanic flank collapse of Fogo Island in the Cape Verdes, offshore West Africa. Geolog. Soc. Lond. Spec. Pub. 500, 13–26. doi: 10.1144/SP500-2019-187
Bird, D. E., Hall, S. A., Burke, K., Casey, J. F., and Sawyer, D. S. (2007). Early Central Atlantic Ocean seafloor spreading history. Geosphere 3, 282–298. doi: 10.1130/GES00047.1
Caress, D. W., and Chayes, D. N. (2017). MB-System: Mapping the Seafloor. Available online at: https://www.mbari.org/products/research-software/mb-system (accessed January 28, 2021).
Hasterok, D. (2013). A heat flow based cooling model for tectonic plates. Earth Planet. Sci. Lett. 361, 34–43. doi: 10.1016/j.epsl.2012.10.036
Hillier, J. K., and Watts, A. (2007). Global distribution of seamounts from ship-track bathymetry data. Geophys. Res. Lett. 34:L13304. doi: 10.1029/2007GL029874
Hyndman, R., Davis, E., and Wright, J. (1979), The measurements of marine geothermal heat flow by a multipenetration probe with digital acoustic telemetry insitu thermal conductivity. Mar. Geophys. Res. 4, 181–205.
Josso, P., Parkinson, I., Horstwood, M., Lusty, P., Chenery, S., and Murton, B. (2019). Improving confidence in ferromanganese crust age models: a composite geochemical approach. Chem. Geol. 513, 108–119. doi: 10.1016/j.chemgeo.2019.03.003
Kim, S.-S., and Wessel, P. (2011). New global seamount census from altimetry-derived gravity data. Geophys. J. Int. 186, 615–631. doi: 10.1111/j.1365-246X.2011.05076.x
Lister, C. R. B. (1970). Measurement of in situ sediment conductivity by means of a Bullard-type probe. Geophys. J. Int. 19, 521–532.
Marino, E., González, F. J., Lunar, R., Reyes, J., Medialdea, T., Castillo-Carrión, M., et al. (2018). High-resolution analysis of critical minerals and elements in Fe–Mn crusts from the Canary Island Seamount Province (Atlantic Ocean). Minerals 8:285. doi: 10.3390/min8070285
Marino, E., González, F. J., Somoza, L., Lunar, R., Ortega, L., Vázquez, J. T., et al. (2017). Strategic and rare elements in Cretaceous-Cenozoic cobalt-rich ferromanganese crusts from seamounts in the Canary Island Seamount Province (northeastern tropical Atlantic). Ore Geol. Rev. 87, 41–61. doi: 10.1016/j.oregeorev.2016.10.005
Mitchell, N. C. (2001). Transition from circular to stellate forms of submarine volcanoes. J. Geophys. Res. 106, 1987–2003. doi: 10.1029/2000JB900263
Palomino, D., Vázquez, J.-T., Somoza, L., León, R., López-González, N., Medialdea, T., et al. (2016). Geomorphological features in the southern Canary Island Volcanic Province: the importance of volcanic processes and massive slope instabilities associated with seamounts. Geomorphology 255, 125–139. doi: 10.1016/j.geomorph.2015.12.016
Patriat, M., and Labails, C. (2006). Linking the canary and cape-verde hot-spots, Northwest Africa. Mar. Geophys. Res. 27, 201–215. doi: 10.1007/s11001-006-9000-7
Ramalho, R., Helffrich, G., Cosca, M., Vance, D., Hoffmann, D., and Schmidt, D. N. (2010). Episodic swell growth inferred from variable uplift of the Cape Verde hotspot islands. Nat. Geosci. 3, 774–777. doi: 10.1038/NGEO982
Ryan, W. B. F., Carbotte, S. M., Coplan, J., O'Hara, S., Melkonian, A., Arko, R., et al. (2009). Global Multi-Resolution Topography (GMRT) synthesis data set. Geochem. Geophys. Geosyst. 10:Q03014. doi: 10.1029/2008GC002332
Smith, W. H. F., and Sandwell, D. T. (1994). Bathymetric prediction from dense satellite altimetry and sparse shipboard bathymetry. J. Geophys. Res. 99, 21803–21824. doi: 10.1029/94JB00988
Smith, W. H. F., and Sandwell, D. T. (1997). Global sea floor topography from satellite altimetry and ship depth soundings. Science 277, 1956–1962.
Tozer, B., Sandwell, D. T., Smith, W. H. F., Olson, C., Beale, J. R., and Wessel, P. (2019). Global bathymetry and topography at15 arc sec: SRTM15+. Earth Space Sci. 6, 1847–1864. doi: 10.1029/2019EA000658
van den Bogaard, P. (2013). The origin of the Canary Island Seamount Province - new ages of old seamounts. Sci. Rep. 3:2107. doi: 10.1038/srep02107
Villinger, H. W., and Davis, E. E. (1987). A new reduction algorithm for marine heat flow measurements. J. Geophys. Res. 92, 12846–12856.
Villinger, H. W., Trehu, A. M., and Grevemeyer, I. (2010). “Chapter 18: Seafloor marine heat flux measurements and estimation of heat flux from seismic observations of bottom simulating refectors,” in Geophysical Characterization of Gas Hydrates, eds M. Riedel, E. C. Willoughby, and S. Chopra (Tulsa, OK: Society of Exploration Geophysicists), 279.
Wessel, P. (2001). Global distribution of seamounts inferred from gridded Geosat/ERS-1 altimetry. J. Geophys. Res. 106, 19431–19441. doi: 10.1029/2000JB000083
Wessel, P., and Smith, W. H. F. (1995). New version of the generic mapping tools. Eos Trans. Am. Geophys. Union 76:329.
Wintersteller, P., Strack, A., and Bachmann, K. (2018). Gridded bathymetry from multibeam echosounder EM122 data of METEOR cruise M146, Transit. MARUM - Center for Marine Environmental Sciences, University of Bremen. doi: 10.1594/PANGAEA.892813
Keywords: seamount, bathymetry, hydroacoustics, reflection seismics, heatflow, Atlantic
Citation: Klügel A, Römer M, Wintersteller P, Lenz K-F, Krastel S, Villinger H and Kaul N (2021) Bathymetric and Seismic Data, Heat Flow Data, and Age Constraints of Le Gouic Seamount, Northeastern Atlantic. Front. Mar. Sci. 8:617927. doi: 10.3389/fmars.2021.617927
Received: 30 October 2020; Accepted: 21 January 2021;
Published: 10 February 2021.
Edited by:
Telmo Morato, University of the Azores, PortugalReviewed by:
Luis Somoza, Instituto Geológico y Minero de España (IGME), SpainRui Quartau, Instituto Hidrográfico, Portugal
Copyright © 2021 Klügel, Römer, Wintersteller, Lenz, Krastel, Villinger and Kaul. This is an open-access article distributed under the terms of the Creative Commons Attribution License (CC BY). The use, distribution or reproduction in other forums is permitted, provided the original author(s) and the copyright owner(s) are credited and that the original publication in this journal is cited, in accordance with accepted academic practice. No use, distribution or reproduction is permitted which does not comply with these terms.
*Correspondence: Andreas Klügel, YWtsdWVnZWxAdW5pLWJyZW1lbi5kZQ==