 Nigel Keeley
 Olivier Laroche
 Murray Birch
 Xavier Pochon
- 1Benthic Resources and Processes Group, Institute of Marine Research, Tromsø, Norway
- 2Marine Design Engineering Ltd., Puramahoi, New Zealand
- 3Costal and Freshwater Group, Cawthron Institute, Nelson, New Zealand
- 4Institute of Marine Science, University of Auckland, Auckland, New Zealand
Sea cage fish farms are increasingly situated over hard and mixed substrate habitats for production and waste-dispersion reasons; yet in many cases, these installations are not being effectively managed with respect to benthic impacts due to the lack of a practical sampling method. This study presents the first set of results from a newly developed Substrate Independent Benthic Sampler (SIBS) device that captures the unconsolidated organic and inorganic matter that overlies almost all substrates. The contents of the samples were analyzed using extracted environmental DNA (eDNA) followed by metabarcoding of the bacterial 16S rRNA gene. SIBS microbial assemblages reliably changed with proximity to farm and concurred with visual assessments of impact. Moreover, the approach appeared to be very sensitive with respect to the enrichment gradient, being able to discern influences at distances of 500–1500 m from the impact source. Other spatial differences, due to region and farm, were small in comparison, and the effect of the underlying substrate type was minor. The samples contained sufficient previously described bacterial bioindicator taxa from enriched sediments, such that a meaningful biotic index could be calculated, thereby placing them on a well-established benthic enrichment spectrum with established environmental thresholds. SIBS-derived bacterial data provide a powerful new approach for mapping spatial boundaries of farm effects irrespective of substrate type and topography. More importantly, the tool should also permit quantitative assessment of benthic enrichment levels irrespective of substrate type from depths of at least 100 m. It therefore has the potential to solve the hard-bottom problem that has until now prohibited effective environmental monitoring at mixed and hard-bottom locations.
Introduction
The last 10 years have seen a rapid global expansion of the aquaculture sector that is epitomized by the sea-cage salmon industry, which in countries such as Canada, Norway, Scotland, Faroe Islands, and Chile now represents a significant contribution to GDP (FAO, 2018). Traditionally, fish farms were established in sheltered bays or deep fjords over soft sediments that are simple to sample and for which the pronounced effects of organic enrichment are well understood (Gowen and Bradbury, 1987; Kalantzi and Karakassis, 2006; MPI, 2013). However, the quest for new and better salmon growing water space (Bostock et al., 2010) has resulted in culture units being situated in more exposed locations (Lader et al., 2017) and consequently over a variety of bottom types supporting a more diverse array of ecosystems (Holmer, 2010). Hard-bottom reef areas for example are often inhabited by fauna such as sponges, bryozoans, and corals that have received little attention in the context of organic enrichment. Yet, these types of habitats are generally perceived to be both important for biodiversity and ecosystem function (Klitgaard, 1995; Kutti et al., 2013; Leys et al., 2018) and sensitive to anthropogenic stressors, including sedimentation (Edge et al., 2016; Scanes et al., 2018). As well as being a relatively new problem, the physical nature of hard substrates precludes the use of most established benthic sampling techniques, which in turn has retarded the learning process with respect to ecological effects.
Perhaps more importantly, the inability to readily sample non-soft-sediment habitats has also hindered our ability to effectively manage these types of sites with respect to waste discharges and the surrounding environment. Until recently, there has been a necessary “loop-hole” in many management guidelines to accommodate this, permitting alternative methods, such as visual surveys (Hamoutene et al., 2016, 2018), but their efficacy is challenged by the relatively sparse and patchy nature and regional specificity of the target organisms. Or even more problematically, in some areas, for example some fjords in southern Norway, there are extensive areas of bare rock that are naturally devoid of conspicuous biota (Author Pers. Obvs), which, in addition to precluding fauna-based assessments, raises interesting philosophical questions over “what is an effect” and “does it matter”? While there are some other more universal visual indicators (e.g., anaerobic bacteria, waste feed, clumps of opportunistic polychetes) that do indicate acute effects and therefore may permit some high-level compliance triggers (Crawford et al., 2001; Hamoutene et al., 2016, 2018), they are typically only in localized, acutely impacted situations and do not indicate a broad range of effects. In addition, most of these indicators are unidirectional in terms of the implication, i.e., presence means effect, but absence does not necessarily means no effect, and as such are arguably unreliable indicators.
In the absence of a scalable range of effects, visual methods cannot be used to discern moderate effects or the outer extent of influence. The importance of this is emphasized at high flow environments, where more sensitive soft-sediment indicators have revealed relatively large waste influence fields, for example 0.5–1 km from the source (Woodcock et al., 2018; Keeley et al., 2019). This has potential ecological implications, not only for the sessile benthic fauna that inhabit those types of environments but also for other mobile and demersal species which may otherwise utilize the area and/or the waste (e.g., lobster and other mobile epifauna: Walters, 2007; Woodcock et al., 2018). Such assessments are facilitated by the ability to analyze compounds in the soft sediments and depositional material caught in traps above the bottom, e.g., terrestrial fatty acids found in fish or carbon and nitrogen isotopes (e.g., Woodcock et al., 2017). As such, neither the spatial extent nor the magnitude of benthic effects can be readily evaluated at hard-bottom sites.
Fortunately, modern genetic tools (i.e., environmental DNA [eDNA] metabarcoding; Taberlet et al., 2018) have greatly enabled the exploration of the microscopic world of micro- and meio-fauna, which in combination with a novel sampling approach may provide a solution to the hard-bottom problem. Numerous studies have demonstrated that microorganisms can be used to indicate benthic organic enrichment (Pawlowski et al., 2014, 2016a; Pochon et al., 2015a; Stoeck et al., 2018b). Not too surprisingly, the most useful taxonomic group appears to be bacteria (Kawahara et al., 2009; Dowle et al., 2015; Keeley et al., 2018; Stoeck et al., 2018a; Verhoeven et al., 2018), which are often visible as mats in heavily organically enriched sediments and are implicit in benthic biogeochemical and metabolic processes (Blackburn and Blackburn, 1992; Bisset et al., 2009; Zhang et al., 2009). The typical sampling procedure for isolating eDNA from the marine benthos involves obtaining a very small sediment sample (e.g., 2–5 g) from a conventional sediment grab brought to the surface and then extracting the DNA and targeting a microbial (16S rRNA) gene region followed by high-throughput sequencing and bioinformatics analyses (Philippe et al., 2015; Pawlowski et al., 2016b). By treating the resulting amplicon sequence variant (ASV) count data similarly to macrofaunal count data and taking into account its compositional nature (e.g., transforming to relative abundance or centered-log ratio), it is then possible to discern differing levels of benthic enrichment using de novo ecological grouping or machine learning approaches (refer: Keeley et al., 2018; Cordier et al., 2020). Although most of the knowledge to date stems from soft sediments, the small, ubiquitous, highly abundant, and diverse nature of these organisms means that they should also be present in the deposited biofilms and/or flocculent layers that overlay most hard- and mixed-bottom substrates. If so, it may be possible to extract valuable information with respect to benthic enrichment from these challenging substrates; all that is required is to develop a means for effectively sampling the flocculent material from the top of hard substrates with varying slopes and uneven surfaces.
In this study, we tested a prototype Substrate-Independent Benthic Sampler (SIBS) device (Figure 1) that was purposely built to obtain such flocculent-derived eDNA samples. The main objective of the work was firstly to physically obtain adequate samples under semi-sterile conditions from a variety of substrates at relatively deep sites (i.e., between 50 and 120 m) and then secondly to test the assumption that the same microbial-based ecological signals could be derived from the thin veneers of flocculent material irrespective of substrate. If this was possible, the sensitivity with respect to conventional enrichment variables (i.e., sediment macrofauna) and grab sediment eDNA-derived bacterial indicators was then evaluated, with particular regard to distance from farms and between regions and farms. Thus, the overall aim of the study was to demonstrate the potential of this approach for obtaining quantitative environmental indicators of organic enrichment from hard-bottom habitats.
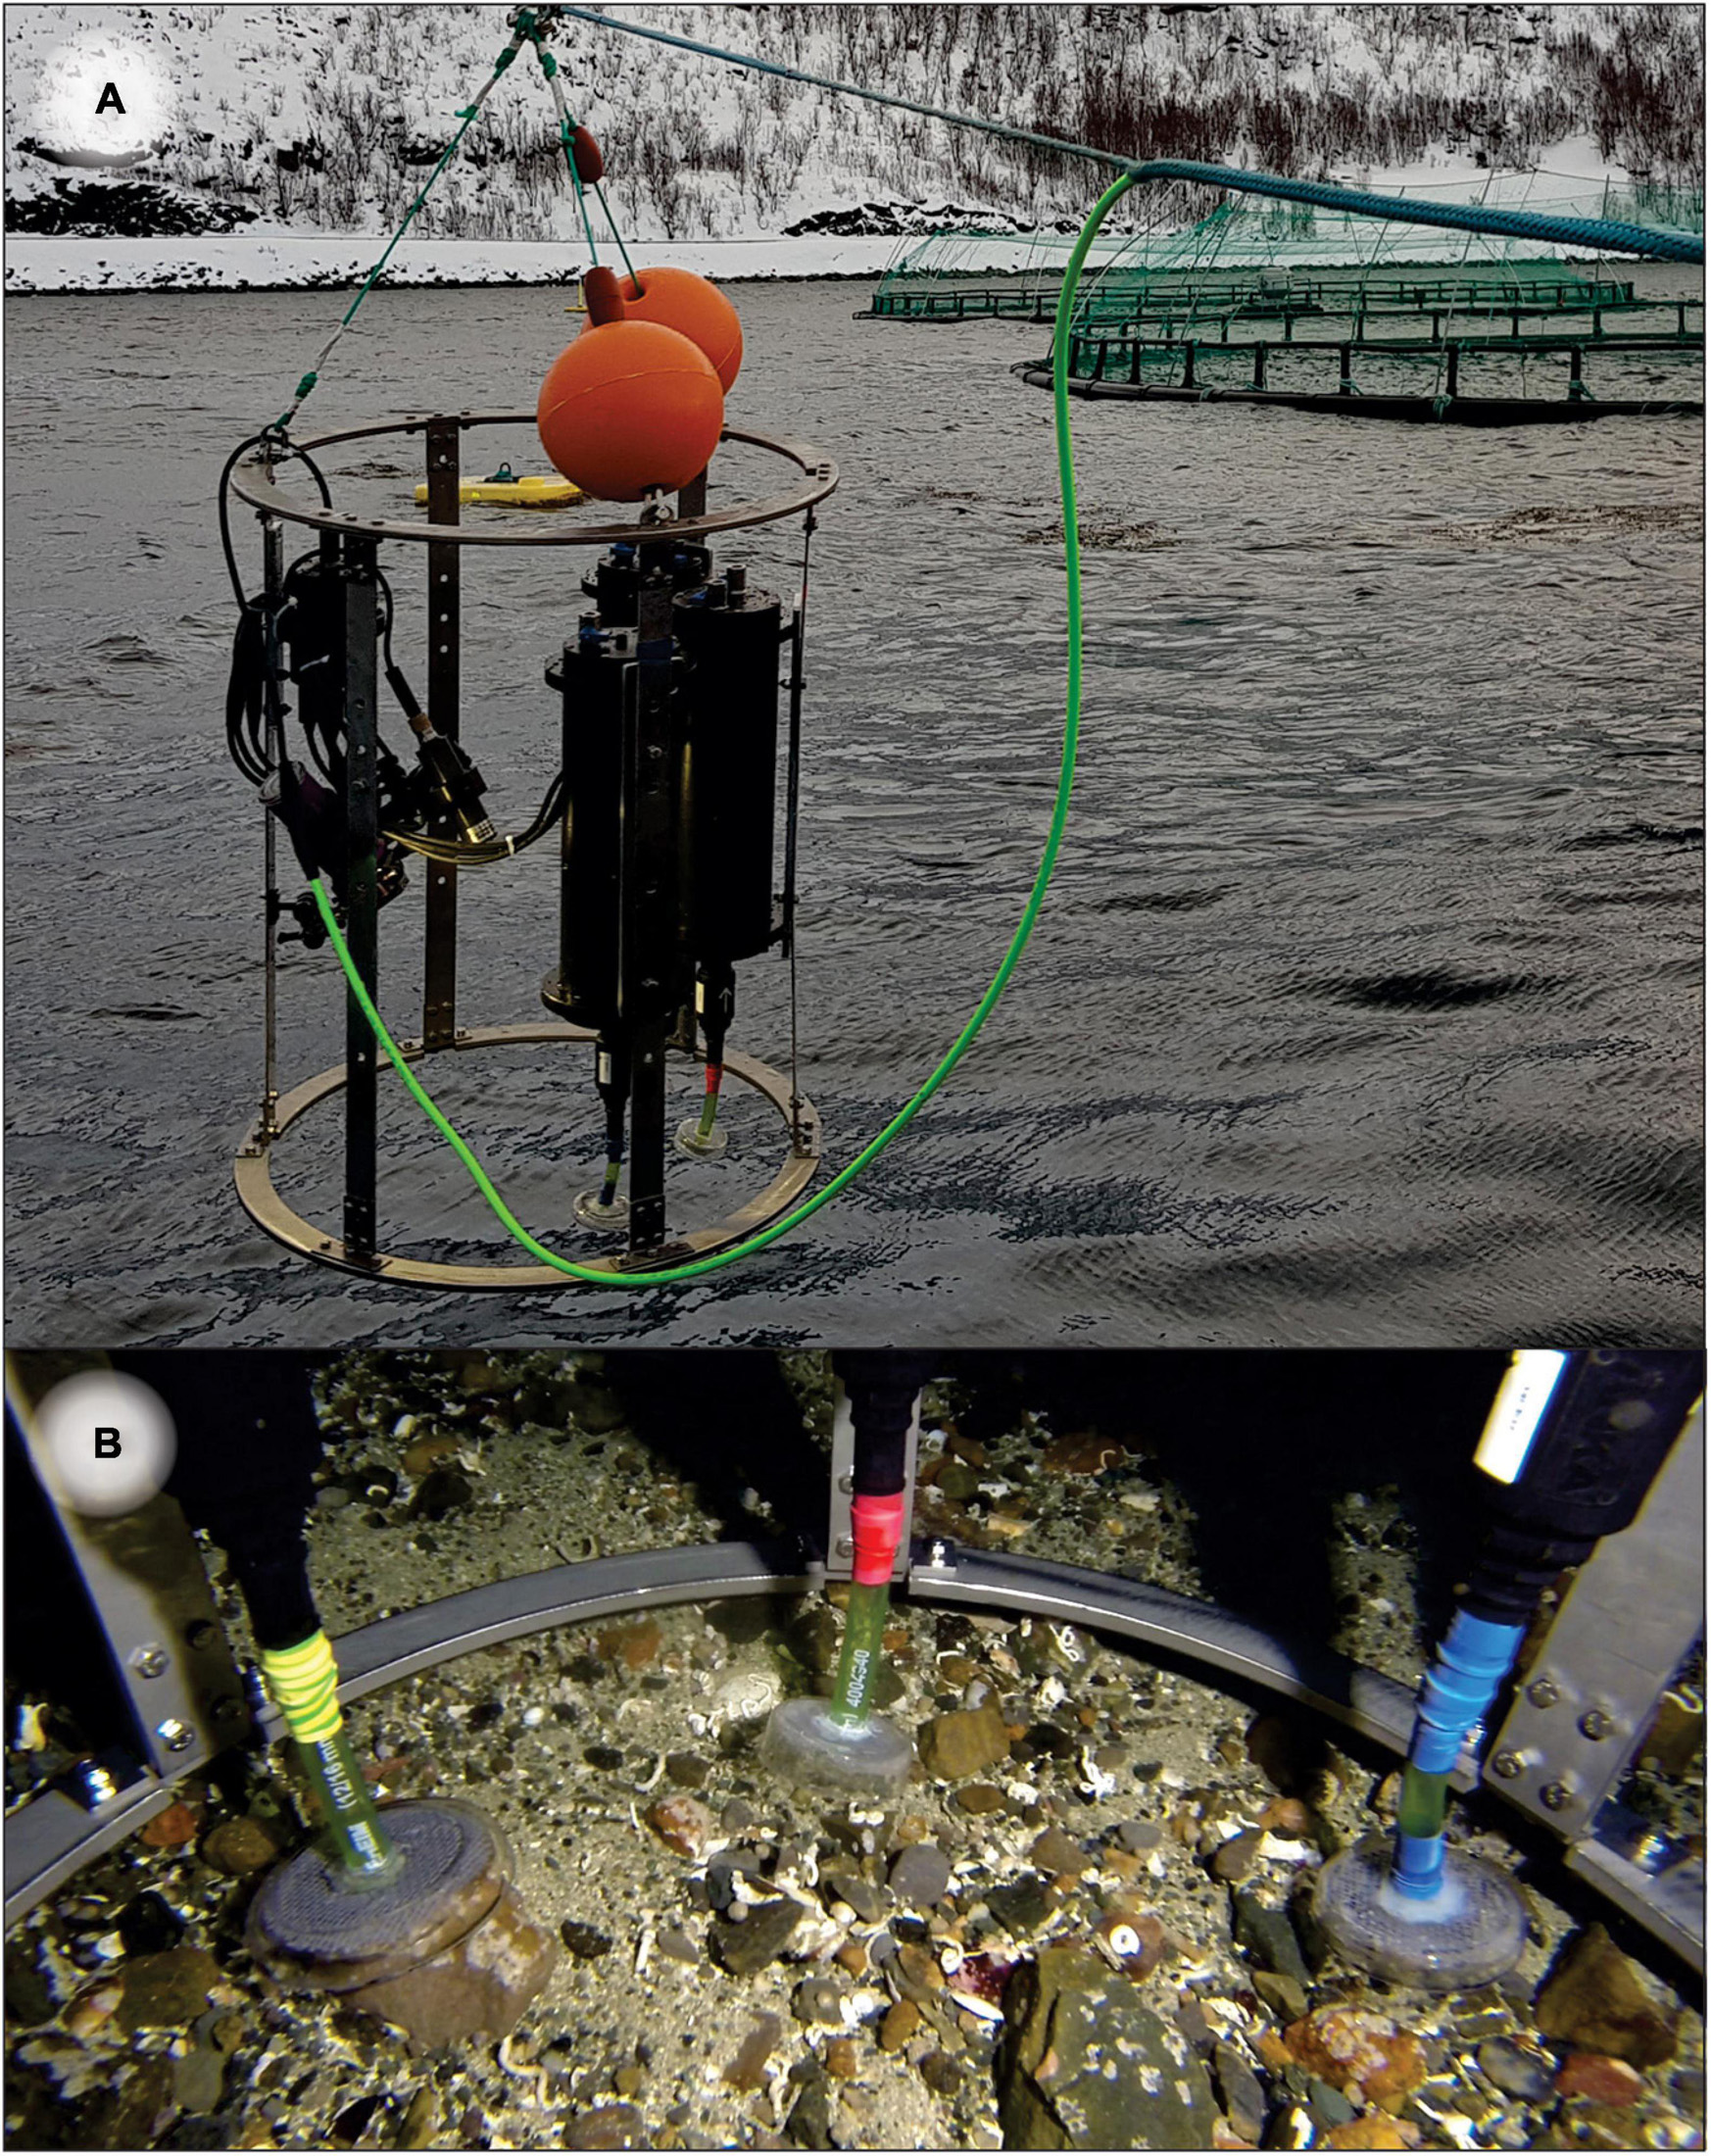
Figure 1. (A) Triplicate Substrate-Independent Sampling Devices (SIBS) mounted on a frame with video light and cabled and independent GoPro cameras. (B) Triplicate independently controlled sampling heads on seafloor.
Materials and Methods
Site Description and Sampling Arrangement
Benthic samples were collected from six salmon farms situated over hard and mixed-bottom habitats in northern (Vargsundet and Øksfjord, Figure 2A) and southern (Sognefjord, Figure 2B) fjords in Norway (Figure 2). The seabed beneath the southern sites (ca. 61° 30′ N; “South-A,” “South-B,” “South-C”) was predominantly steep solid bedrock with very low densities of conspicuous epibiota (Table 1). The rock surface was often covered with crustose coralline algae and a heterogeneous, thin layer of organic and/or inorganic sediments (Figure 3). The seabed beneath two of the northern farm sites, “North-C” and North-A, comprised three-dimensionally complex hard and mixed-bottom habitats typified by extensive patches of bedrock, boulders, gravel, and coarse and shell sand (Figure 3). Epifauna at North-A and North-C were relatively diverse with a heterogeneous coverage of sponges, ascidians, and a notable soft coral species, Drifa florida (Dunlop et al., In Review). North-B had a relatively flat seabed comprising mostly of gravel, with varying amounts of soft sediment either overlying the surface or within the gravel matrix (Table 1 and Figure 3). A moderately diverse epifauna community was evident beyond ca. 200 m of the cages, comprising sea stars, anemones, various ascidians, bryozoans, and small sponges (Dunlop et al., In Review). All six salmon farms were of moderate to high capacity in mid- to late stages of the production cycle, except for “South-C” which had been “fallowed” (all fish removed) 3 months prior. However, the seabed near the cages at South-C was still visibly highly impacted, evidenced by a thick layer of organic matter overlying rock, with white bacterial mats on the surface and outgassing on disturbance (Table 1 and Figure 3).
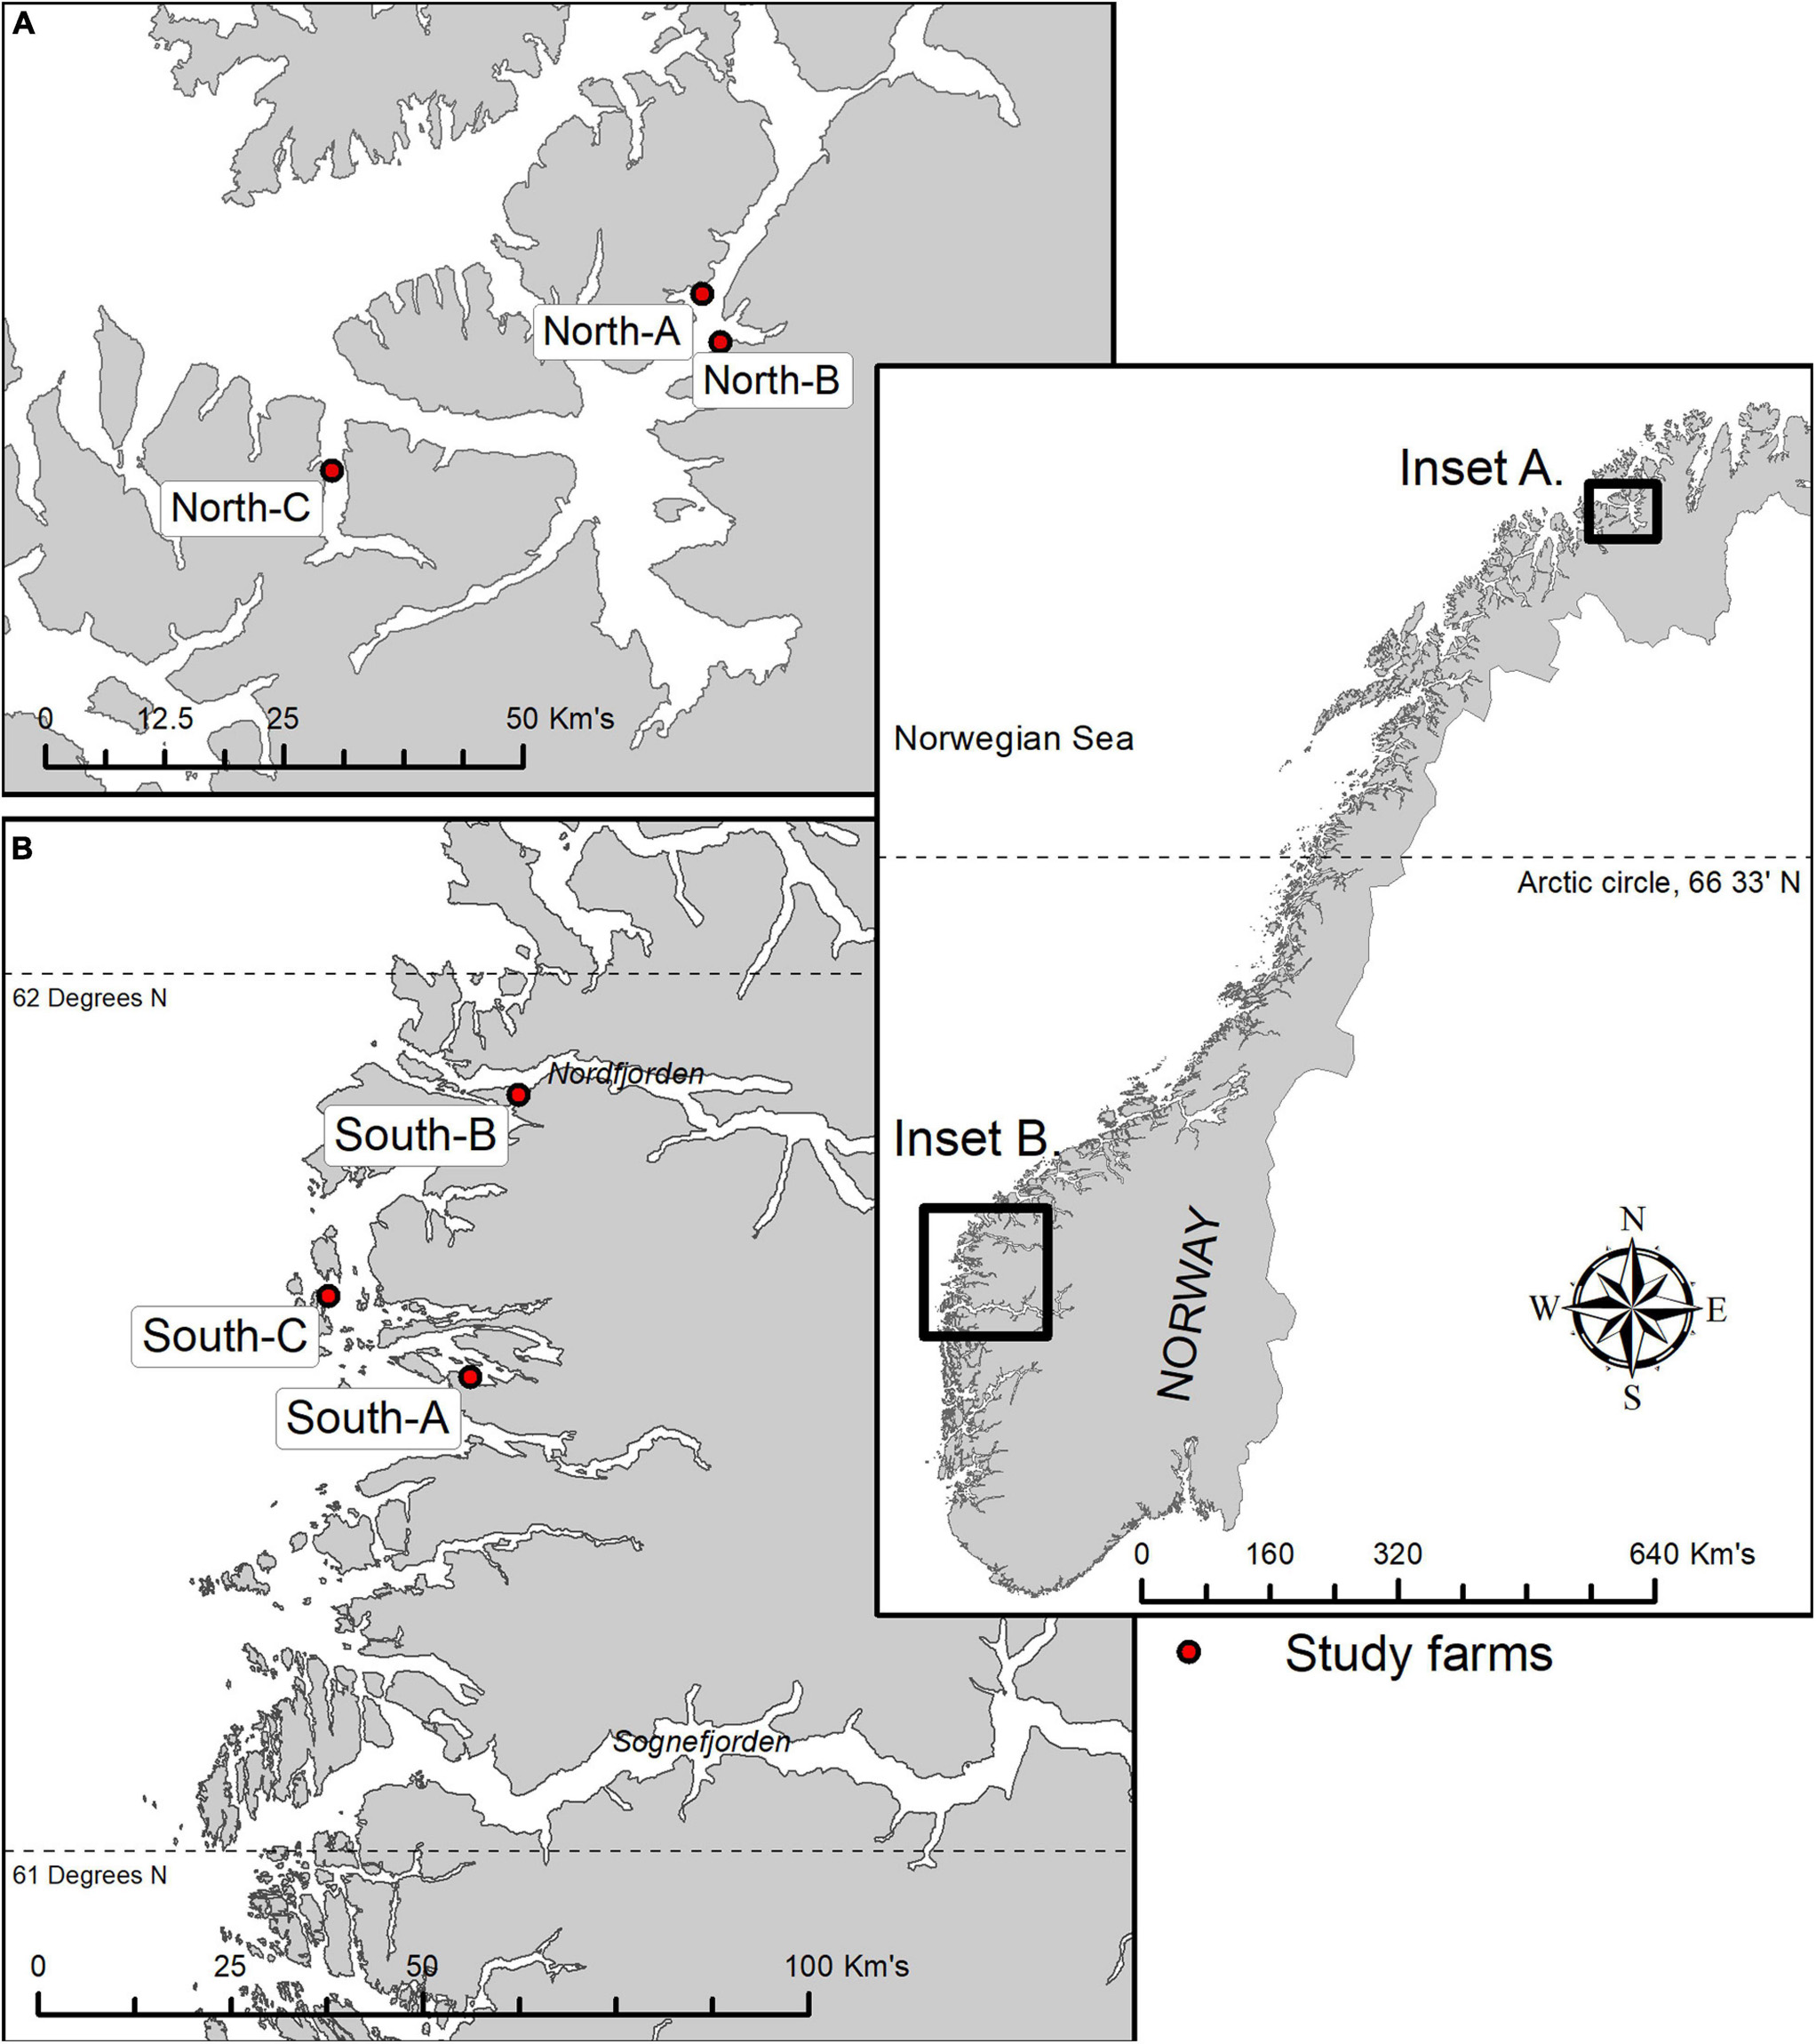
Figure 2. Location of six study farms along the Norwegian coastline; three in the northern Vargsund and Øksfjord regions (A) and three in the Southern Sognefjord region (B). See Table 1 for locations of sampling stations (distance) relative to farms, farm use, and visible level of effects at the time of sampling.
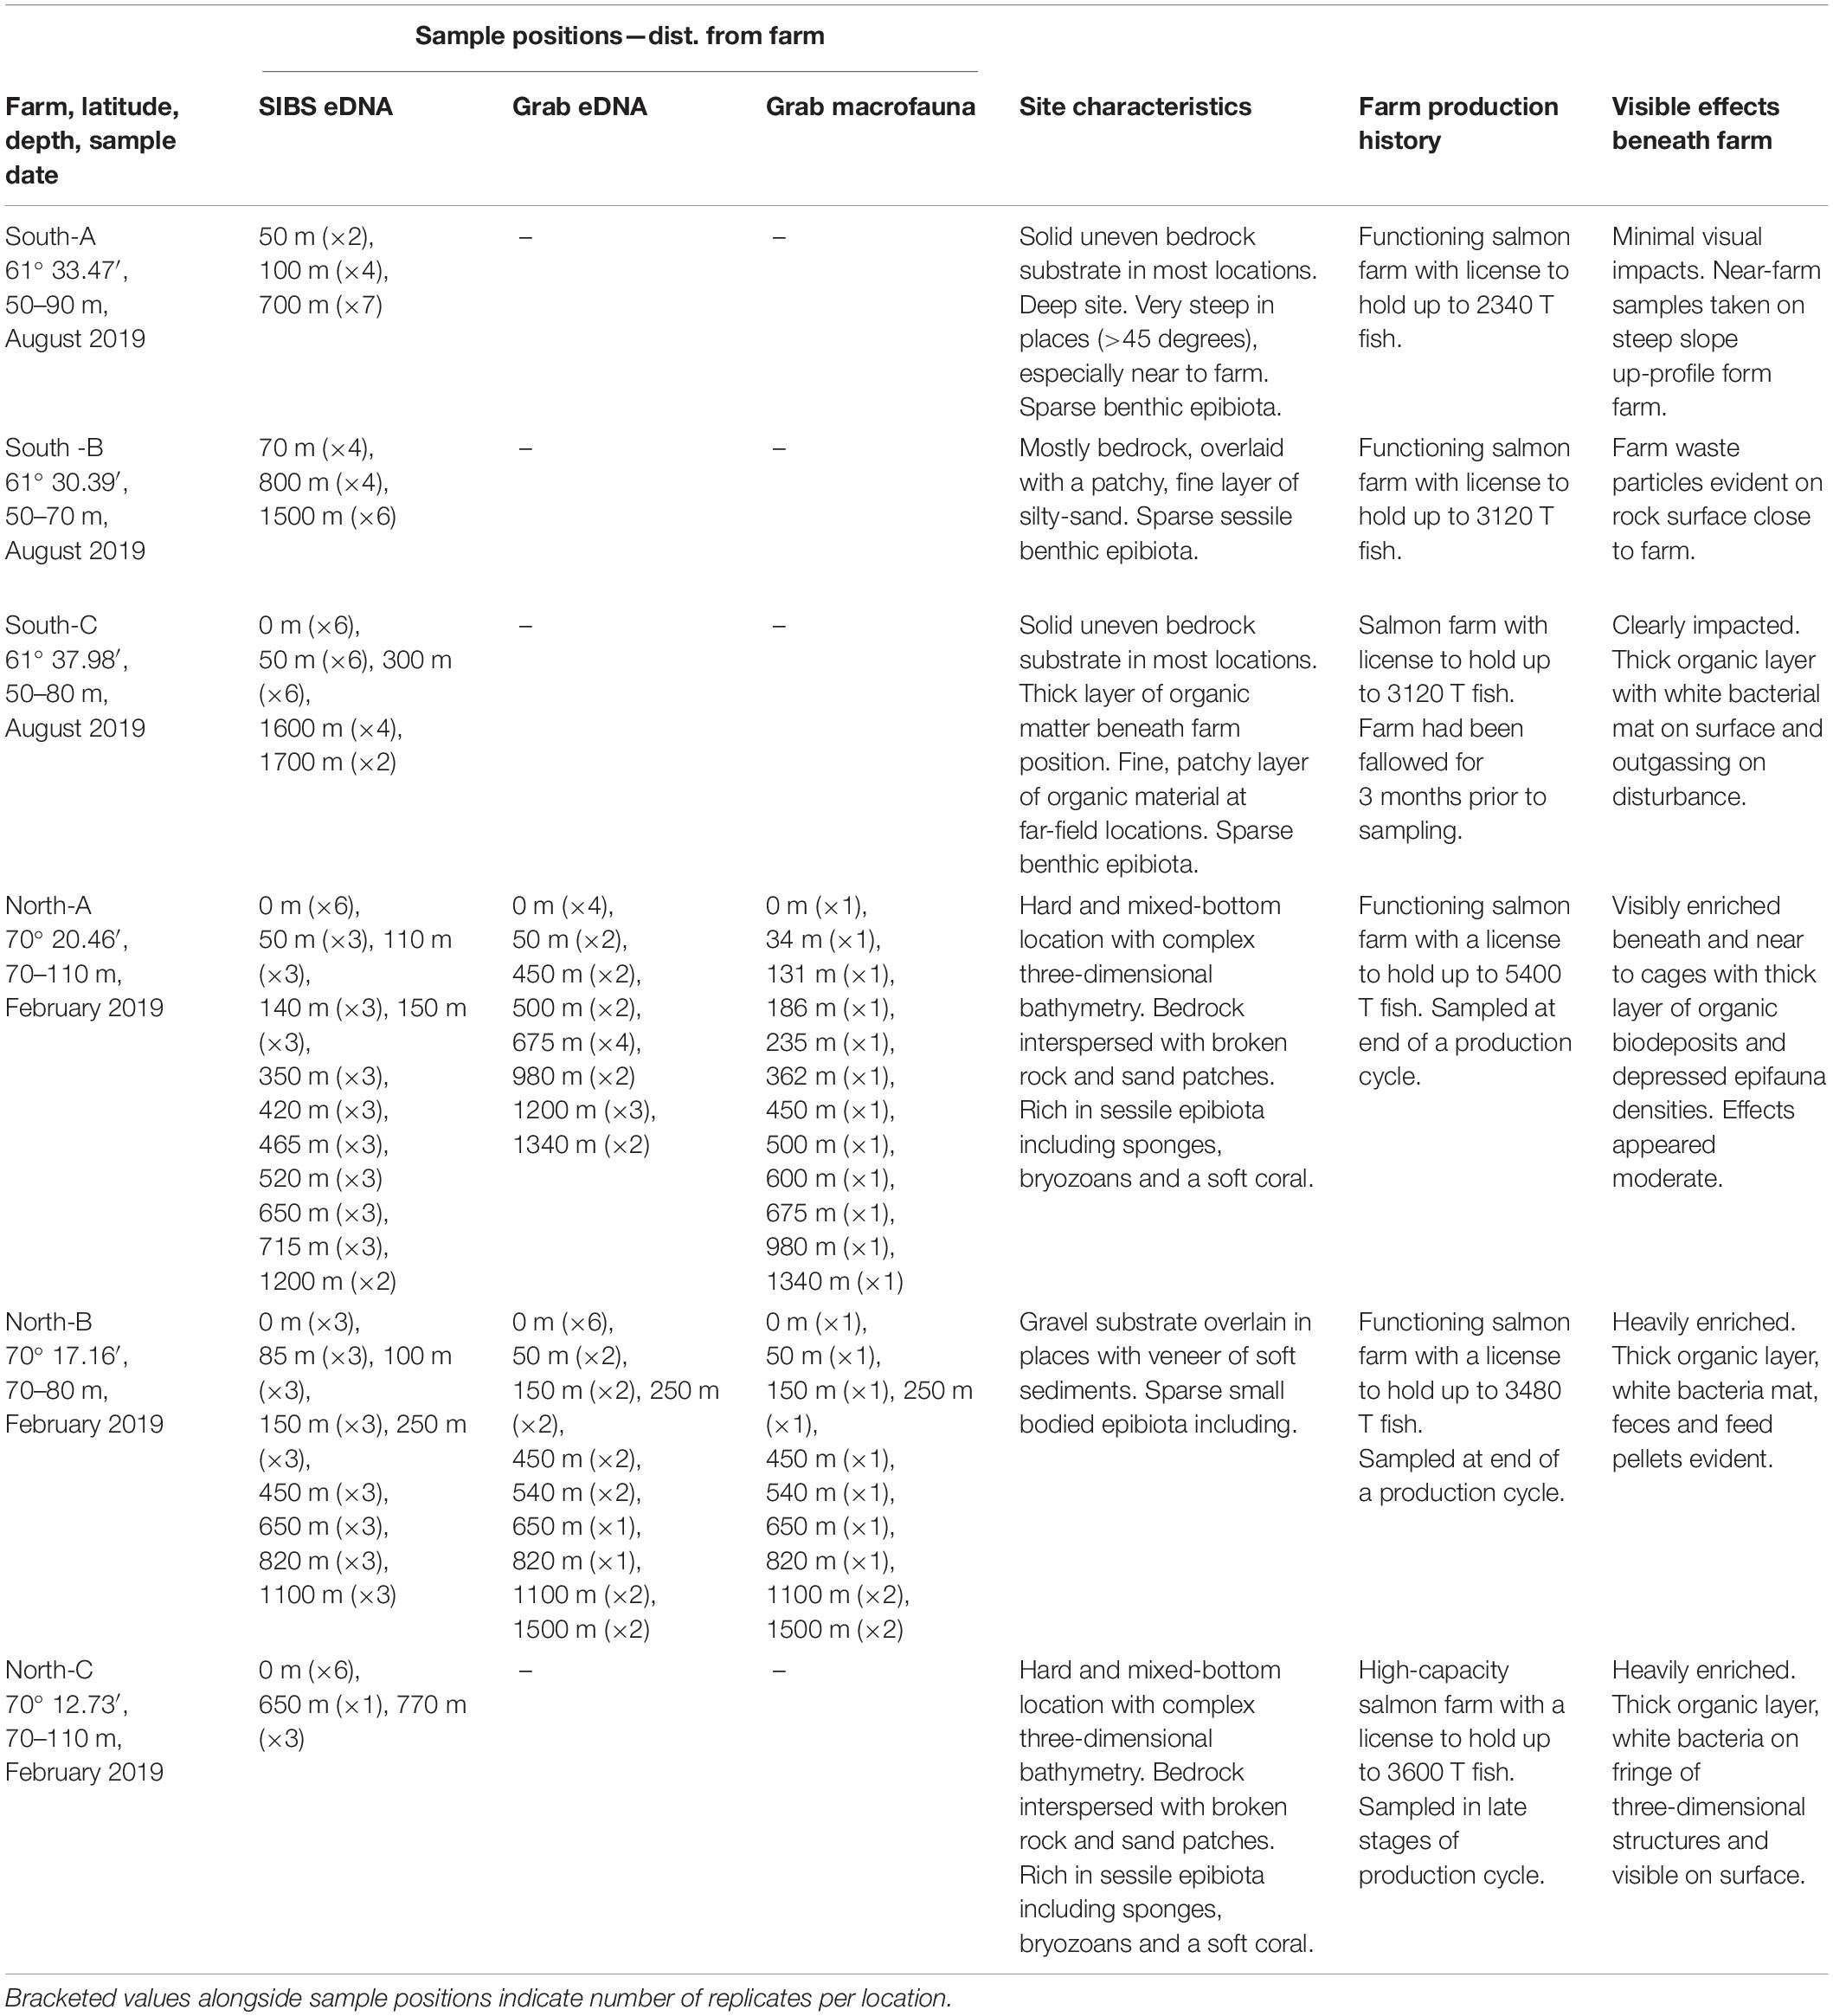
Table 1. Summary of study farm site characteristics, sampling stations, farm use, and visible level of effects at time of sampling.
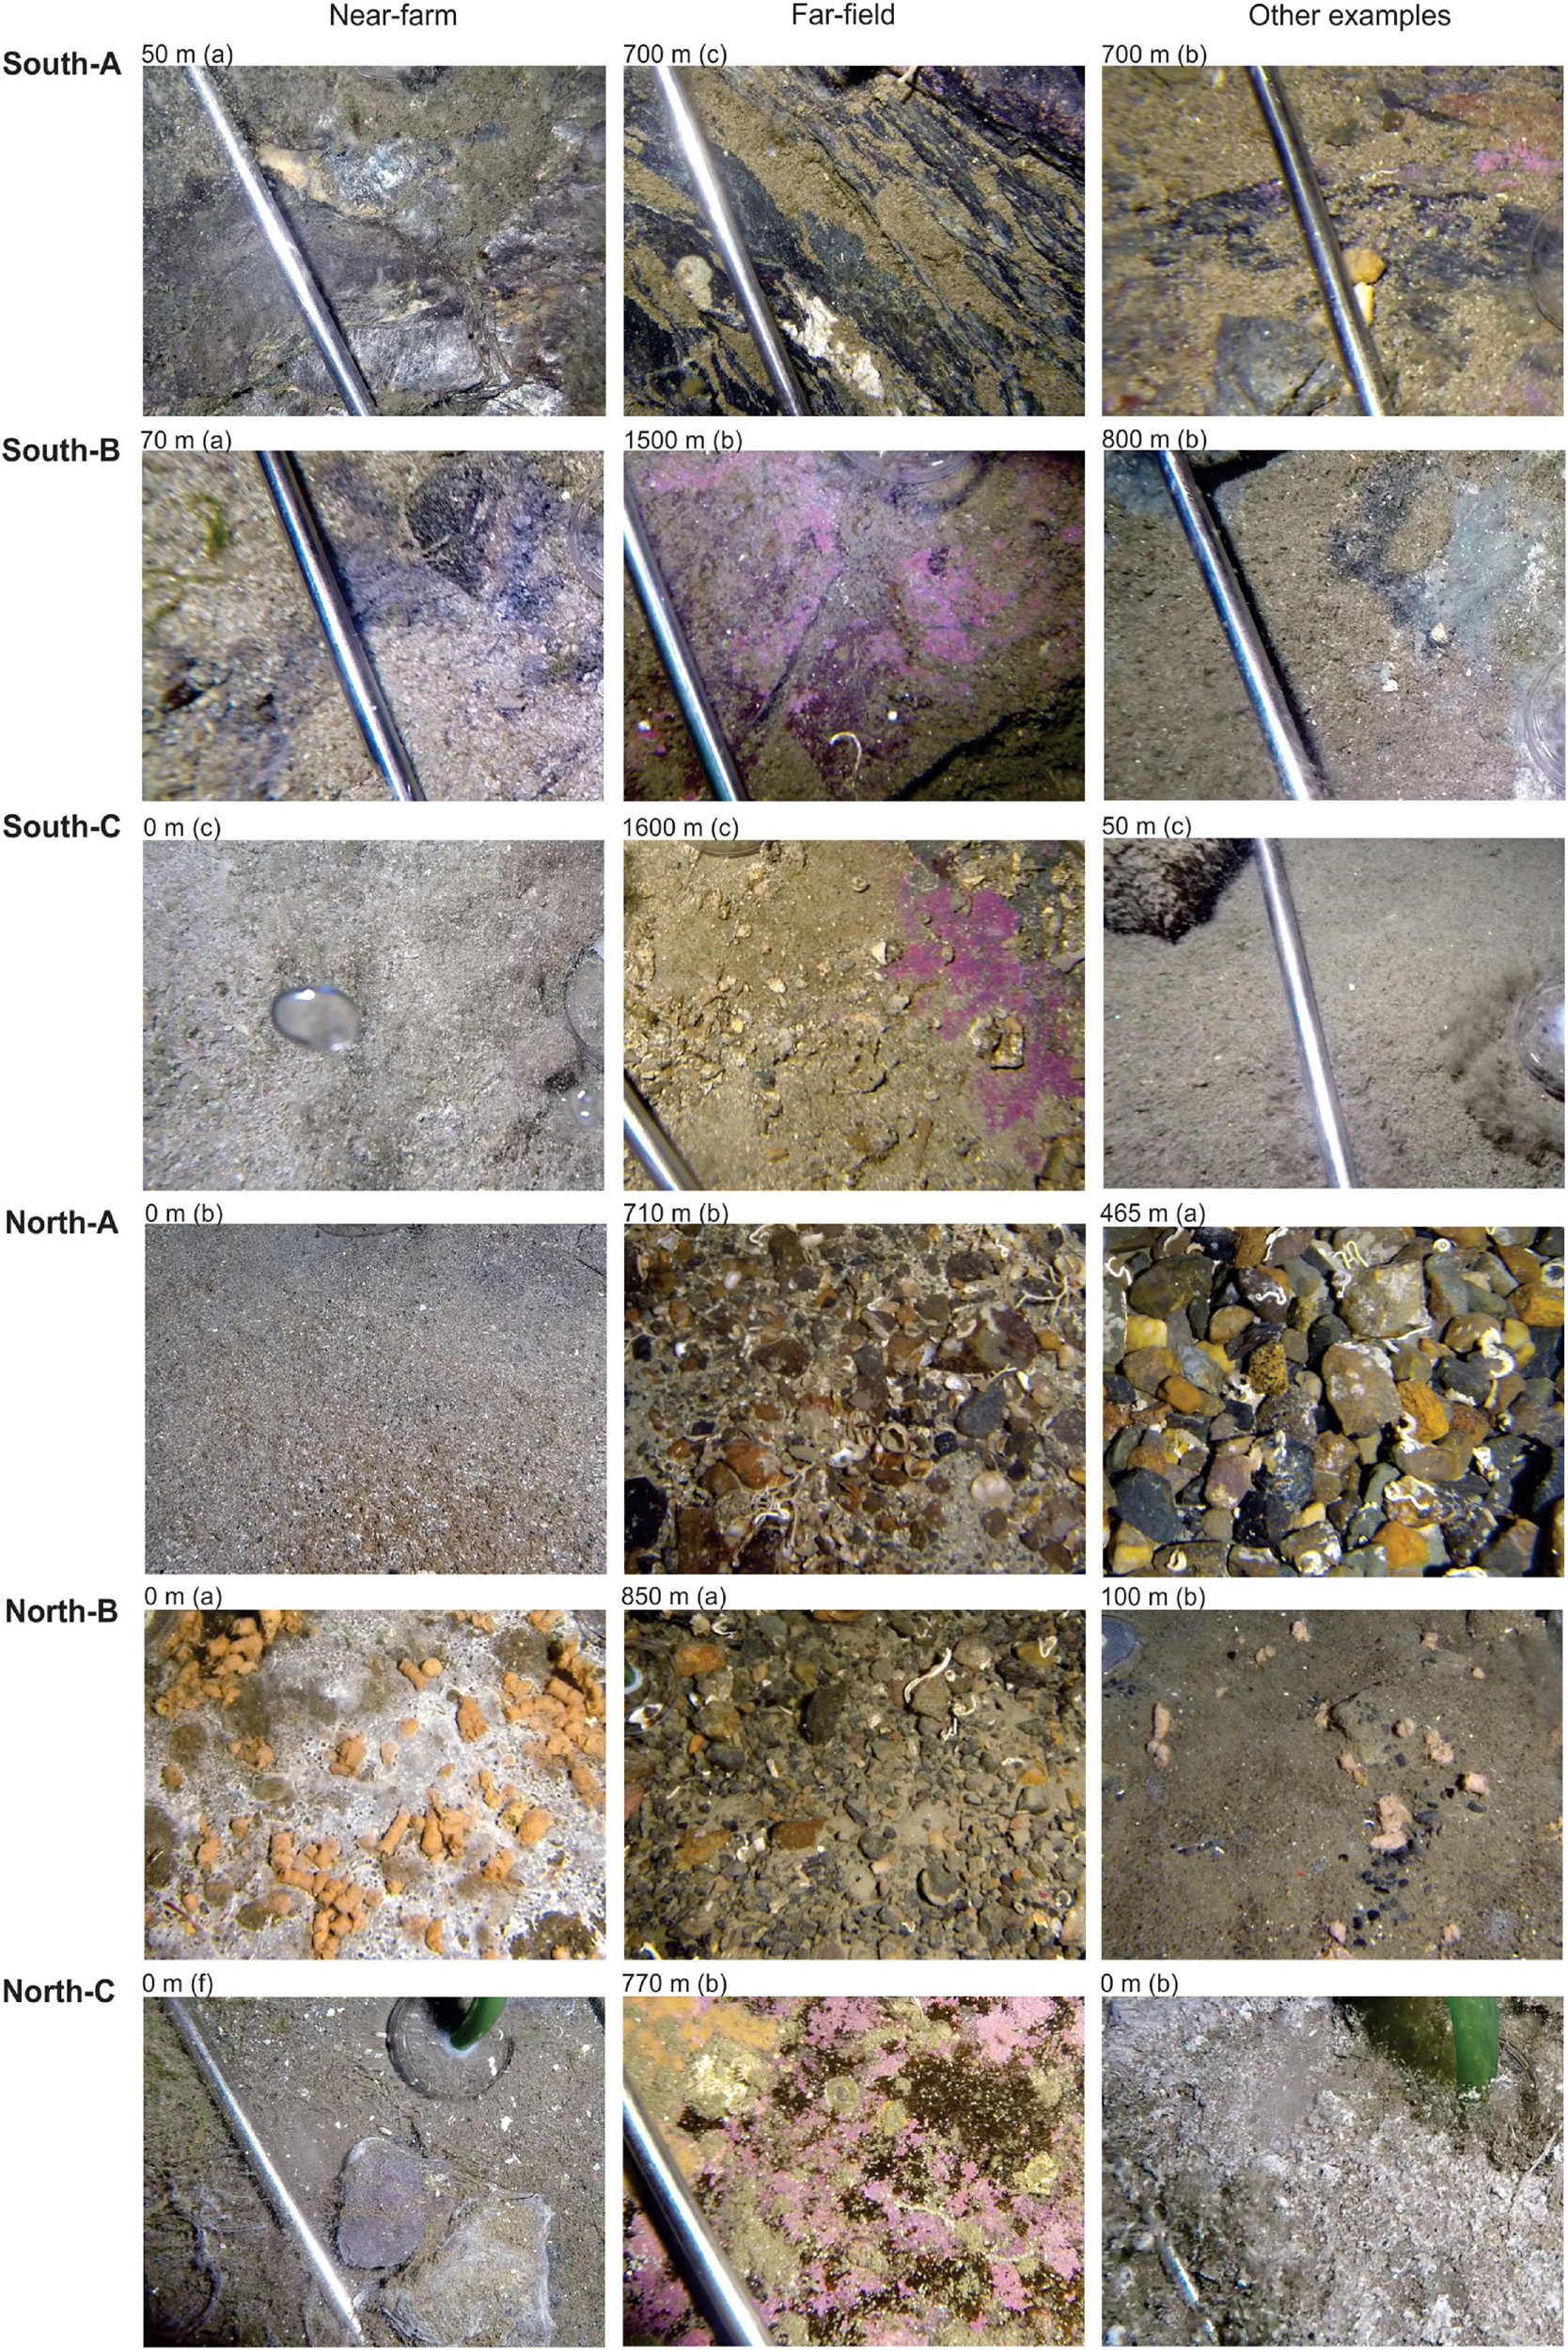
Figure 3. Representative images of benthic conditions and substrates from the Substrate-Independent Bottom Sampler (SIBS) sample sites beneath the six farms (“Near-farm”), from the more distant/natural locations (“Far-field,” >600 m from farm) and from another example location from the same farm (“Other examples”). Images were obtained from HD video collected just prior to or immediately after obtaining the sample, and the letter in parenthesis indicates the corresponding replicate sample.
At all farm stations, sampling effort was concentrated as much as possible in a single down-current direction or “transect,” away from the farm, within a consistent depth band that corresponded to the depth beneath the farm (Table 1). In most cases, this meant sampling following the coastline along a ca. 10–20-m-wide depth band between 50 and 110 m water depth. These “transects” formed the study gradients from which changes due to organic enrichment could be elucidated and sampling approaches compared.
Conventional Sediment Grab Sampling
Conventional grab samples were obtained using a large, heavily weighted 0.1-m2 Van Veen grab which maximized the chances of obtaining an adequate sample from the varied sediment types (mud, sand, shell sand, and gravel). A grab was determined to be successful when it contained at least 10-cm depth of relatively undisturbed sediment (sufficient for a macrofauna subcore), with minimal “drain-out” due to obstructions preventing the grab jaws from closing. At the three southern study farms, it was impossible to obtain any sediment grabs due to the prevalence of bedrock substrate. Grab sampling at farms North-A and North-B was facilitated by reference to high-resolution multibeam bathymetry images to select possible “pockets” of soft sediment to target, but obtaining sufficient samples was still difficult with a success rate of approximately 20%. This adversely impacted the placement of grabs with respect to the desired impact gradient, especially at North-A where 12 stations (Table 1) were ultimately sampled after approximately 3 days of attempts. At farm North-C, 20 successful grab samples were obtained from approximately 1.5 days of effort (data not shown). At farm North-B, approximately 50% of the grabs were successful (10 stations in total, Table 1) due to the flatter bottom and more conducive substrates.
Each successful grab was then subsampled for microbial eDNA and macrofauna. Firstly, 2–3 g of intact sediment (n = 45 samples) was obtained for eDNA analysis from two to three haphazardly determined locations across the surface (top 1–2 cm) of the grab (constrained to the least disturbed part of the grab) using a small sterile scoop into 3-ml Eppendorf tubes, which were immediately placed in a –20 freezer for transportation to a –80°C freezer where they remained until DNA extraction. For macrofauna (n = 24 samples), the sediment volume of the grab was roughly quantified and then transferred to a large sieve. The material retained on the 1-mm mesh was preserved with buffered 4% formalin. A full taxonomic investigation was conducted by a certified taxonomy laboratory, whereby all macrofauna were stained using Rose Bengal, picked out, counted, and identified to the lowest possible taxonomic level. The paired eDNA and macrofaunal samples from the same grab from North-A and North-B form the basis for the comparisons in Section “Analysis 2: Conventional grab samples versus SIBS and relationship to macrofauna.”
SIBS Device and Sampling Procedure
A total of 131 substrate-independent benthic samples of mobile flocculent organic and inorganic sediments overlying hard and mixed-bottom substrates were obtained using a custom-built sampling device (hereafter referred to as “SIBS,” Figure 1A and Table 1). The SIBS operates off ambient pressure changes and when triggered creates a rapid, high-velocity suction of approximately 0.3–0.8 liters of fluid into a chamber through a suction head (Figure 1B), which constitutes the “sample.” The velocity of the intake is such that any mobile particles are mobilized and effectively “hovered” up from the rocks, and along with some very-near-bottom seawater. The sample is retained in a tough, sterile 1627-mL Whirl-PakTM sample bag (Nasco, WI, United States), which upon surfacing is removed from the sampler and immediately transferred, by suction filtering onto a 47-mm Whatman® GFC filter (pore size 1.2 μm), which was in turn cut in half under sterile conditions (to give two duplicate samples—one as a backup) and then stored in a 1.5-mL Eppendorf tube containing 1 mL of DNA/RNA-ShieldTM isolation buffer (Zymo Research, CA, United States). For large or particularly concentrated samples, the aliquot was homogenized and subsampled to minimize clogging of the filters. Additional filtration trials were also conducted using a smaller (0.2 μm) filter pore size, but these clogged almost immediately and therefore only allowed for a very small volume to be filtered (data not shown). Our compromise was to use a slightly larger (1.2 μm) filter pore size, enabling complete filtration of collected samples. We considered this approach optimal, and it easily captured adequate material for analysis, which is also supported by recent studies showing that larger pore filters can be as informative as smaller pore filters in detecting rare eDNA targets from environmental water samples (Wittwer et al., 2018; Sepulveda et al., 2019).
Triplicate SIBS devices were mounted on a single frame along with a Keldan Video 4X FLUX 8000 Lumen video light, a junction box that houses the control electronics, and a 12VDC 700TVL analog bullet camera. To collect the samples, the SIBS was lowered to the seabed on a stressed underwater cable (Falmat Xtreme Green) with the aid of the bullet camera which was cabled to a surface LCD monitor. Each of the triplicate sampling chambers were independently triggered once an appropriate sampling position was achieved, at which point the GPS position was recorded. The sampling procedure was also recorded on a GoPro Hero 4 or 5 camera for retrospective analysis and revision of substrate characteristics and sample effectiveness, and to obtain still images of the seabed (Figure 3). The suction heads were covered with a 2-mm gauze mesh to prevent uptake of large particles and/or clogging, which enabled samples to be successfully taken from almost any substrate (mud or sludge, shell sand, gravel, or bedrock, Figure 3). Regular sample blanks were taken from SIBS samples of surface seawater and by filtering RO water to check the microbial baseline. A retrospective analysis of the videos was undertaken to classify each station in terms of substrate types and visual appearance using the following four grouping categories: (i) the type of base substrate (factor “BaseSubst”); (ii) type of mobile substrate overlying base substrate, i.e., the sampleable material: (factor “MobileSubst”); (iii) the extent and composition of flocculant material (factor “FlocCovExt”); and (iv) qualitatively assessed level of visual impact (factor “VisImpactCat”) using expert judgment and a preestablished scale from 1 (being clean, natural) to 5 (being highly enriched, excessive organic material, and formation of white bacteria).
Molecular Analyses
DNA Extraction
Sediment samples (n = 45) were homogenized with a sterile stainless-steel micro-spatula (soaked in 10% bleach solution for a minimum of 5 min before each extraction session and sterilized with ETOH flaming and rinsed with ddH2O between each sample), subsampled for 0.25 g, and processed with the DNeasy PowerSoil kit (QIAGEN, CA, United States) following the manufacturer’s protocol.
Due to their different nature, SIBS samples (n = 131) and filtered surface seawater controls (n = 16) were processed with a custom protocol using the Zymo Quick-DNA/RNA Miniprep kit (Zymo Research, CA, United States). Filters were first transferred to ZR bashing bead lysis tubes (mix of 0.1- and 0.5-mm beads; Zymo Research, CA, United States). The initial collection tubes containing DNA/RNA-Shield isolation buffer and the remaining sediment were centrifuged at 14,000 g for 2 min. The supernatant was discarded, and approximately 0.25 g of sediment pellet was transferred to the corresponding bashing bead tubes and 400 μL of DNA/RNA Lysis Buffer (first step of Zymo kit) was added. Bead beating was performed with a 1600 MiniG at maximum speed (1500 strokes/minute) for 2 min. The bashing bead tubes were centrifuged at 10,000 g for 1 min and the supernatant (up to 400 μL) transferred to a new 2-mL sterile microcentrifuge tube. The remainder of the DNA/RNA co-extraction procedure followed the manufacturer’s protocol. DNA purity was measured with a Nanophotometer (Implen, Munich, Germany) and integrity assessed on 1.5% agarose gels. Total RNA samples were stored at –80°C for future studies. To assess potential cross-contamination, extraction blanks (substrate replaced by double-distilled water [ddH2O]) were included throughout.
Library Preparation
DNA extracts from both sediment and floc samples were PCR-amplified for a segment of the V3–V4 region of the 16S ribosomal RNA (16S rRNA) gene (approximately 450 base pairs [bp]) using the forward S-D-Bact-0341-b-S-17: 5′-CCT ACG GGN GGC WGC AG-3′ and reverse S-D-Bact-0785-a-A-21: 5′-GAC TAC HVG GGT ATC TAA TCC-3′ primers from Klindworth et al. (2012), modified to include IlluminaTM overhang adaptors (5′-TCG TCG GCA GCG TCA GAT GTG TAT AAG AGA CAG-3′ and 5′-GTC TCG TGG GCT CGG AGA TGT GTA TAA GAG ACA G-3′ for the forward and reverse primers, respectively).
Each PCR reaction was done in a total volume of 36.5 μL, consisting of 20 μL of AmpliTaq Gold® 360 PCR Master Mix (Life Technologies), 8 μL of ddH2O, 1 μL of each primer (10 μM, IDT, IA, United States), 5 μL of GC enhancer (Life Technologies), and 1.5 μL of template DNA. The reaction cycling conditions were 94°C for 3 min, followed by 30 cycles of 94°C for 30 s, 52°C for 30 s, 72°C for 1 min, with a final extension step at 72°C for 5 min. Each PCR included a negative control (no template sample, n = 8 in total) to ensure the absence of cross-contamination. DNA extraction blanks (n = 13) were also subjected to PCR analysis to account for background bacterial contamination of DNA extraction kits, and a double-distilled water [ddH2O] blank (n = 3 in total) was added in each sequencing library.
Amplicon purification and normalization (1 ng/μL) were performed with the SequalPrepTM Normalization plates (Invitrogen, CA, United States), following the manufacturer’s instructions. Samples were sent to Auckland Genomics (University of Auckland, New Zealand) for indexing with the NexteraTM DNA library Prep Kit (Illumina, CA, United States), followed by pooling into three libraries (AG0246-3: floc samples of 2018, AG0246-13: floc samples of 2019, and AG0246-30: sediment samples of 2019) and paired-end (2 × 250 bp) sequencing on a IlluminaTM MiSeq. Sequences are available from the NCBI Sequence Read Archive (SRA) under project number PRJNA578643.
Bioinformatics and Preprocessing Analyses of 16S rRNA Data
Demultiplexed fastq files were quality filtered, denoised, merged, and chimera filtered per library with the DADA2 R program (version 1.14; Callahan et al., 2016). Prior to quality filtering, primers were trimmed using cutadapt (version 2.6; Martin, 2011) allowing no insertion or deletion and requiring a minimum overlap of 15 bp. Additionally, the forward and reverse reads were truncated at 226 and 220 bp on the 5′-end to remove the lower-quality section of the reads and reduce read lost during quality trimming. Quality filtering and denoising were performed using default parameters and merged using a perfect minimum overlap of 10 bp. Chimeric sequences were identified and removed using the “consensus” method in DADA2, which by default discards sequences found as potential chimera in at least 90% of samples. Taxonomic assignment was performed with DADA2 assignTaxonomy function using the RDP Naïve Bayesian Classifier algorithm (Wang et al., 2007) with default parameters and trained on the SILVA 16S rRNA database (version 132 clustered at 99% similarity; Quast et al., 2012).
Prior to data analysis, sequences found in negative controls, including DNA extraction blanks, PCR, indexing, and sequencing blanks, were examined (Supplementary Tables 1, 2) and processed, per library, with the MicroDecon R package (1.0.2; McKnight et al., 2019), to remove contaminant reads. Non-bacterial sequences and those unidentified at kingdom level were further discarded. To reduce the risk of including artifactual ASVs within each dataset, sequences with less than two reads and/or found in less than three samples were discarded. Sampling depth per sample was visualized with the rarecurve function of the vegan R package (version 2.5.6; Oksanen et al., 2014; Supplementary Figure 1). Samples with less than 4,000 reads were discarded.
Analytical Design and Statistics
The data were divided and analyzed in three ways: firstly, all SIBS samples from all six farm locations were analyzed with respect to distance from farm, differences between farms and regions, and the effect of the four visually assessed substrate and impact level factors (Analysis 1, Results section “Analysis 1: Microbial eDNA from SIBS with distance and substrate factors”). The second analysis utilized all types of samples from the more intensively studied northern farms (North-A and North-B) and compared macrofaunal count data with eDNA sediment samples from conventional grabs, and then compared SIBS eDNA data with sediment eDNA data with regard to substrate factors and environmental variables (Analysis 2, Results section “Analysis 2: Conventional grab samples versus SIBS and relationship to macrofauna”). Finally, an analysis was conducted on the SIBS data from the southern farms (South-A to -C) which were principally from bedrock and for which no other environmental data was obtainable (Analysis 3, Results section “Analysis 3: Application to pure hard-bottom sites”).
Macrofaunal biotic indices AZTI Marine Biotic Index (AMBI), Shannon–Weiner diversity (H′), Indicator Species Index (ISI), Norwegian Sensitivity Index (NSI), Norwegian Quality Index (NQI1), and the infauna trophic index (ITI) were calculated from the assemblage count data using the BBI (v0.3.0) function in R. An assessment of overall Enrichment Stage (ES; utilizes an enrichment spectrum from 1 (prstine) to 7 (anoxic/azoic): Keeley et al., 2012a) was calculated directly from the microbial eDNA ASV read abundance data using a preestablished GeneCode-ID library developed from sediment microbial eDNA around New Zealand salmon farms (Keeley et al., 2018; Pochon et al., 2020). At the time of writing, the GeneCode-ID library contained 395 microbial ASVs that have been consistently and repeatedly associated with certain enrichment states and accordingly assigned a corresponding Eco-Group I to V—akin to assignments for macrofauna as per Borja et al. (2000) and Keeley et al. (2012b) and subsequently for microbial eDNA (Keeley et al., 2018). The relative proportions of these Eco-Groups within a given sample are used to calculate the bacterial-Metabarcoding Biotic Index (b-MBI, see Keeley et al., 2018), which is directly relatable to Enrichment Stage (ES).
Analysis 1
Microbial eDNA ASV abundance data from all SIBS samples at all six study farms were “compositionally” transformed within the phyloseq package (version 1.30; McMurdie and Holmes, 2013) to standardize between samples. Four different ordinations were created using distance matrices: presence/absence (distance = “jaccard,” binary = True), auto-transformed Bray–Curtis (distance = “bray”), UniFrac (distance = “UniFrac”), and weighted UniFrac (distance = “wUniFrac”) (Lozupone and Knight, 2005). Sample similarities were represented using NMDS with associated two-dimensional stress using the plot_ordination function of phyloseq. Significant community differences between groups were obtained by permutational analysis of variance (PERMANONVA) using the adonis function (Vegan, R) with the same distance matrices. “Distance” (distance from farm, m) as a continuous variable and categorical factors “Farm” and “Region” (South, North) were contrasted to give an impression of sources of spatial variability in relation to enrichment effects (i.e., [Distance matrix] ∼ Region/Farm ∗ log(Distance + 1)). Subsequently, PERMANOVAs were constructed to test for the influence of the four substrate types and visual appearance categorical factors. The potential influence of substrate factors was displayed visually using NMDS and the ordisurf function, whereby Distance was plotted as a two-dimensional surface using the ordisurf function (Vegan, R) and the similarities according to the same four substrate types and visual appearance categories were displayed by color coding the symbols on the nMDS surface plot.
Analysis 2
Grab sediment microbial eDNA ASV data from farms North-A and North-B were compared to the corresponding macrofaunal count data. Macrofauna data were square-root transformed to reduce the influence of most numerous taxa, and the microbial eDNA data underwent compositional transformation prior to a Bray–Curtis dissimilarity matrix being generated for both datasets. Relative similarities between sampling stations and Farms were displayed using NMDS with geom_path lines overlaid to emphasize the trends with respect to distance from farm along the gradients. Correlation vectors showing the 5 most highly correlated variables [macrofauna AMBI, total abundance (S), NQI1, H’, and log-transformed distance from farm (logDist)] was generated and displayed using the bioenv and envfit procedures in Vegan (R). A simple procruste rotation between two sets of points was used to compare the grab sediment macrofauna and microbial ASV ordinations with associated protest scores. The proportion of shared genera between near-farm (0–100 m) and distant-farm (800–1100 m) samples and between sample types (SIBS versus sediment) was visualized with Venn diagrams using the eulerr R package (version 6.1.0; Larsson, 2019).
The optimal ordination method from Analysis 1 (weighted UniFrac) was used to contrast differences in the North-A and North-B farm dataset with respect to the effect of sample type (microbial eDNA from grab sediment versus microbial eDNA from SIBS) versus the effect of Farm (North-A versus North-B) with respect to Distance (from farm) indicated by a two-dimensional surface on the same plots using the ordisurf function. ASVs most strongly correlated with the distribution of the ordination were determined using the NMDS “species” “scores” function in Vegan (R) and are indicated on the plot and listed in Supplementary Table 3. Two replicate NMDS plots were created to display the sample ordination in relation to the Distance factor as a two-dimensional surface, with visual reference to (i) the assessed Enrichment Stage (ES) for each eDNA sample as determined from the b-MBI score (see above) and (ii) the base substrate category for each sampling station. Finally, the relative influence of each of these factors (i.e., Farm, Source of sample, BaseSubsCat, and ES) was determined using a PERMANOVA model with the Adonis function in R.
Analysis 3
The final plot replicates the analysis used to generate the nMDS Distance surface plot as presented in Section “Relationship between SIBS and conventional sediment grabs” but includes only SIBS eDNA data and the calculated b-MBI enrichment score from the three southern farms that had no other environmental information due to being situated over bedrock.
Results
High-Throughput Sequencing Data
A total of 19,256,199 reads were obtained from the 204 sequenced amplicons. Quality filtering, denoising, merging, and chimera removal reduced that number by 49% (9,984,074 reads), resulting in a mean number of 48,942 reads per sample (Supplementary Table 1). Removal of contaminant reads determined by MicroDecon (Supplementary Table 1) and of those either unassigned at Kingdom level or to a non-bacterial group reduced the number of reads by 0.55 and 0.19%, respectively. Discarding ASVs with less than two reads found in at least three independent samples further reduced reads by 20.4% (from 9,204,442 to 7,328,670) and ASVs by 91.29% (from 131,455 to 11,448). While sequencing depth was sufficient to recover most of the diversity within all samples (Supplementary Figure 1), four of them yielded low read counts (less than 4,000) and were removed from downstream analyses.
Analysis 1: Microbial eDNA From SIBS With Distance and Substrate Factors
Preliminary assessment of samples obtained with the SIBS showed good congruence with respect to distance from farm and associated expected enrichment levels (Figure 4). The weighted UniFrac ordination best elucidated the differences between samples and respective groups, with 37% of variability remaining unexplained (Table 2). Of the explained variance, Distance as a continuous explanatory variable explained the most (27.5%), followed by Region (13.2%) and then Farm nested within Region (11.2%). By comparison, the total unexplained variation for unweighted UniFrac, Bray–Curtis on transformed read abundances, and the binary presence–absence data ordinations were considerably greater (56–64%, increasing in corresponding order).
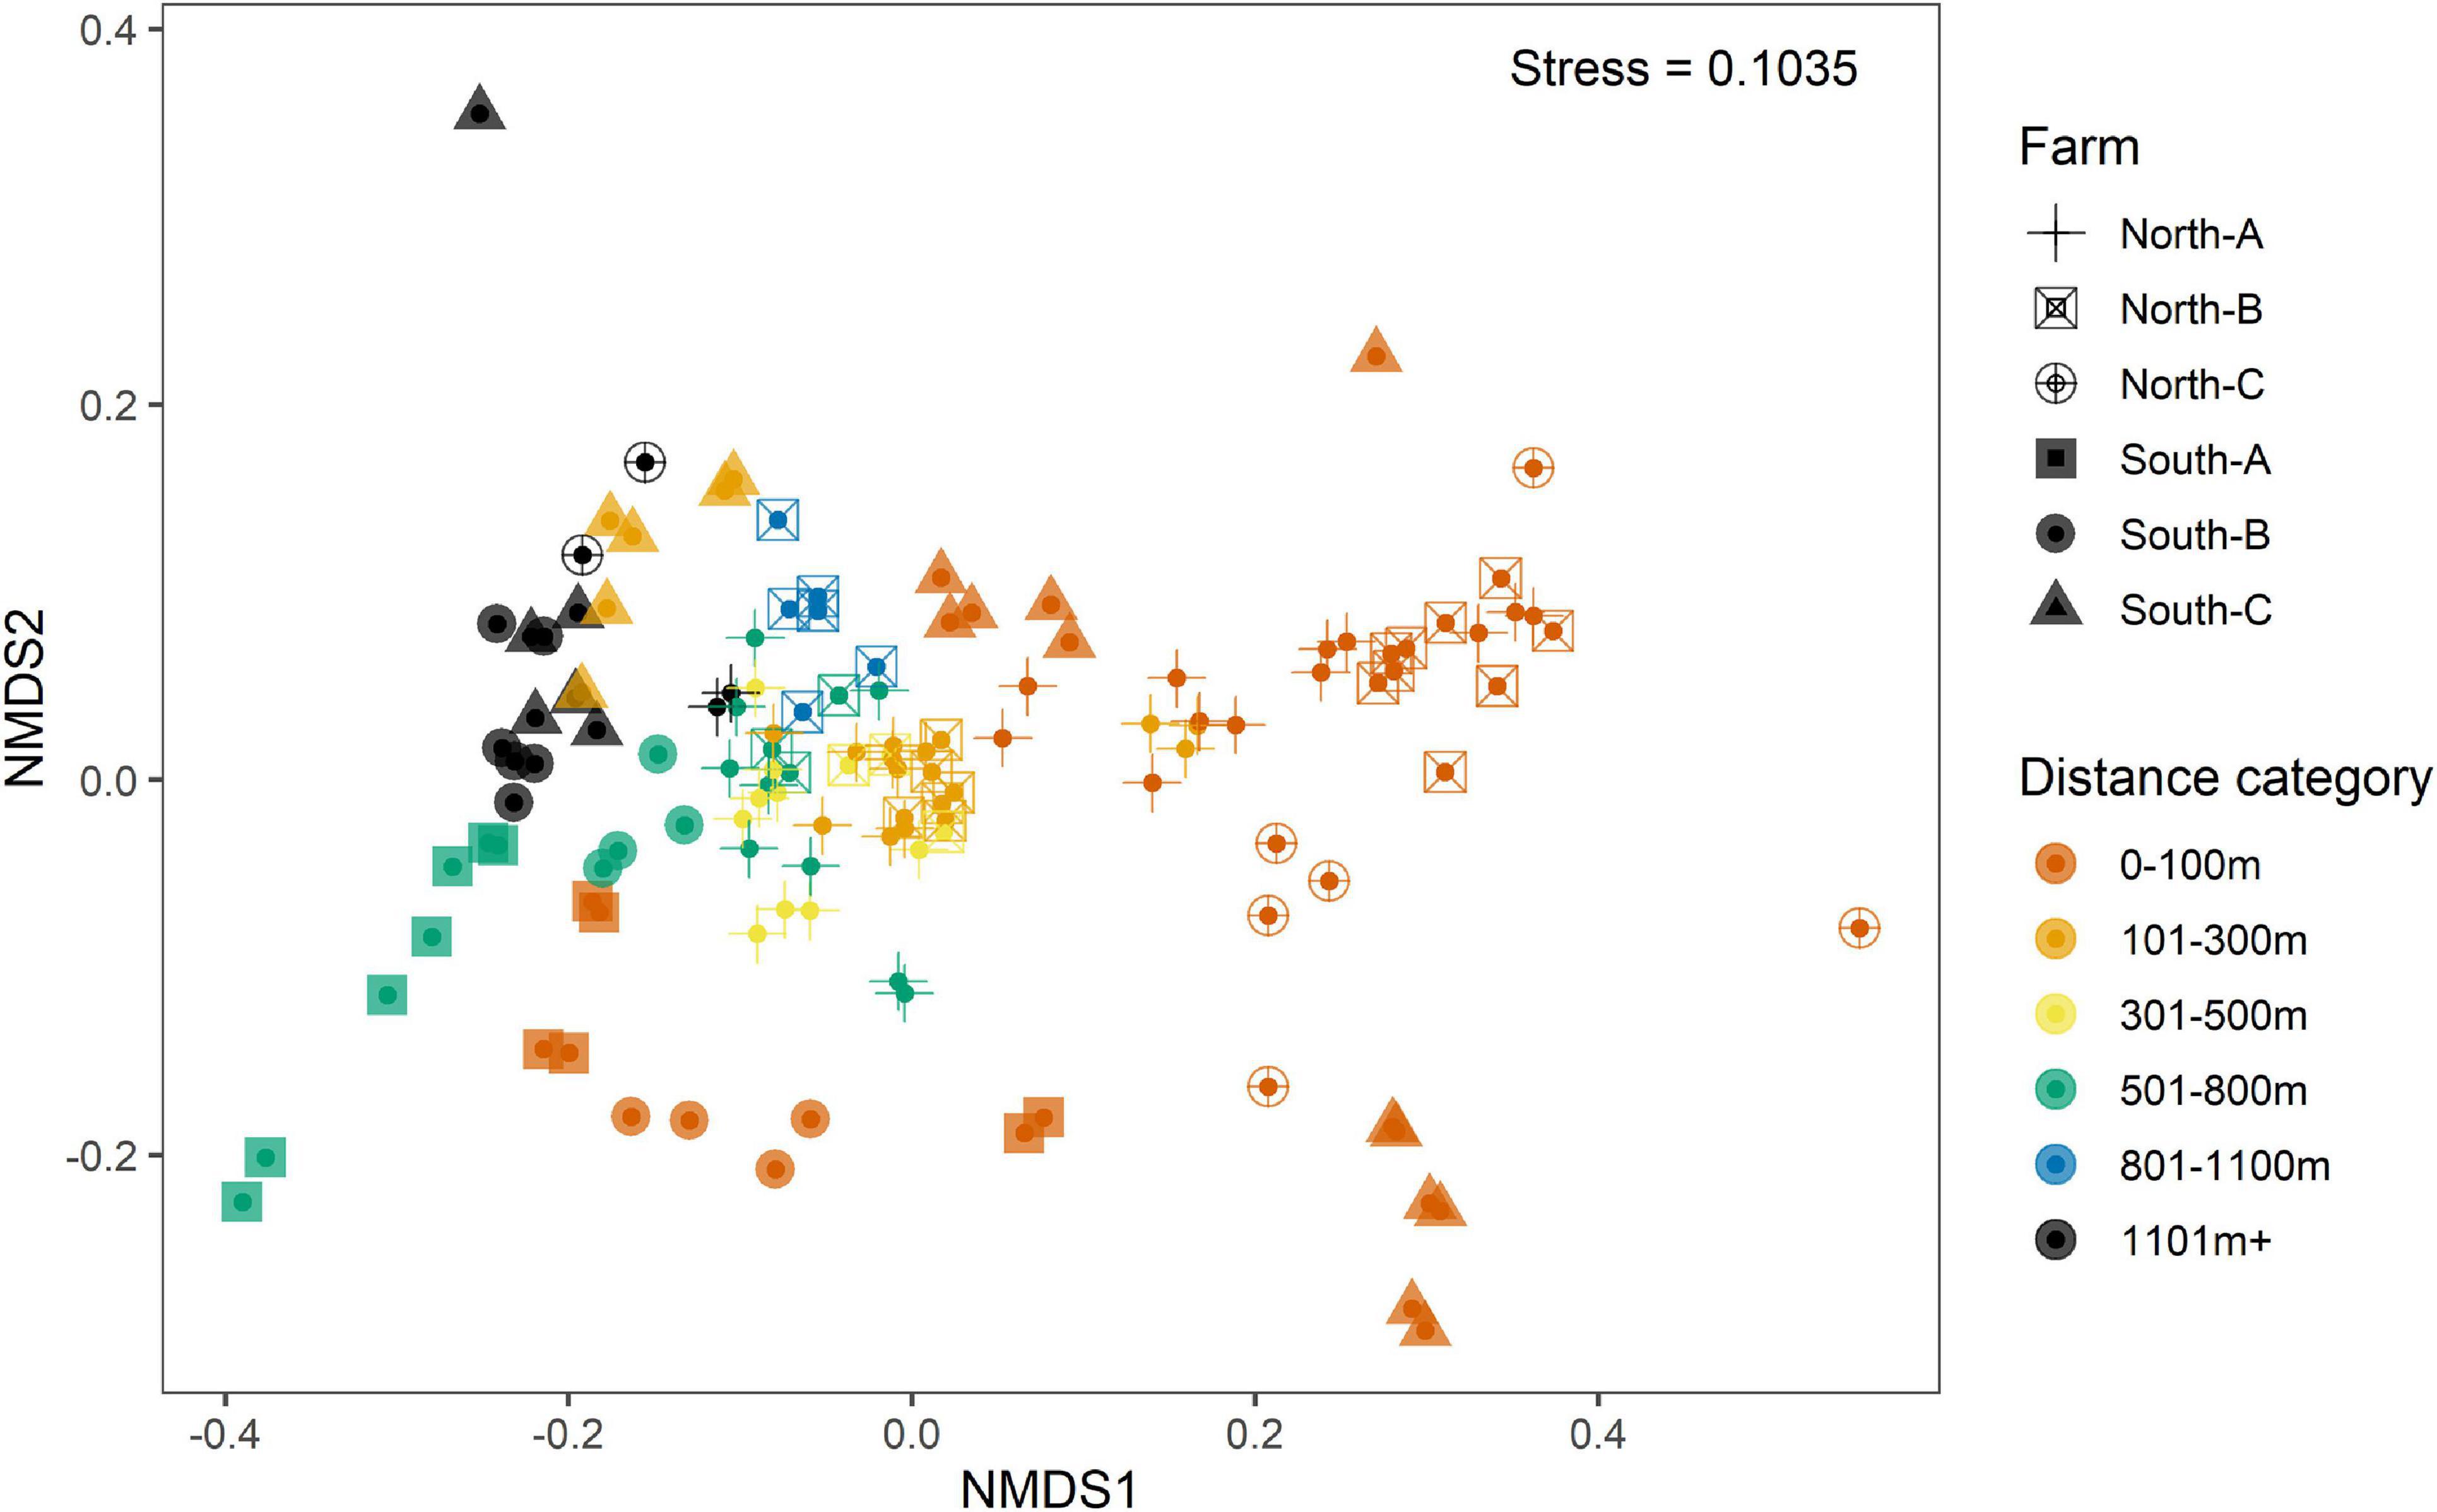
Figure 4. Non-metric multidimensional scaling (nMDS) representation of weighted UniFrac ordination of replicate-level microbial eDNA samples from all Substrate-Independent Benthic Sampler (SIBS) samples from all six farm locations: South-A (filled-in square), South-B (filled-in circle), South-C (filled-in triangle), North-A (cross), North-B (open square and cross), and North-C (open circle and cross). Samples are color-coded according to distance-from-farm grouping.
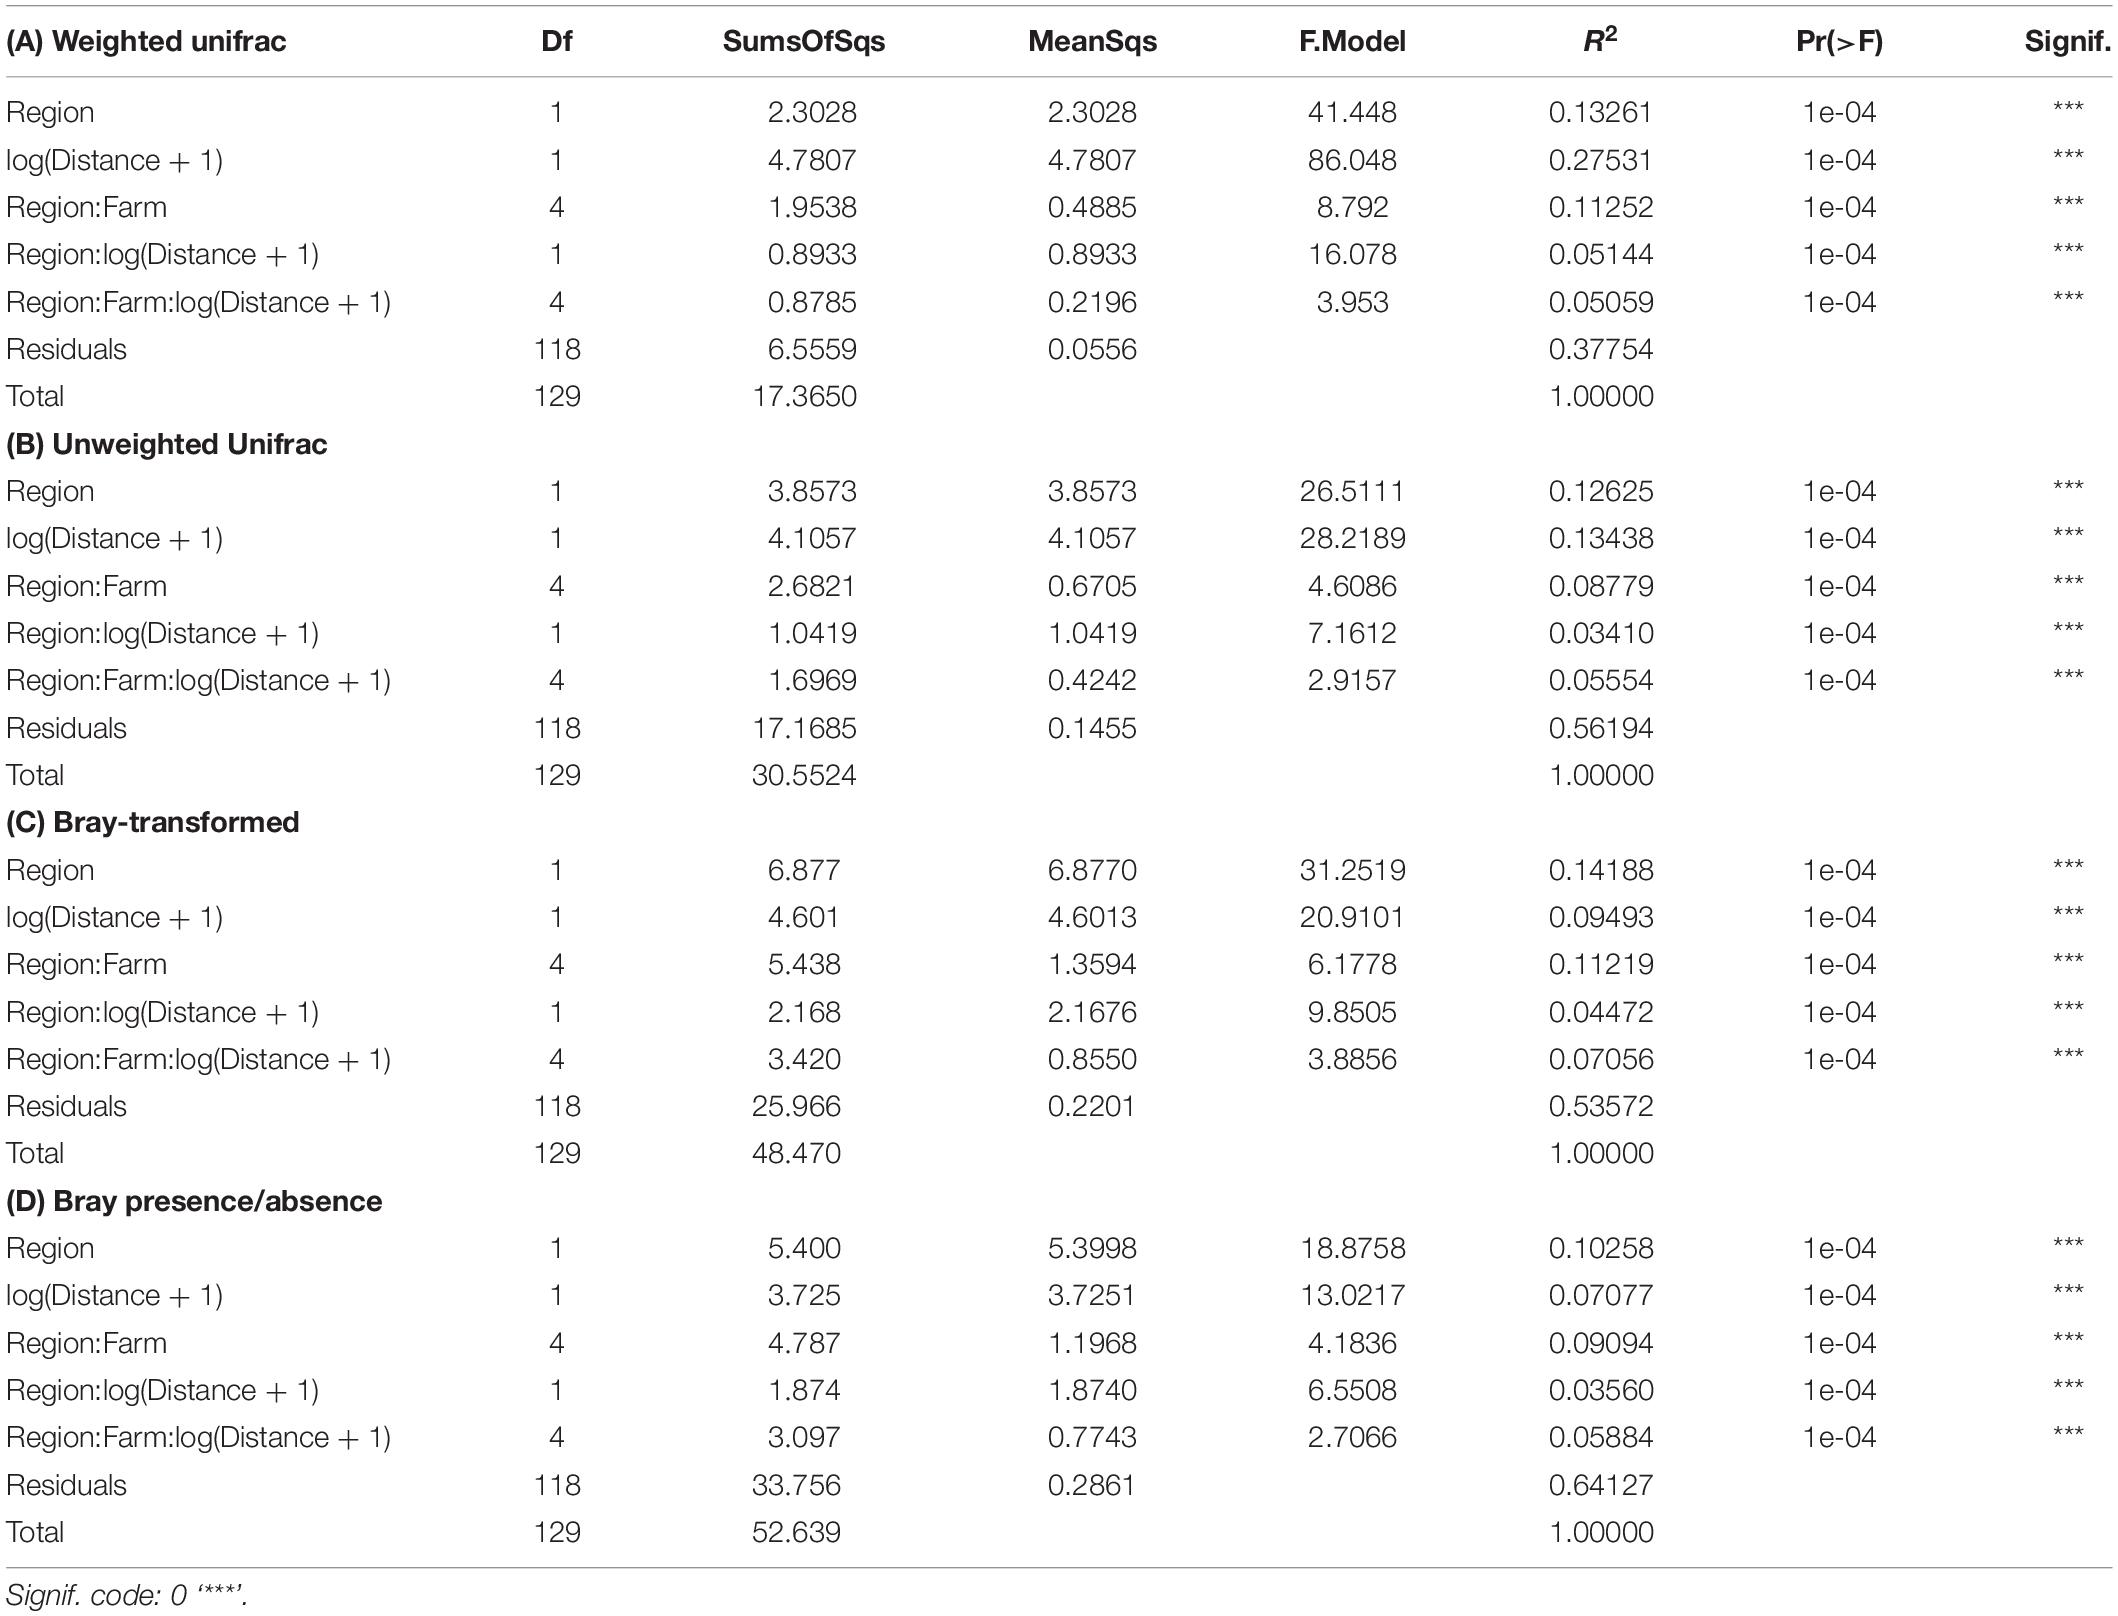
Table 2. Assessment of significance of spatial factors using permutational analysis of variance (PERMANOVA) based on distance matrices from: (A) compositionally transformed weighted UniFrac, (B) compositionally transformed unweighted UniFrac, (C) compositionally transformed Bray–Curtis, and (D) Bray–Curtis similarities of binary (presence/absence) data from all SIBS obtained microbial eDNA samples.
Base substrate, mobile substrate type, and composition of flocculent material varied considerably among stations and had little correspondence with distance from farm (Figures 5A,B). Solid bedrock was the most common base substrate, especially at the southern farms, but was often displaced by “sludge” (presumably organic fish waste overlying the bedrock) beneath and near cages. Types of base substrate and flocculent material were significant factors influencing the distribution but minor in comparison to the changes that were observed with respect to Distance from farm and therefore organic enrichment (Table 3). Coverage of flocculent material (“FlocCoverCat”) explained 12.5% of the variation between samples but was half that explained by Distance (Figure 5C). The qualitative assessment of visual impact (scale from 1 = natural to 5 = highly enriched, Figure 5D) also had a minor contribution to sample differences.
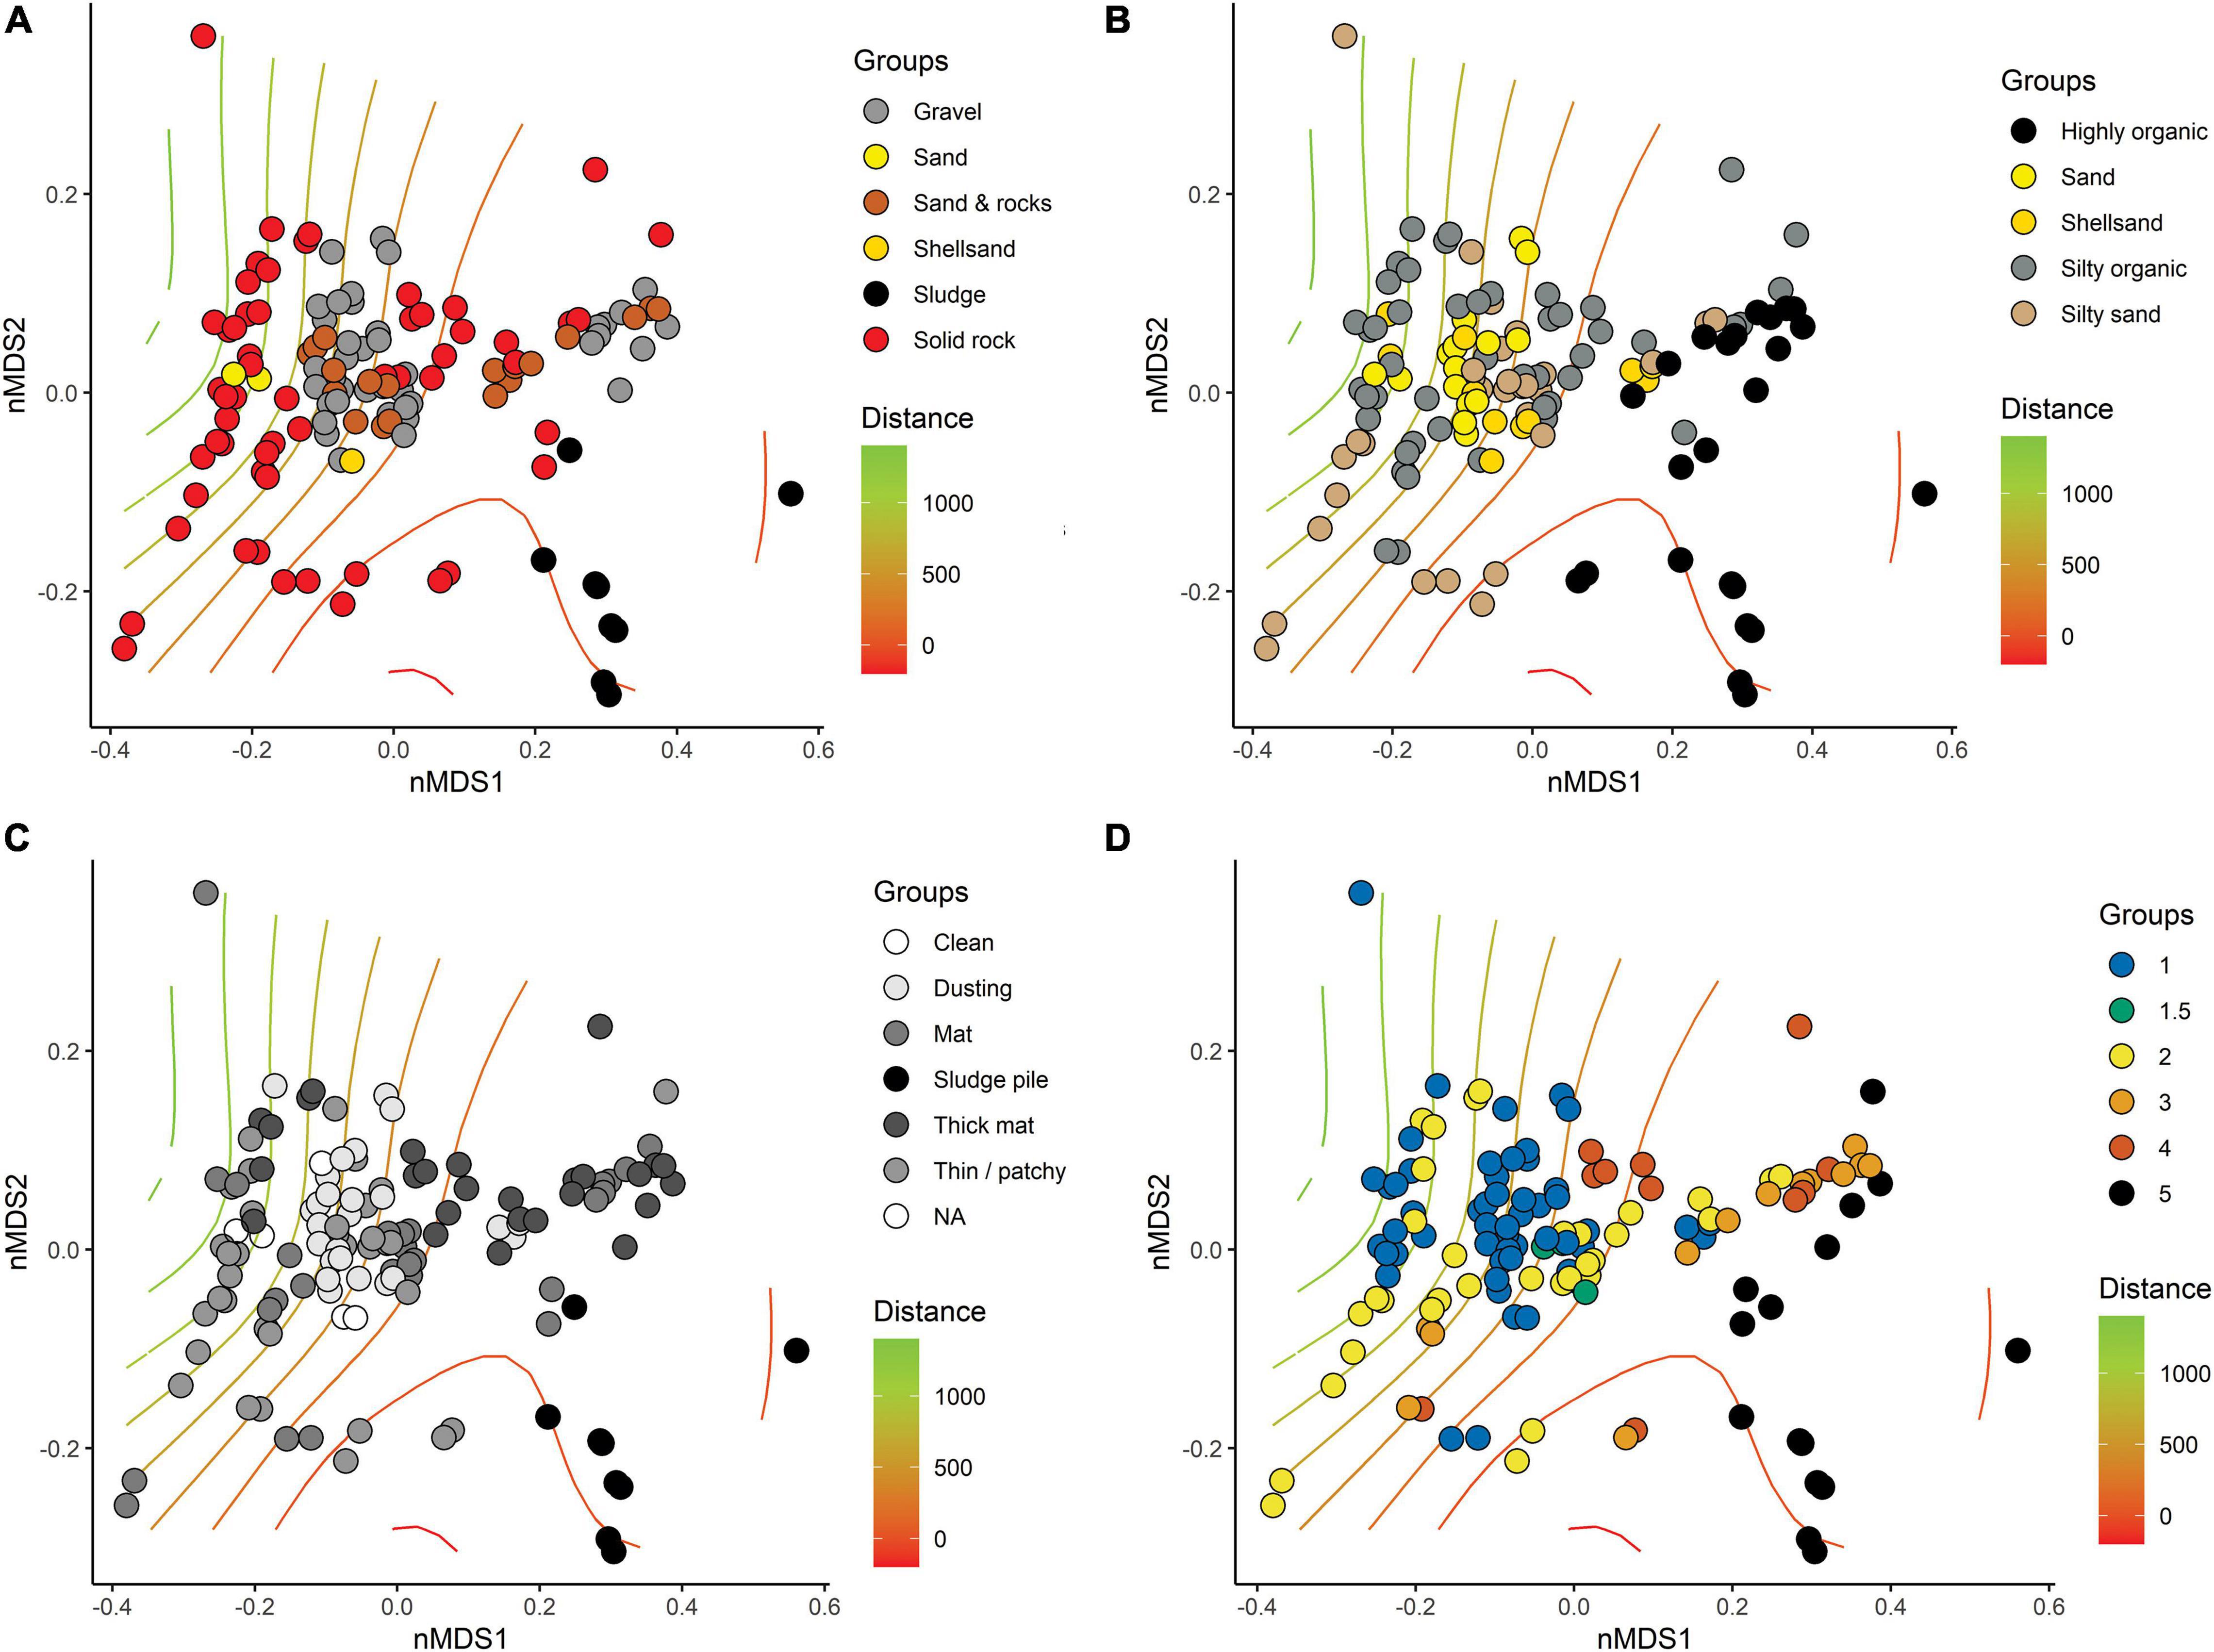
Figure 5. Non-metric multi-dimensional scaling (nMDS, stress = 0.1035) of compositionally transformed weighted-UniFrac-based similarities of replicate-level SIBS samples from all six farm locations with symbol colors differentiating: (A) type of base substrate, (B) type of mobile substrate overlying base substrate (i.e., the sampleable material), (C) extent of cover of flocculant material, and (D) visually assessed level of impact. Distance from farm indicated using surface gradient lines generated from the “ordisurf” function in Vegan, R.
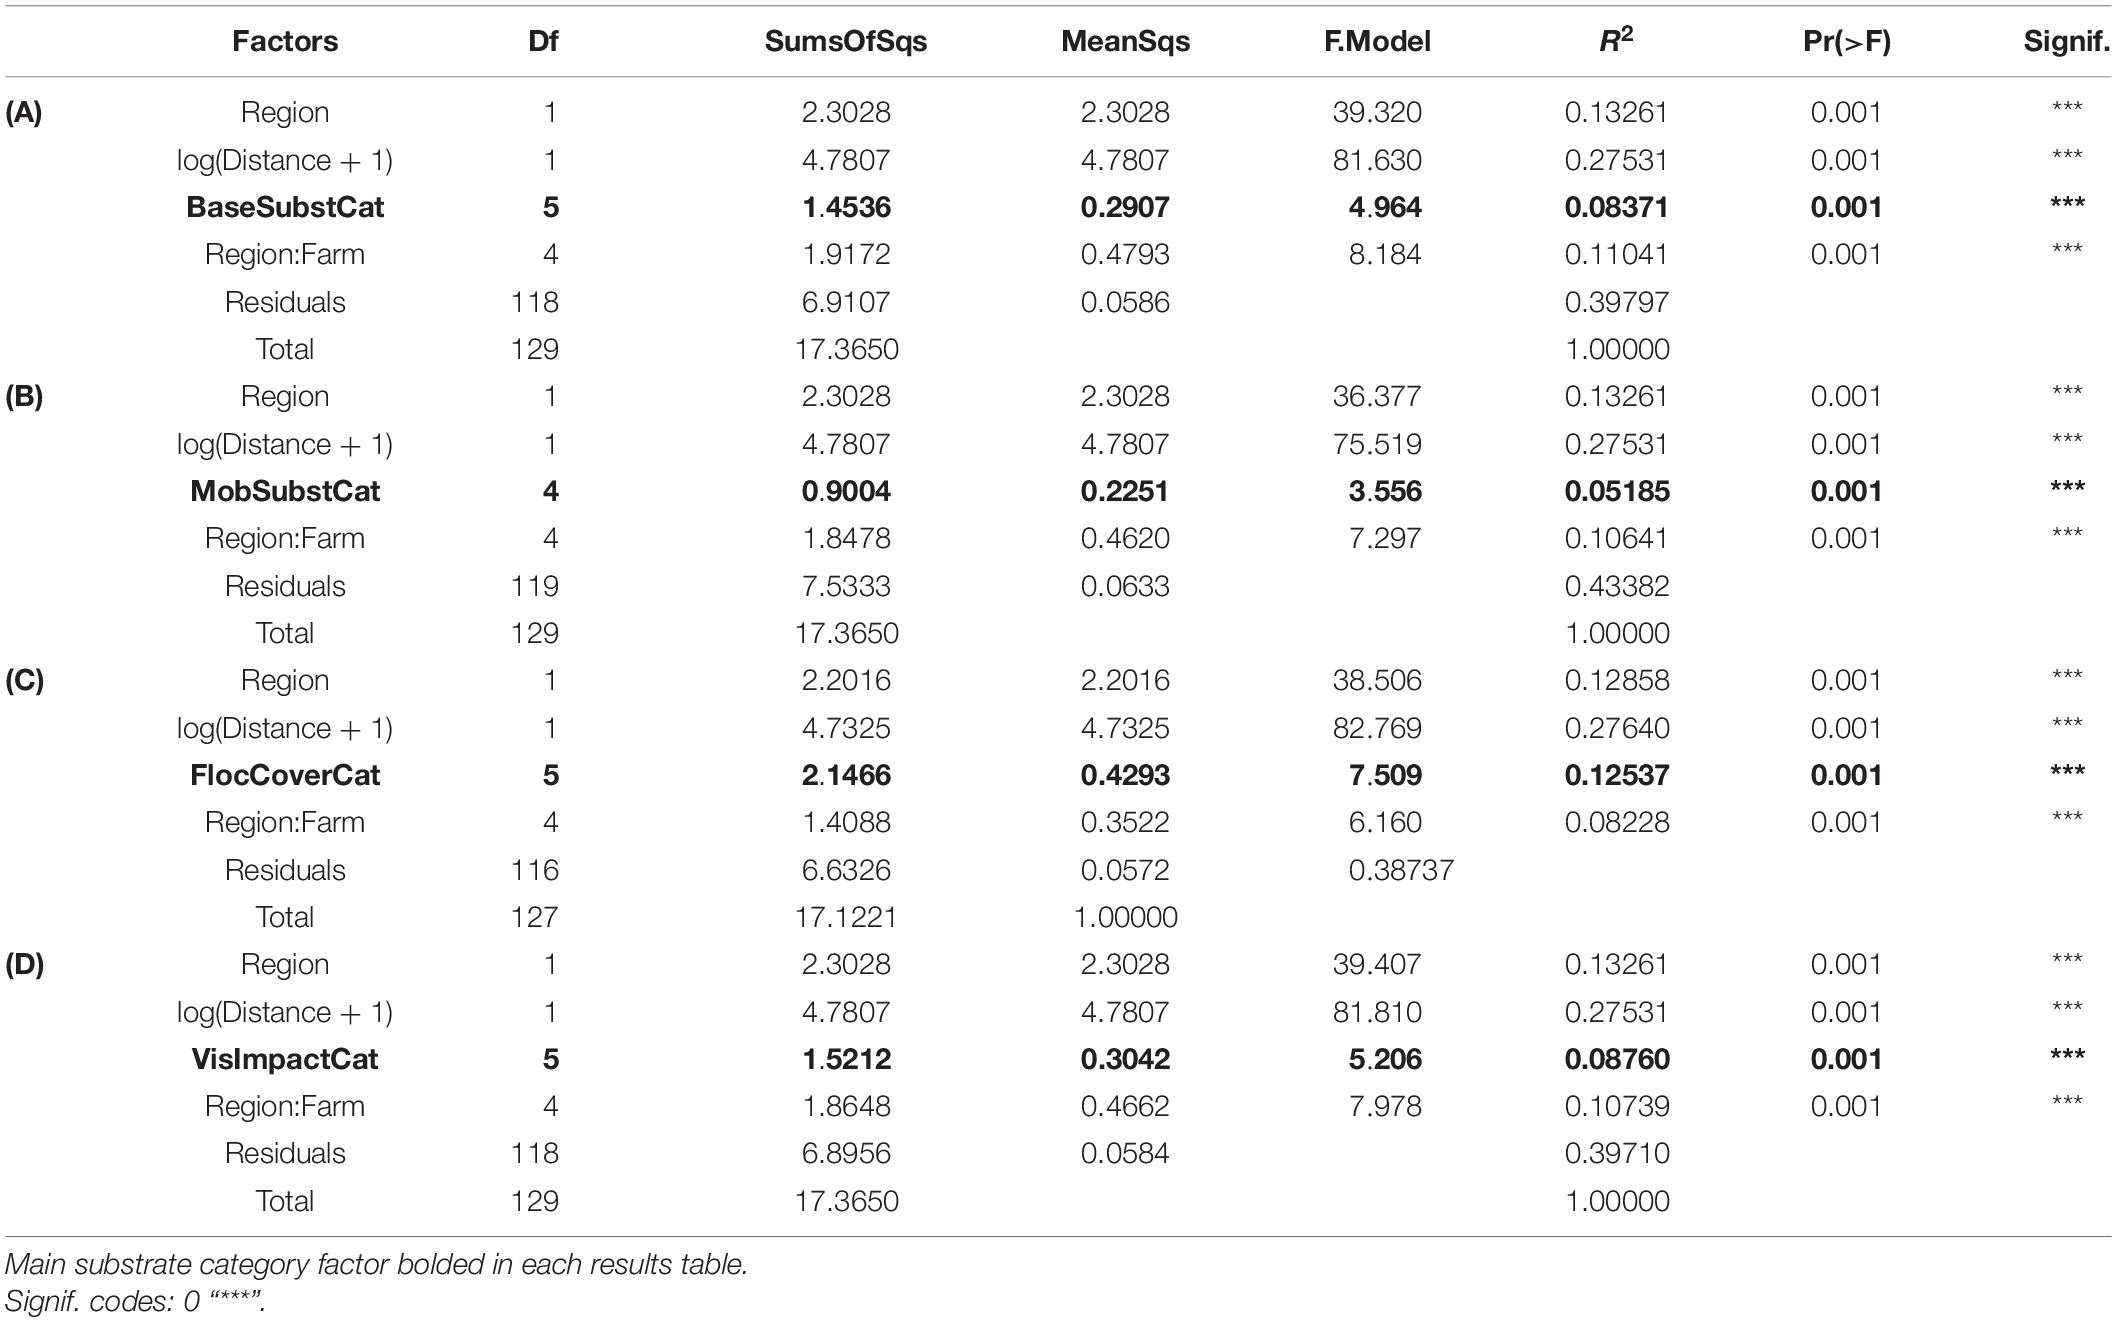
Table 3. Assessment of significance of visually assessed substrate and impact categories using permutational analysis of variance (PERMANOVA) based on distance matrices from all SIBS-obtained microbial eDNA samples. (A) base substrate category; (B) type of mobile substrate; (C) extent and composition of flocculent material, and (D) visual assessment of impact category.
Analysis 2: Conventional Grab Samples Versus SIBS and Relationship to Macrofauna
Relationship Between Macrofauna and Microbial eDNA
Macrofauna richness and diversity at farm North-A ranged from six taxa (S) with a Shannon diversity (H′) of 0.21 at 0 m, to 91 taxa and H′ of 5.29 at the 820 m station. Near-farm sediments were clearly enriched, with strongly elevated total abundances (due primarily to the opportunistic polychete Capitella sp.; Supplementary Table 6) and the AZTI Marine Biotic Index (AMBI) and NQI1 index values of 4.8–5.5 and 0.28–0.51 (indicating a moderately to heavily disturbed state), respectively. In the two-dimensional NMDS representation of the macrofaunal count data, the stations from North-A between 0 and 450 m are not shown because they did not have corresponding eDNA samples for comparison; nevertheless, the ordination shows the 0-m station being very different from the distant 450–1340 m stations, which were comparable in terms of their community composition (Figure 6A). The richness and diversity at farm North-B also exhibited a strong enrichment gradient, with near-farm stations having low richness and diversity (S = 6–33 taxa and H′ = 0.2–1) and biotic indices indicating a highly impacted state (AMBI = 5.2–6.0 and NQI1 = 7.1–9.2). By comparison, the most distant stations (>800 m) from Farm-B were diverse and unimpacted (S = 74–91 and AMBI = 1.1–1.5). Distance to farm (logDist) and the biotic indicators and indices S, H′, AMBI, and NQI1 all correlated strongly [envfit r2 0.81–0.97, Pr(> r) ≥ 0.001] with the ordination and principally along the NMDS1 axis (Figure 6A).
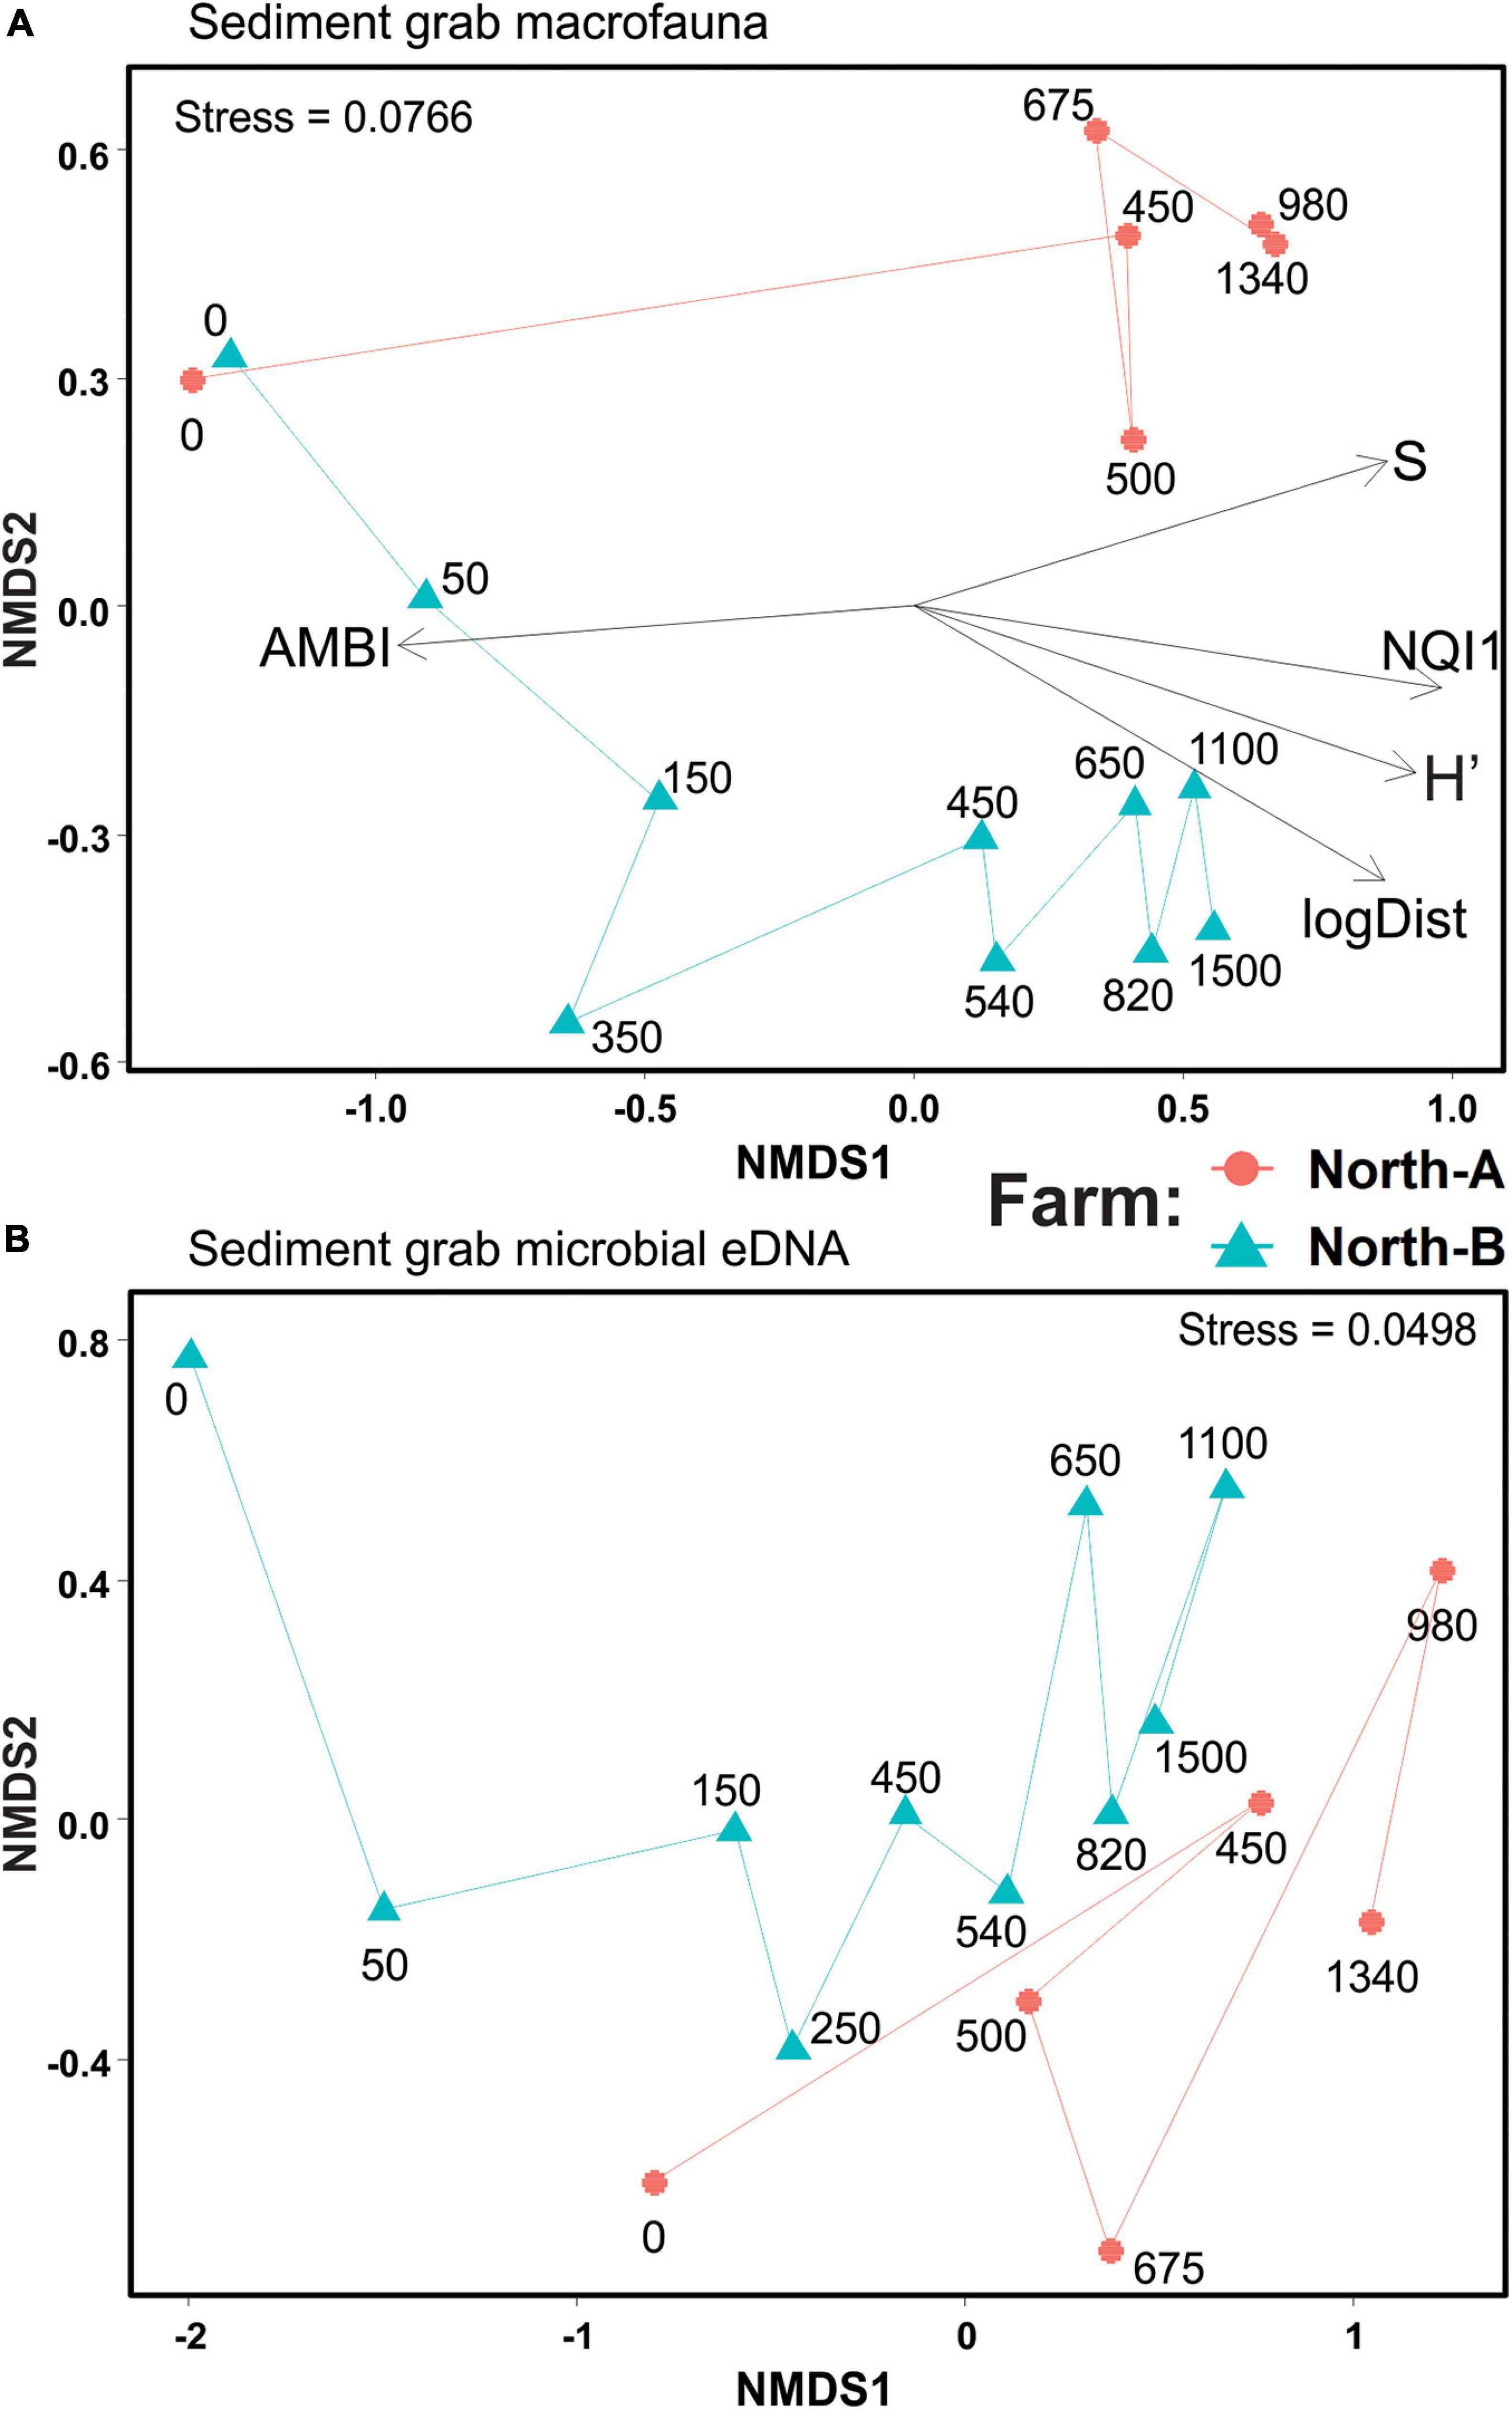
Figure 6. Non-metric multidimensional scaling of Bray–Curtis similarities of (A) square root transformed macrofauna count data, and (B) compositionally transformed microbial eDNA Amplicon Sequence Variants (ASVs) from conventional Van Veen grab samples at North-A and North-B farms. “S” = number of taxa, “AMBI” = AZTI marine Biotic Index, “NQI1” = Norwegian Quality Index, “Shannon” = Shannon diversity (H’), and “logDist” = log10 of the distance to farm in meters.
The NMDS ordination derived from sediment grab eDNA microbial data exhibited comparable sample arrangements, whereby the 0-m stations were placed on the left side of the plot (negative end of NMDS1 axis) and progressed approximately with increasing distance from left to right (Figure 6B). Farm North-A had a less pronounced gradient with respect to distance; however, a similar trend was evident in macrofauna count data from the same farm (Figure 6A). The Procruste Protest correlation in symmetric rotation between the two matrices (Figure 6A versus 6B) was strongly significant (Cor = 0.757 and P < 0.0001) indicating good agreement between the two alternative enrichment indicating communities (i.e., macrofauna and microbial eDNA).
Relationship Between SIBS and Conventional Sediment Grabs
The strongest factor responsible for the dissimilarities between stations from the North-A and North-B SIBS and grab sediment samples was distance from farm (Distance, r2 = 0.217) and therefore farm-sourced material (Table 4A and Figure 7A). The second most influential factor was “source of sample” (SIBS versus grab, r2 = 0.143), and factors Farm and the Farm:Distance interaction were mildly significant but minor in their contribution (both r2 < 0.04).

Table 4. Test for significance of (A) distance-based factors (“Farm” and “Distance” from farm) in relation to Source of sample (SIBS versus grab) and Base substrate type, and (B) replacing Distance with b-MBI (assessed Enrichment Stage) using permutational analysis of variance (PERMANOVA) based on distance matrices from all SIBS obtained microbial eDNA samples.
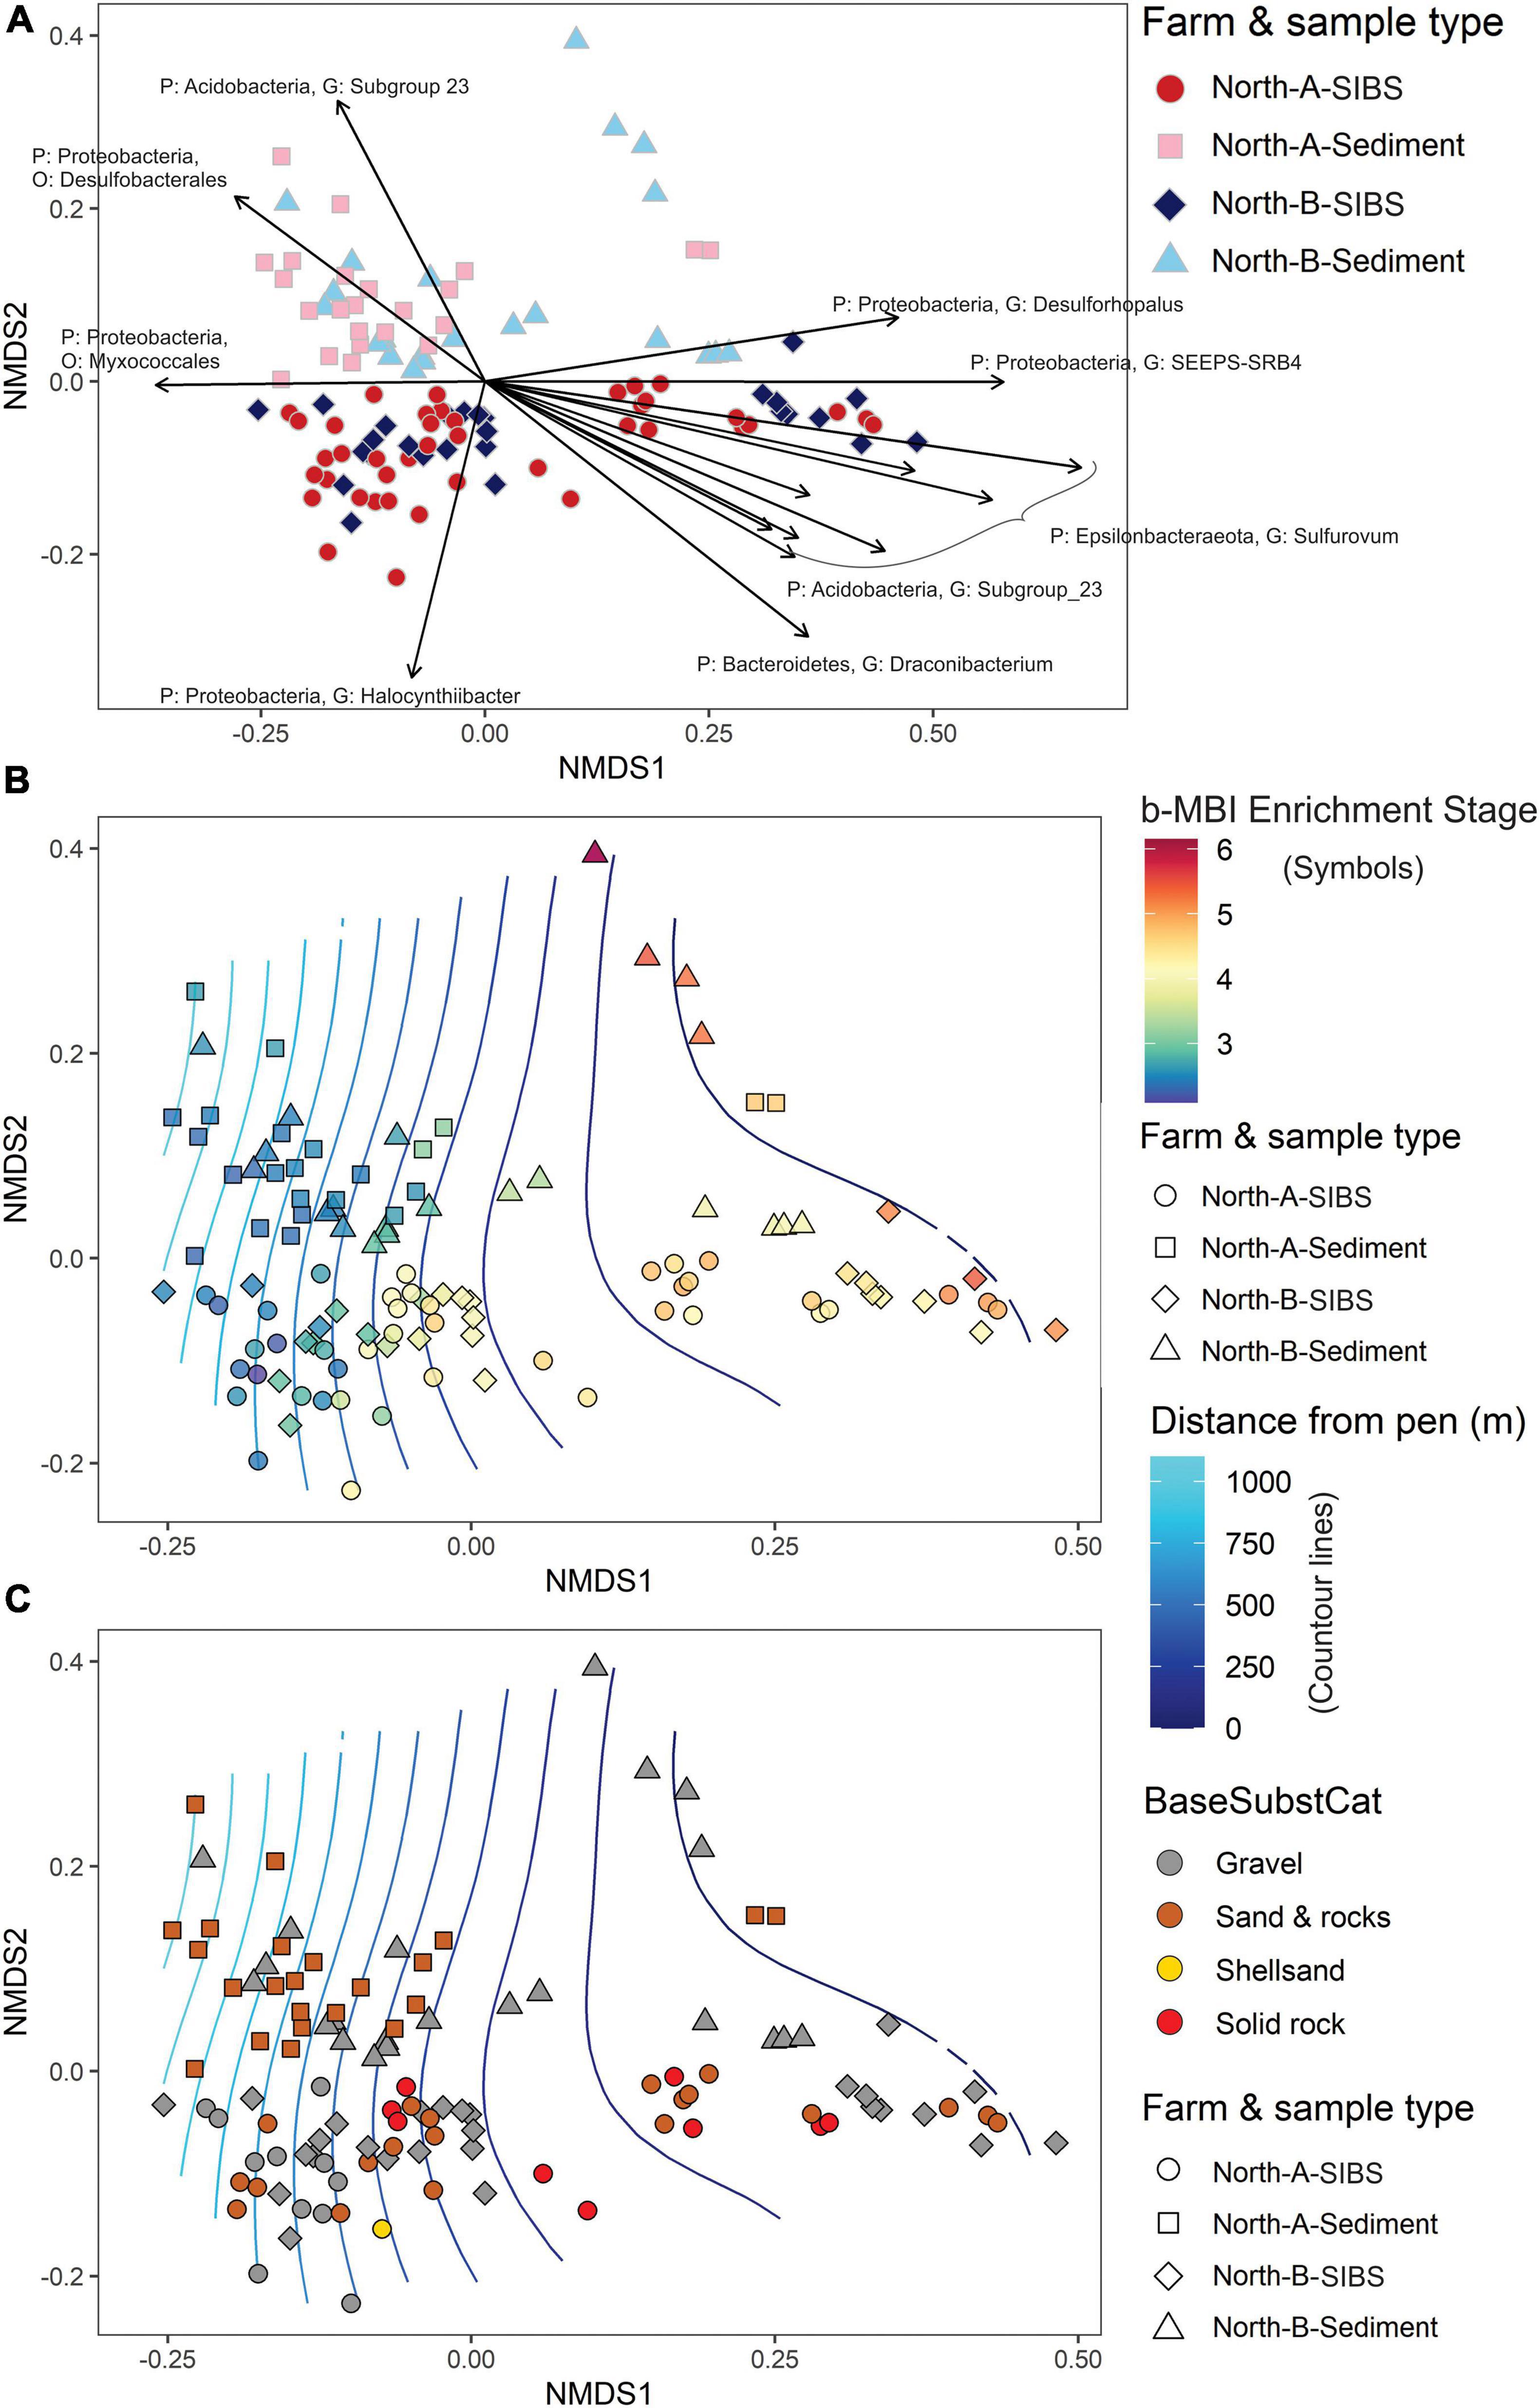
Figure 7. Non-metric multidimensional scaling plots representing weighted UniFrac similarities of microbial eDNA samples from SIBS (hard bottom) and grab sediments collected along gradients radiating away from farms North-A and North-B. (A) Indicates similarities in relation to floc and sediment samples for each farm, along with a vector plot of 15 microbial ASV’s most responsible for distribution in the ordination. (B) Shows same sample distribution but symbol color indicates benthic Enrichment Stage from 1 = “pristine/natural” to 7 = “anaerobic and azoic” (Keeley et al., 2012b) inferred from the bacteria-MBI (Pochon et al., 2020) overlaid on surface plot of distance (m) from farm. (C) As for (B) but symbols are color coded according to base substrate type.
In terms of the commonality between SIBS and sediment eDNA samples, at the near-farm stations (0–100 m away), 154 of the 243 microbial genera (63.4%) where shared (Supplementary Figure 2C). At the more distant stations (800–1000 m), there were fewer genera (total 191) and the overlap between SIBS and sediment was smaller (n = 91, 47.6%), with the SIBS sampler containing a large proportion of samples (n = 77, 45%) that were not found in the grab sediment. The overlap of genera between near-farm and distant stations using the SIBS was 54%, with 18 and 22% being exclusive to distant stations and near-farm stations, respectively. Conversely, almost all (n = 111) of the genera found in the grab sediment at distant stations (n = 114) were also found at the near-farm stations (Supplementary Figure 2B). The ASV most responsible for the difference between sediment grab eDNA and SIBS eDNA samples was Halocynthiibacter spp. (Proteobacteria), which was more prevalent in SIBS samples (Figure 7A). The Phylum Verrucomicrobia (containing families Pedospharaceae and Rubritaleaceae) was generally more prevalent in SIBS samples than in grab sediment samples. Conversely, the Acidobacteria were more prevalent in grab sediments than SIBS samples (Figure 8).
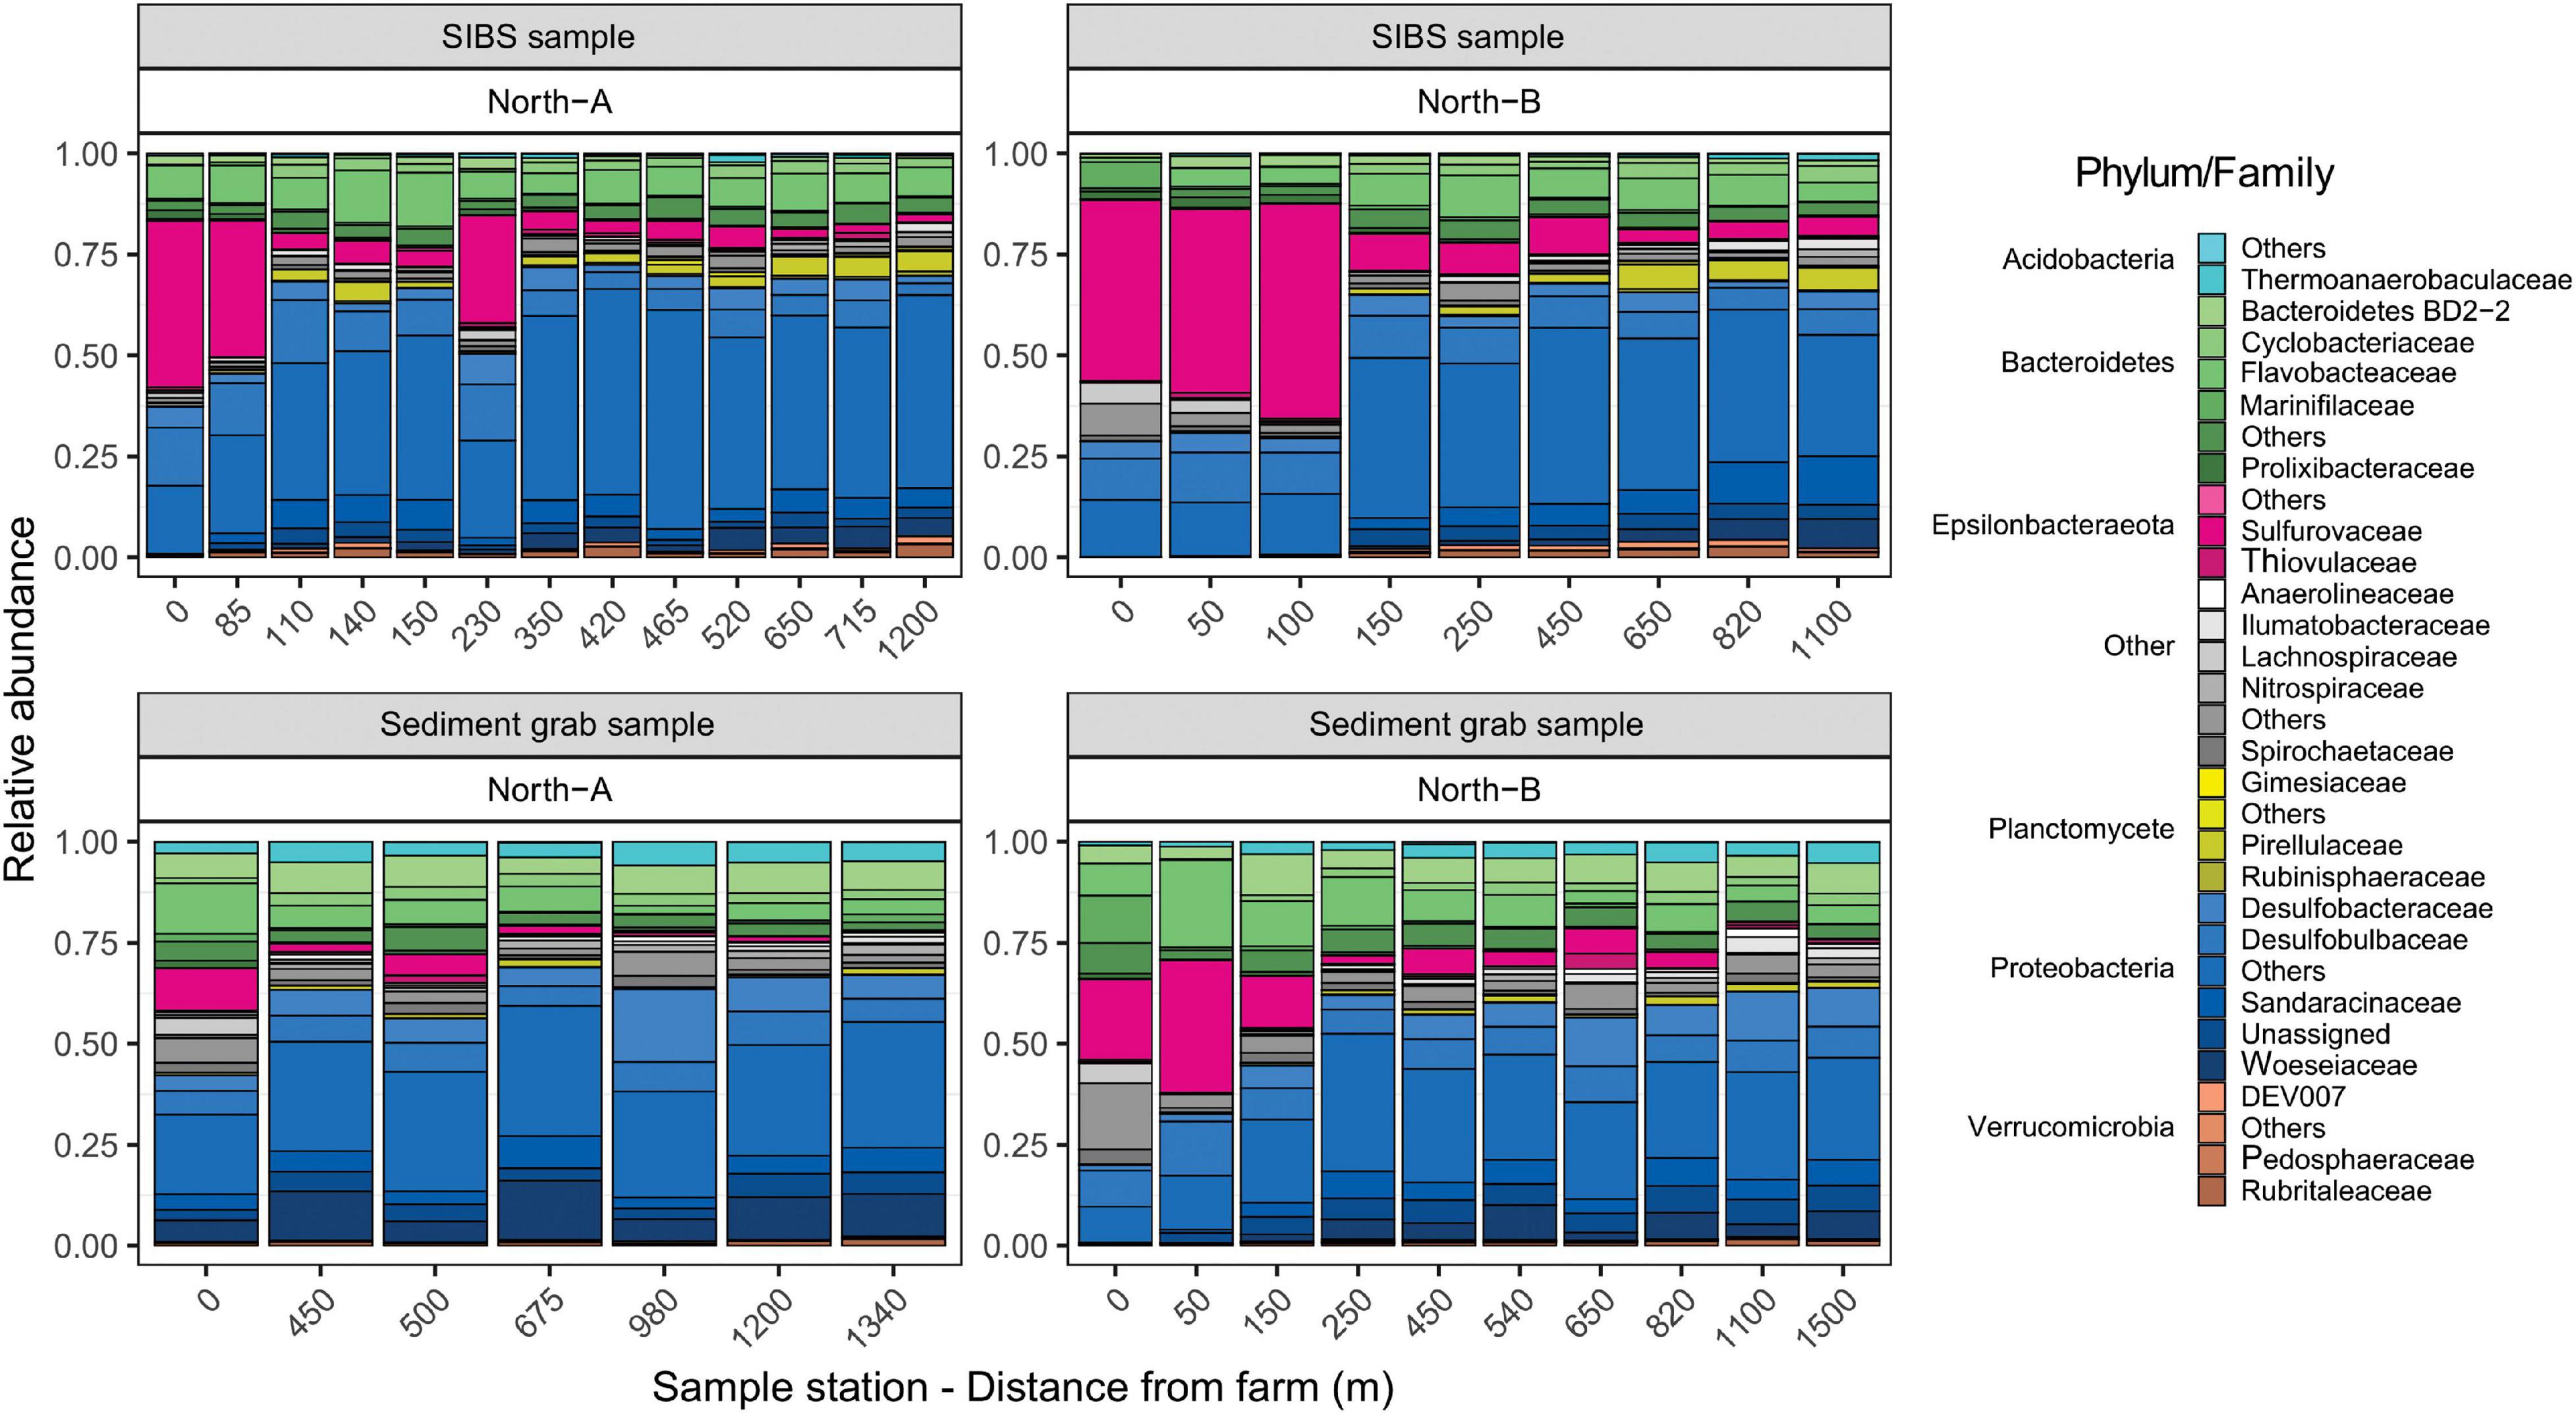
Figure 8. Relative contributions of amplicon sequence variants (ASVs) taxa (Phylum and Family) with respect to distance form farm for SIBS and grab sample sediments from the North-A and North-B farms.
The main differences in microbial composition due to distance from farm was the notable increase in dominance of the Epsilonbacteraeota Phylum (primarily of the Family Sulfurovaceae) close to the farms and a proportional reduction in members of the Protobacteria Phylum (Figure 8). This trend was evident in both SIBS and grab sediment samples. At the 0-m stations at the North-B farm, the Family Nitrospiraceae was noticeably more prevalent. The species-based envifit procedure also identified several Sulfurovaceace species as the most influential ASVs that increased in the positive direction (to near farm stations) on NMDS1 (Figure 7A). Other important ASVs that increased consistently with proximity to farm were the Proteobacteria Desulforhopalus and SEEP-SRB4, a Bacteroidetes in the genus Draconibacterium. Conversely, ASVs that were most prevalent at the unimpacted, distant end of the spectrum included two unidentified Proteobacteria species and Acidobacteria, Subgroup_23 (Figure 7A).
In Figure 7B, factor Distance is displayed as a two-dimensional surface and station symbols are color-coded to indicate the b-MBI score that was calculated based on each sample’s microbial assemblage. Of the 395 GeneCode-IDs that have been registered in the Cawthron GeneCode-ID database (Pochon et al., 2020), 140 exact matches were found from the total of 8,617 ASVs that were identified (post-filtering) in this study. The correlation with factor b-MBI and inferred Enrichment Stage (Table 4B) is even stronger than for distance (Table 4A), displaying clear congruence with Distance (and the NMDS1 axis) and a proportionally large (r2 of 0.321) and highly significant contribution to the model. By comparison, the base substrate (as a categorical factor) was haphazardly distributed in the plot with respect to the distance variable (Figure 7C) and accordingly was a very minor factor in both models and non-significant in the b-MBI model (Table 4).
Analysis 3: Application to Pure Hard-Bottom Sites
The final analysis (Figure 9) presents an analogous plot to Figure 7B but that uses only SIBS eDNA samples obtained from pure bedrock areas in southern Norway (farms South A-C). These areas are impossible to sample with conventional sediment grab and as such have no other environmental data aside from the proxy of distance to farm. This plot reveals very good congruence between b-MBI and distance from farm. The findings are also in good agreement with field observations regarding levels of effects in that the 0-m South-C stations were notably highly impacted with a visible layer of organic sludge, whereas the 0-m stations at South-A had bare rock still visible (Figure 3 and Table 1).
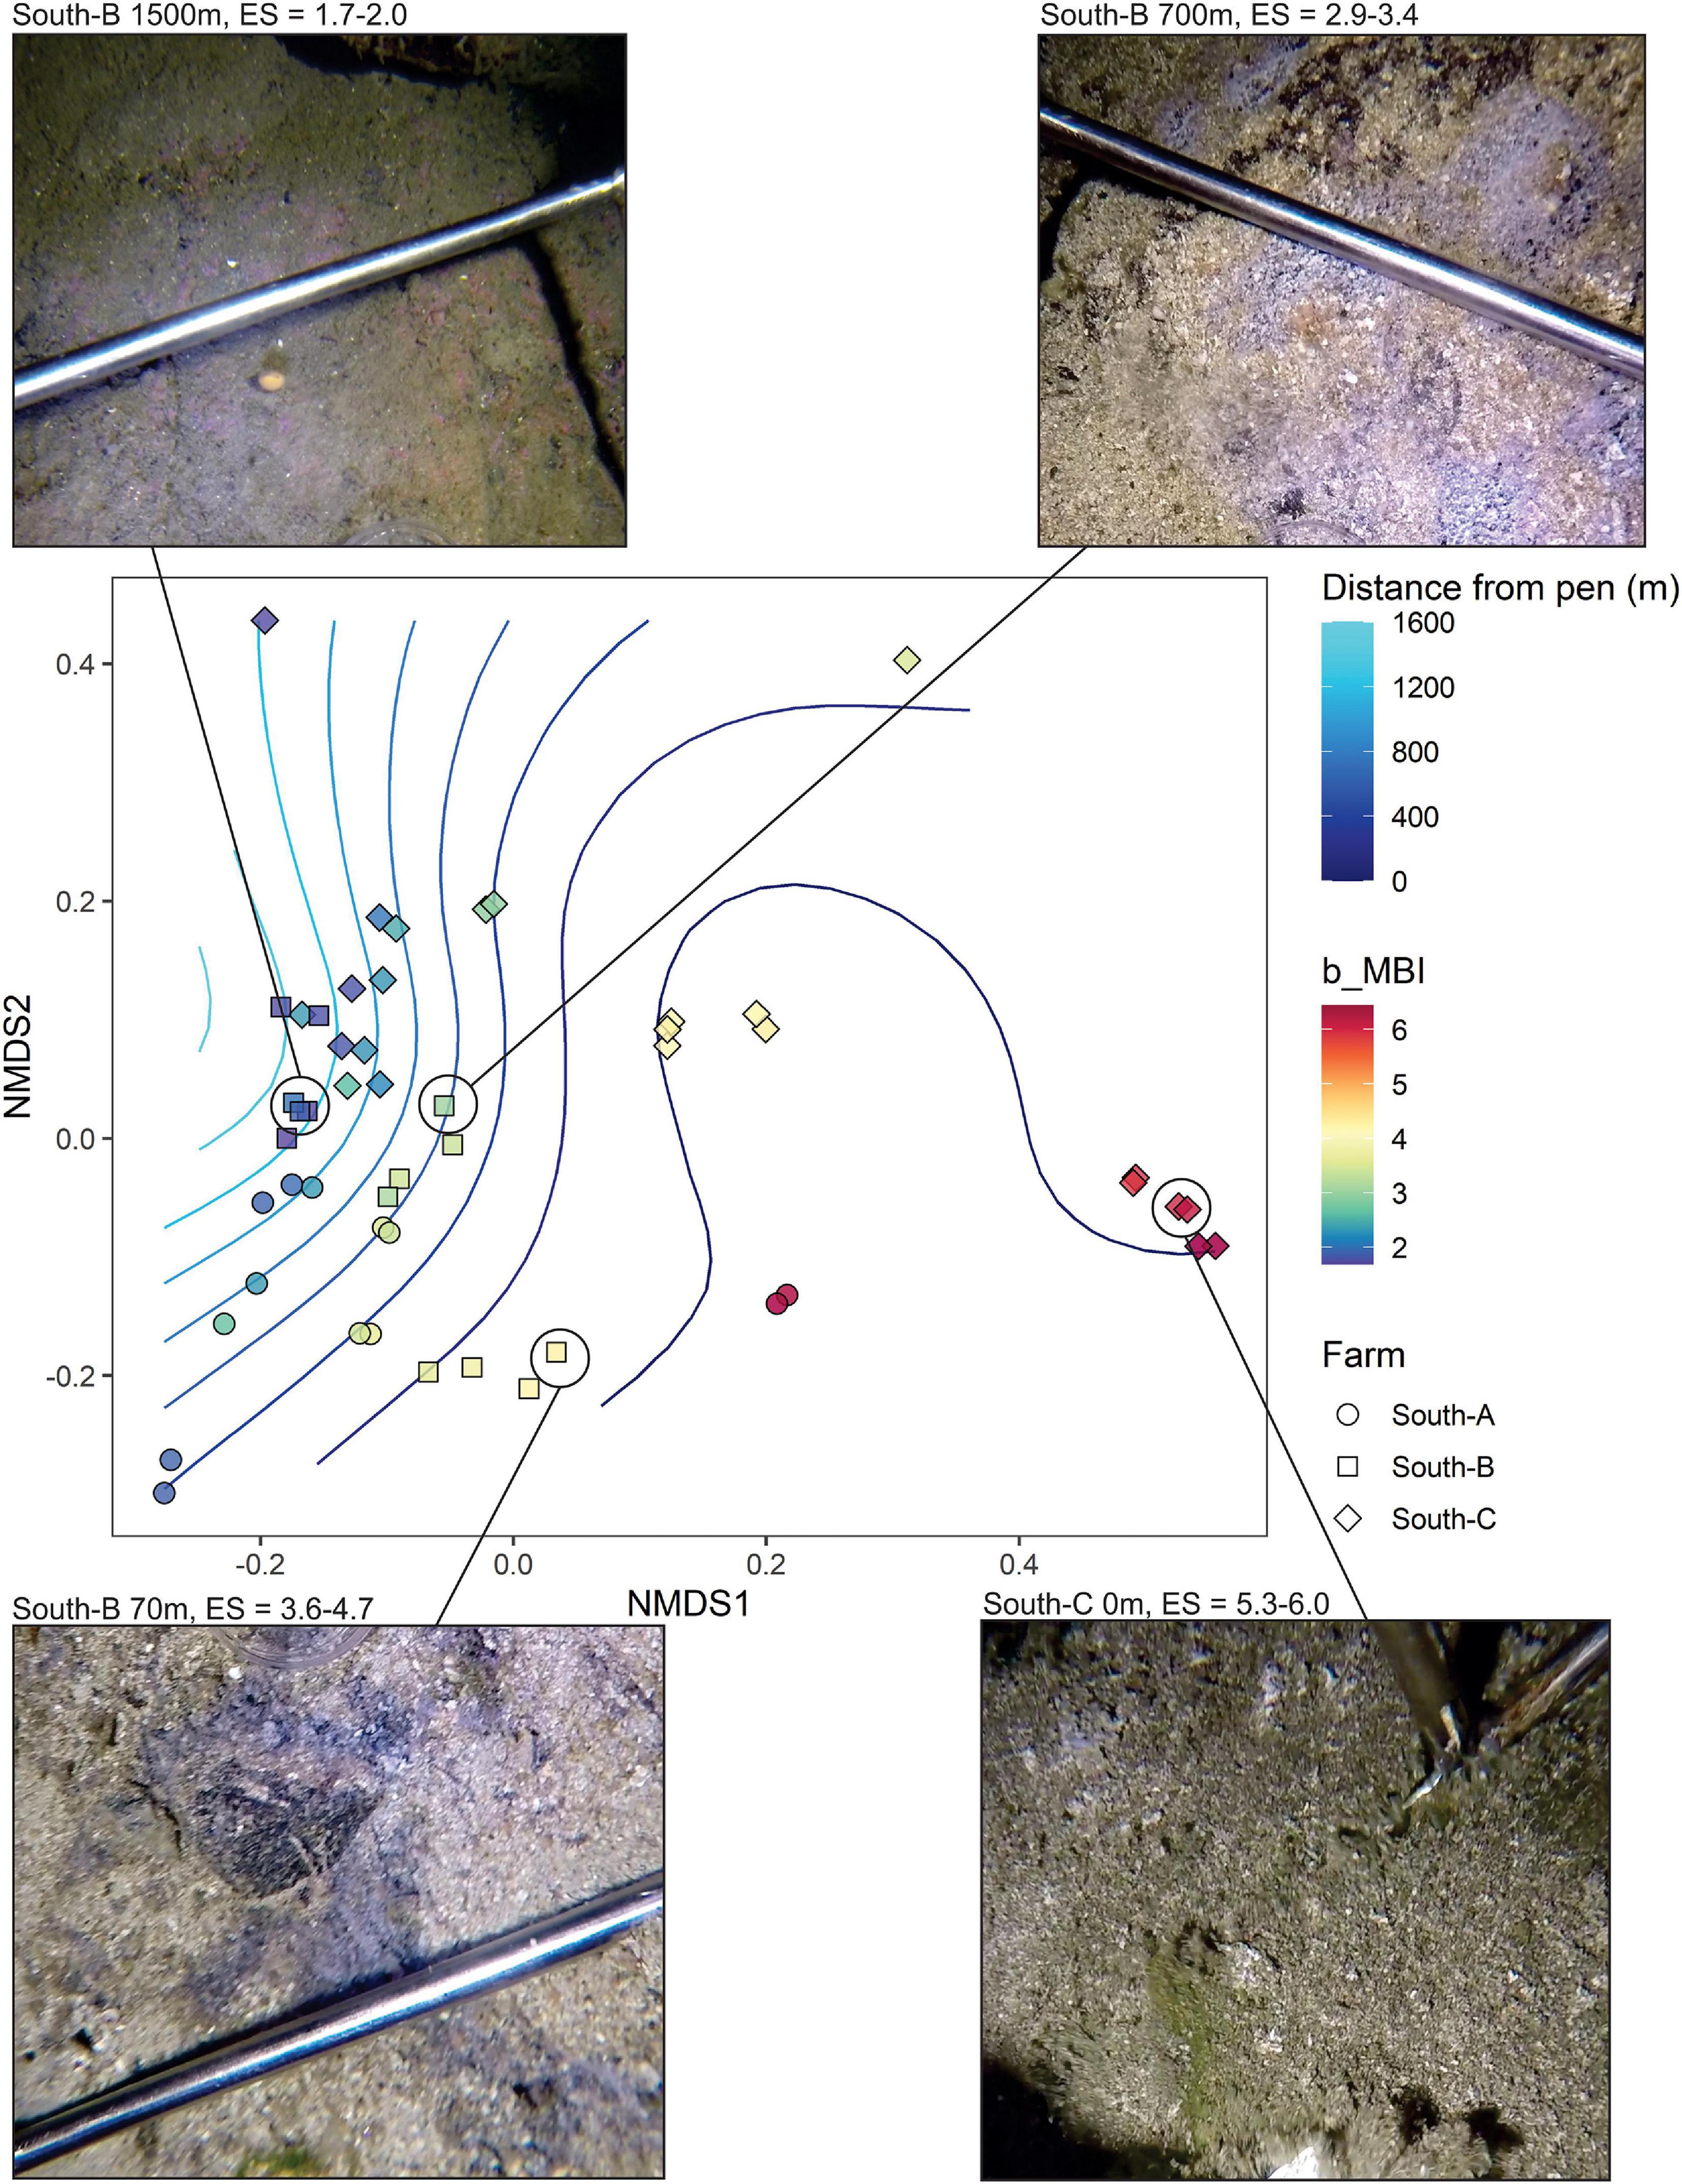
Figure 9. NMDS plot representing weighted UniFrac similarities of microbial eDNA SIBS samples from predominantly bedrock substrates for which obtaining any other benthic environmental data was not possible. Symbols are color-coded according to benthic Enrichment Stage (1 = “pristine/natural” to 7 = “anaerobic and azoic”) calculated from the bacteria-MBI (Pochon et al., 2020). Images provided of selected sample stations (at point of sampling) along the enrichment/distance gradient.
Discussion
The microbial eDNA that exists in mobile organic and inorganic sediment veneers that overlie almost all substrates in subtidal marine ecosystems can be used to assess fish farm influence and to inform the level of benthic organic enrichment. Useful samples were obtained using the SIBS device from a broad spectrum of substrates, including bedrock, broken rock, gravel, coarse shell sand, and mud/sludge (mostly directly beneath the cages). Throughout this analysis, “Distance” from farm (as a proxy for the enrichment gradient in the absence of other variables) was the strongest factor influencing the microbial composition of the SIBS samples and substrate-specific factors were relatively minor, the inference being that a sample can be drawn from any of the tested substrates and return a comparable result in terms of microbial composition with respect to organic enrichment. This represents a substantial breakthrough as, to date, assessments of benthic impacts were constrained to either readily sampleable soft-sediment substrates or semi- or non-quantitative visual surveys on hard bottoms. Although significant differences were observed between farms and regions (northern and southern Norway), these were less influential than distance from farm and were also not surprising given the degree of spatial separation between regions (8° 40′ of Latitude) and that the farms were presumably in differing states of impact. Together, these results show that we now have the necessary tools for elucidating benthic enrichment on most substrates, including hard-bottom previously considered unsampleable.
It was notable that even samples from seemingly “clean” bedrock (lacking an obvious sediment veneer) returned usable microbial eDNA results that allowed the stations to be suitably positioned against other samples in multivariate space. This can mostly be attributed to the highly sensitive nature of the eDNA metabarcoding approach, which compared to traditional methods is particularly effective in describing diversity and measuring richness estimates from small amounts of physical matter (Thomsen et al., 2012; Deiner et al., 2017). The effectiveness of the method was enhanced by our ability to minimize contamination by collecting the SIBS samples directly into separate sterile laboratory-grade bags where they remained until being transferred to sterile filters (usually within 1 h of being brought to the surface). The efficacy of the results can also be attributed to the way in which the data is analyzed, in that the samples are not required to be quantitative in terms of volume and are instead driven by highly diverse compositional data that is first filtered to remove spurious ASVs and standardized for each sample. The amount of DNA required is very small (milligrams), and the focus is on the dominant taxa and not on abundances and diversity per se. In most cases, the retrieved sample also includes a significant quantity of very-near bottom water (i.e., 1–15 mm above bottom), which may not be detrimental to the result. Near-bottom waters are known to contain environmental DNA and RNA from animals that have passed through the area, for example of fish (Sassoubre et al., 2016; Lacoursière-Roussel et al., 2018) and therefore presumably also the fauna and microbial communities that are on the seabed in the immediate vicinity. Microbial communities are of particular relevance as they are spatially ubiquitous, implicit in the geochemical process of enrichment (McCaig et al., 1999; Barton and Hamilton, 2007), and even water samples taken 1 m above the seabed can include benthic enrichment biomarkers (Verhoeven et al., 2018).
This result is not entirely surprising given that useful prokaryotic and eukaryotic eDNA can also be extracted from settlement plates and artificial surfaces (Pochon et al., 2015b; Cahill et al., 2018; von Ammon et al., 2018). However, a concern with this approach for benthic biomonitoring purposes is that it may provide a very contemporary picture (or “settlement snapshot”), whereas samples from the seabed are likely to both integrate a longer-term picture and include sediment-derived influences and therefore functions. This assumption was reinforced in this study by the high comparability between benthic substrates compared to the significant differences that were observed between sediment and settlement plates by Koziol et al. (2019).
Philosophically, it could be argued that just because the microbial communities that are found in the flocculent material that overlies what was otherwise bare bedrock is consistent with that of impacted soft sediments, it does not necessarily constitute an equivalent ecological effect. This question is especially pertinent in settings with extensive areas of bedrock that contain little to no epifauna diversity, as was the case at many locations in the southern region studied here (determined from multiple video surveys in the region—data not shown). There are two aspects to this conundrum: one is that just because there was no fauna present, it is possible they were never there, and never will be there, and therefore their absence cannot infer impact. Secondly, even if the substrate was to be covered with ecologically detrimental waste, does it matter if there is no significant faunal community? However, from an ecological perspective it seems reasonable to expect that any anthropogenic activities should operate such that they are not responsible for precluding the establishment of normal, native assemblages, regardless of whether they are excluded by other natural factors, e.g., larval dispersal ranges. Additionally, the seabed should not be impacted in such a way that overlying waters and associated inhabitants (e.g., demersal fish) are adversely affected. For example, severely enriched sediments can cause localized deoxygenation of near-bottom waters and release toxic hydrogen sulfide gases (Black et al., 1996; Brooks et al., 2002). Therefore, in absence of soft sediments and the associated traditional indicators, the information that can be derived from the overlying veneers serve as a good proxy for benthic effects.
Another particularly encouraging feature in the data was sensitivity of the method with respect to distance from farm. It is well known that thick anaerobic bacterial mats can form on the accumulated organic matter directly beneath farms and that these assemblages can be discerned visually (Hamoutene et al., 2016; Salvo et al., 2017) and effectively distinguished using high-throughput sequencing techniques (Verhoeven et al., 2016, 2018). However, at all farms, visual signs of effects were virtually absent beyond ca 200 m, especially with regard to visible microbial mats, which tend to form only under acute azoic/anoxic conditions (Findlay and Watling, 1997). Nevertheless, the changes in microbial communities consistently separated the sites in accordance with distance and organic enrichment levels (assessed via b-MBI). Even stations positioned 700 m from the farm were able to be distinguished from those, e.g., 1000 m away. This does, however, beg the question of whether the SIBS samples should be considered a “tracer” variable (i.e., evidence of the presence of waste) versus a measure of ecological effect. In this study, the inferred effects were able to be partially validated against macrofauna samples that were collected from small patches of soft sediments interspersed along the transects at the northern farms, whereby the conventional and established biotic indicators (e.g., AMBI) revealed comparable trends and levels of enrichment. Notably, the macrofauna indicated that both of these farms could be considered highly enriched in close proximity and therefore presented a full enrichment spectrum, as was evidenced by the extreme dominance of the widely recognized opportunistic polychete Capitella sp. (Tenore and Chesney, 1985), coupled with another known opportunist polychete, Ophryotrocha sp. at North-B. These same farms were also intensively surveyed using video techniques (Dunlop et al., 2020, In Review), which revealed spatial thresholds for five epibiota species that will assist with determining ecologically meaningful thresholds for future SIBS samples. This means the method is highly sensitive and can be used to address questions related to the outer limit of effects and total footprint size irrespective of substrate type.
Ideally however, assessments of the level of effect should be derived directly from the sample constituents, as opposed to using the assemblage to scale the samples and then making inference from associations with other parameters. The preliminary calculations of Enrichment Stage based on GeneCode-IDs that were developed for New Zealand sediments were very encouraging in this regard. Enrichment Stage, as determined from the b-MBI (Keeley et al., 2018; Pochon et al., 2020) utilizing molecular eco-groups (ASVs) with known ecological niches, showed a clear gradient consistent with distance and anticipated levels of enrichment for respective farms. It was significant that b-MBI was a stronger influencing factor than Distance in terms of explaining sample differences when substituted within the same PERMANOVA model (Table 4). This is an understandable outcome given that Distance from farm can be an unreliable proxy for effects because waste inputs can vary greatly between farms and farm waste is distributed according to physical site-specific factors, especially depth and hydrodynamics (Black et al., 1996; Bannister et al., 2016). As was observed with distance, the calculated Enrichment Stages were not polarized with respect to “farm” and “non-farm” and instead formed a clear gradient. Whereby, very distant (reference, ca. > 1 km away) stations were considered natural (ca. ES 2, Keeley et al., 2012a, b) and distinguished from intermediate stations (ca. 0.5 km, ES 3-4), which were appreciably less enriched than near-farm stations. The b-MBI indicated that the most impacted (assessed to be ca. ES 6) were farms North-B and South-C, which were also assessed to be the most impacted based on visual signs of severe enrichment (Table 1 and Figure 3). Therefore, using this index, enrichment levels were able to be quantitatively placed on a predefined enrichment scale that has been established over four decades of related research (Pearson and Rosenberg, 1978; Gray et al., 1979; Borja et al., 2000; Hargrave et al., 2008; Keeley et al., 2012a), and in doing so, samples could be assigned ecological meaning in the absence of other environmental data.
The functioning of the index is facilitated by strong changes that were observed in the microbial community in response to organic enrichment, and although details relating to many of the specific ASVs are sparse, there are some that appear to have logical functions in the altered environment. For example, highly enriched sediments were more dominated by the prokaryote family Phaselicystidaceae that has previously been associated with decomposing plant matter (Garcia and Müller, 2014). The Sulfurovaceae family (Class Epsilonproteobacteria, Phylum Proteobacteria) was also much more prevalent in the enriched conditions; a bacteria Class that has a diverse range of functions that notably includes their capacity to perform sulfur oxidation coupled to N-oxide reduction and carbon fixation (Hügler et al., 2005; Campbell et al., 2009). Epsilonproteobacteria are also commonly found in sulfur-rich sediments and surrounding microbial mats (Moussard et al., 2006; Hubert et al., 2012). Protobacteria species have also been observed dominating organically enriched sediments under fish farms elsewhere in Norway (Stoeck et al., 2018a; Keeley et al., 2020), and in recovering sediments in Newfoundland, Canada (Desulfobacter sp., Verhoeven et al., 2018). Clearly, there is still a lot to learn about the functioning and the ubiquity of ASVs that reoccur in these types of conditions, which would contribute greatly to the social acceptance of the resulting biological indices and accordingly their use in regulation.
Although the enrichment gradient was the main factor responsible for sample separation, other spatial and substrate-related factors were also significant and warrant some discussion. In the analysis of the northern farms, the significant differences due to sample type (i.e., SIBS versus sediment grab samples) were very likely attributable to mechanical and analytical procedures as opposed to true sample derived differences. Two factors may have contributed. First, the use of the van Veen grab is recognized as a suboptimal methodology for the isolation of intact surface sediment layers for eDNA applications. Particularly, the considerable grab lifting distance (up to 120 m) in this study likely affected the sediment surface, potentially flushing a portion of the typically surface-dwelling bacterial communities thereby skewing the direct comparison with the surface microbes that were effectively captured by the SIBS. Second, two different DNA extraction kits were used to isolate the grab samples (Qiagen PowerSoil kit) and the SIBS samples (Quick-DNA/RNA Miniprep Zymo kit). While both of these commercial kits are routinely used to extract high-quality nucleic acids from environmental samples, subtle differences in the physico-chemical properties of sediments and the corresponding kit chemistry may impact the recovery of genetic material, hence leading to significant differences in microbial community composition (Zielińska et al., 2017). Further research is required to better comprehend the implications of kit selection (Pearman et al., 2020).
Lastly, at the beginning of this analysis we compared methods for elucidating differences in the microbial communities with respect to the anticipated changes due to organic enrichment. The weighted UniFrac (Lozupone and Knight, 2005) approach proved to be most effective, more so than conventional numerical transformations of the read abundance data (presence–absence and square-root transformation) with Bray–Curtis ordinations. As such, this finding suggests that there is additional value in taking phylogenetic relatedness between taxa into account. In cases where samples are geographically distant, such as in this study, it reduces the variance that could be due to allopatric speciation while retaining variance associated with environmental conditions, thus improving sensitivity toward fish farm activities.
Summary and Conclusion
This study demonstrates that it is possible to obtain useful environmental information from almost any subtidal substrate and used in conjunction with sensitive eDNA metabarcoding techniques, to assess the degree of influence from fish farm waste. The SIBS, a purpose-built benthic sampler was used to “hoover up” veneers of unconsolidated organic and inorganic sediments from a variety of substrates, at depth and in a controlled manner. The microbial assemblages within the sample material consistently indicated changes with proximity to farm, while source substrate type and sampling mechanisms (SIBS versus grabbed sediments) had a comparatively small influence. At the minimum, the new sampling method provides a means of accurately mapping farm influence across almost all marine substrates, filling gaps that would have previously existed due to the inability to obtain a grab sample. Moreover, the influential specificity of microbial genotypes recovered in this study proved to be surprisingly ubiquitous such that a small GeneCode-ID library developed for sediments on the other side of the planet had sufficient shared taxa to allow the calculation of an enrichment indicating biotic index and place the samples on an established enrichment scale. These findings have major implications for the future management of fish farms that are situated over hard substrates that were, until now, deemed unsampleable, and therefore have not been effectively environmentally managed. The new method is likely to have many more applications, for example obtaining samples to trace other waste sources such as municipal outfalls, rivers, or oil extraction facilities.
Data Availability Statement
The datasets presented in this study can be found in online repositories. The names of the repository/repositories and accession number(s) can be found in the article/Supplementary Material.
Author Contributions
NK contributed to all aspects and was the primary author. OL assisted with sampling, was responsible for eDNA analysis and bioinformatics, and contributed to data analysis and text. MB was responsible for SIBS design and engineering, as well as testing and development, and contributed to text. XP assisted with original concept, SIBS design and development, sampling and genetics advice, and sequencing, and contributed to text. All authors contributed to the article and approved the submitted version.
Funding
The support and funding for this project was provided by the Norwegian Research Council under the project 267829 SUSTAINable AQUAculture in the North: identifying thresholds, indicators, and tools for future growth.
Conflict of Interest
MB was the owner and director ofMarine Design Engineering Ltd.
The remaining authors declare that the research was conducted in the absence of any commercial or financial relationships that could be construed as a potential conflict of interest.
Acknowledgments
We are grateful to Raymond Bannister for his project management role at the start of the project and for the valuable field assistance and suggestions provided by Astrid Harendza and Pia Kupka Hansen.
Supplementary Material
The Supplementary Material for this article can be found online at: https://www.frontiersin.org/articles/10.3389/fmars.2021.627687/full#supplementary-material
References
Bannister, R. J., Johnsen, I. A., Hansen, P. K., Kutti, T., and Asplin, L. (2016). Near- and far-field dispersal modelling of organic waste from Atlantic salmon aquaculture in fjord systems. ICES J. Mar. Sci. 73, 2408–2419. doi: 10.1093/icesjms/fsw027
Barton, L. L., and Hamilton, W. A. (2007). Sulphate Reducing Bacteria. Environmental and Engineering Systems, 1st Edn. Cambridge: Cambridge University Press.
Bisset, A., Cook, P. L. M., Macleod, C. M., Bowman, J. P., and Burke, C. (2009). Effects of organic perturbation on marine sediument betaproteobacterial ammonia oxidizers and on benthic nitrogen biogeochemistry. Mar. Ecol. Prog. Ser. 392, 17–32.
Black, K. D., Kiemer, M. C. B., and Ezzi, I. A. (1996). The relationships between hydrodynamics, the concentration of hydrogen sulphide produced by polluted sediments and fish health at several marine cage farms in Scotland and Ireland. J. Appl. Ichthyol. 12, 15–20. doi: 10.1111/j.1439-0426.1996.tb00053.x
Blackburn, T. H., and Blackburn, N. D. (1992). Model of nitrification and denitrification in marine sediments. FEMS Microbiol. Lett. 100, 517–521. doi: 10.1111/j.1574-6968.1992.tb14086.x
Borja, A., Franco, J., and Perez, V. (2000). A marine biotic index to establish the ecological quality of soft-bottom benthos within European estuarine and coastal environments. Mar. Pollut. Bull. 40, 1100–1114.
Bostock, J., McAndrew, B., Richards, R., Jauncey, K., Telfer, T., Lorenzen, K., et al. (2010). Aquaculture: global status and trends. Philos. Trans. R. Soc. B Biol. Sci. 365, 2897–2912.
Brooks, K. M., Mahnken, C., and Nash, C. (2002). “Environmental effects associated with marine netpen waste with emphasis on salmon farming in the Pacific northwest,” in Responsible Marine Aquaculture, eds R. R. Stickney and J. P. McVey (Wallingford: CAB International), 159–203.
Cahill, A. E., Pearman, J. K., Borja, A., Carugati, L., Carvalho, S., Danovaro, R., et al. (2018). A comparative analysis of metabarcoding and morphology-based identification of benthic communities across different regional seas. Ecol. Evol. 8, 8908–8920.
Callahan, B. J., McMurdie, P. J., Rosen, M. J., Han, A. W., Johnson, A. J. A., and Holmes, S. P. (2016). DADA2: high-resolution sample inference from Illumina amplicon data. Nat. Methods 13, 581–583. doi: 10.1038/nmeth.3869
Campbell, B. J., Smith, J. L., Hanson, T. E., Klotz, M. G., Stein, L. Y., Lee, C. K., et al. (2009). Adaptations to submarine hydrothermal environments exemplified by the genome of Nautilia profundicola. PLoS Genet. 5:e1000362. doi: 10.1371/journal.pgen.1000362
Cordier, T., Alonso-Sáez, L., Apothéloz-Perret-Gentil, L., Aylagas, E., Bohan, D. A., Bouchez, A., et al. (2020). Ecosystems monitoring powered by environmental genomics: a review of current strategies with an implementation roadmap. Mol. Ecol. 1–22. doi: 10.1111/mec.15472
Crawford, C. M., Mitchell, I. M., and Macleod, C. K. (2001). Video assessment of environmental impacts of salmon farms. ICES J. Mar. Sci. 58, 445–452.
Deiner, K., Bik, H. M., Mächler, E., Seymour, M., Lacoursière-Roussel, A., Altermatt, F., et al. (2017). Environmental DNA metabarcoding: transforming how we survey animal and plant communities. Mol. Ecol. 26, 5872–5895. doi: 10.1111/mec.14350
Dowle, E., Pochon, X., Keeley, N., and Wood, S. A. (2015). Assessing the effects of salmon farming seabed enrichment using bacterial community diversity and high-throughput sequencing. FEMS Microbiol. Ecol. 91:fiv089. doi: 10.1093/femsec/fiv089
Dunlop, K., Harendza, A., and Keeley, N. (In Review). Sustainable Aquaculture in the North; Epifaunal Indicators of Organic Material Released from Salmon Aquaculture on Hard and Mixed Substrates in Northern Norway.
Dunlop, K., Harendza, A., Plassen, L., and Keeley, N. (2020). Epifaunal habitat associations of sessile epifauna on mixed and hard bottom substrates in northern Norwegian fjords. Front. Mar. Sci. 7:568802. doi: 10.3389/fmars.2020.568802
Edge, K. J., Johnston, E. L., Dafforn, K. A., Simpson, S. L., Kutti, T., and Bannister, R. J. (2016). Sub-lethal effects of water-based drilling muds on the deep-water sponge Geodia barretti. Environ. Pollut. 212, 525–534. doi: 10.1016/j.envpol.2016.02.047
FAO (2018). The State of World Fisheries and Aquaculture 2018- Meeting the Sustainable Development Goals. Rome: FAO.
Findlay, R. H., and Watling, L. (1997). Prediction of benthic impact for salmon net-pens based on the balance of benthic oxygen supply and demand. Mar. Ecol. Prog. Ser. 155, 147–157. doi: 10.3354/meps155147
Garcia, R., and Müller, R. (2014). “The family Phaselicystidaceae,” in The Prokaryotes: Deltaproteobacteria and Epsilonproteobacteria, eds E. Rosenberg, E. F. DeLong, S. Lory, E. Stackebrandt, and F. Thompson (Berlin: Springer), 239–245.
Gowen, R. J., and Bradbury, N. B. (1987). The ecological impact of salmon farming in coastal waters: a review. Oceanogr. Mar. Biol. Annu. Rev. 25, 563–575.
Gray, J. S., Waldichuk, M., Newton, A. J., Berry, R. J., Holden, A. V., and Pearson, T. H. (1979). Pollution-induced changes in populations [and discussion]. Philos. Trans. R. Soc. Lond. Ser. B Biol. Sci. 286, 545–561.
Hamoutene, D., Salvo, F., Cross, S., Dufour, S. C., and Donnet, S. (2018). Linking the presence of visual indicators of aquaculture deposition to changes in epibenthic richness at finfish sites installed over hard bottom substrates. Environ. Monit. Assess. 190:750. doi: 10.1007/s10661-018-7108-2
Hamoutene, D., Salvo, F., Donnet, S., and Dufour, S. C. (2016). The usage of visual indicators in regulatory monitoring at hard-bottom finfish aquaculture sites in Newfoundland (Canada). Mar. Pollut. Bull. 108, 232–241. doi: 10.1016/j.marpolbul.2016.04.028
Hargrave, B. T., Holmer, M., and Newcombe, C. P. (2008). Towards a classification of organic enrichment in marine sediments based on biogeochemical indicators. Mar. Pollut. Bull. 56, 810–824.
Holmer, M. (2010). Environmental issues of fish farming in offshore waters: perspectives, concerns and research needs. Aquac. Environ. Int. 1, 57–70. doi: 10.3354/aei00007
Hubert, C. R. J., Oldenburg, T. B. P., Fustic, M., Gray, N. D., Larter, S. R., Penn, K., et al. (2012). Massive dominance of Epsilonproteobacteria in formation waters from a Canadian oil sands reservoir containing severely biodegraded oil. Environ. Microbiol. 14, 387–404. doi: 10.1111/j.1462-2920.2011.02521.x
Hügler, M., Wirsen, C. O., Fuchs, G., Taylor, C. D., and Sievert, S. M. (2005). Evidence for autotrophic CO2 fixation via the reductive tricarboxylic acid cycle by members of the ε subdivision of Proteobacteria. J. Bacteriol. 187, 3020–3027. doi: 10.1128/jb.187.9.3020-3027.2005
Kalantzi, I., and Karakassis, I. (2006). Benthic impacts of fish farming: meta-analysis of community and geochemical data. Mar. Pollut. Bull. 52, 484–493.
Kawahara, N., Shigematsu, K., Miyadai, T., and Kondo, R. (2009). Comparison of bacterial communities in fish farm sediment along an organic enrichment gradient. Aquaculture 287, 107–113.
Keeley, N., Forrest, B., Crawford, C., and Macleod, C. (2012a). Exploiting salmon farm benthic enrichment gradients to evaluate the regional performance of biotic indices and environmental indicators. Ecol. Indic. 23, 453–466.
Keeley, N., MacLeod, C., and Forrest, B. (2012b). Combining best professional judgement and quantile regression splines to improve characterisation of macrofaunal responses to enrichment. Ecol. Indic. 12, 154–166.
Keeley, N., Valdemarsen, T., Strohmeier, T., Pochon, X., Dahlgren, T., and Bannister, R. (2020). Mixed-habitat assimilation of organic waste in coastal environments – it’s all about synergy! Sci. Total Environ. 699:134281. doi: 10.1016/j.scitotenv.2019.134281
Keeley, N., Wood, S. A., and Pochon, X. (2018). Development and preliminary validation of a multi-trophic metabarcoding biotic index for monitoring benthic organic enrichment. Ecol. Indic. 85, 1044–1057. doi: 10.1016/j.ecolind.2017.11.014
Keeley, N. B., Valdemarsen, T., Woodcock, S., Holmer, M., Husa, V., and Bannister, R. J. (2019). Resilience of dynamic coastal benthic ecosystems in response to large-scale finfish farming. Aquac. Environ. Interact. 11, 161–179.
Klindworth, A., Pruesse, E., Schweer, T., Peplies, J., Quast, C., Horn, M., et al. (2012). Evaluation of general 16S ribosomal RNA gene PCR primers for classical and next-generation sequencing-based diversity studies. Nucleic Acids Res. 41:e1.
Klitgaard, A. B. (1995). The fauna associated with outer shelf and upper slope sponges (Porifera, Demospongiae) at the Faroe Islands, northeastern Atlantic. Sarsia 80, 1–22. doi: 10.1080/00364827.1995.10413574
Koziol, A., Stat, M., Simpson, T., Jarman, S., DiBattista, J. D., Harvey, E. S., et al. (2019). Environmental DNA metabarcoding studies are critically affected by substrate selection. Mol. Ecol. Resour. 19, 366–376. doi: 10.1111/1755-0998.12971
Kutti, T., Bannister, R. J., and Fosså, J. H. (2013). Community structure and ecological function of deep-water sponge grounds in the Traenadypet MPA—Northern Norwegian continental shelf. Cont. Shelf Res. 69, 21–30. doi: 10.1016/j.csr.2013.09.011
Lacoursière-Roussel, A., Howland, K., Normandeau, E., Grey, E. K., Archambault, P., Deiner, K., et al. (2018). eDNA metabarcoding as a new surveillance approach for coastal Arctic biodiversity. Ecol. Evol. 8, 7763–7777. doi: 10.1002/ece3.4213
Lader, P., Kristiansen, D., Alver, M., Bjelland, H. V., and Myrhaug, D. (2017). “Classification of aquaculture locations in Norway with respect to wind wave exposure,” in Proceedings of the ASME 2017 36th International Conference on Ocean, Offshore and Arctic Engineering: Ocean Space Utilization. Trondheim, Norway. June 25–30, 2017. V006T05A005, Vol. 6, (New York; NY: ASME). doi: 10.1115/OMAE2017-61659
Larsson, J. (2019). eulerr: Area-Proportional Euler and Venn Diagrams with Ellipses (6.0.0). Available online at: https://cran.r-project.org/package=eulerr
Leys, S. P., Kahn, A. S., Fang, J. K. H., Kutti, T., and Bannister, R. J. (2018). Phagocytosis of microbial symbionts balances the carbon and nitrogen budget for the deep-water boreal sponge Geodia barretti. Limnol. Oceanogr. 63, 187–202. doi: 10.1002/lno.10623
Lozupone, C., and Knight, R. (2005). UniFrac: a new phylogenetic method for comparing microbial communities. Appl. Environ. Microbiol. 71, 8228–8235. doi: 10.1128/aem.71.12.8228-8235.2005
Martin, M. (2011). Cutadapt removes adapter sequences from high-throughput sequencing reads. EMBnet. J 17:10. doi: 10.14806/ej.17.1.200
McCaig, A. E., Phillips, C. J., Stephen, J. R., Kowalchuk, G. A., Harvey, S. M., Herbert, R. A., et al. (1999). Nitrogen cycling and community structure of Proteobacterial β-subgroup ammonia-oxidizing bacteria within polluted marine fish farm sediments. Appl. Environ. Microbiol. 65, 213–220.
McKnight, D. T., Huerlimann, R., Bower, D. S., Schwarzkopf, L., Alford, R. A., and Zenger, K. R. (2019). microDecon: a highly accurate read-subtraction tool for the post-sequencing removal of contamination in metabarcoding studies. Environ. DNA 1, 14–25. doi: 10.1002/edn3.11
McMurdie, P. J., and Holmes, S. (2013). “phyloseq: an R package for reproducible interactive analysis and graphics of microbiome census data,” in PLoS ONE ed M. Watson. 8:e61217. doi: 10.1371/journal.pone.0061217
Moussard, H., Corre, E., Cambon-Bonavita, M.-A., Fouquet, Y., and Jeanthon, C. (2006). Novel uncultured Epsilonproteobacteria dominate a filamentous sulphur mat from the 13°N hydrothermal vent field, East Pacific Rise. FEMS Microbiol. Ecol. 58, 449–463. doi: 10.1111/j.1574-6941.2006.00192.x
MPI (2013). Literature Review of Ecological Effects of Aquaculture. A Collaboration Between Ministry for Primary Industries, Cawthron Institute & National Institute for Water and Atmospheric Research Ltd. August 2013. Wellington: Ministry for Primary Industries.
Oksanen, J., Blanchet, F. G., Kindt, R., Legendre, P., Minchin, P. R., O’Hara, R. B., et al. (2014). Vegan: Community Ecology Package Version 2.2-0. Available online at: http://cran.r-project.org/web/packages/vegan/vegan.pdf (accessed November 1, 2016).
Pawlowski, J., Esling, P., Lejzerowicz, F., Cordier, T., Visco, J. A., Martins, C. I. M., et al. (2016a). Benthic monitoring of salmon farms in Norway using foraminiferal metabarcoding. Aquac. Environ. Interact. 8, 371–386.
Pawlowski, J., Lejzerowicz, F., Apotheloz-Perret-Gentil, L., Visco, J., and Esling, P. (2016b). Protist metabarcoding and environmental biomonitoring: time for change. Eur. J. Protistol. 55(Part A), 12–25. doi: 10.1016/j.ejop.2016.02.003
Pawlowski, J., Lejzerowicz, F., and Esling, P. (2014). Next-generation environmental diversity surveys of Foraminifera: preparing the future. Biol. Bull. 227, 93–106.
Pearman, J. K., Keeley, N., Wood, S. A., Laroche, O., Zaiko, A., Thomson-Laing, G., et al. (2020). Comparing sediment DNA extraction methods for assessing organic enrichment associated with marine aquaculture. PeerJ 8:e10231.
Pearson, T. H., and Rosenberg, R. (1978). Macrobenthic succession in relation to organic enrichment and pollution of the marine environment. Oceanogr. Mar. Biol. Annu. Rev. 16, 229–311.
Philippe, E., Franck, L., and Jan, P. (2015). Accurate multiplexing and filtering for high-throughput amplicon-sequencing. Nucleic Acids Res. 43, 2513–2524. doi: 10.1093/nar/gkv107
Pochon, X., Wood, S., Atalah, J., Laroche, O., Zaiko, A., and Keeley, N. (2020). A Validated Protocol for Benthic Monitoring of New Zealand’s Salmon Farms using Environmental DNA. Prepared for Seafood Innovation Ltd, New Zealand King Salmon Company Ltd, Ministry for Primary Industries and Marlborough District Council. Nelson: Cawthron Institute.
Pochon, X., Wood, S. A., Keeley, N. B., Lejzerowicz, F., Esling, P., Drew, J., et al. (2015a). Accurate assessment of the impact of salmon farming on benthic sediment enrichment using foraminiferal metabarcoding. Mar. Pollut. Bull. 100, 370–382. doi: 10.1016/j.marpolbul.2015.08.022
Pochon, X., Zaiko, A., Hopkins, G. A., Banks, J. C., and Wood, S. A. (2015b). Early detection of eukaryotic communities from marine biofilm using high-throughput sequencing: an assessment of different sampling devices. Biofouling 31, 241–251. doi: 10.1080/08927014.2015.1028923
Quast, C., Pruesse, E., Yilmaz, P., Gerken, J., Schweer, T., Yarza, P., et al. (2012). The SILVA ribosomal RNA gene database project: improved data processing and web-based tools. Nucleic Acids Res. 41, D590–D596. doi: 10.1093/nar/gks1219
Salvo, F., Mersereau, J., Hamoutene, D., Belley, R., and Dufour, S. C. (2017). Spatial and temporal changes in epibenthic communities at deep, hard bottom aquaculture sites in Newfoundland. Ecol. Indic. 76, 207–218. doi: 10.1016/j.ecolind.2017.01.019
Sassoubre, L. M., Yamahara, K. M., Gardner, L. D., Block, B. A., and Boehm, A. B. (2016). Quantification of environmental DNA (eDNA) shedding and decay rates for three marine fish. Environ. Sci. Technol. 50, 10456–10464. doi: 10.1021/acs.est.6b03114
Scanes, E., Kutti, T., Fang, J. K. H., Johnston, E. L., Ross, P. M., and Bannister, R. J. (2018). Mine waste and acute warming induce energetic stress in the deep-sea sponge Geodia atlantica and coral Primnoa resedeaformis; results from a Mesocosm study. Front. Mar. Sci. 5:129. doi: 10.3389/fmars.2018.00129
Sepulveda, A. J., Schabacker, J., Smith, S., Al-Chokhachy, R., Luikart, G., and Amish, S. J. (2019). Improved detection of rare, endangered and invasive trout in using a new large-volume sampling method for eDNA capture. Environ. DNA 1, 227–237. doi: 10.1002/edn3.23
Stoeck, T., Frühe, L., Forster, D., Cordier, T., Martins, C. I. M., and Pawlowski, J. (2018a). Environmental DNA metabarcoding of benthic bacterial communities indicates the benthic footprint of salmon aquaculture. Mar. Pollut. Bull. 127, 139–149. doi: 10.1016/j.marpolbul.2017.11.065
Stoeck, T., Kochems, R., Forster, D., Lejzerowicz, F., and Pawlowski, J. (2018b). Metabarcoding of benthic ciliate communities shows high potential for environmental monitoring in salmon aquaculture. Ecol. Indic. 85, 153–164. doi: 10.1016/j.ecolind.2017.10.041
Taberlet, P., Bonin, A., Zinger, L., and Coissac, E. (2018). Environmental DNA: For Biodiversity Research and Monitoring. Oxford: Oxford University Press.
Tenore, K. R., and Chesney, E. J. Jr. (1985). The effects of interaction of rate of food supply and population density on the bioenergetics of the opportunistic polychaete, Capitella capitata (type 1). Limnol. Oceanogr. 30, 1188–1195.
Thomsen, P. F., Kielgast, J., Iversen, L. L., Møller, P. R., Rasmussen, M., and Willerslev, E. (2012). Detection of a diverse marine fish fauna using environmental DNA from seawater samples. PLoS One 7:e41732. doi: 10.1371/journal.pone.0041732
Verhoeven, J. T. P., Salvo, F., Hamoutene, D., and Dufour, S. C. (2016). Bacterial community composition of flocculent matter under a salmonid aquaculture site in Newfoundland, Canada. Aquac. Environ. Interact. 8, 637–646.
Verhoeven, J. T. P., Salvo, F., Knight, R., Hamoutene, D., and Dufour, S. C. (2018). Temporal bacterial surveillance of salmon aquaculture sites indicates a long lasting benthic impact with minimal recovery. Front. Microbiol. 9:3054. doi: 10.3389/fmicb.2018.03054
von Ammon, U., Wood, S. A., Laroche, O., Zaiko, A., Tait, L., Lavery, S., et al. (2018). The impact of artificial surfaces on marine bacterial and eukaryotic biofouling assemblages: a high-throughput sequencing analysis. Mar. Environ. Res. 133, 57–66. doi: 10.1016/j.marenvres.2017.12.003
Walters, B. B. (2007). Competing use of marine space in a modernizing fishery: salmon farming meets lobster fishing on the Bay of Fundy. Can. Geogr. 51, 139–159. doi: 10.1111/j.1541-0064.2007.00171.x
Wang, Q., Garrity, G. M., Tiedje, J. M., and Cole, J. R. (2007). Naïve Bayesian Classifier for Rapid Assignment of rRNA Sequences into the New Bacterial Taxonomy. Appl. Environ. Microbiol. 73, 5261–5267. doi: 10.1128/AEM.00062-07
Wittwer, C., Nowak, C., Strand, D. A., Vrålstad, T., Thines, M., and Stoll, S. (2018). Comparison of two water sampling approaches for eDNA-based crayfish plague detection. Limnologica 70, 1–9. doi: 10.1016/j.limno.2018.03.001
Woodcock, S. H., Strohmeier, T., Strand, Ø, Olsen, S. A., and Bannister, R. J. (2018). Mobile epibenthic fauna consume organic waste from coastal fin-fish aquaculture. Mar. Environ. Res. 137, 16–23. doi: 10.1016/j.marenvres.2018.02.017
Woodcock, S. H., Troedsson, C., Strohmeier, T., Balseiro, P., Skaar, K. S., and Strand, Ø (2017). Combining biochemical methods to trace organic effluent from fish farms. Aquac. Environ. Interact. 9, 429–443.
Zhang, M., Zhang, T., Shao, M. F., and Fang, H. H. P. (2009). Autotrophic denitrification in nitrate-induced marine sediment remediation and Sulfurimonas denitrificans-like bacteria. Chemosphere 76, 677–682. doi: 10.1016/j.chemosphere.2009.03.066
Keywords: metabarcoding, bacteria, metataxonomics, fish farms, salmon, organic enrichment, environmental DNA (eDNA)
Citation: Keeley N, Laroche O, Birch M and Pochon X (2021) A Substrate-Independent Benthic Sampler (SIBS) for Hard and Mixed-Bottom Marine Habitats: A Proof-of-Concept Study. Front. Mar. Sci. 8:627687. doi: 10.3389/fmars.2021.627687
Received: 20 November 2020; Accepted: 01 March 2021;
Published: 14 April 2021.
Edited by:
Stelios Katsanevakis, University of the Aegean, GreeceReviewed by:
Laura Carugati, University of Cagliari, ItalyXiaoping He, Department of Fisheries and Oceans, Canada
Copyright © 2021 Keeley, Laroche, Birch and Pochon. This is an open-access article distributed under the terms of the Creative Commons Attribution License (CC BY). The use, distribution or reproduction in other forums is permitted, provided the original author(s) and the copyright owner(s) are credited and that the original publication in this journal is cited, in accordance with accepted academic practice. No use, distribution or reproduction is permitted which does not comply with these terms.
*Correspondence: Nigel Keeley, bmtlZWxleUBoaS5ubw==