 Ning Huang
 Shuai Chen1
 Ming He
 Lina Hou
 Miao Miao
- 1Savaid Medical School, University of Chinese Academy of Sciences, Beijing, China
- 2College of Life Sciences, Capital Normal University, Beijing, China
- 3College of Resources and Environment, University of Chinese Academy of Sciences, Beijing, China
Ciliates are the most complex unicellular eukaryotic organisms, which play important roles in various ecosystems. The Euplotes is a dominant genus in the ciliates Euplotida and consists of approximate one hundred species. They distribute widely in environments with various salinity levels including freshwater, brackish, seawater as well as hypersaline. In this study, we obtained four mitochondrial genomes of Euplotes species, using both high throughput sequencing and Sanger sequencing. Combined with two previously reported Euplotes mitochondrial genomes, we analyzed their gene structure, codon usage pattern as well as phylogenetic relationship. We found that gene rearrangement exists in Euplotes and codon usage bias is different among these species. Phylogenetic analyses based on both mitochondrial and nuclear genes further unveiled that Euplotes spp. living in similar salinity levels tend to be clustered together. Moreover, we found that the dN/dS ratios of two mitochondrial genes, cox1 and cox2, are significantly different between marine and freshwater species, indicating the salinity could act as a barrier for the Euplotes species distribution. We also recommended mitochondrial genes to discriminate the species with highly similarity of Euplotes which could not be easily distinguished by nuclear gene marker and morphological characteristics. This study provides novel resources to improve our understanding of Euplotes evolution and also its adaptation to habitats with different salinity levels.
Introduction
Ciliates play important ecological roles in natural environments and become one of the most prevailing model territory in unicellular eukaryotes (Graziano et al., 2010; Gentekaki et al., 2014). They are more diverse and highly differentiated than multicellular eukaryotes (Graziano et al., 2010) and able to survive in various types of environments (Giuseppe et al., 2011). The genus Euplotes is one of hypotrichous ciliates which contains approximately one hundred species (Pedrini et al., 2017). Recent studies have been focus on Euplotes diversity and phylogeny based on morphological characters and molecular data (Yi et al., 2009; Syberg-Olsen et al., 2016). However, different opinions by taxonomists may result in identification confusion, also lack of enough molecular sequences could lead to misestimating the inner relationship among the increasing taxa. Besides, as species in the genus Euplotes have a wide distribution from freshwater to marine water, more genetic traits are needed to provide the relation between salinity and Euplotes clusters. Mitochondrial genome analyses have been playing a growing important role in phylogenetic and evolutionary studies. Mitochondrial genome contains multiple vital genes and has a higher evolutionary rate than nuclear gene markers (Gray et al., 1999; Zhang et al., 2016). The inheritance of mitochondrial DNA occurs in a unique and heritably separate manner that is spatially different from nuclear DNA, which may provide a new perspective for the phylogenetics of the Euplotes. Moreover, its small size makes it to be more accessible than nuclear genome. Therefore, mitochondrial genomes have been widely used to study biogeography, phylogeny as well as evolutionary biology (Ballard, 2000; Sivasankaran et al., 2017). Until now, mitochondrial genomes from only three species have been sequenced in ciliated species (de Graaf et al., 2009; Serra et al., 2019).
This research aims to revisit the phylogenetic relationship among the representative Euplotes species, as well as to explore the correlation between Euplotes evolution and salinity of their habitats from the perspective of mitochondria. We obtained the mitogenomes of two freshwater species (E. aediculatus and E. otocarinatus) and two seawater species (E. vannus and E. focardii) by Sanger sequencing and high throughput sequencing. Then the structure feature and codon usage were compared among all Euplotes mitogenomes. We also identified the major force influencing codon usage pattern. By constructing phylogenetic trees based on both nuclear and mitochondrial genes, we investigated the correlation between phylogenetic diversity and salinity of habitats. Finally, two mitochondrial genes (cox1 and cox2) were speculated to be related to salinity adaptation. These data provided new clues to explore the genetic basis on how Euplotes adapts to diverse habitats.
Materials and Methods
Cultivation and DNA Extraction
E. aediculatus and E. vannus were obtained from Qingdao Agricultural University (Qingdao, China) and Ocean University of China (Qingdao, China), respectively. The former was cultured in sterilized freshwater at the room temperature, while the latter was cultured in sterilized seawater with concentration of 30‰ at the room temperature. When the density of cells reached 600 per milliliter (ml), we used a 15-μm-pore-size nylon filter membrane to harvest them from the medium and washed by sterilized water to reduce bacterial contamination (Kodama and Fujishima, 2005). The cells were starved and incubated with 1 × penicillin-streptomycin antibiotics (Invitrogen, Carlsbad, CA, United States) for 24 h to further eliminate the contamination of bacteria (McGrath et al., 2014; Slabodnick et al., 2017; He et al., 2019). We collected cells by centrifugation at 8,000 rpm/min for 10 min and extracted DNA using the DNeasy Blood & Tissue Kit (Qiagen, Düsseldorf, Germany).
Sequencing and Assembly
We obtained the mitochondrial sequences of E. vannus by Sanger sequencing. Conserved regions between E. minuta and E. crassus were selected to design several pairs of degenerate primers (Supplementary Table 1), then we amplified corresponding regions by degenerate Polymerase Chain Reaction (PCR) (de Graaf et al., 2009; Barth and Berendonk, 2011). The long range PCR was performed to acquire connection between conserved regions. Seqman in DNAstar 7.1 was used to assemble the amplified sequences.
Approximately 2 μg DNA from E. aediculatus was used to construct a DNA library with 500 bp insert size and then sequenced on an Illumina HiSeq 2500 platform. Ultimately, 1858120 read pairs were acquired (PE250). Adaptors and low quality bases were removed by Trimmomatic with default parameters (Bolger et al., 2014). We employed SPAdes to assemble the mitochondrial genome with an option of “careful” (Bankevich et al., 2012; Zhang et al., 2016; Serra et al., 2019) and obtained E. aediculatus mitochondrial contigs by TBLASTN (E value < 1e-5). We further used the same approach to assemble the mitogenomes from two published genomic DNA-seq datasets of E. focardii (SRR3929761) and E. ocatocarinatus (SRR2474557), respectively. The processes of verifying and concatenating the assembled contigs from E. aediculatus were accomplished by PCR.
Annotation
Firstly, we predicted all possible open reading frames (ORFs) from the assembled mitochondrial genomes. If there were multiple ORFs in one position, only the longest one was kept. Besides, ORFs shorter than 150 bp were also removed (Swart et al., 2012). BLASTX was employed to align these ORFs to non-redundant (nr) protein database and Swiss-prot database to detect homologous mitochondrial protein coding sequences. As for the protein coding genes with high divergence, a more sensitive homology detection approach HHpred was used to search against the protein families (Soding et al., 2005), which can detect homology based on HMM-HMM-comparison. The tRNA genes were identified with tRNAscan-SE version 2.0 (Lowe and Chan, 2016). The boundaries of rRNA genes were determined using clustalW by aligning to known Euplotes mitochondrial rRNA genes. The tandem repeat region was determined by Tandem Repeats Finder (Benson, 1999).
AT and GC Skew Profiling
We divided the upstream and downstream sequences of the tandem repeat region into 50 bins, respectively. The cumulative AT skew and cumulative GC skew were calculated by the following formula, where i indicate i-th bin of mitochondrial genome (Grigoriev, 1998).
Codon Usage Bias Analysis
The relative synonymous codon usage (RSCU), effective number of codons (ENC), aromaticity (AROMO) as well as general average hydropathicity (GRAVY) were calculated by CodonW (v1.4.4)1. GC12 represents the mean GC content of the first and second sites of codons, and GC3 represents GC content of the third site of codons. The expect ENC value was calculated according to the previous study (Wright, 1990). Principal component analysis (PCA) and correlation analysis were carried out using R studio (Wei et al., 2014).
Phylogenetic Analysis
SSU-rRNA genes of E. vannus and E. aediculatus were obtained by PCR with degenerated primers Euk-A (5′-AACCTGGTTGATCCTGCCAGT-3′) and EukB (5′- GATCC TTCTGCAGGTTCACCTAC-3′) (Medlin et al., 1988). SSU-rRNA sequences of E. focardii and E. ocatocarinatus were extracted from the assembled contigs by BLASTN, and SSU-rRNA genes of other species were downloaded from GenBank (Supplementary Table 4). These sequences were aligned and manually edited using BioEdit (Hall, 1999). After curation, a total of 1984 positions of SSU-rRNA genes were kept for subsequent phylogenetic analyses. According to MrModeltest (version 2.4)2 with Akaike Information Criterion (AIC), GTR + I + G was the best-fit model for SSU-rRNA genes. The datasets were then analyzed using two phylogenetic methods, Maximum Likelihood (ML) and Bayesian Inference (BI), under the best-fit model. ML analyses with 1000 non-parametric bootstrap replicates were carried out using RAxML (Stamatakis, 2014). BI analyses were performed using MrBayes (Ronquist et al., 2012). Four Markov Chain Monte Carlo (MCMC) were run twice with 106 generations and sampled every 100th cycle, while the first 2500 trees were discarded as burn-in (Fernandes et al., 2016; Shazib et al., 2016).
In order to construct phylogenetic trees using mitochondrial genes, we downloaded mitochondrial genomes of another eleven species in ciliates and Durinskia baltica (outgroup) from GenBank. GET_HOMOLOGUES was employed to identify orthologs genes among these mitogenomes (Contreras-Moreira and Vinuesa, 2013). The selected genes were aligned using MAFFT (Katoh and Standley, 2013) and then combined by SequenceMatrix (Vaidya et al., 2011). Conserved regions in the alignments were determined by Gblocks and all gaps were removed (Castresana, 2000; He et al., 2019). The best-fit model LG + G + F amino acid replacement matrix according to AIC was determined by the ProtTest 3 (Darriba et al., 2011). The phylogenetic tree based on the concatenated mitochondrial genes was constructed by the same method as that based on SSU-rRNA genes.
Analysis of Selection
The ratio of non-synonymous to synonymous substitutions (dN/dS) is usually used to measure strength and mode of natural selection (Jeffares et al., 2015). If dN/dS > 1, positive Darwinian selection (positive selection) is acting on PCGs, whereas dN/dS < 1 suggests purifying selection, and dN/dS = 1 indicates neutral selection. The ω represents estimate dN/dS value. Branch model test was used to test whether ω between Euplotes G1 and G2 is significantly different. The branch model test based on protein coding genes was carried out by the program CODEML of PAML Version 4.8a (Yang, 2007). We set CodonFreq equal to 1. The one ratio model (icode = 3, model = 0) assumes that ω across all branches is identical. For two ratio model (icode = 3, model = 2), Euplotes G2 was selected as the foreground branch, ω0 was for Euplotes G2 species while ω1 was for Euplotes G1 species. The likelihood ratio test was used to compare and test the significance between two models by jModelTest 2 (Darriba et al., 2012).
Results
Structure Feature of Mitochondrial Genomes
Similar to previous reports, the four new mitochondrial genomes in this study also have a linear structure, with the length ranging from 32.6 kb to 43.6 kb (Table 1). All Euplotes mitogenomes have considerably high AT content, especially for E. aediculatus (80.2%) and E. otocarinatus (82.0%). In this study, we used the reannotation of E. minuta (Swart et al., 2012) and reannotated E. crassus through the same strategy (Supplementary Table 2). We found that Euplotes mitochondrial genomes have all protein-coding genes (PCGs) that have been reported in other ciliate mitochondria. Regardless of the ORFs with unknown function, gene order among E. minuta, E. crassus, E. vannus as well as E. focardii is almost the same with exception of nad6, which is absent in E. crassus. Here, we classified these four species as group one, termed as Euplotes G1. Likewise, the arrangements of PCGs in mitochondria of the other two Euplotes species are completely consistent, which could be classified as group two (Euplotes G2). However, there are inversion and translocation of PCGs between these two groups. For species in Euplotes G1, cob locates between ccmF and trnM but it interposes between nad3 and trnH in Euplotes G2. In E. octocarinatus, we also found that nad5-ccmf is translocated to the end of nad1a, but the orientation of transcription remains unchanged (Figure 1).
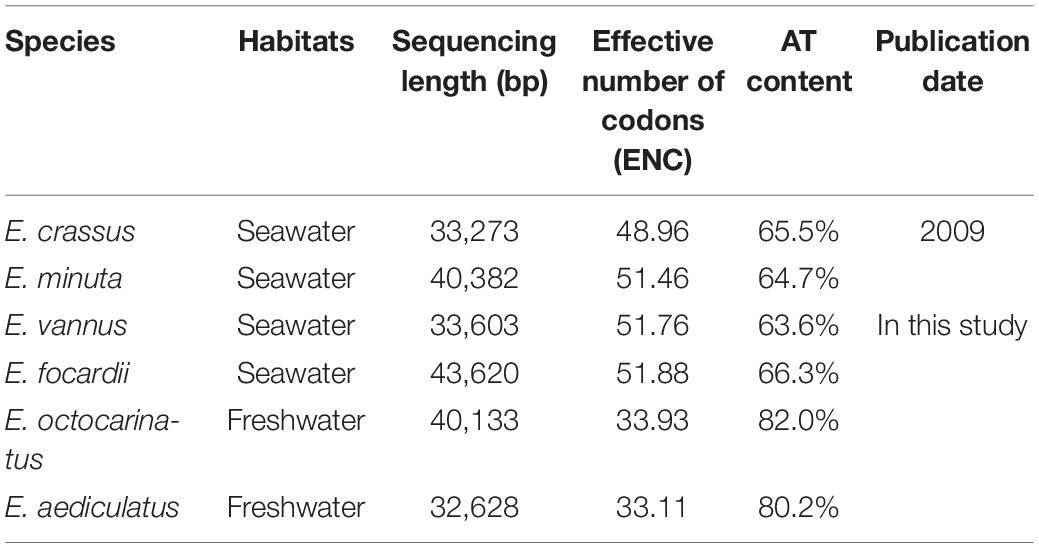
Table 1. Summary of Euplotes mitochondrial genomes.
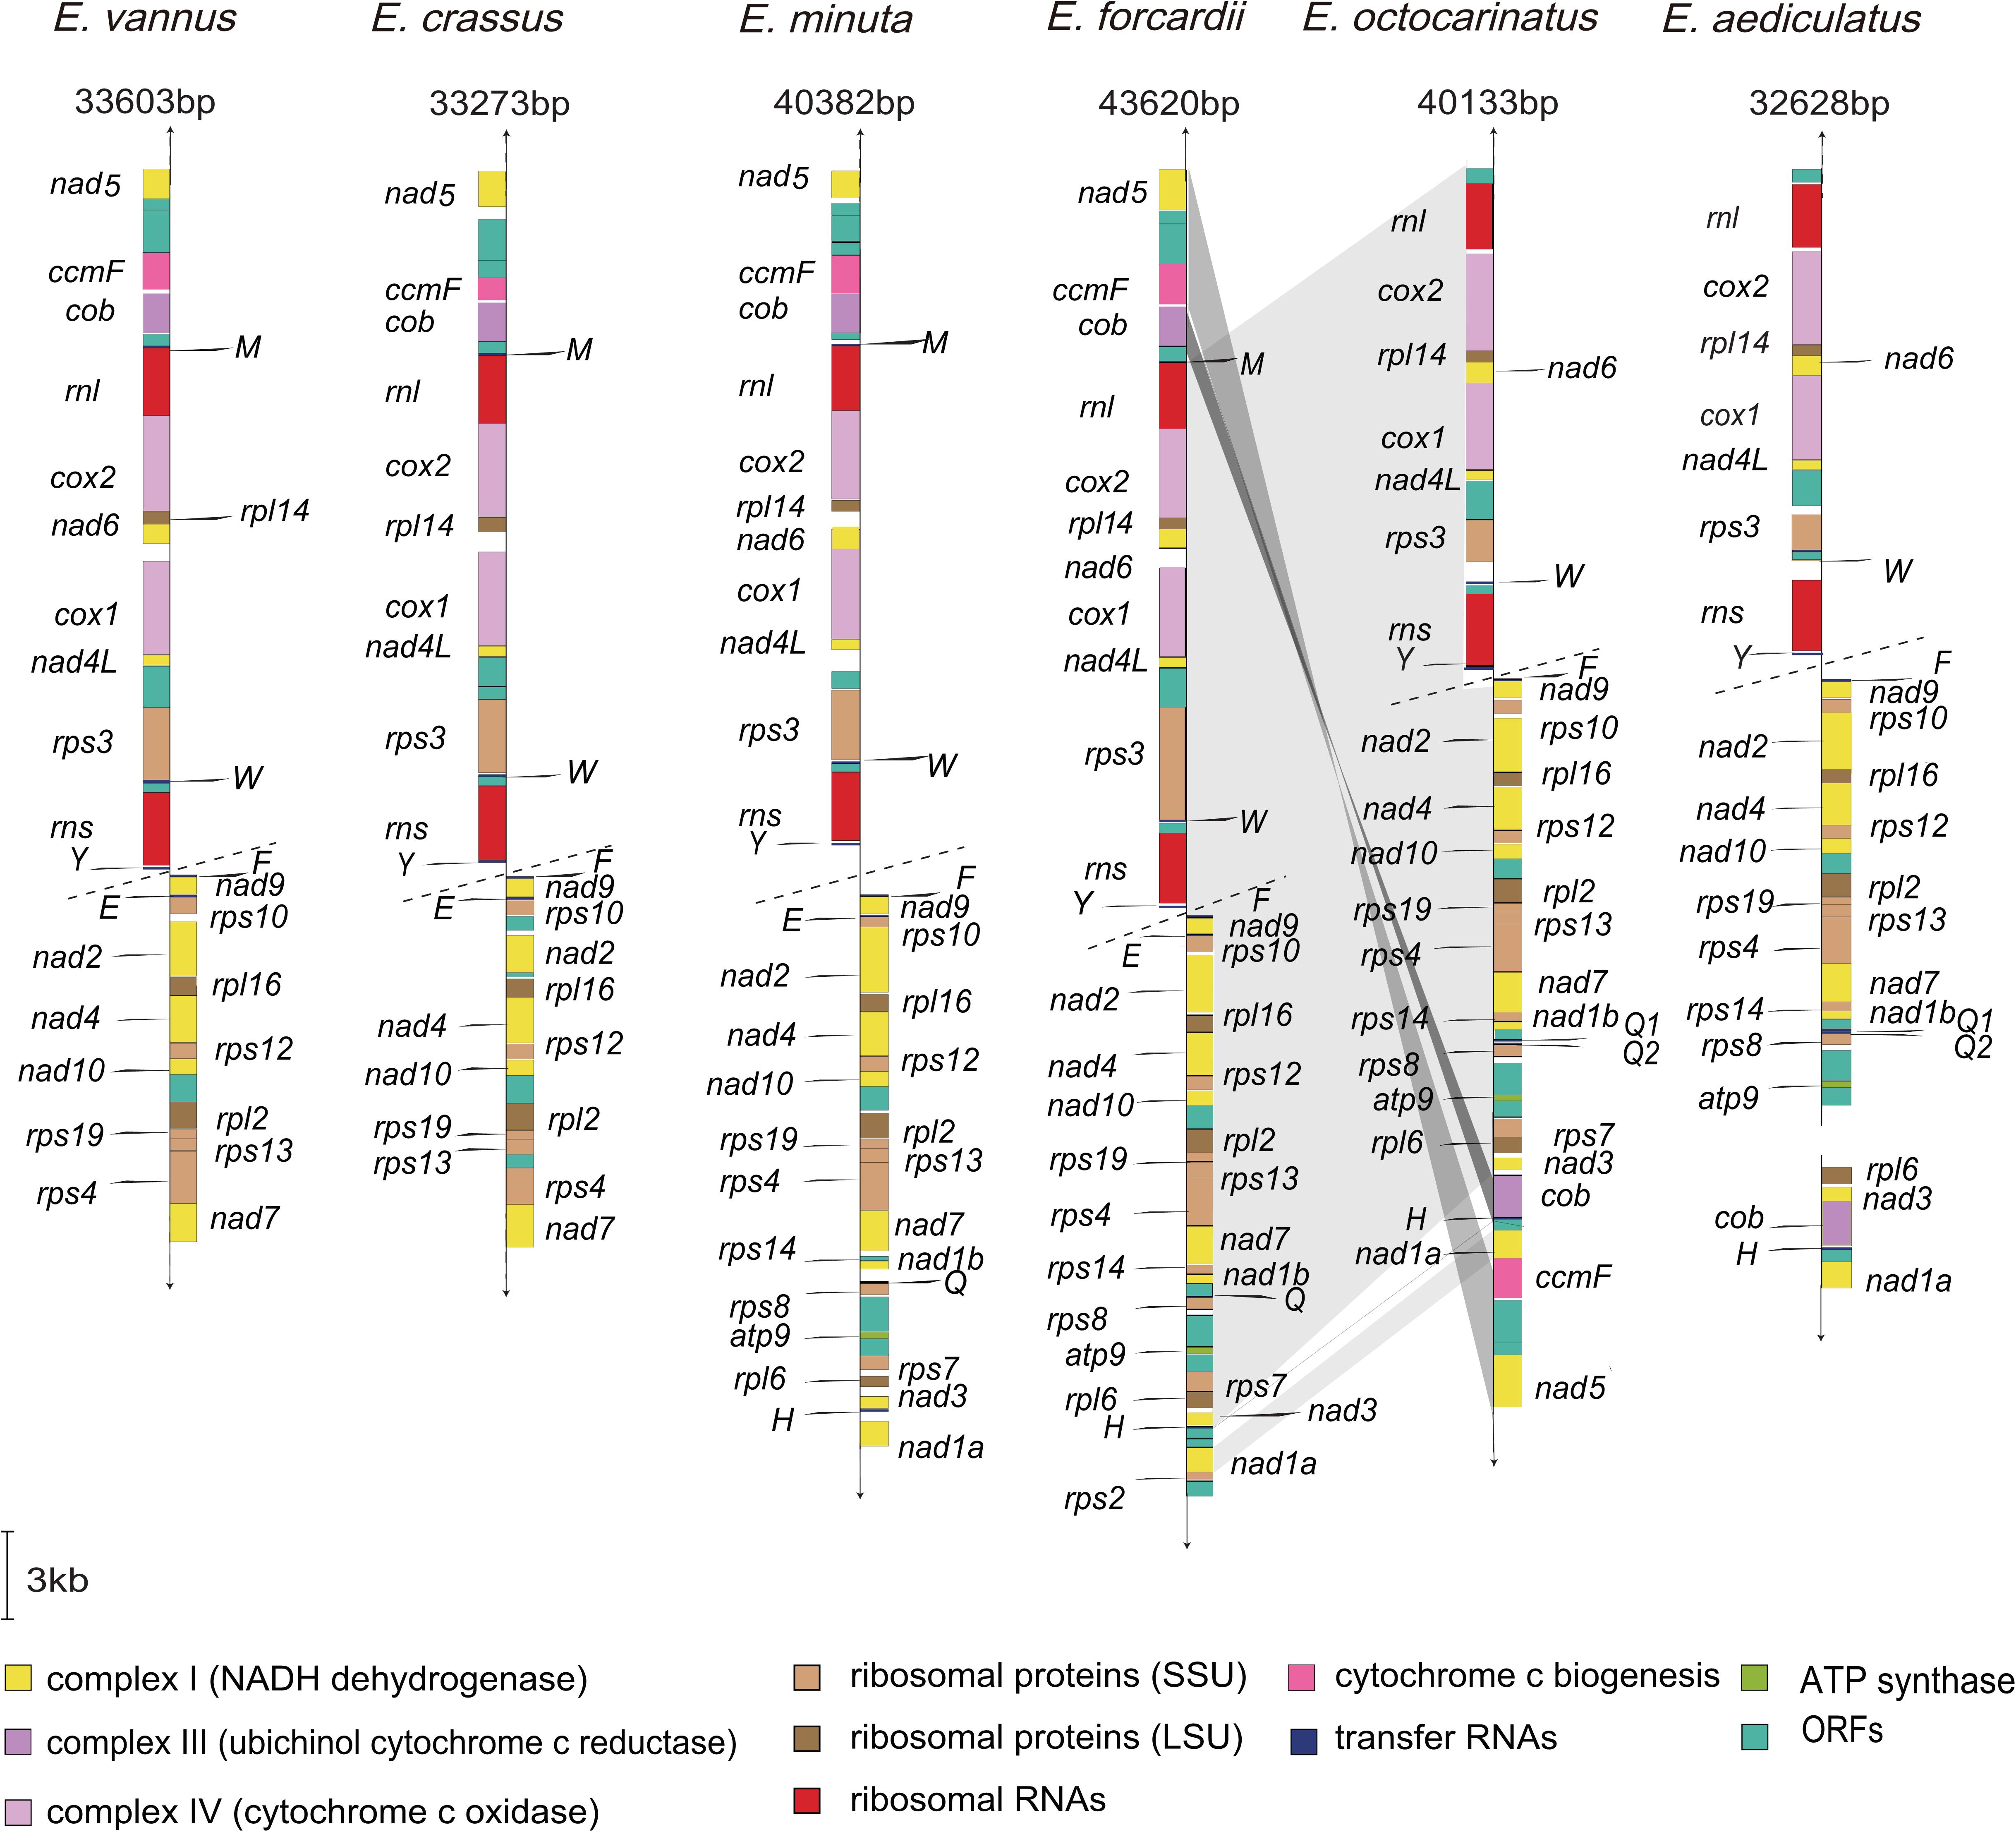
Figure 1. Mitochondrial gene maps in Euplotes. Different colors are used to distinguish genes with different functions. Gray-colored regions represent the collinearity between the two groups of mitochondrial genomes. The dot line indicates the tandem repeat region with unknown length located in mitogenomes. Arrow shows the transcriptional direction of genes. The length of Euplotes mitochondrial genomes is labeled excluding the central tandem repeat region. For E. aediculatus, we obtained two segments from mitochondria and failed to connect them.
Compared with mitochondrial genomes of Euplotes G1, there are no trnM and trnE but two trnQs (Q1 and Q2 in Figure 1) in Euplotes G2 mitogenomes. The trnQ1 in Euplotes G2 owns the same anticodon (UUG) as trnQ in Euplotes G1, while the anticodon of trnQ2 is CUG (Supplementary Figure 1A). Besides, the sequence similarity between Euplotes G2 trnQ1 and Euplotes G1 trnQ is higher than that between Euplotes G2 trnQ2 and Euplotes G1 trnQ (Supplementary Figure 1B). The interspecific divergence of trnQ1 (between E. aediculatus and E. octocarinatus) is smaller than that of trnQ2 both in sequence and structure (Supplementary Figures 1A,B). The disparity of trnQ2 mainly reflects on both D arm and anticodon arms.
Asymmetric Nucleotide Composition Flanking the Tandem Repeat Regions
Although the sequences of the tandem repeat region are not completely consistent within the existing Euplotes mitochondrial genomes, their AT content is obviously higher than that of the entire mitogenome. We calculated AT skew and GC skew of upstream and downstream by regarding the tandem repeat region as midpoint. The AT skew of the non-overlapping windows of all species in upstream are mostly positive while windows in the downstream are opposite, which means there are more A than T in the upstream and more T than A in the downstream. However, the GC skew of Euplotes G1 and Euplotes G2 has different tendencies regardless of upstream or downstream, which means there are more G than C in the upstream and more C than G in the downstream of Euplotes G1 but completely different for Euplotes G2 (Supplementary Figure 2). In order to facilitate the observation of their trend, we calculated cumulative AT skew and cumulative GC skew and found turning points near the tandem repeat region (Figures 2A,B).
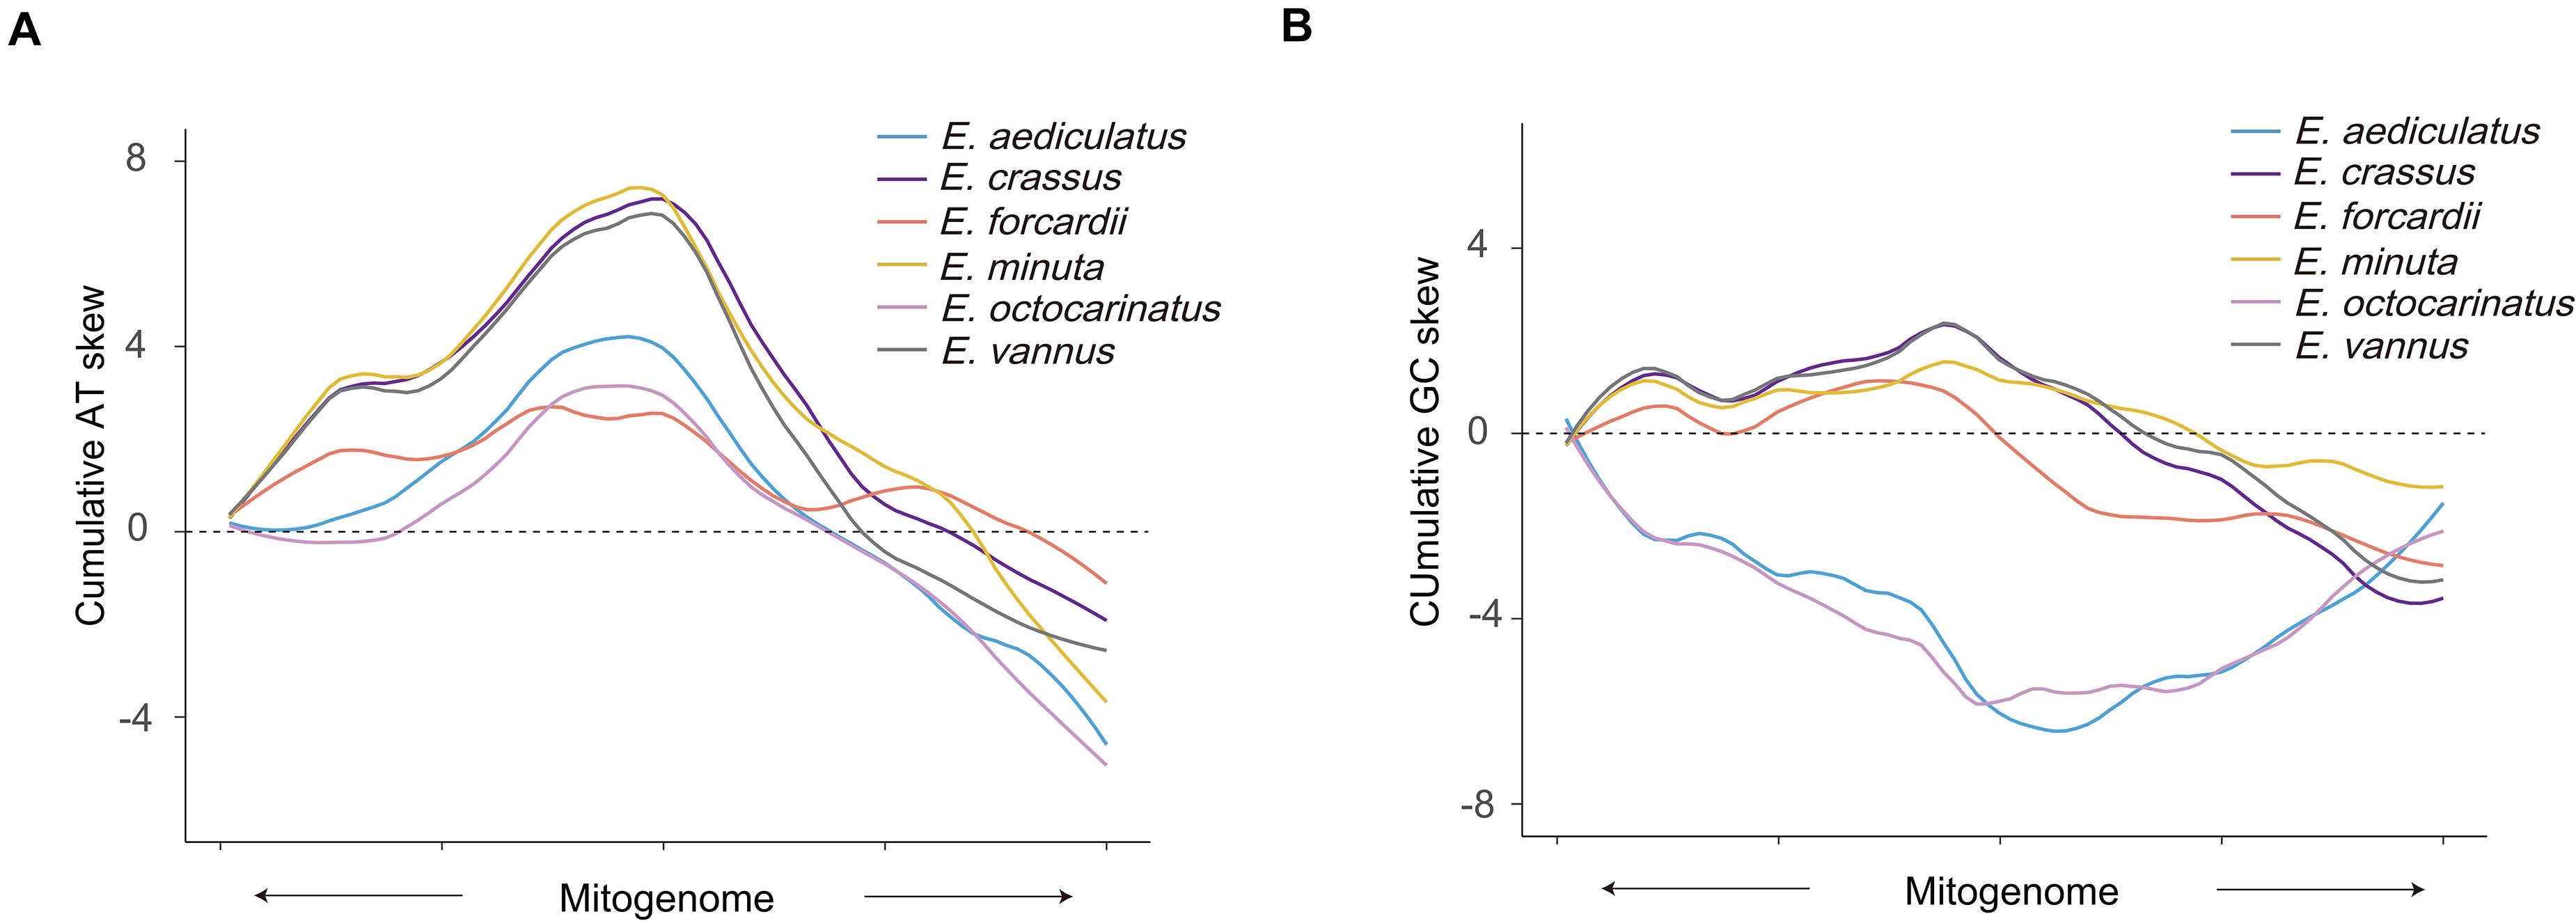
Figure 2. Cumulative AT skew and GC skew of Euplotes mitogenomes. (A) Cumulative AT skew of upstream and downstream of the tandem repeat regions. Upstream and downstream sequences of all mitochondrion are scaled to the same length, respectively. The midpoint of X-axis shows the position of the tandem repeat region. The arrow shows the transcriptional direction. (B) Cumulative GC skew of upstream and downstream of the tandem repeat regions. The meaning of the diagram marks are the same as panel (A).
Codon Usage Bias
The effective number of codons which ranges from 20 to 61 is an index used to measure codon usage bias level (Wright, 1990). A value of 20 indicates that there exists extreme bias - only one codon is used for each amino acid, while a value of 61 indicates no bias that all codons are equally used (Fuglsang, 2006). We found that Euplotes species in G2 have a higher degree of codon usage bias than those in G1 (Table 1). Then, we calculated the relative synonymous codon usage (RSCU) of 61 codons (except two stop codons and ATG) in all Euplotes species and found that Euplotes G1 and G2 exhibit different codon usage patterns but both prefer codons ending with AT. Compared with species belonging to G1, species in G2 seem to use more AT-ending codons (Figure 3A).
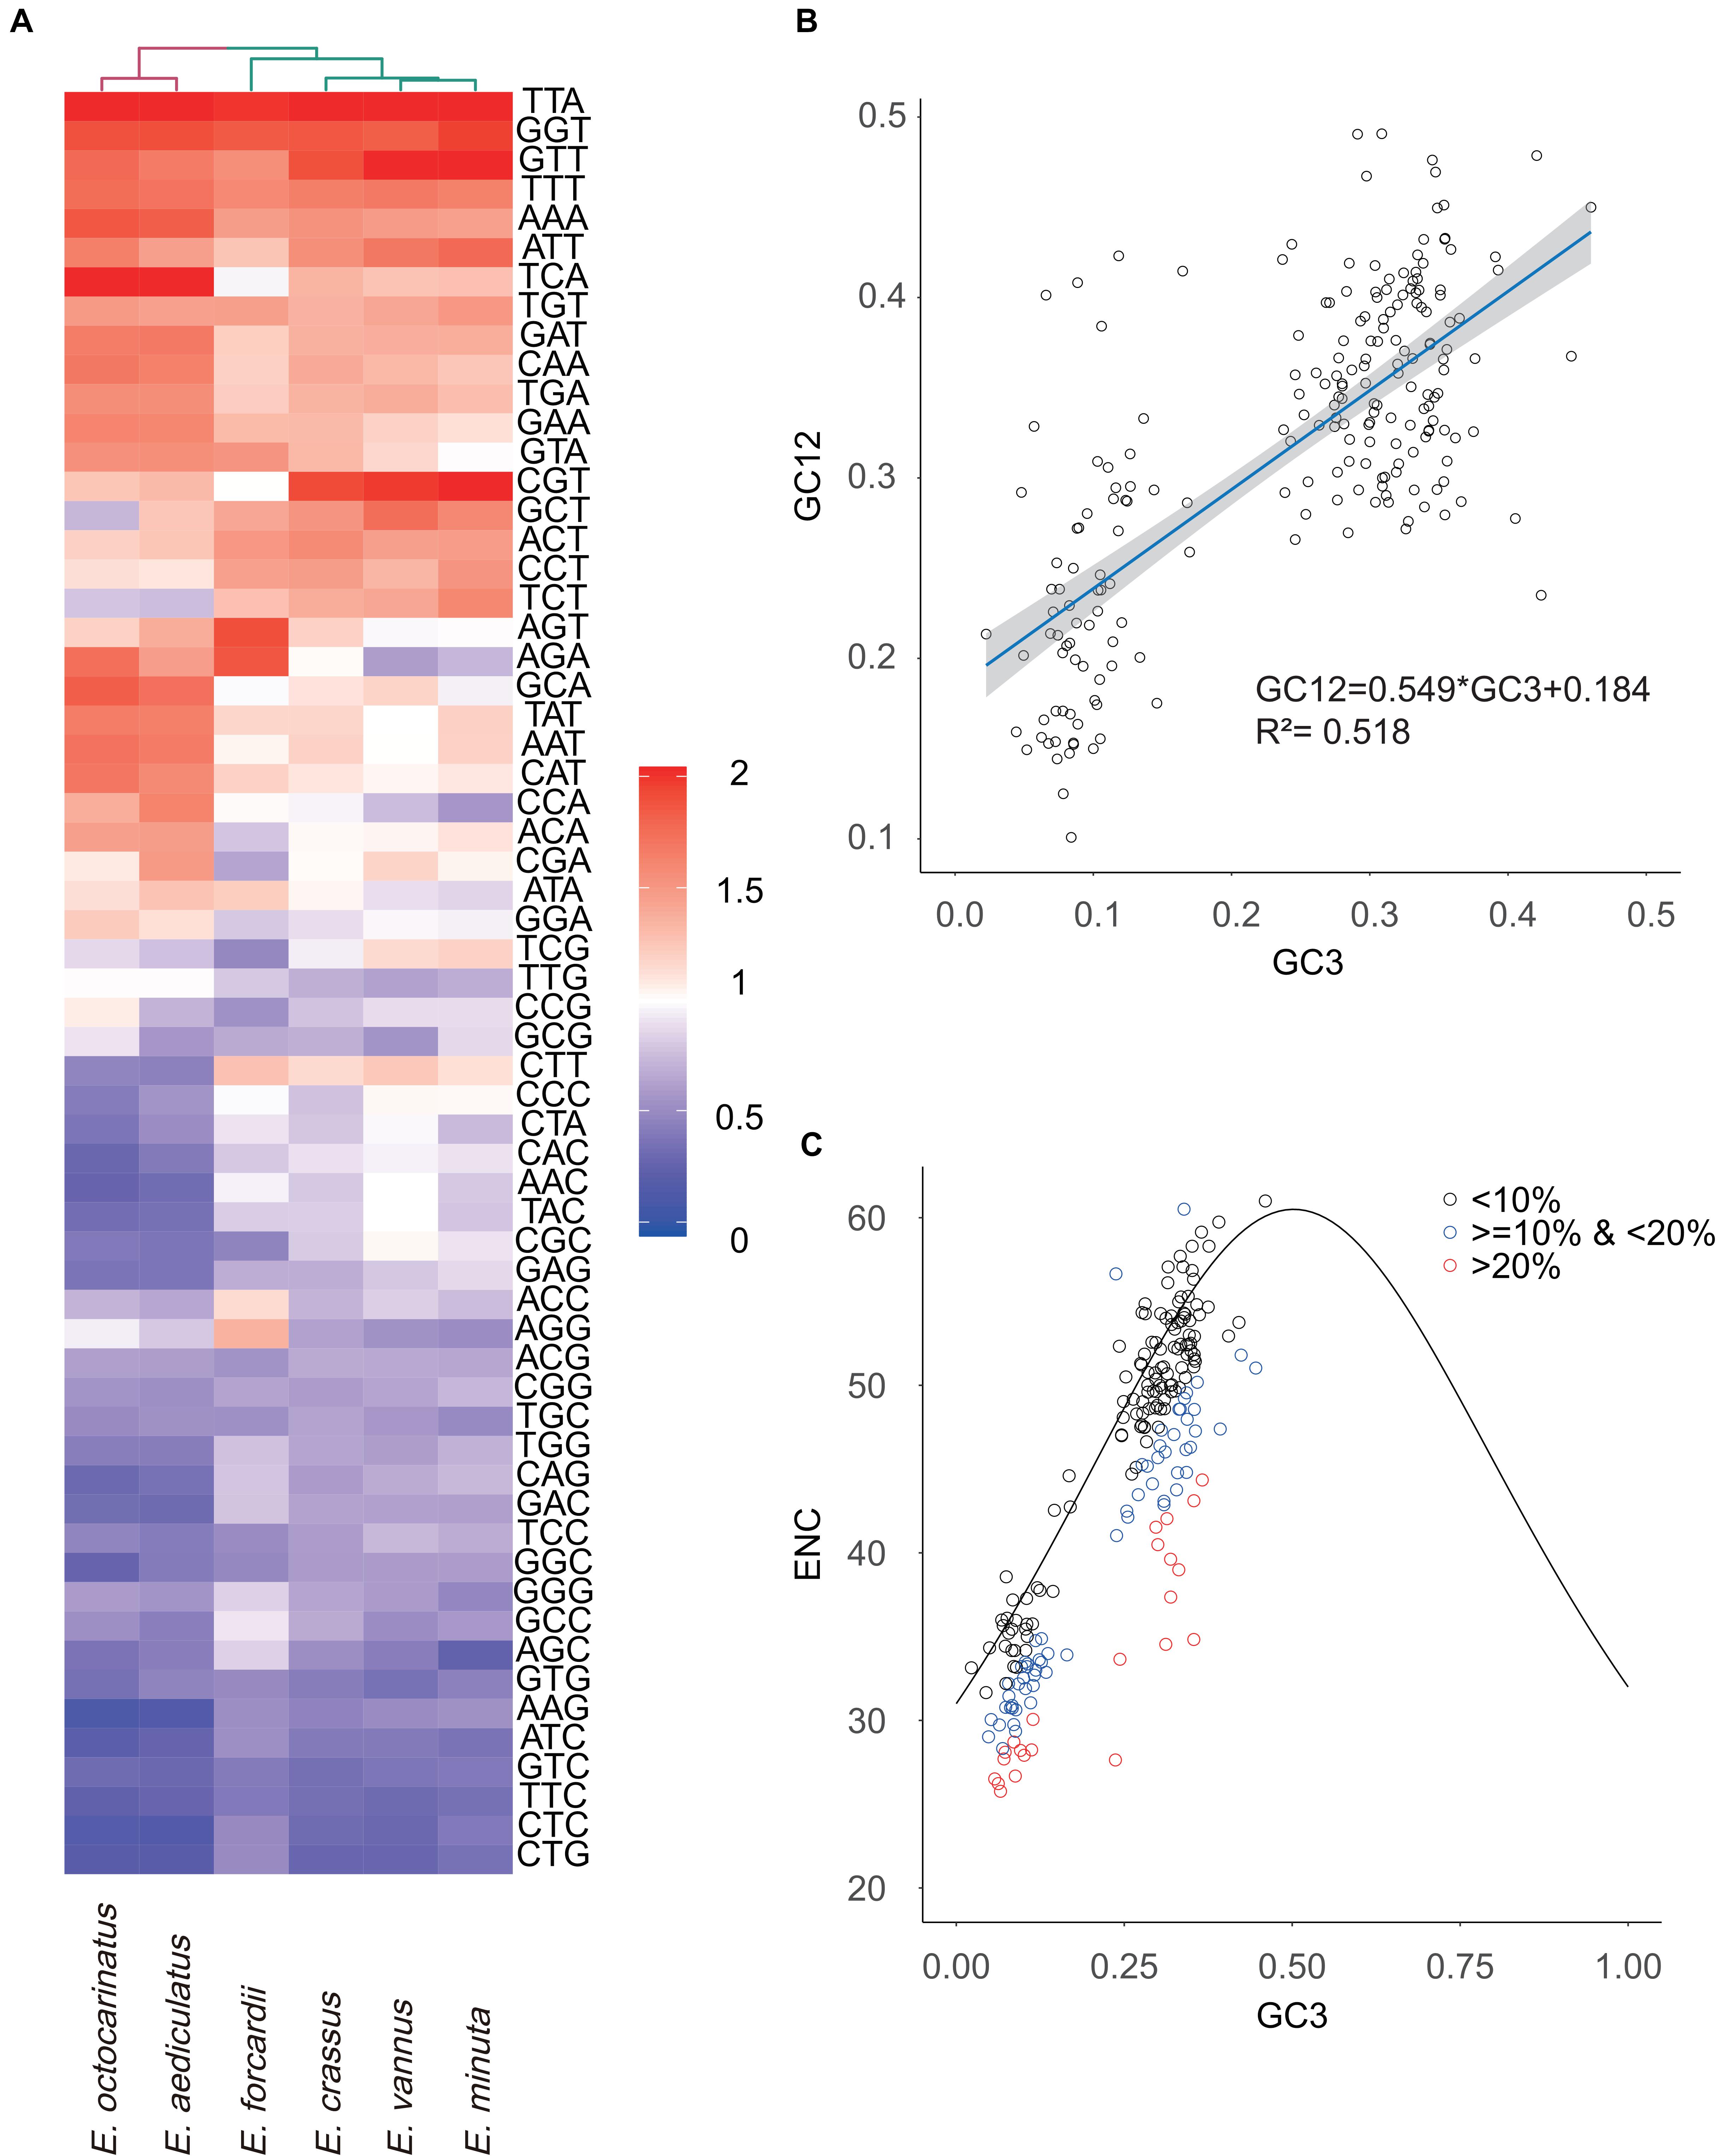
Figure 3. Analysis of codon usage bias. (A) The heatmap shows RSCU values of 61 codons used in Euplotes mitochondrial genomes. (B) Neutrality plot analysis. GC3 refers to GC content of the third codon site, GC12 means GC content of the first and second codon sites. The dark blue line represents the regression line and the gray area represents 95% confidence interval. (C) ENC-plot analysis. We divided genes into three levels (<10%, <20% & >10%, >20%) based on the degree of the actual ENC values deviating from the standard curve.
Factors Influencing Codon Usage
To explore the potential factor that shapes the codon usage bias in Euplotes mitogenomes, the neutrality plot analysis and ENC-plot analysis were carried out using all PCGs as well as ORFs in six Euplotes. The correlation between GC12 and GC3 is statistically significant (r = 0.722, p < 2.2e –16) and the slope of the regression line is 0.549 (R2 = 0.518, p < 2.2e –16) (Figure 3B). We further calculated the expected ENC values by GC3 with the assumption that codon usage bias is only subject to mutation bias. Subsequently, we plotted the standard curve by GC3 and the corresponding expected ENC values. As shown in Figure 3C, most genes distributed near the standard curve and the Pearson correlation coefficient between actual ENC values and expected ENC values is 0.877 (p < 2.2e –16). It should be mentioned that the ENC values of several genes deviated from the standard curve by more than 20%, most of which have shorter length compared to the remaining genes. However, there is no significant difference on gene length between the genes deviated from the standard values by more than 10% and less than 20% and those deviated from the standard values by less than 10% (Supplementary Figure 3).
Principal component analysis was carried out based on 61 synonymous codons. The first principal component (PC1) and the second principal component (PC2) can explain 73.06% and 5.04% of the total variation, respectively. The positions of codon were marked in two-dimensional coordinates and codons ending with AT and GC could be clearly separated (Figure 4A). Both PC1 and PC2 were significantly correlated with GC3 and GC content but only slightly correlated with protein aromaticity (Figure 4B). There is no correlation between these principal components and protein hydrophily.
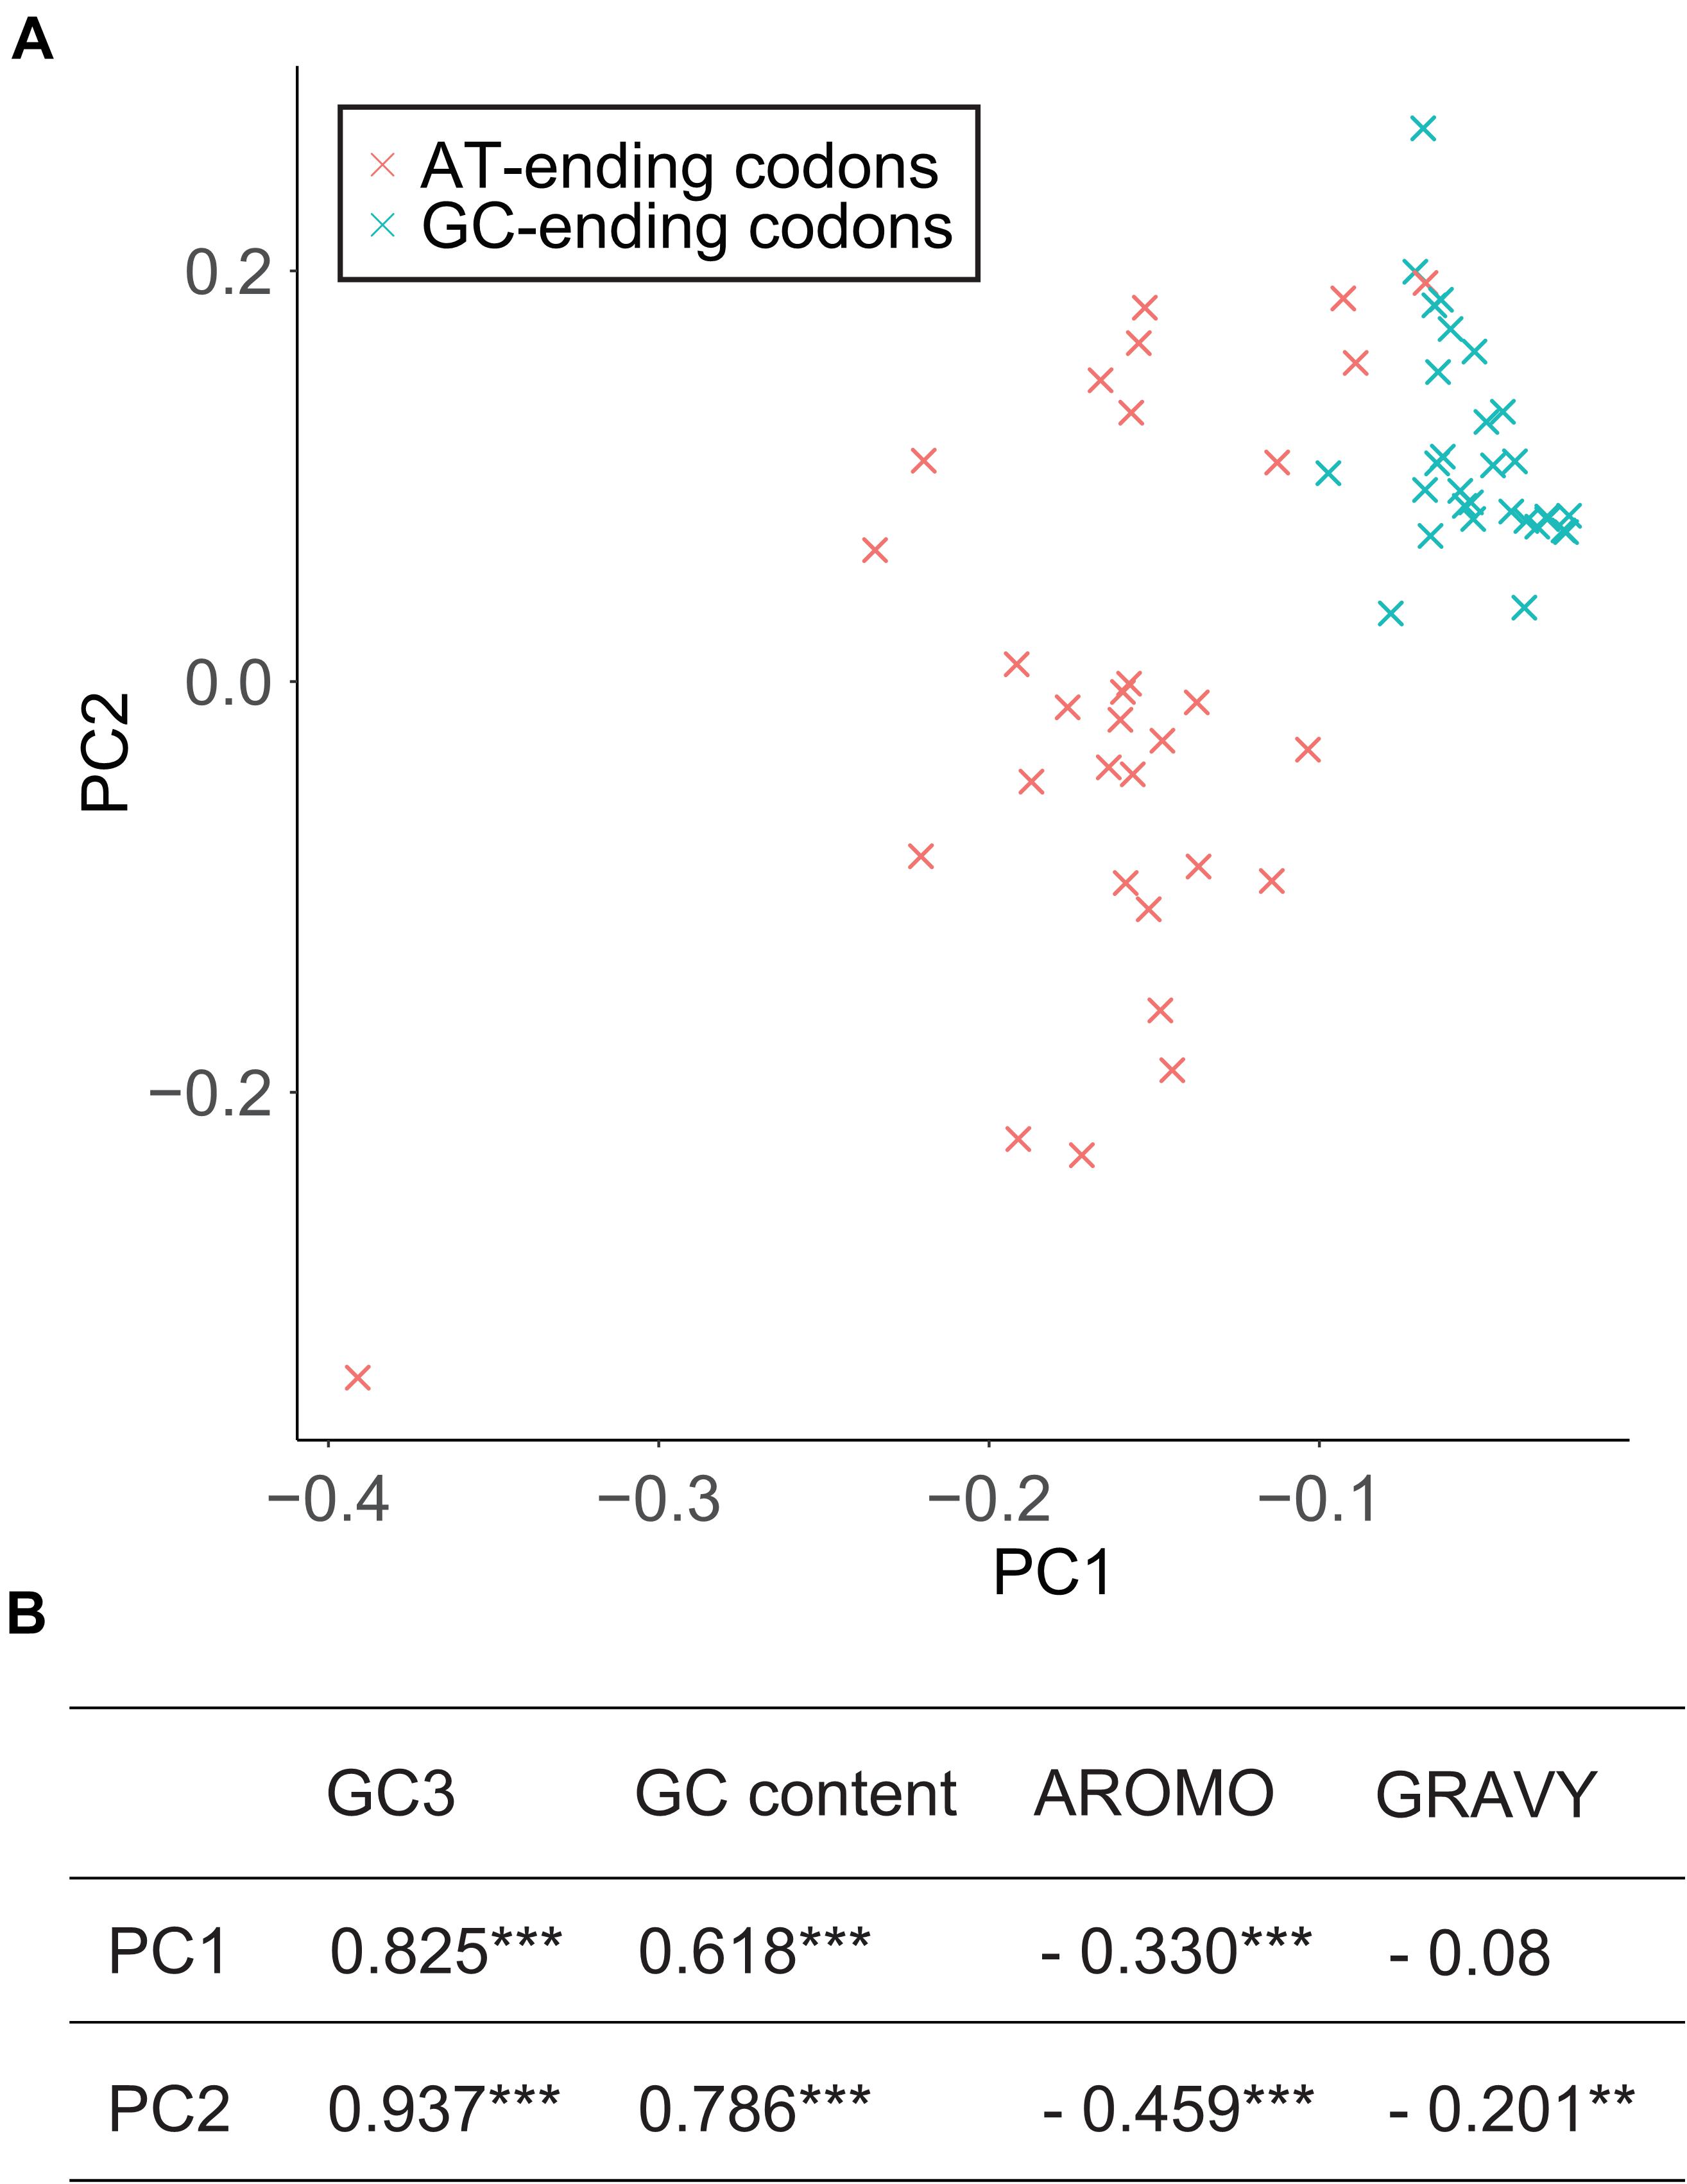
Figure 4. Principal component analysis of codon usage. (A) The first principal component (PC1) and the second principal component (PC2) form two-dimensional coordinate and 61 codons are marked on it. (B) Correlation between principal components and potential factors that may affect codon usage. *** indicates p < 0.001, and ** indicates p < 0.01.
Phylogenetic Analysis
We selected conserved genes that are shared in all sequenced ciliate mitochondrial genomes (Supplementary Table 3), including cox1, cox2, nad4, nad7, rpl2, rps12, to construct phylogenetic trees based on the concatenated sequence of these genes. The phylogenetic trees using ML and BI method have similar topologies so we only present the ML tree with support values of both methods labeling on branches. The sequenced ciliates come from two classes and Euplotes belongs to Spirotrichea. Six Euplotes species were clustered into two groups, G1 and G2 (Figure 5A), which is consistent to the classification based on gene order. We further investigated the evolutionary history of the genus Euplotes based on SSU-rRNA genes (Supplementary Table 4). The phylogentic tree can classify species into five clades, with G1 and G2 belonging to two main clades respectively. Unlike phylogenetic tree based on mitochondrial genes, E. vannus is closer to E. crassus rather than E. minuta. Since salinity was often absent in previous studies, we defined the description of freshwater, brackish water and habitats less than 25‰ salinity to be low salinity while the description of seawater, hypersaline water and habitats more than 25‰ salinity as high salinity (Syberg-Olsen et al., 2016). Both two main clades contain species habitat in low salinity and high salinity and clustered Euplotes species tend to live in similar salinity level (Figure 5B). However, some species, including E. encysticus, E. harpa, E. curdsi and E. petzi, could survive in both high salinity and low salinity environments (Syberg-Olsen et al., 2016).
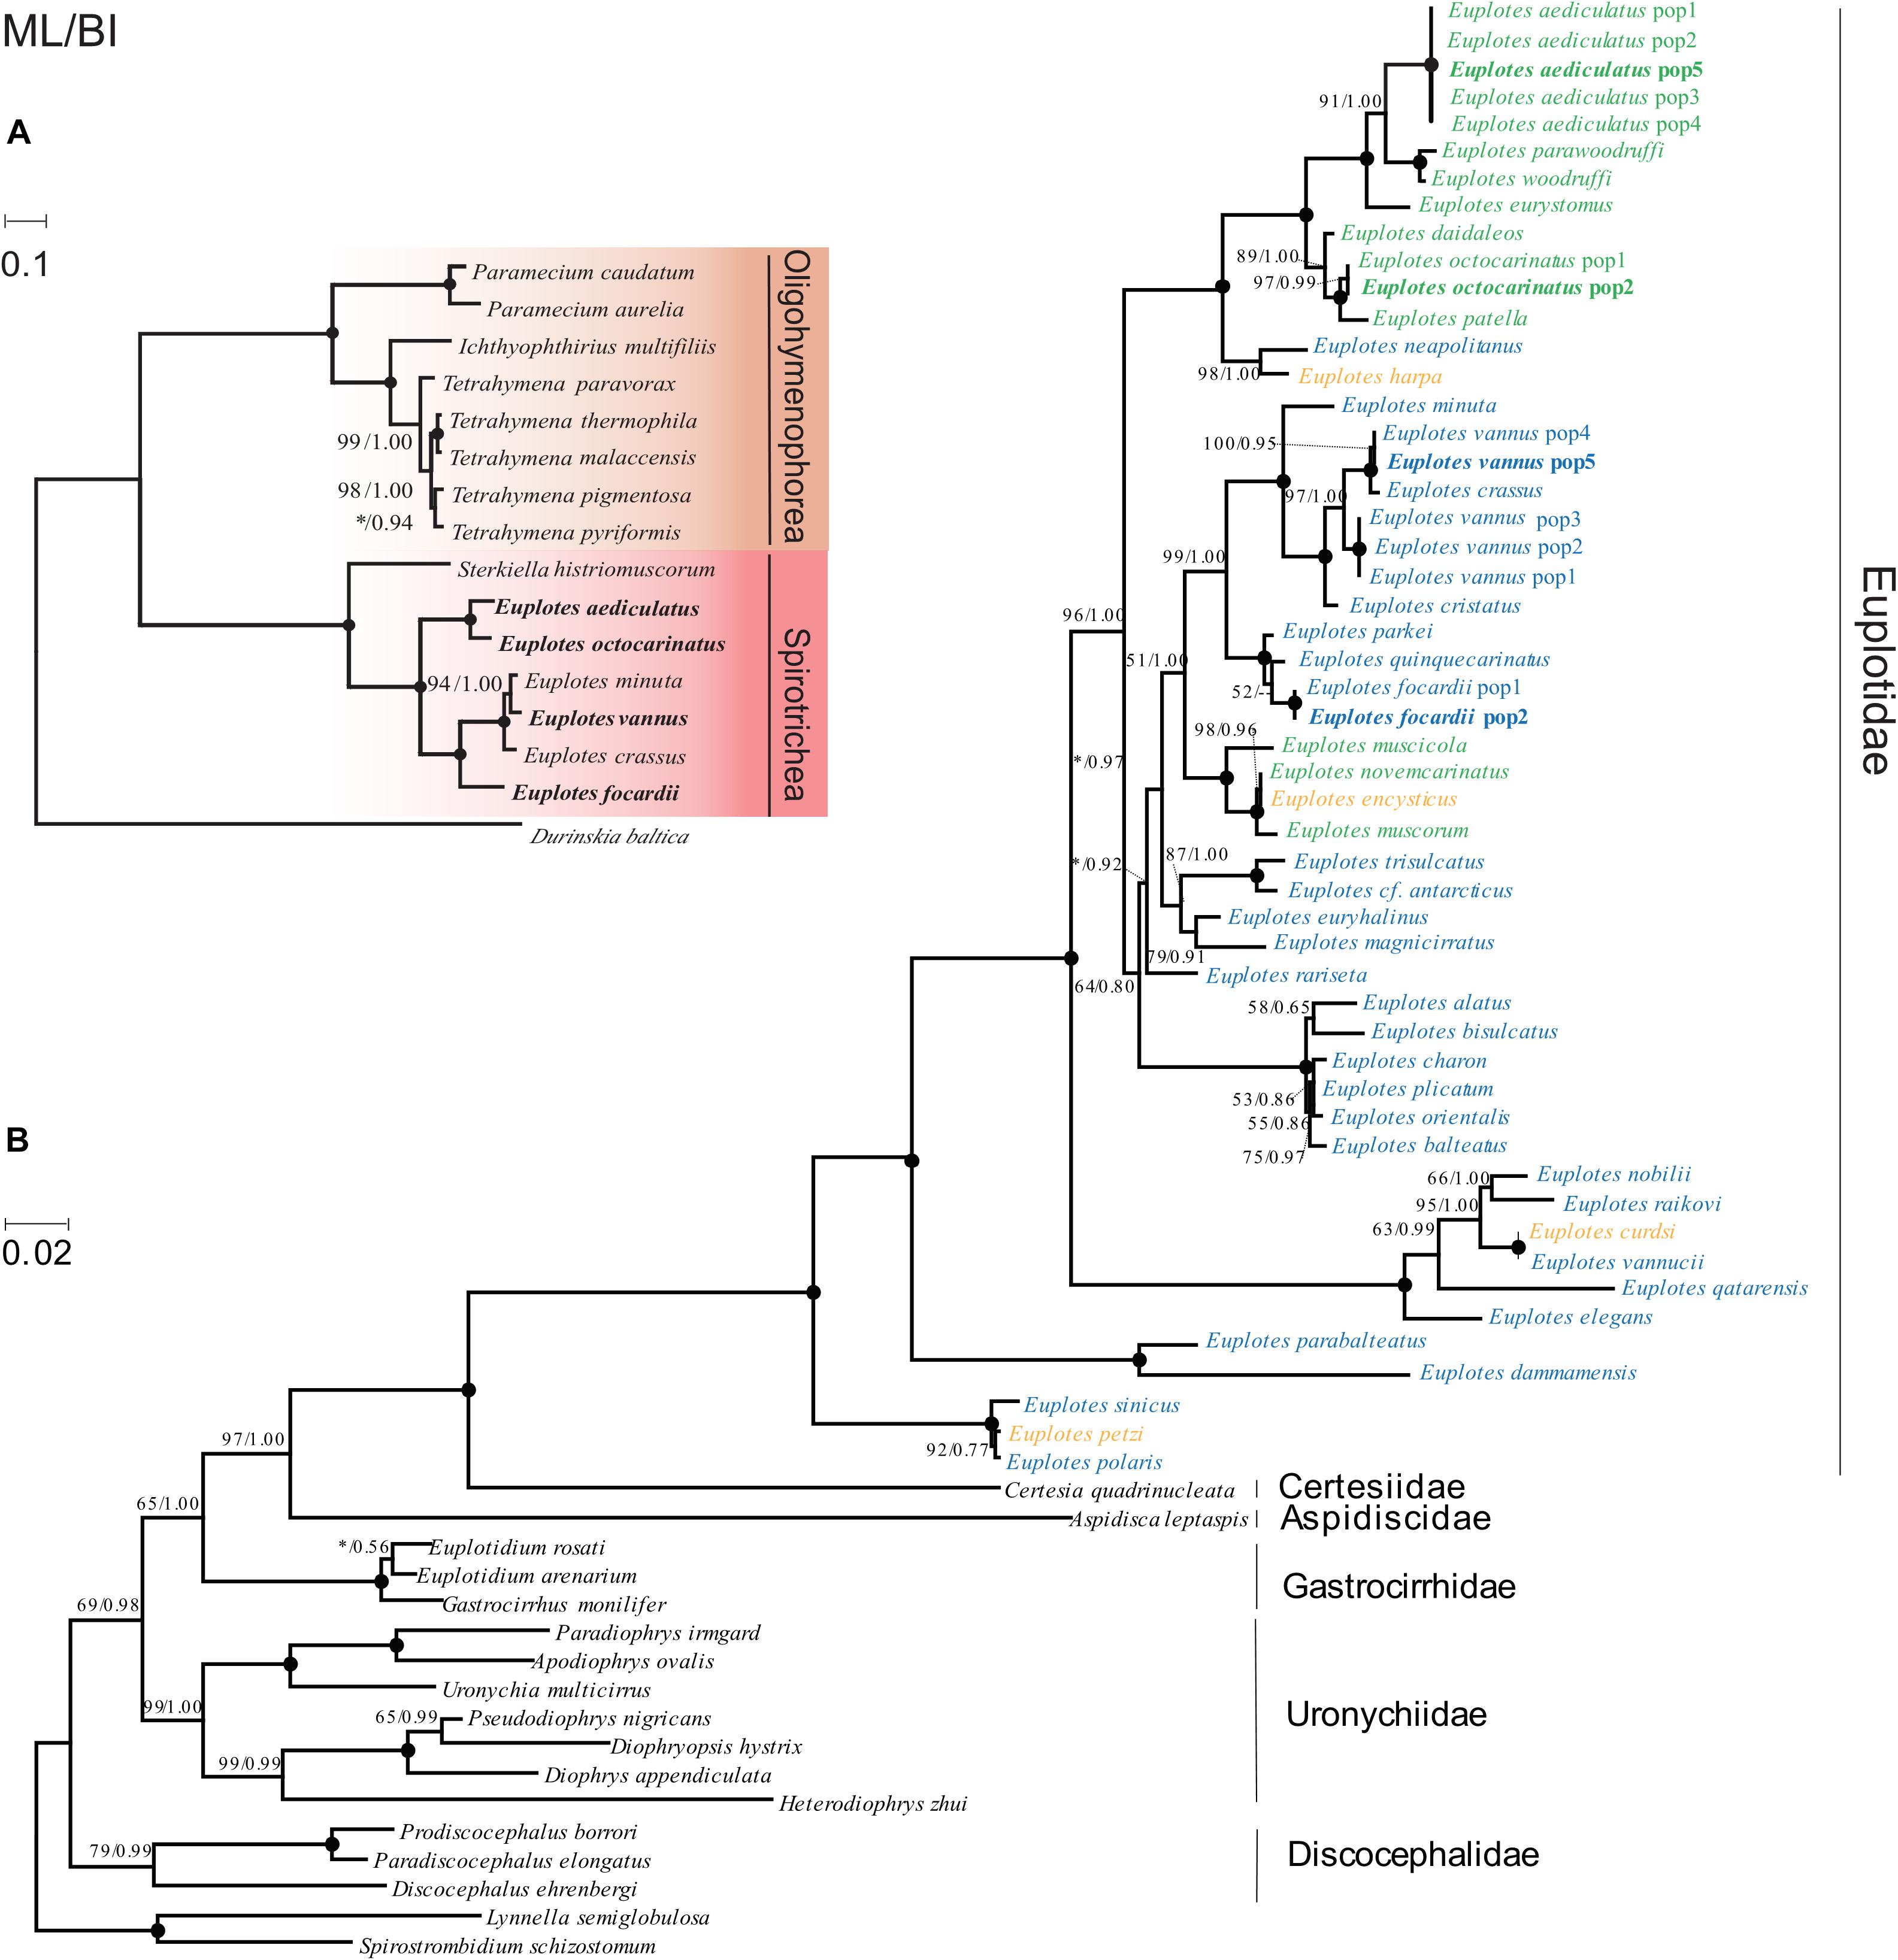
Figure 5. Phylogenetic trees based on mitochondrial genes and nuclear genes. BP values for ML tree and PP values for BI tree are given near nodes and separated by slash. The asterisks represent BP values lower than 50 or PP values lower than 0.7. Solid circles indicate fully supported branches (100%/1.00). Species sequenced in the present study are shown in bold. (A) Phylogenetic trees constructed based on multiple mitochondrial genes. The scale bar represents 10 substitutions per 100 nucleotide positions. (B) Phylogenetic tree constructed based on SSU-rRNA genes. Euplotes living in environment with low salinity are shown in green, while those in high salinity are shown in blue. Species surviving in both high salinity and low salinity environments are marked with yellow. The “pop” represents different strains within a specific species. The scale bar corresponds to 2 substitutions per 100 nucleotide positions.
Selection on Mitochondrial Genes
The branch that represents Euplotes G2 is selected as the foreground branch for all mitochondrial protein coding genes. ω of all genes present are much less than 1, indicating they are under strong purifying selection. The one-ratio model assumes that foreground branch and background branch have the same ω value, while two-ratio model is opposite. The result of likelihood-ratio test indicates that most genes fit the one-ratio model, while cox1, cox2 and rps3 seem to better fit to the two-ratio model (Table 2) (p < 0.05). It is likely that ω of these three genes are significant different between Euplotes G1 and G2, indicating different degree of purifying selection pressure may occur on the speciation of the two clades.
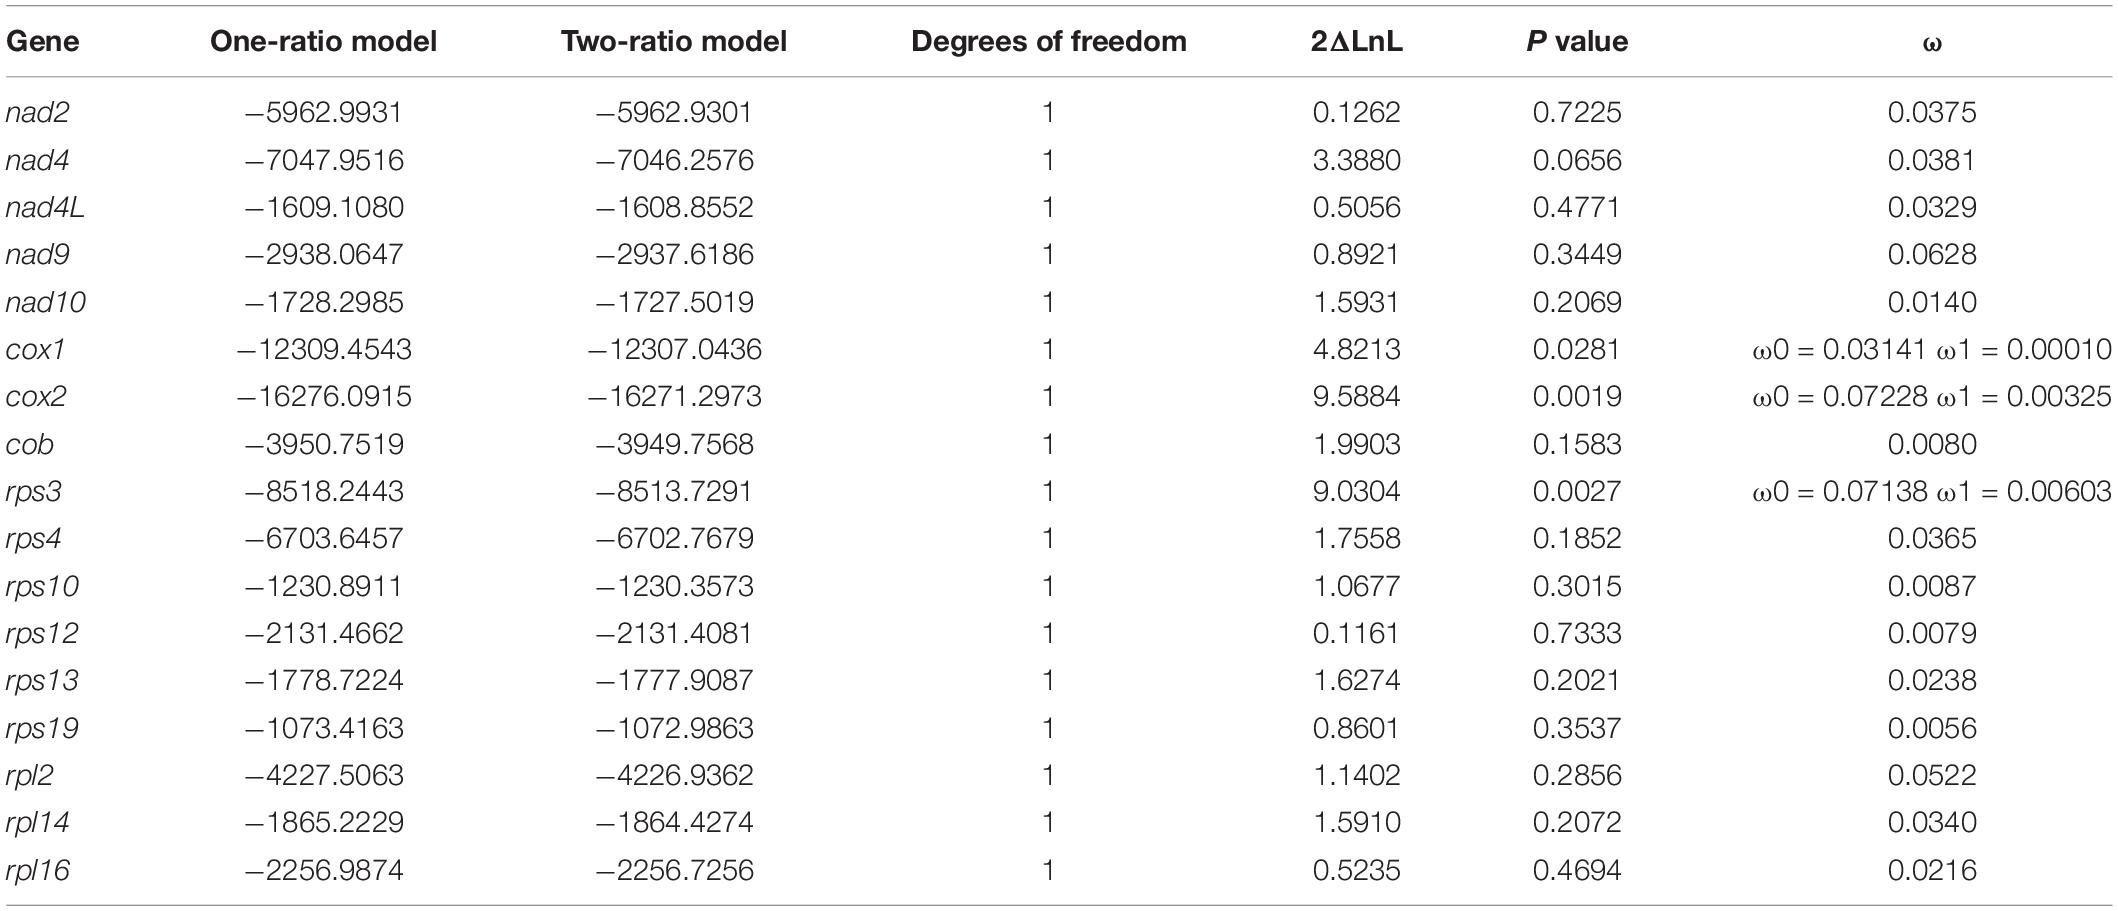
Table 2. Branch test performed on protein coding genes of mitochondrion.
Discussion
Gene Rearrangement and Putative Origin in Euplotes Mitochondrial Genomes
There is a long tandem repeat region with high level of AT content in Euplotes mitochondrial genomes, which makes it difficult to acquire complete sequences by high-throughput sequencing techniques. Despite the incompleteness of mitogenomes, we found gene rearrangement events present in Euplotes mitochondrion. Genes involved in rearrangement include tRNA genes as well as protein-coding genes. In general, the tRNA genes rearrange more frequently than PCGs and rRNA genes within the mitogenome (Wu et al., 2014). In 2007, a pseudo-tRNA gene, which was absent in other Tetrahymena species, had been detected in Tetrahymena paravorax (Moradian et al., 2007). We noticed that species in Euplotes G1 are from the marine water, while Euplotes G2 species live in freshwater. Interestingly, E. vannus living in low salinity stress could activated an extra pathway related to the glutamine (Gln, Q) metabolic process (Chen et al., 2019). The extra trnQ in Euplotes G2 mitogenome which has different anticodons might be related to salinity of habitats.
Previous study shows that the AT rich region usually plays an important role in regulating the process of transcription and replication (Boore, 1999). In two genera Paramecium and Tetrahymena, the AT-rich region coincides with the DNA replication origin (Moradian et al., 2007). Due to the difference in replication mechanisms of leading strand and lagging strand, there should be a positive GC skew and negative AT skew in the leading strand, a negative GC skew and a positive AT skew in the lagging strand in prokaryote genomes (Charneski et al., 2011). AT skew or GC skew in prokaryotes can switch at the origin and terminus of replication (Fellenberg et al., 2001). Considering that both cumulative AT skew and cumulative GC skew have a turning point near the tandem repeat region, it suggests that this interval may be the replication origin of Euplotes mitochondrion. The origin of replication in Paramecium mitochondria is at one terminus, whereas it is near the center in Tetrahymena (Pritchard and Cummings, 1981; Pritchard et al., 1990; Burger et al., 2000). The fact that the sequence flanking the tandem repeat region transcribes in the opposite directions increases the possibility that this region may be involved in transcription and replication initiation.
Mutation Bias as the Major Driving Force of Codon Usage Bias
It is generally acknowledged that codon usage pattern reflects a balance between mutation bias and natural selection for translational efficiency (Sharp et al., 1993; Liu et al., 2004). The neutrality plot analysis is a classical method to compare the influences of these two factors by plotting the GC12 of the synonymous codons against the GC3. Considering that base composition of three codon positions should be similar without natural selection, the closer the slope of their regression curve is to 1, the greater the influence of mutational bias. In Euplotes mitogenomes, GC12 and GC3 are highly correlated with a slope of 0.549, indicating that mutation bias might be the major driving force of codon usage bias. For ENC-plot analysis, if genes distribute near the standard curve, their codon usage is more likely affected by mutation bias. In this study, we found that most genes in the ENC-plot locate near the standard curve and the correlation between actual ENC and expected ENC is highly significant, which further confirm mutation bias as the major driving force. Genes which are deviated from the standard curve (>20% deviation) are mostly shorter than 500 bp (Supplementary Figure 3), it is likely the short length rather than actual codon usage bias lead to the extremely low ENC values.
There are various factors contributing to codon usage bias, including gene function (Chiapello et al., 1998), composition of bases and amino acid, gene length (Duret and Mouchiroud, 1999), gene expression (Liu et al., 2004; Wei et al., 2014), abundance of tRNA (Duret, 2000). Codons ending with AT and GC form two clusters by plotting PC1 against PC2, indicating that GC3 has great impact on codon usage. Although the effect is not as strong as GC3, GC content also affects codon usage. Protein aromaticity is negatively related to codon usage, as protein aromaticity depends on the composition of amino acid and gene function, which is considered to be the result of natural selection (Wei et al., 2014). Therefore, the codon usage bias in Euplotes mitogenomes is mainly shaped by mutations bias, whereas natural selection is only the minor driving force.
Phylogeny and Habitat Salinity
For aquatic organisms, salinity are one of the most important environmental factors which determine the community composition (Crump et al., 2004; Herlemann et al., 2016). Previous studies suggest that the Euplotes species and subclades in phylogenetic tree based on SSU-rRNA gene are more uniform in term of habitat salinity (Petroni et al., 2002; Yi et al., 2009; Syberg-Olsen et al., 2016). It is still be true when we carried out phylogenetic analysis by SSU-rRNA gene from more species in Euplotes. When constructing the phylogenetic tree by multiple mitochondrial genes, we found the six species in Euplotes were divided into two branches, corresponding to Euplotes G1 (seawater) and Euplotes G2 (freshwater), respectively. These results indicate that salinity might act as a barrier for the distribution of Euplotes species. The salinity barrier seems not be strict as the euryhaline species might be the intermediate stage of immigration from ancestrally marine to freshwater (Zhao et al., 2018).
Mitochondrial Genes Used for Discriminating Closely Related Euplotes Species
There is a long standing species classification problem in the vannus-crassus group (Caprette and Gates, 1994; Zhao et al., 2018). One view point is that E. vannus and E. crassus experienced separated evolution and speciation (Giannì and Piras, 1990), while another is that E. vannus and E. crassus form a highly polymorphic species (Caprette and Gates, 1994). E. vannus and E. crassus have similar morphological characteristics and high sequence identity (SSU-rRNA: average 97.78%), which makes it difficult to distinguish them. Sequence identity in mitochondrial genes between E. vannus and E. crassus is relatively low (e.g., 78.1% in cox1), which can help distinguish E. vannus from E. crassus and other species with highly similarity. In phylogenetic trees based on mitochondrial genes (both single and concatenated genes), phylogenetic relationship among E. vannus, E. crassus and E. minuta is slightly different from that based on nuclear genes, which may be due to incongruent evolutionary rates between mitochondrial and nuclear genes in these species.
Adaptations From Marine to Freshwater
Immigration from marine to freshwater require specific adaptive mechanism to adjust osmoregulation (Alverson et al., 2007). Evolutionary divergence between marine and freshwater Euplotes might be caused by this kind of physiological adaptations. We found that ω of all mitochondrial genes are far less than 1, indicating strong purifying selection acting on these genes in Euplotes. The result of branch-specific test indicates that cox1, cox2 and rps3 have inconsistent ω value along the branch of Euplotes G1 and G2, which means their evolutionary rate is different. The rps3 encodes ribosomal protein small subunit and it shows a relatively low sequence similarity in the middle of gene and is of great difference in length among Euplotes species. Previous study reported that the mitochondrial rps3 is variable in size and position as well as gene arrangement due to insertions, microsatellite expansions (Sethuraman et al., 2009). These may result in inconsistent ω values of rps3 between Euplotes G1 and G2. Both cox1 and cox2 encode cytochrome c oxidase which play crucial roles in ATP production by participating in oxidative phosphorylation (OXPHOS pathway). The strategy for osmotic adjustment rely on energy-depend mechanism (Harding et al., 2016; Weinisch et al., 2018). The two genes of Euplotes G1 and Euplotes G2 may undergo diversifying evolutionary process for physiological adaptations from marine to freshwater.
Conclusion
The current study mainly acquired four mitogenomes of Euplotes and help to provide valuable resources and new insights into the evolution process of Euplotes genus. Mitochondrial genes of Euplotes including PCGs and tRNA genes undergo rearrangement events but the position of putative origin of transcription and replication is conserved. Though the codon usage patterns of mitochondrion are different in Euplotes genus, mutation bias is always the major driving force resulting in the codon usage bias. Interestingly, both gene order and codon usage bias seem to be uniform with habitat salinity level. Phylogenetic analyses based on both mitochondrial and nuclear genes further confirm that species living in similar salinity habitat tend to cluster together. Salinity does present a barrier to the distribution of Euplotes. However, some of the ancestrally marine species could adapt to the freshwater. Physiological adaptations may happen to regulate osmotic pressure regulation participated in this process. The cox1 and cox2 which participate in OXPHOS pathway might be the key genes for physiological adaptations from marine to freshwater. Besides, mitochondrial genes have higher evolutionary rate compared with traditional nuclear gene markers, so they are more effective for discriminating species with highly similarity.
Data Availability Statement
The datasets presented in this study can be found in online repositories. The names of the repository/repositories and accession number(s) can be found below: https://www.ncbi.nlm.nih.gov/, MT665958; https://www.ncbi.nlm.nih.gov/, MT665959.
Author Contributions
MM designed and guided the study. NH, SC, MH, and LH conducted sampling and performed laboratory work. NH and SC performed the evolutionary and phylogenetic analyses. NH drafted the manuscript. MM, SZ, YZ, and QS made further revisions. All authors read and approved this manuscript.
Funding
This work was supported by Natural Science Foundation of China (32070432, 31672279, 41702385, 32070461), and the Fundamental Research Funds for the Central Universities.
Conflict of Interest
The authors declare that the research was conducted in the absence of any commercial or financial relationships that could be construed as a potential conflict of interest.
Acknowledgments
Our thanks are due to Prof. Weibo Song (Ocean University of China, China) for supplying samples and technical support.
Supplementary Material
The Supplementary Material for this article can be found online at: https://www.frontiersin.org/articles/10.3389/fmars.2021.627879/full#supplementary-material
Supplementary Figure 1 | Secondary structure and identity of trnQs. (A) The secondary structure of trnQs in Euplotes. The short lines mean there are two hydrogen bonds between the bases, the round dots are used to denote three hydrogen bonds between G and C. Mismatched base pairs are marker by green solid circle. (B) Pairwise identity of trnQs in Euplotes. The order of trnQs from top to bottom is exactly the same as the order from left to right.
Supplementary Figure 2 | AT skew and GC skew of Euplotes mitogenomes. AT skew and GC shew of upstream and downstream of the tandem repeat regions. Upstream and downstream sequences of all mitochondrion are scaled to the same length respectively. The midpoint of x-coordinate represents the position of the tandem repeat region. The arrows show the transcriptional directions.
Supplementary Figure 3 | Relationship between gene length and degree of actual ENC values deviating from the standard values. The x-coordinate represents the percentage of deviation from the standard, while y-coordinate is gene length. Three asterisks indicate p value is less than 0.001 (t-test).
Supplementary Table 1 | Degenerate primers for E. vannus.
Supplementary Table 2 | The previous annotation refers to earliest annotation of E. minuta and E. crassus done by de Graaf et al. (2009). The new annotation of E. minuta represents result of reannotation done by Swart et al. (2012). We reannotated E. crassus as the new annotation of E. crassus. In this study, we used new annotation results uniformly.
Supplementary Table 3 | Accession numbers of all sequenced ciliate mitochondrial genomes.
Supplementary Table 4 | Accession numbers of SSU-rRNA genes used to construct phylogenetic tree.
Footnotes
References
Alverson, A. J., Jansen, R. K., and Theriot, E. C. (2007). Bridging the Rubicon: phylogenetic analysis reveals repeated colonizations of marine and fresh waters by thalassiosiroid diatoms. Mol. Phylogenet. Evol. 45, 193–210. doi: 10.1016/j.ympev.2007.03.024
Ballard, J. W. (2000). Comparative genomics of mitochondrial DNA in Drosophila simulans. J. Mol. Evol. 51, 64–75. doi: 10.1007/s002390010067
Bankevich, A., Nurk, S., Antipov, D., Gurevich, A. A., Dvorkin, M., Kulikov, A. S., et al. (2012). SPAdes: a new genome assembly algorithm and its applications to single-cell sequencing. J. Comput. Biol. 19, 455–477. doi: 10.1089/cmb.2012.0021
Barth, D., and Berendonk, T. U. (2011). The mitochondrial genome sequence of the ciliate Paramecium caudatum reveals a shift in nucleotide composition and codon usage within the genus Paramecium. BMC Genomics 12:272. doi: 10.1186/1471-2164-12-272
Benson, G. (1999). Tandem repeats finder: a program to analyze DNA sequences. Nucleic Acids Res. 27, 573–580. doi: 10.1093/nar/27.2.573
Bolger, A. M., Lohse, M., and Usadel, B. (2014). Trimmomatic: a flexible trimmer for Illumina sequence data. Bioinformatics 30, 2114–2120. doi: 10.1093/bioinformatics/btu170
Boore, J. L. (1999). Animal mitochondrial genomes. Nucleic Acids Res. 27, 1767–1780. doi: 10.1093/nar/27.8.1767
Burger, G., Zhu, Y., Littlejohn, T. G., Greenwood, S. J., Schnare, M. N., Lang, B. F., et al. (2000). Complete sequence of the mitochondrial genome of Tetrahymena pyriformis and comparison with Paramecium aurelia mitochondrial DNA. J. Mol. Biol. 297, 365–380. doi: 10.1006/jmbi.2000.3529
Caprette, C. L., and Gates, M. A. (1994). Quantitative analyses of interbreeding in populations of E. vannus-Morphotype Euplotes, with special attention to the nominal species E. vannus and E. crassus. J. Eukaryot. Microbiol. 41, 316–324. doi: 10.1111/j.1550-7408.1994.tb06084.x
Castresana, J. (2000). Selection of conserved blocks from multiple alignments for their use in phylogenetic analysis. Mol. Biol. Evol. 17, 540–552. doi: 10.1093/oxfordjournals.molbev.a026334
Charneski, C. A., Honti, F., Bryant, J. M., Hurst, L. D., and Feil, E. J. (2011). Atypical AT skew in Firmicute genomes results from selection and not from mutation. PLoS Genet. 7:e1002283. doi: 10.1371/journal.pgen.1002283
Chen, X., Jiang, Y., Gao, F., Zheng, W., Krock, T. J., Stover, N. A., et al. (2019). Genome analyses of the new model protist Euplotes vannus focusing on genome rearrangement and resistance to environmental stressors. Mol. Ecol. Resour. 19, 1292–1308. doi: 10.1111/1755-0998.13023
Chiapello, H., Lisacek, F., Caboche, M., and Hénaut, A. (1998). Codon usage and gene function are related in sequences of Arabidopsis thaliana. Gene 209, GC1–GC38. doi: 10.1016/s0378-1119(97)00671-9
Contreras-Moreira, B., and Vinuesa, P. (2013). GET_HOMOLOGUES, a versatile software package for scalable and robust microbial pangenome analysis. Appl. Environ. Microbiol. 79, 7696–7701. doi: 10.1128/aem.02411-13
Crump, B. C., Hopkinson, C. S., Sogin, M. L., and Hobbie, J. E. (2004). Microbial biogeography along an estuarine salinity gradient: combined influences of bacterial growth and residence time. Appl. Environ. Microbiol. 70, 1494–1505. doi: 10.1128/aem.70.3.1494-1505.2004
Darriba, D., Taboada, G. L., Doallo, R., and Posada, D. (2011). ProtTest 3: fast selection of best-fit models of protein evolution. Bioinformatics 27, 1164–1165. doi: 10.1093/bioinformatics/btr088
Darriba, D., Taboada, G. L., Doallo, R., and Posada, D. (2012). jModelTest 2: more models, new heuristics and parallel computing. Nat. Methods 9, 772–772. doi: 10.1038/nmeth.2109
de Graaf, R. M., van Alen, T. A., Dutilh, B. E., Kuiper, J. W., van Zoggel, H. J., Huynh, M. B., et al. (2009). The mitochondrial genomes of the ciliates Euplotes minuta and Euplotes crassus. BMC Genomics 10:514. doi: 10.1186/1471-2164-10-514
Duret, L. (2000). tRNA gene number and codon usage in the C. elegans genome are co-adapted for optimal translation of highly expressed genes. Trends Genet. 16, 287–289. doi: 10.1016/s0168-9525(00)02041-2
Duret, L., and Mouchiroud, D. (1999). Expression pattern and, surprisingly, gene length shape codon usage in Caenorhabditis, Drosophila, Arabidopsis. Proc. Natl. Acad. Sci. U.S.A. 96, 4482–4487. doi: 10.1073/pnas.96.8.4482
Fellenberg, K., Hauser, N. C., Brors, B., Neutzner, A., Hoheisel, J. D., and Vingron, M. (2001). Correspondence analysis applied to microarray data. Proc. Natl. Acad. Sci. U.S.A. 98, 10781–10786. doi: 10.1073/pnas.181597298
Fernandes, N. M., Paiva, T., da Silva-Neto, I. D., Schlegel, M., and Schrago, C. G. (2016). Expanded phylogenetic analyses of the class Heterotrichea (Ciliophora, Postciliodesmatophora) using five molecular markers and morphological data. Mol. Phylogenet. Evol. 95, 229–246. doi: 10.1016/j.ympev.2015.10.030
Fuglsang, A. (2006). Estimating the “effective number of codons”: the Wright way of determining codon homozygosity leads to superior estimates. Genetics 172, 1301–1307. doi: 10.1534/genetics.105.049643
Gentekaki, E., Kolisko, M., Boscaro, V., Bright, K. J., Dini, F., Di Giuseppe, G., et al. (2014). Large-scale phylogenomic analysis reveals the phylogenetic position of the problematic taxon Protocruzia and unravels the deep phylogenetic affinities of the ciliate lineages. Mol. Phylogenet. Evol. 78, 36–42. doi: 10.1016/j.ympev.2014.04.020
Giannì, A., and Piras, L. (1990). Autoecological and molecular approach to the species problem in the Euplotes vannus-crassus-minuta group (Ciliophora, Hypotrichida). Eur. J. Protistol. 26, 142–148. doi: 10.1016/s0932-4739(11)80108-2
Giuseppe, G. D., Erra, F., Dini, F., Alimenti, C., Vallesi, A., Pedrini, B., et al. (2011). Antarctic and Arctic populations of the ciliate Euplotes nobilii show common pheromone-mediated cell-cell signaling and cross-mating. Proc. Natl. Acad. Sci. U.S.A. 108, 3181–3186. doi: 10.1073/pnas.1019432108/-/DCSupplemental
Gray, M. W., Burger, G., and Lang, B. F. (1999). Mitochondrial evolution. Science 283, 1476–1481. doi: 10.1126/science.283.5407.1476
Graziano, G., Danielle, S., Graziano, D. G., and Fernando, D. (2010). Structures, biological activities and phylogenetic relationships of terpenoids from marine ciliates of the genus Euplotes. Mar. Drugs 8, 2080–2116. doi: 10.3390/md8072080
Grigoriev, A. (1998). Analyzing genomes with cumulative skew diagrams. Nucleic Acids Res. 26, 2286–2290. doi: 10.1093/nar/26.10.2286
Hall, T. A. (1999). BioEdit: a user-friendly biological sequence alignment editor and analysis program for Windows 95/98/NT. Nucleic Acids Symp. Ser. 41, 95–98. doi: 10.14601/Phytopathol_Mediterr-14998u1.29
Harding, T., Brown, M. W., Simpson, A. G., and Roger, A. J. (2016). Osmoadaptative strategy and its molecular signature in obligately halophilic heterotrophic protists. Genome Biol. Evol. 8, 2241–2258. doi: 10.1093/gbe/evw152
He, M., Wang, J., Fan, X., Liu, X., Shi, W., Huang, N., et al. (2019). Genetic basis for the establishment of endosymbiosis in Paramecium. ISME J. 13, 1360–1369. doi: 10.1038/s41396-018-0341-4
Herlemann, D. P., Lundin, D., Andersson, A. F., Labrenz, M., and Jurgens, K. (2016). Phylogenetic signals of salinity and season in bacterial community composition across the salinity gradient of the Baltic Sea. Front. Microbiol. 7:1883. doi: 10.3389/fmicb.2016.01883
Jeffares, D., Tomiczek, B., Sojo, V., and dos Reis, M. (2015). A beginners guide to estimating the non-synonymous to synonymous rate ratio of all protein-coding genes in a genome. Methods Mol. biol. 1201, 65–90. doi: 10.1007/978-1-4939-1438-8_4
Katoh, K., and Standley, D. M. (2013). MAFFT multiple sequence alignment software version 7: improvements in performance and usability. Mol. Biol. Evol. 30, 772–780. doi: 10.1093/molbev/mst010
Kodama, Y., and Fujishima, M. (2005). Symbiotic Chlorella sp. of the ciliate Paramecium bursaria do not prevent acidification and lysosomal fusion of host digestive vacuoles during infection. Protoplasma 225, 191–203. doi: 10.1007/s00709-005-0087-5
Liu, Q. P., Feng, Y., and Xue, Q. Z. (2004). Analysis of factors shaping codon usage in the mitochondrion genome of Oryza sativa. Mitochondrion 4, 313–320. doi: 10.1016/j.mito.2004.06.003
Lowe, T. M., and Chan, P. P. (2016). tRNAscan-SE On-line: integrating search and context for analysis of transfer RNA genes. Nucleic Acids Res. 44, W54–W57. doi: 10.1093/nar/gkw413
McGrath, C. L., Gout, J. F., Doak, T. G., Yanagi, A., and Lynch, M. (2014). Insights into three whole-genome duplications gleaned from the Paramecium caudatum genome sequence. Genetics 197, 1417–1428. doi: 10.1534/genetics.114.163287
Medlin, L., Elwood, H. J., Stickel, S., and Sogin, M. L. (1988). The characterization of enzymatically amplified eukaryotic 16S-like rRNA-coding regions. Gene 71, 491–499. doi: 10.1016/0378-1119(88)90066-2
Moradian, M. M., Beglaryan, D., Skozylas, J. M., and Kerikorian, V. (2007). Complete mitochondrial genome sequence of three Tetrahymena species reveals mutation hot spots and accelerated nonsynonymous substitutions in Ymf genes. PLoS One 2:e650. doi: 10.1371/journal.pone.0000650
Pedrini, B., Suter-Stahel, T., Vallesi, A., and Luporinic, C. A. P. (2017). Molecular structures and coding genes of the water-borne protein pheromones of Euplotes petzi, an early diverging polar species of Euplotes. J. Eukaryot. Microbiol. 64, 164–172. doi: 10.1111/jeu.12348
Petroni, G., Dini, F., Verni, F., and Rosati, G. (2002). A molecular approach to the tangled intrageneric relationships underlying phylogeny in Euplotes (Ciliophora, Spirotrichea). Mol. Phylogenet. Evol. 22, 118–130. doi: 10.1006/mpev.2001.1030
Pritchard, A. E., and Cummings, D. J. (1981). Replication of linear mitochondrial DNA from Paramecium: sequence and structure of the initiation-end crosslink. Proc. Natl. Acad. Sci. U.S.A. 78, 7341–7345. doi: 10.1073/pnas.78.12.7341
Pritchard, A. E., Seilhamer, J. J., Mahalingam, R., Sable, C. L., Venuti, S. E., and Cummings, D. J. (1990). Nucleotide sequence of the mitochondrial genome of Paramecium. Nucleic Acids Res. 18, 173–180. doi: 10.1093/nar/18.1.173
Ronquist, F., Teslenko, M., van der Mark, P., Ayres, D. L., Darling, A., Hohna, S., et al. (2012). MrBayes 3.2: efficient Bayesian phylogenetic inference and model choice across a large model space. Syst. Biol. 61, 539–542. doi: 10.1093/sysbio/sys029
Serra, V., Gammuto, L., Nitla, V., Castelli, M., Lanzoni, O., Sassera, D., et al. (2019). Next generation taxonomy: integrating traditional species description with the holobiont concept and genomic approaches – the in-depth characterization of a novel Euplotes species as a case study. bioRxiv [Preprint]. doi: 10.1101/666461
Sethuraman, J., Majer, A., Iranpour, M., and Hausner, G. (2009). Molecular evolution of the mtDNA encoded rps3 gene among filamentous ascomycetes fungi with an emphasis on the Ophiostomatoid fungi. J. Mol. Evol. 69, 372–385. doi: 10.1007/s00239-009-9291-9
Sharp, P. M., Stenico, M., Peden, J. F., and Lloyd, A. T. (1993). Codon usage: mutational bias, translational selection, or both? Biochem. Soc. Trans. 21, 835–841. doi: 10.1042/bst0210835
Shazib, S. U., Vdacny, P., Kim, J. H., Jang, S. W., and Shin, M. K. (2016). Molecular phylogeny and species delimitation within the ciliate genus Spirostomum (Ciliophora, Postciliodesmatophora, Heterotrichea), using the internal transcribed spacer region. Mol. Phylogenet. Evol. 102, 128–144. doi: 10.1016/j.ympev.2016.05.041
Sivasankaran, K., Mathew, P., Anand, S., Ceasar, S. A., Mariapackiam, S., and Ignacimuthu, S. (2017). Complete mitochondrial genome sequence of fruit-piercing moth Eudocima phalonia (Linnaeus, 1763) (Lepidoptera: Noctuoidea). Genom. Data 14, 66–81. doi: 10.1016/j.gdata.2017.09.004
Slabodnick, M. M., Ruby, J. G., Reiff, S. B., Swart, E. C., Gosai, S., Prabakaran, S., et al. (2017). The macronuclear genome of Stentor coeruleus reveals tiny introns in a giant cell. Curr. Biol. 27, 569–575. doi: 10.1016/j.cub.2016.12.057
Soding, J., Biegert, A., and Lupas, A. N. (2005). The HHpred interactive server for protein homology detection and structure prediction. Nucleic Acids Res. 33, W244–W248. doi: 10.1093/nar/gki408
Stamatakis, A. (2014). RAxML version 8: a tool for phylogenetic analysis and post-analysis of large phylogenies. Bioinformatics 30, 1312–1313. doi: 10.1093/bioinformatics/btu033
Swart, E. C., Nowacki, M., Shum, J., Stiles, H., Higgins, B. P., Doak, T. G., et al. (2012). The Oxytricha trifallax mitochondrial genome. Genome Biol. Evol. 4, 136–154. doi: 10.1093/gbe/evr136
Syberg-Olsen, M. J., Irwin, N. A., Vannini, C., Erra, F., Di Giuseppe, G., Boscaro, V., et al. (2016). Biogeography and character evolution of the ciliate genus Euplotes (Spirotrichea, Euplotia), with description of Euplotes curdsi sp. nov. PLoS One 11:e0165442. doi: 10.1371/journal.pone.0165442
Vaidya, G., Lohman, D. J., and Meier, R. (2011). SequenceMatrix: concatenation software for the fast assembly of multi-gene datasets with character set and codon information. Cladistics 27, 171–180. doi: 10.1111/j.1096-0031.2010.00329.x
Wei, L., He, J., Jia, X., Qi, Q., Liang, Z., Zheng, H., et al. (2014). Analysis of codon usage bias of mitochondrial genome in Bombyx mori and its relation to evolution. BMC Evol. Biol. 14:262. doi: 10.1186/s12862-014-0262-4
Weinisch, L., Kuhner, S., Roth, R., Grimm, M., Roth, T., Netz, D. J. A., et al. (2018). Identification of osmoadaptive strategies in the halophile, heterotrophic ciliate Schmidingerothrix salinarum. PLoS Biol. 16:e2003892. doi: 10.1371/journal.pbio.2003892
Wright, F. (1990). The ‘effective number of codons’ used in a gene. Gene 87, 23–29. doi: 10.1016/0378-1119(90)90491-9
Wu, X. Y., Xiao, S., Li, X. L., Li, L., Shi, W., and Yu, Z. N. (2014). Evolution of the tRNA gene family in mitochondrial genomes of five Meretrix clams (Bivalvia, Veneridae). Gene 533, 439–446. doi: 10.1016/j.gene.2013.09.077
Yang, Z. (2007). PAML 4: phylogenetic analysis by maximum likelihood. Mol. Biol. Evol. 24, 1586–1591. doi: 10.1093/molbev/msm088
Yi, Z. Z., Song, W. B., Clamp, J. C., Chen, Z. G., Gao, S., and Zhang, Q. Q. (2009). Reconsideration of systematic relationships within the order Euplotida (Protista, Ciliophora) using new sequences of the gene coding for small-subunit rRNA and testing the use of combined data sets to construct phylogenies of the Diophrys-complex. Mol. Phylogenet. Evol. 50, 599–607.
Zhao, Y., Yi, Z. Z., Warren, A., and Song, W. B. (2018). Species delimitation for the molecular taxonomy and ecology of the widely distributed microbial Eukaryote genus Plotters (Alveolata, Ciliophora). Proc. Biol. Sci. 285:20172159. doi: 10.1098/rspb.2017.2159
Keywords: codon usage bias, Euplotes, gene rearrangement, mitochondrial genome, phylogeny, salinity adaptation
Citation: Huang N, Chen S, He M, Song Q, Hou L, Zhao Y, Zhao S and Miao M (2021) Molecular Evolutionary Analyses of Euplotes Species Living in Freshwater and Marine Habitats: A Mitogenomic Perspective. Front. Mar. Sci. 8:627879. doi: 10.3389/fmars.2021.627879
Received: 10 November 2020; Accepted: 02 March 2021;
Published: 23 April 2021.
Edited by:
Xiaoshou Liu, Ocean University of China, ChinaReviewed by:
Daode Ji, Yantai Nanshan University, ChinaWenzhe Xu, Tianjin University of Science and Technology, China
Copyright © 2021 Huang, Chen, He, Song, Hou, Zhao, Zhao and Miao. This is an open-access article distributed under the terms of the Creative Commons Attribution License (CC BY). The use, distribution or reproduction in other forums is permitted, provided the original author(s) and the copyright owner(s) are credited and that the original publication in this journal is cited, in accordance with accepted academic practice. No use, distribution or reproduction is permitted which does not comply with these terms.
*Correspondence: Miao Miao, bWlhb21pYW9AdWNhcy5hYy5jbg==; Shuo Zhao, emhhb3NodW9AdWNhcy5hYy5jbg==; Yan Zhao, eWFuemhhb0BjbnUuZWR1LmNu