 Ting-Hsuan Huang1,2
 Wei-Jun Cai3*
 Penny Vlahos4
 Douglas W. R. Wallace5
 Ernie R. Lewis6
 Chen-Tung Arthur Chen1
- 1Department of Oceanography, National Sun Yat-sen University, Kaohsiung, Taiwan
- 2National Applied Research Laboratories, Taiwan Ocean Research Institute, Kaohsiung, Taiwan
- 3School of Marine Science and Policy, University of Delaware, Newark, NJ, United States
- 4Department of Marine Sciences, University of Connecticut, Groton, CT, United States
- 5Department of Oceanography, Dalhousie University, Halifax, NS, Canada
- 6Environmental and Climate Sciences Department, Brookhaven National Laboratory, Upton, NY, United States
The United States Department of Energy (DOE)’s Ocean Margins Program (OMP) cruise EN279 in March 1996 provides an important baseline for assessing long-term changes in the carbon cycle and biogeochemistry in the Mid-Atlantic Bight (MAB) as climate and anthropogenic changes have been substantial in this region over the past two decades. The distributions of O2, nutrients, and marine inorganic carbon system parameters are influenced by coastal currents, temperature gradients, and biological production and respiration. On the cross-shelf direction, pH decreases seaward, but carbonate saturation state (ΩArag) does not exhibit a clear trend. In contrast, ΩArag increases from north to south, while pH has no clear spatial patterns in the along-shelf direction. In order to distinguish between the effects of physical mixing of various water masses and those of biological activities on the marine inorganic carbon system, we use the potential temperature-salinity diagram to identify water masses, and differences between observations and theoretical mixing concentrations to measure the non-conservative (primarily biological) effects. Our analysis clearly shows the degree to which ocean margin pH and ΩArag are regulated by biological activities in addition to water mass mixing, gas exchange, and temperature. The correlations among anomalies in dissolved inorganic carbon, phosphate, nitrate, and apparent oxygen utilization agree with known biological stoichiometry. Biological uptake is substantial in nearshore waters and in shelf-slope mixing areas. This work provides valuable baseline information to assess the more recent changes in the marine inorganic carbon system and the status of coastal ocean acidification.
Introduction
Coastal waters link the three main carbon reservoirs: land, ocean, and atmosphere, and are recognized as a major component of the global carbon cycle and budget. Although the surface area of continental margins amounts to only 7–8% of that of the ocean as a whole, the margins contribute 10–30% of global oceanic primary production (Liu et al., 2000, 2010; Vlahos et al., 2002; Jahnke, 2010; Chavez et al., 2011; Chen et al., 2013). Terrestrial materials flow into the continental shelf through river plumes and groundwater discharge. Coastal ocean processes such as tides, upwelling, onwelling, and net advective transport are the main physical pathways for terrestrial material exchange with oceanic water. In addition, gas exchange and deposition provide the main interactions between the atmosphere and coastal water. Besides mediating the exchange of carbon among the three main carbon reservoirs, biogeochemical processes, and anthropogenic impacts further compound the complexity of the marine inorganic carbon system in continental margins (Mackenzie et al., 2005; Muller-Karger et al., 2005; Jahnke, 2010; Cai, 2011; Bauer et al., 2013).
The Mid-Atlantic Bight (MAB) is a hydrographically and geochemically complex continental margin ecosystem that has been investigated intensively over the past 30 years (Csanady and Hamilton, 1988; Walsh, 1988; Biscaye et al., 1994; Wang et al., 2013; Wanninkhof et al., 2015; Cai et al., 2020; Xu et al., 2020). The slope water, coastal river plume water, southward-flowing Labrador Current, and northeastward-flowing Gulf Stream constitute the multiple and varied components of the shelf water in the MAB. Air temperature differences, buoyancy effects, tidal mixing, wind force, eddies, and shelf break jets all contribute to the physical exchange processes of water masses. Furthermore, biological processes such as photosynthesis, remineralization, bacterial motility, and denitrification also affect the marine inorganic carbon cycle in the MAB (Beardsley et al., 1976; Chapman and Beardsley, 1989; Linder and Gawarkiewicz, 1998; Gawarkiewicz et al., 2001; Aluwihare et al., 2002; Fennel et al., 2006; Lentz, 2008).
To improve the knowledge of biogeochemical processes in the continental shelf to the slope region, the United States Department of Energy (DOE) supported several research projects including the Ocean Margins Program (OMP), whose goal was to estimate the carbon and biogenic elemental storage, biogeochemical transformations, and fluxes across different interfaces (Jahnke and Verity, 1994). Hydrographic data were collected in the course of eight cruises between 1993 and 1996, and physical and biological parameters have been studied extensively according to these results. The reported results indicate that the MAB ecosystem is net autotrophic, and phytoplankton absorbs the inorganic carbon and generates organic matter that would otherwise be chemically altered and exported to the open ocean (Bauer et al., 2002; DeGrandpre et al., 2002; Hopkinson et al., 2002; Vlahos et al., 2002). However, the dissolved inorganic carbon (DIC) and total alkalinity (TA) data collected during this program have not been previously reported. A thorough analysis of the OMP inorganic carbon dataset will not only improve our understanding of how inorganic carbon system parameters are regulated by complex coastal ocean physical and biological processes but also will provide a valuable baseline to examine how climate and anthropogenic changes have modified inorganic carbon system parameters since the 1990s. This exercise is particularly relevant to current community efforts to determine and understand coastal ocean acidification with ongoing regional field observations every 3 to 5 years (Wang et al., 2013; Wanninkhof et al., 2015; Xu et al., 2017; Cai et al., 2020).
This study focuses on spatial distributions of the inorganic carbon system parameters, water mass mixing, and biological activities in the MAB in March 1996. More specifically, it focuses on the exchange between nearshore and shelf water, and between shelf and slope water (or Gulf Stream), and the mixing of these water masses that takes place largely along isopycnals or via mixing in the benthic boundary layer over the shelf and shelf-break. In subsequent papers, we will compare this wintertime and baseline analysis with summer data from OMP to assess seasonal variations and with more recent observations to assess the carbon cycle, anthropogenic carbon accumulation, and biogeochemical changes in this region.
Study Area, Analytical Methods, and Mixing Mode
Cruise Description and Regional Hydrographic Background
The MAB is commonly defined by boundaries at the coast, the shelf/slope front, and two imaginary lines across the shelf: one south of Nantucket Shoals and one east of Cape Hatteras (Mountain, 1991; Figure 1). The cruise data were collected throughout the entire MAB from March 1–10, 1996. The timing of the cruise was chosen to capture late winter conditions when shelf water temperatures are at their annual minimum (e.g., Mountain, 2003). The six transects (Figures 1A,B) sampled from north to south are the Nantucket Shoals (NS), Long Island (LI), New Jersey (NJ), Delaware (DE), Chesapeake Bay (CB), and Cape Hatteras (CH), and each transect traversed from the shelf to the upper slope, with the bottom depth reaching 1,000 m at the most offshore stations, except in the NS transect. However, water samples for inorganic carbon measurements were generally collected only in the upper 200 m to allow for high vertical sample resolution within the depth and density ranges of slope waters that could exchange directly with shelf waters. In addition, there is no significant exchange between the shelf water and the slope water below 200 m (Csanady and Hamilton, 1988; Supplementary Figure 1).
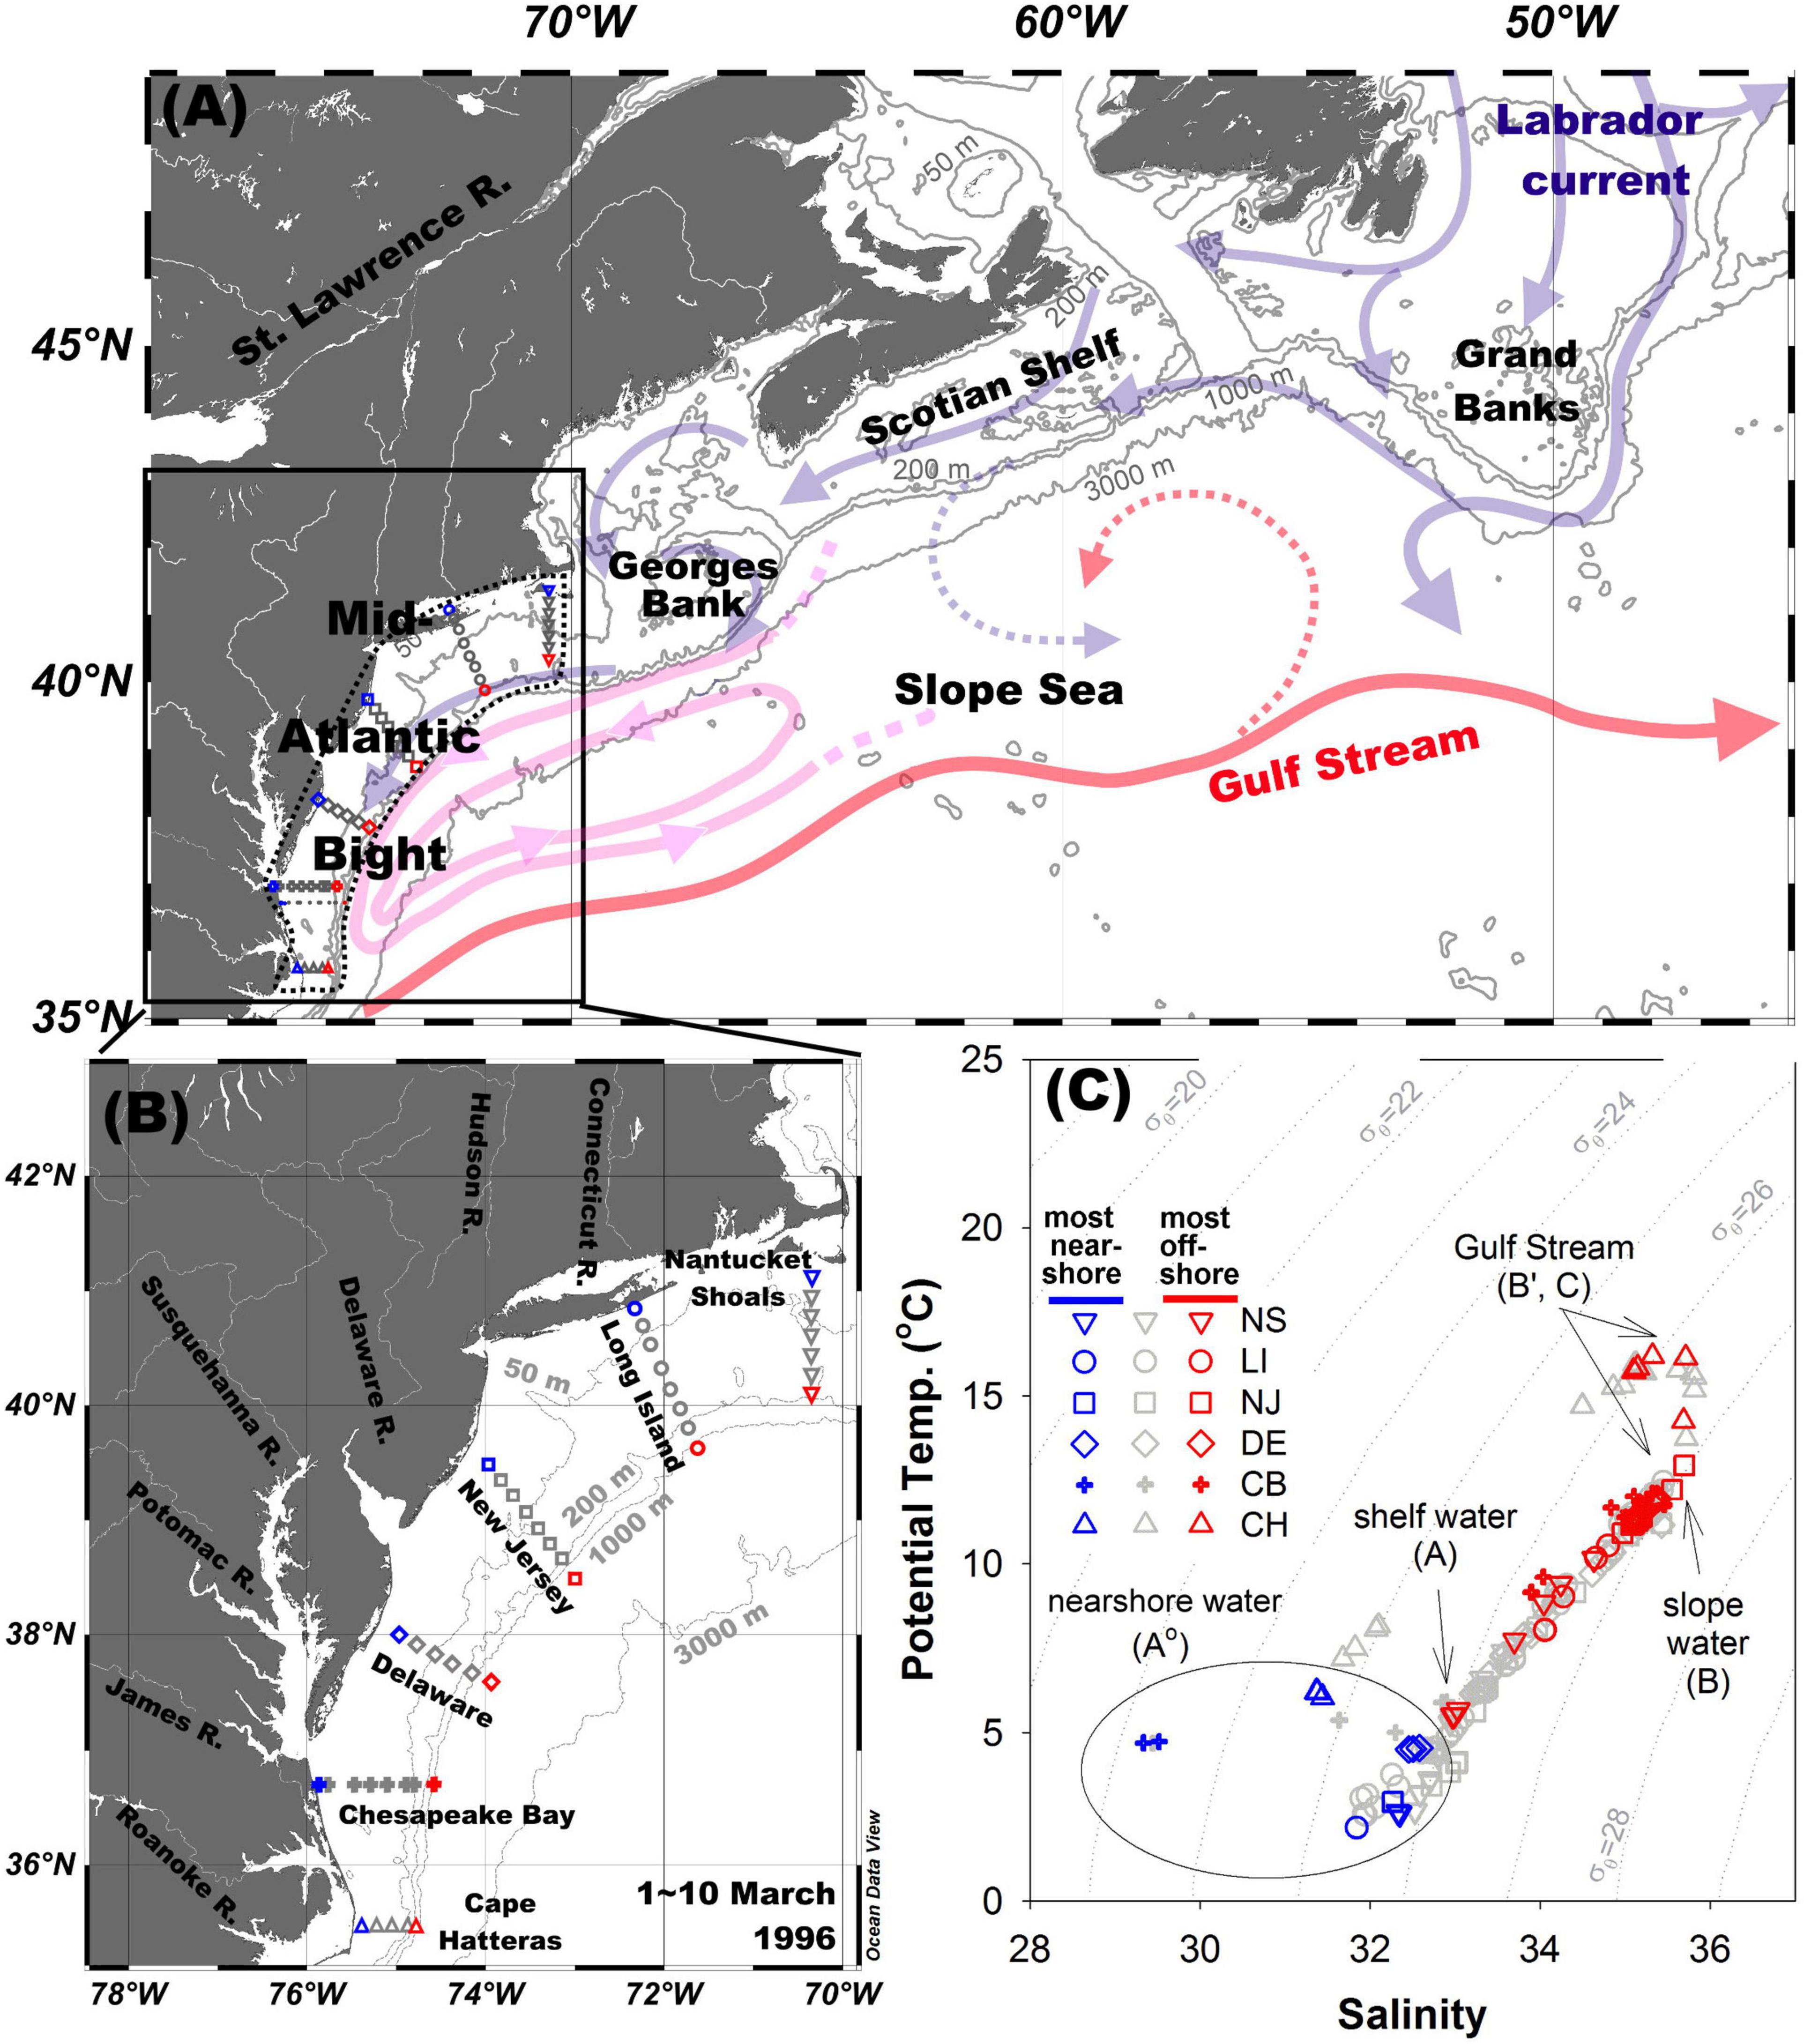
Figure 1. (A) Schematic representation of the Gulf Stream, Labrador Current, and Slope Sea modified from Saba et al. (2015) and Townsend et al. (2006). (B) The location of sampled sites. (C) Potential temperature and salinity diagram. The different symbols correspond to different transects. Although symbols are not differentiated for depths, red, and blue colors are used to represent the most nearshore stations and offshore stations, respectively, while the light shaded symbols are the stations in-between. The six transects from north to south are: Nantucket Shoals (NS), Long Island (LI), New Jersey (NJ), Delaware (DE), Chesapeake Bay (CB), and Cape Hatteras (CH).
In the vicinity of the MAB, the main alongshore currents are an equatorward-flowing, cold, and fresh coastal current (Chapman and Beardsley, 1989) supplied by the Labrador Current, and the northward-flowing, warm, and salty Gulf Stream (Figure 1A). The Slope Sea separates the shelf waters from the Gulf Stream as far south as Cape Hatteras, with the western Slope Sea (within the MAB) being a closed cyclonic gyre, and the eastern Slope Sea having a more open cyclonic circulation. The Labrador Current flows out of the Canadian Arctic and mixes with the Gulf Stream and its extension, the North Atlantic Current, at the Grand Banks. Further south, the Labrador Current water exchanges with fresher water from the Gulf of St. Lawrence, and flows along the Scotian Shelf, and through the Gulf of Maine where mixing with a cross-isobath, onshore flow of warmer and saltier slope waters creates the characteristic shelf water mass of the MAB (Csanady and Hamilton, 1988; Chapman and Beardsley, 1989; Dong and Kelly, 2003; Townsend et al., 2006; Figure 1A). Within the MAB, there is additional local freshwater supply from rivers via several large bays, but the major freshwater sources for the MAB are the Chesapeake Bay, Labrador Current, and St. Lawrence River. A shelf-slope front that separates shelf waters from the Slope Sea has a variable location but lies typically over the 80-m isobath and is characterized by a salinity around ca. 34 and a sigma theta around 26.5 (Supplementary Figure 1).
Analytical Methods and Study Area
The shipboard salinity and temperature data were collected with a Neil Brown Mark III (NBIS) conductivity temperature depth (CTD) device (Flagg et al., 2002). Nitrate (NO3–) and phosphate (PO4–) concentrations were determined by using a Technicon Autoanalyzer (Technicon AA-II, SEAL Analytical, Inc.) with spectrophotometric methods similar to those described in Wilson et al. (1989). The precision of these methods was around ± 2% (Atlas et al., 1971; Hager et al., 1972; Knap et al., 1996). The DIC concentrations were measured using a single operator multi-parameter metabolic analyzer (SOMMA) with a precision of ± 0.06% and an accuracy of ca. ± 2 μmol kg–1, with values checked against Certified Reference Materials (CRM) (Dickson, 2010), and TA concentrations were determined with a Metrohm 665 Dosimat titrator and an Orion 720A pH meter with a ROSS glass pH electrode and an Orion double junction Ag, AgCl reference electrode through a nonlinear least squares approach with ±2 μmol kg–1 precision and were corrected with the difference between the CRM stated and analyzed values (Johnson, 1992; Johnson et al., 1993; DOE, 1994; Jahnke and Verity, 1994; Knap et al., 1996). The apparent oxygen utilization (AOU) values were calculated from the difference between the theoretical oxygen (O2) saturation values and O2 concentrations determined by Winkler titrations (Chen, 1981; Garcia and Gordon, 1992); positive values of AOU represent O2 undersaturation, and negative values reflect O2 oversaturation. Most samples were analyzed on board during the cruise.
Carbonate chemistry calculations require any two of the four commonly measured parameters—TA, DIC, pH, and fCO2 (fugacity of CO2) or pCO2 (partial pressure of carbon dioxide)—to determine the other two. The CO2SYS program (Lewis and Wallace, 1998; Pierrot et al., 2006) used measured DIC and TA concentrations to calculate values of pH on the total scale, using carbonic acid dissociation constants (K1, K2) of Lueker et al. (2000). Also calculated using the CO2SYS was the aragonite saturation, ΩArag, defined as [Ca2+][CO32–]/KArag, where KArag is the solubility constant (Mucci, 1983), and the calcium concentration was determined from salinity (Millero, 1995). Finally, pHin situ and ΩArag were calculated at in situ temperature and pressure.
Water Mass Mixing Model
Potential temperature–salinity (θ-S) diagrams (Figure 1C) are widely utilized to represent and quantify mixing of different water masses (Helland-Hansen, 1916; Mamayev, 1975). The geometry of the θ-S diagram, together with the assumption of no heat or gas exchange with the atmosphere, yields a set of closed system equations that allow quantitative water mass analysis (Tomczak, 1981). The source water types (known as endmembers) were identified for each transect in the MAB based on the bounding extremes and inflection points in the potential θ-S diagrams (Table 1 and Supplementary Figures 1, 2). The nearshore water endmembers were the points with the lowest salinity at each transect. The shelf water endmembers were the inflection points within the salinity range around 33–34, where the water column generally showed stratification. If there was another inflection point between the nearshore water and the shelf water, it would be identified as the nearshore water endmember 2, which reflects the mixing situation in shallow waters. The slope water was determined as the highest salinity point on the θ-S plot and was generally located around the isopycnal of 27 (Supplementary Figure 1). In the southern MAB, the Gulf Stream rather than the slope water served as the highest salinity endmembers for the CB and CH transects.
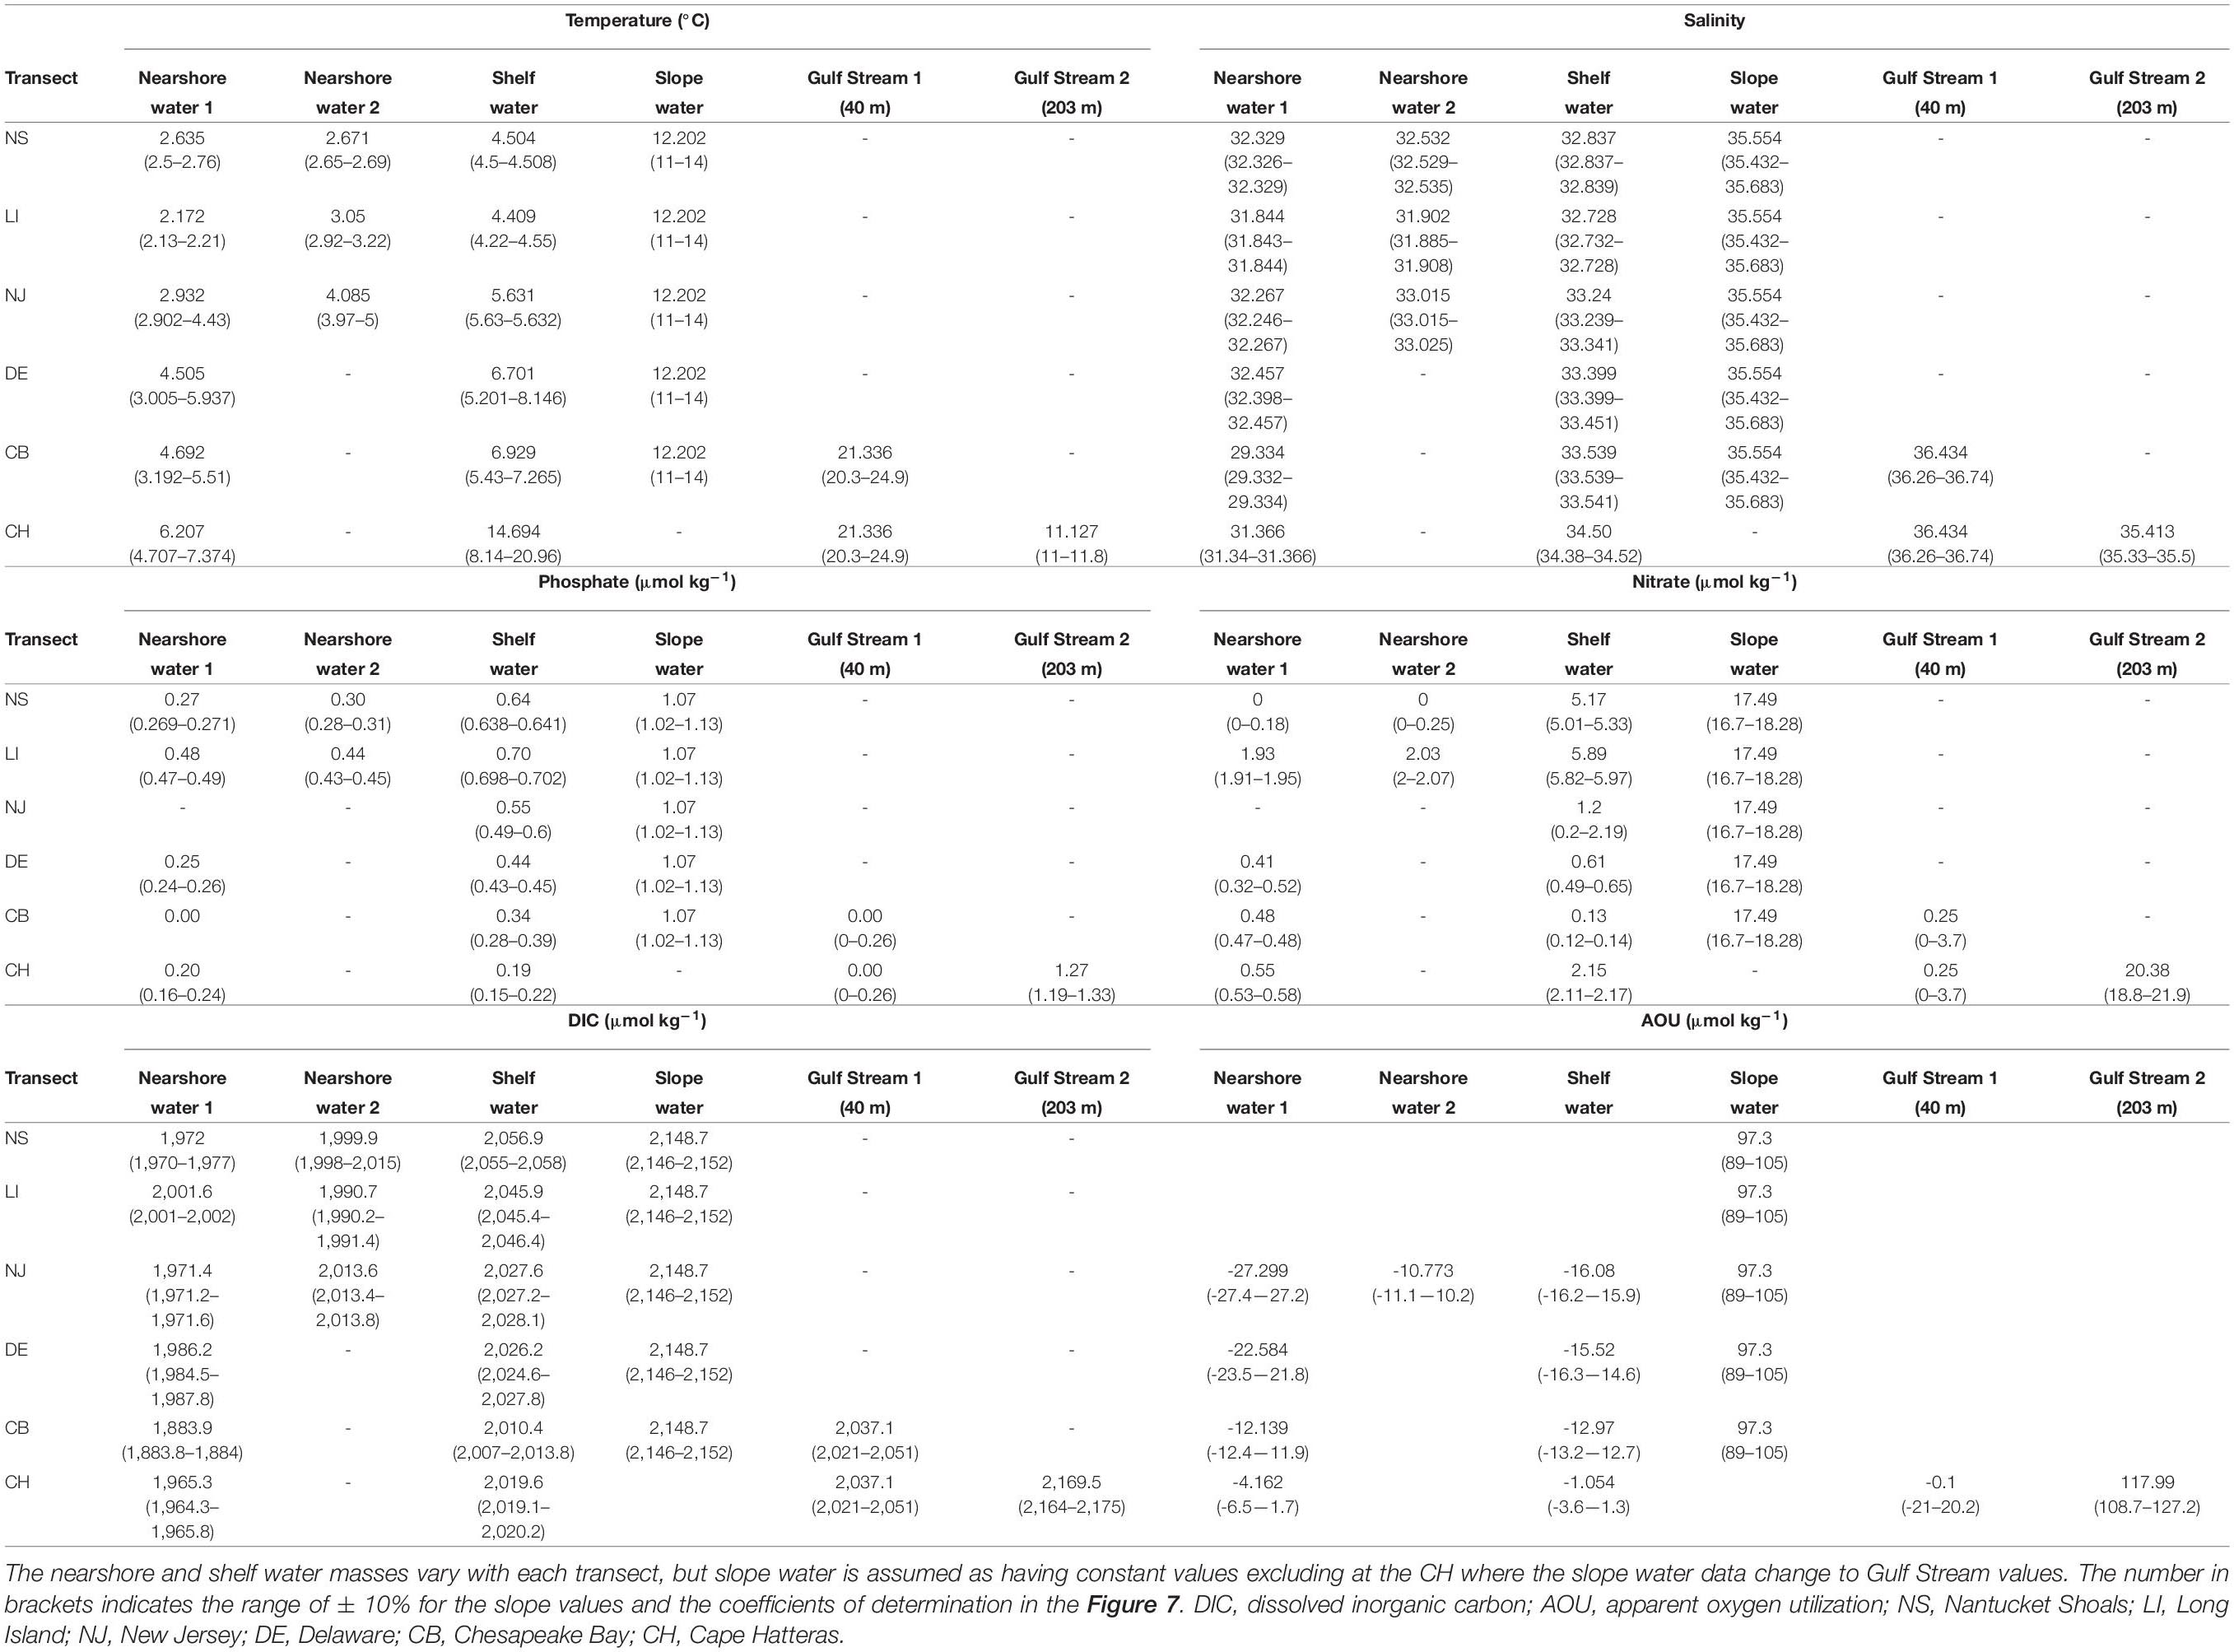
Table 1. Comparisons among nearshore water, shelf water, and slope water in temperature, salinity, phosphate, nitrate, DIC, and AOU in the NS, LI, NJ, DE, CB, and CH transects.
In this work, each transect was divided into two mixing regimes: a mixing between nearshore and shelf water, and a mixing between shelf and slope water (or the Gulf Stream for the two southern transects). The fraction of each water mass was estimated by a two-endmember mixing or a three-endmember mixing (when there were two nearshore water endmembers). The mass balance equations of a water sample (j) that is a mixture of various source water types (i) are:
where the subscript i refers to an individual seawater endmember or water type, and Xij is the fractional contribution of the endmember (i) to a water sample (j). Tj and Sj are the temperatures and salinities of the samples, and Ti and Si are the temperatures and salinities of the individual endmembers. Equation 1 is the mass balance of water and Equation 3 that of salt, both of which must be conserved. Salinity can vary due not only to mixing of different water types but also to precipitation and evaporation, but it is assumed that the latter processes have little influences on the water and salt masses during the sampling period. Strictly speaking, temperature (Equation 2) is not a conserved quantity, but it is nearly directly proportional to heat content, which is conserved. Water temperatures can also be affected by heat exchange with the atmosphere, but this is not considered in the mixing model. In the calculation of mixing model, the estimated salinities are consistent with corresponding data points, but temperature differences between estimated and measured values range from –1.3 to 0.9°C.
Theoretical mixing concentrations of biogeochemical parameters can be viewed as conservative and predicted based on the proportions and concentrations of different source water types as follows:
where A°j refers to the theoretical, or conservative, mixing concentration in sample j, of a biogeochemical parameter such as AOU, phosphate, nitrate, or DIC, and Ai represents the concentrations of that biogeochemical parameter in the endmembers. The differences
between the observed sample concentrations Aj and theoretical concentrations predicted on the basis of conservative mixing reflect anomalies mainly resulting from biological processes such as production and remineralization.
Results and Discussion
Surface Distributions of Current, Physical, Chemical, and Biological Parameters
Consistent with regional circulation (see the Cruise description and regional hydrographic background section), surface temperature, salinity, nitrate, DIC, and TA in the MAB increase across the shelf from the shore to the Slope Sea (Figure 2). The lower temperatures occur in the most nearshore stations of NS, LI, and NJ because of the more important role of heat loss in shallow water to the atmosphere during winter, Labrador Current input, and coastal river inputs. The temperature of nearshore water also slightly increases with decreasing latitude due to the increased solar radiation and decreased influence of the Labrador Current. The highest temperature is at the most offshore station of CH due to the influence of the Gulf Stream (Figure 2A). The distribution of salinity is slightly different from that of temperature, with river discharge diminishing the salinity in the nearshore region, and more Labrador Current dominance leading to low salinity in the northern part of the shelf. The greatest onshore–offshore salinity contrast occurs in the CB and CH transects due to the large amount of freshwater input from the Chesapeake Bay and the greater influences of the Gulf Stream and slope water at the most offshore stations (Figure 2B).
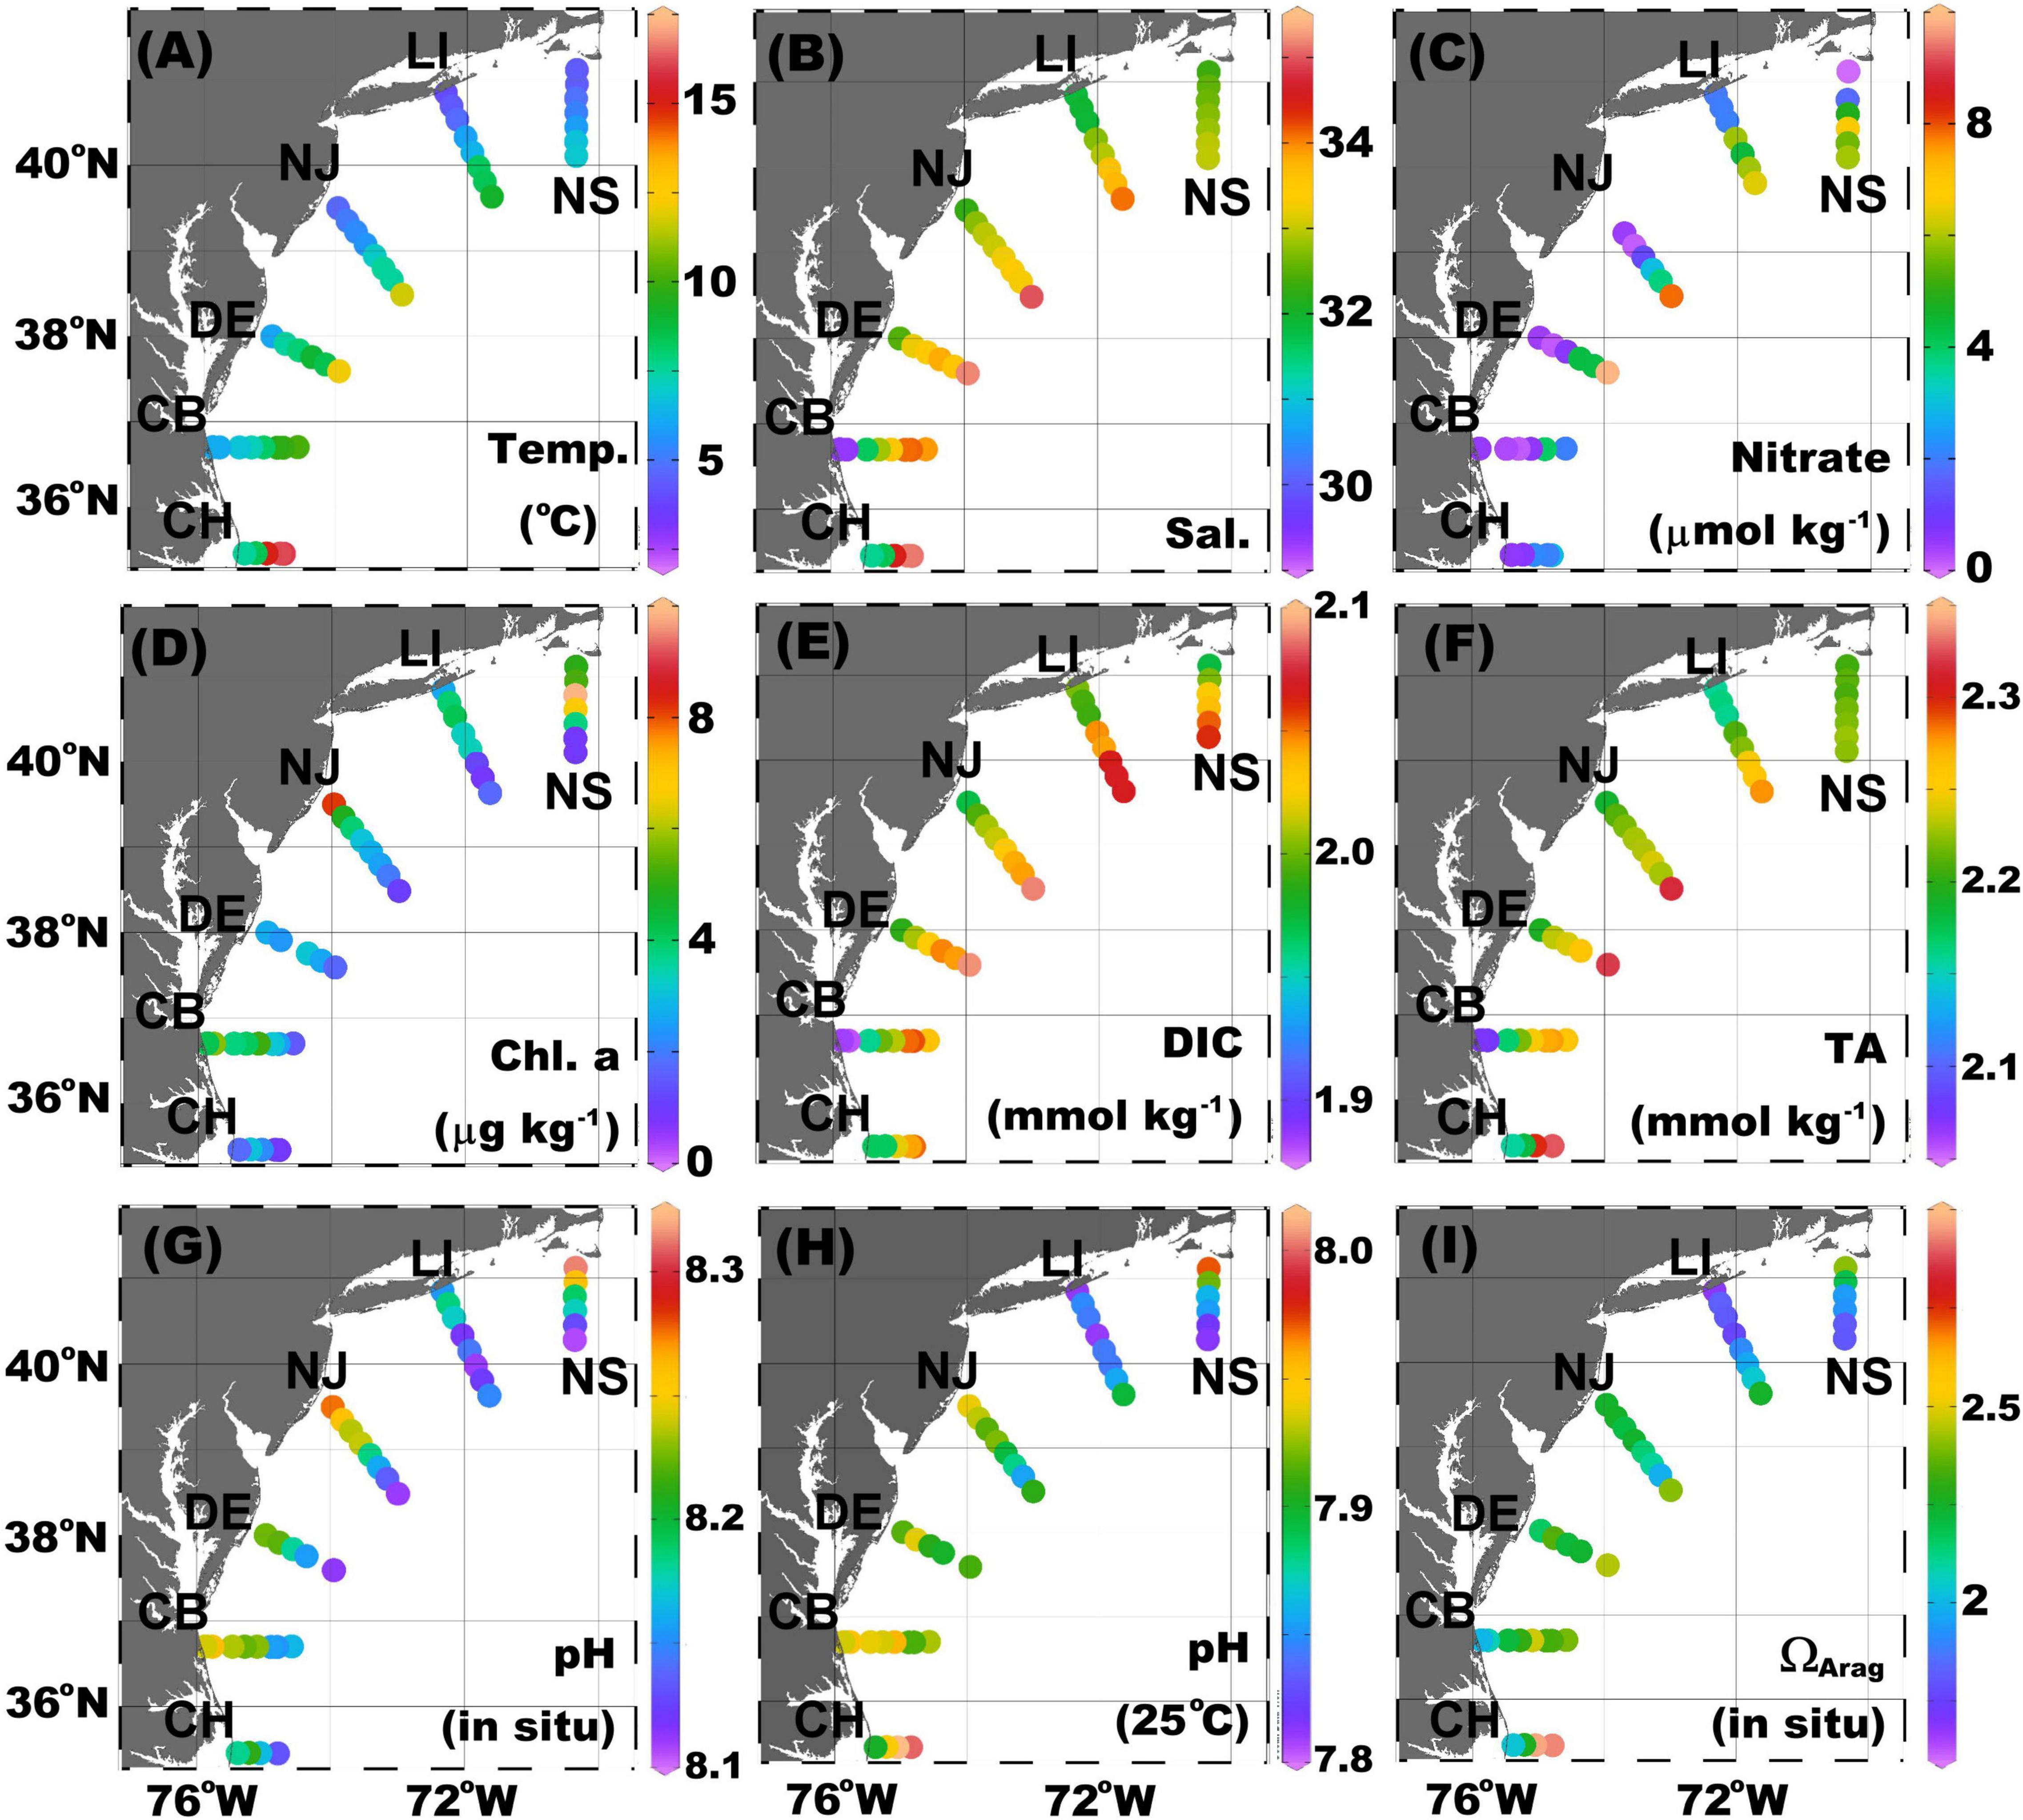
Figure 2. Surface distribution of (A) temperature, (B) salinity, (C) nitrate, (D) chlorophyll a (Chl-a), (E) dissolved inorganic carbon (DIC), (F) total alkalinity (TA), (G) pHin situ, (H) pH25C, and (I) aragonite saturation state (ΩArag) in the Mid-Atlantic Bight (MAB). The color dots from red to purple depicts the value from high to low. pHin situ was calculated on the total scale at in situ temperature and pressure, and pH25C was calculated in 25°C and zero pressure. ΩArag was calculated at the in situ temperature and pressure.
In general, river discharges bring nitrate to the nearshore regions, as does mixing with slope water. However, in the MAB region, major river inputs are processed within large estuaries such as the Chesapeake and Delaware Bays with relatively long water residence times (Boynton et al., 1995; Kemp et al., 1997; Sharp et al., 2009). As a result, riverine nitrate and DIC are consumed, and pCO2 is reduced in lower estuaries before reaching the shelf (Joesoef et al., 2015; Cai et al., 2017; Chen et al., 2020). Nutrients and DIC are also used for biological production in the MAB inner shelf, even during the late winter, as evidenced by relatively high Chlorophyll a (Chl-a) concentrations (Figures 2C–E). As river water is characterized by much lower DIC and TA concentrations than seawater, the surface DIC and TA distributions largely reflect the salinity distribution (Figures 2B,E,F). On the contrary, pHin situ values decrease seaward with increasing salinity (Figure 2G). This pattern is a combined result of water mass mixing with an increasing temperature to the offshore direction and a stronger biological production (which increases pH) in nearshore waters. In the northern transects, it appears that strong biological activities play a more important role as pH normalized to 25°C has a similar pattern to the pHin situ and as Chl-a values are clearly higher at nearshore stations (Figures 2G–I). In the southernmost transect (CH), however, once the temperature is scaled or normalized to a common temperature of 25°C, pH25C increases toward the Gulf Stream endmember. Biological CO2 could have a stronger impact in increasing pH in cold waters than in warm waters (Cai et al., 2020). The distribution of ΩArag is less consistent in the cross-shelf direction, decreasing seaward along the NS transect but increasing seaward in other transects.
Vertical Distributions of Physical, Chemical, and Biological Parameters
Shallow inner shelf waters are vertically well mixed because of strong winds and cooling, as indicated by an overlap of symbols in the θ-S diagram from the same station (blue symbols in Figure 1C). The salinity maximum (S = 35.82) at offshore regions likely results from the subtropical subsurface water, reflecting the influence of the Gulf Stream (Gawarkiewicz et al., 1992; Marchese and Gordon, 1996), and this impact is particularly noticeable across the entire CH transect from coast to the shelf break (Figure 1C and Supplementary Figure 1), which is close to where the Gulf Stream leaves the coast. This vertical mixing results in a hook shape in the θ-S diagram for the CH transect at the highest salinity (S ≈ 34.5–35.8) and temperature (T ≈ 13.7–16.2°C), where the subtropical subsurface water mixes with coastal river plume water from the Chesapeake Bay (triangle symbols in Figure 1C). The most offshore stations (red symbols in Figure 1C) from the NS to the CB sections reflect the influence of the slope water (S ≈ 35.6), and the waters in the layer of σT ≈ 26.5–27 cluster in a small salinity and temperature range (Figure 1C). Excluding the lowest and highest salinity areas, the main trend shown in Figure 1C is nearly a linear relation between θ and S (S ≈ 33.0–35.6, T ≈ 4.7–12.2°C), reflecting the mixing between the low-salinity inner shelf water (S ≈ 32–33.5) and the higher-salinity slope water (S ≈ 35.6).
The cross-shelf sections of temperature, salinity, nitrate, Chl-a, DIC, TA, pHin situ, and ΩArag for each transect are presented in Figures 3, 4. Cold and freshwater occupies the shelf, whereas warm and salty water sits over the slope, with the boundary between these two water masses marked by the persistent shelf-break front (green area in Figures 3A–F, yellow area in Figures 3G–L). The colder and fresher shelf water extends seaward in the upper layer, while the warmer and saltier slope water onwells shoreward in the bottom layer from the NS to the CB transects (Figures 3A–L). In the alongshore direction, the northern MAB region (NS-NJ) is colder, fresher, and has a larger extent of vertical mixing on the shelf than in the southern region (DE–CH), reflecting a north-to-south change in the volume of the shelf water (Mountain, 1991). At the nearshore end of CB transect, the water from the Chesapeake Bay greatly reduces both salinity and temperature. The highest temperature and salinity waters occupy the shelf break edge of the CH transect (Figures 3F,L), consistent with its proximity to the Gulf Stream, which turns northeastward around Cape Hatteras (Rossby and Benway, 2000).
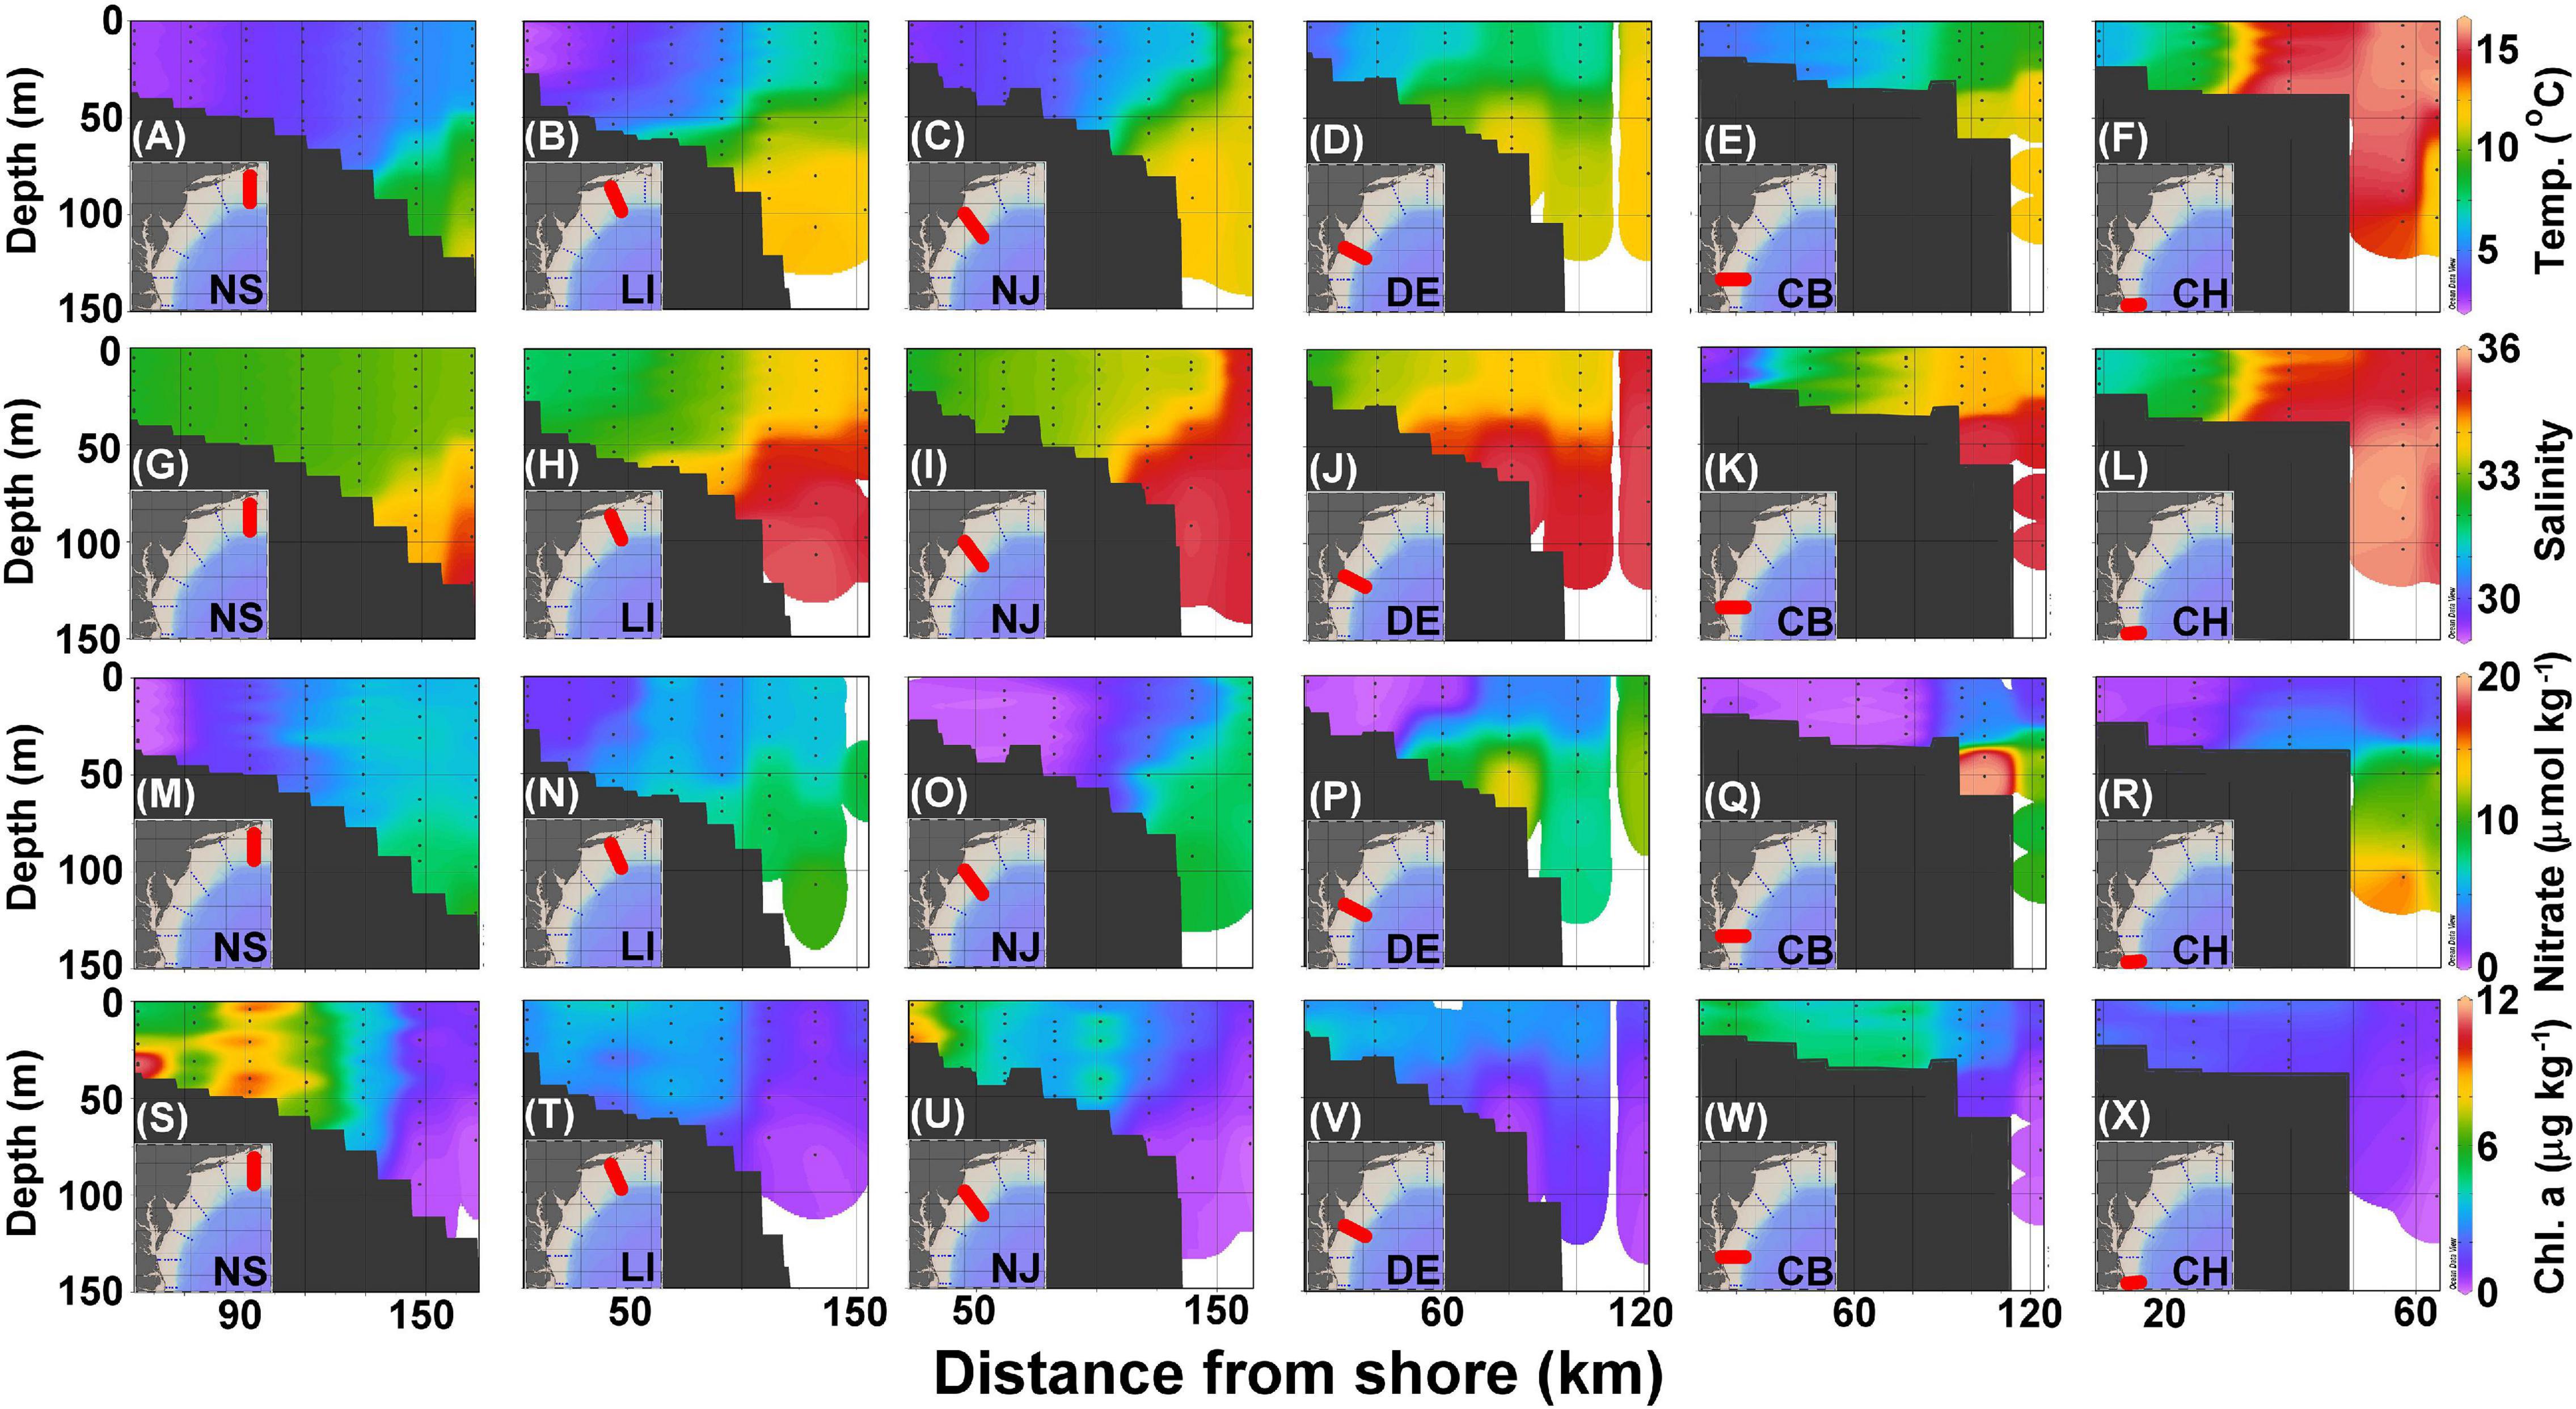
Figure 3. Cross section of temperature (A–F), salinity (G–L), nitrate (M–R), and Chl-a (S–X) in the NS, LI, NJ, DE, CB, and CH transects (Figure 1) corresponding to panels ordered from left to right. The black dots represent sampled locations and depths.
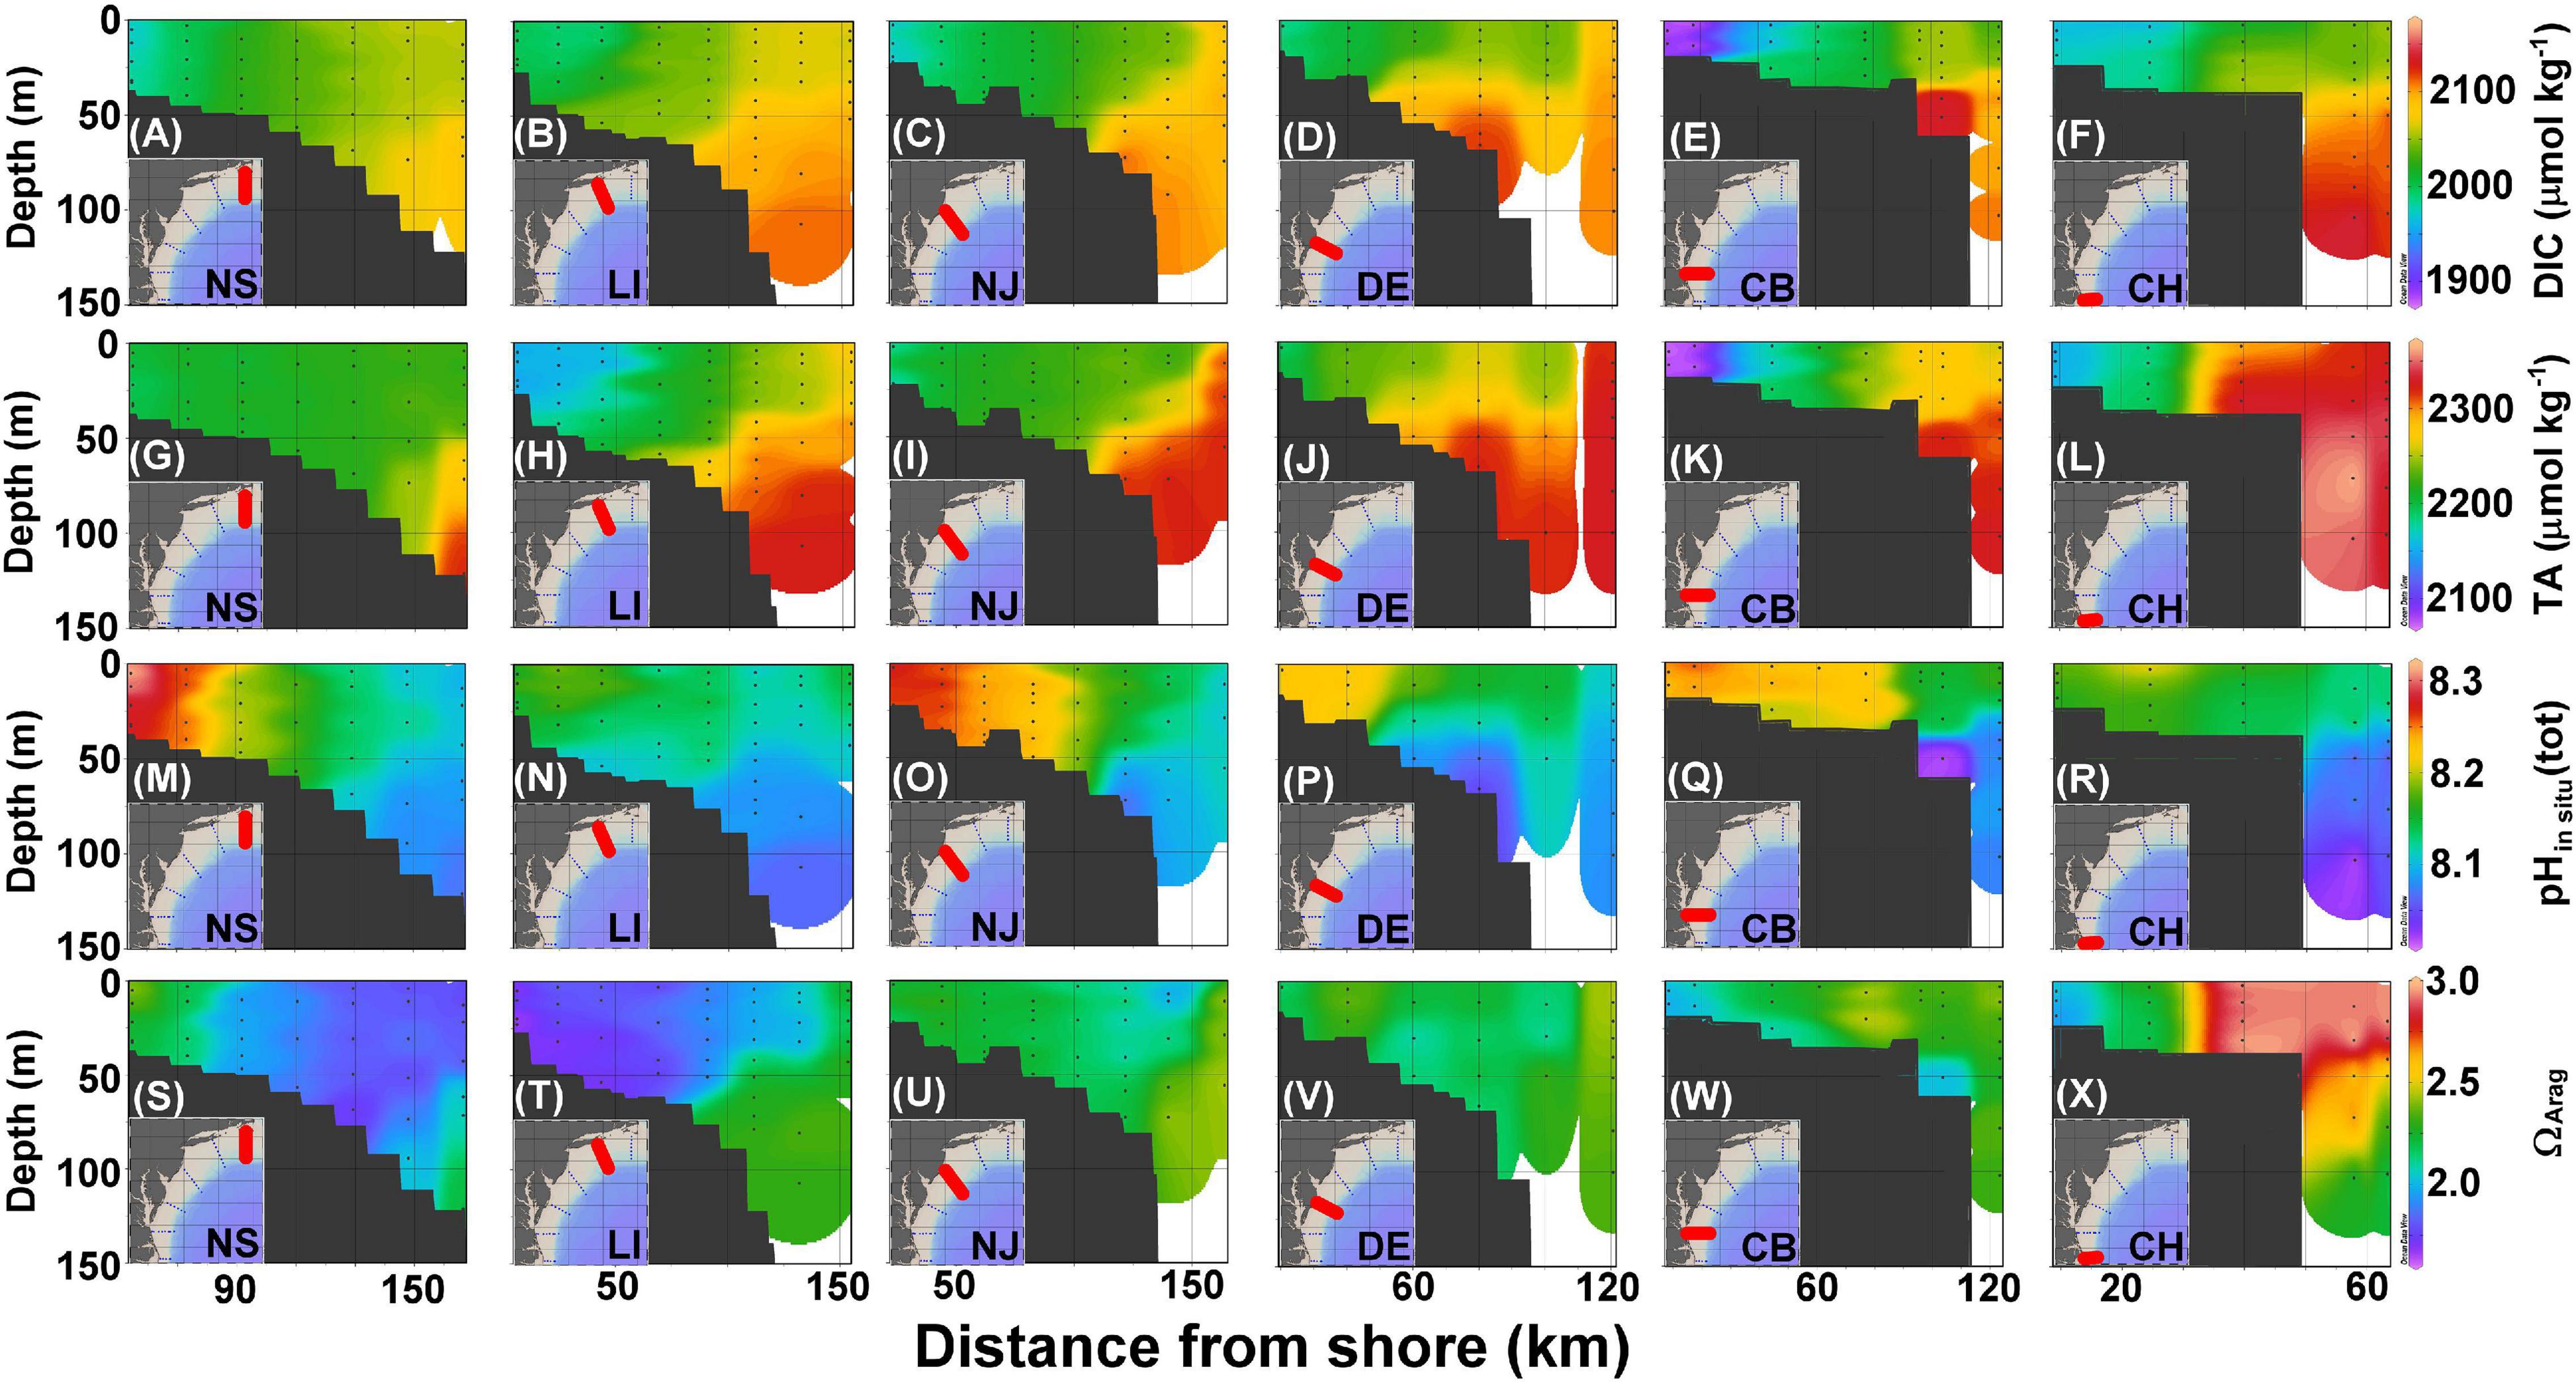
Figure 4. Cross section of DIC (A–F), TA (G–L), pHin situ (M–R), and ΩArag (S–X) in the NS, LI, NJ, DE, CB, and CH transects (Figure 1) corresponding to panels ordered from left to right. The black dots represent sampled locations and depths.
As noted in the Surface distributions of current, physical, chemical, and biological parameters section, inner shelf waters tend to have low nitrate concentrations, which increase seaward due to wintertime mixing with deeper, subsurface waters with high nutrient concentrations that occur in the Slope Sea (Figures 3M–R). However, nitrate concentrations are also high inside the shelf-break at about the 50-m depth in the CB transect due to bottom recycling driven by high biological production in the surface water (Figure 3Q; Fisher et al., 1988). Generally, concentrations of Chl-a are high along the coastal shelf and decrease with distance from shore, and at some shallow stations, (e.g., those <50 m, Figure 3S) concentrations are highest near the bottom due to either wind-enhanced mixing or bottom shoreward nutrient supply (Figures 3S–X; Makinen and Moisan, 2012).
Dissolved inorganic carbon and TA values on the shelf are between 1,850 and 2,050 and 2,050 and 2,250 μmol kg–1, respectively, whereas the slope water is characterized by DIC and TA that are higher than 2,100 and 2,300 μmol kg–1, respectively (Figures 4A–L). The lowest DIC and TA are found at the most nearshore station in the CB transect (Figures 4E,K), consistent with the lowest salinity found there because of river plume water influences (Figure 3K). The highest DIC and TA originate from the subsurface water of the Slope Sea that partially onwells to the edge of the shelf (Figures 4A–L). Similar to the surface distributions, pHin situ values are consistently higher in the nearshore water columns and decrease seaward (Figures 4M–R), whereas ΩArag distributions are variable (Figures 4S–X). The lower pHin situ values are also present near the bottom or in the subsurface water.
Latitudinal Distribution of Aragonite Saturation State
ΩArag increases from north to south with the increase in TA/DIC ratio and temperature (Figure 2). This trend is largely determined by the temperature dependences of CO2 solubility, the solubility of aragonite, and the dissociation constants of carbonic acid (Millero et al., 2006; Cai et al., 2020). Jiang et al. (2015) have derived a regional empirical formula based on the data collected from 1970 to 2010 to predict the surface water ΩArag in the Atlantic Ocean from sea surface temperature (SST) and concluded that the tight correlation between ΩArag and temperature is mainly a result of the different air–sea CO2 exchange fluxes induced by the north–south temperature gradient rather than a direct thermodynamic effect of temperature. In other words, more CO2 is taken up by cold water in the north, thus, converting more CO32– to HCO3– and leading to a higher DIC and a lower TA/DIC ratio than in the warmer water in the south (Takahashi et al., 2014; Xu et al., 2017; Cai et al., 2020). A similar correlation exists for the MAB shelf water (the dotted line in Figure 5), likely for the same reason, even though TA and environmental conditions change greatly and are often patchy in these coastal waters. The average ΩArag in the MAB surface waters is generally lower than the value predicted using Jiang’s formula because the TA/DIC ratio in nearshore water is generally lower than the open ocean surface waters (note that the TA/DIC ratio is ≤ 1.0 in most rivers and typically near 1.15 in open ocean waters). Such latitudinal pattern does not exist in the surface pHin situ distribution as it is more controlled by the local biological activities. The closely linked, but somewhat different, responses of pHin situ and ΩArag to temperature, mixing, and biological production observed here are consistent with those reported in Cai et al. (2020) at a large, though less fine, spatial scale in the waters off the northern American eastern coast.
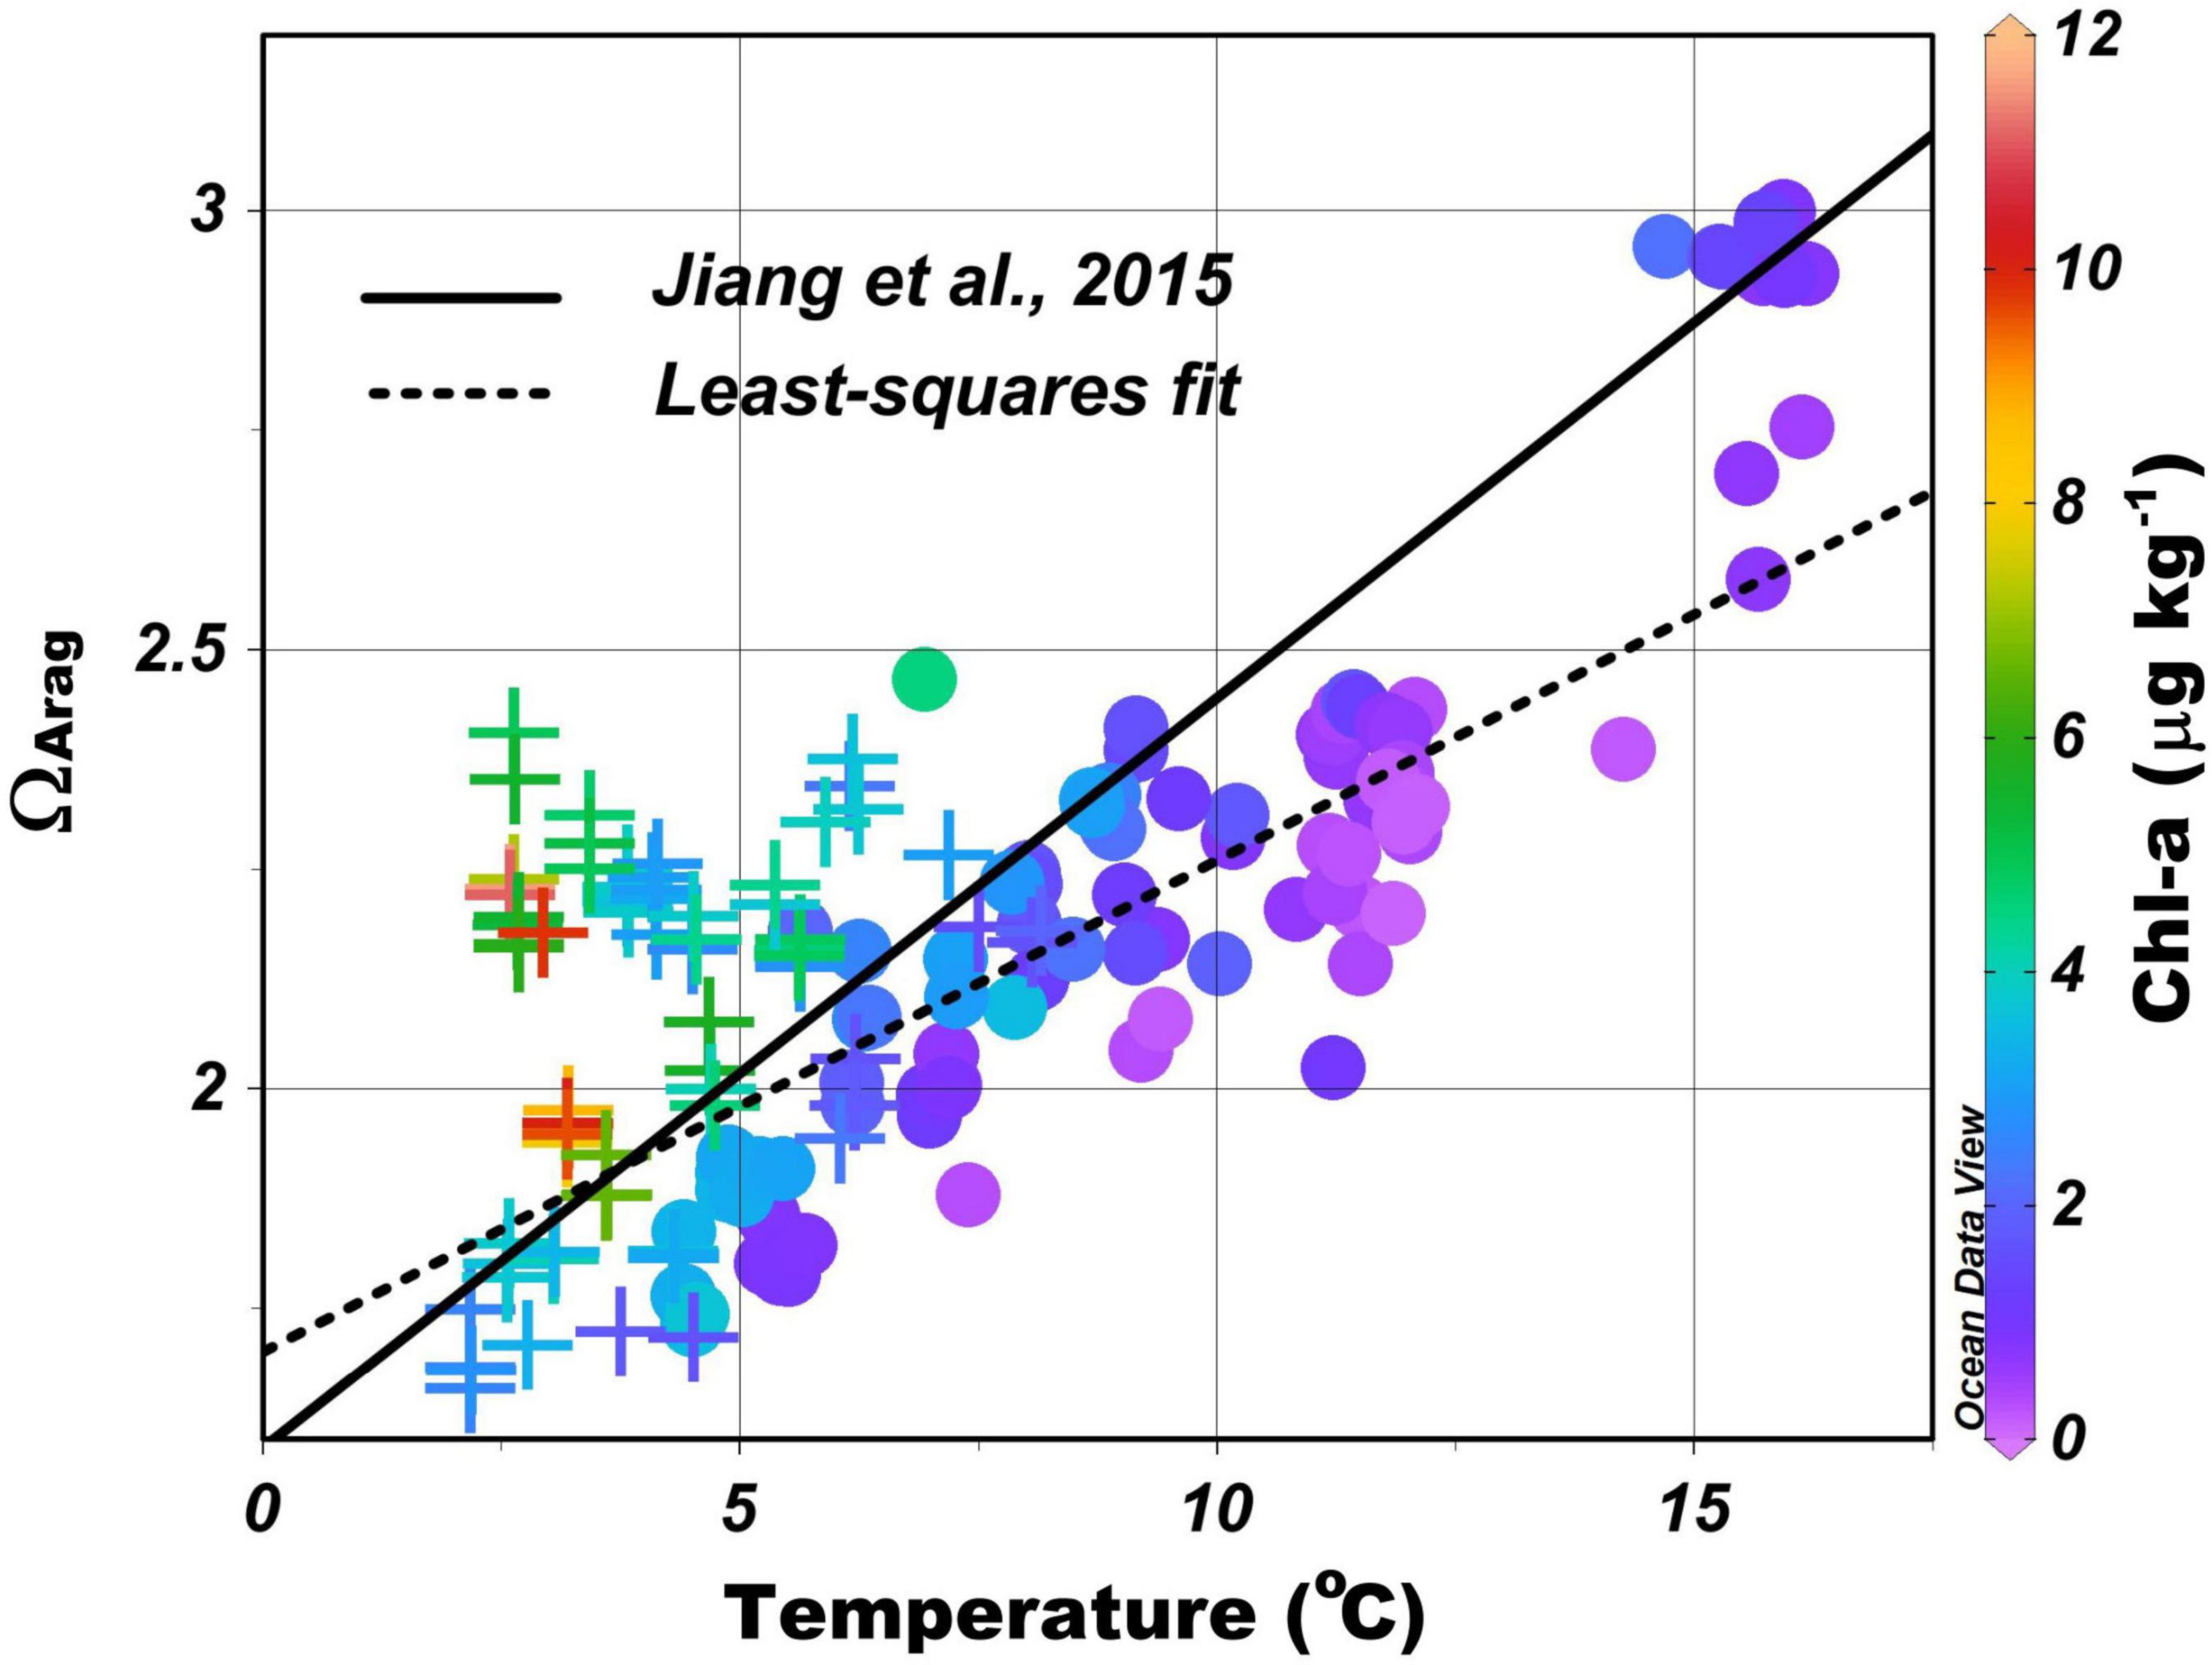
Figure 5. Aragonite saturation state (ΩArag) as a function of sea surface temperature (SST), with least-squares fit, ΩArag = 0.056 × SST + 1.70 (dotted line). Circles represent samples between the shelf water and the slope water/Gulf Stream, and crosses represent samples between the nearshore and the shelf waters. Symbols with different colors represent different levels of Chl-a concentration. The black line represents the empirical formula from Jiang et al. (2015): ΩArag = 0.0855 × SST + 1.59.
Correlations Among Apparent Oxygen Utilization, Dissolved Inorganic Carbon, Nutrients, and Total Alkalinity
Property–property plots such as those presented in Figure 6 can reveal whether associated variables follow the same physical mixing process or are altered by biological processes. Here, we have categorized data into two groups: (i) mixture of shelf water with slope water or Gulf Stream water (gray circles) and (ii) mixture of nearshore water with shelf water (black cross symbols). For DIC-TA plot, the slope of the black symbols, located near the shore, is consistent with linear mixing (two black solid lines) between seawater and riverine (nearshore) endmembers based on the riverine TA data from the United States Geological Survey (USGS) for the same period and assuming TA ≈ DIC (Cai et al., 2010). As noted earlier, as riverine concentrations of DIC are subject to modification by net biological production in large estuaries and low-salinity inner shelf waters (Figure 6A), it may therefore be more appropriate to use nearshore endmembers instead of river endmembers to examine mixing and biological effects. The black crosses with high DIC concentrations (a few symbols above the solid lines) on the northern shelf indicate another low-salinity endmember (Figure 6A; Table 1).
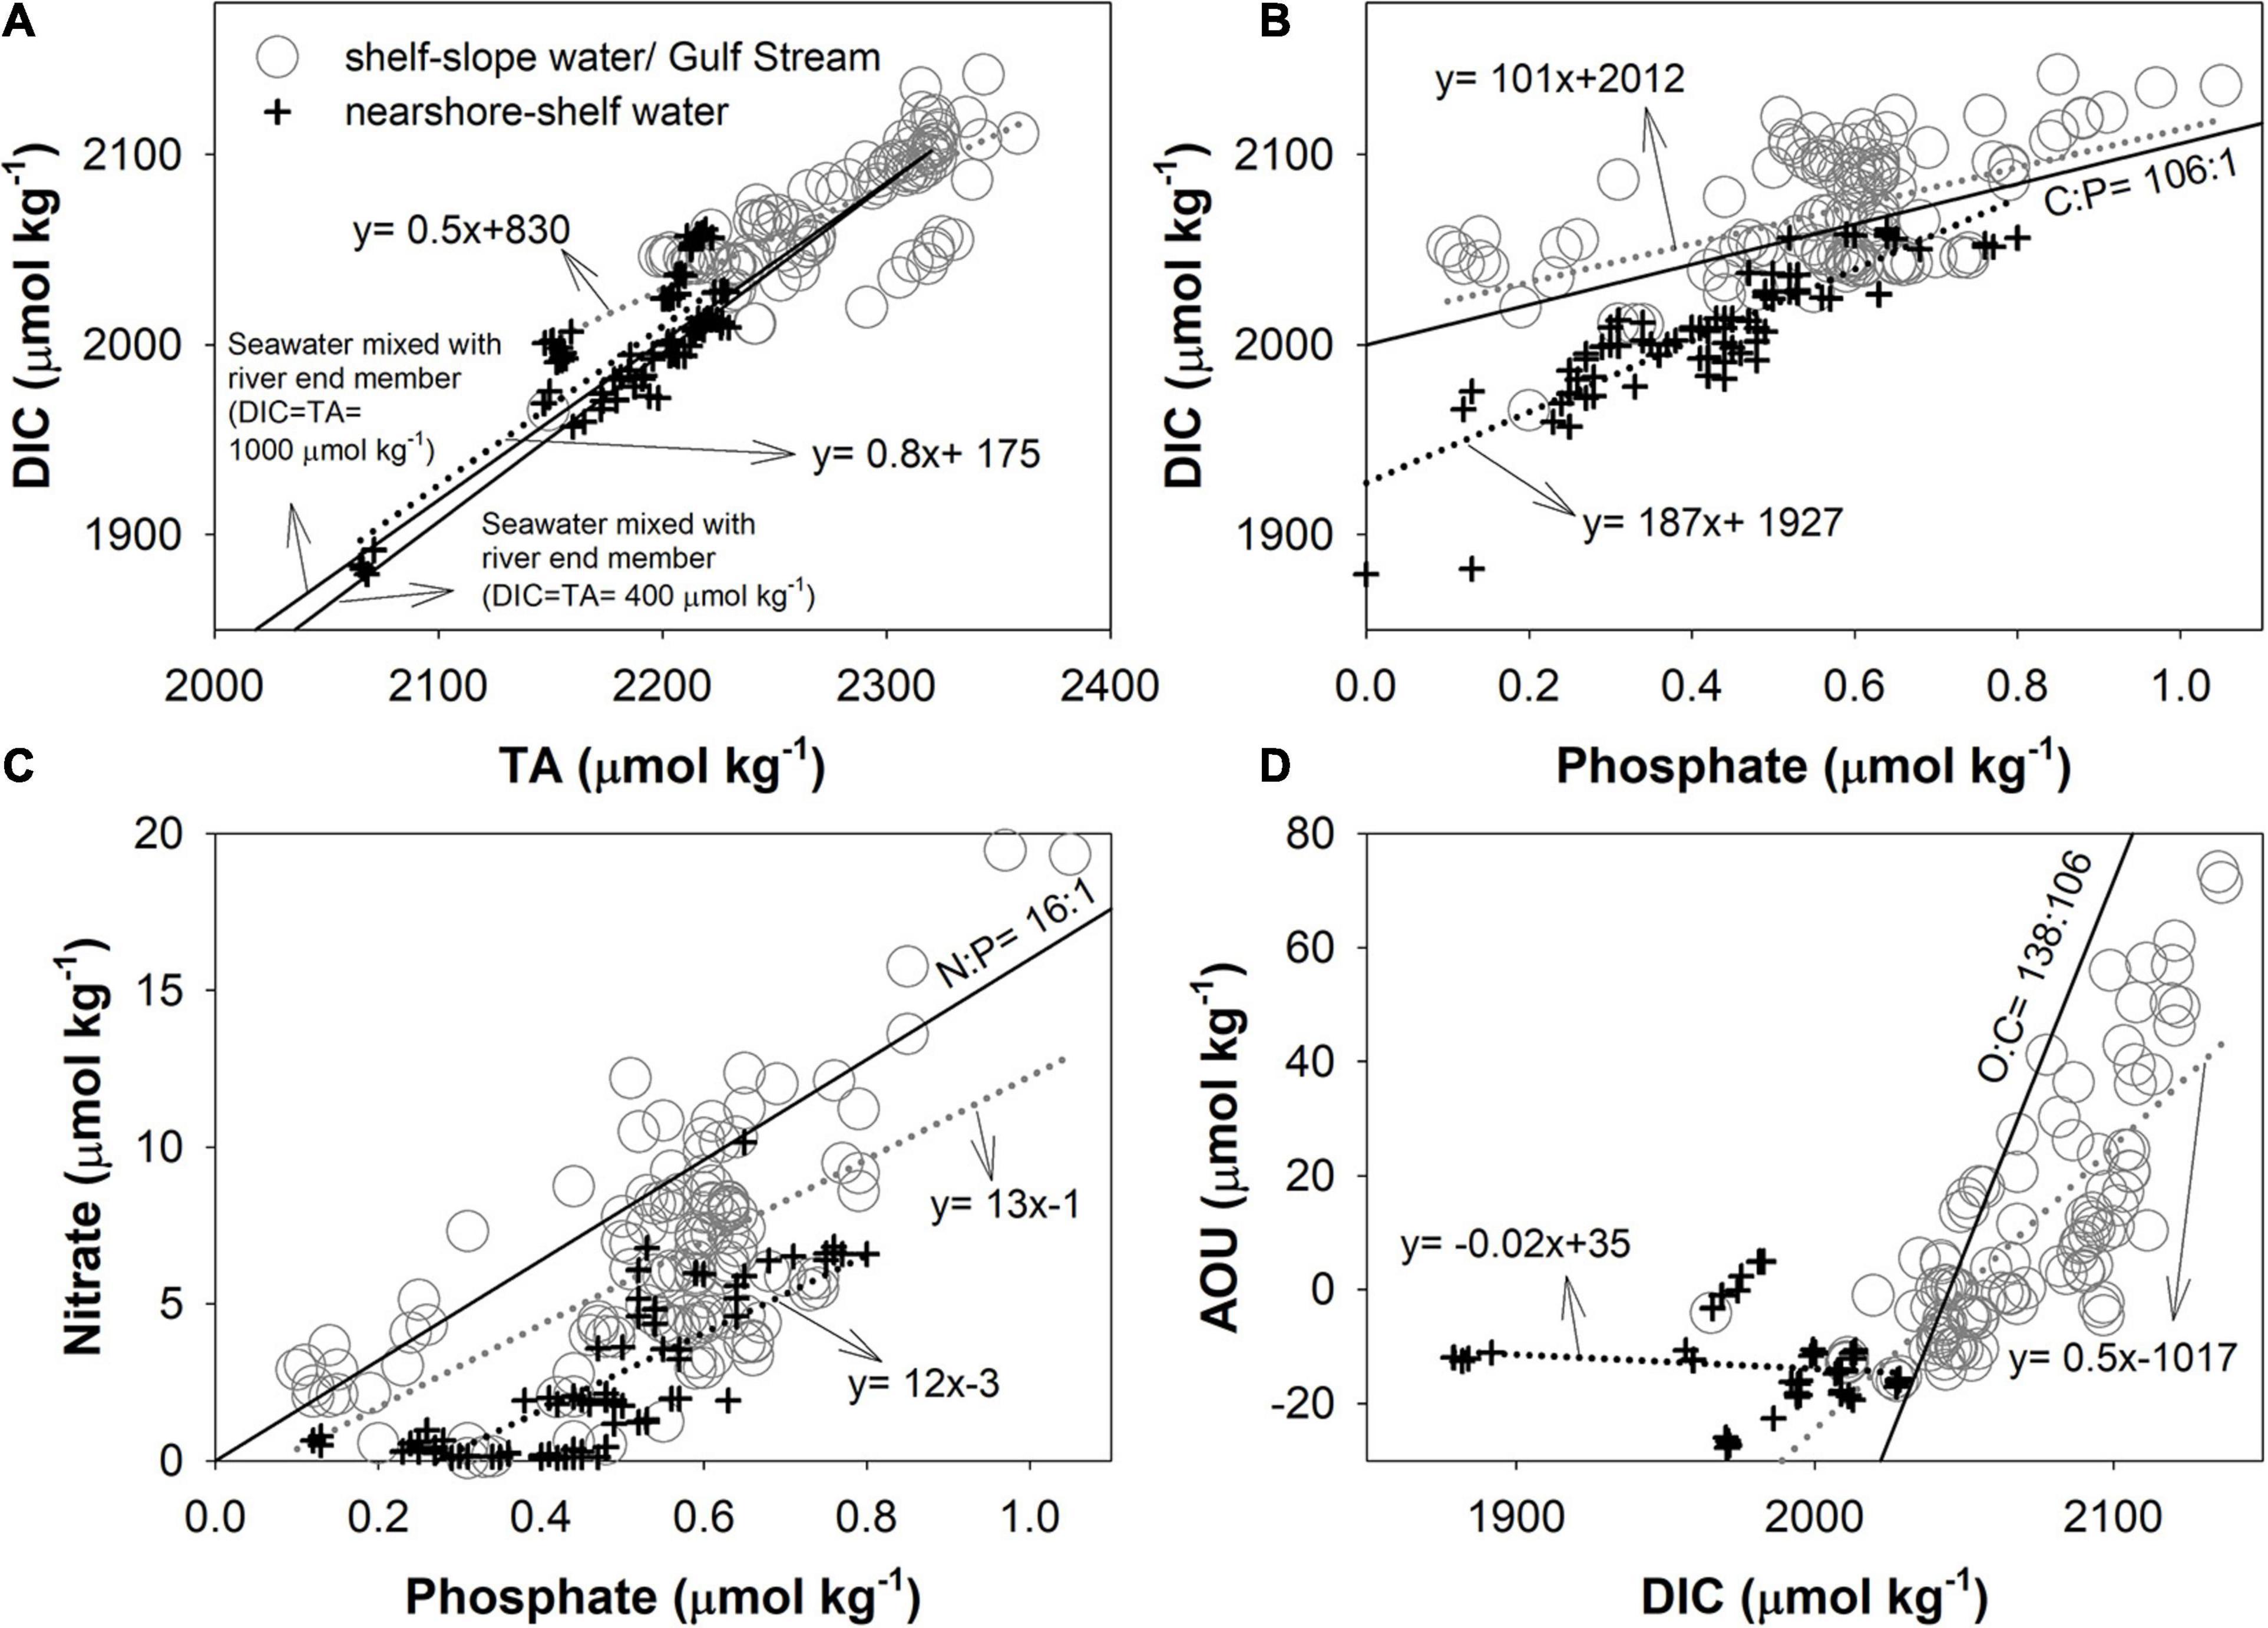
Figure 6. (A) DIC vs. TA, (B) DIC vs. phosphate, (C) nitrate vs. phosphate, and (D) apparent oxygen utilization (AOU) vs. DIC. Gray circles represent samples between the shelf water and the slope water/Gulf Stream, and black crosses represent the seasonal samples between the plume nearshore and the shelf water. The gray and black dot lines are linear regression lines for data represented by gray circles and black crosses. The two black lines in (A) denote the theoretical mixing between riverine endmember and shelf water (A), and the lines in other plots are the Redfield ratios. For the theoretical mixing line, two river concentrations (DIC ≈ TA = 400 or 1,000 μmol kg–1) are used to bracket a range of river endmembers in this region.
Graphs of DIC vs phosphate, nitrate vs phosphate, and AOU vs DIC, are shown in Figures 6B–D, respectively. Overall, most of the slopes in these plots differ from the stoichiometry given by the Redfield ratios (Redfield, 1958), which are expected from biological processing alone (C:P = 106:1; N:P = 16:1; O:C = 138:106), due to the mentioned physical mixing. For biological activities, the low nitrate makes nitrogen, rather than phosphate, the limiting nutrient (black cross symbols in Figure 6C), and similar distributions also exists in Georges Bank and the Gulf of Maine (Townsend and Thomas, 2002). In most of the inner shelf water (black cross in Figure 6C), nitrate falls below the expected Redfield ratio and may be the result of a more rapid regeneration for phosphate than nitrate (Paytan and McLaughlin, 2007). Denitrification and gas exchange can also affect the relations (see discussion in the Separation of water mixing and biological effects section). Because of a combination of complex mixing and biological activities operating in different regions of the MAB, a simple interpretation of water column processes based on observed property–property relations is unlikely, and a more rigorous treatment of mixing is needed to elucidate the influences of biological processes on nutrient and inorganic carbon distributions.
Separation of Water Mixing and Biological Effects
In order to distinguish biological effects from water mass mixing on the property distributions and to examine stoichiometric ratios during biological processes, we use the mixing model to separate the effects of these two processes. We first use the results of linear programming optimization (Goodarzi et al., 2014)—that is, Equations 1–3—to calculate the fractions of various water masses that contribute at each location. Then, the estimated fractions of identified water masses are used to calculate the theoretical concentrations of biochemical parameters. Finally, the difference between the observed property and the mixing predicted value is defined as the anomaly, which is attributed to non-conservative biological processes (atmospheric exchange is neglected here). The source water types are determined from the θ-S diagram as detailed earlier (Figure 1C), and nutrient and DIC concentrations are then used to distinguish the water masses with similar θ-S values (Table 1). Although the identified endmembers may vary both spatially and temporally, the concept and procedure proposed here, nonetheless, allow us to effectively separate biological processes from physical mixing. However, it must be noted that this approach does not provide a measure on the biological activities in the endmembers, such as that in the highly productive nearshore waters.
The adopted endmember values differ between different transects (Table 1). The phosphate concentration of nearshore water at the CB transect is zero, consistent with reports that phosphate is limited in the Chesapeake Bay during winter (Prasad et al., 2010). The low nitrate concentration of nearshore waters at the NS transect may result from the near-zero nitrate of the Gulf of Maine surface water (Townsend et al., 2010). The AOU of nearshore water increases from the NJ to the CH transect, and the DIC concentration either decreases or remains nearly constant. It is worth noting that nearshore or coastal river plume water is most heterogeneous and variable, and can be divided into two sub-types (nearshore water-1 and nearshore water-2) in the northern transects (NS-NJ), where nearshore water-1 is slightly colder and fresher than nearshore water-2. Surface cooling and vertical mixing in nearshore areas may contribute to the lower temperature there, and cause the winter-only mid-shelf front in the northern MAB (Ullman and Cornillon, 2001). The nitrate concentration of shelf water in the NS and LI are similar to the reported values for the Georges Bank (Table 1; Townsend and Thomas, 2001; Bisagni, 2003). For the shelf water endmember, the nutrient and DIC concentrations decrease southward from the NS to the CB, but the salinity increases consistent with the water flow direction, showing a reduced Labrador Current influence (Table 1).
Using the water mass endmembers identified above and the mixing model presented in the Water mass mixing model section, we are able to separate the effects of biological processes from the water mass mixing using correlations among the biogeochemical anomalies, dDIC, dP, dN, and dAOU presented in Figure 7, calculated using Equations 1–5. Each plot is divided into four quadrants based on the sign of the anomalies, with positive and negative values representing addition to or removal from the theoretical mixing values, respectively. In particular, the anomalies in quadrant I denote the addition of DIC and inorganic nutrients and consumption of O2 due to organic matter decomposition, and those in quadrant III represents removal of DIC and inorganic nutrients and production of O2 by biological production and other processes (see discussion below).
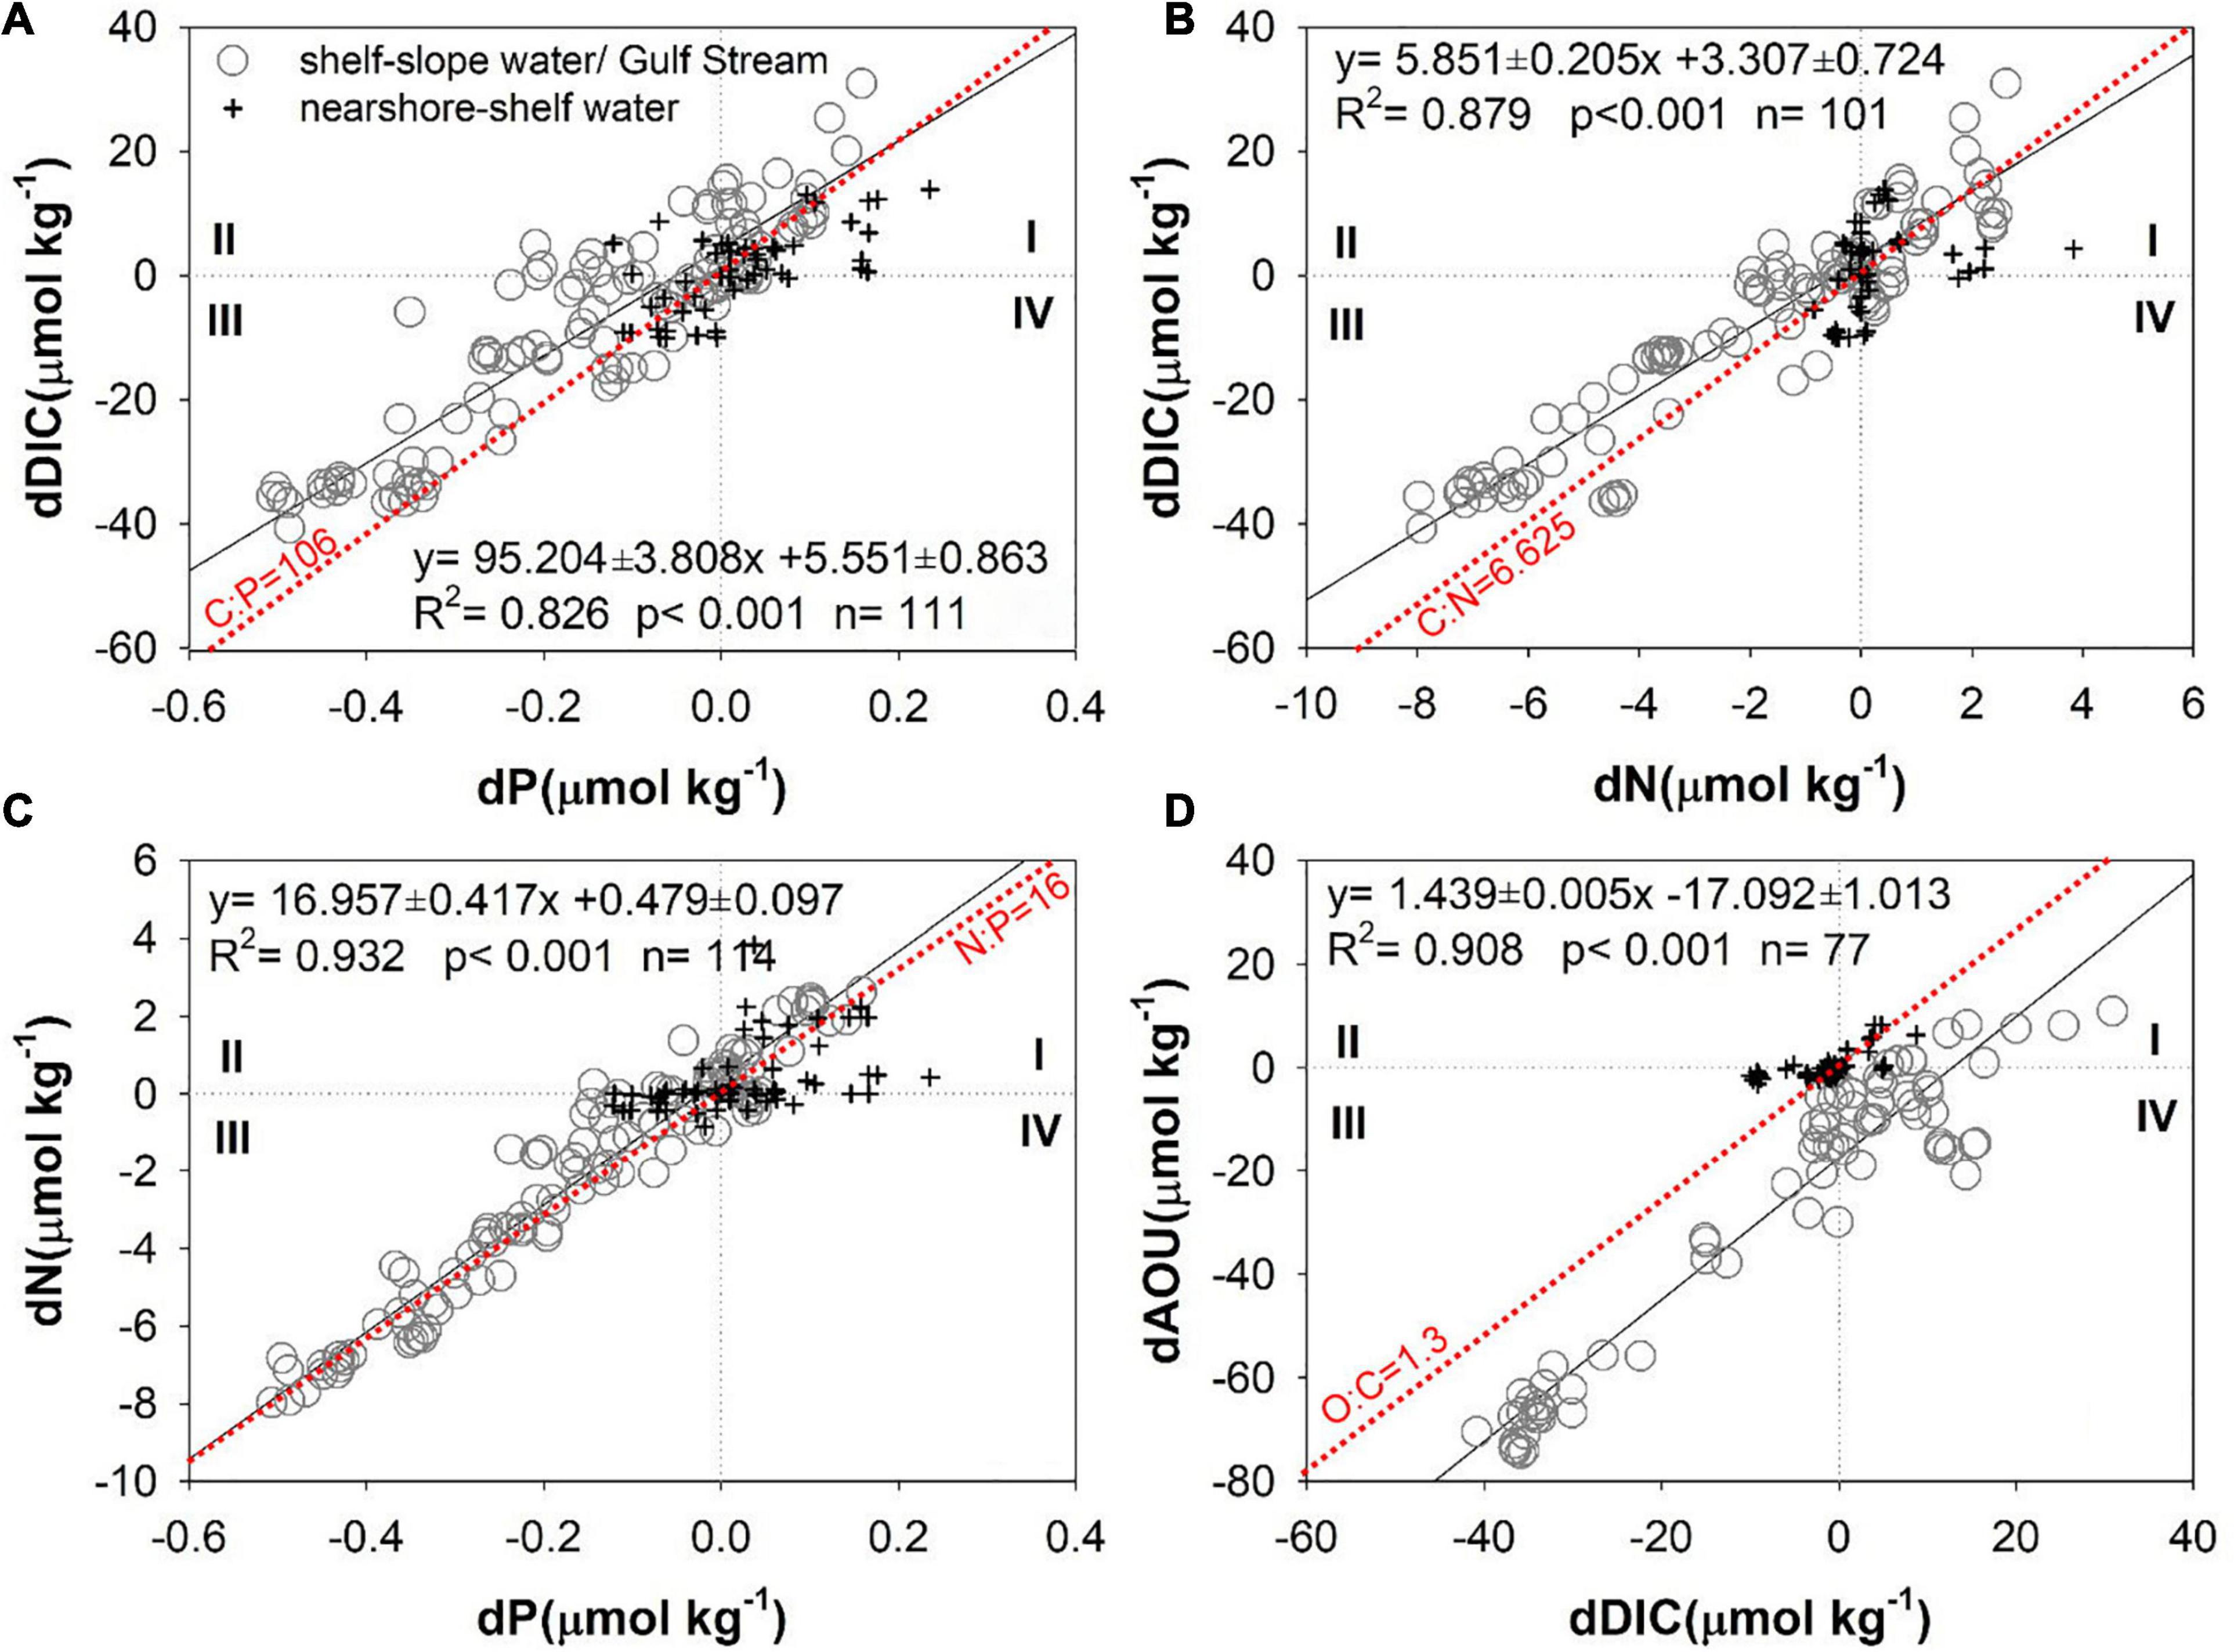
Figure 7. (A) dDIC vs. dP, (B) dDIC vs. dN, (C) dN vs. dP, and (D) dAOU vs. dDIC in the MAB. Gray circles represent samples between the shelf water and the slope water/Gulf Stream, and black crosses represent the samples between the nearshore and the shelf water. Black lines denote least squares fits calculated with a model II regression (Laws and Archie, 1981; Sokal and Rohlf, 2012), and the red dot lines are the Redfield ratios.
Most anomalies from the mid and outer shelves (gray circles in Figure 7) occur in quadrants I and III, and those on the inner shelf (black crosses in Figure 7) cluster near the origin. dDIC, dP, dN, and dAOU anomalies in the mixed shelf and slope (Gulf Stream) waters (gray circles in Figure 7) are negative in quadrant III, meaning that these concentrations are removed by biogeochemical activities. Thus, the MAB ecosystem tends to be autotrophic during late winter, a result consistent with a recent numerical model study (Friedrichs et al., 2019). In the mixed nearshore-shelf waters, most of the dissolved oxygen is oversaturated (black crosses in Figure 7D, AOU < 0 in Figure 6D), and the excess oxygen escapes to the atmosphere (dAOU ∼ 0), while the DIC is consumed by phytoplankton (dDIC < 0). While both O2 supersaturation and CO2 deficit are compensated by gas exchange in the surface or shallow waters, the impacts on the dAOU and dDIC are different. This is because air–sea exchange is more rapid for O2 than for CO2, and more importantly, the impact of the carbonate buffering system, i.e., the gas exchange-induced changes in aquatic CO2 are buffered by a much larger carbon pool of HCO3–-CO32– (Wallace and Wirick, 1992; DeGrandpre et al., 1998; Carrillo et al., 2004; Zhai et al., 2009).
The extent to which biological processes determine the anomalies of various parameters can be examined by comparing ratios of the anomalies to the Redfield ratios, as noted above. The dDIC/dP ratio of 96.8 ± 4.8 is slightly lower than the Redfield ratio of C:P = 106, likely because of the decrease of processes that compensate dDIC, such as an increase due to absorbing atmospheric CO2 (Figure 7A). The surface seawater in the MAB was a moderately strong atmospheric CO2 sink during late winter in 1996 (DeGrandpre et al., 2002; Signorini et al., 2013). The air–sea CO2 flux will tend to compensate biological DIC removal or addition; that is, to reduce dDIC in the third quadrant and to reduce oversaturated CO2 in the first quadrant (Figure 7A). Another reason for the dDIC/dP ratio being lower than the Redfield ratio is that it does not adequately account for recycled phosphate. The dDIC/dN ratio of 5.85 ± 0.21 is similar to the Redfield ratio C:N = 6.625 and to that reported by Hedges et al. (2002), C:N = 6.23 (Figure 7B), yet lower than that reported by Chen et al. (1996), C:N = 7.69. Denitrification will also diminish nitrate, and substantial denitrification may occur on the seafloor (Seitzinger and Giblin, 1996; Fennel, 2010). However, as the dN/dP ratio of 16.96 ± 0.42 is similar to the Redfield ratio of N:P = 16 (Figure 7C), we conclude that the impact of benthic denitrification on water column N is quite limited in winter, probably because of the diminished denitrification under low temperature (Brin et al., 2014) and high oxygen concentration due to a well-mixed condition during wintertime. Finally, the dAOU/dDIC ratio of 1.44 ± 0.01 is also similar to the Redfield ratio for these quantities, O:C = 1.30, as well as with those reported by Chen et al. (1996), O:C = 1.27, and Hedges et al. (2002), O:C = 1.45 (Figure 7D). Slight differences in ratios may be actual differences across sampled areas or may result from deviations in endmembers. Overall, the results capture biological effects well and support the validity of a water mass mixing approach.
Biological Control on pH and Aragonite Saturation State
As suggested in the Surface distributions of current, physical, chemical, and biological parameters section, pHin situ indicates a biological control mechanism. After removing the influence of physical mixing, strong correlations remain between positive dpHin situ and negative dAOU, dDIC, dP, and dN (Figures 8A,C,E,G), indicating that the increase in pHin situ and the decreases in AOU, DIC, and nutrient concentrations are controlled by the same biological process. The same strong correlation occurs between positive dΩArag and negative dAOU, dDIC, dP, and dN (Figures 8B,D,F,H). Biological production releases oxygen (negative AOU) and consumes DIC, hydrogen ions (increases pH), and nutrient concentrations, which are represented by anomalies in the second quadrant of Figure 8 (corresponding to quadrant III in Figure 7). In contrast, the anomalies in the fourth quadrant of Figure 8 result from organic matter decomposition (corresponding to quadrant I in Figure 7), which increases the AOU, DIC, hydrogen ions (decreases pH), and nutrient anomalies. Regression lines of dDIC, dpHin situ, dN, dP, and dΩArag all pass through the origin, indicating that these quantities are influenced by the same biological processes, and supporting the overall validity of the mixing and mass balance model and our choices of the endmember values (circles in Figures 7, 8).
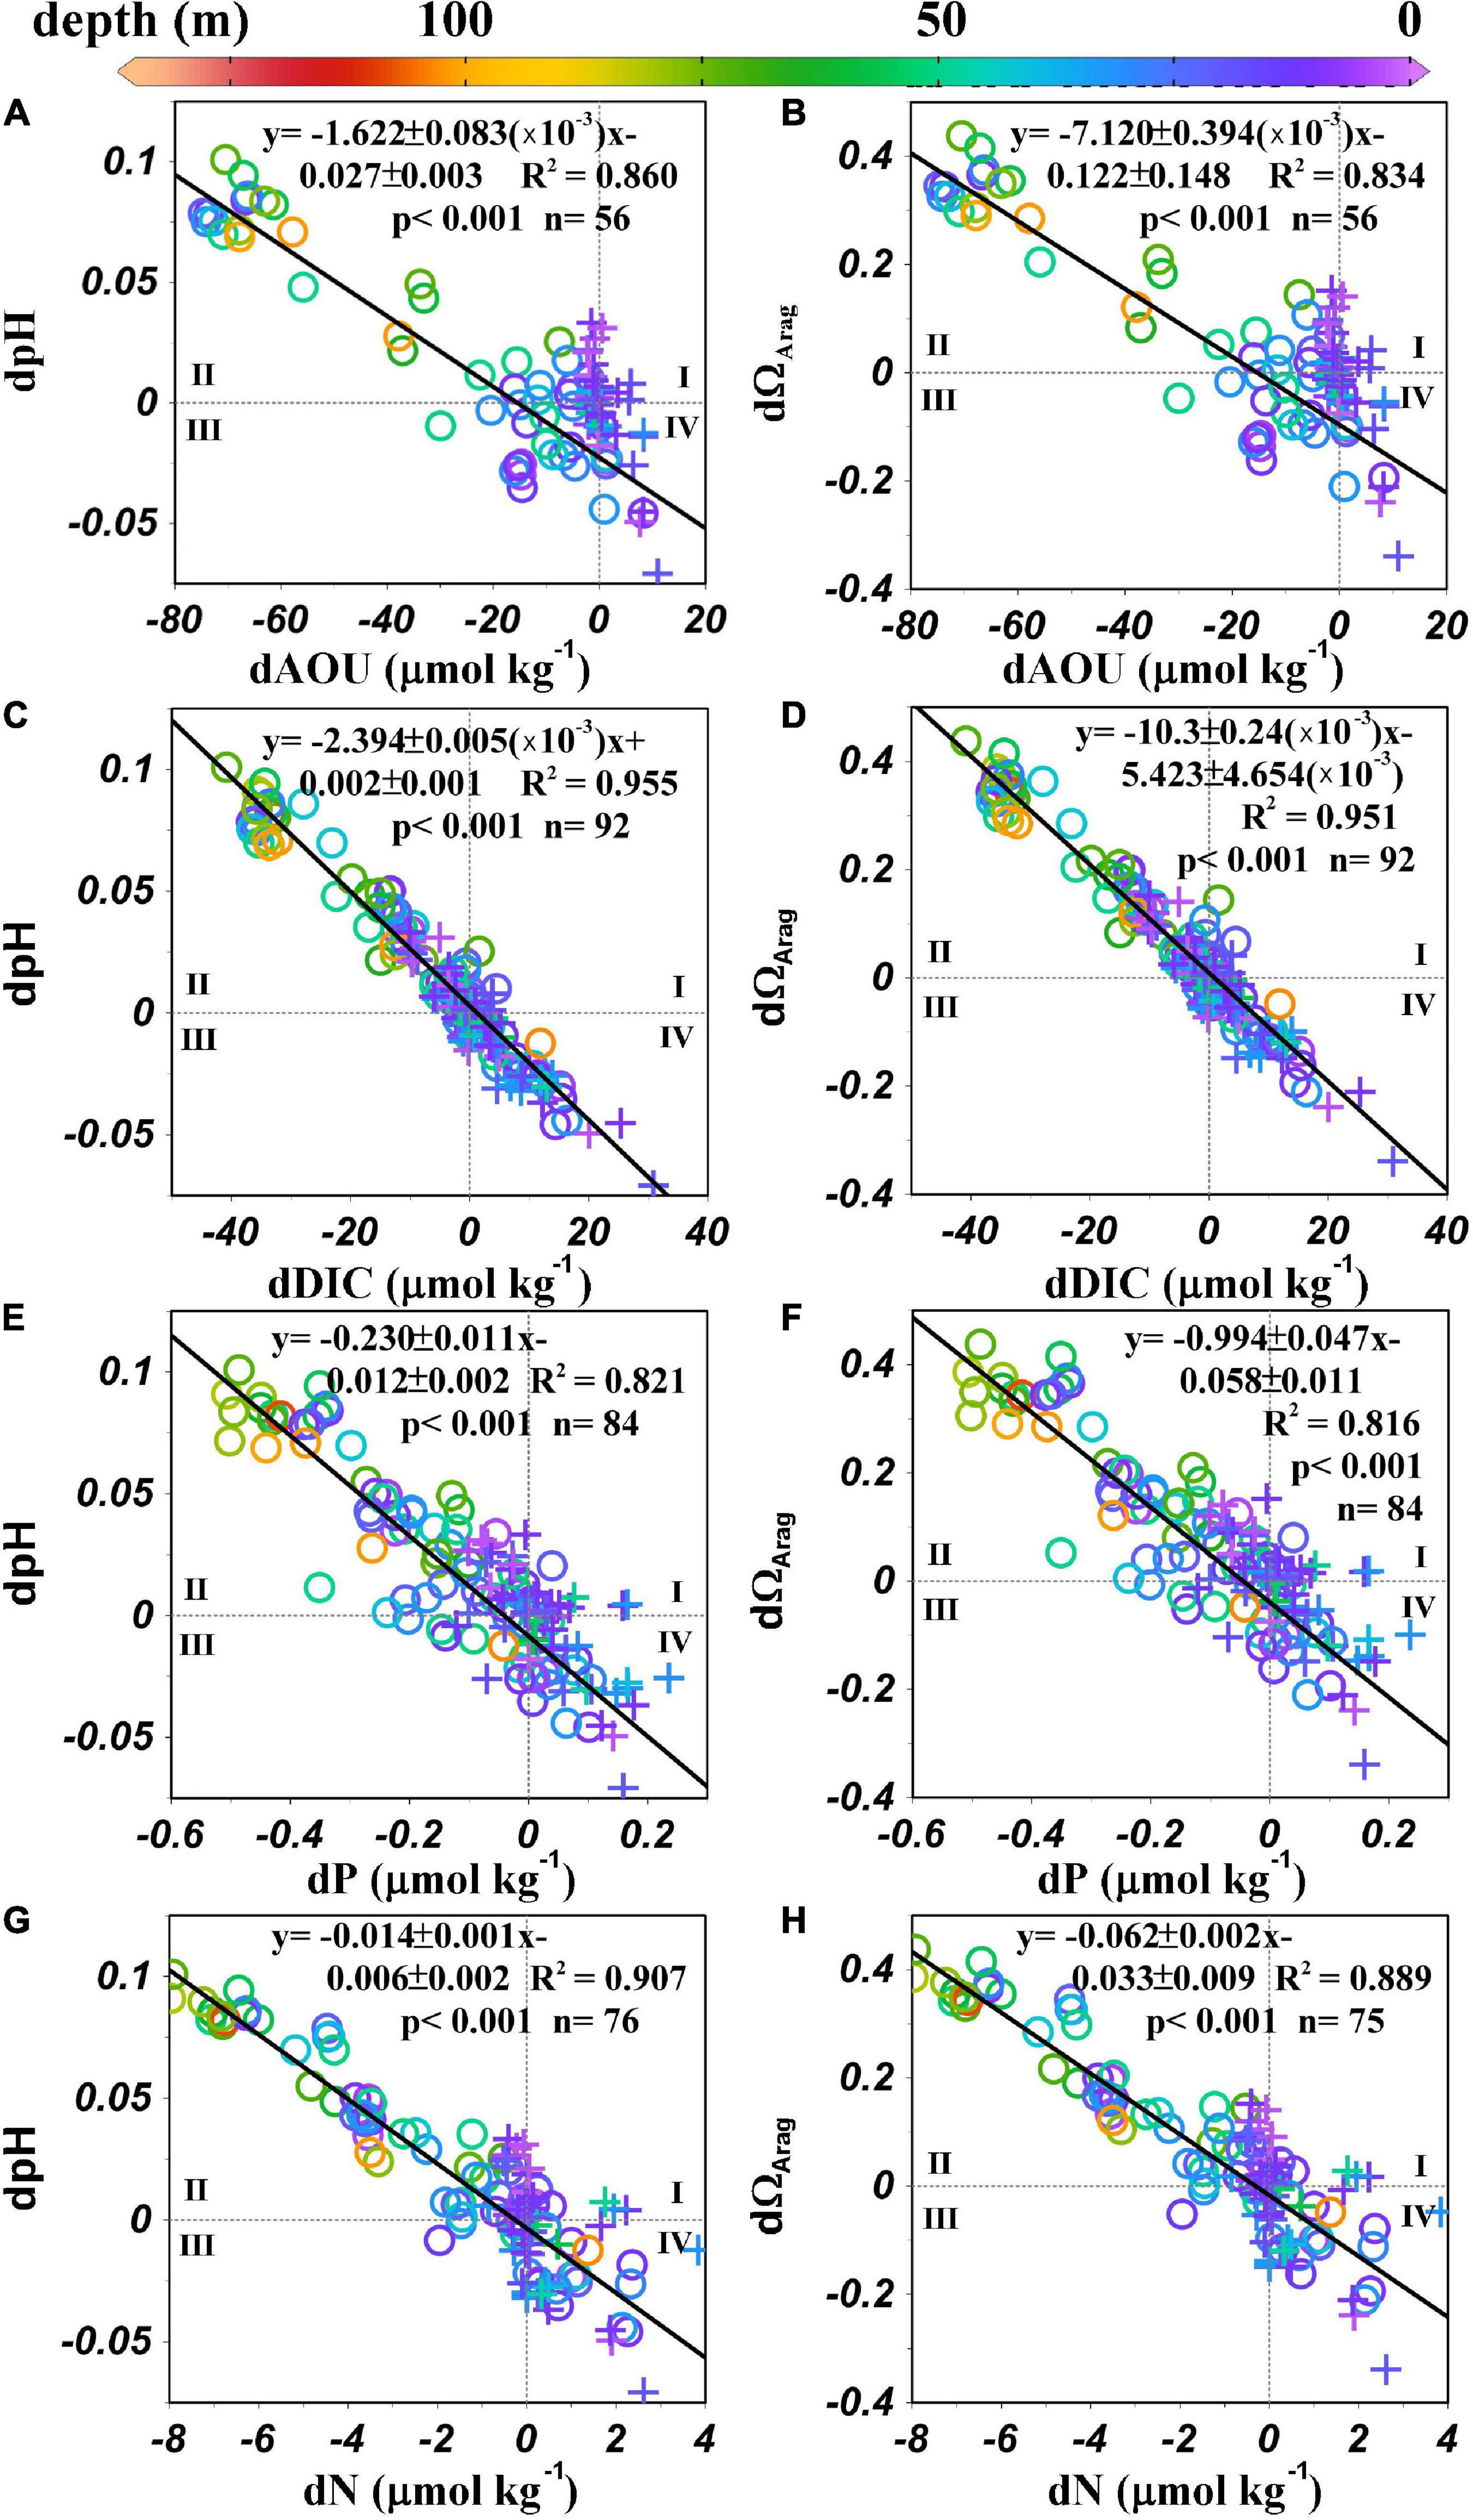
Figure 8. (A) dpHin situ vs. dAOU, (B) dΩArag vs. dAOU, (C) dpHin situ vs. dDIC, (D) dΩArag vs. dDIC, (E) dpHin situ vs. dP, (F) dΩArag vs. dP, (G) dpHin situ vs. dN, and (H) dΩArag vs. dN in the MAB. Circles represent samples collected between the shelf water and the slope water/Gulf Stream, and crosses represent samples collected between the nearshore water and the shelf water. Black lines denote least-squares fits calculated with a model II regression.
In contrast, consistently in all anomaly plots, at dDIC = 0 or dpH = 0 or dΩArag = 0, dAOU values scatter from –20 to 0 μmol kg–1 in the mixed shelf-slope waters (gray circles in Figures 7D, 8A,B). While we have no independent supporting evidence (for example, information from an inert gas such as argon), we suggest this negative shift in dAOU is caused by air bubble-induced O2 supersaturation (Craig and Hayward, 1987; Wallace and Wirick, 1992; Cassar et al., 2009; Emerson and Bushinsky, 2016). During wintertime, strong winds and deep mixed layer depth could facilitate increased O2 solubility at high hydrological pressure in the offshore water. A changing O2 gas solubility due to bubbling effect is a physical process that is not considered in our water mass mixing model and is, thus, a non-conservative term as far as the mixing is concerned, although it is non-biological either. This process would have little effect on the CO2 system as it is buffered by the HCO3– and CO32–.
Summary
Using the late wintertime dataset collected under the Ocean Margins Program in March 1996, we have characterized four main biogeochemically distinguishable water masses distributed within the MAB: the nearshore, shelf, slope, and Gulf Stream waters. Generally, the nearshore (or coastal river plume) and shelf waters occupy the inner shelf and have high Chl-a concentration and stronger biological production, whereas the slope and the Gulf Stream waters occupy the outer shelf and the slope area. Among these water masses, the nearshore water is colder and fresher, with lower AOU, DIC, nitrate, and TA concentrations than the slope water. On the cross-shelf direction, pHin situ decreases seaward reflecting a strong biological control in addition to water mass mixing, gas exchange, and temperature, but ΩArag is more variable and does not exhibit a clear trend. However, pHin situ has no clear spatial patterns on the along-shelf direction, whereas ΩArag increases from north to south, reflecting the strong influence of the CO2 solubility on carbonate saturation state.
The hydrography of the MAB is complex because of the current patterns compounded with other effects, such as tidal and cross-frontal mixing. To distinguish between physical and biological effects, we adopted a water mass mixing model, using endmembers derived from θ-S diagrams. By accounting for physical effects through the mixing model, anomalies due to biological effects could be isolated and were shown to be consistent with the Redfield ratios. Moreover, the intrusion of the slope water onto the outer shelf is found to further support biological production, even during late winter conditions providing further information to support across-front organic carbon flux for the MAB study.
Data Availability Statement
The datasets presented in this study can be found in online repositories. The names of the repository/repositories and accession number(s) can be found in the article/Supplementary Material.
Author Contributions
T-HH, W-JC, and C-TC prepared the manuscript. DW and EL conceived and conducted the original experiments. PV and EL reviewed and edited the manuscript. All authors contributed to the article and approved the submitted version.
Funding
W-JC is supported by the NOAA Ocean Acidification Program and NSF Chemical Oceanography. This publication was also supported by the NSF EPSCoR Grant No. 1757353 and the State of Delaware. This paper was initially prepared in 2015 when T-HH was a visiting scholar at the University of Delaware. T-HH was financed by the National Science Council of Taiwan (103-2917-I-110-004-) during her visit.
Conflict of Interest
The authors declare that the research was conducted in the absence of any commercial or financial relationships that could be construed as a potential conflict of interest.
Acknowledgments
We thank the Captains and crews of the vessels, and others for their contribution to the Ocean Margins Program data collection and archive.
Supplementary Material
The Supplementary Material for this article can be found online at: https://www.frontiersin.org/articles/10.3389/fmars.2021.629412/full#supplementary-material
References
Aluwihare, L. I., Repeta, D. J., and Chen, R. F. (2002). Chemical composition and cycling of dissolved organic matter in the Mid-Atlantic Bight. Deep Sea Res. II Top. Stud. Oceanogr. 49, 4421–4437. doi: 10.1016/S0967-0645(02)00124-8
Atlas, E. L., Gordon, L., Hager, S., and Park, P. K. (1971). A Practical Manual for Use of the Technicon Autoanalyzer in Seawater Nutrient Analyses in: Technical Report. Corvallis, OR: Oregon State University.
Bauer, J. E., Cai, W.-J., Raymond, P. A., Bianchi, T. S., Hopkinson, C. S., and Regnier, P. A. (2013). The changing carbon cycle of the coastal ocean. Nature 504, 61–70. doi: 10.1038/nature12857
Bauer, J. E., Druffel, E. R., Wolgast, D. M., and Griffin, S. (2002). Temporal and regional variability in sources and cycling of DOC and POC in the northwest Atlantic continental shelf and slope. Deep Sea Res. II Top. Stud. Oceanogr. 49, 4387–4419. doi: 10.1016/S0967-0645(02)00123-6
Beardsley, R., Boicourt, W., and Hansen, D. (1976). “Physical oceanography of the Middle Atlantic Bight,” in Middle Atlantic Continental Shelf and the New York Bight, ed. M. G. Gross (Lawrence, KS: American Society of Limnology and Oceanography), 20–34.
Bisagni, J. (2003). Seasonal variability of nitrate supply and potential new production in the Gulf of Maine and Georges Bank regions. J. Geophys. Res. Oceans 108:8015. doi: 10.1029/2001JC001136
Biscaye, P. E., Flagg, C. N., and Falkowski, P. G. (1994). The shelf edge exchange processes experiment, SEEP-II: an introduction to hypotheses, results and conclusions. Deep Sea Res. II Top. Stud. Oceanogr. 41, 231–252. doi: 10.1016/0967-0645(94)90022-1
Boynton, W., Garber, J., Summers, R., and Kemp, W. (1995). Inputs, transformations, and transport of nitrogen and phosphorus in Chesapeake Bay and selected tributaries. Estuaries Coasts 18, 285–314. doi: 10.2307/1352640
Brin, L. D., Giblin, A. E., and Rich, J. J. (2014). Environmental controls of anammox and denitrification in southern New England estuarine and shelf sediments. Limnol. Oceanogr. 59, 851–860.
Cai, W.-J. (2011). Estuarine and coastal ocean carbon paradox: CO2 sinks or sites of terrestrial carbon incineration? Annu. Rev. Mar. Sci. 3, 123–145. doi: 10.1146/annurev-marine-120709-142723
Cai, W. J., Hu, X., Huang, W. J., Jiang, L. Q., Wang, Y., Peng, T. H., et al. (2010). Alkalinity distribution in the western North Atlantic Ocean margins. J. Geophys. Res. Oceans 115:C08014. doi: 10.1029/2009JC005482
Cai, W.-J., Huang, W.-J., Luther, G. W., Pierrot, D., Li, M., Testa, J., et al. (2017). Redox reactions and weak buffering capacity lead to acidification in the Chesapeake Bay. Nat. Commun. 8:369. doi: 10.1038/s41467-017-00417-7
Cai, W.-J., Xu, Y.-Y., Feely, R. A., Wanninkhof, R., Jönsson, B., Alin, S. R., et al. (2020). Controls on surface water carbonate chemistry along North American ocean margins. Nat. Commun. 11:2691.
Carrillo, C. J., Smith, R. C., and Karl, D. M. (2004). Processes regulating oxygen and carbon dioxide in surface waters west of the Antarctic Peninsula. Mar. Chem. 84, 161–179. doi: 10.1016/j.marchem.2003.07.004
Cassar, N., Barnett, B., Bender, M., Kaiser, J., Hamme, R., and Tilbrook, B. (2009). Continuous high-frequency dissolved O2/Ar measurements by equilibrator inlet mass spectrometry. Anal. Chem. 81, 1855–1864. doi: 10.1021/ac802300u
Chapman, D. C., and Beardsley, R. C. (1989). On the origin of shelf water in the Middle Atlantic Bight. J. Phys. Oceanogr. 19, 384–391. doi: 10.1175/1520-04851989019<0384:OTOOSW<2.0.CO;2
Chavez, F. P., Messié, M., and Pennington, J. T. (2011). Marine primary production in relation to climate variability and change. Annu. Rev. Mar. Sci. 3, 227–260. doi: 10.1146/annurev.marine.010908.163917
Chen, B., Cai, W. J., Brodeur, J. R., Hussain, N., Testa, J. M., Ni, W., et al. (2020). Seasonal and spatial variability in surface pCO2 and air–water CO2 flux in the Chesapeake Bay. Limnol. Oceanogr. 65, 3046–3065. doi: 10.1002/lno.11573
Chen, C.-T. A., Huang, T.-H., Chen, Y.-C., Bai, Y., He, X., and Kang, Y. (2013). Air–sea exchanges of CO2 in the world’s coastal seas. Biogeosciences 10, 6509–6544. doi: 10.5194/bg-10-6509-2013
Chen, C.-T. A., Lin, C.-M., Huang, B.-T., and Chang, L.-F. (1996). Stoichiometry of carbon, hydrogen, nitrogen, sulfur and oxygen in the particulate matter of the western North Pacific marginal seas. Mar. Chem. 54, 179–190. doi: 10.1016/0304-4203(96)00021-7
Craig, H., and Hayward, T. (1987). Oxygen supersaturation in the ocean: Biological versus physical contributions. Science 235, 199–202. doi: 10.1126/science.235.4785.199
Csanady, G., and Hamilton, P. (1988). Circulation of slopewater. Cont. Shelf Res. 8, 565–624. doi: 10.1016/0278-4343(88)90068-4
DeGrandpre, M., Hammar, T., and Wirick, C. (1998). Short-term pCO2 and O2 dynamics in California coastal waters. Deep Sea Res. II Top. Stud. Oceanogr. 45, 1557–1575. doi: 10.1016/S0967-0645(98)80006-4
DeGrandpre, M., Olbu, G., Beatty, C., and Hammar, T. (2002). Air–sea CO2 fluxes on the US Middle Atlantic Bight. Deep Sea Res. II Top. Stud. Oceanogr. 49, 4355–4367. doi: 10.1016/S0967-0645(02)00122-4
DOE (1994). Handbook of Methods for the Analysis of the Various Parameters of the Carbon Dioxide System in Sea Water. San Diego, CA: ORNL/CDIAC-74.
Dong, S., and Kelly, K. A. (2003). Seasonal and interannual variations in geostrophic velocity in the Middle Atlantic Bight. J. Geophys. Res. Oceans 108:3172. doi: 10.1029/2002JC001357
Emerson, S., and Bushinsky, S. (2016). The role of bubbles during air-sea gas exchange. J. Geophys. Res. Oceans 121, 4360–4376. doi: 10.1002/2016JC011744
Fennel, K. (2010). The role of continental shelves in nitrogen and carbon cycling: Northwestern North Atlantic case study. Ocean Sci. 6:539. doi: 10.5194/os-6-539-2010
Fennel, K., Wilkin, J., Levin, J., Moisan, J., O’Reilly, J., and Haidvogel, D. (2006). Nitrogen cycling in the Middle Atlantic Bight: results from a three-dimensional model and implications for the North Atlantic nitrogen budget. Glob. Biogeochem. Cycles 20:GB3007. doi: 10.1029/2005GB002456
Fisher, T. R., Harding, L. W., Stanley, D. W., and Ward, L. G. (1988). Phytoplankton, nutrients, and turbidity in the Chesapeake, Delaware, and Hudson estuaries. Estuarine Coast. Shelf Sci. 27, 61–93. doi: 10.1016/0272-7714(88)90032-7
Flagg, C. N., Pietrafesa, L. J., and Weatherly, G. L. (2002). Springtime hydrography of the southern Middle Atlantic Bight and the onset of seasonal stratification. Deep Sea Res. II Top. Stud. Oceanogr. 49, 4297–4329. doi: 10.1016/S0967-0645(02)00121-2
Friedrichs, M. A., St-Laurent, P., Xiao, Y., Hofmann, E., Hyde, K., Mannino, A., et al. (2019). Ocean circulation causes strong variability in the Mid-Atlantic Bight nitrogen budget. J. Geophys. Res. Oceans 124, 113–134. doi: 10.1029/2018JC014424
Garcia, H. E., and Gordon, L. I. (1992). Oxygen solubility in seawater: better fitting equations. Limnol. Oceanogr. 37, 1307–1312. doi: 10.4319/lo.1992.37.6.1307
Gawarkiewicz, G., Bahr, F., Beardsley, R. C., and Brink, K. H. (2001). Interaction of a slope eddy with the shelfbreak front in the Middle Atlantic Bight. J. Phys. Oceanogr. 31, 2783–2796. doi: 10.1175/1520-04852001031<2783:IOASEW<2.0.CO;2
Gawarkiewicz, G., Church, T. M., Luther, G. W., Ferdelman, T. G., and Caruso, M. (1992). Large-scale penetration of Gulf Stream water onto the Continental Shelf north of Cape Hatteras. Geophys. Res. Lett. 19, 373–376. doi: 10.1029/92GL00225
Goodarzi, E., Ziaei, M., and Hosseinipour, E. Z. (2014). “Linear optimization,” in Introduction to Optimization Analysis in Hydrosystem Engineering, eds E. Goodarzi, M. Ziaei, and E. Z. Hosseinipour (Cham: Springer International Publishing), 17–53.
Hager, S. W., Atlas, E. L., Gordon, L. I., Mantyla, A. W., and Park, P. K. (1972). A comparison at sea of manual and autoanalyzer analyses of phosphate, nitrate, and silicate. Limnol. Oceanogr. 17, 931–937. doi: 10.4319/lo.1972.17.6.0931
Hedges, J., Baldock, J., Gélinas, Y., Lee, C., Peterson, M., and Wakeham, S. (2002). The biochemical and elemental compositions of marine plankton: a NMR perspective. Mar. Chem. 78, 47–63. doi: 10.1016/S0304-4203(02)00009-9
Helland-Hansen, B. (1916). Nogen hydrografiske metoder, Forhandlinger ved de Skandinaviske Naturforskeres Möde. 16, 357–359.
Hopkinson, C. S., Vallino, J. J., and Nolin, A. (2002). Decomposition of dissolved organic matter from the continental margin. Deep Sea Res. II Top. Stud. Oceanogr. 49, 4461–4478. doi: 10.1016/S0967-0645(02)00125-X
Jahnke, R., and Verity, P. (1994). in Ocean Margins Program, ed. U. S. D. O. Energy (Oak Ridge, TN: DOE Office of Scientific and Technical Information).
Jahnke, R. A. (2010). “Global synthesis,” in Carbon and Nutrient Fluxes in Continental Margins, eds K.-K. Liu, L. Atkinson, R. Quinones, and L. Talaue-McManus (Berlin: Springer-Verlag), 597–615.
Jiang, L. Q., Feely, R. A., Carter, B. R., Greeley, D. J., Gledhill, D. K., and Arzayus, K. M. (2015). Climatological distribution of aragonite saturation state in the global oceans. Glob. Biogeochem. Cycles 29, 1656–1673. doi: 10.1002/2015GB005198
Joesoef, A., Huang, W.-J., Gao, Y., and Cai, W.-J. (2015). Air–water fluxes and sources of carbon dioxide in the Delaware Estuary: spatial and seasonal variability. Biogeosciences 12, 6085–6101. doi: 10.5194/bg-12-6085-2015
Johnson, K. (1992). Single-Operator Multiparameter Metabolic Analyzer (SOMMA) For Total Carbon Dioxide (CT) with Coulometric Detection. Operator‘s Manual. Upton, NY: Brookhaven National Lab.
Johnson, K., Wills, K. D., Butler, D. B., Johnson, W. K., and Wong, C. S. (1993). Coulometric total carbon dioxide analysis for marine studies: maximizing the performance of an automated gas extraction system and coulometric detector. Mar. Chem. 44, 167–187.
Kemp, W., Smith, E., Marvin-DiPasquale, M., and Boynton, W. (1997). Organic carbon balance and net ecosystem metabolism in Chesapeake Bay. Mar. Ecol. Progr. Ser. 150, 229–248. doi: 10.3354/meps150229
Knap, A., Michaels, A., Close, A., Ducklow, H., and Dickson, A. (1996). Protocols for the Joint Global Ocean Flux Study (JGOFS) Core Measurements, JGOFS, Reprint of the IOC Manuals and Guides No. 29. Paris: Intergovernmental Oceanographic Commission.
Laws, E., and Archie, J. (1981). Appropriate use of regression analysis in marine biology. Mar. Biol. 65, 13–16.
Lentz, S. J. (2008). Observations and a model of the mean circulation over the Middle Atlantic Bight continental shelf. J. Phys. Oceanogr. 38, 1203–1221. doi: 10.1175/2007JPO3768.1
Lewis, E., and Wallace, D. W. R. (1998). Program Developed for CO2 System Calculations. Oak Ridge, TN: Oak Ridge National Laboratory.
Linder, C. A., and Gawarkiewicz, G. (1998). A climatology of the shelfbreak front in the Middle Atlantic Bight. J. Geophys. Res. Oceans 103, 18405–18423. doi: 10.1029/98JC01438
Liu, K., Iseki, K., and Chao, S. (2000). “Continentalf margin carbon fluxes,” in The Changing Ocean Carbon Cycle: a Midterm Synthesis of the Joint Global Ocean Flux Study, eds R. B. Hanson, H. W. Ducklow, and J. G. Field (Cambridge, MA: Cambridge University Press), 187–239.
Liu, K.-K., Atkinson, L., Quiñones, R. A., and Talaue-McManus, L. (2010). “Biogeochemistry of continental margins in a global context,” in Carbon and Nutrient Fluxes in Continental Margins, eds K.-K. Liu, L. Atkinson, R. Quinones, and L. Talaue-McManus (Berlin: Springer), 3–24.
Lueker, T. J., Dickson, A. G., and Keeling, C. D. (2000). Ocean pCO2 calculated from dissolved inorganic carbon, alkalinity, and equations for K1 and K2: validation based on laboratory measurements of CO2 in gas and seawater at equilibrium. Mar. Chem. 70, 105–119. doi: 10.1016/S0304-4203(00)00022-0
Mackenzie, F., Andersson, A., Lerman, A., and Ver, L. M. (2005). “Boundary exchanges in the global coastal margin: implications for the organic and inorganic carbon cycles,” in The Global Coastal Ocean: Multiscale Interdisciplinary Processes, eds A. R. Robinson and K. Brink (Cambridge, MA: Harvard University press), 193–225.
Makinen, C. P., and Moisan, T. A. (2012). Phytoplankton assemblage patterns in the southern Mid-Atlantic Bight. Bot. Mar. 55, 445–457. doi: 10.1515/bot-2012-0110
Marchese, P. J., and Gordon, A. L. (1996). The eastern boundary of the Gulf Stream recirculation. J. Mar. Res. 54, 521–540. doi: 10.1357/0022240963213510
Millero, F. J. (1995). Thermodynamics of the carbon dioxide system in the oceans. Geochim. Cosmochim. Acta 59, 661–677. doi: 10.1016/0016-7037(94)00354-O
Millero, F. J., Graham, T. B., Huang, F., Bustos-Serrano, H., and Pierrot, D. (2006). Dissociation constants of carbonic acid in seawater as a function of salinity and temperature. Mar. Chem. 100, 80–94. doi: 10.1016/j.marchem.2005.12.001
Mountain, D. G. (1991). The volume of shelf water in the Middle Atlantic Bight: seasonal and interannual variability, 1977–1987. Cont. Shelf Res. 11, 251–267.
Mountain, D. G. (2003). Variability in the properties of Shelf Water in the Middle Atlantic Bight, 1977–1999. J. Geophys. Res. Oceans 108:3014.
Mucci, A. (1983). The solubility of calcite and aragonite in seawater at various salinities, temperatures, and one atmosphere total pressure. Am. J. Sci. 283, 780–799. doi: 10.2475/ajs.283.7.780
Muller-Karger, F. E., Varela, R., Thunell, R., Luerssen, R., Hu, C., and Walsh, J. J. (2005). The importance of continental margins in the global carbon cycle. Geophys. Res. Lett. 32:L01602. doi: 10.1029/2004GL021346
Paytan, A., and McLaughlin, K. (2007). The oceanic phosphorus cycle. Chem. Rev. 107, 563–576. doi: 10.1021/cr0503613
Pierrot, D., Lewis, E., and Wallace, D. (2006). MS Excel Program Developed for CO2 System Calculations. Oak Ridge, TN: Carbon Dioxide Information Analysis Center.
Prasad, M. B. K., Sapiano, M. R., Anderson, C. R., Long, W., and Murtugudde, R. (2010). Long-term variability of nutrients and chlorophyll in the Chesapeake Bay: a retrospective analysis, 1985–2008. Estuaries Coasts 33, 1128–1143. doi: 10.1007/s12237-010-9325-y
Redfield, A. C. (1958). The biological control of chemical factors in the environment. Am. Sci. 46, 205–221.
Rossby, T., and Benway, R. (2000). Slow variations in mean path of the Gulf Stream east of Cape Hatteras. Geophys. Res. Lett. 27, 117–120. doi: 10.1029/1999GL002356
Saba, V. S., Hyde, K. J., Rebuck, N. D., Friedland, K. D., Hare, J. A., Kahru, M., et al. (2015). Physical associations to spring phytoplankton biomass interannual variability in the US Northeast Continental Shelf. J. Geophys. Res. Biogeosci. 120, 205–220.
Seitzinger, S. P., and Giblin, A. E. (1996). Estimating denitrification in North Atlantic continental shelf sediments. Biogeochemistry 35, 235–260. doi: 10.1007/BF02179829
Sharp, J. H., Yoshiyama, K., Parker, A. E., Schwartz, M. C., Curless, S. E., Beauregard, A. Y., et al. (2009). A biogeochemical view of estuarine eutrophication: seasonal and spatial trends and correlations in the Delaware Estuary. Estuaries Coasts 32, 1023–1043. doi: 10.1007/s12237-009-9210-8
Signorini, S. R., Mannino, A., Najjar, R. G., Friedrichs, M. A. M., Cai, W.-J., Salisbury, J., et al. (2013). Surface ocean pCO2 seasonality and sea-air CO2 flux estimates for the North American east coast. J. Geophys. Res. Oceans 118, 5439–5460. doi: 10.1002/jgrc.20369
Sokal, R. R., and Rohlf, F. J. (2012). Biometry: the Principles and Practice of Statistics in Biological Research. New York, NY: W.H. Freeman and Company.
Takahashi, T., Sutherland, S. C., Chipman, D. W., Goddard, J. G., Ho, C., Newberger, T., et al. (2014). Climatological distributions of pH, pCO2, total CO2, alkalinity, and CaCO3 saturation in the global surface Ocean, and temporal changes at selected locations. Marine Chemistry 164, 95–125. doi: 10.1016/j.marchem.2014.06.004
Tomczak, M. (1981). A multi-parameter extension of temperature/salinity diagram techniques for the analysis of non-isopycnal mixing. Progr. Oceanogr. 10, 147–171. doi: 10.1016/0079-6611(81)90010-0
Townsend, D. W., Rebuck, N. D., Thomas, M. A., Karp-Boss, L., and Gettings, R. M. (2010). A changing nutrient regime in the Gulf of Maine. Cont. Shelf Res. 30, 820–832. doi: 10.1016/j.csr.2010.01.019
Townsend, D. W., and Thomas, A. C. (2001). Winter–spring transition of phytoplankton chlorophyll and inorganic nutrients on Georges Bank. Deep Sea Res. II Top. Stud. Oceanogr. 48, 199–214. doi: 10.1016/S0967-0645(00)00119-3
Townsend, D. W., Thomas, A. C., Mayer, L. M., Thomas, M. A., and Quinlan, J. A. (2006). “Oceanography of the northwest Atlantic continental shelf,” in The Global Coastal Ocean: Interdisciplinary Regional Studies and Syntheses, eds A. R. Robinson and K. Brink (Cambridge, MA: Harvard University Press), 119–168.
Townsend, D. W., and Thomas, M. (2002). Springtime nutrient and phytoplankton dynamics on Georges Bank. Mar. Ecol. Progr. Ser. 228, 57–74. doi: 10.3354/meps228057
Ullman, D. S., and Cornillon, P. C. (2001). Continental shelf surface thermal fronts in winter off the northeast US coast. Cont. Shelf Res. 21, 1139–1156.
Vlahos, P., Chen, R. F., and Repeta, D. J. (2002). Dissolved organic carbon in the Mid-Atlantic Bight. Deep Sea Res. II Top. Stud. Oceanogr. 49, 4369–4385. doi: 10.1016/S0967-0645(02)00167-4
Wallace, D., and Wirick, C. (1992). Large air–sea gas fluxes associated with breaking waves. Nature 356:694. doi: 10.1038/356694a0
Wang, Z. A., Wanninkhof, R., Cai, W.-J., Byrne, R. H., Hu, X., Peng, T.-H., et al. (2013). The marine inorganic carbon system along the Gulf of Mexico and Atlantic coasts of the United States: insights from a transregional coastal carbon study. Limnol. Oceanogr. 58, 325–342. doi: 10.4319/lo.2013.58.1.0325
Wanninkhof, R., Barbero, L., Byrne, R., Cai, W.-J., Huang, W.-J., Zhang, J.-Z., et al. (2015). Ocean acidification along the Gulf Coast and East Coast of the USA. Cont. Shelf Res. 98, 54–71. doi: 10.1016/j.csr.2015.02.008
Wilson, C., Behrens, W. J., Flagg, C. N., Wallace, D. W. R., Wilke, R. J., and Wyman, K. D. (1989). Shelf Edge Exchange Processes, II: SEEP2-08, R/V ENDEAVOR Cruise 188. Hydrographic Data Report. Upton, NY: Brookhaven National Laboratory.
Xu, Y. Y., Cai, W. J., Gao, Y., Wanninkhof, R., Salisbury, J., Chen, B., et al. (2017). Short-term variability of aragonite saturation state in the central Mid-Atlantic Bight. J. Geophys. Res. Oceans 122, 4274–4290. doi: 10.1002/2017JC012901
Xu, Y. Y., Cai, W. J., Wanninkhof, R., Salisbury, J., Reimer, J., and Chen, B. (2020). Long-term changes of carbonate chemistry variables along the North American East Coast. J. Geophys. Res. Oceans 125:e2019JC015982.
Keywords: Mid-Atlantic Bight, inorganic carbon system, water mass mixing, carbonate saturation, nutrient supply
Citation: Huang T-H, Cai W-J, Vlahos P, Wallace DWR, Lewis ER and Chen C-TA (2021) The Mid-Atlantic Bight Dissolved Inorganic Carbon System Observed in the March 1996 DOE Ocean Margins Program (OMP)—A Baseline Study. Front. Mar. Sci. 8:629412. doi: 10.3389/fmars.2021.629412
Received: 14 November 2020; Accepted: 24 May 2021;
Published: 29 June 2021.
Edited by:
Xianghui Guo, Xiamen University, ChinaReviewed by:
Antón Velo, Instituto de Investigaciones Marinas (CSIC), SpainChris Langdon, University of Miami, United States
Copyright © 2021 Huang, Cai, Vlahos, Wallace, Lewis and Chen. This is an open-access article distributed under the terms of the Creative Commons Attribution License (CC BY). The use, distribution or reproduction in other forums is permitted, provided the original author(s) and the copyright owner(s) are credited and that the original publication in this journal is cited, in accordance with accepted academic practice. No use, distribution or reproduction is permitted which does not comply with these terms.
*Correspondence: Wei-Jun Cai, d2NhaUB1ZGVsLmVkdQ==