 Linlin Cui
 Courtney K. Harris
 Danielle R. N. Tarpley1,2
- 1Virginia Institute of Marine Science, William & Mary, Gloucester Point, VA, United States
- 2Coastal and Hydraulics Laboratory, United States Army Corps of Engineers, Vicksburg, MS, United States
When oil spills occur in turbid waters, the oil droplets and mineral grains can combine to form oil-particle aggregates (OPAs). The formation of OPAs impacts the vertical transport of both the oil and the mineral grains; especially increasing deposition of oil to the seabed. Though the coastal oceans can be very turbid, to date, few numerical ocean models have accounted for aggregation processes that form OPAs. However, interactions between oil and mineral aggregates may be represented using techniques developed to account for sediment aggregation. As part of Consortium for Simulation of Oil Microbial Interactions in the Ocean (CSOMIO), we modified an existing, population dynamics-based sediment flocculation model to develop OPAMOD, a module that accounts for the formation of OPAs. A zero-dimensional model using OPAMOD is shown to be capable of reproducing the size distribution of aggregates from existing laboratory experimental results. Also using the zero-dimensional model, sensitivity tests were performed on two model parameters, the fractal dimension and collision efficiency. Results showed that fractal dimension played a role in the OPA size distribution by influencing the effective particle density, which modified the number concentration of flocs for a given mass concentration. However, the modeled particle characteristics and oil sequestration were relatively insensitive to collision efficiency. To explore OPA formation for an outer continental shelf site, two simulations were conducted using a one-dimensional (vertical) implementation of the model. One scenario had high sediment concentration near the seabed to mimic storm-induced resuspension. The other scenario represented river plume sediment delivery by having high sediment concentration in surface waters. Results showed that OPA formation was sensitive to the vertical distribution of suspended sediment, with the river plume scenario creating more OPA, and sequestering more oil within OPA than the storm resuspension scenario. OPAMOD was developed within the Coupled Ocean-Atmosphere-Wave-and-Sediment Transport (COAWST) modeling system, therefore the methods and parameterizations from this study are transferrable to a three-dimensional coupled oil-sediment-microbial model developed by CSOMIO within the COAWST framework.
Introduction
Oil spills have detrimental impacts on coastal ecosystems and marine life (Nixon et al., 2016; Bam et al., 2018; Robinson and Rabalais, 2019; Martin et al., 2020). As a result, oil models have been developed to predict the transport and fate of oil, often by employing Lagrangian particle tracking (Zhu et al., 2018). However, predicting the fate of oil is difficult as it is influenced by a variety of processes, such as spreading, evaporation, and degradation for surface slicks; and emulsification, degradation, and dissolution for oil droplets in the subsurface. In addition, aggregation of oil and suspended particulate material has been considered an important process to remove free oil (Lee, 2002; Payne et al., 2003). It was reported that significant oil sedimentation can occur when suspended particulate concentrations reach 0.01 kg m–3, and large deposition events were associated with sediment concentrations of at least 0.1 kg m–3 (Boehm, 1987). The Mississippi River mouth delivers significant quantities of both freshwater and sediment into the northern Gulf of Mexico. Suspended sediment concentrations vary seasonally. The Mississippi River discharge peak occurs during the spring, when it is about twice as high as the low flow in the fall (Thorne et al., 2008). A previous study showed that the formation of OPAs in the Mississippi River varied depending on the time of year with a higher probability during winter and spring when suspended sediment concentrations were high, ∼0.35 kg m–3 (Danchuk and Willson, 2011). With an aggregation kinetic model, Sterling et al. (2004) found that the timescale for aggregation of oils and clays was within an order of magnitude for the timescale of clay settling, thus, aggregation provided a mechanism for oil sedimentation. Nevertheless, numerical models for oil-sediment interactions are limited, especially in three-dimensional oil models for the coastal ocean.
When oil interacts with organic matter, such as bacteria, phytoplankton, or detritus; they can form a type of aggregate called Marine Oil Snow (MOS). Marine Oil Snow Sedimentation and Flocculent Accumulation (MOSSFA) is a significant pathway for the fate of oil. Studies showed that ∼4–31% of the Deepwater Horizon oil settled on the seafloor via MOSSFA (Valentine et al., 2014). These aggregates are more common in areas where primary productivity is high and suspended sediment concentrations are relatively low (<0.01 kg m–3), such as the open ocean (Daly et al., 2016). Compared to OPA, the MOS tend to reach larger diameters (Stoffyn-Egli and Lee, 2002). Simulation of MOS has obtained substantial interest since the Deepwater Horizon oil spill. For example, Dissanayake et al. (2018) developed a one-dimensional model to simulate MOS formation and settling in the ocean. This provided valuable insight into the vertical processes that govern MOSSFA formation and transport, but to date these processes have not been included in a three-dimensional model capable of estimating dispersal.
Different terminologies have been used to describe aggregates that incorporate oil along with sediment, such as oil-mineral aggregate (OMA) (Lee and Stoffyn-Egli, 2001; Ye et al., 2020), oil-sediment aggregate (OSA) (Bandara et al., 2011), and oil-particle aggregate (OPA) (Fitzpatrick et al., 2015; Zhao et al., 2016). We use the term OPA in this study, because this has been preferred to describe microscopic aggregates. In terms of structure, three types of OPAs were identified from microscopy imageries: droplet OPAs, solid OPAs, and flake OPAs (Stoffyn-Egli and Lee, 2002). Droplet OPAs are single or multiple oil droplets coated by sediment particles; solid OPAs are a mixture of oil and sediment particles where clear oil droplets cannot be seen; flaked OPAs have a membrane-like shape, are fragile and break apart in high shear conditions, thus they are rarely observed in nature (Stoffyn-Egli and Lee, 2002). When oil is delivered to areas of high turbidity, such as surf zones and river plumes, OPAs provide a means of delivering oil to the seafloor (Daly et al., 2016). In general, OPAs observed in situ are small (<50 micron–1 mm) (Stoffyn-Egli and Lee, 2002). Sediment mineralogy can affect the formation and shape of OPAs. A recent laboratory study investigated the formation of OPAs with crude oil and two types of cohesive minerals: kaolinite and bentonite clay (Ye et al., 2020). They showed that bentonite clay had a higher stickiness than kaolinite, and tended to produce solid, higher-settling velocity OPAs. Based on these results, along with the fact that bentonite is more like the clay observed near Mississippi River Delta than kaolinite (Jaisi et al., 2008), solid OPAs formed from oil and bentonite clay were considered in this study.
Numerical flocculation models that represent particle aggregation and breakup have a long history within sediment-transport (Lick et al., 1992; Winterwerp, 1998), and can provide a method to represent OPA formation. There are two main approaches to representing particle sizes in these sediment flocculation models. The first type are distribution-based models, in which floc size distribution is fixed but the modeled sizes change in response to turbulence, concentration, etc. (Khelifa and Hill, 2006; Winterwerp et al., 2006). The other method uses size-class-based models that calculate the particle population by distributing mass among a discrete number of fixed size classes (Verney et al., 2011). Unlike distribution-based models, size-class-based models can provide detailed information about floc populations. Recently, a size-class-based flocculation model (FLOCMOD) (Verney et al., 2011) has been implemented within the COAWST (Coupled-Ocean-Atmosphere-Wave-Sediment Transport) model (Sherwood et al., 2018) and tested in an idealized, partially mixed estuary to investigate cohesive sediment distribution over a tidal cycle (Tarpley et al., 2019). To date, however, these types of flocculation models have solely been used to characterize the fate and aggregation of sediment. We expand upon these by using the FLOCMOD numerical framework to account for the formation of OPA that incorporate oil, sediment, and water within aggregates.
An important parameter in representing the formation and evolution of aggregates of particles is the fractal dimension, which generally represents the shape and packing of an aggregate (Wiesner, 1992; Kranenburg, 1994). Fractal dimension has been used to represent sediment flocs, marine snow, and oil-mineral aggregates, among other aggregate types. Fractal dimensions can range from 1 to 3, with a value of three representing a solid particle, such as sand grains. Natural sediment flocs typically have a fractal dimension close to 2.1 (Tambo and Hozumi, 1979; Kranenburg, 1994), with broadly reported fractal dimensions with the range of 1.7 ∼ 2.85 (Wiesner, 1992). However, for sediment flocs, some studies have reported higher fractal dimensions, between 2.6 and 3.0 (Lee et al., 2002). Fractal dimensions have also been reported for marine snow, falling in the range of 1.3 ∼ 2.3 (Burd and Jackson, 2009). The main factors that can affect the fractal dimension include turbulence (Logan and Kilps, 1995; Dyer and Manning, 1999), the shape (e.g., ellipsoidal and spherical) of the primary particles (Perry et al., 2012), and the makeup of the components (e.g., mineral types, organic matters, and oil) (Lee et al., 2002; Jarvis et al., 2005; Ye et al., 2020). In the laboratory, fractal dimensions can be indirectly estimated from properties related to aggregate size, such as settling velocity. Based on this method, Ye et al. (2020) reported that fractal dimension of kaolinite-oil aggregates varied from 2.4 to 2.6, while fractal dimension of bentonite-oil aggregates was in the range of 2.2–2.4. Flocculation and aggregation models often assume a single average fractal dimension throughout all size ranges. For instance, Dissanayake et al. (2018) chose a fractal dimension of 2.2 to represent the MOS aggregates in their one-dimensional model. FLOCMOD also assumes a constant fractal dimension (Verney et al., 2011; Sherwood et al., 2018). For example, Tarpley et al. (2019) used a fractal dimension of 2.4 for FLOCMOD in a two-dimensional sediment transport model.
An objective of our study was to develop a module capable of simulating oil-particle aggregation that could be coupled to other components of the COAWST modeling system. To accomplish this, we developed OPAMOD, a population-balance module based on FLOCMOD, but modified to account for the formation of OPAs. Further motivation was to facilitate the use of OPAMOD within a three-dimensional implementation of COAWST that coupled hydrodynamic, sediment, microbial, and oil components (Dukhovskoy et al., 2021). This coupled model included hydrodynamics, sediment transport, and biogeochemical modules available from ROMS (Shchepetkin and McWilliams, 2005; Fennel et al., 2006; Haidvogel et al., 2008; Warner et al., 2008). To these modules, Dukhovskoy et al. (2021) added OPAMOD, OWTM (the Oil Weathering and Transport Module), and a module to account for biological weathering of oil (Coles et al., 2020). They then used the fully coupled model to estimate oil dispersal for situation similar to the Deepwater Horizon event for a timescale of several days. To be useful within the fully coupled model required that OPAMOD carry a moderate computational expense. Additionally, the application focused on transport of oil droplets over the continental slope and outer continental shelf, where sediment concentrations and turbulence levels are relatively low. This meant that our formulation could focus on the aggregate formation process to account for settling of oil via OPA, and neglect potential breakup of OPA once formed as has been done by similar models (Bandara et al., 2011; Zhao et al., 2016).
The rest of this paper describes the development of OPAMOD and two stand-alone applications. Specifically, Section “Materials and Methods” describes model development. A zero-dimensional model implementation was then used to validate model performance based on available laboratory data, and test its sensitivity to parameters (Section “Zero-Dimensional Model Implementation and Results”). Next, a one-dimensional model was used to represent an oil spill on a continental slope setting to evaluate the relative importance of OPA formation under storm, and freshwater plume scenarios (Section “Scenarios: Implementation of One-Dimensional Model”). Conclusions and discussion are given in Section “Conclusion and Discussion.”
Materials and Methods
This section describes the modeling framework and assumptions used to represent the formation of OPAs. The new module, OPAMOD, was implemented within the hydrodynamic model, ROMS, which is the ocean model component of COAWST.
Existing COAWST System Including FLOCMOD
The COAWST modeling system was developed to couple the ROMS hydrodynamic model with Weather Research and Forecasting Model (WRF) and Simulating Waves Nearshore (SWAN) to provide two-way links between the hydrodynamic (ROMS), atmospheric (WRF), and wave (SWAN) models (Warner et al., 2010). ROMS is capable of solving for the transport of tracer fields, including salinity, temperature, sediment, etc. (Haidvogel et al., 2008). The Community Sediment Transport Modeling System (CSTMS) was implemented in ROMS for sediment transport and evolution of bottom morphology (Warner et al., 2008). Further model development added processes of sediment flocculation (FLOCMOD) including aggregation and disaggregation (Sherwood et al., 2018). FLOCMOD is a population-balance module using a finite number of floc size classes based on Verney et al. (2011). Each floc class is assumed to have the same fractal dimension, but assigned a different floc diameter, floc density, and setting velocity. FLOCMOD has been tested in one-dimensional simulations to reproduce a tidal cycle variation of sediment flocs from a laboratory experiment (Sherwood et al., 2018), and two-dimensional simulation for an idealized, muddy estuary (Tarpley et al., 2019). Within this paper we implemented COAWST to use ROMS, CSTMS, and the newly developed OPAMOD in zero-dimensional and one-dimensional configurations, as described below.
OPA Module Development
To account for OPA, the tracer fields in ROMS were expanded to include sediment flocs, oil droplets, and OPAs. These tracers for flocs, oil droplets, and OPAs were represented using a finite number of classes; each with a prescribed diameter, settling velocity, and density.
Assumptions
Our approach used a population-balance model for OPA formation and growth, specifically representing interactions between three types of tracers: oil droplets, sediment flocs, and OPAs (Figure 1). In nature, the formation, aggregation, and disaggregation of an OPA is complicated. Interactions include collisions between particles and droplets that can form larger particles or droplets; or can result in the breakup into smaller particles and droplets (Lee et al., 1997). An oil droplet can coalesce with other oil droplets to form a larger oil droplet; or with sediment flocs to create OPAs; also, an oil droplet can interact with OPAs. Likewise, a sediment floc can combine with other sediment flocs to form larger flocs; or with oil droplets to form OPAs; or interact with existing OPAs. Finally, OPAs can interact with other OPAs. The simulation was conducted with concentration thresholds for both sediment and oil; i.e., the OPA aggregation process was not invoked when concentrations were below 0.001 kg m–3. To reduce model complexity while addressing the primary goal of providing estimates of OPA formation and sinking for use on continental shelves, the following assumptions were made:
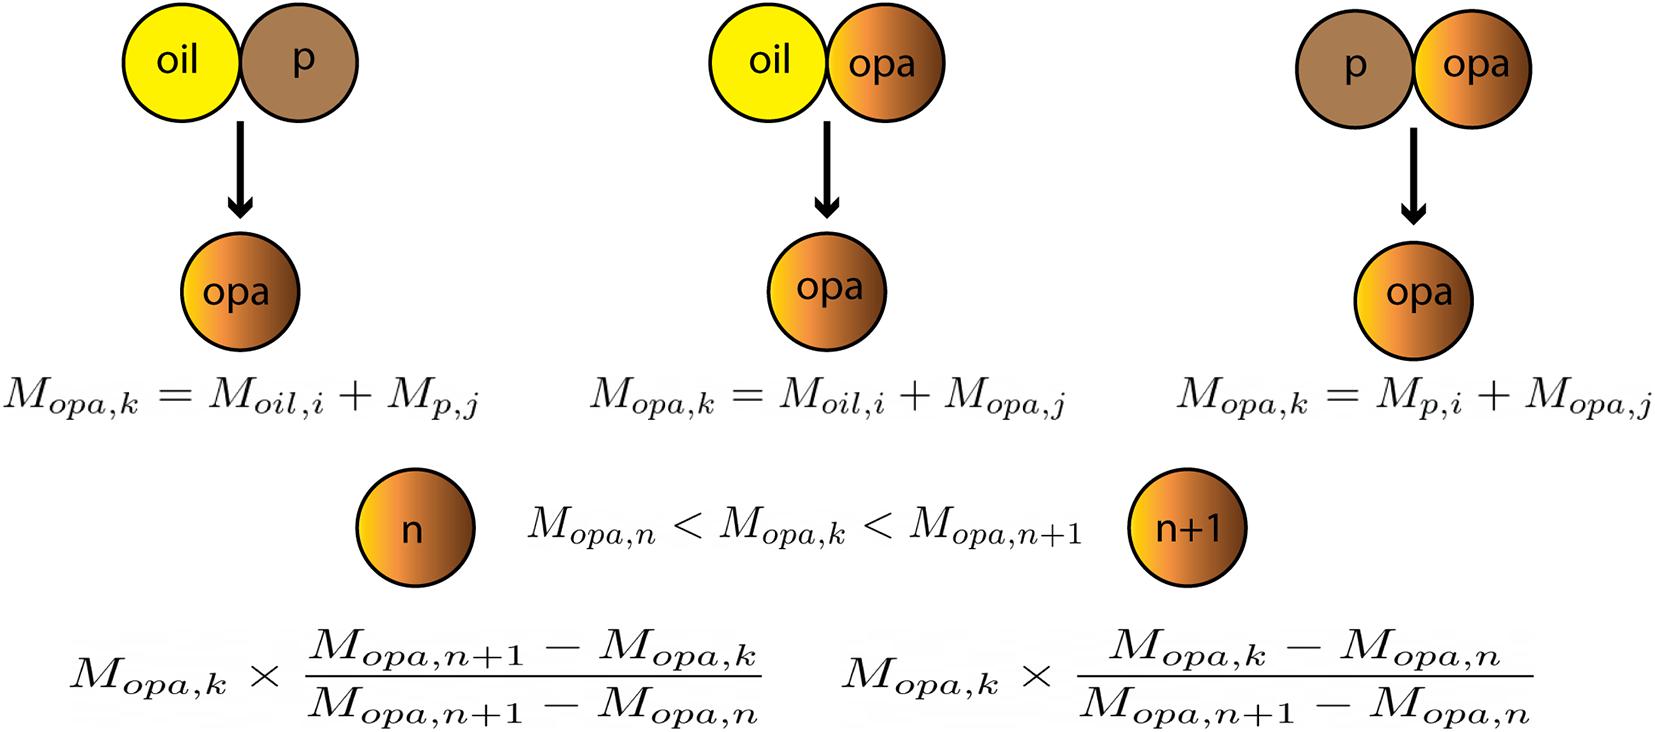
Figure 1. Schematic of modeled formation processes for OPA.Mopa,k is the mass of newly formed OPA of class k, which is the mass addition of two collision components (e.g., collision between the ith – class oil Moil,i and the jth – class sediment Mp,j). Assuming that Mopa,k falls between two OPA classes, then this mass is mass-linearly distributed into the two neighboring classes [i.e. the nth and (n+1)th OPA classes].
(1) Including all potential aggregation and disaggregation processes in the model would require a large number of parameters and high degree of complexity. As noted above, a variety of aggregation processes can occur in coastal systems that include sediment and oil droplets. To reduce the complexity and increase computational efficiency, the implementation of this model only considered interactions between oil droplets and sediment flocs, oil droplets and OPAs, and sediment flocs and OPAs (Figure 1), following Zhao et al. (2016).
(2) Collision between two entities can result from turbulent motions, differential settling, and Brownian motion. Collisions due to Brownian motion are unimportant in ocean systems and shear-induced collisions are dominant in turbulent environments (Sherwood et al., 2018), therefore, we only implemented collisions due to fluid shear in the model.
(3) Sediment flocs, oil droplets, and OPAs were assumed to be spherical.
(4) The fractal behavior of OPAs was assumed to be the same as that of sediment flocs, which is consistent with laboratory observations of Ye et al. (2020). Therefore, the effective density was related to the primary particle diameter and density through fractal dimension in the following relationship (Kranenburg, 1994):
where ρeis the effective density of the floc or OPA, ρs is the density of the particle, and ρw is the density of water. D is the diameter; and D_p is the diameter of the primary particle, i.e. the smallest floc particle. The fractal dimension is n_f.
(5) Each sediment class and OPA class was assigned a diameter, density, and settling velocity as model input parameters.
(6) Formed OPAs are considered to be stable, i.e., the model neglected OPA breakup processes. This assumption is consistent with previous models (Bandara et al., 2011; Zhao et al., 2016), and seemed reasonable for meeting the primary objective of accounting for OPA formation, settling and subsequent removal of oil from the water column. It effectively considers the OPA to be resilient to breakup and avoids an added complexity in the model of specifying the particle makeup that would be produced via breakup.
Governing Equations of OPA Formation Process
At model implementation, the input files specify the number of tracer classes to be included; specifically, the value of nsed represents the number of sediment floc classes, noil represents the number of oil droplet classes, and nopa represents the number of OPA classes. Changes to the number concentration (i.e. NOIL,i, NP,j, and NOPA,i) due to mass exchanges among classes were simulated to represent aggregation between two different class types. The model tracks the time variation of the number concentration of OPA in the mth class (NOPA,m) as the sum of gain and loss terms:
where α represents collision efficiency. Note that this formulation used a single value for α regardless of the types of particles involved in a collision. Zhao et al. (2016) developed an estimate for coagulation efficiency applied on the conceptual basis of sediment particles coating an oil droplet. Dissanayake et al. (2018) cited values of alpha that ranged from 0.08 to 0.8, depending on the makeup of the particle (i.e., organic material, mineral content, oil content). However, these were not directly applicable to the solid OPAs conceptualized for this study, nor could they be directly implemented within the full coupled model. Additionally, our sensitivity study below indicated that the model was not particularly sensitive to α. For these reasons we used a constant value for α, though it would be relatively straightforward to use particle-type dependent values provided guidance for its parameterization. Finally, the collision probability, A(i,j) is given by:
where D_i and D_j are diameters of two colliding entities; G is the shear rate, which can be expressed by energy dissipation rate ε and kinematic viscosity ν, as G = .
The time variation of the number concentration of sediment particles in the ith class (NP,i) is calculated as:
Finally, the time variation of the number concentrations of oil droplets in the ith class (NOIL,i) is calculated as:
OPAMOD classifies OPAs by density (ρi,opa), vertical terminal velocity (wi,opa), and median diameter (Di,opa), for OPA sizes i=1,…nopa. Since OPAMOD tracks a finite number of OPA classes, the mass of each newly formed OPA is mass-linearly distributed into two neighboring classes (Bandara et al., 2011; Verney et al., 2011) rather than assigning the total mass to one class (Figure 1).
Zero-Dimensional Model Implementation and Results
OPAMOD was implemented within a quasi-zero-dimensional framework, as described below. This was first used to demonstrate that the model results compared favorably to laboratory observations of OPA properties, and to aid with selection of model parameters (Section “Model Comparison With Laboratory Experimental Data”). Next, the zero-dimensional implementation was used to evaluate the sensitivity of OPA properties to the choice of the collision efficiency and fractal dimension (Section “Sensitivity Tests”).
Model Comparison With Laboratory Experimental Data
The first set of model results were compared with experimental data from Ye et al. (2020) who conducted six laboratory experiments to investigate characteristics (e.g., settling velocity, effective density, and fractional dimension) of OPAs formed from kaolinite or bentonite clays mixed with crude oil. Previous studies have shown that when the ratio of oil to sediment is close to two, it can reach a maximum OPA formation efficiency (Guyomarch et al., 2002; Khelifa et al., 2008). Ye et al. (2020) therefore generated OPAs by adding 0.5 g of clay and 1.0 g of Texas crude oil into a jar containing 1.0 L of artificial seawater. The mixture was stirred at 490 rpm, which gave an estimated turbulence dissipation rate ε about 0.02 m2s–3. The turbulence was maintained for up to 2 h, and then flocs and OPAs were collected and analyzed from materials after they settled overnight. Statistical analysis of these experimental samples showed that the floc and OPA sizes varied from 20 to 700 μm. Bentonite clays tended to generate compact, negatively buoyant OPAs (Ye et al., 2020).
To compare with these laboratory measurements, we configured a quasi-zero-dimensional model in ROMS to simulate the scenario where OPAs formed from oil and bentonite clay. The shear rate G was specified as 20 s–1 over the simulation time of 2 h, replicating the laboratory experiment. In actuality, the ROMS implementation was a small three-dimensional grid, but the model was effectively zero-dimensional because conditions were uniform, the horizontal boundary conditions were periodic, and settling velocities were set to zero to maintain a vertically uniform suspension. The quasi-zero-dimensional simulation therefore operated as uniform in all three directions, so that the only mechanism for changes to the distributions of sediment, oil droplets, and OPA were via the OPAMOD terms. The model used five sediment classes, twelve OPA classes, and six oil classes (Table 1). The initial concentrations of sediment and oil, shown in Figure 2, were 0.5 and 1.0 kg m–3, respectively, to match laboratory conditions (Ye et al., 2020). The sediment mass concentration was evenly distributed among the five sediment classes (Figure 2A), and the initial oil distribution was as shown (Figure 2B). In this simulation, the collision efficiency was 0.35, and fractal dimension was 2.3, which were obtained using model calibration simulations to match the laboratory results. The primary particle diameter was 4 μm, which matched the value used by Ye et al. (2020).
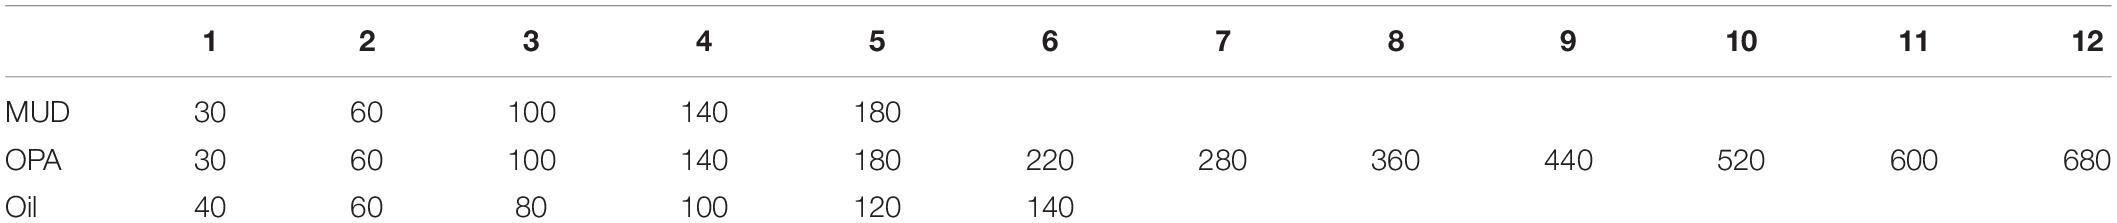
Table 1. Diameters (D,μm) for sediment (MUD, five size classes), OPA (twelve size classes), and oil droplets (six size classes).
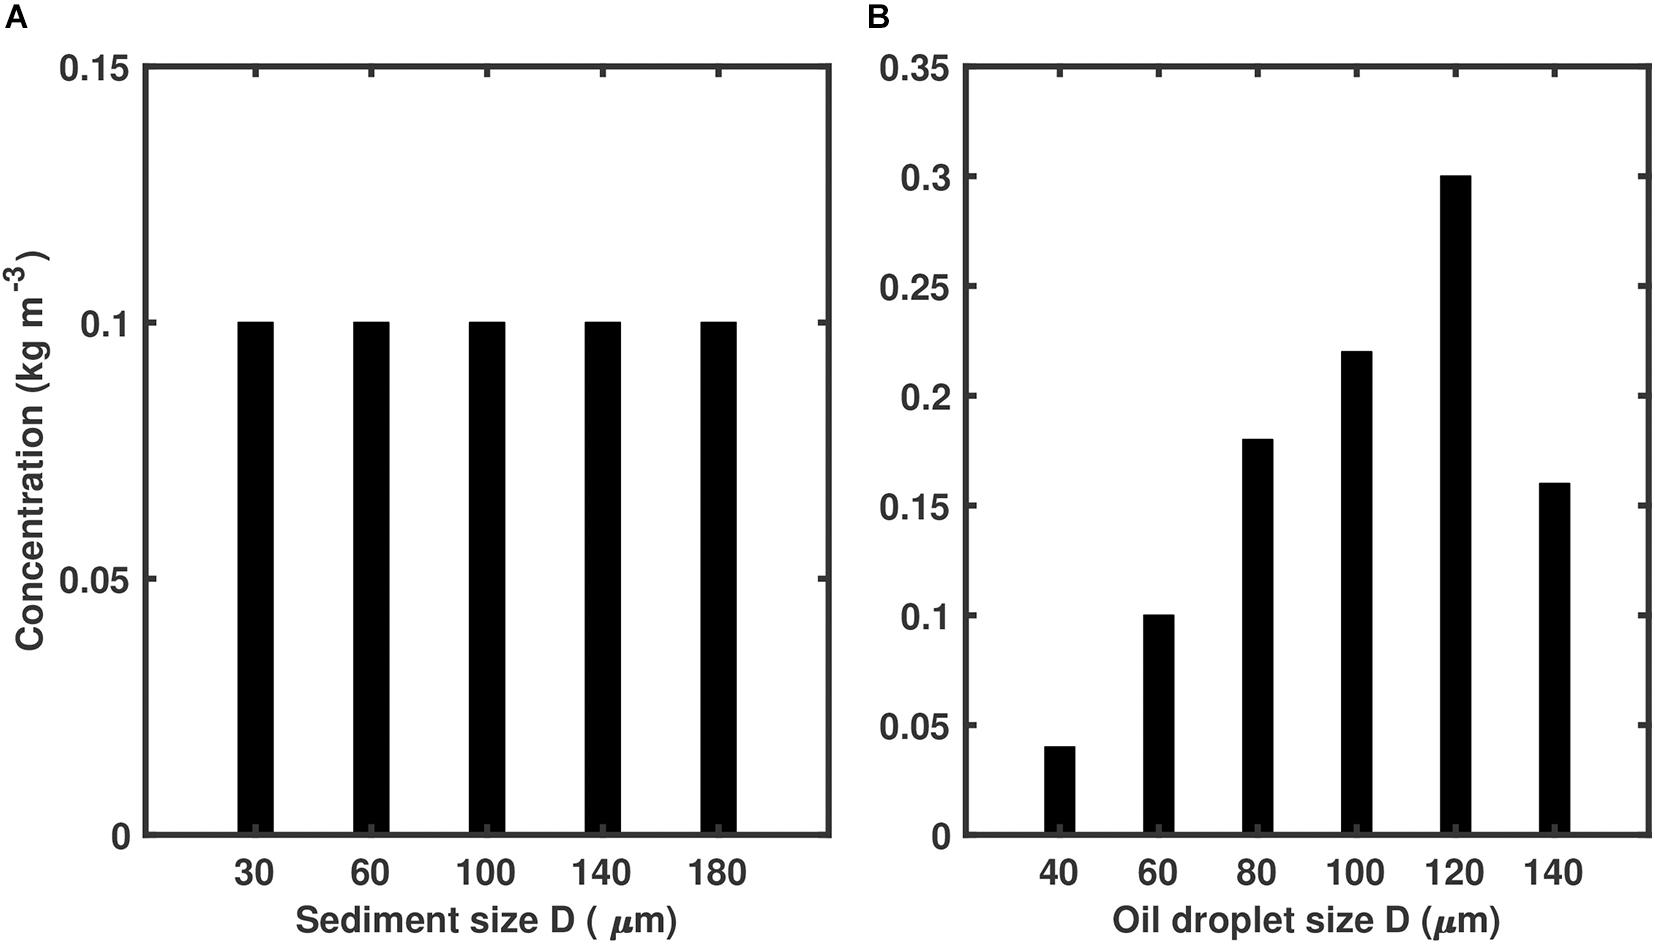
Figure 2. Initial size mass concentration distributions for OPAMOD simulation of (A) sediment particles, and (B) oil droplets.
Within the model, the mixtures of sediment and oil quickly combined to form OPAs, and the OPA concentrations and size distributions reached a steady state within the first few minutes of the simulation. Figure 3 compares the number fraction of modeled and experimental OPAs. The size distribution produced by the model had good agreement with experimental data. The modeled OPA size peaked in class 6 (D = 220μm), which accounted for about 18% of the total number of OPA, while the experimental OPA size peaked in class 5 (D = 180μm) with a number fraction of ∼20% (Figure 3A). Both the modeled and experimental OPAs were mainly composed of small and medium aggregates (>95% of the population, Figure 3B). However, the number fraction of modeled small OPAs (class 2 and 3, D = 60and 100μm) slightly exceeded that of experimental ones (Figure 3B).
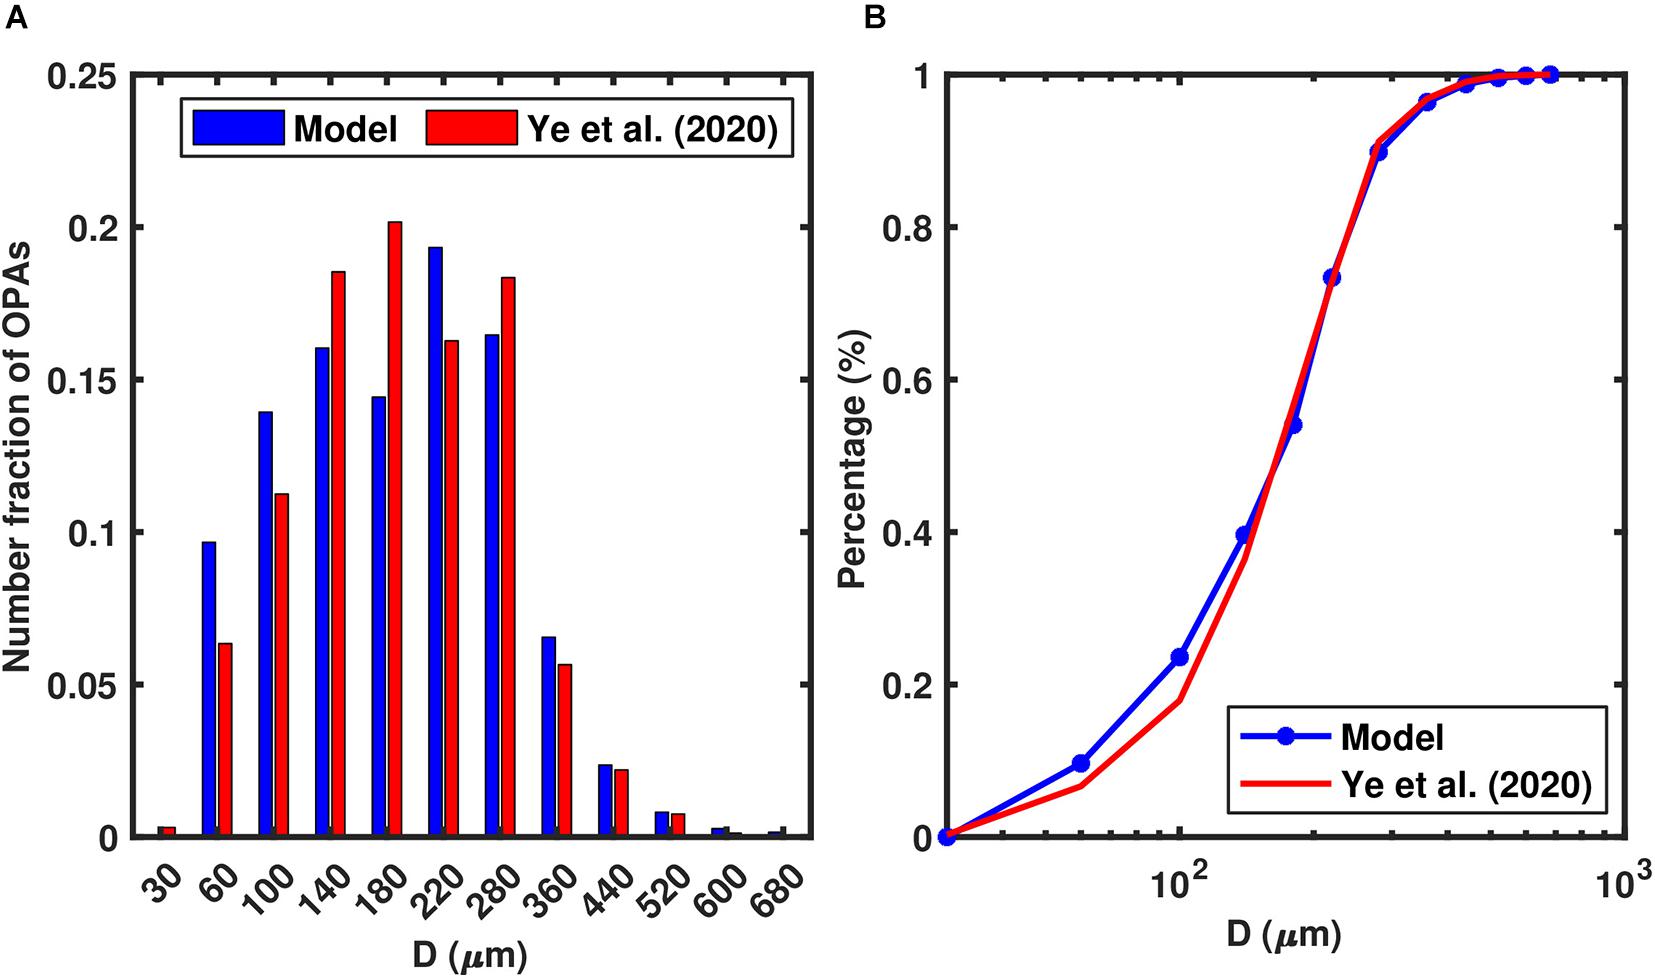
Figure 3. Comparison of the number fraction of oil-bentonite aggregates between the lab experiments (Ye et al., 2020) and 0-D model that included OPAMOD after a simulation time of 2 h. (A) Histogram of OPA sizes, (B) Cumulative number percentage of OPAs.
Sensitivity Tests
Next, sensitivity tests were run to evaluate the impact of uncertainties in model parameters on the resulting size distributions of OPAs. The primary model parameters, fractal dimension and collision efficiency (nf in Equation 1; and α in Equations 2, 4, 5), were each varied for a series of model runs, and the resultant effect on the size distribution of OPAs was assessed. The final size distribution of OPAs was seen to be quite sensitive to the fractal dimension, and insensitive to collision efficiency.
Collision efficiency (α) represents the probability with which colliding constituents (sediment, oil droplets, or OPA) combine to form larger OPA. Values reported in the literature include 0.4 for heterogeneous collision efficiency (e.g., oil-clay), and 0.7 for homogeneous collision efficiency (e.g., sediment-sediment), respectively (Sterling et al., 2004; Bandara et al., 2011). Six numerical experiments were run to test how variations in collision efficiency influenced modeled OPA formation, with collision efficiencies that ranged from 0.2 to 0.7. For these simulations, the fractal dimension (nf) was held constant at 2.3. The final OPA size distributions for these simulations are shown in Figure 4. The case that had a higher collision efficiency had slightly higher OPA concentrations in the middle-sized classes (180μm < D < 360μm), and concentrations were slightly shifted to the larger OPA classes for the case having lower collision efficiency. The modeled OPA size distributions were fairly insensitive to collision efficiency.
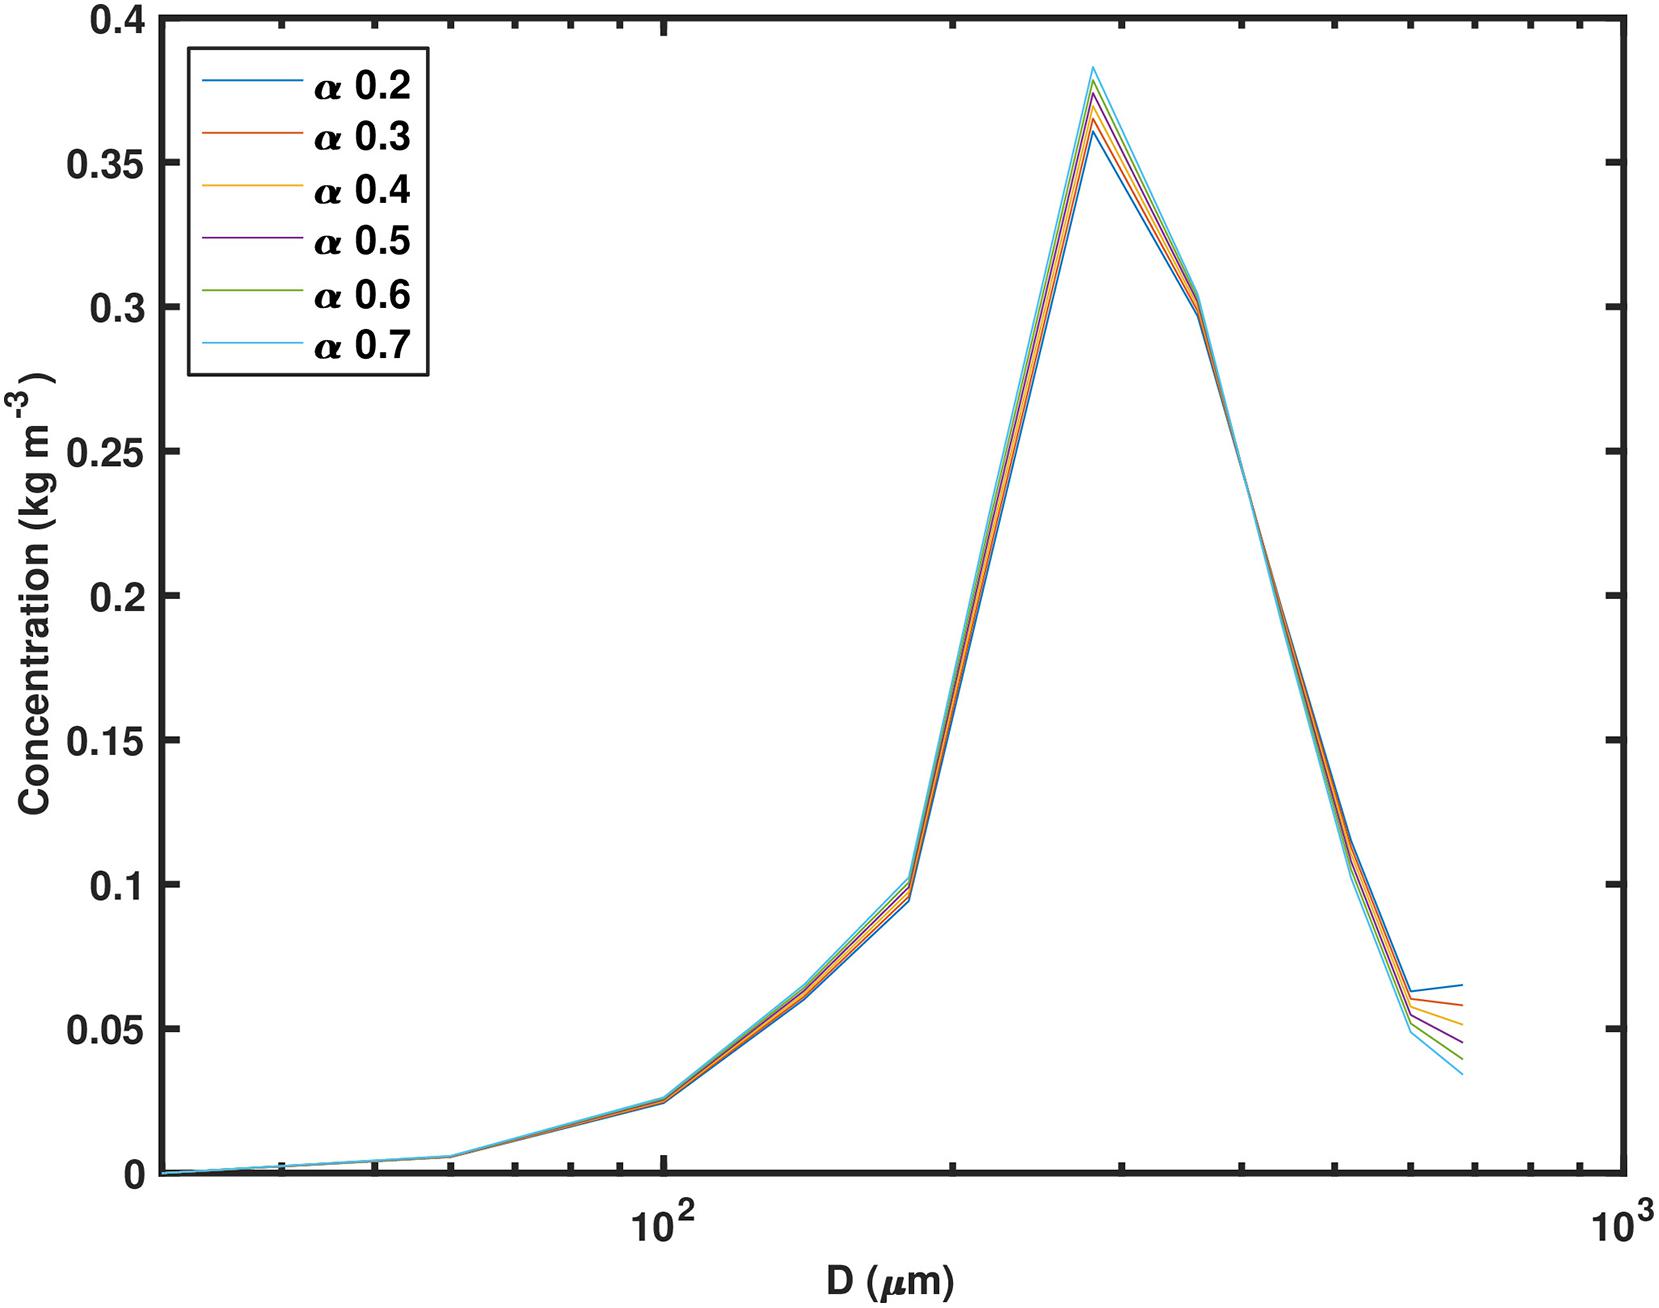
Figure 4. Size distribution by mass concentration of OPA at the end of 2 h simulation calculated using different collision efficiencies (see legend). A fractal dimension of nf = 2.3 was used for these simulations.
Next, to estimate the relative influence of fractal dimension on the size distribution of OPAs, six numerical experiments were run where fractal dimension was varied from 2.0 to 2.5. For these simulations, collision efficiency was held at 0.3. Note that because fractal dimension represents the shape and packing of aggregates, particles with higher fractal dimensions are denser than particles of the same diameter with lower fractal dimension (Equation 1). Each of these sensitivity tests had the same initial sediment concentration by mass (0.1 kg m–3, matching Ye et al., 2020). Because they had different fractal dimensions, however they were each initialized with different number concentrations (NP,i). As the fractal dimension for the test increased, the initial number of sediment particles decreased. Because the population balance equations are based on number concentrations, this had an impact on the frequency of collisions and thus likelihood of formation of OPAs. The results of the fractal dimension sensitivity tests are illustrated as the final OPA size distributions by number of particles (Figure 5A), and the final size distribution by mass concentration (Figure 5B). As the assumed fractal dimension increased, the OPA size distribution shifted from coarse toward fine aggregates. For the sensitivity test that used a fractal dimension of 2.5, the finer classes (D≤140μm) accounted for almost 65% of the number concentration (Figure 5A). For the simulation that used a fractal dimension of 2.0, finer classes made up less than 10% of the total (Figure 5A). For simulations with intermediate fractal dimensions (2.2 and 2.3), the intermediate classes (D from 180 to 360μm) contained greater than 60% of the number concentrations. In terms of mass concentrations, as the fractal dimension decreased, the OPA shifted toward the larger diameter particles (Figure 5B).
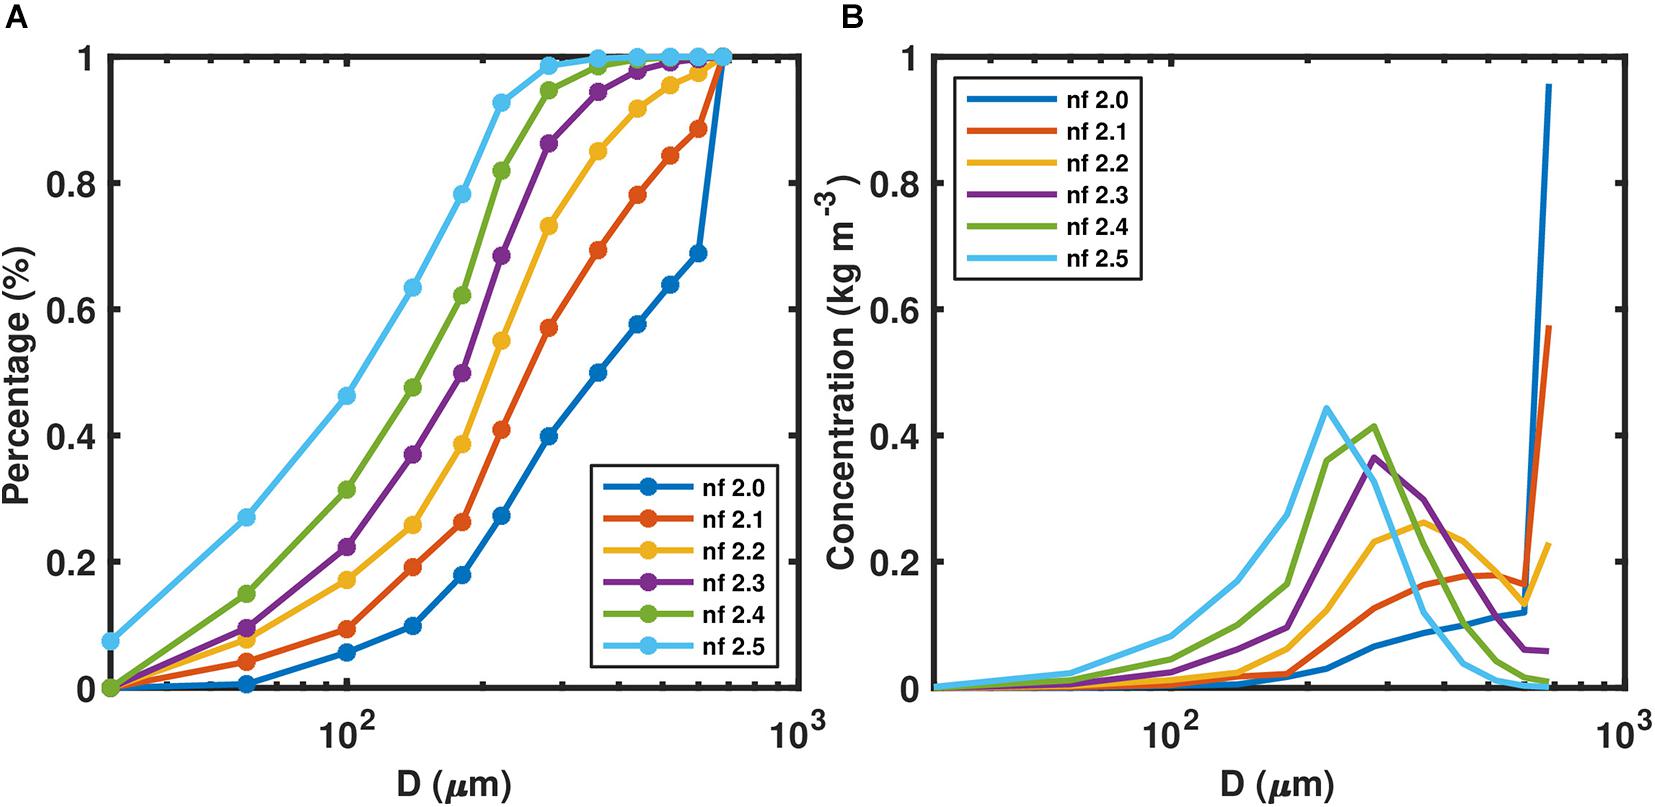
Figure 5. Size distributions of OPA calculated at the end of 2 h simulation using different fractal dimensions (see legend). A collision efficiency of 0.3 was used for these simulations. (A) The cumulative distribution by % of the number of particles. (B) Size distribution by mass concentration.
Scenarios: Implementation of One-Dimensional Model
Next, the formation of OPA was examined in the context of an oceanographic water column, using a quasi-one-dimensional approach. These scenarios were motivated by consideration of a contamination event at the Taylor Energy Company’s Mississippi Canyon Block 20 platform (MC20), and used oceanographic fields (SSC, velocity) from a three-dimensional numerical model as described below.
Background of MC20 Site
In September of 2004, Hurricane Ivan passed through the northern Gulf of Mexico as a category 3 storm generating 22 m waves, and destroying seven drilling platforms (Mason, 2019). The Taylor Energy Mississippi Canyon 20 (MC20) oil and gas drilling platform, which is located about 16 km southeast of the mouth of the South Pass of the Mississippi River, was toppled by storm-triggered submarine mudslides. On 17 September 2004, 1 day after the passage of Ivan, surface oil slicks were found around the MC20 site. About 10 days later, satellite images showed oil floating over the sediment-laden coastal waters offshore of the Mississippi delta (Mason, 2019). Since then, oil plumes and surface oil slicks have been observed at the MC20 site from ships and satellite remote sensing (Mason, 2019). Estimates of the oil flux rate span from roughly 9–108 barrels of oil per day, based on acoustic surveys and bubblometer surveys (MacDonald et al., 2019). The MC20 site is located at a water depth of approximately 140 m, where the fine sediment (silt and clay) percentage exceeds 90% (Mason, 2019).
Sediment from the Mississippi River is widely dispersed within 20–40 km from the bird-foot delta (Xu et al., 2011). Located within 16 km of the South Pass of the Mississippi River, the MC20 site is therefore often influenced by the Mississippi River freshwater and sediment plume. Additionally, during large storms, this location may be impacted a bottom nepheloid layer sourced from sediment resuspended from the adjacent continental shelf by energetic waves. However, it is difficult to quantify potential interactions between oil released at this site, and sediments in either the surface freshwater plume, or in a bottom nepheloid layer. Therefore, the MC20 scenario provides a good example to implement one-dimensional (vertical) model to explore the potential for sediment / oil interactions to impact the dispersal of oil in similar settings.
Configuration of One-Dimensional Model
The quasi-one-dimensional model was configured to generally represent steady conditions for the MC20 site. The one-dimensional model was actually a small three-dimensional implementation, with 5×6 horizontal grid cells, and 50 vertical grid cells. Lateral periodic boundary conditions were applied meaning that anything exiting the domain horizontally reentered on the upstream side, creating a uniform flow field in the horizontal. The oil concentration was initialized to be vertically uniform and set to 0.2 kg m–3, based on estimates from the BP/Deepwater Horizon Oil Spill (Sammarco et al., 2013). The size distribution of oil was assumed to be the same mass percentage as in the 0D simulation (Figure 2B). Hydrodynamic and suspended sediment conditions were obtained from a 1-year long ROMS simulation (1 October, 2007 through 30 September, 2008) of the northern Gulf of Mexico that included times of large river discharge, and two hurricanes (Harris et al., 2020). The one-dimensional model started from rest and was nudged to a steady flow condition; matching values of velocity, temperature, salinity, and suspended sediment concentrations extracted from a larger-scale ROMS simulation (Harris et al., 2020). After a 2 h spin-up time to allow for the flow to accelerate and reach steady state, OPAMOD was activated. The fractal dimension and collision efficiency were set to 2.3 and 0.35, respectively. As done for the zero-dimensional model (Section “Zero-Dimensional Model Implementation and Results”), the one-dimensional sediment-OPAMOD model used five cohesive sediment classes, twelve OPA classes, and six oil droplet classes (Table 1). The effective density (Equation 1) and settling velocity for sediment flocs and OPAs are shown in Tables 2, 3, respectively. Here settling velocity are obtained from laboratory experiment (Ye et al., 2020). To avoid complexity in the suspended concentrations, and because little is known about either the erosion thresholds for OPA or the characteristics of eroded OPA; the critical shear stress was defined a high value (10 Pa) to prevent erosion from occurring. Rather, the initial suspended sediment concentrations were derived from the larger scale ROMS model of Harris et al. (2020), which did include both river plume sedimentation and seabed resuspension.
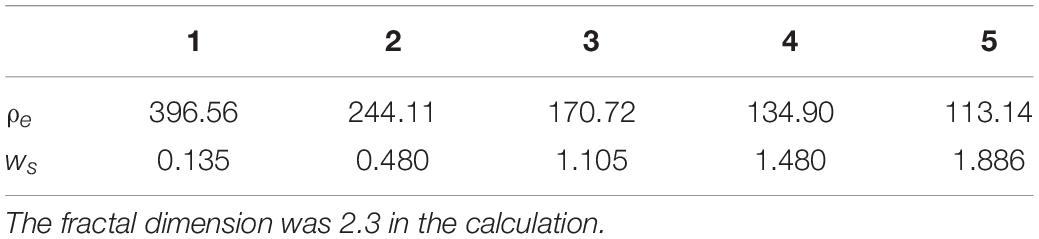
Table 2. Effective density (ρe, kg m–3) and settling velocity (w_s, mm s–1) for sediment size classes.
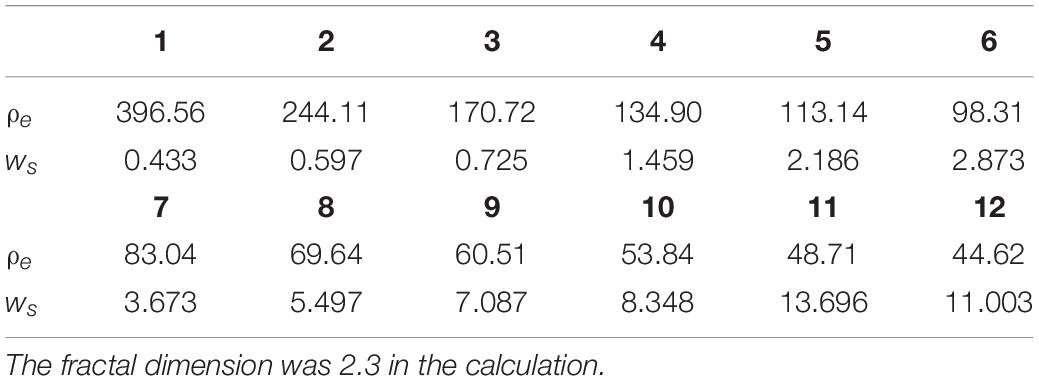
Table 3. Effective density (ρe, kg m–3) and settling velocity (w_s, mm s–1) for OPA size classes.
Hurricane Scenario
First, the one-dimensional model was implemented to study oil-sediment interaction under energetic waves to explore interactions between oil contamination and a bottom nepheloid layer created by resuspended sediment during a tropical storm. The model results from Harris et al. (2020) estimated that about 30% of the suspended sediment delivered to the continental slope of the northern Gulf of Mexico for the 1-year simulation period occurred during hurricanes Gustav and Ike. For this scenario we therefore used Hurricane Gustav, the second most catastrophic hurricane of the year 2008 (Brown et al., 2010). Gustav made landfall in southeast Louisiana on 1 September 2008 as category 2 hurricane. Model results indicated that wave-induced bottom orbital velocities exceeded 4 m s–1 in coastal areas and wave-induced resuspensions occurred offshore to water depth of 189 m (Harris et al., 2020). Figure 6A shows the vertical profiles of velocity and salinity used as forcing, which were extracted from the three-dimensional model output from Harris et al. (2020). The velocity exceeded 1.0 m s–1 at mid-depth. The salinity profile showed an upper mixed layer extending to about 15 m depth. Fresher water in the mixed layer indicated the influence of the Mississippi River plume. The vertical profile of initial sediment concentration included a ∼40 m thick bottom nepheloid layer where concentrations increased to about 0.01 kg m–3 near the seafloor (Figure 6B). The sediment concentration was assumed to be evenly distributed among five sediment classes at each vertical level. The simulation period was 12 h, which allowed OPAMOD to operate for 10 h.
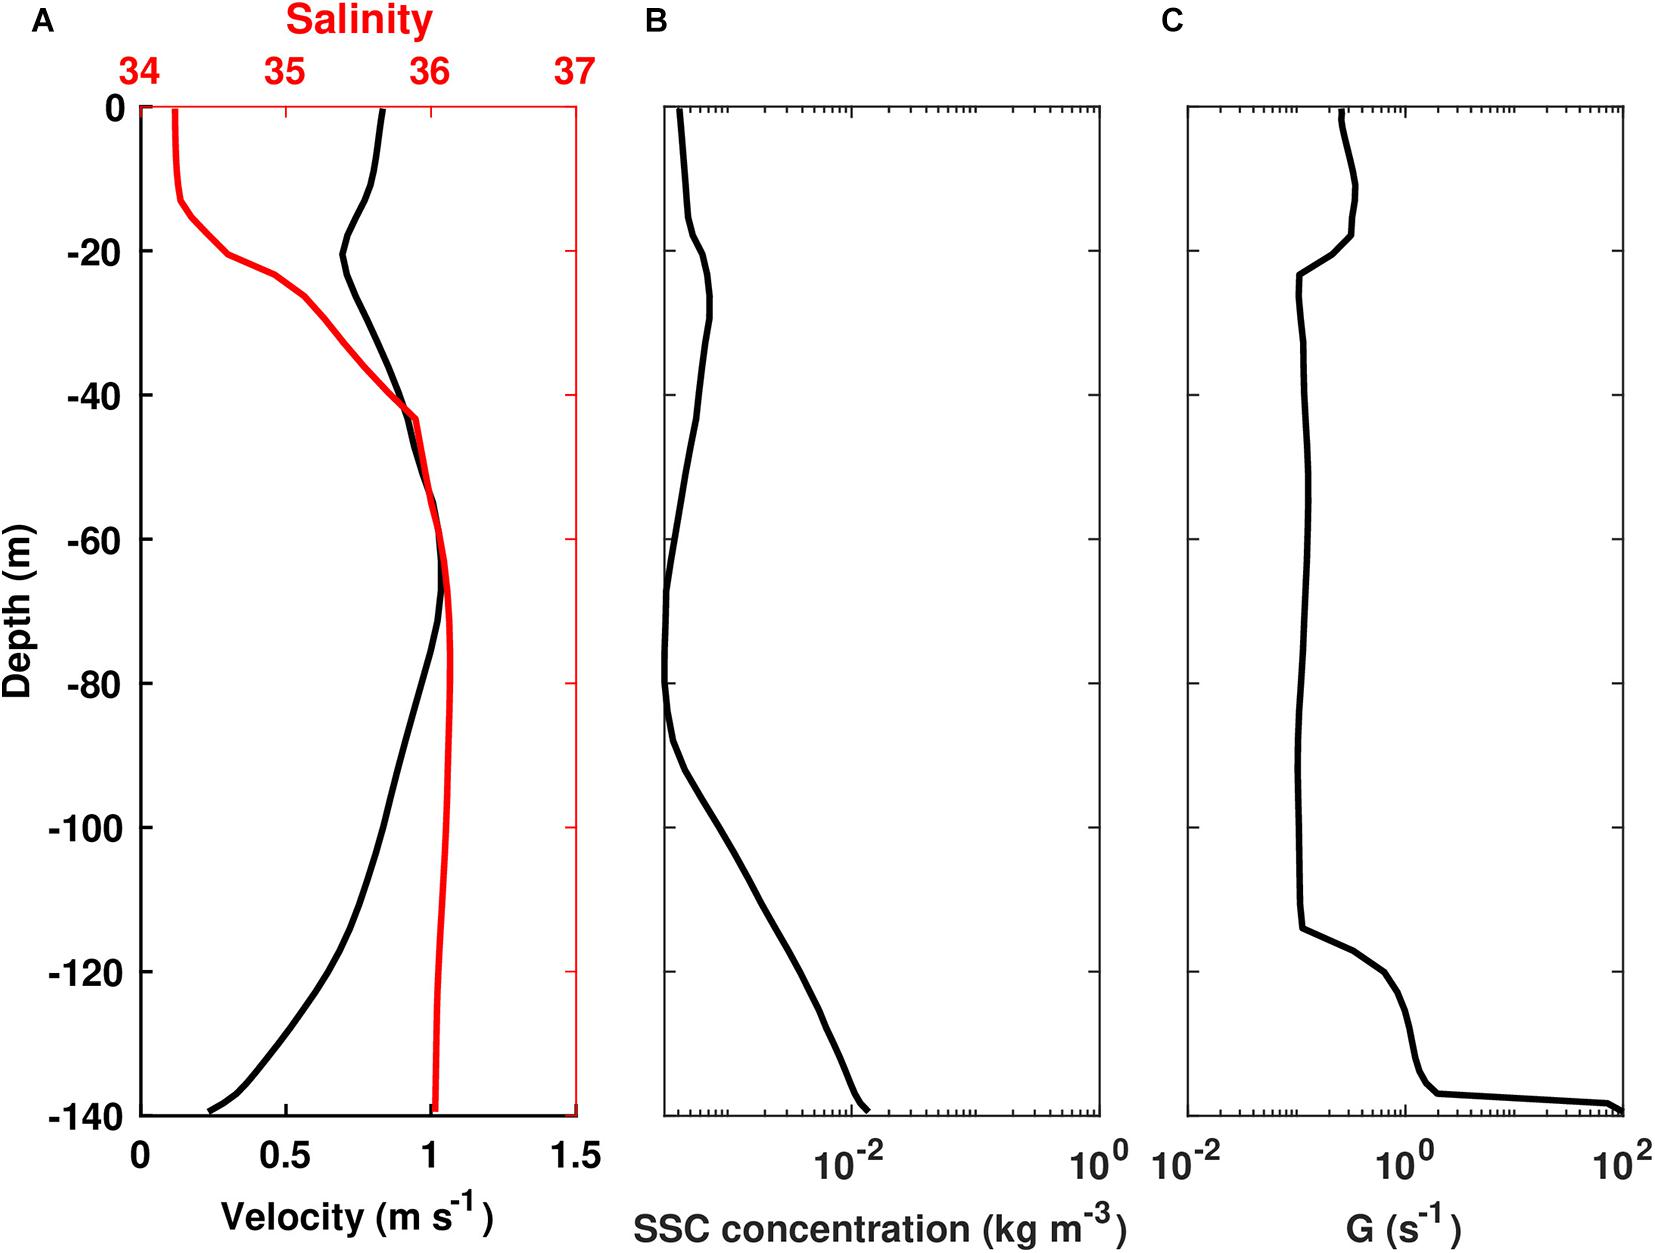
Figure 6. Profiles of (A) velocity and salinity, (B) initial suspended sediment mass concentration, and (C) shear rate for the hurricane scenario (A,B are based on model output from Harris et al., 2020. C is from 1D model output).
Figures 7A,B show the depth-integrated OPA and suspended sediment concentrations, respectively. After the initial 2-h hydrodynamic spin-up time, OPAMOD was activated in the model and the mixture of oil and sediment began to form OPA. The depth-integrated OPA mass concentration peaked around 45 min after the aggregation process commenced, and increased to about 0.3 kg m–2. During this time, depth-integrated sediment concentrations saw a rapid decrease (from 0.25 to < 0.1 kg m–2), as suspended sediment was converted to OPA. After the peak, OPA concentrations decreased over the next 8 h as the OPAs settled to the seafloor (Figure 7A). The size distribution of OPAs mainly fell in the medium size range (classes 5–8, having D = 180−360μm), whose concentration was about 10 times greater than that of small and large size ranges.
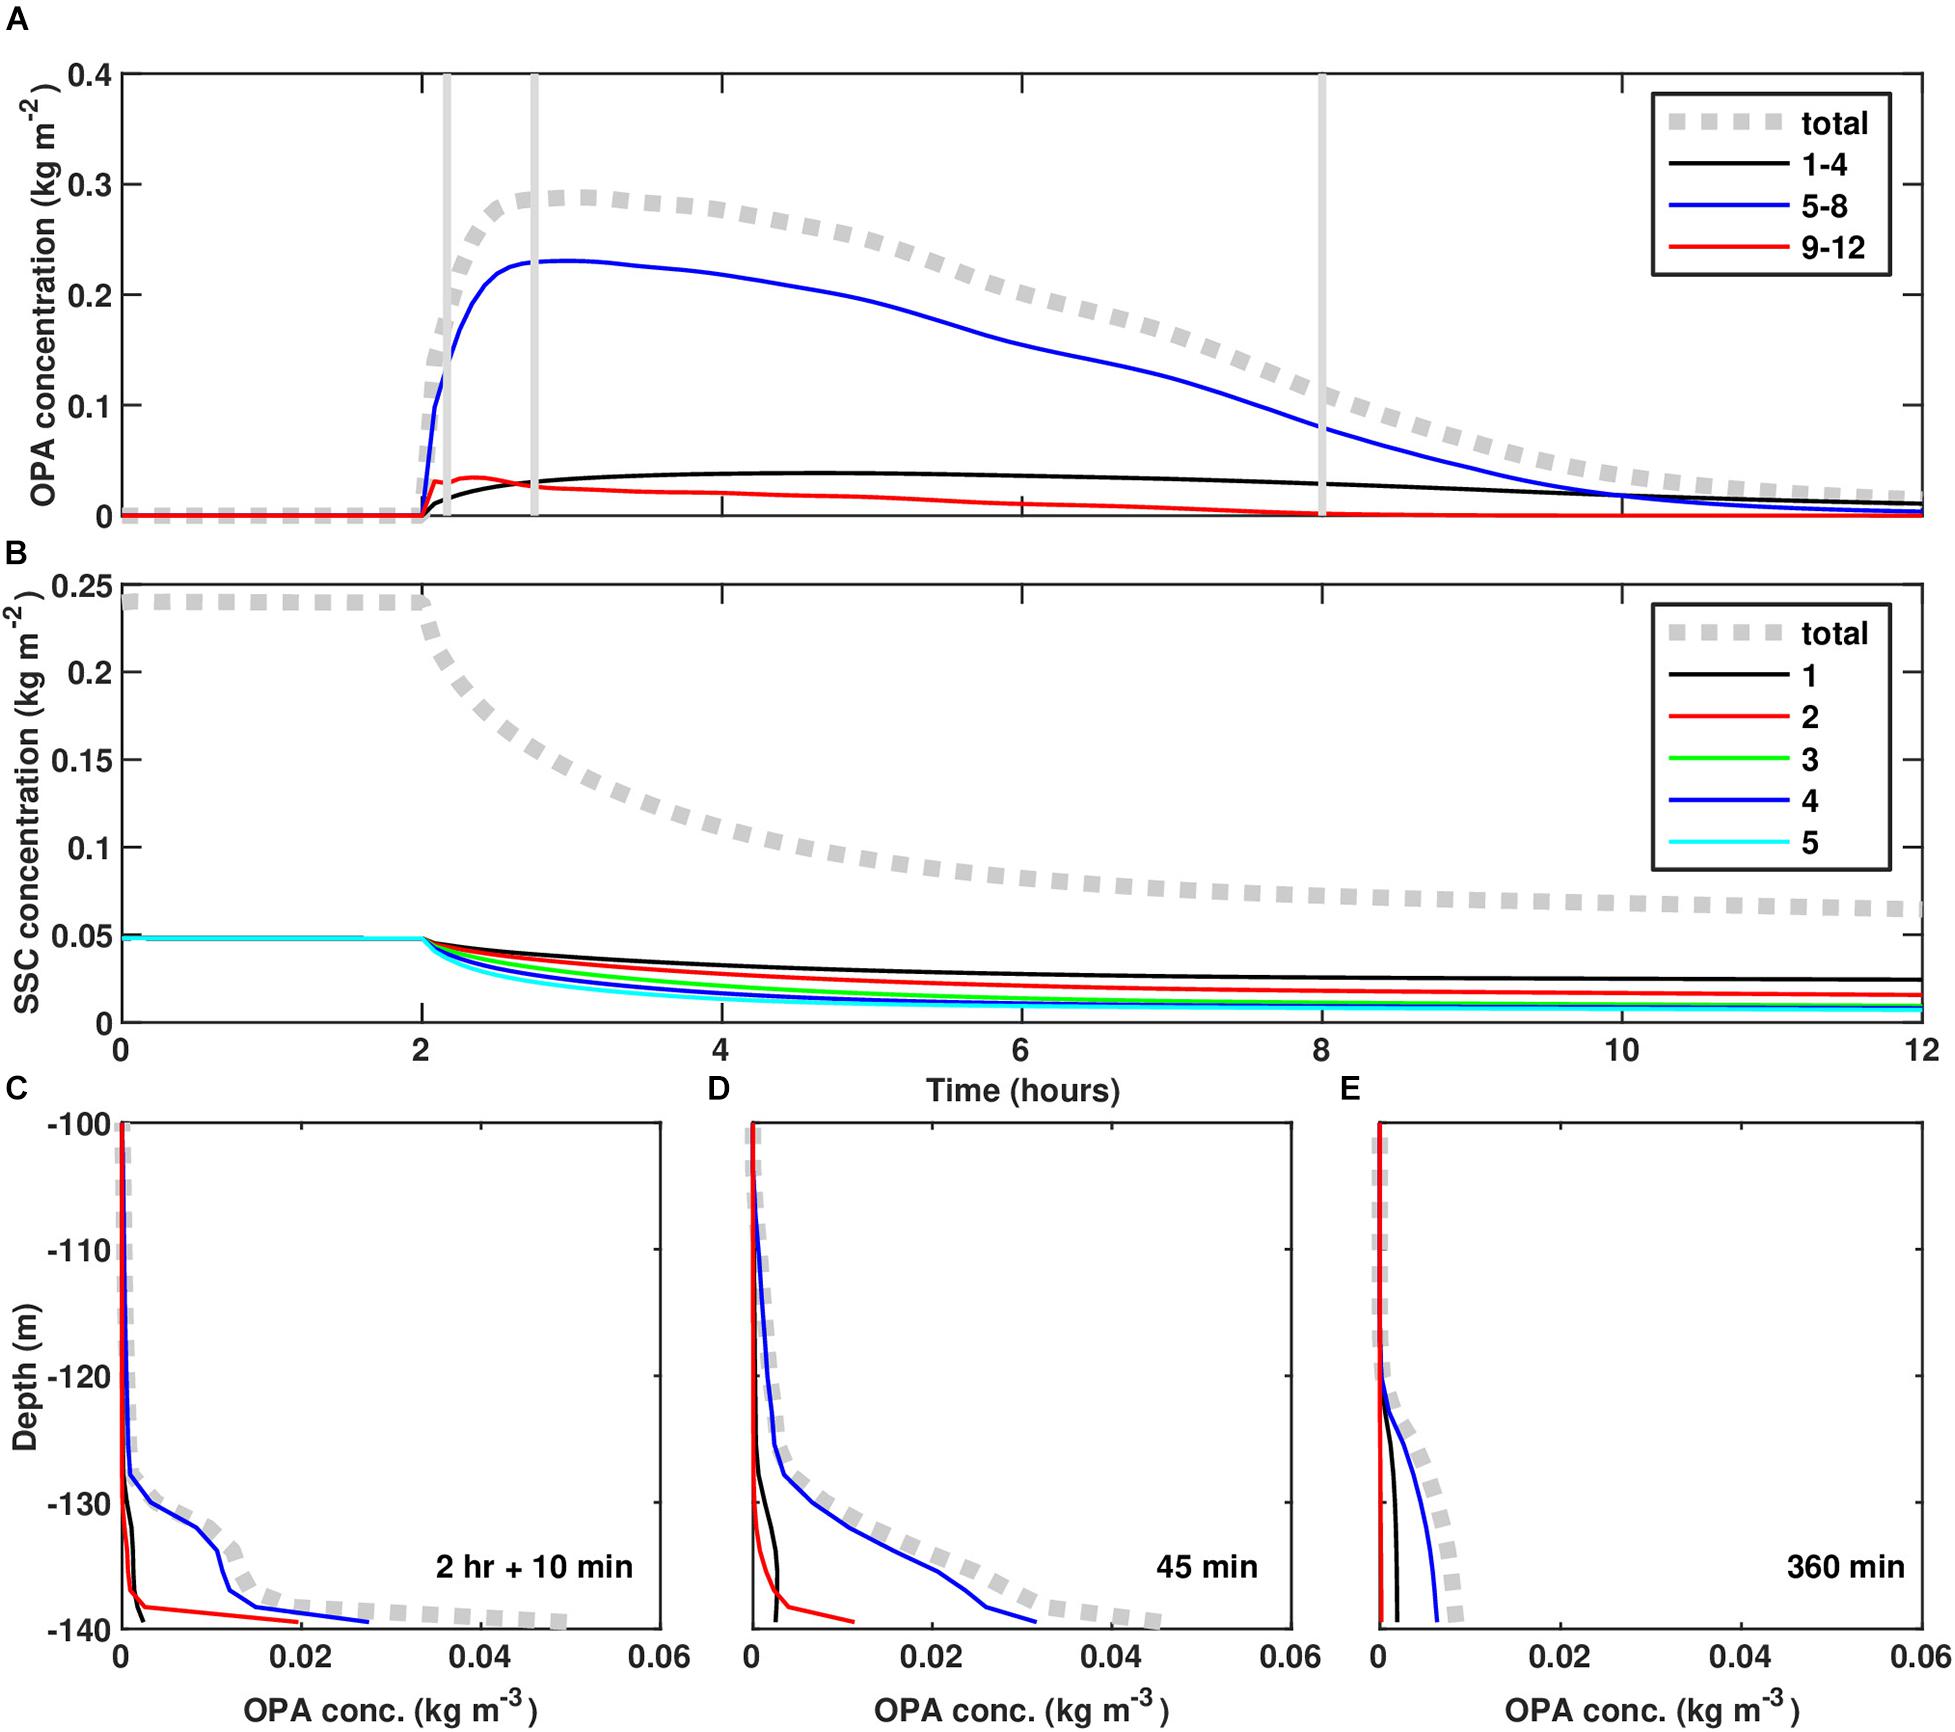
Figure 7. Time-series for the hurricane scenario of depth-integrated (A) OPA mass concentration and (B) SSC mass concentration. Profiles of OPA mass concentration at (C) 10 min, (D) 25 min, and (E) 360 min after activating OPAMOD, respectively. Lines in panels (C–E) share the same legend shown in panel (A), with dotted gray line representing the total OPA size classes, black line representing the OPA size classes from 1 to 4, blue line representing the OPA size classes from 5 to 8, and red line representing the OPA size classes from 9 to 12, respectively.
Vertical profiles of the OPA concentrations show that the aggregation process was evident in the bottom 40 m of water (Figures 7C–E). Directly after OPAMOD was initiated, OPA concentrations were especially high in the bottom few meters of the water column (Figure 7C) where sediment concentration was high (e.g., see Figure 6B) and turbulence was energetic (Figure 6C). The smaller classes of OPA (D < 180μm) were fairly well-mixed throughout the bottom boundary layer (black lines in Figures 7A,C–E), but did not reach high mass concentrations. The medium size classes of OPA (D = 180−360μm) dominated the presence of OPA, and were distributed through the bottom boundary layer (depths of ∼130–140 m in Figures 7C–E). The larger OPA (red lines in Figures 7A,C–E, D > 360μm) settled to the seafloor quickly.
River Plume Scenario
Next, the one-dimensional model was applied to examine how sediment from river discharge can affect OPA formation. The velocity and salinity forcing came from the same model simulation as in hurricane scenario (i.e., Harris et al., 2020), but conditions including velocities, salinity, and suspended sediment concentrations were extracted for a period in March of 2008 that had elevated river discharge. The maximum velocity was ∼ 0.8 m s–1 in the surface layer (Figure 8A). The vertical salinity profile reflected the influence of the Mississippi River plume in this locality, with a salinity difference greater than 10 PSU in the upper 20 m (Figure 8A). The suspended sediment concentration peaked near 30 m water depth, reaching ∼ 0.017 kg m–3 (Figure 8B). The initial oil concentration was the same as used in the hurricane scenario, again initialized to be vertically uniform at 0.2 kg m–3, based on Sammarco et al. (2013). The simulation period was 48 h, with the OPAMOD being activated after the first 2 h to allow for spin up of the hydrodynamic model.
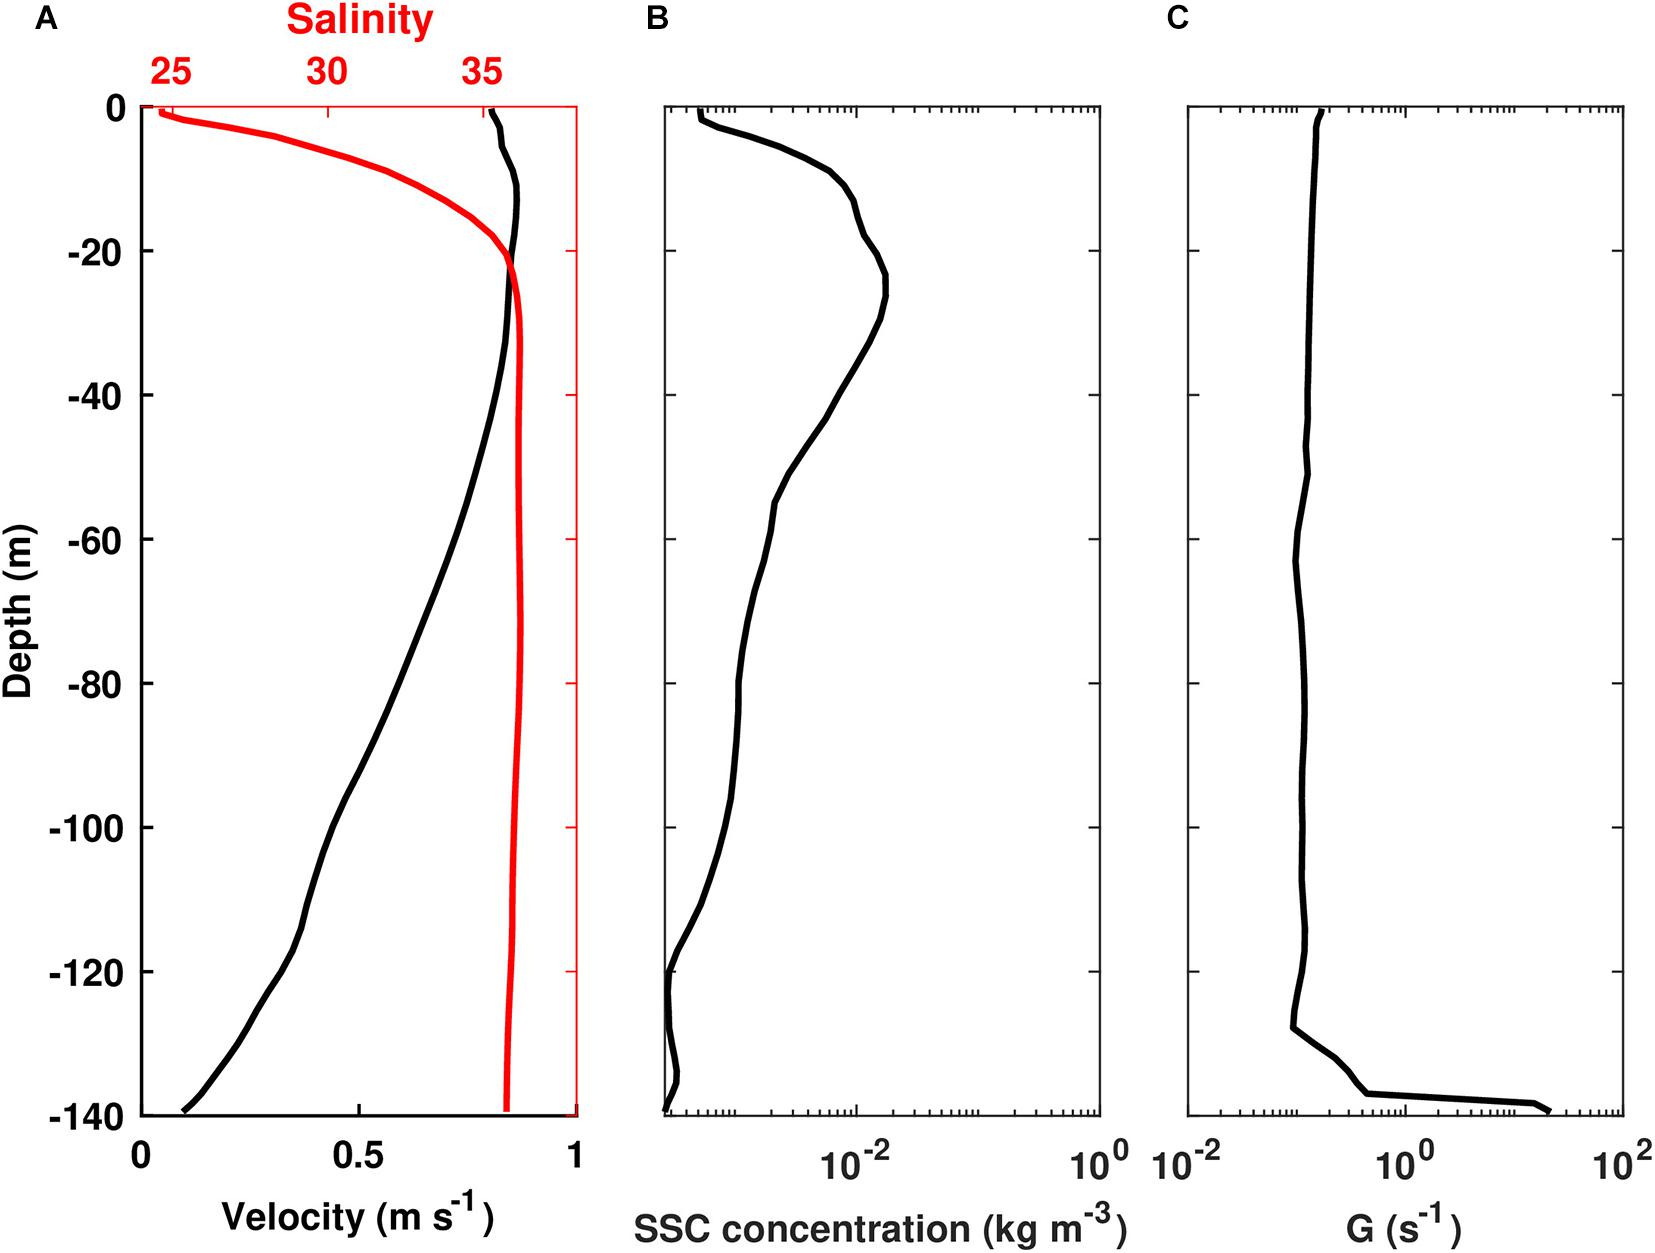
Figure 8. Profiles of (A) velocity and salinity, (B) initial suspended sediment mass concentration, and (C) shear rate for the river plume scenario (A,B are based on model output from Harris et al., 2020. C is from 1D model output).
Figures 9A,B show the depth-integrated OPA and suspended sediment mass concentrations, respectively. It took about 4 h for the mass concentration of suspended OPA to reach a maximum (Figure 9A, the first and second vertical gray lines). Suspended sediment mass concentrations began decreasing when OPAMOD was initiated (time = 2 h, Figure 9B), as sediment became incorporated into OPA. Then, for the next ∼30 h, the suspended sediment and OPA mass concentrations both decreased as sediment continued to be incorporated into OPA, and both OPA and sediment settled to the seafloor (Figure 9A). For the river plume case, the OPA mass concentrations were mainly distributed within the medium (D = 180−360μm), and larger (D > 360μm) sizes (red and blue lines in Figure 9A), though the medium sizes had a longer residence time in the water column.
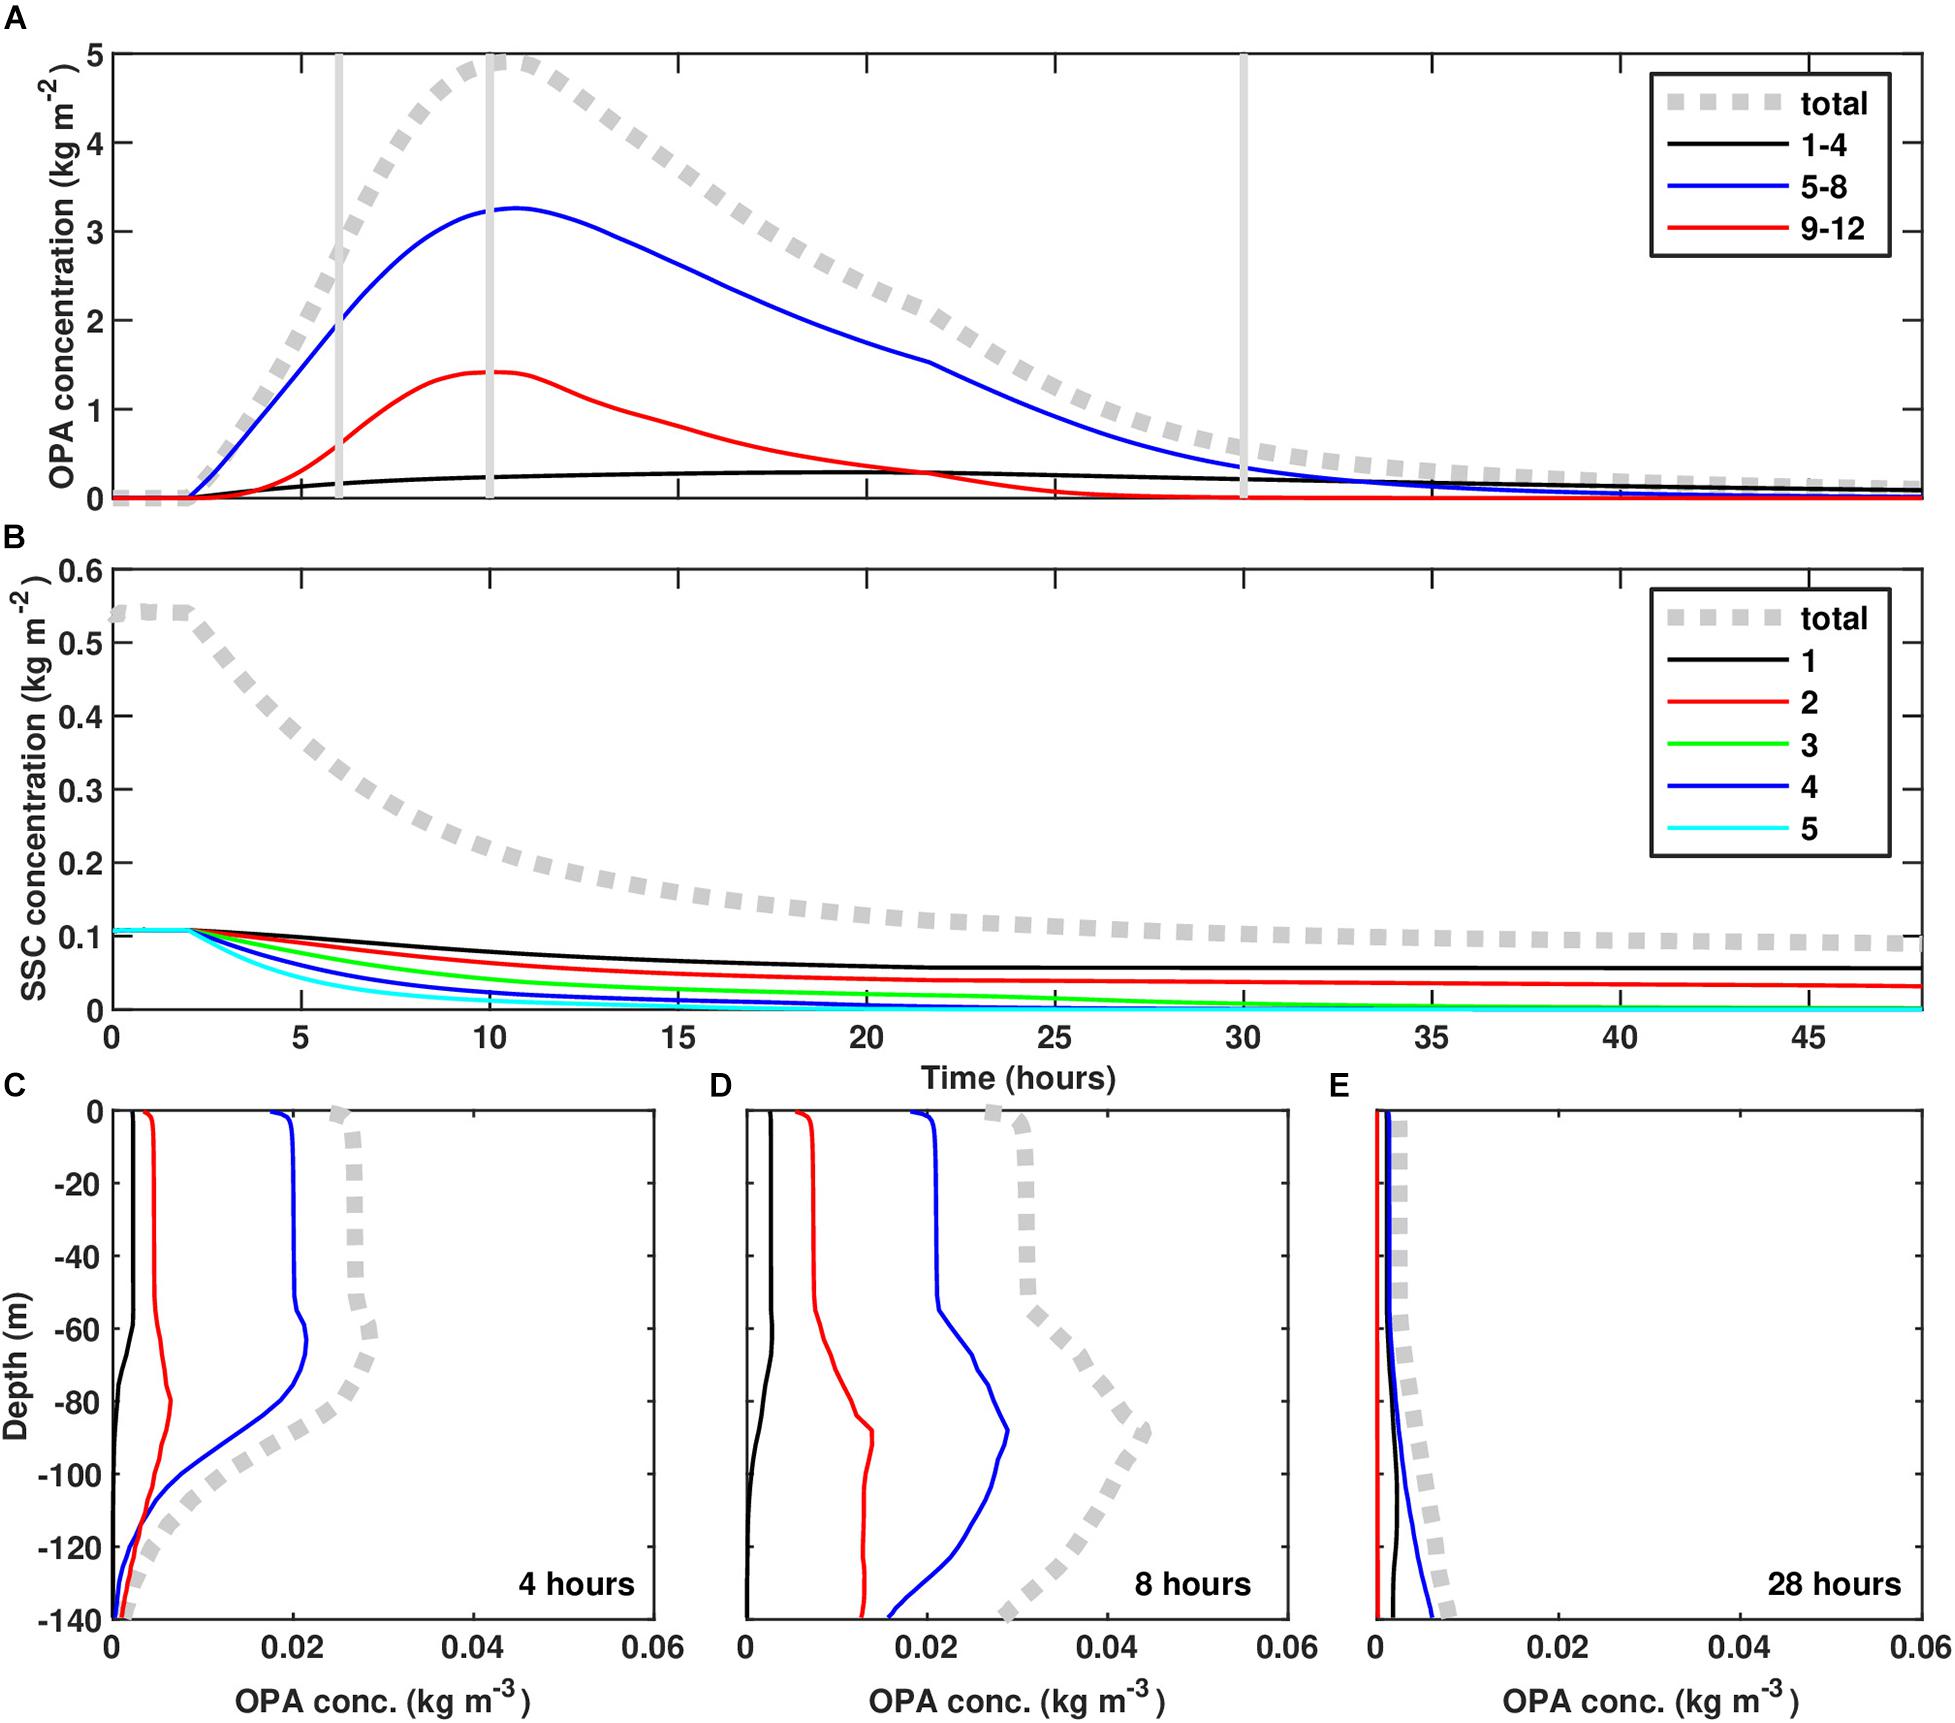
Figure 9. Time-series for the river plume scenario of depth-integrated (A) OPA mass concentration and (B) SSC mass concentration. Profiles of OPA concentration at (C) hour 4, (D) hour 8, and (E) hour 28 after activating OPAMOD, respectively. Lines in panels (C–E) share the same legend shown in panel (A), with dotted gray line representing the total OPA size classes, black line representing the OPA size classes from 1 to 4, blue line representing the OPA size classes from 5 to 8, and red line representing the OPA size classes from 9 to 12, respectively.
The vertical concentration profiles show that OPA were present throughout the water column (Figures 9C–E). Initially, elevated suspended OPA concentrations were formed in the upper water column, where suspended sediment was available, so that OPA appeared in the top 80 m of the water column (Figure 9C). The higher settling velocities of the OPA, relative to the suspended sediment, caused the OPA to sink out of surface waters, but they continued to grow by scavenging the residual oil in the water column. While the smaller OPA sizes (D < 180μm) were present in the freshwater plume, they did not reach large concentrations (Figures 9C–E), but instead served mainly to “seed” the growth of the larger sized OPAs. The medium and larger sizes reached notably high concentrations in the water column, and because they have relatively high settling velocities, provided a downward flux that resulted in elevated suspended OPA concentrations in the mid-water column (Figure 9D). After approximately 28 h, OPAs completely settled to the seafloor (Figure 9E).
Conclusion and Discussion
An oil-particle-aggregate module was developed and implemented in ROMS within the COAWST framework. Implementation of a quasi-zero-dimensional simulation demonstrated the ability to predict OPA formation and reproduce the particle size distribution observed in a laboratory study. Both the modeled and laboratory results showed that OPAs were dominated by small and medium sized aggregates (D≤360μm). Comparison with laboratory results showed that our implementation of OPAMOD in ROMS behaved reasonably, indicating that the model can be a useful tool in representing the removal of oil via OPA formation. Sensitivity tests were conducted to examine how the model responded to two parameters: fractal dimension and collision efficiency. Results showed that the modeled size distributions were much more sensitive to fractal dimension than collision efficiency. According to Equation 1, floc density varies with fractal dimension; when a smaller fractal dimension was assumed, the initial number concentrations of sediment increased, which encouraged the formation of more and larger OPA.
Simulations of OPA formation impacted by a surface river plume and a hurricane event were conducted by configuring a quasi-one-dimensional model using conditions based on a 140-m deep site near Mississippi River Delta. These two scenarios allowed us to compare the relative importance of surface suspended sediments associated with a freshwater plume to bottom nepheloid layer suspended sediments associated with a resuspension event. Model results showed that the plume conditions were more effective at forming OPAs and creating a deposition event of OPAs. The main difference between these two scenarios was the vertical distributions of suspended sediment. In the hurricane scenario, high sediment concentrations were located in a bottom nepheloid layer. Thus, newly formed OPAs quickly settled out of the water column. In comparison, suspended sediment concentration was high in the surface layer for the river plume scenario. OPAs formed in surface waters, which gave OPAs longer residence times in the water column. During settling, OPAs scavenged more residual oil and sediment in the water column. For comparison, the depth-integrated suspended sediment mass concentration (∼0.5 kg m–2, Figure 9B) in the river plume scenario was about double that of the hurricane scenario (Figure 9A), but the maximum depth-integrated OPA mass concentration (∼5 kg m–2, Figure 9B) in the river plume scenario was about 15 times greater than that in the hurricane scenario (Figure 7A). Additionally, in the river plume scenario, the OPA remained in the water column for a longer time period, because the settling distance was so much greater. This implies that OPA formation via river plume sediment would lead to a more widely dispersed depositional footprint, compared to OPA formation via storm resuspension. Additionally, because river plume generated OPAs had longer residence times in the water column compared to resuspension generated OPAs, they would have more opportunity for degradation via water column weathering and consumption prior to deposition.
The current study is the first attempt of integrating an OPA module within a coupled hydrodynamic and sediment transport model. The one-dimensional model was run for scenarios representative of conditions that could lead to OPA formation over the Gulf of Mexico continental slope. In order to fully represent the formation and dispersal of OPA, however, OPAMOD can be implemented within a model that also accounts for horizontal transport. This has been done within a three-dimensional, fully coupled model which included OPAMOD, developed by the Consortium for Simulation of Oil-Microbial Interactions in the Ocean (CSOMIO) (Dukhovskoy et al., 2021). Implemented to represent the transport and fate of oil sourced from an oil spill in the northern Gulf of Mexico, this three-dimensional model represented oil transformations and transport, biological processes and feedbacks with oil (Coles et al., 2020) and formation of OPA through OPAMOD. The full three-dimensional coupled model therefore accounts for water column transport of hydrocarbons, as well as biodegradation, and delivery to the seabed via OPAs (Dukhovskoy et al., 2021). For the case modeled, the source of oil was in very deep waters and the results showed that the feedbacks between microbial processes and oil were more significant than OPA formation (Dukhovskoy et al., 2021). We postulate that the OPA formation would be significant for cases where the source of oil was near a turbid river plume, as shown for our one-dimensional river plume scenario; or in shallower water where resuspension creates higher turbidity.
However, application of OPAMOD to scenarios that have the potential for resuspension would require further model development to account for the resuspension of OPA and potential breakup of OPA under energetic conditions. For the current implementations, we set the erosion parameters for OPA to be very large so that resuspension would not occur. However, previously deposited OPA might be resuspended later, under more energetic conditions, thus providing a source of contamination some time after the initial contamination event. The model is equipped to account for resuspension, but would require proper parameterization of critical shear stress and the erosion rate parameter (Warner et al., 2008; Sherwood et al., 2018), from field or laboratory studies. Including OPA breakup would be more difficult, because the mass balance equations would need to specify the products formed by the disaggregation of large OPA. Within FLOCMOD, the fragmentation distribution function (FDBS) specifies how sediment mass from a larger floc is distributed into smaller flocs upon breakup (Verney et al., 2011; Sherwood et al., 2018). Similarly, inclusion of OPA breakup would require specification of how to partition the oil and sediment mass into smaller OPA, and / or sediment or oil classes.
The current formulation of OPAMOD also does not account for interactions between the biogenic detritus, oil, and sediment, which have been shown to form MOSSFA (Vonk et al., 2015; Quigg et al., 2020). Additionally, recent laboratory studies have shown that the collision efficiency for OPA formation may be sensitive to organic content of the particles (Ye et al., 2021). Adding coupling between the sediment, OPA, and biological modules within the CSOMIO model (Dukhovskoy et al., 2021) would be relatively straightforward because all of these components have been coded within the ROMS and COAWST frameworks. This model could become an important tool in determining the fate of oil and prediction of the impact of future oil spills.
Data Availability Statement
The datasets presented in this study can be found on an online repository. The name of the repository/repositories and accession numbers can be found below: https://data.gulfresearchinitiative.org/. The dataset page is https://data.gulfresearchinitiative.org/data/R6.x803.000:0009.
Author Contributions
LC, CH, and DT: conceptualization and writing-review and editing. LC and CH: methodology. LC: model development, implementation, analysis, and writing-original draft preparation. CH: supervision and funding acquisition. All authors have read and agreed to the published version of the manuscript.
Funding
This research was made possible by a grant from the Gulf of Mexico Research Initiative to support CSOMIO (Consortium for Simulation of Oil-Microbial Interactions in the Ocean) (GoMRI Award R01983).
Conflict of Interest
The authors declare that the research was conducted in the absence of any commercial or financial relationships that could be construed as a potential conflict of interest.
Acknowledgments
Leiping Ye (Sun Yat-sen University) provided laboratory data from his publications. The authors appreciate input from the CSOMIO group during model development, including Eric Chassignet, Dmitry Dukhovskoy, Tian-Jian Hsu, Andrew Manning, and Steve Morey. We appreciate input from the two reviewers, which greatly helped us to improve the manuscript. The authors acknowledge William and Mary Research Computing (https://www.wm.edu/it/rc) for providing computational resources that have contributed to the results reported within this paper. This paper is Contribution No. 4007 of the Virginia Institute of Marine Science, William & Mary.
References
Bam, W., Hooper-Bui, L. M., Strecker, R. M., Adhikari, P. L., and Overton, E. B. (2018). Coupled effects of oil spill and hurricane on saltmarsh terrestrial arthropods. PLos One 13:e0194941. doi: 10.1371/journal.pone.0194941
Bandara, U. C., Yapa, P. D., and Xie, H. (2011). Fate and transport of oil in sediment laden marine waters. J. Hydro Environ. Res. 5, 145–156. doi: 10.1016/j.jher.2011.03.002
Boehm, P. D. (1987). “Transport and transformation processes regarding hydrocarbon and metal pollutants in offshore sedimentary environments,” in Long-Term Environmental Effects of Offshore Oil and Gas Development, eds D. F. Boesch and N. N. Rabalais (London: Elsevier Appled Science), 233–287.
Brown, D. P., Beven, J. L., Franklin, J. L., and Blake, E. S. (2010). Atlantic hurricane season of 2008∗. Mon. Weather Rev. 138, 1975–2001. doi: 10.1175/2009mwr3174.1
Burd, A. B., and Jackson, G. A. (2009). Particle Aggregation. Ann. Rev. Mar. Sci. 1, 65–90. doi: 10.1146/annurev.marine.010908.163904
Coles, V. J., Wang, J., Mason, O., and Stukel, M. R. (2020). Understanding how emergent community trait-based modeling (genome-based emergent ocean microbial ecosystem model) influences biogeochemical, ecological, and microbial system responses. Paper Presented at the 2020 Ocean Science Meeting, San Diego, CA.
Daly, K. L., Passow, U., Chanton, J., and Hollander, D. (2016). Assessing the impacts of oil-associated marine snow formation and sedimentation during and after the deepwater Horizon oil spill. Anthropocene 13, 18–33. doi: 10.1016/j.ancene.2016.01.006
Danchuk, S., and Willson, C. S. (2011). Influence of seasonal variability of lower Mississippi River discharge, temperature, suspended sediments, and salinity on oil-mineral aggregate formation. Water Environ. Res. 83, 579–587. doi: 10.2175/106143010x12780288628453
Dissanayake, A. L., Burd, A. B., Daly, K. L., Francis, S., and Passow, U. (2018). Numerical modeling of the interactions of oil, marine snow, and riverine sediments in the ocean. J. Geophys. Res. Oceans 123, 5388–5405. doi: 10.1029/2018JC013790
Dukhovskoy, D. S., Morey, S. L., Chassignet, E. P., Chen, X., Coles, V. J., Cui, L., et al. (2021). Development of the CSOMIO coupled ocean-oil-sediment- biology model. Front. Mar. Sci. 8:629299. doi: 10.3389/fmars.2021.629299
Dyer, K. R., and Manning, A. J. (1999). Observation of the size, settling velocity and effective density of flocs, and their fractal dimensions. J. Sea Res. 41, 87–95. doi: 10.1016/S1385-1101(98)00036-7
Fennel, K., Wilkin, J., Levin, J., Moisan, J., O’Reilly, J., and Haidvogel, D. (2006). Nitrogen cycling in the Middle Atlantic Bight: results from a three-dimensional model and implications for the North Atlantic nitrogen budget. Glob. Biogeochem. Cycles 20: GB3007. doi: 10.1029/2005GB002456
Fitzpatrick, F. A., Boufadel, M. C., Johnson, R., Lee, K. W., Graan, T. P., Bejarano, A. C., et al. (2015). Oil-Particle Interactions and Submergence From Crude Oil Spills in Marine and Freshwater Environments: Review of the Science and Future Research Needs: Open-File Report. Reston, VA: USGS.
Guyomarch, J., Le Floch, S., and Merlin, F.-X. (2002). Effect of suspended mineral load, water salinity and oil type on the size of oil–mineral aggregates in the presence of chemical dispersant. Spill Sci. Technol. Bull. 8, 95–100. doi: 10.1016/S1353-2561(02)00118-4
Haidvogel, D. B., Arango, H., Budgell, W. P., Cornuelle, B. D., Curchitser, E., Di Lorenzo, E., et al. (2008). Ocean forecasting in terrain-following coordinates: formulation and skill assessment of the regional ocean modeling system. J. Comput. Phys. 227, 3595–3624. doi: 10.1016/j.jcp.2007.06.016
Harris, C. K., Syvitski, J., Arango, H. G., Meiburg, E. H., Cohen, S., Jenkins, C. J., et al. (2020). Data-driven, multi-model workflow suggests strong influence from hurricanes on the generation of turbidity currents in the Gulf of Mexico. J. Mar. Sci. Eng. 8:28. doi: 10.3390/jmse8080586
Jaisi, D. P., Ji, S., Dong, H., Blake, R. E., Eberl, D. D., and Kim, J. (2008). Role of microbial Fe(III) reduction and solution chemistry in aggregation and settling of suspended particles in the Mississippi river delta plain, Louisiana, USA. Clays Clay Miner. 56, 416–428. doi: 10.1346/CCMN.2008.0560403
Jarvis, P., Jefferson, B., and Parsons, S. A. (2005). How the natural organic matter to coagulant ratio impacts on floc structural properties. Environ. Sci. Technol. 39, 8919–8924. doi: 10.1021/es0510616
Khelifa, A., Fingas, M., and Brown, C. A. (2008). Effects of Dispersants On Oil-SPM Aggregation and Fate in US Coastal Waters. Final Report Grant Number. NA04NOS4190063. Ottawa, ON: The Coastal Response Research Center.
Khelifa, A., and Hill, P. S. (2006). Models for effective density and settling velocity of flocs. J. Hydraul. Res. 44, 390–401. doi: 10.1080/00221686.2006.9521690
Kranenburg, C. (1994). The fractal structure of cohesive sediment aggregates. Estuar. Coast. Shelf Sci. 39, 451–460. doi: 10.1006/ecss.1994.1075
Lee, D. G., Bonner, J. S., Garton, L. S., Ernest, A. N. S., and Autenrieth, R. L. (2002). Modeling coagulation kinetics incorporating fractal theories: comparison with observed data. Water Res. 36, 1056–1066. doi: 10.1016/S0043-1354(01)00281-0
Lee, K. (2002). Oil–particle interactions in aquatic environments: influence on the transport, fate, effect and remediation of oil spills. Spill Sci. Technol. Bull. 8, 3–8. doi: 10.1016/S1353-2561(03)00006-9
Lee, K., Lunel, T., Wood, P., Swannell, R., and Stoffyn-Egli, P. (1997). Shoreline cleanup by acceleration of clay-oil flocculation processes. Int. Oil Spill Conf. Proc. 1997, 235–240. doi: 10.7901/2169-3358-1997-1-235
Lee, K., and Stoffyn-Egli, P. (2001). Characterization of oil-mineral aggregates. Int. Oil Spill Conf. Proc. 2001, 991–996. doi: 10.7901/2169-3358-2001-2-991
Lick, W., Lick, J., and Ziegler, C. K. (1992). Flocculation and its effect on the vertical transport of fine-grained sediments. Hydrobiologia 235, 1–16. doi: 10.1007/BF00026196
Logan, B. E., and Kilps, J. R. (1995). Fractal dimensions of aggregates formed in different fluid mechanical environments. Water Res. 29, 443–453. doi: 10.1016/0043-1354(94)00186-B
MacDonald, I. R., Taylor, J. C., Roa, C., and O’Reilly, C. (2019). “Chapter 8. Estimates of oil flux to the ocean at MC20 using optical and acoustical methods,” in An Integrated Assessment of Oil and Gas Release into the Marine Environment at the Former Taylor Energy MC20 Site. NOAA National Ocean Service, National Centers for Coastal Ocean Science. NOAA Technical Memorandum 260, eds A. L. Mason, J. C. Taylor, and I. R. MacDonald (Silver Spring, MD: NCCOS), 107–118.
Martin, C. W., Lewis, K. A., McDonald, A. M., Spearman, T. P., Alford, S. B., Christian, R. C., et al. (2020). Disturbance-driven changes to northern Gulf of Mexico nekton communities following the deepwater horizon oil spill. Mar. Pollut. Bull. 155:111098. doi: 10.1016/j.marpolbul.2020.111098
Mason, A. L. (2019). An Integrated Assessment of Oil and Gas Release into the Marine Environment at the Former Taylor Energy MC20 Site. NOAA Technical Memorandum NOS NCCOS 260. Silver Spring, MD: NCCOS, 147. doi: 10.25923/kykm-sn39
Nixon, Z., Zengel, S., Baker, M., Steinhoff, M., Fricano, G., Rouhani, S., et al. (2016). Shoreline oiling from the deepwater horizon oil spill. Mar. Pollut. Bull. 107, 170–178. doi: 10.1016/j.marpolbul.2016.04.003
Payne, J. R., Clayton, J. R., and Kirstein, B. E. (2003). Oil/suspended particulate material interactions and sedimentation. Spill Sci. Technol. Bull. 8, 201–221. doi: 10.1016/S1353-2561(03)00048-3
Perry, J. D., Gostomski, E., Matthews, L. S., and Hyde, T. W. (2012). The influence of monomer shape on aggregate morphologies. Astron. Astrophys. 539:7. doi: 10.1051/0004-6361/201117940
Quigg, A., Passow, U., Daly, K. L., Burd, A., Hollander, D. J., Schwing, P. T., et al. (2020). “Marine oil snow sedimentation and flocculent accumulation (MOSSFA) events: learning from the past to predict the future,” in Deep Oil Spills: Facts, Fate, and Effects, eds S. A. Murawski, C. H. Ainsworth, S. Gilbert, D. J. Hollander, C. B. Paris, M. Schlüter, et al. (Cham: Springer International Publishing), 196–220.
Robinson, E. M., and Rabalais, N. N. (2019). The effects of oil on blue crab and periwinkle snail interactions: a mesocosm study. J. Exp. Mar. Biol. Ecol. 517, 34–39. doi: 10.1016/j.jembe.2019.05.012
Sammarco, P. W., Kolian, S. R., Warby, R. A. F., Bouldin, J. L., Subra, W. A., and Porter, S. A. (2013). Distribution and concentrations of petroleum hydrocarbons associated with the BP/deepwater horizon oil spill. Gulf Mexico. Mar. Pollut. Bull. 73, 129–143. doi: 10.1016/j.marpolbul.2013.05.029
Shchepetkin, A. F., and McWilliams, J. C. (2005). The regional oceanic modeling system (ROMS): a split-explicit, free-surface, topography-following-coordinate oceanic model. Ocean Modell. 9, 347–404. doi: 10.1016/j.ocemod.2004.08.002
Sherwood, C. R., Aretxabaleta, A. L., Harris, C. K., Rinehimer, J. P., Verney, R., and Ferré, B. (2018). Cohesive and mixed sediment in the regional ocean modeling system (ROMS v3.6) implemented in the coupled ocean–atmosphere–wave–sediment transport modeling system (COAWST r1234). Geosci. Model Dev. 11, 1849–1871. doi: 10.5194/gmd-11-1849-2018
Sterling, M. C., Bonner, J. S., Page, C. A., Fuller, C. B., Ernest, A. N. S., and Autenrieth, R. L. (2004). Modeling crude oil droplet-sediment aggregation in nearshore waters. Environ. Sci. Technol. 38, 4627–4634. doi: 10.1021/es035467z
Stoffyn-Egli, P., and Lee, K. (2002). Formation and characterization of oil–mineral aggregates. Spill Sci. Technol. Bull. 8, 31–44. doi: 10.1016/S1353-2561(02)00128-7
Tambo, N., and Hozumi, H. (1979). Physical characteristics of flocs—II. Strength floc Water Res. 13, 421–427. doi: 10.1016/0043-1354(79)90034-4
Tarpley, D. R. N., Harris, C. K., Friedrichs, C. T., and Sherwood, C. R. (2019). Tidal variation in cohesive sediment distribution and sensitivity to flocculation and bed consolidation in an idealized, partially mixed estuary. J. Mar. Sci. Eng. 7:334. doi: 10.3390/jmse7100334
Thorne, C., Harmar, O., Watson, C., Clifford, N., Biedenham, D., and Measures, R. (2008). Current and Historical Sediment Loads in the Lower Mississippi River. (University of Nottingham School of Geography, Final Report to US Army European Research Office, London, Under Contract 1106- EN-01) Nottingham: University of Nottingham School of Geography.
Valentine, D. L., Fisher, G. B., Bagby, S. C., Nelson, R. K., Reddy, C. M., Sylva, S. P., et al. (2014). Fallout plume of submerged oil from deepwater horizon. Proc. Natl. Acad. Sci. 111:15906. doi: 10.1073/pnas.1414873111
Verney, R., Lafite, R., Brun-Cottan, J. C., and Le Hir, P. (2011). Behaviour of a floc population during a tidal cycle: laboratory experiments and numerical modelling. Cont. Shelf Res. 31, S64–S83. doi: 10.1016/j.csr.2010.02.005
Vonk, S. M., Hollander, D. J., and Murk, A. J. (2015). Was the extreme and wide-spread marine oil-snow sedimentation and flocculent accumulation (MOSSFA) event during the deepwater horizon blow-out unique? Mar. Pollut. Bull. 100, 5–12. doi: 10.1016/j.marpolbul.2015.08.023
Warner, J. C., Armstrong, B., He, R., and Zambon, J. B. (2010). Development of a coupled ocean–atmosphere–wave–sediment transport (COAWST) modeling system. Ocean Modell. 35, 230–244. doi: 10.1016/j.ocemod.2010.07.010
Warner, J. C., Sherwood, C. R., Signell, R. P., Harris, C. K., and Arango, H. G. (2008). Development of a three-dimensional, regional, coupled wave, current, and sediment-transport model. Comput. Geosci. 34, 1284–1306. doi: 10.1016/j.cageo.2008.02.012
Wiesner, M. R. (1992). Kinetics of aggregate formation in rapid mix. Water Res. 26, 379–387. doi: 10.1016/0043-1354(92)90035-3
Winterwerp, J. C. (1998). A simple model for turbulence induced flocculation of cohesive sediment. J. Hydraul. Res. 36, 309–326. doi: 10.1080/00221689809498621
Winterwerp, J. C., Manning, A. J., Martens, C., de Mulder, T., and Vanlede, J. (2006). A heuristic formula for turbulence-induced flocculation of cohesive sediment. Estuar. Coast. Shelf Sci. 68, 195–207. doi: 10.1016/j.ecss.2006.02.003
Xu, K., Harris, C. K., Hetland, R. D., and Kaihatu, J. M. (2011). Dispersal of Mississippi and Atchafalaya sediment on the Texas–Louisiana shelf: model estimates for the year 1993. Cont. Shelf Res. 31, 1558–1575. doi: 10.1016/j.csr.2011.05.008
Ye, L., Manning, A. J., Holyoke, J., Penaloza-Giraldo, J. A., and Hsu, T.-J. (2021). The role of biophysical stickiness on oil-mineral flocculation and settling in seawater. Front. Mar. Sci. 8:628827. doi: 10.3389/fmars.2021.628827
Ye, L., Manning, A. J., and Hsu, T.-J. (2020). Oil-mineral flocculation and settling velocity in saline water. Water Res. 173:115569. doi: 10.1016/j.watres.2020.115569
Zhao, L., Boufadel, M. C., Geng, X., Lee, K., King, T., Robinson, B. H., et al. (2016). A-DROP: a predictive model for the formation of oil particle aggregates (OPAs). Mar. Pollut. Bull. 106, 245–259. doi: 10.1016/j.marpolbul.2016.02.057
Keywords: oil-particle aggregates, flocculation, fractal dimension, numerical modeling, oil spill
Citation: Cui L, Harris CK and Tarpley DRN (2021) Formation of Oil-Particle-Aggregates: Numerical Model Formulation and Calibration. Front. Mar. Sci. 8:629476. doi: 10.3389/fmars.2021.629476
Received: 14 November 2020; Accepted: 14 April 2021;
Published: 13 May 2021.
Edited by:
Andrew James Manning, HR Wallingford, United KingdomReviewed by:
Byung Joon Lee, Kyungpook National University, South KoreaJunhong Liang, Louisiana State University, United States
Copyright © 2021 Cui, Harris and Tarpley. This is an open-access article distributed under the terms of the Creative Commons Attribution License (CC BY). The use, distribution or reproduction in other forums is permitted, provided the original author(s) and the copyright owner(s) are credited and that the original publication in this journal is cited, in accordance with accepted academic practice. No use, distribution or reproduction is permitted which does not comply with these terms.
*Correspondence: Linlin Cui, bGN1aUB2aW1zLmVkdQ==; Courtney K. Harris, Y2toYXJyaXNAdmltcy5lZHU=