 Vonda J. Cummings
 David A. Bowden
 Matthew H. Pinkerton
 N. Jane Halliday1
- 1National Institute of Water and Atmospheric Research, Wellington, New Zealand
- 2National Institute of Water and Atmospheric Research, Hamilton, New Zealand
- 3Department of Statistics, University of Auckland, Auckland, New Zealand
The Ross Sea, Antarctica, is amongst the least human-impacted marine environments, and the site of the world’s largest Marine Protected Area. We present research on two components of the Ross Sea benthic fauna: mega-epifauna, and macro-infauna, sampled using video and multicore, respectively, on the continental shelf and in previously unsampled habitats on the northern continental slope and abyssal plain. We describe physical habitat characteristics and community composition, in terms of faunal diversity, abundance, and functional traits, and compare similarities within and between habitats. We also examine relationships between faunal distributions and ice cover and productivity, using summaries of satellite-derived data over the decade prior to our sampling. Clear differences in seafloor characteristics and communities were noted between environments. Seafloor substrates were more diverse on the Slope and Abyss, while taxa were generally more diverse on the Shelf. Mega-epifauna were predominantly suspension feeders across the Shelf and Slope, with deposit feeder-grazers found in higher or equal abundances in the Abyss. In contrast, suspension feeders were the least common macro-infaunal feeding type on the Shelf and Slope. Concordance between the mega-epifauna and macro-infauna data suggests that non-destructive video sampling of mega-epifauna can be used to indicate likely composition of macro-infauna, at larger spatial scales, at least. Primary productivity, seabed organic flux, and sea ice concentrations, and their variability over time, were important structuring factors for both community types. This illustrates the importance of better understanding bentho-pelagic coupling and incorporating this in biogeographic and process-distribution models, to enable meaningful predictions of how these ecosystems may be impacted by projected environmental changes. This study has enhanced our understanding of the distributions and functions of seabed habitats and fauna inside and outside the Ross Sea MPA boundaries, expanding the baseline dataset against which the success of the MPA, as well as variability and change in benthic communities can be evaluated longer term.
Introduction
Climate change is considered the greatest anthropogenic threat to Antarctic ecosystems (Gutt et al., 2020). Antarctica and its biota are highly sensitive to environmental changes, due in part to the biota’s narrow tolerance range to a number of environmental features (e.g., temperature; Peck, 2005; Pörtner et al., 2007; Peck et al., 2010). Warming, and its influence on sea ice dynamics is anticipated to reduce sea ice coverage and alter ocean circulation, affecting key processes such as biogeochemical and nutrient cycling and increasing primary production (e.g., Stammerjohn et al., 2008, 2012; Jacobs and Giulivi, 2010). Convey et al. (2014) found that ice cover, ice scour, salinity, and productivity are the most important determinants of marine habitat and community level diversity at smaller spatial scales. This view is supported by data from the Ross Sea shelf and coastal areas (e.g., Thrush et al., 2006; Kröger and Rowden, 2008; Dayton et al., 2013; Rowden et al., 2015). Along with impacts of ocean acidification (Orr et al., 2005; Aronson et al., 2011), effects of climate change on species composition, productivity, phenology and predator-prey interactions in these changing environments are considered imminent (Doney et al., 2012). Indeed, sea ice retreat and ocean warming along the Western Antarctic Peninsula has already resulted in increased algal blooms (Moreau et al., 2015), and changes in the distributions of krill (Steinberg et al., 2015), penguins (Ducklow et al., 2013), and king crabs (Smith et al., 2012; Griffiths et al., 2013) in recent decades.
Interannual variability in Southern Ocean primary production is strongly controlled by changes in sea ice cover (Arrigo et al., 2008, 2015), which also regulates particle flux to the seafloor (Isla, 2016; Deppeler and Davidson, 2017; Henley et al., 2020). The influence of productivity on benthic biomass and abundance in food limited Antarctic ecosystems has been repeatedly demonstrated (e.g., Brey and Clarke, 1993). Suspension feeders in particular have been shown to respond quickly to decreases in productivity associated with reductions in sea ice (Pineda-Metz et al., 2020) due to their more direct link to pelagic production than other feeding guilds (e.g., Smith et al., 2006; Dayton et al., 2013; Sumida et al., 2014). Patterns in the distributions of benthos (abundance, community composition, functional groups) will likely reflect sea ice conditions and water circulation and provide a strong correlative tool for changes in food supply over time (Thrush and Cummings, 2011; Dayton et al., 2019; Kim et al., 2019).
The Ross Sea is a large Antarctic embayment centered at 180° S. Its continental shelf – the largest and widest in Antarctica – covers 466,000 km2, with an average depth of 530 m and a depth range of 200–1200 m (Smith et al., 2012). Despite commercial hunting of whales and seals in the 19th and 20th centuries, and toothfish in the 21st, the Ross Sea is amongst the least human-impacted marine environments worldwide, due largely to its remoteness, intense seasonality, and extensive ice cover (e.g., Halpern et al., 2008), which make access difficult. The Ross Sea shelf has been sampled by biologists, geologists, and oceanographers since the earliest days of Antarctic exploration and consequently has a relatively well-known benthic fauna by comparison with other regions of the Antarctic (Bullivant, 1959; Bullivant and Dearborn, 1967; Dayton et al., 1974; Barry et al., 2003; Cummings et al., 2010; Barnes et al., 2011). In places, this fauna is rich and the area is considered a ‘biodiversity hotspot’ (Clarke and Johnston, 2003). The benthic biota of the Ross Sea slope and abyssal environments, however, have had little scientific study (Arntz et al., 1994; Clarke and Johnston, 2003; Brandt et al., 2007). In December 2018, the world’s largest marine protected area (MPA) (CCAMLR, 2016) was established in the Ross Sea region, encompassing shelf, slope, seamount, and abyssal environments. Documenting baseline information on the composition, distribution and functioning of ecological communities within the MPA boundaries is a priority for understanding how well the MPA meets its objectives of conserving ecological structure and function, protecting representative portions of benthic environments, and protecting rare or vulnerable seabed habitats (CCAMLR, 2016). A key aspect of the MPA is that it should enable a scientific research and monitoring program that will improve understanding of the effects of natural and anthropogenic change on the ecosystem (CCAMLR, 2016). A fundamental requirement for any understanding of such change is baseline information about the current status of key ecosystem components.
Here, we present research on two components of the Ross Sea benthic fauna: mega-epifauna, and macro-infauna, sampled at sites on the continental shelf, northern continental slope and the abyssal plain during New Zealand’s International Polar Year research voyage (RV Tangaroa). This research builds and expands on earlier studies of benthic fauna in the Ross Sea by extending sampling beyond the continental shelf to deeper, previously unsampled habitats. We examine patterns in diversity, abundance, and function across the three major environments: (1) continental shelf; (2) continental slope, and (3) abyssal plain. In these three areas, we also explore relationships between the presence of mega-epifauna and macro-infauna to local habitat characteristics. We are particularly interested in the extent to which spatial patterns in benthic community composition concur between mega- and macrofaunal groups, with the aim of assessing whether surface dwelling mega-epifauna can be used to indicate likely composition of the more cryptic (and difficult to sample) macro-infauna.
Relationships between benthic communities and broader spatial and temporal patterns in sea ice conditions were also examined. Sea ice cover in the western Ross Sea increased between 1979 and 2016, with a longer ice-covered season, a later sea ice retreat (∼1 month) and an earlier advance (∼1–2 months) (Stammerjohn and Maksym, 2017). Since 2017, with 2 years of low ice cover, these trends are no longer statistically significant (except for in autumn) (Maksym, 2019). Against this backdrop of change, we provide an initial assessment of the influence of sea ice conditions in conjunction with changes to primary production and organic flux to the seabed, on benthic community characteristics (abundance, composition).
Materials and Methods
Sample Collection and Processing
Mega-epifaunal and macro-infaunal assemblages, and substrate characteristics were investigated at 21 sites across the Ross Sea continental shelf (eight sites), northern continental slope (10 sites), and northern abyssal plain (three sites) in February 2008 (Figure 1 and Table 1). At 15 of these sites (‘Core’ sites, prefix ‘C’), one towed camera transect, one beam trawl tow, and one or two multicorer deployments were conducted. At the remaining six sites (‘Demersal’ sites, prefix ‘D’) only the towed camera and the beam trawl were deployed. Towed camera transects and beam trawl samples were analyzed for the identities and abundances of mega-epifauna (>ca. 50 mm), and categorical descriptors of substrate type. Multicorer samples were analyzed for macro-infaunal (>300 μm) assemblages and sediment characteristics. Details of the sampling devices, and methods used for determination of the different community components, are provided below.
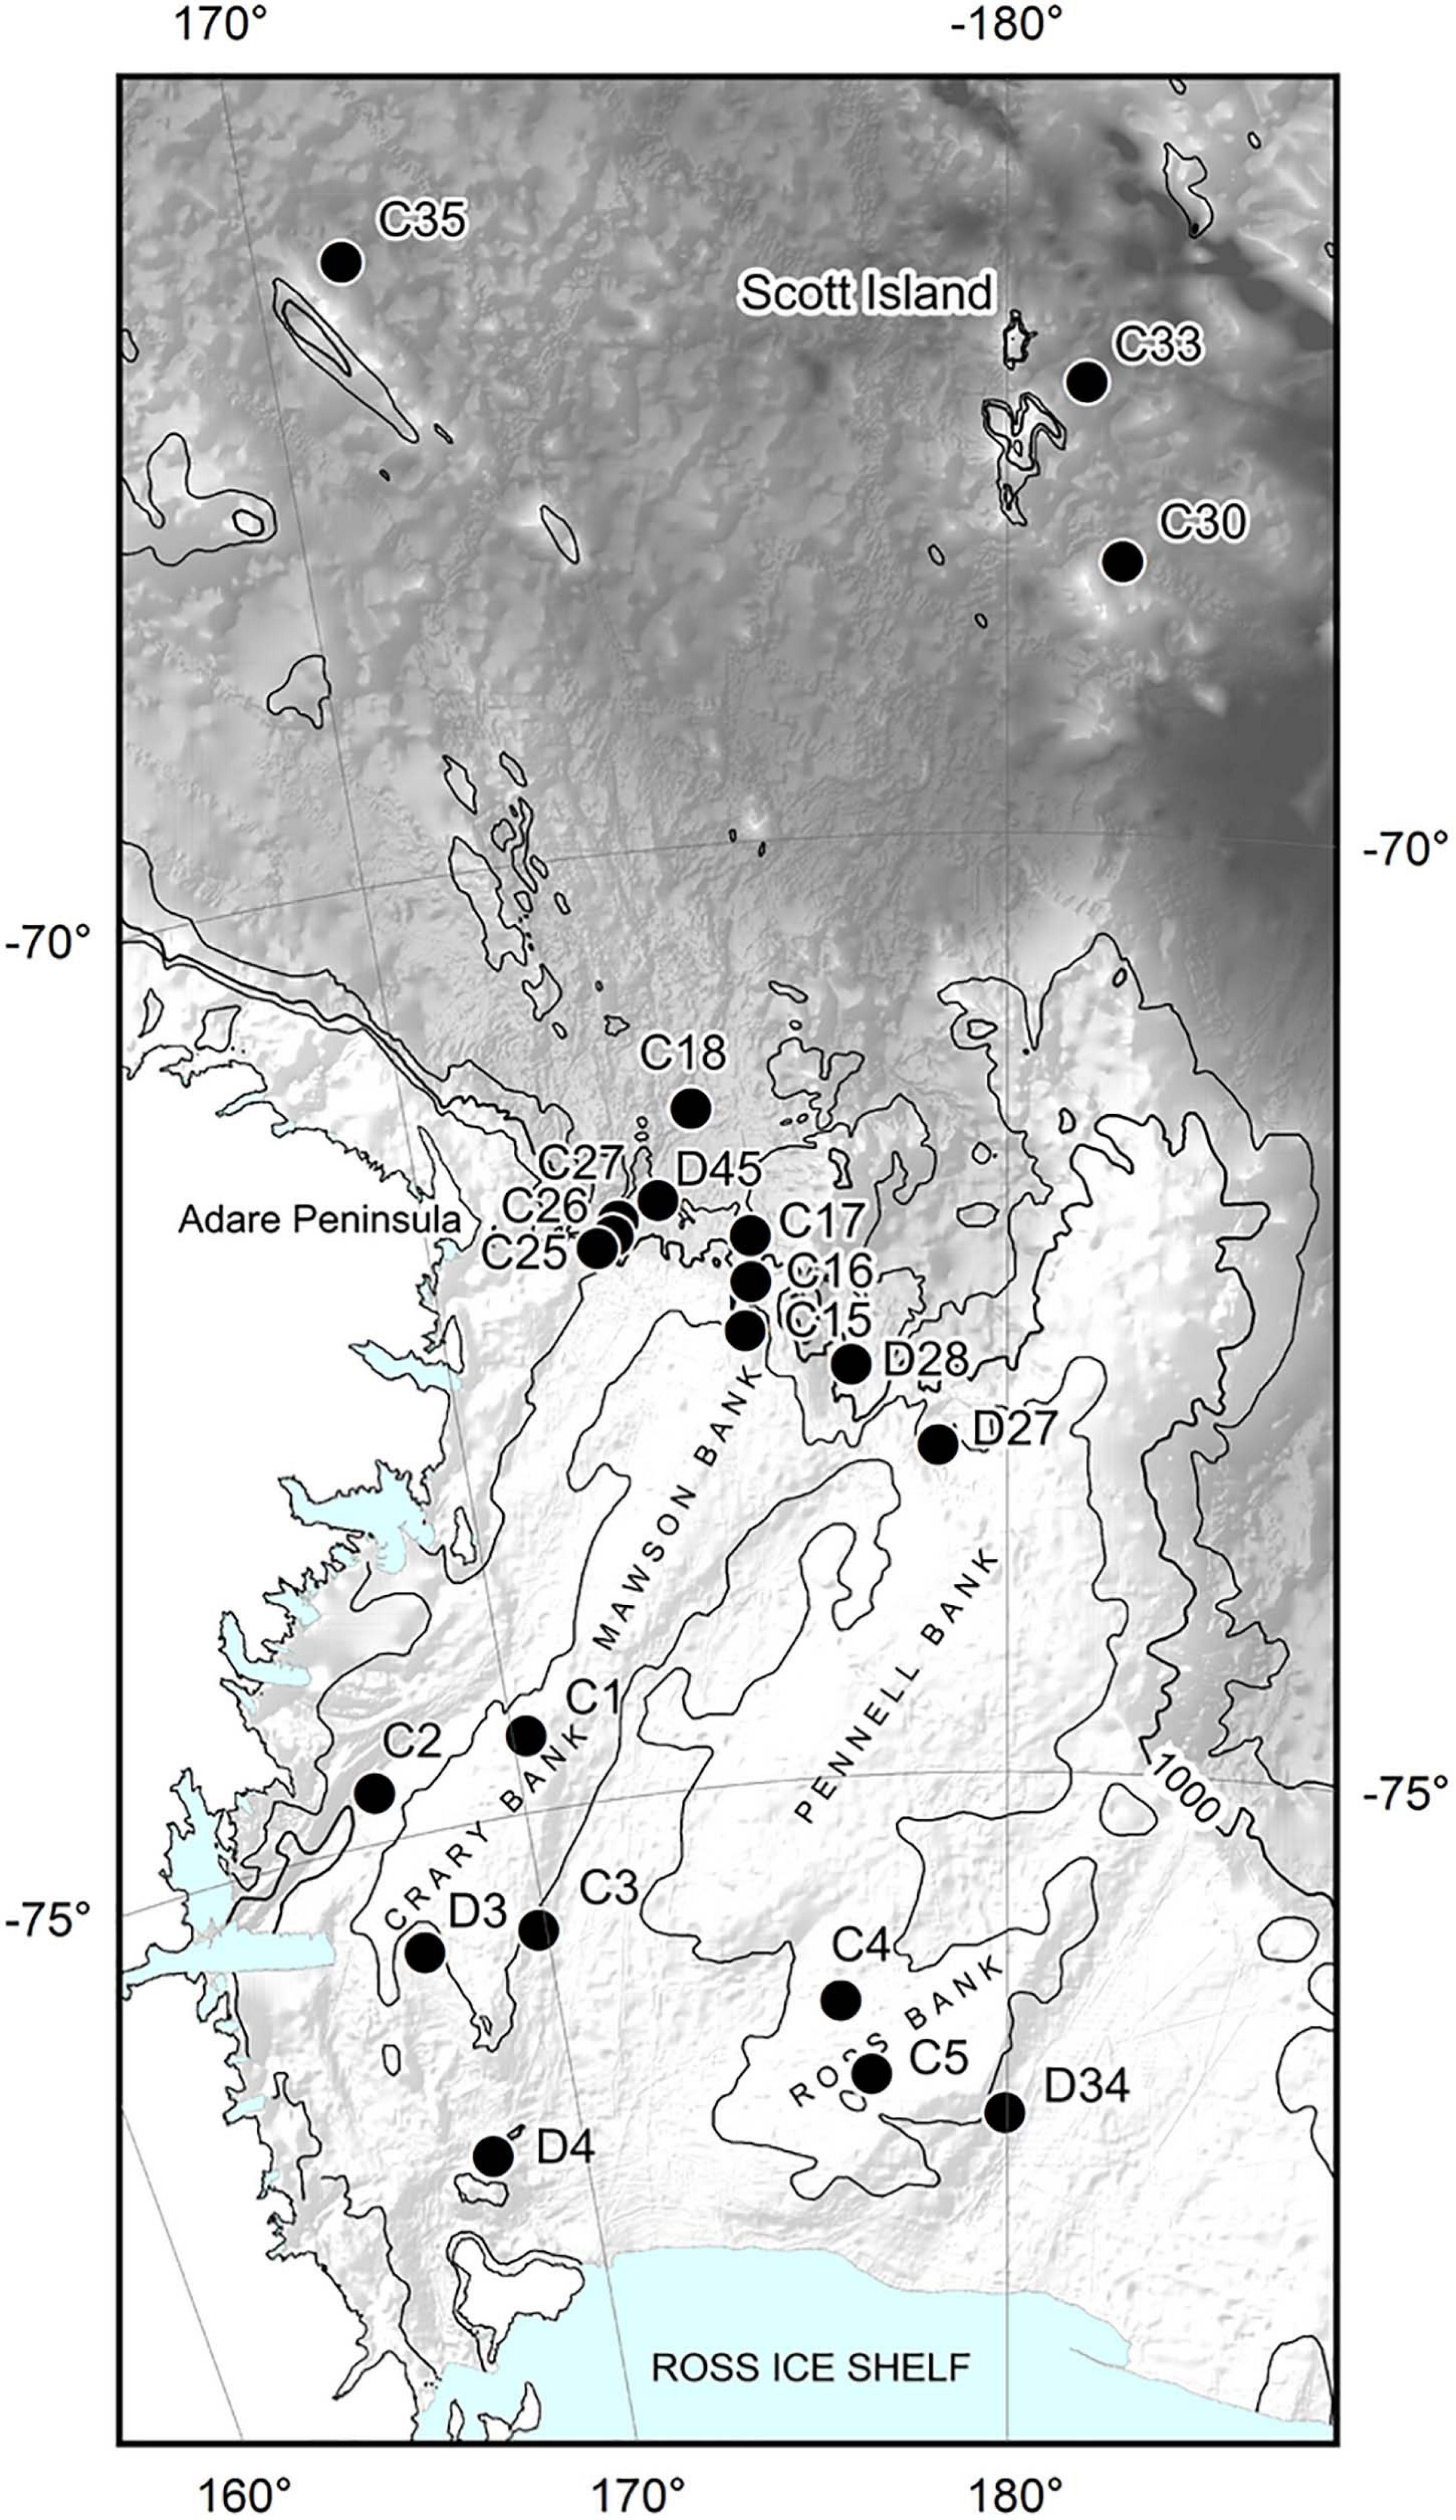
Figure 1. Sites sampled for benthic invertebrates during the NZ IPY-CAML voyage to the Ross Sea (TAN0802) in Jan-Apr 2008. C prefix sites: towed camera, beam trawl, and multicorer; D prefix sites: towed camera and beam trawl only. Hill shade bathymetry from IBSCO v1, isobaths at 500, 1000, and 2000 m.
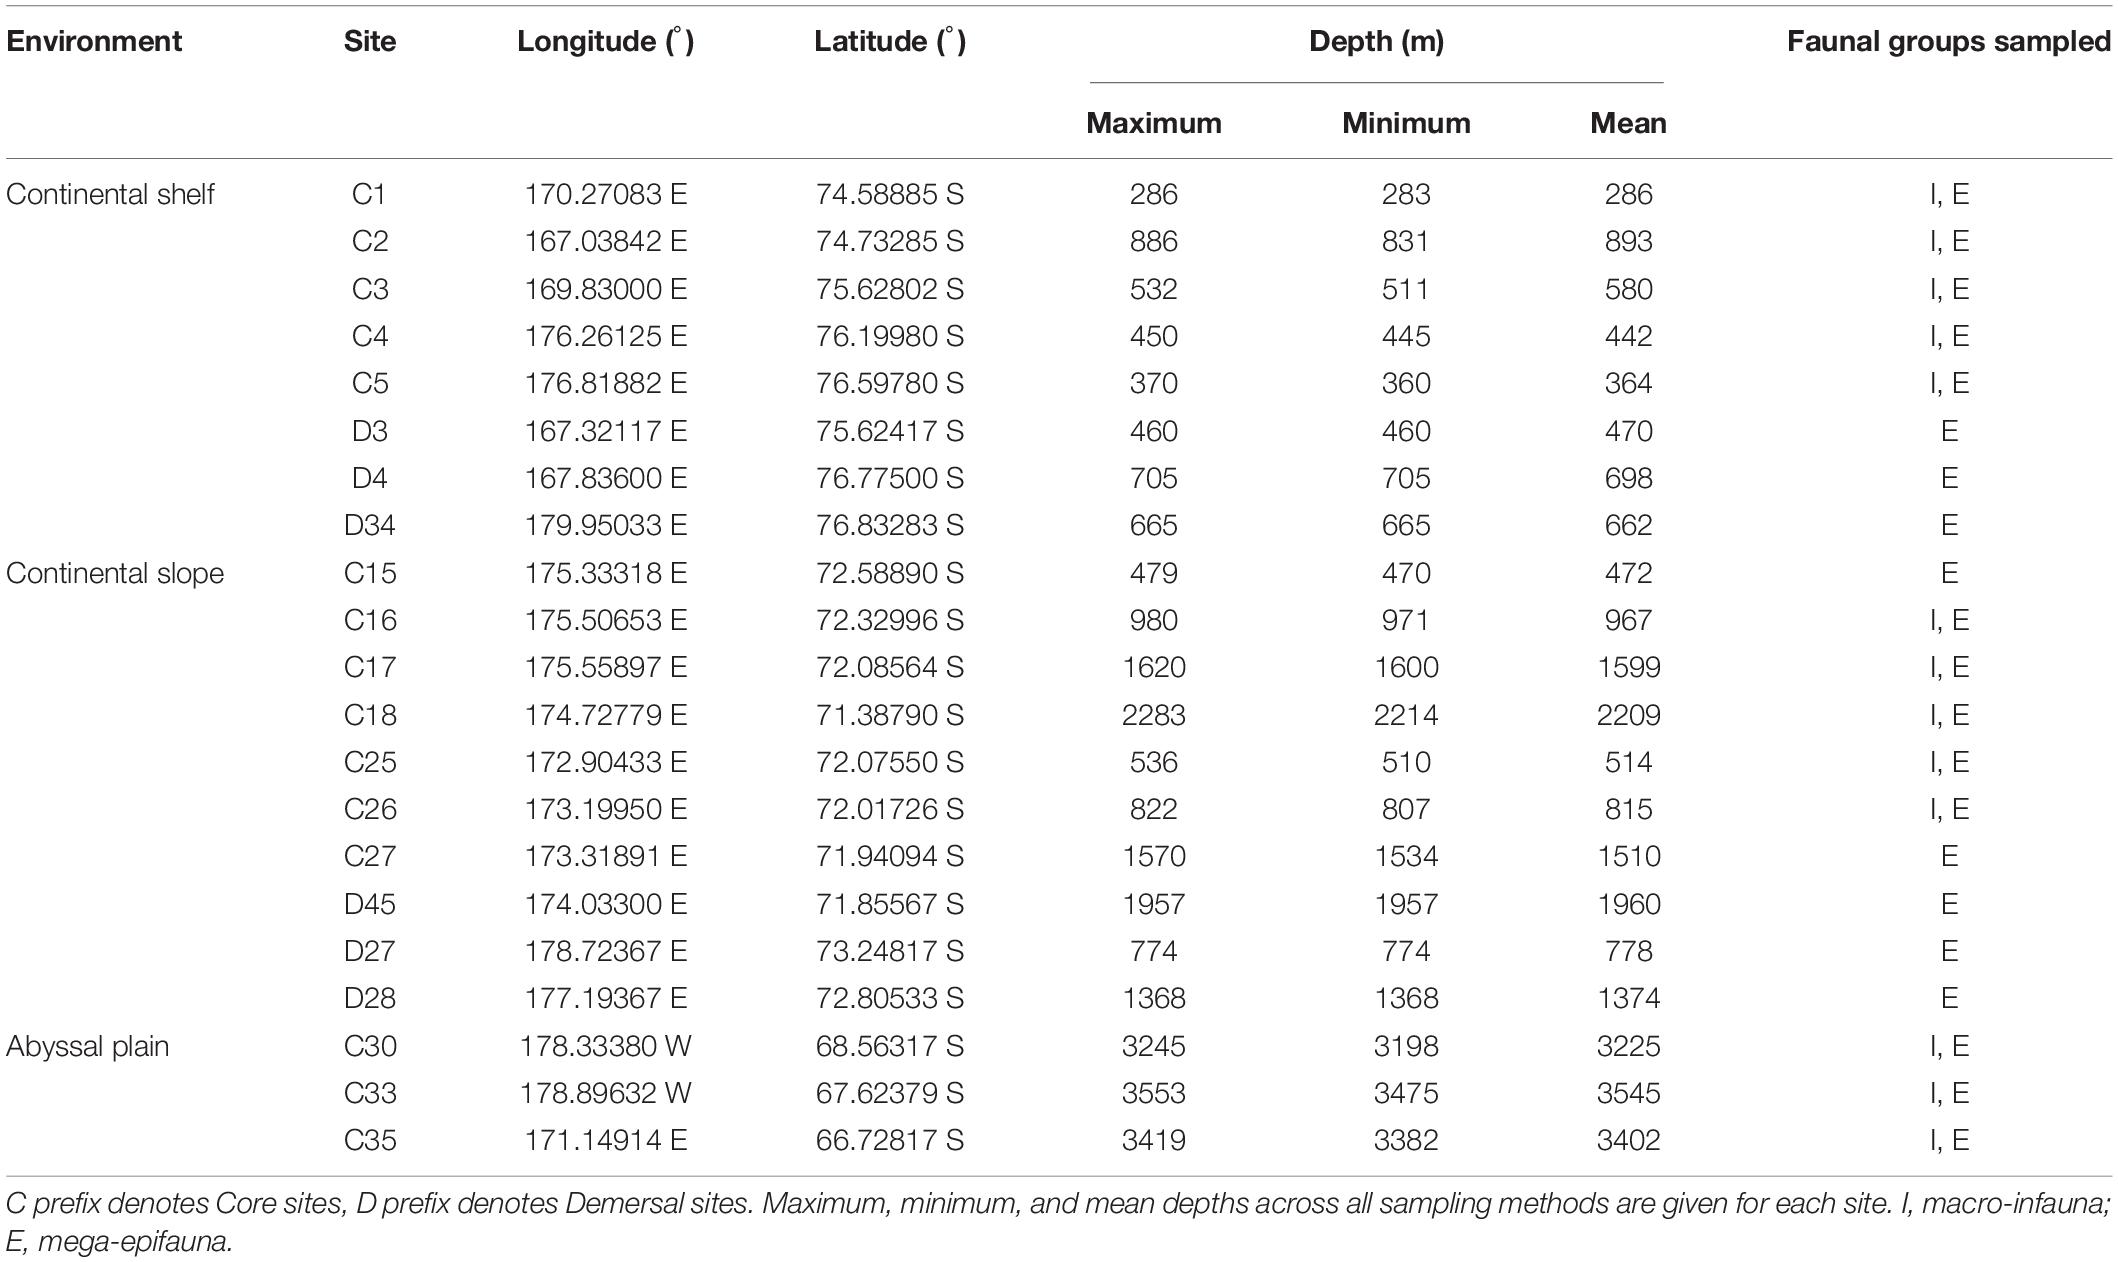
Table 1. Details of benthic sampling sites.
Mega-Epifauna
Camera transects were run using NIWA’s Deep Towed Imaging System (Hill, 2009; Bowden and Jones, 2016) configured with a high definition digital color video camera (HD1080i format) angled forward at 45° and a vertically orientated digital still image camera (Canon 10 MP DSLR). Transects were of 1 h duration at target speed of 0.25–0.5 ms–1 and a target altitude above the seabed of 2–3 m. Video was recorded continuously and still images were taken automatically at 15 s intervals. The seabed position of DTIS was recorded continuously in real time using an ultra-short baseline (USBL) acoustic tracking system (Simrad HPR410). Total seabed area imaged by video during each transect ranged from 1,800 to 3,000 m2, depending on realized tow speed. After the camera transect, a single beam trawl tow (4 m wide, 25 mm cod-end mesh) of approximately 10 min bottom time at 1.0 – 1.5 ms–1 tow speed was completed at each site, following the track of the towed camera transect where possible.
Counts of benthic taxa and substrate information were derived from laboratory reviews of the full length of each video transect by analysts using Ocean Floor Observation Protocol software (OFOP, Huetten and Greinert, 2008), with the high-resolution still images and beam trawl specimens used as references for taxonomic identifications. Substratum type was recorded continuously on an eight-category scale from ‘Bedrock’ to ‘Muddy sediment’ and expressed as percentages of the full transect distance after correcting for any sections of the transect in which the seabed was not visible (e.g., because of excessive altitude, or contact with the seabed). All visible benthic fauna (>ca. 50 mm) were identified to the finest practicable taxonomic level and counted. Each individual was recorded as a separate observation and logged with its position on the seabed (latitude and longitude), depth, and the substrate type. Densities for each taxon were standardized as the number of individuals 1000 m–2 along the whole transect. Both unitary and clonal fauna were recorded as counts, which may underestimate abundance of smaller and more abundant clonal taxa, especially bryozoans, hydroids, and some sponges (i.e., those with indeterminate growth form).
Benthic taxa from the beam trawl were identified to operational taxonomic groups at sea, weighed individually, and preserved using appropriate methods for each taxon (either 90% ethanol, 4% buffered formalin, or frozen). Preserved specimens were later identified to finer taxonomic levels (species, genus, family) by an international network of taxonomists coordinated by the NIWA Invertebrate Collection in New Zealand. Densities for each taxon were calculated as the total number of specimens standardized to the number of individuals 1000 m–2 of seabed.
Macro-infauna
Macro-infauna and sediments were sampled at 13 of the 15 Core sites (Table 1) using an Ocean Instruments MC-800 multicorer. The multicorer was deployed with either 4 or 8 individual core tubes (96 mm internal diameter), depending on substratum type. For most sites, only one core was processed for macrofauna from each shelf and slope site, but 5–7 cores were processed from each abyssal site. Cores (110 mm deep) were sieved (300 μm mesh) to remove fine sediments, residues preserved in 4% buffered formalin solution, and all retained fauna were identified and enumerated. Non-living biogenic material (e.g., sponge spicules and bryozoan and shell fragments) in each macro-infaunal core was dried and weighed and the amount of sponge spicule material was classified on a categorical scale from 0 (none) to 3 (abundant).
Sediment samples (top 50 mm of cores) were stored frozen and in the dark until analysis. In the laboratory, samples were homogenized prior to determination of particle size distribution, pigment (chlorophyll a and phaeophytin) concentrations, total organic content, and calcium carbonate (CaCO3) content. Chlorophyll a was extracted from freeze dried sediments by boiling in 90% ethanol. The extract was measured spectrophotometrically and an acidification step was included to separate degradation products (phaeophytin) from chlorophyll a (Sartory, 1982). Sediments for particle size analysis were digested in 6% hydrogen peroxide for 48 h to remove organic matter and dispersed using Calgon. A combination of sieving and analysis on a Galai particle analyzer (Galai Cis-100; Galai Productions Ltd, Midgal Haemek, Israel) was then used to calculate percentage volumes for the various size fractions. Organic content was determined by drying the sediment at 60°C for 48 h, followed by combustion at 400°C for 5.5 h, while CaCO3 content was determined using a CO2 vacuum-gasometric method with ±1% accuracy (Jones and Kaiteris, 1983).
Faunal Functional Traits
To identify the relative predominance of faunal feeding type (suspension feeders, deposit feeder-grazers, or predator-scavengers) and, for macro-infauna only, living position (surface, top 2 cm of sediment or deeper-sediment dwellers) within and between areas/environments. The taxon lists for each faunal group data set were examined and trait modalities were assigned using a combination of literature information, advice from taxonomic experts and our own observations. Because taxa can exhibit more than one feeding type or living position, ‘fuzzy coding’ (sensu Chevenet et al., 1994) was applied to allow the species to vary in the degree in which it exhibited affinity to a specific modality within the feeding and living position trait categories. The probability of a species exhibiting a particular trait was allocated, with allocation across a single trait category summing to 1 (see Hewitt et al., 2008, 2018 for specifics on how probabilities were generated). The fuzzy probability of a species exhibiting a specific trait modality, multiplied by the abundance the species displayed, then partitions the abundance of species that exhibit more than one modality across the traits. The resulting functional trait data were assessed in two ways: (i) the number of taxa with a particular trait (‘taxa weighted trait’), and (ii) the number of individuals with a given trait (‘abundance weighted trait’). The latter was calculated by multiplying the fuzzy probability by the abundance of each taxon to provide an abundance weighted measure of each trait.
Sea Ice Conditions, Productivity, and Seabed Flux
Sea ice concentration data for the region were derived from satellite measurements. We used data from the Scanning Multichannel Microwave Radiometer (SMMR) on the Nimbus-7 satellite and from the Special Sensor Microwave/Imager (SSM/I) sensors on the Defense Meteorological Satellite Program’s (DMSP) -F8, -F11, and -F13 satellites. Measurements from the Special Sensor Microwave Imager/Sounder (SSMIS) aboard DMSP-F17 are also included. The data set has been generated using the Advanced Microwave Scanning Radiometer – Earth Observing System (AMSR-E) Bootstrap Algorithm with daily varying tie-points (Cavalieri et al., 1990/2007).
The monthly time series was also used to calculate spatial maps of the proportions of time present of four sea ice types: ice free, marginal ice zone, open pack ice, and close pack ice. Areas of ocean are usually taken to be “ice-free” if the proportion of the sea covered with ice within a given area is less than about 10–15% (e.g., Comiso, 2003; Arrigo and van Dijken, 2004). Here, we use 15% as the limit. Sea ice concentrations between 15–40% are typically associated with “marginal ice zone” conditions, while concentrations between 40–70% are typically “open pack” conditions, and concentrations over about 70% are usually “close pack” conditions (Comiso, 1983, 1995; Cavalieri et al., 1984; Gloersen and Cavalieri, 1986).
Net primary production (mg C m–2 d–1) was derived using the Vertically Generalized Production Model (VGPM; Behrenfeld and Falkowski, 1997) sourced from www.science.oregonstate.edu/ocean.productivity/. This model incorporates data on near surface Chlorophyll a (Chl a) and sea surface temperature (SST). Near surface concentration of Chl a (mg m3) was estimated from the default (case 1) processing of MODIS-Aqua (version R2018.0) and SeaWiFS (version R2018.0) satellite sensors, blended using overlap period 2002–2010 (NASA Goddard Space Flight Center, Ocean Ecology Laboratory, and Ocean Biology Processing Group., 2018a,b). The Chl a and VGPM data sets span the period September 1997 to August 2018, but only data in the decade before benthic sampling were used here (1998–2008). The SST dataset used was the Optimum Interpolation Sea Surface Temperature (OISST), version 2, which is based on satellite measurements by the Advanced Very High Resolution Radiometer series, operated by the National Oceanic and Atmospheric Administration, United States (Reynolds et al., 2002).
Downward vertical flux of particulate organic matter at the seabed (mg C m–2 d–1) was estimated based on net primary production in the surface mixed layer (VGPM), with export fraction and flux attenuation factor with depth obtained by refitting sediment trap and thorium-based measurements to environmental data (VGPM, SST) as Lutz et al. (2007) and Law et al. (2017) and using data from Cael et al. (2018).
The above data were analyzed for the time period 1998 to 2008; i.e., encompassing the 10 years up to the time of the benthic sample collection. All sea ice and productivity data were projected onto a circumpolar, polar stereographic grid with nominal 9 km resolution. For five variables (% sea ice concentration, Chl a, SST, VGPM, seabed flux), monthly climatologies were generated by averaging all data in a given calendar month. Monthly resolution was chosen as shorter timespans lead to large data gaps. The pixel value of the monthly composites was used to calculate annual means. We consider a year the period from July to June (e.g., data for 1998 corresponds to July 1997 to June 1998). The long-term (i.e., 10 years) mean and standard deviation values were calculated from the annual averages, so that the standard deviations represent the variability between years. Mean and standard deviations (between years) were also calculated from the proportions of time with a given type of sea ice (% of time ice free, or with marginal, open pack, or close pack ice).
Statistical Analyses
Community Analyses
Mega-epifauna (from DTIS video) and macro-infauna assemblage data were analyzed to identify spatial patterns in assemblages between and within environments (Shelf, Slope, Abyssal plain). For each faunal group separately, total numbers of taxa and individuals were calculated and similarities in community composition among sites were visualized using non-metric multidimensional scaling ordinations (MDS: PrimerE, Clarke and Warwick, 2001) of Bray–Curtis similarity matrices calculated from both untransformed and presence-absence transformed faunal abundance data. These two data treatments have been used throughout out our analyses; together they provide complementary information by emphasizing the importance of dominant and rare species, respectively. Where no major differences were observed between the two data treatments, only the raw results are presented. The individual taxa contributing to the community differences between environments were identified using the similarity percentages procedure, SIMPER (Primer E).
The PERMANOVA routine in PrimerE was used to quantify differences in benthic community structure between environments (Shelf, Slope, and Abyss) indicated in the MDS, and the significance of these differences using pairwise comparisons. P-values were obtained using 999 permutations. Because PERMANOVA is sensitive to differences in multivariate dispersion among groups, the PERMDISP routine in PRIMER was used to test for homogeneity of dispersion, also using pairwise comparisons.
Comparison of patterns across faunal groups
Spatial patterns in community composition between the mega-epifauna (from DTIS video) and macro-infauna were compared using a matrix correlation method (RELATE, Clarke and Warwick, 2001; Somerfield et al., 2002). For mega-epifauna only, data from the two sampling methods (DTIS video vs beam trawl) were also compared at this stage to assess any influence of gear type on spatial patterns. Similarity matrices were calculated for each of the faunal data sets (mega-epifauna DTIS, mega-epifauna beam trawl, and macro-infauna) using Bray–Curtis distance as a measure of similarity between pairs of samples. Spearman’s rho (ρ) correlations between these similarity matrices were then calculated using RELATE. The analyses were run using untransformed and presence-absence faunal data to assess the relative contributions of species richness and abundance to concordance between patterns.
Community composition for the mega-epifaunal (DTIS video) and macro-infaunal data sets was initially investigated across all samples to determine whether patterns observed in the similarity matrices were alike for the two faunal components. The similarity matrices compared were of the same type (e.g., untransformed compared with untransformed, and presence-absence with presence-absence). After this initial comparison, each data set was divided into shelf, slope and abyssal plain sites to determine whether any common patterns detected between the faunal data sets at the scale of the entire survey area were similar within and between the shelf, slope and abyssal habitats separately.
Because RELATE provides only a single correlation value describing the relationship between two matrices, it cannot be used to test for interactions among variables directly. To explore this further, a three stage partial canonical ordination was used (CANOCO, Ter Braak and Smilauer, 1998). In the first stage, Correspondence Analysis (CA) was used to reduce the multivariate composition of the macro-infauna and mega-epifauna data (separately) to a few dimensions. This analysis was based on untransformed data and down weighted to reduce the influence of rare species and thus highlight general inter-sample differences (note that this procedure does not change the abundance of common species). Next, dummy variables were constructed to represent each of the two areas (shelf and slope) and the interaction between them and used in Canonical Correspondence Analysis (CCA) where the macro-infauna data was predicted by the sample scores from the CA of the mega-epifauna and the dummy variables. Finally, we established whether consistent relationships occurred between the macro-infauna data and the mega-epifauna CA scores, and whether or not these were a direct result of depth, by re-running the CCAs with the effect of depth partialed out.
Sea Ice, Productivity and Seabed Flux, and Community Characteristics
To investigate the relative importance of the sea ice and productivity-associated variables on community composition and feeding traits (i.e., taxa and abundance weighted traits), distance-based linear models were run (DistLM, McArdle and Anderson, 2001) based on Bray–Curtis dissimilarities calculated from untransformed macro-infaunal and mega-epifaunal data, and using step-wise selection based on the adjusted R2 criterion. Thirteen variables were included in the initial model (i.e., mean and SD for: % sea ice concentration; % seabed flux; % of time ice free, or with close pack- or marginal ice; VGPM). The % of time with open pack ice and concentration of Chl a were both excluded due to their high correlations with close pack ice and VGPM, respectively. Depth was included as a starting condition in all models so that the influence of other variables could be evaluated after allowing for the effect of depth. Distance-based Redundancy Analysis ordinations (dbRDA, Legendre and Anderson, 1999) of the fitted values of the selected models were created, to visualize the strength and direction of the relationships between community composition and individual environmental variables.
Results
General Site Descriptions – Substrata
Substrata at sites on the Shelf were mostly muddy sediments, with occasional glacial drop-stones (recorded as ‘boulders’ in the video analysis, Figure 2A). Analyses of multicores showed that Shelf sediments consisted predominantly of fine sand, with varying amounts of medium sand and silt (Figure 2B and Supplementary Table 1). The deepest shelf site, C2 in the Drygalski Basin, contained a significant amount of pebble (17%; Figure 2B and Supplementary Table 1). The Shelf site cores contained the most sponge material of all areas (Supplementary Table 1).
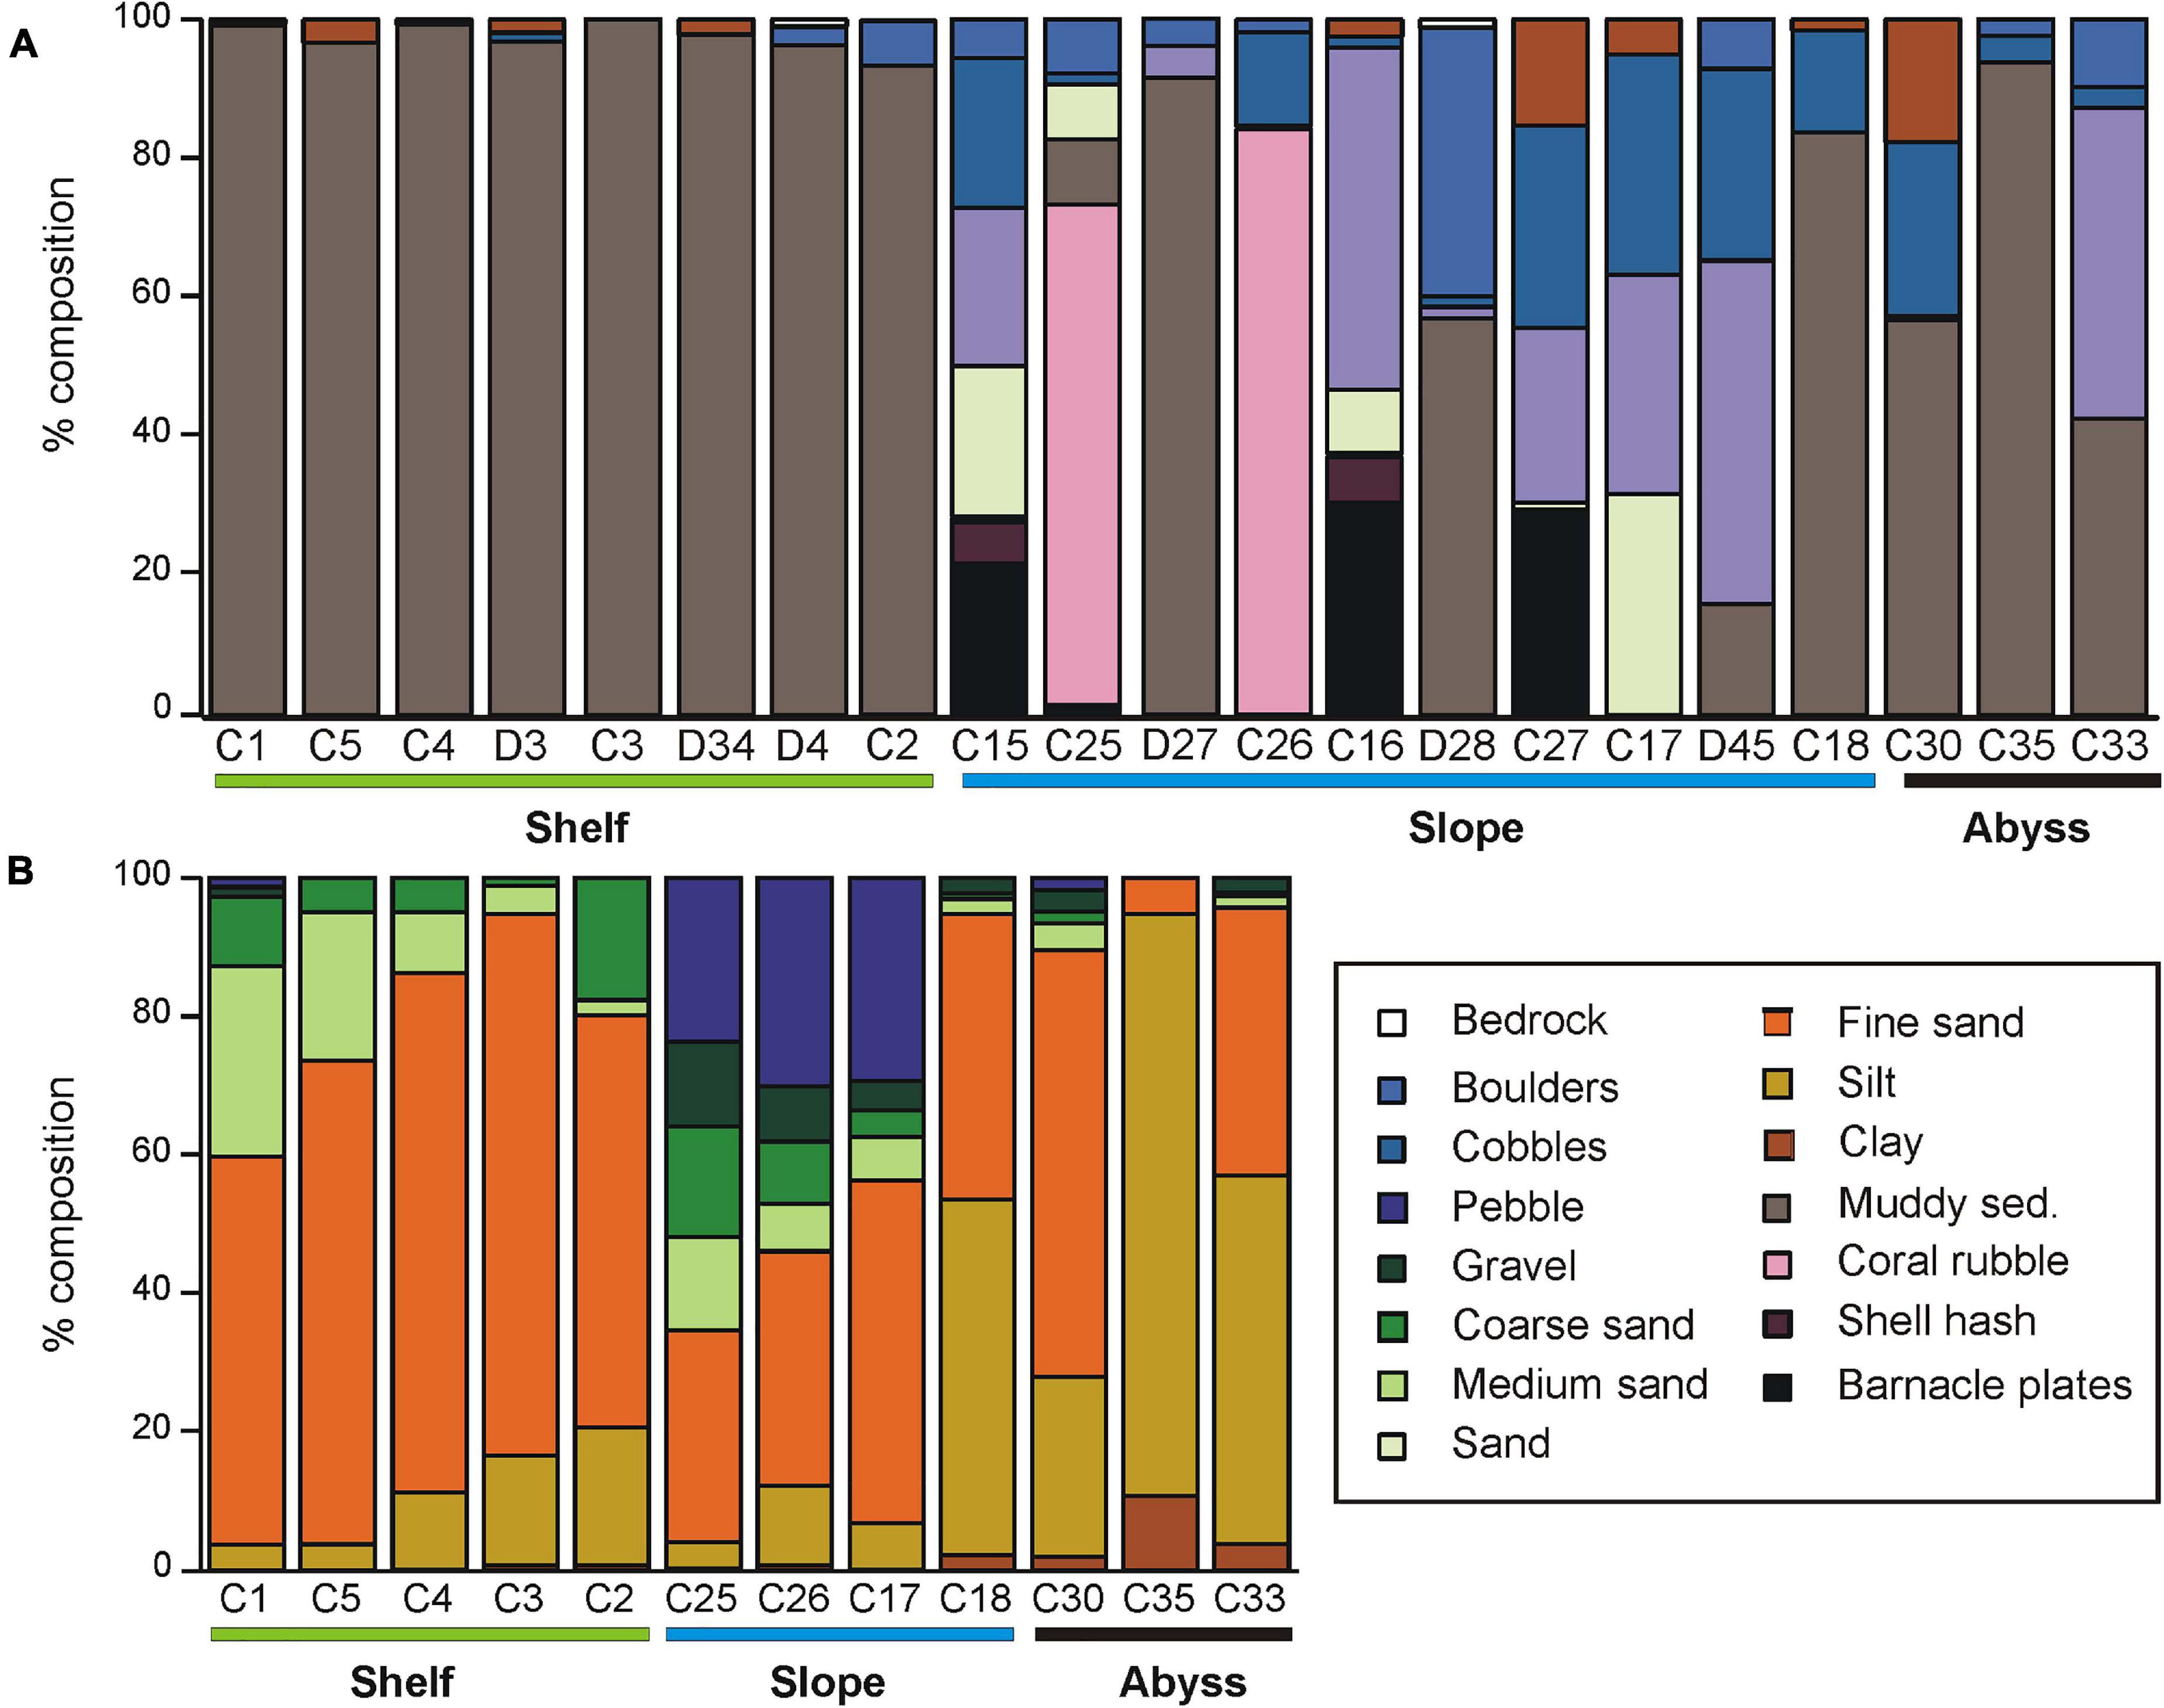
Figure 2. (A) Substrate type determined for Core and Demersal sites from DTIS video, and (B) grain size composition of the multi-core sampled sediments at each Core station. Stations are grouped by environment (Shelf, Slope, Abyss), and, within each environment, are arranged from shallowest to deepest (left to right).
Slope substrata were more heterogeneous than those on the shelf, comprising a mixture of gravel, cobbles and sand, with smaller proportions of shell hash and boulder. The volume of coarser sediment and biogenic material was highest on the Slope (Figure 2B and Supplementary Table 1). The seafloor at two upper-slope sites on the shelf break east of Cape Adare (C25 and C26) were predominantly fragments of stylasterid hydro-coral skeleton. The cores from these sites had a distinctive coarse layer of coral fragments overlying finer sediment, and also contained gastropod and bivalve shells. At the base of the slope (sites D27 and C18) substrata were mostly fine muddy sediments.
The Abyssal sites consisted of muddy sediments with varying amounts of boulder, cobble and, particularly at site C33 east of Scott Island, dark basaltic gravels (Figure 2A). These muddy sediments were predominantly silt and fine sand, with some clay, and contained relatively little biogenic material (Figure 2A and Supplementary Table 1).
Sediment organic content ranged from 0.8 to 3.1% and did not differ between environments (Supplementary Table 1). In contrast, sediment pigment concentrations were considerably higher on the Shelf (1.84 – 7.28 μg phaeophytin g–1 sediment) than on either the Slope or Abyssal plain (<< 1 μg phaeophytin g–1 sediment). Chl a was only detected at two sites; C1 and C2 on the continental shelf (<0.43 μg g–1 sediment). CaCO3 content of the sediments was generally very low (0.04 – 2.67%), with the exception of the two shelf-break Slope sites C25 and C26 (43 and 38%, respectively; Supplementary Table 1).
General Site Descriptions – Fauna
For mega-epifauna 48,818 individuals, representing 261 taxa across 11 phyla, were identified from DTIS video transects, while 61,399 individuals representing 592 taxa across were identified from beam trawl samples. One hundred and twenty-seven macro-infaunal taxa (ranging from species to phyla) and 1230 individuals were recorded from the 48 multicore samples analyzed for this study.
Mega-Epifauna
On the continental shelf, mega-epifaunal assemblages were comprised of 53–101 taxa and from 448 to nearly 3000 individuals 1000 m–2 (Figures 3A,B, respectively). Communities were characterized by bryozoans, gorgonian and pennatulacean octocorals, comatulid crinoids, sponges (demosponges and hexactinellids), hydroids, anthozoans (cerianthids and anemones), and ascidians; all of which are suspension feeding taxa. The highest densities of fauna were recorded at site C4, where bryozoans dominated. At the two deepest Shelf sites, C2 and D4, deposit feeding taxa, primarily holothuroids constituted a greater proportion of the community, but suspension feeders in the form of hexactinellid sponges, pennatulaceans, and large solitary athecate hydroids were also common.
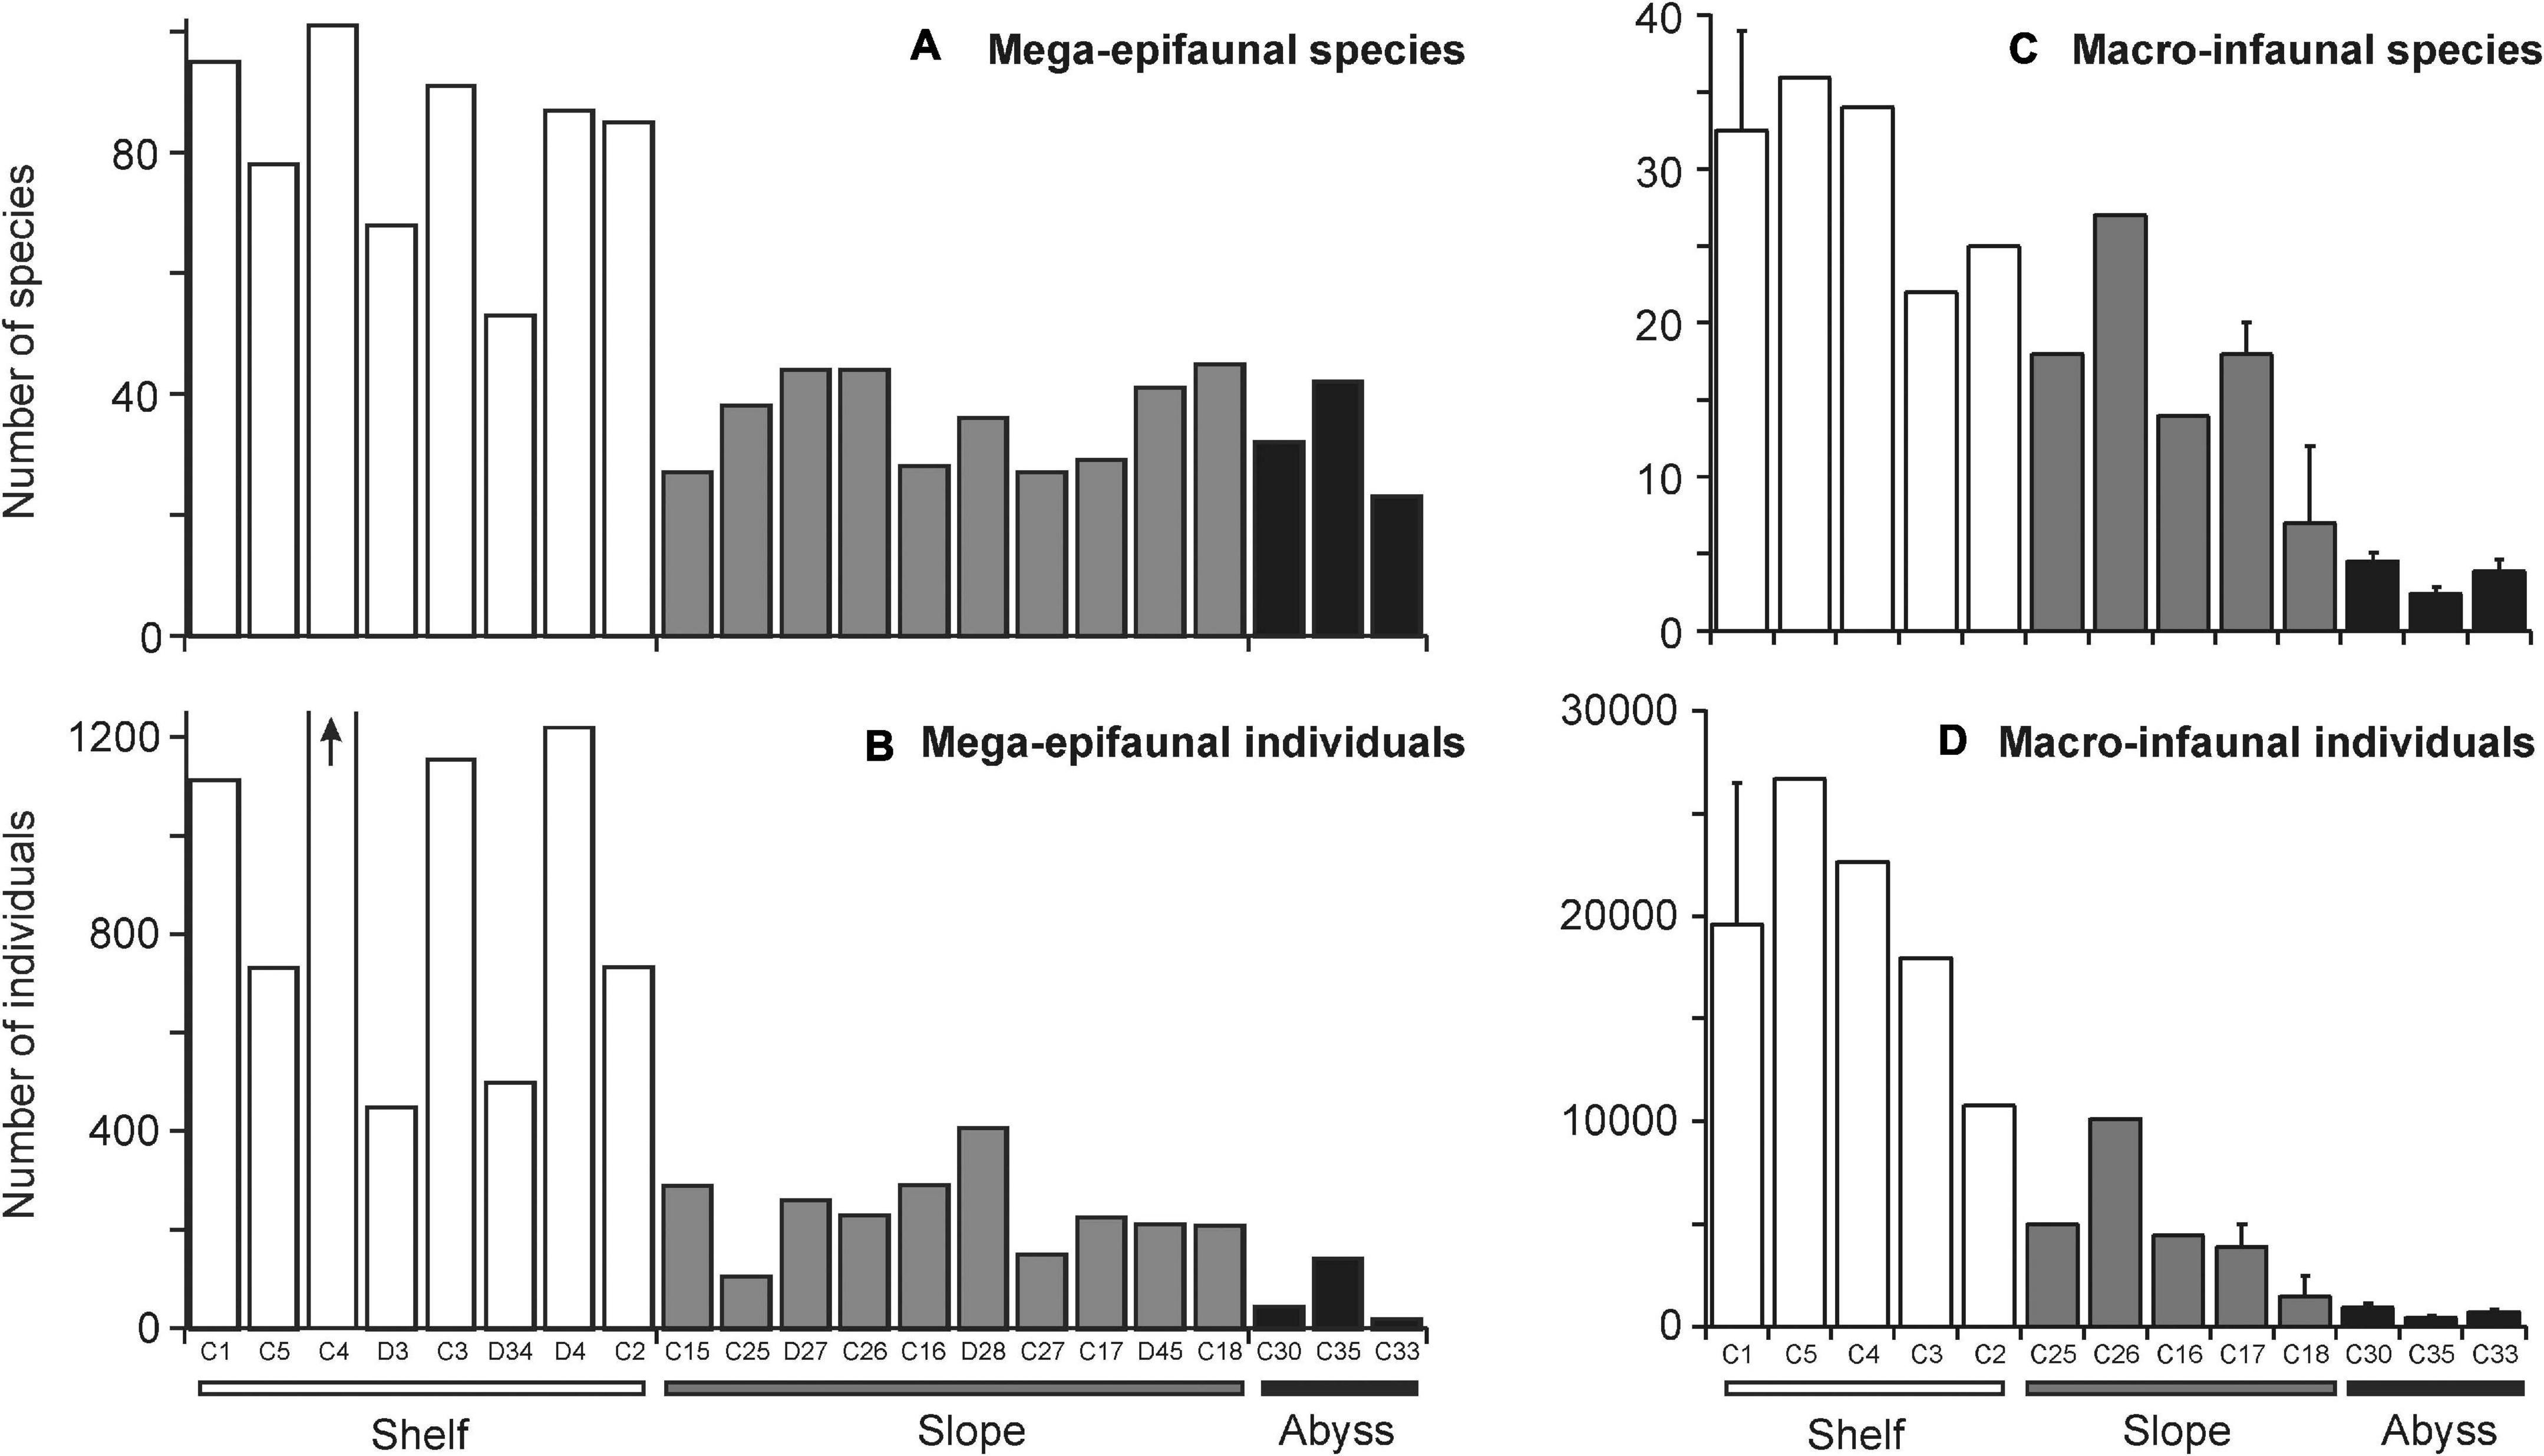
Figure 3. Total number of (A) mega-epifaunal and (C) macro-infaunal species and (B,D) individuals found at each site. Sites are arranged in order of increasing depth (left to right) within the “Shelf,” “Slope,” and “Abyss” categories. The arrow on (B) indicates number of individuals at Site C4 was off the scale (2959 individuals). Standard error bars on some macro-infaunal sites indicate where multiple stations were sampled at that Core site. Note the different y-axes scales on comparable plots.
On the continental slope, by contrast, numbers of taxa and abundances were lower (27 – 45 taxa, 104 – 405 individuals 1000 m–2 Figures 3A,B) and there were fewer sessile suspension feeding taxa. Asteroids, demosponges, and anemones were the most consistent characterizing taxa (highest similarity values) across all Slope sites. However, natant decapod crustaceans were conspicuous at deeper sites and stylasterid hydrocorals dominated at the shallow Shelf break site on the westernmost cross-slope transect in the Cape Hallett and Cape Adare region (Site C25).
At the Abyssal sites, numbers of taxa were similar to those on the Slope (23 – 42 taxa 1000 m–2; Figure 3A), but overall densities were lower than in the other environments (18 – 141 individuals 1000 m–2; Figure 3B). Deposit-feeding holothuroids were the most abundant mega-epifauna. Anemones, echinoids, ophiuroids, isopods, asteroids and natant decapods were consistently found, albeit at lower densities.
Macro-Infauna
Polychetes were the most diverse macro-infaunal taxonomic group overall (47 taxa) and, along with nematodes, accounted for half and one quarter of the total number of individuals collected (658 and 321 specimens), respectively.
The continental shelf sites had from 22 to 39 taxa, and the most individuals (10,776 – 26,664 individuals m–2) of all areas (Figures 3C,D). The assemblages were all dominated by nematodes, in varying abundances (2,487 – 8,487 individuals m–2). The small suspension feeding bivalve Thyasira debilis was the second most abundant taxon at sites C5 and C4 (4,421 and 2,487 individuals m–2, respectively). Ostracoda, and the deposit feeding polychete grouping Cirratulidae were common at three of the five shelf sites (ostracods at C1, C5, and C4, with 2,072, 1,796, and 691 individuals m–2, respectively; cirratulids at C5, C3, and C4, with 1,382, 967, and 829 individuals m–2, respectively).
All of the Slope sites featured Isopoda spp. (276 – 1,105 individuals m–2) which was the most common taxon at C18 and the second most abundant taxon at C16, C17, and C26. Nematodes were also the most abundant taxa at two of the slope sites, C17 and C25 (691 and 829 individuals m–2, respectively), and featured at C26 (967 individuals m–2). Numbers of taxa and individuals were intermediate between those of the Shelf and Abyss sites (Figures 3C,D).
Abyssal sites were characterized by very low numbers of individuals and taxa (Figures 3C,D), with Cirratulidae the most common taxa at C30 (average 161 individuals m–2), and oligochaetes (predator/scavengers) the most abundant taxa at C33 and C35 (124 and 81 individuals m–2, respectively). Isopoda spp. were the second or third most abundant taxa at these sites. Nematodes were the second most common taxa at C30, with 80 individuals m–2 on average.
Comparisons of Faunal Characteristics Across Environments
Numbers of mega-epifaunal taxa and overall sample abundances were higher at sites on the Shelf than on either the Slope or Abyssal plain but were comparable between Slope and Abyssal sites (Figures 3A,B). Macro-infauna were also more species-rich and considerably more abundant on the Shelf than on either the Slope or Abyssal plain (Figures 3C,D); additionally, numbers of taxa and individuals were higher in the Slope sites compared to the Abyssal sites. Macro-infauna taxon-richness and abundance showed a strong inverse relationship with depth (R2 = 0.92 and 0.86, respectively; Figure 4B), with similar but weaker relationships for mega-epifauna (R = 0.64 and 0.53, respectively; Figure 4A).
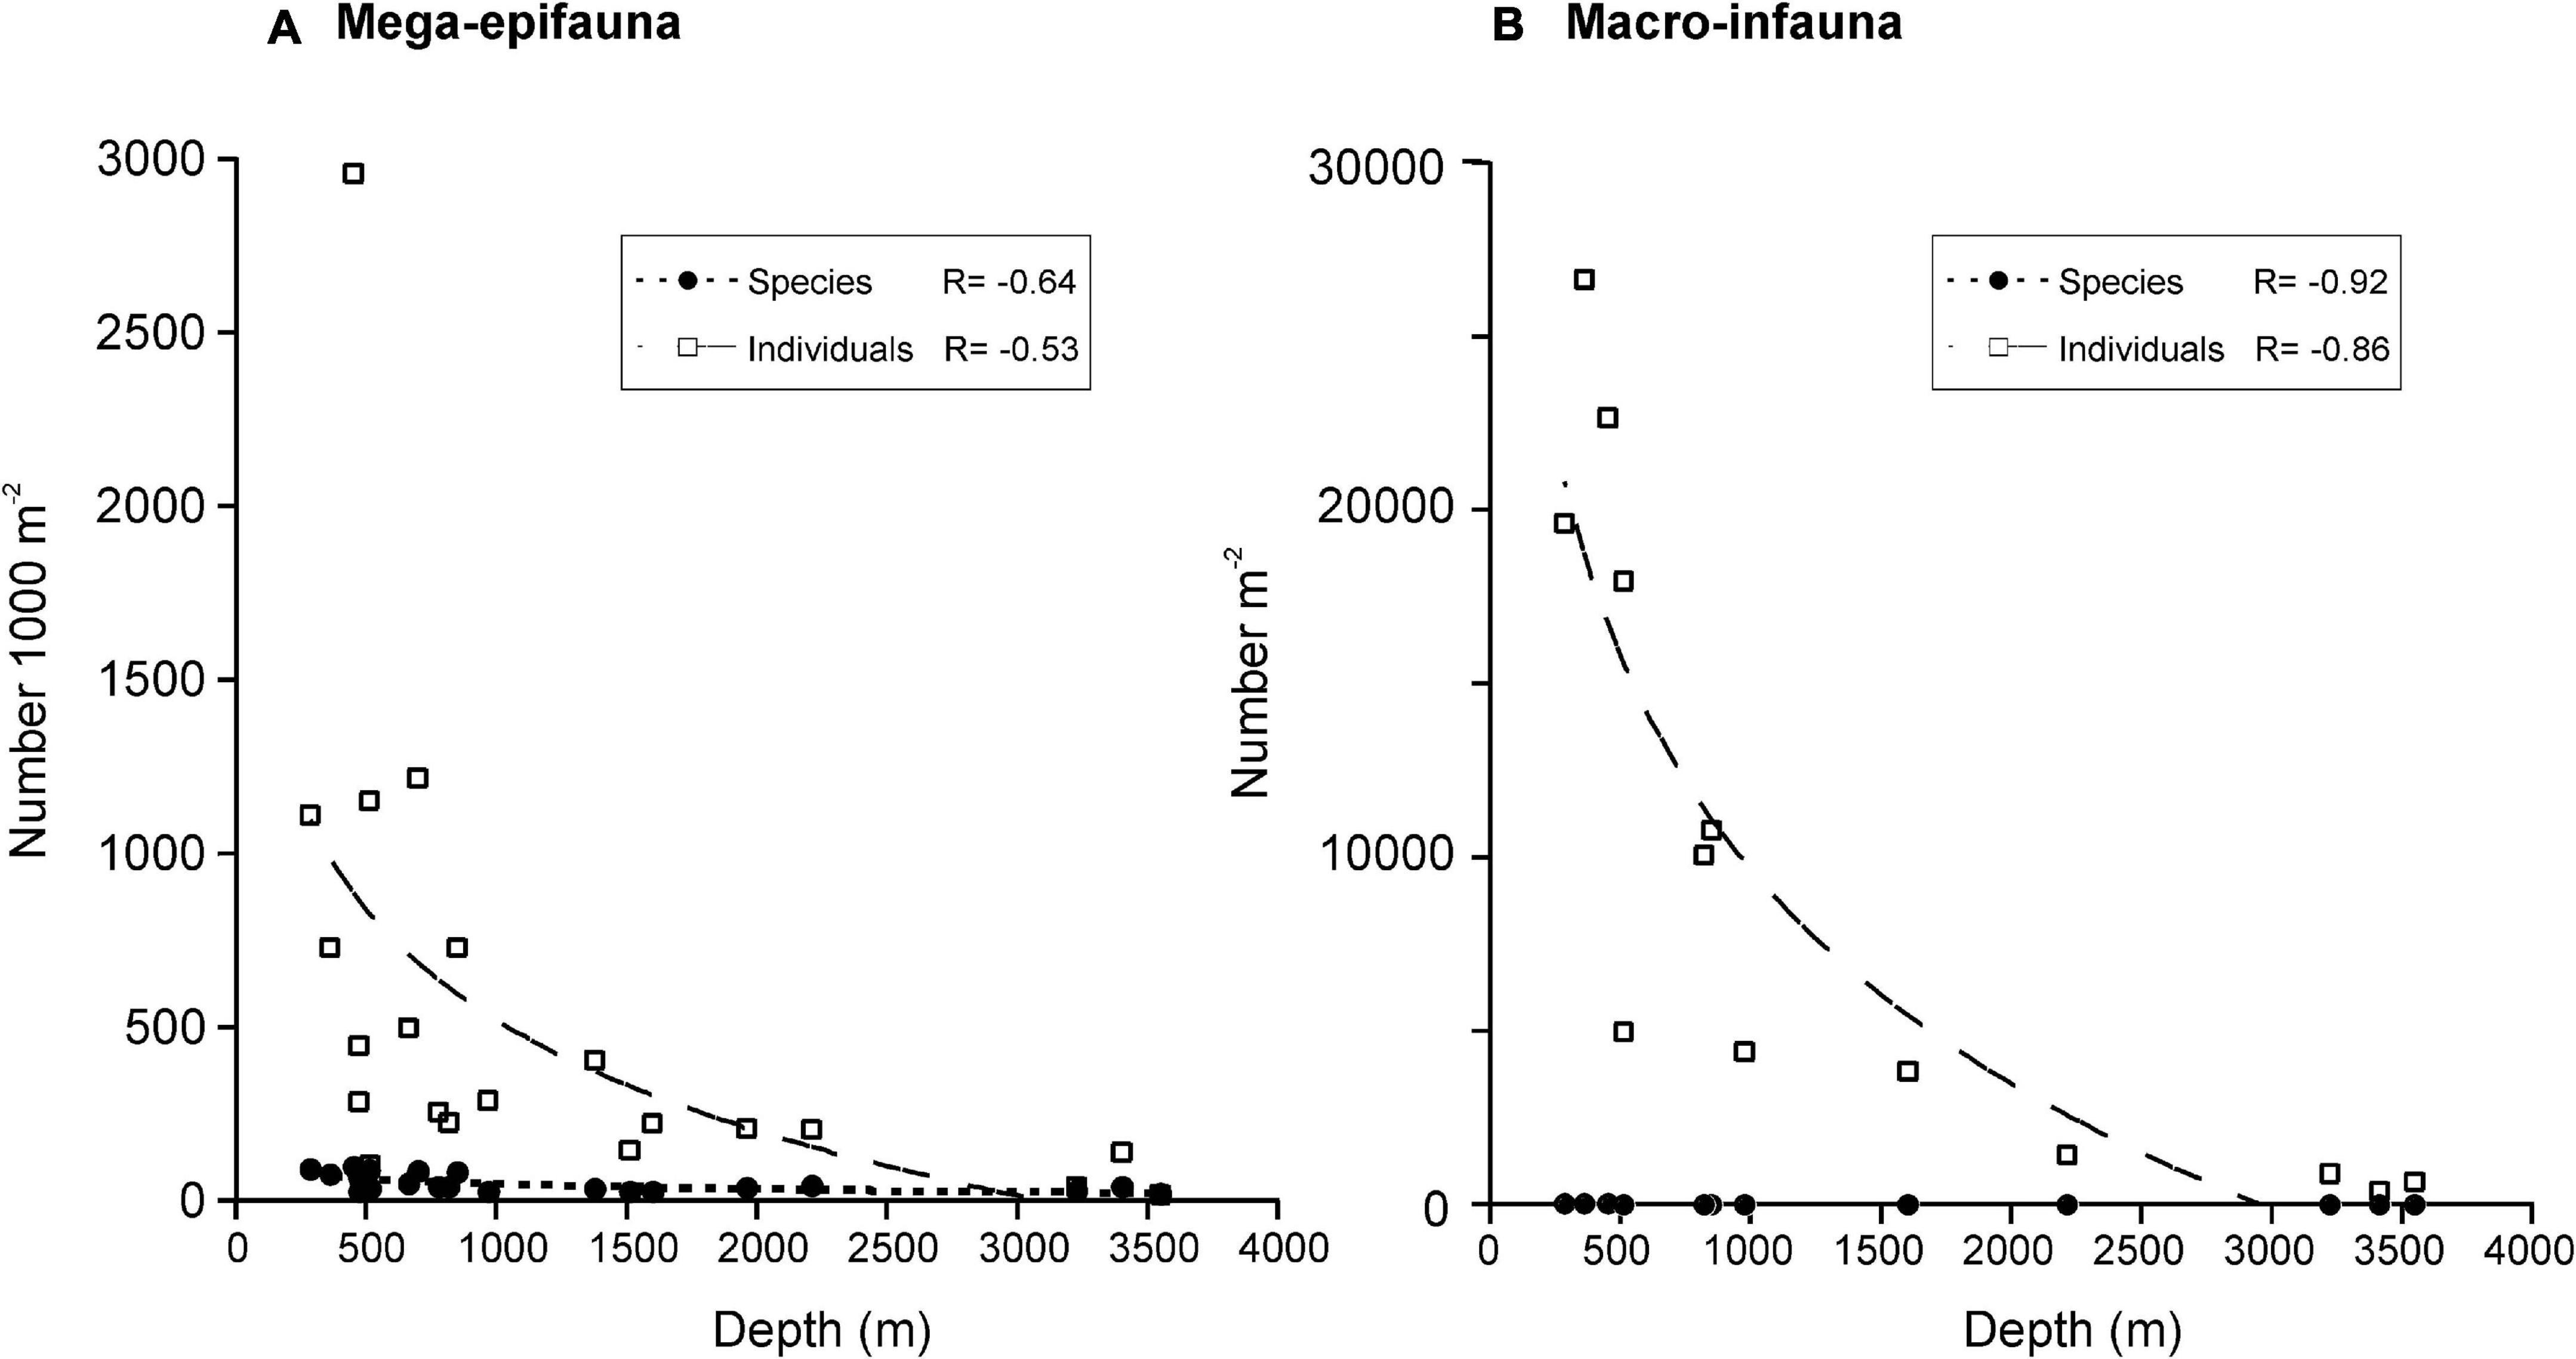
Figure 4. Relationship between depth and number of (A) mega-epifaunal and (B) macro-infaunal taxa and individuals. Curves are logarithmic fits and correlation coefficients (R) are shown for each. Mega-epifaunal data from DTIS video footage.
MDS ordinations revealed distinct groupings of sites by environments (Figure 5). For mega-epifauna untransformed data, all Shelf sites and four of the easternmost Slope sites grouped together and were distinct from the remaining Slope sites and the Abyssal sites (Figure 5A). However, dissimilarities were generally very high (>70%; Supplementary Table 2), with the exception of Slope sites C16, C17, D27, and D28 (Figure 5A), among which dissimilarities were <50% (Supplementary Table 2). Dissimilarity between mega-epifaunal assemblages in the three large-scale environments was high (>80%), particularly in comparisons involving the abyssal environments (i.e., shelf vs. slope = 80.34%, abyss vs. shelf = 90.85%, abyss vs. slope = 87.25% Supplementary Table 2).
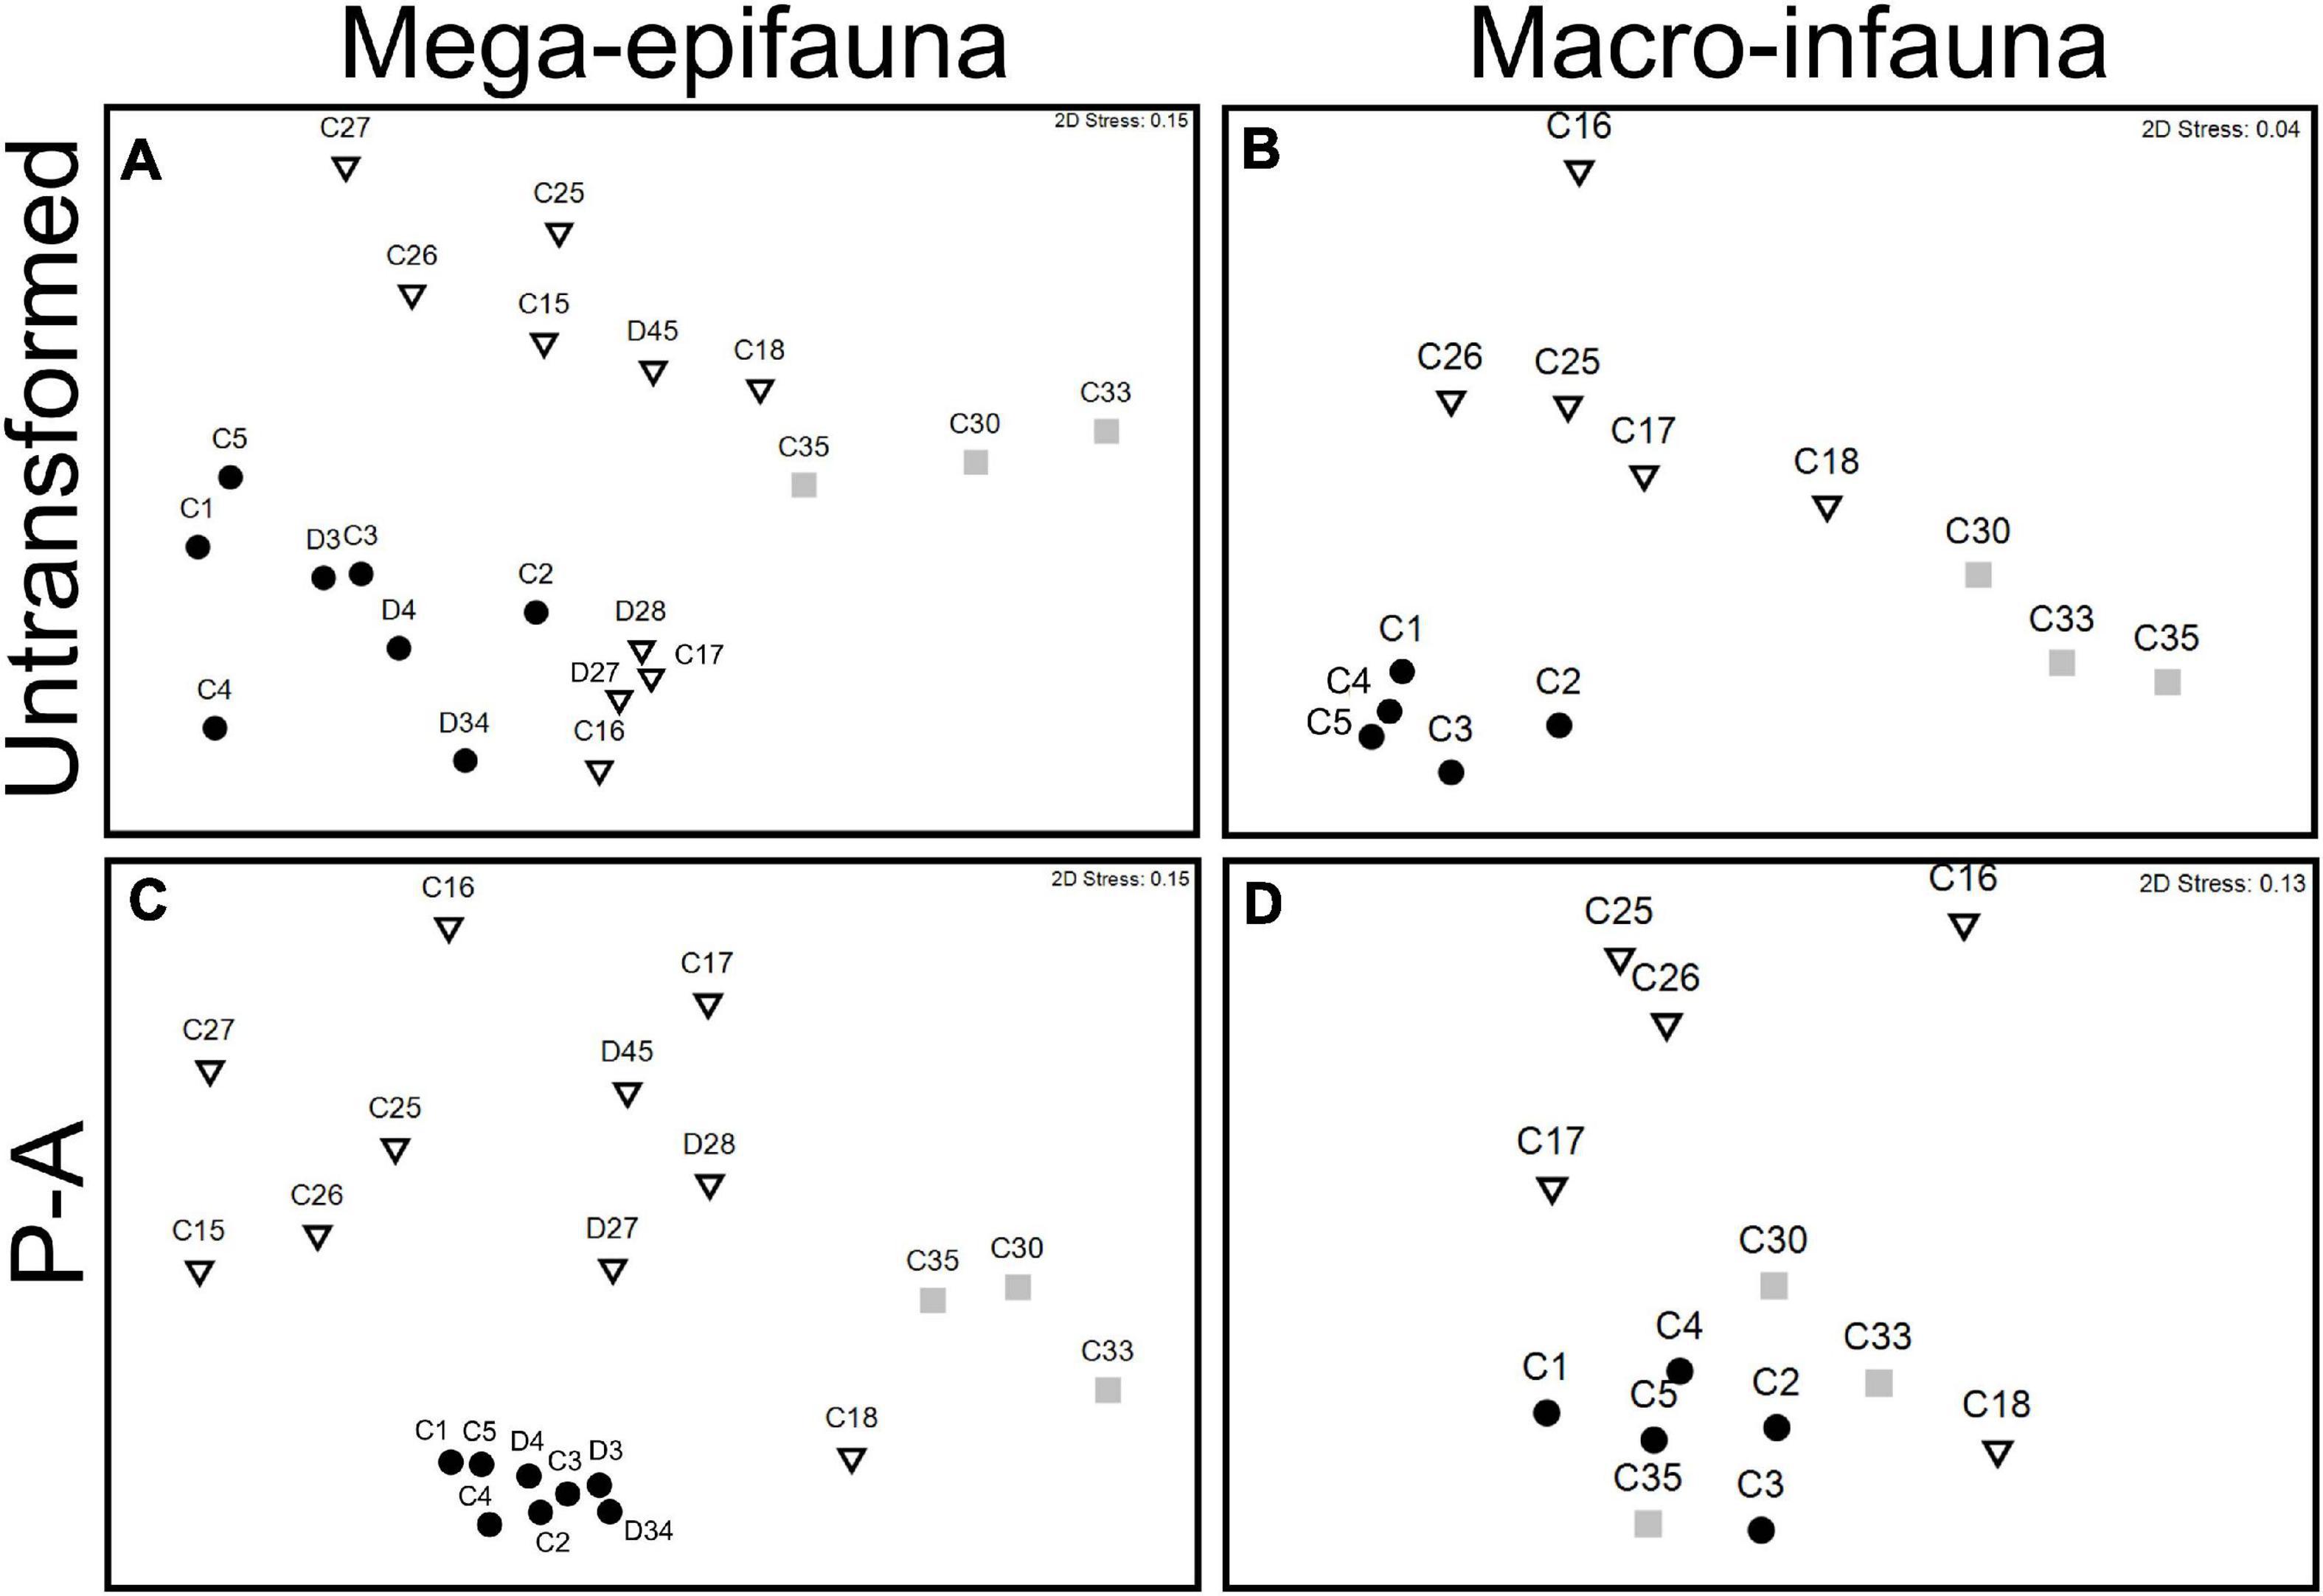
Figure 5. MDS ordinations of mega-epifaunal and macro-infaunal community similarity between sampling sites on the continental shelf (circles), continental slope (triangles), and abyss (squares). Data are untransformed (A,B), and presence-absence transformed (P-A, C,D) abundance values from seabed video transects (mega-epifauna) and multicorer (macro-infauna) samples. Distances represent Bray–Curtis similarities among sites.
In the mega-epifauna MDS based on presence-absence transformed data (Figure 5C) there was strong clustering of Shelf site communities, and strong dissimilarities between these and all other sites, indicating pronounced differences in taxonomic composition between on- and off-shelf faunas. Comparable ordinations using data from the beam trawl samples showed broadly similar relationships (not shown here).
Macro-infaunal communities from the Shelf, Slope, and Abyssal plain were, like the mega-epifauna, clearly separated in ordination space (untransformed MDS, Figure 5B). Closer examination of the species comprising the assemblages in the different environments (using SIMPER analysis of the untransformed data; Supplementary Table 3) revealed considerably lower % dissimilarity between core sites on the Shelf (37 – 73%) than that within either the Slope (61 – 90%) or Abyss (80 – 83%). The stations comprising each of the abyssal core sites exhibited very low similarity (15 – 27%), indicating there were strong differences in community composition between stations/within sites. Only one slope and one shelf Core site had sufficient replication to test within-site similarity, and in both cases, these were higher than those of the abyssal stations (slope C17, 36%; shelf C1, 43%). MDS using presence/absence transformed data shows higher similarity of the Abyssal sites to the Shelf sites, reflecting occurrence of some wide-spread taxa (Figures 5B cf. D).
These observations of differences in mega-epifaunal and macro-infaunal community structure between environments are supported by statistical significance of the PERMANOVA analyses (Table 2). Significant differences were found between environments for almost all mega-epifauna and macro-infaunal comparisons, regardless of the data transformation treatment (Tables 3A,B). The exception was the comparison between Slope and Abyssal macro-infauna communities using presence-absence (p = 0.106; Table 3B), reflecting the fact that the deepest Slope sites are at similar depths to the Abyssal sites. PERMDISP pairwise comparisons of variability between environments were significantly different only for the mega-epifaunal presence/absence transformed data, in which the Slope data were significantly more variable than those from the Abyss and the Shelf (Table 3A and Figure 5C). This is expected because the Slope sites span a depth range from Shelf to Abyss and an environmental gradient across the shelf-break front.
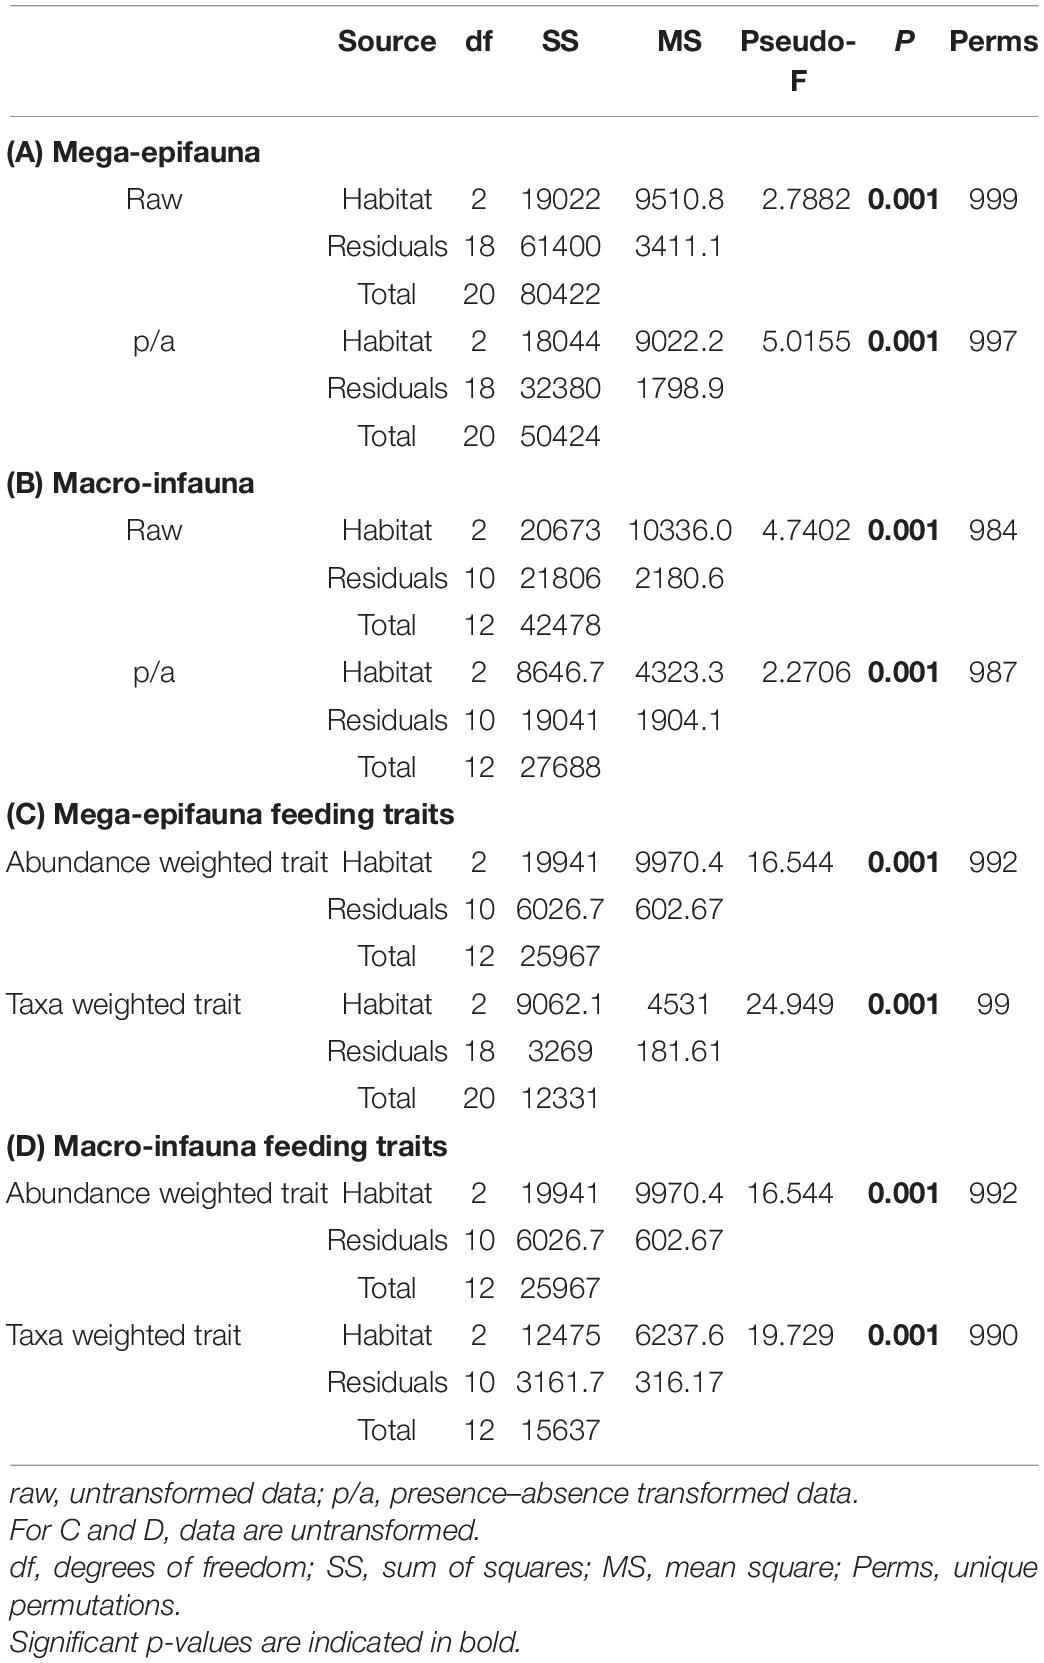
Table 2. Results of PERMANOVA analyses testing for differences in benthic community composition between environments, for (A) mega-epifauna taxon identity data, (B) macro-infauna taxon identity data, (C) mega-epifauna feeding traits, and (D) macro-infauna feeding traits.
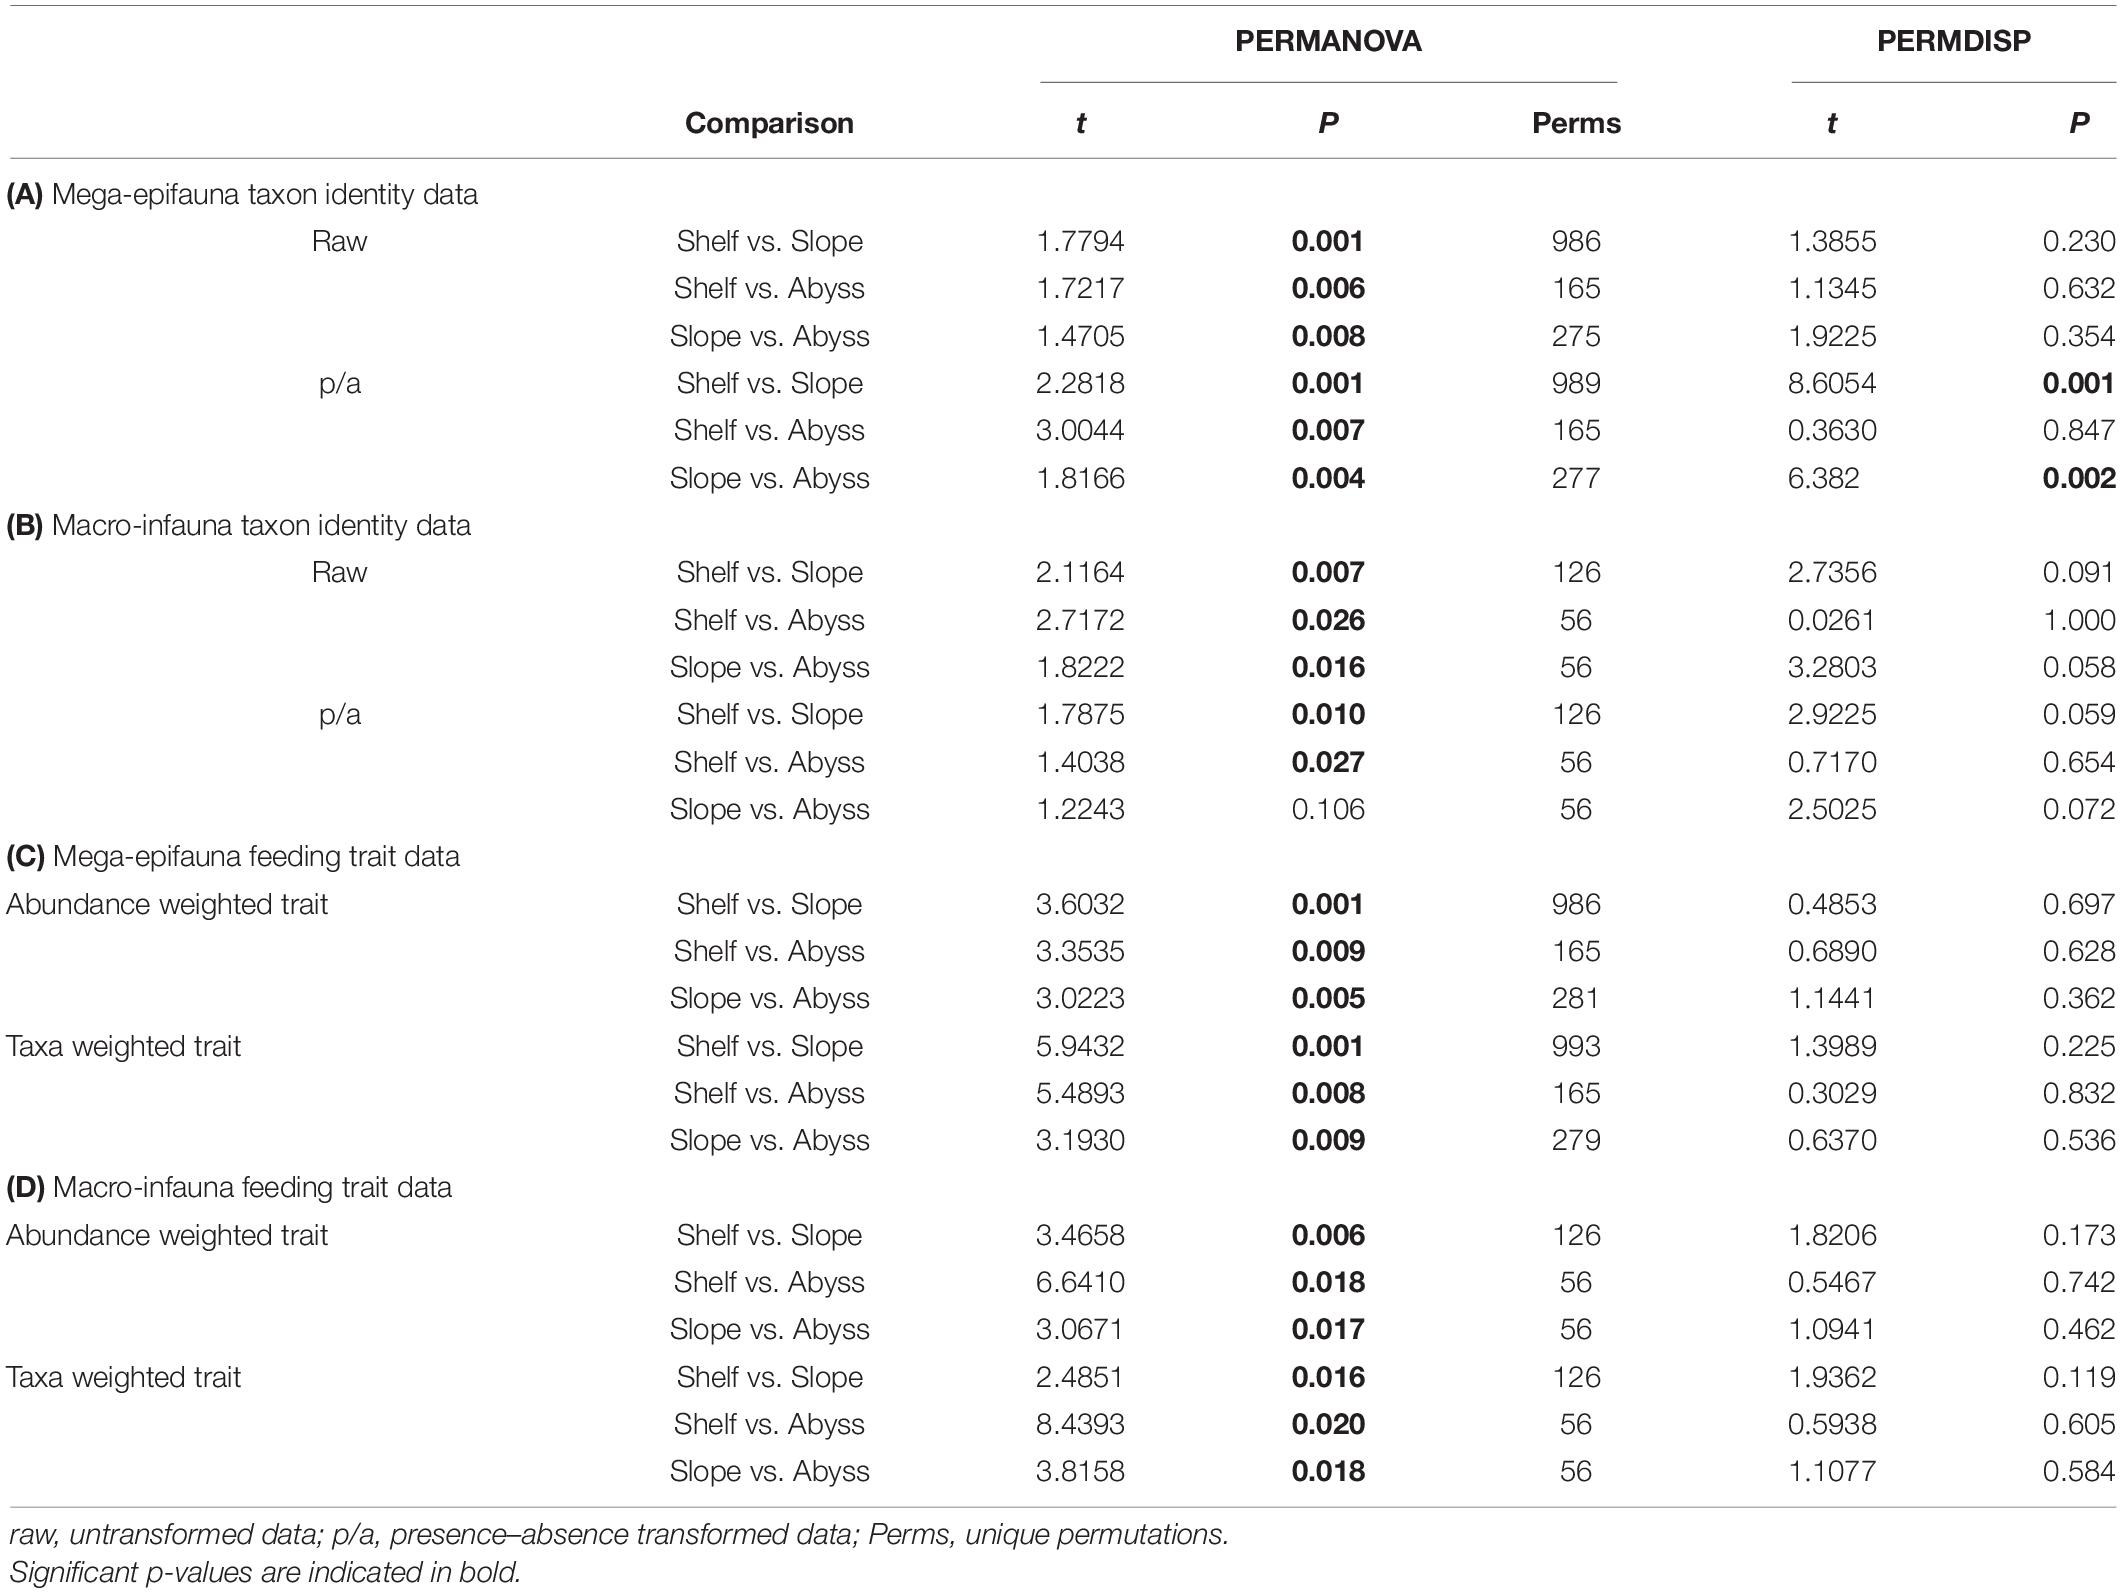
Table 3. Results of pairwise comparisons from PERMANOVA and PERMDISP analyses, testing for differences in benthic community composition between environments, for (A) mega-epifauna taxon identity data, (B) macro-infauna taxon identity data, (C) mega-epifauna feeding traits, and (D) macro-infauna feeding traits.
Functional Traits
Across the Shelf and Slope stations, mega-epifauna were predominantly suspension feeding taxa (Figure 6). In the Abyss, deposit feeder-grazers were found in higher or equal abundances. For macro-infauna in contrast, suspension feeding taxa were the least common feeding type at all Shelf stations, and at all but one of the five Slope stations (i.e., C26, C16–C18; Figure 6). Deposit feeder-grazers were found in relatively high proportions at the three shallowest Shelf sites (C1, C5, and C4; 0.45–0.50), and equal numbers of deposit-grazer and predator-scavenger taxa were noted at C3 and C2 (Figure 6). There was no clear pattern of feeding type across the Abyssal sites, although fewer predator/scavenger taxa were found here.
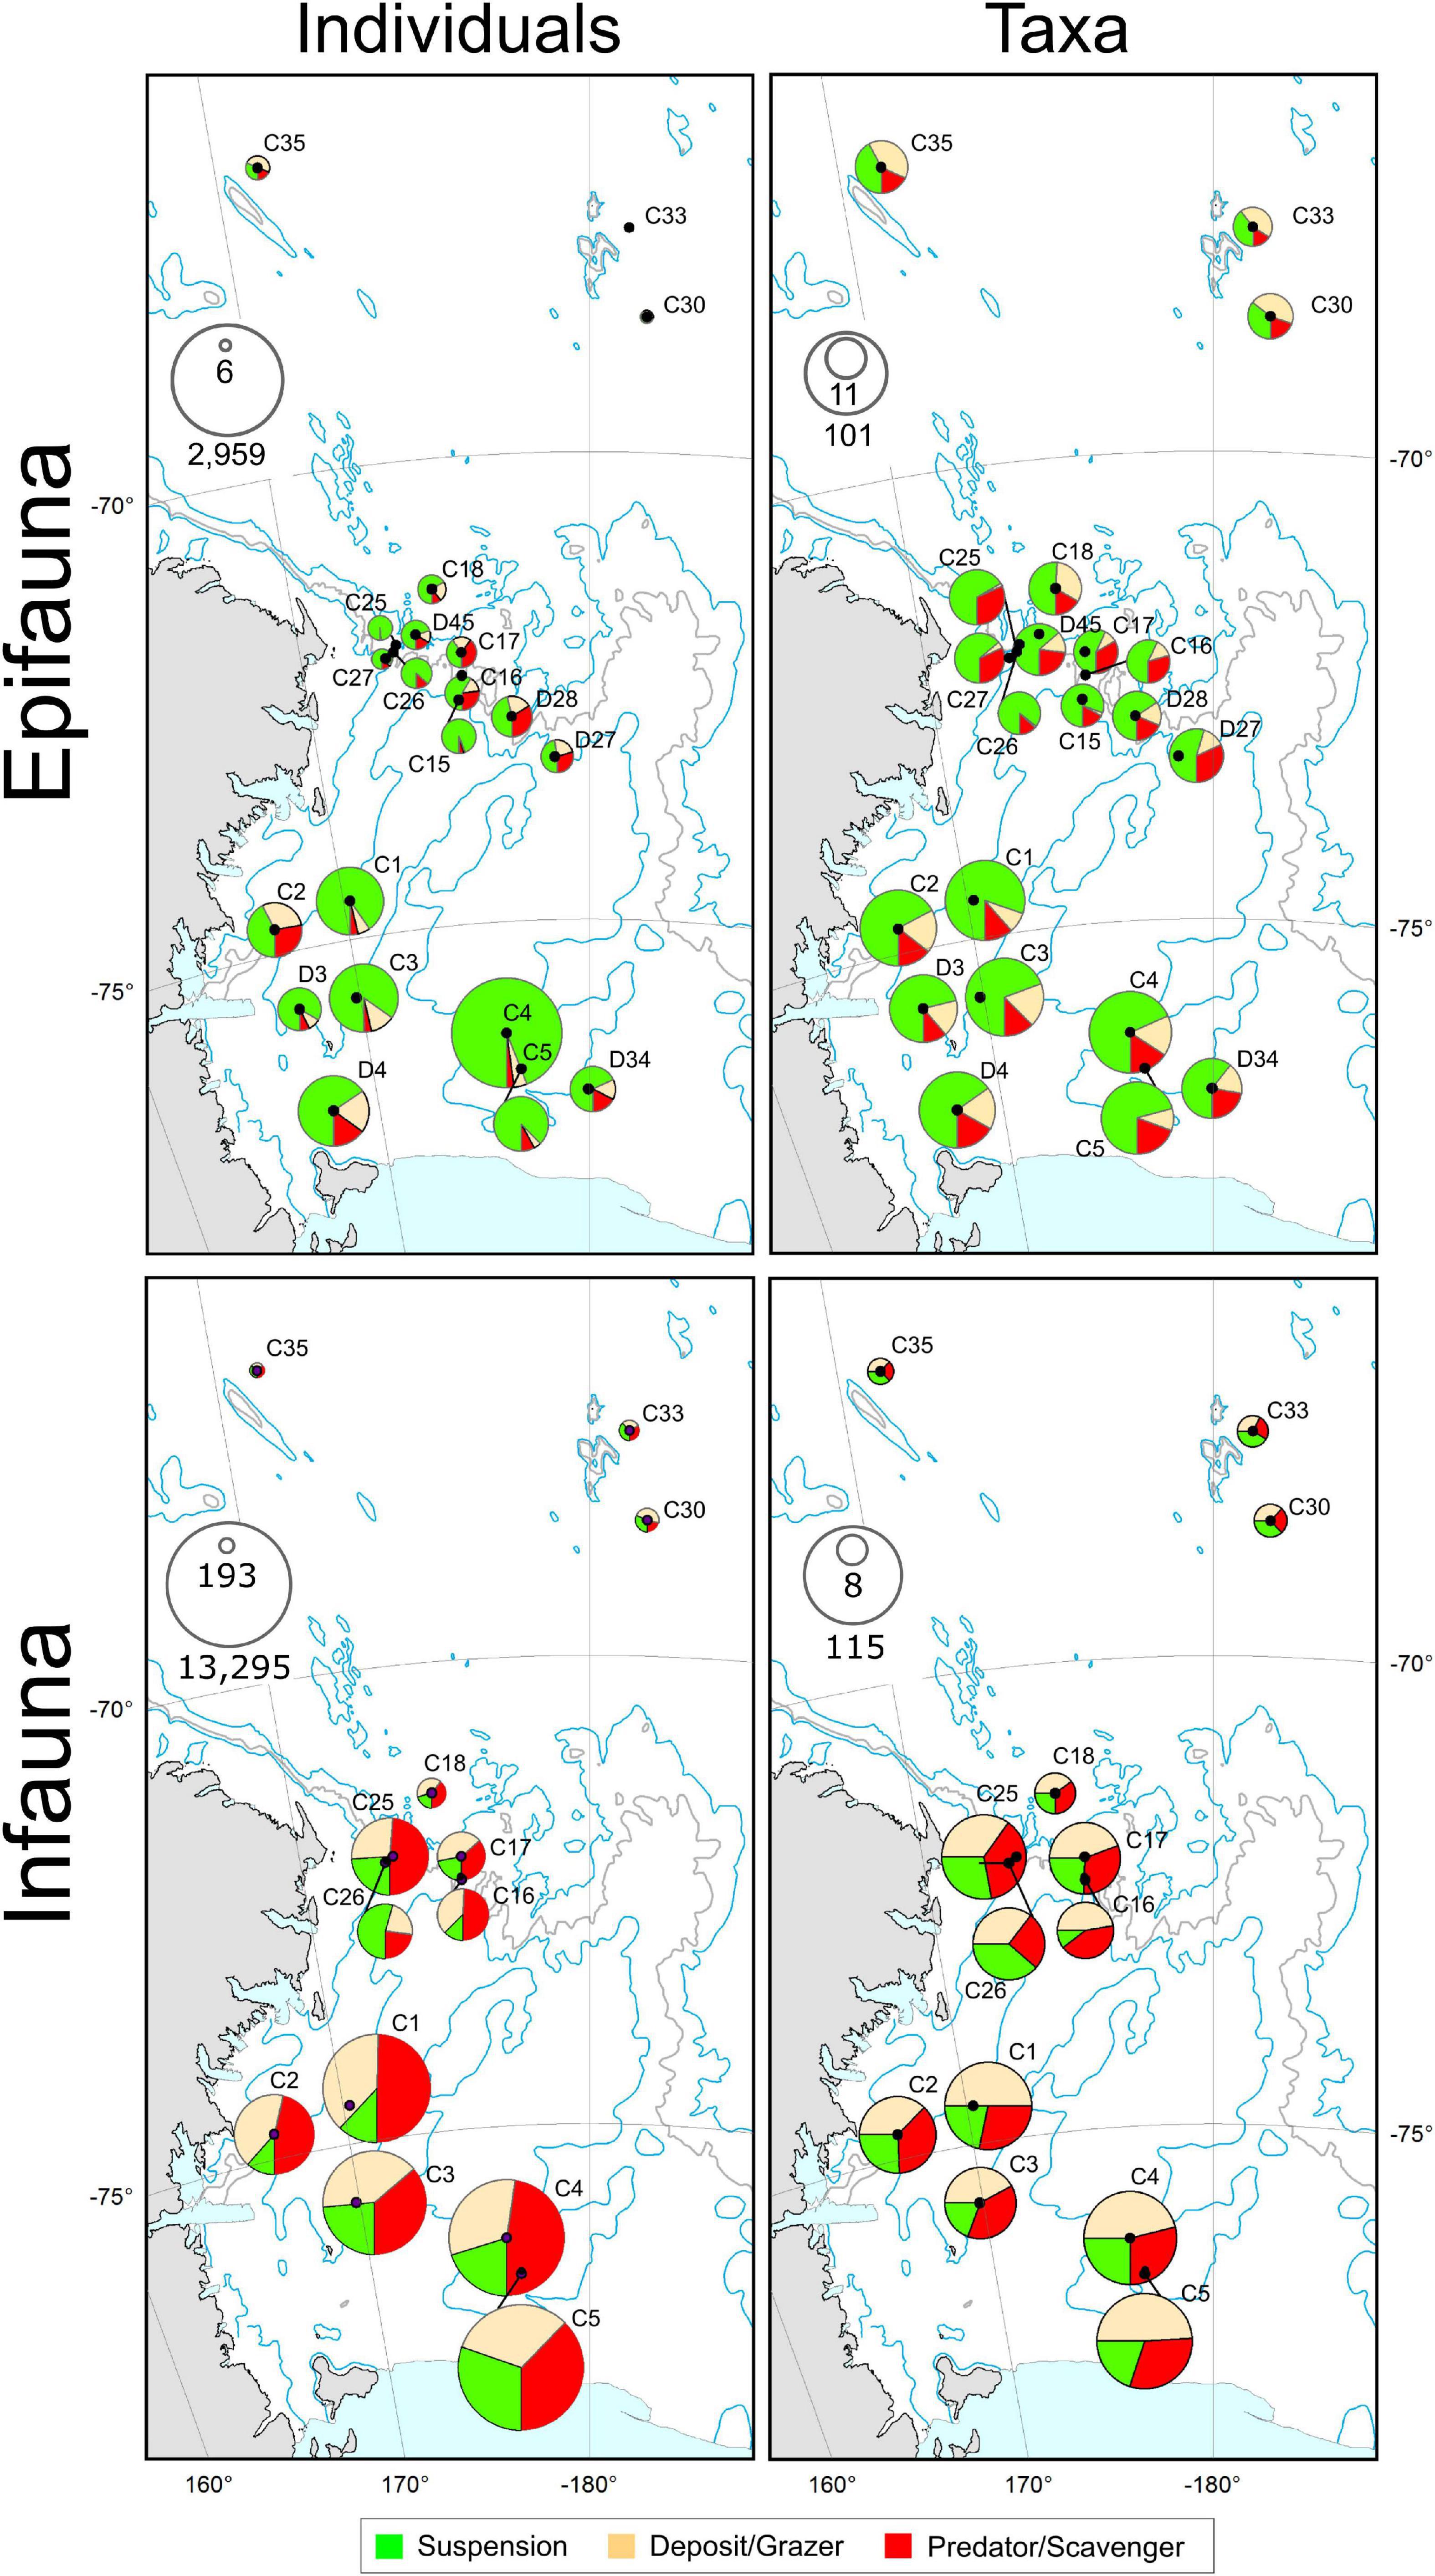
Figure 6. Feeding modes of mega-epifauna (top panels) and macro-infauna (bottom panels) represented in terms of the number of individuals (left) and the number of taxa (right) exhibiting each of three feeding modes: suspension feeders; deposit-feeders or grazers; and predators/scavengers. Pie symbol diameters are scaled in proportion to the total number of individuals (see inset max-min scales: epifauna, individuals 1000 m– 2; infauna, individuals m– 2) or taxa recorded at each site, and segments indicate the relative occurrence of each feeding category. For Mega-epifauna individuals, proportions of suspension feeders, predator-scavengers, and deposit-grazers at the Abyssal sites were: C30: 0.37, 0.23, 0.40, C33: 0.16, 0.11, 0.73; C35: 0.32, 0.20, 0.48, respectively. For macro-infauna individuals proportions were C30: 0.31, 0.48, 0.21, C33: 0.37, 0.26, 0.38; C35: 0.38, 0.29, 0.34, respectively.
When weighted by abundance, these patterns become less obvious – the Shelf and Slope macro-infaunal assemblages were both predominantly deposit feeder-grazers and predator-scavengers, with the exception of the shallowest slope site (C26) which had considerably more suspension feeders (Figure 6). No one feeding type predominated across all Abyssal stations.
Significant differences between all environments for mega-epifauna and macro-infauna feeding traits were found using PERMANOVA, both when examining taxa- and trait-weighted abundance (Tables 2, 3). There were no differences in trait variability between communities from the environments being compared, as indicated by PERMDISP (Table 3).
Across all stations and environments, there were relatively few macro-infauna taxa residing deeper in the sediments (below 2 cm; <0.5) (Supplementary Figure 1). At all Shelf sites, 0.4 – 0.5 of taxa found were top 2 cm dwellers, while on the Slope the majority were surface dwelling taxa (except at the two deepest sites, C17 and C18). A combination of top 2 cm and surface-dwellers were most common at the Abyssal sites. Weighting by abundance accentuated the predominance of top 2 cm-dwellers on the Shelf and of surface dwellers on the Slope (Supplementary Figure 1).
Concordance of Faunal Group Spatial Patterns
RELATE tests comparing patterns from the two benthic faunal groups across all sampling sites and environments showed significant concordance in all comparisons (Table 4). The strongest concordance was found using untransformed abundance data (ρ = 0.749, P = 0.001), and the weakest using presence-absence data (ρ = 0.326, P = 0.020) (Table 4).
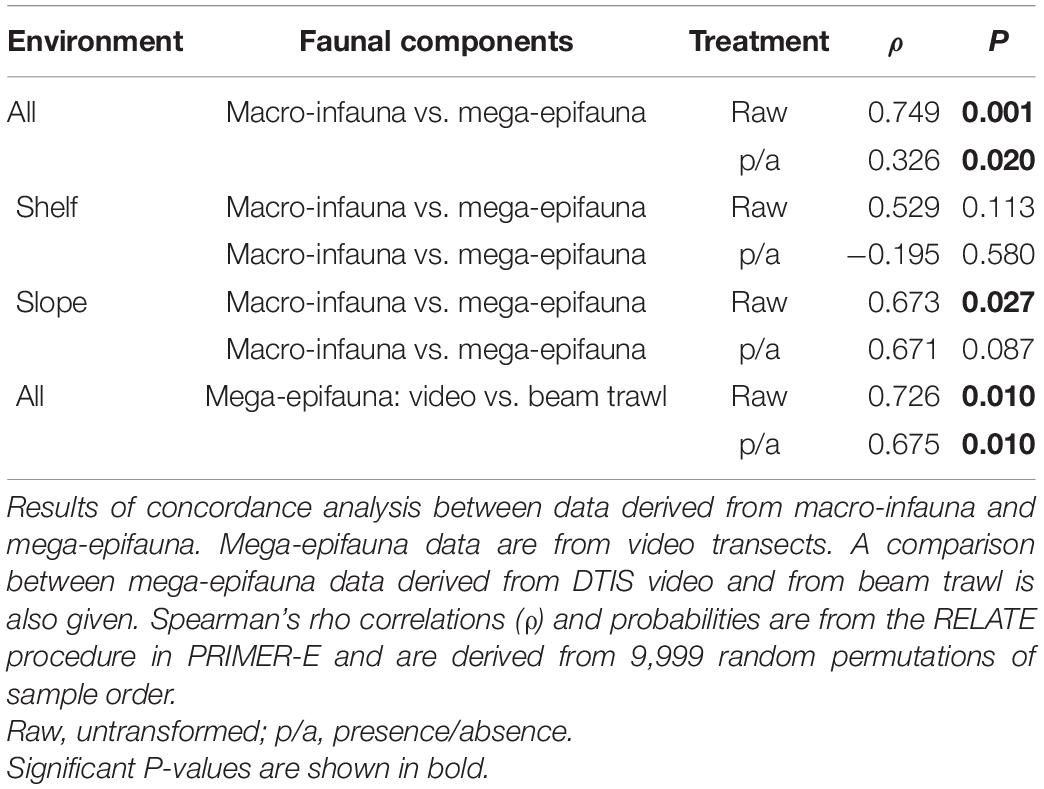
Table 4. Patterns of community composition change between all sampling sites across all environments, and within the Shelf and Slope only.
When Shelf and Slope environments were analyzed independently, concordance was weaker than for comparisons across all sampling areas and was significant only for the slope (Table 4, untransformed data only). A comparison between mega-epifaunal assemblage characteristics sampled by video or by beam trawl also showed strong and significant concordance, for all data transformations (ρ > 0.675, P = 0.010; Table 4).
The first two axes of the CA ordination of the untransformed DTIS-based mega-epifauna data explained 14.5 and 12.5% of the variance in assemblage composition, with a further 11 and 10% explained by the third and fourth axes, respectively, and a total of 48% explained across four axes. For macro-infauna, the first two axes explained 21 and 15% of the total variance, respectively, with a total of 53% explained by all four axes.
There was a significant relationship between the untransformed macro-infaunal data and the DTIS video mega-epifaunal CA scores, even with the effect of depth partialed out (p = 0.008, community composition variation explained = 42%; Supplementary Table 4). Depth by itself explained only 9% of the variability in community composition (p = 0.092).
Sea Ice, Productivity and Seabed Flux, and Community Characteristics
Community Structure
Mega-epifaunal community structure was best explained in the DistLM analysis by five variables in addition to depth: the standard deviation of ice-free time (iceFree_sd, 11.5%); mean water-column productivity (vgpm_mean, 9.9%); mean flux of primary production to the seabed (flux_mean, 7.9%); mean marginal sea-ice duration (marginal_mean, 4.3%), and the standard deviation of water-column productivity (vgpm_sd, 3.9%) (Figure 7A; untransformed ordination; Supplementary Table 5). Depth alone explained 6.8% of variance. The total explained variance was 48.9. Shelf sites were strongly distinguished from slope and abyssal sites primarily by higher productivity and to a lesser extent by mean marginal ice duration. Within each set of these broad groupings of sites (i.e., Shelf versus Slope and Abyss), individual sites were distributed along an axis defined by the variability of ice-free duration (iceFree_sd) and mean flux to the seabed (flux_mean). The westernmost Slope sites, at the outflow of the Drygalski Trough off the Adare Peninsula, together with deepest slope sites and the abyssal sites, were correlated with higher mean seabed flux and lower variability in ice-free duration than the eastern slope sites, where ice-free duration was more variable and flux was lower.
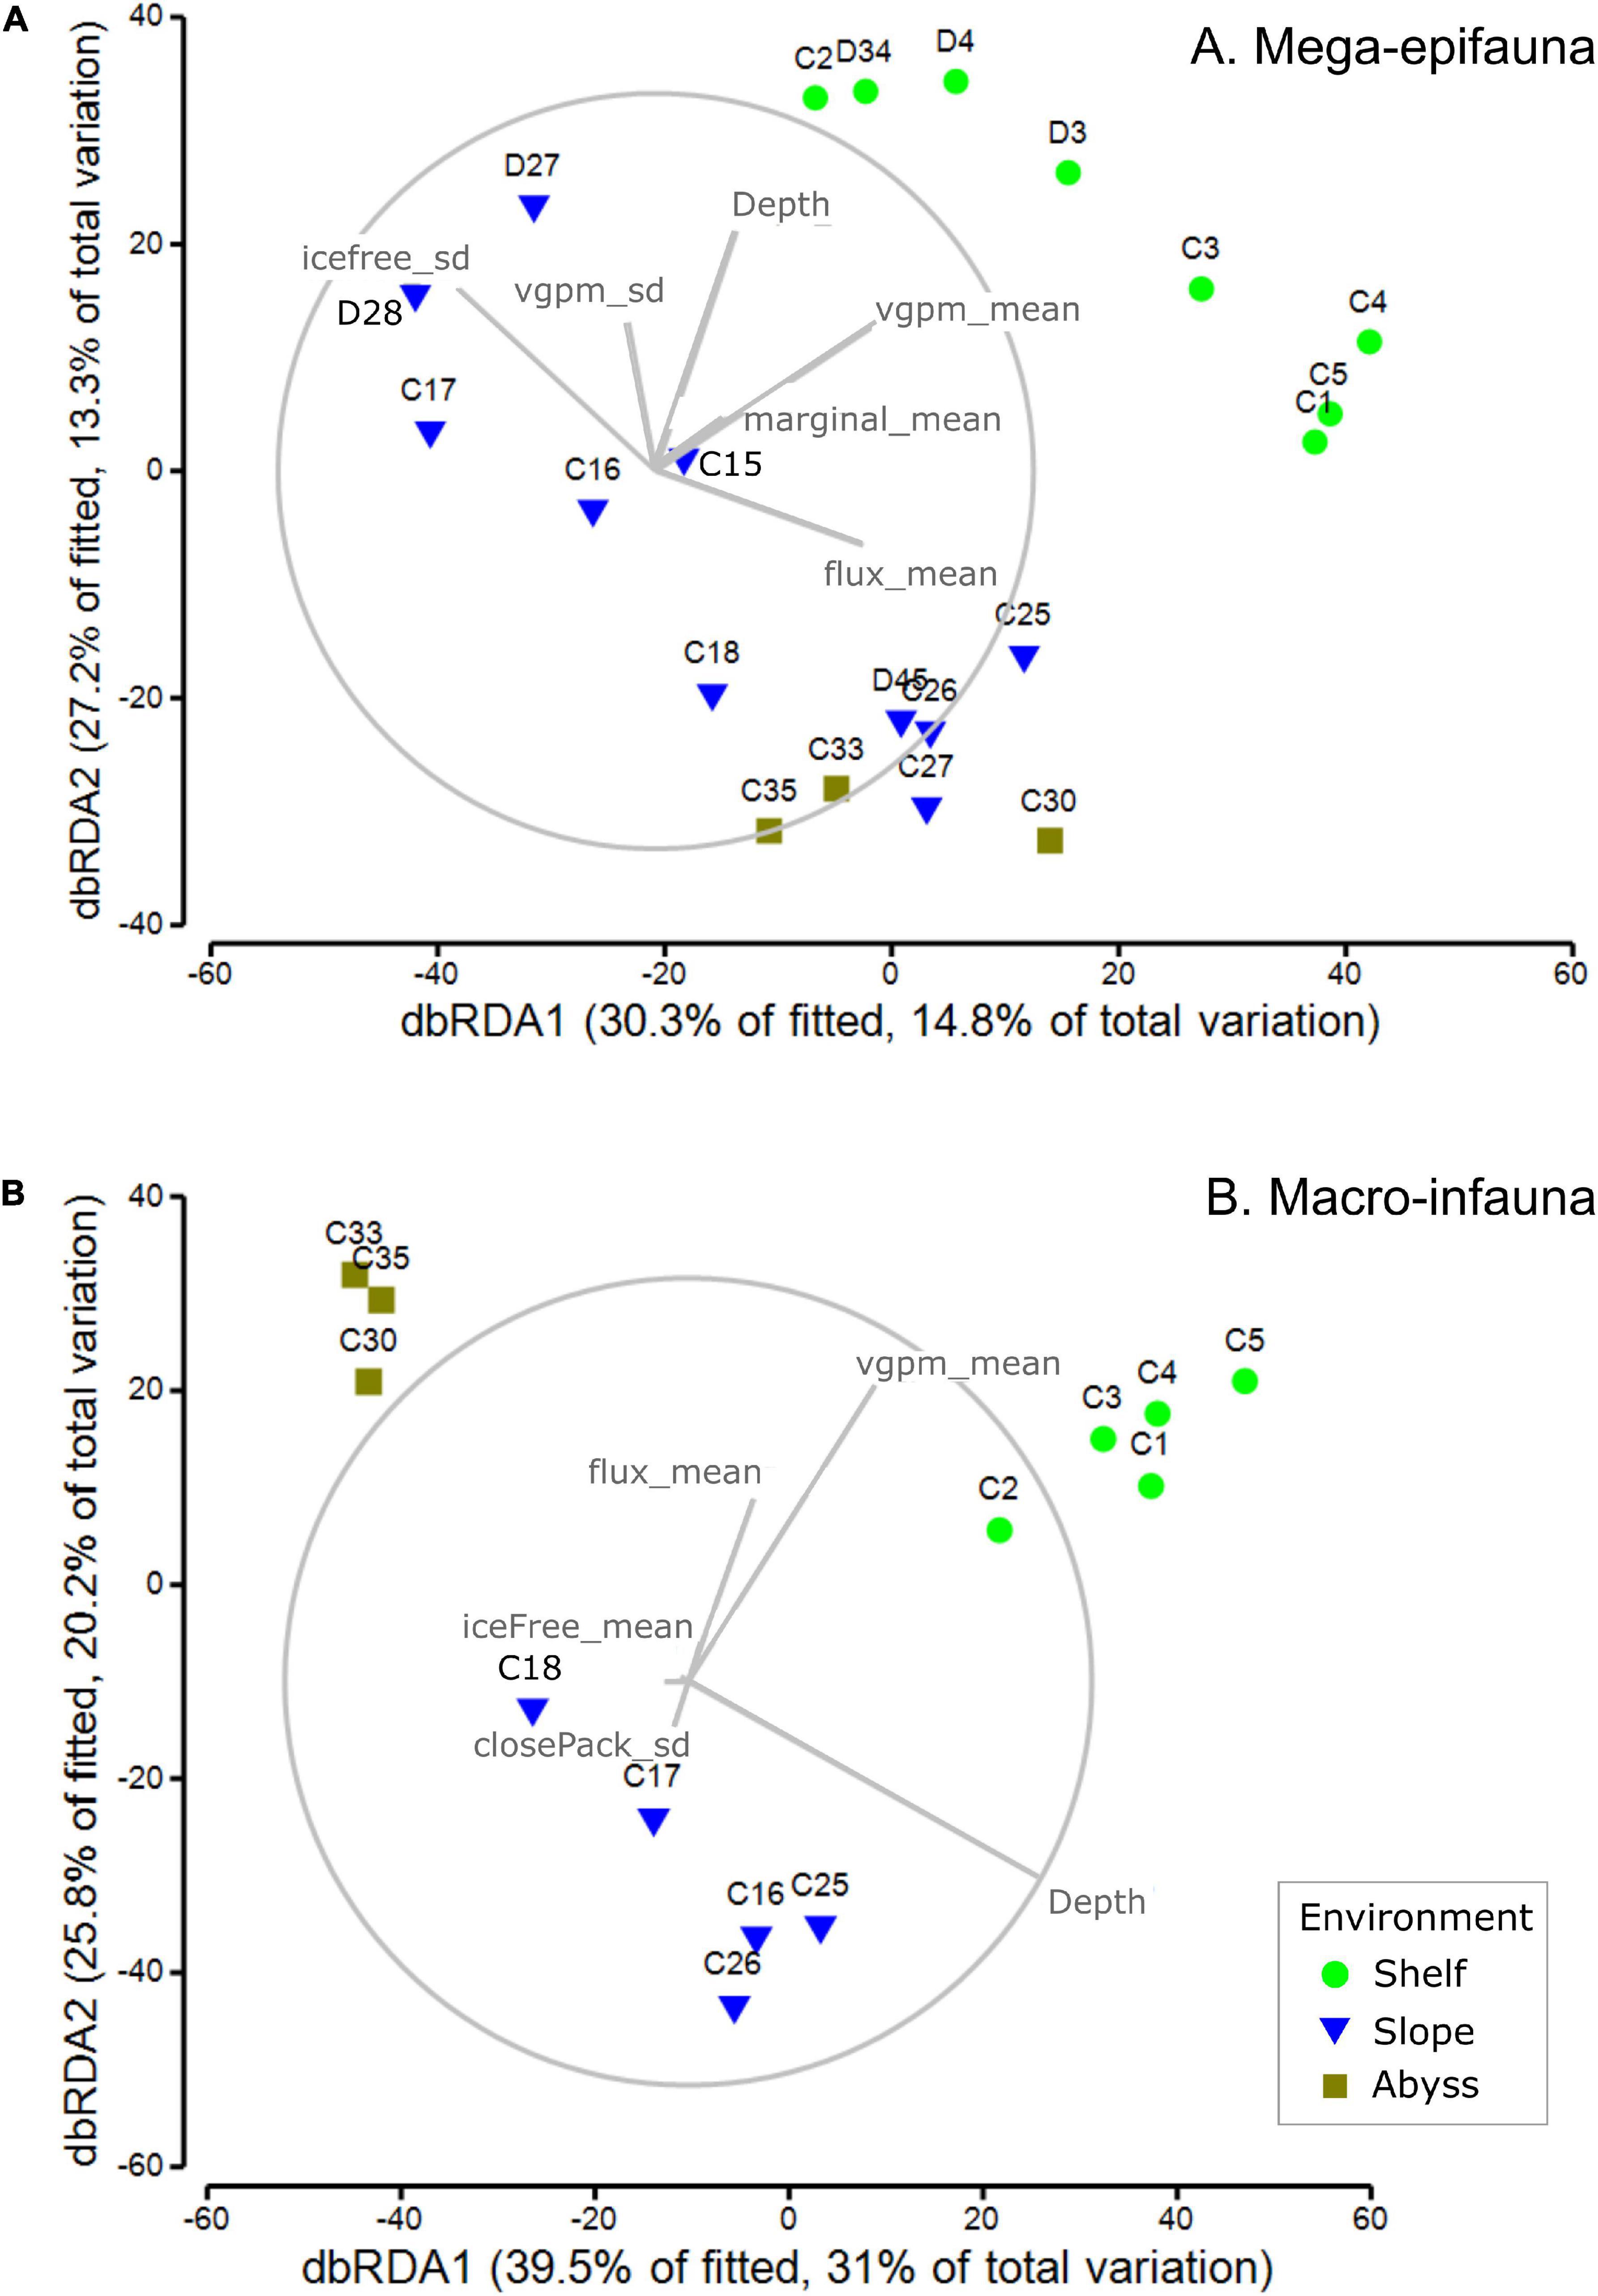
Figure 7. dbRDA ordinations community composition of (A) mega-epifaunal and (B) macro-infaunal at each site. Vector overlays indicate the strength and direction of the relationships between sea ice- and productivity-associated environmental variables on the dispersion of samples in the ordination. DistLM outputs are provided in Supplementary Tables 2, 3, respectively.
Macro-infaunal community structure was best explained by six variables in addition to depth: mean water-column productivity (vgpm_mean, 18.2%); mean flux of primary production to the seabed (flux_mean, 9.2%); mean ice-free time (iceFree_mean, 5.9%); the standard deviation of marginal sea-ice duration (marginal_sd, 5.2%), and the standard deviation of close pack-ice duration (closePack_sd, 4.7%) (Figure 7B; untransformed ordination; Supplementary Table 6). Depth alone explained 29.2% of the variance and the total explained variance was 78.5%. Shelf, slope, and abyssal sites formed three distinct groupings, with the separation of abyssal sites from the others explained primarily by depth, and the distinction between shelf and slope sites explained by higher productivity (vgpm_mean), seabed flux (flux_mean), and longer ice-free duration (iceFree_mean). Separation among Shelf sites was associated primarily with differences in these same three variables (productivity, flux, and ice-free duration) but for the Slope sites depth was the dominant variable.
Feeding Traits
Mega-epifaunal abundance weighted feeding traits were best explained in the DistLM analysis by five variables: the mean flux of primary production to the seabed (flux_mean, 20.3%), standard deviation of water-column productivity (vgpm_sd, 12.6%); standard deviation of ice-free time (iceFree_sd, 5.9%); mean water-column productivity (vgpm_mean, 2.8%); mean sea-ice (Seaice_mean, 2.2%) (Figure 8A and Supplementary Table 7). Depth explained 26.2% of variance. The total explained variance was 62.6%. Patterns of abundance weighted feeding traits showed the Shelf, Slope, and Abyss were all clearly distinguished from each other (Figure 8A and Supplementary Table 7). Shelf and Abyssal sites were characterized by higher mean flux of primary production to the seabed, water column productivity (mean and standard deviation), and to a lesser extent by standard deviation of ice-free time.
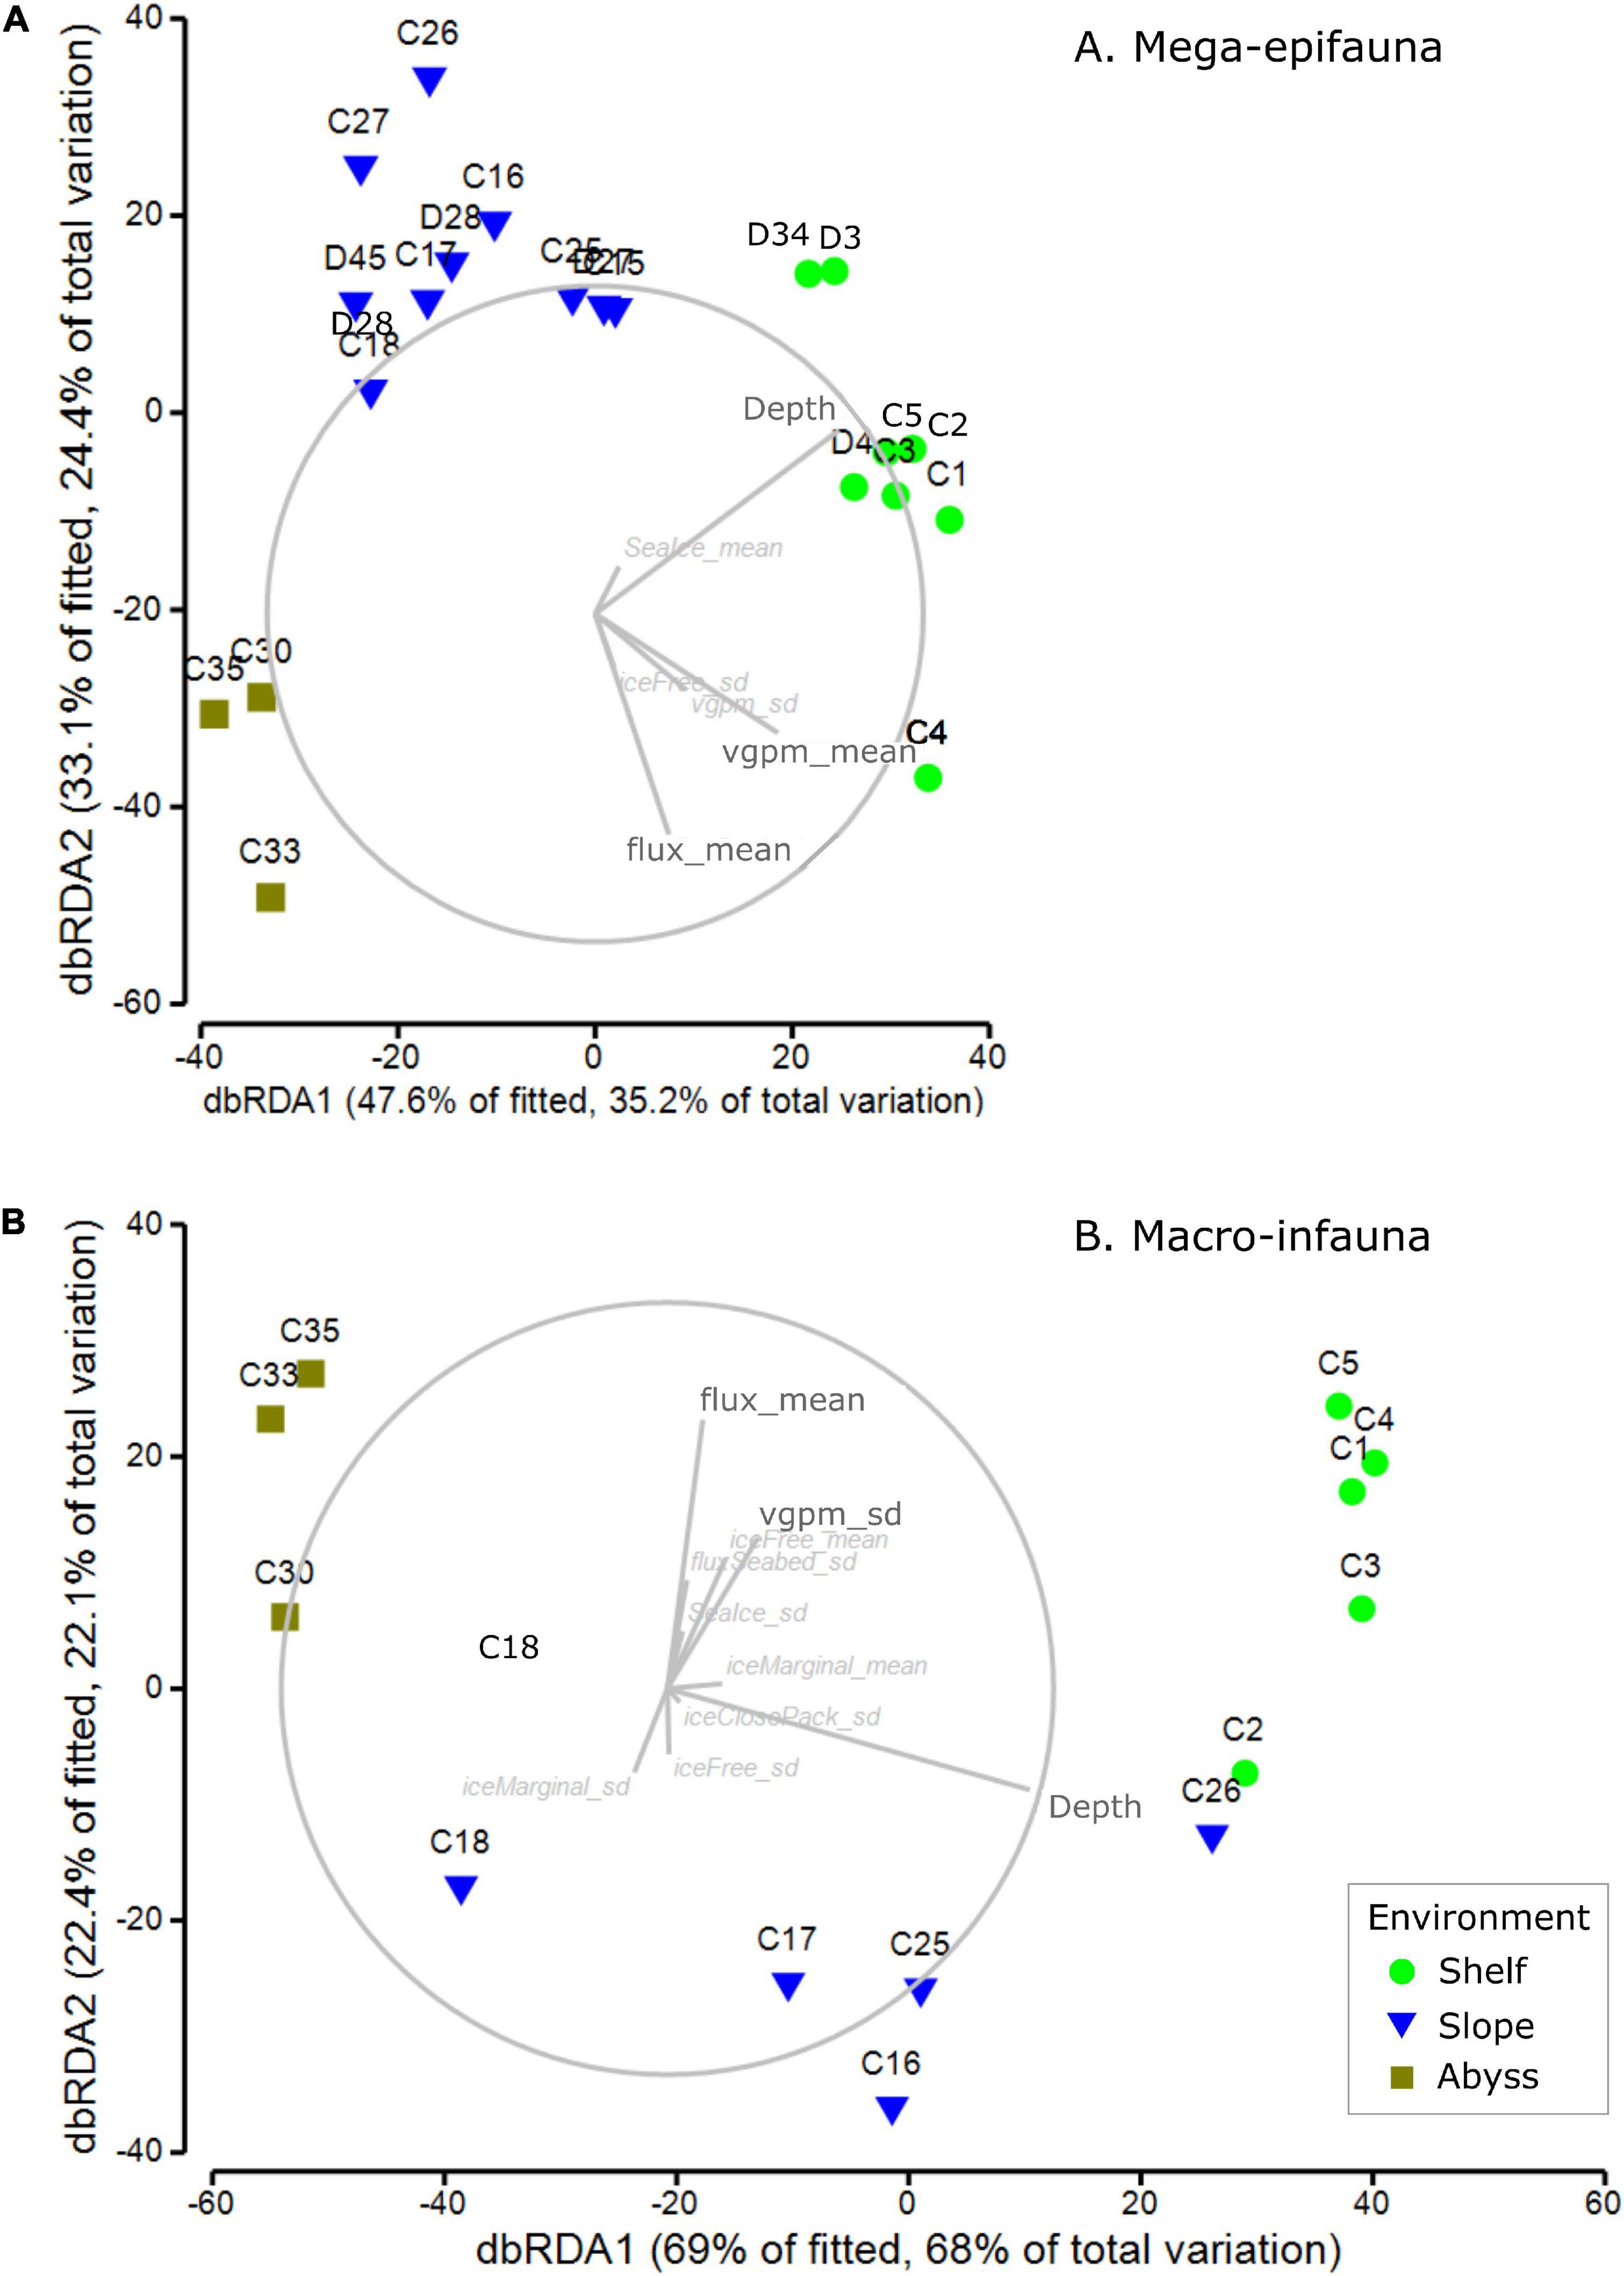
Figure 8. dbRDA ordinations of abundance weighted feeding traits of (A) mega-epifaunal and (B) macro-infaunal, at each site. Vector overlays indicate the strength and direction of the relationships between sea ice- and productivity-associated environmental variables on the dispersion of samples in the ordination. DistLM outputs are provided in Supplementary Tables 7, 8, respectively.
Macro-infaunal abundance weighted feeding traits were explained in the DistLM analysis by many variables, the most important of which was the mean flux of primary production to the seabed (flux_mean, 16.2%), followed by the standard deviation of close pack-ice duration (iceClosePack_sd, 6.5%) (Figure 8B and Supplementary Table 8). Depth explained 59.0% of the total 91.4% variance explained. The many other variables with small contributions to this total included the mean and standard deviation of ice free time (iceFree_mean, 3.5%; iceFree_sd 1.2%), standard deviation of sea ice (seaIce_sd, 2.8%), the mean and standard deviation of marginal sea-ice duration (iceMarginal_mean 1.8%, iceMarginal_sd 1.2%), flux_sd 1.4%, mean and standard deviation of water-column productivity (vgpm_mean 1.3%, vgpm_sd 0.8%).
Discussion
This study adds to our knowledge of the composition, spatial variability, and drivers of benthic invertebrate community structure and function in the Ross Sea Shelf, Slope, and Abyssal environments. We have provided new information on these communities and habitats, particularly in deep slope and abyssal areas, shown that patterns in mega-epifaunal assemblages can be used to indicate likely composition of the more cryptic (and difficult to sample) macro-infaunal assemblages at large spatial scales, and demonstrated the influence of sea ice conditions, primary production and organic flux to the seabed on benthic community characteristics (abundance, composition). Below we describe these findings and discuss their relevance to monitoring of the Ross Sea Marine Protected Area.
Variations in Benthic Habitat and Community Composition Within and Between Environments
Our eight Shelf sites spanned mean depths from 286 to 893 m, while the ten Slope and three Abyssal sites encompassed areas from 472 to 2209 m and 3225 to 3545 m, respectively. The Abyssal sites are only slightly deeper than the >3000 m used to define abyssal depths (Table 1). Our data support the expected decline in faunal diversity from the Shelf to the Abyss (e.g., Convey et al., 2014), a pattern that was particularly strong for macro-infauna (Figure 4).
We found clear differences between the Shelf, Slope, and Abyssal environments in community characteristics and their environmental drivers. In comparing these environments, it is important to note that they are located at markedly different latitudes; i.e., the Abyssal sites (68.5–66.7oS) were significantly further north than the Slope sites (72.5 to 71.3oS), with the Shelf sites from 76.8 to 74.5oS (Table 1 and Figure 1).
Seafloor substrata at Shelf sites contained predominantly soft sediments at the large scale (1000 m–2), which our small scale (m–2) sampling identified as mostly fine sand (Figure 2). Slope substrates were very heterogeneous at both scales and consisted mostly of coarser substrate/sediment fractions and higher volumes of biogenic material, including shell hash, barnacle plates and coral rubble (Figure 2). Perhaps surprisingly, the Abyssal substrates were even more heterogeneous than the Shelf substrates; with boulders and cobbles scattered amongst silt and fine sand (Figure 2). This may reflect the deposition of glacial drop-stones and scour material from the last glacial maximum, or the close proximity of these sites to seamounts (Bowden et al., 2011; Clark and Bowden, 2015). Earlier surveys in the deep Southern Ocean noted a high frequency of drop-stones amongst soft muds (e.g., Bullivant, 1959; Brandt et al., 2007).
Sediment organic content was very low < 3.1% (Supplementary Table 1) across all environments. These values are within the range of those found at selected shelf areas (<750 m deep) from another study in the north-western Ross Sea (<3.5%, Cummings et al., 2010). Sediment phaeophytin concentrations were considerably higher on the Shelf (1.84 – 7.28 μg phaeophytin g–1 sediment) than in the deeper Slope or Abyssal sites (<<1 μg phaeophytin g–1 sediment), reflecting the reduced flux of algal material from surface to deeper waters.
The apparently higher substrate diversity on the Slope (see Figure 2), did not translate to greater species diversity: mega-epifaunal abundances and numbers of taxa were higher on the Shelf than on the Slope or Abyssal plain (Figures 3A,B), and shelf assemblages were distinct from those at the other environments in multivariate analyses (Figure 5). Mega-epifauna were predominantly suspension feeders across the Shelf and Slope stations, with highest densities of suspension feeders found at the shallower bank sites (C4 and C1). In the Abyss deposit feeder-grazers were found in higher or equal abundances (Figure 6). Bryozoans, sponges, and crinoids were the major conspicuous groups on banks, but even in the deep basins sponges, crinoids, and pennatulaceans were abundant. In their study of Ross Sea Shelf sites spanning depths from 270 to 1173 m, Barry et al. (2003) also found that suspension feeding mega-epifauna were more dominant in the shallow waters, with deposit feeders most abundant at the deepest sites. Our data show an increase in the abundance of deposit-feeding taxa at deeper shelf sites for mega-epifauna (Figure 6, sites C2, D4, D34) but not for macro-infauna.
Mega-epifaunal assemblages on the continental Shelf are distinct from those on the Slope and in the Abyss in our analyses, aligning with well-documented general characteristics of Antarctic continental shelf fauna, including the predominance of sessile suspension feeders, particularly bryozoans, sponges and comatulid crinoids and the absence of decapod crustaceans (Clarke and Johnston, 2003; Clarke et al., 2004). These characteristics are thought to result from environmental conditions in the present, including the extremely cold, stable, seawater temperatures (Frederich et al., 2001) and absence of riparian sedimentation (Aronson and Blake, 2001), but also from historical events, particularly the episodic defaunation of continental shelf areas during glacial maxima (Clarke and Crame, 1992). The distinct character of the shelf fauna is emphasized by the gradient of assemblage change from sites on the shelf break down to abyssal depths. Despite greater variation in substrate types among the slope sites (Figure 2) and a broad depth range, conditions on the shelf are sufficiently different to maintain a distinct fauna.
Distinct macro-infaunal assemblages were observed between all three environments and, like the mega-epifauna, taxa were generally more diverse on the Shelf (Figure 3). Abundances were higher there than on either the Slope or Abyssal plain, and in the Slope sites compared to the Abyssal sites (Figure 3). In contrast to the mega-epifauna, suspension feeders were the least common macro-infaunal feeding type on the Shelf and Slope (Figure 6). On the Shelf, deposit feeder-grazers and predator-scavengers were most common. There was no clear pattern of feeding type across the Abyssal sites, although fewer predator/scavengers were found there. Sea ice conditions in an area over time may influence the feeding types of the taxa present. Analysis of benthic macrofaunal community data spanning 26 years on the north eastern Weddell Sea shelf found a decrease in suspension feeders, an increase in deposit feeders, and an overall decline in biomass, in association with an increasing trend of sea ice cover, which the authors’ attributed to reduced productivity and vertical flux of organic matter (Pineda-Metz et al., 2020).
While both faunal groups showed distinct clustering of assemblages from each environment in the MDS ordinations, clear separation between sites within environments was also apparent (Figure 5). Comparison of the ordinations derived from presence/absence transformed vs. raw data indicate considerable similarity in mega-epifaunal taxa comprising the Shelf site assemblages (Figure 5C vs. 5A) and, for macro-infauna, closer clustering of Shelf sites with some Abyssal sites (Figure 5D vs. 5B). The latter is primarily due to the occurrence of cirratulids and nematodes at Shelf sites and at Abyssal sites C30 and C35. Assemblage variability among Shelf sites was less than that among Slope or Abyssal sites, as shown by the closer grouping (lower dispersion) of Shelf sites in the MDS ordinations (Figure 5). This can be explained by the Slope sites encompassing greater ranges of environmental variables and habitats than the Shelf sites; most obviously, they extend over a greater depth range than the Shelf sites.
Concordance of Spatial Patterns in Mega-Epifauna and Macro-Infauna Benthic Community Composition
To explore whether surface dwelling mega-epifauna can be used to indicate likely composition of the cryptic (and more difficult to sample) macro-infauna, we examined the extent to which mega-epifauna and macro-infaunal patterns in benthic communities co-occur. Results show that patterns of assemblage variability across the whole study area are largely similar (concordant) regardless of which faunal fraction is examined. Thus, the same general patterns are seen whether we look at mega-epifauna or macro-infauna. However, despite the significance of these relationships, the strength of the correlations between faunal fractions varied. Correlations between macro-infauna and mega-epifauna were stronger for quantitative comparisons (ρ = 0.749 for untransformed data; Table 4) than for that using presence-absence data. This suggests that the concordance between faunal fractions is influenced by both assemblage composition and changes in abundance.
A comparative analysis of benthic infauna (collected using multibox corer) and epifauna (obtained from imagery) in the southern Weddell Sea similarly found comparable spatial distribution patterns (Pineda-Metz and Gerdes, 2018), suggesting this pattern may be widespread in the Southern Ocean. The generally strong concordance between macro-infauna and mega-epifauna patterns across our entire study area suggests that these elements of the fauna are responding to similar environmental constraints at this scale (e.g., large-scale differences in organic content, benthic production, hydrodynamic conditions). This relationship remained strong within the Slope environment but was moderate (and non-significant) on the Shelf (p < 0.05; Table 4), suggesting that generalizations across faunal groups in terms of how we explain observed patterns might only be appropriate at larger spatial scales. In other words, while we might be able to predict macro-infaunal communities on the basis of mega-epifaunal data at the scale of environments (e.g., between Shelf and Slope), this would not be reliable for sites within one of these environments (e.g., discriminating macro-infaunal communities between sites on the Shelf on the basis of the mega-epifaunal community). Concordance was also strong for comparisons between video and beam trawl mega-epifauna data across all three environments (Table 4), indicating that patterns of assemblage similarity between sites at the largest spatial scale of the survey can be summarized effectively by reference to either data set.
Environmental Conditions – Explaining Benthic Community Characteristics
The importance of sea ice conditions, their influence on productivity – and so on flux of organic material to the seafloor (Smith et al., 2006; Arrigo et al., 2015; Isla, 2016) – as a driver of benthic community structure and function is well recognized (e.g., Cummings et al., 2018; Pineda-Metz et al., 2019), even at depths far below the surface (Gutt et al., 2019). Incorporating spatial and temporal variability in sea ice concentrations and conditions, rather than just an average concentration, is important in understanding different distribution patterns, particularly as the extent, timing and duration of sea ice break out will affect the magnitude and timing of primary production (e.g., Gutt et al., 2012; Ingels et al., 2012; Kim et al., 2018). We assessed the influence of various concentrations of sea ice [from an overall average, to ice free (concentrations < 15%), marginal (15-40%), and close pack (>70%)], and summarized these over the 10 years period prior to our sampling. For each site, we calculated the mean time these conditions were experienced, and the variability around these means. Results for general community composition revealed that the % of time a site was ice free or experienced marginal ice was important for both mega-epifauna and macro-infauna, although when the mean values were highlighted as important for one community type, the variability (SD) was identified for the other (Figure 7 and Supplementary Tables 2, 3). Other key explanatory variables for both community groups were mean VGPM (net primary production; particularly for macro-infauna) and seabed flux (downward vertical flux of particulate organic matter at the seabed). The variability (SD) in VGPM was also identified for mega-epifauna, and variability in the % of time of close pack ice was also important for the macro-infaunal model (Figure 7). Combinations of these same variables (Flux mean, VGPM mean and SD, and ice free time SD) were important for the mega-epifauna feeding traits, where the shelf and slope had high percentages of suspension feeders, and the abyss had equal or higher numbers of deposit feeder-grazers (Figure 8). In contrast, many different environmental variables explained the distribution of macro-infaunal abundance-weighted feeding traits, which is perhaps reflected in the mixture of feeding types found on the Slope and Abyss and the low predominance of suspension feeders on the Shelf (Figure 8).
Sea ice conditions and concentrations are correlated with and strongly influence primary production and flux (both physically, and in the calculation of these variables). These findings point to the importance of formally including and considering the drivers of food supply in analyses explaining existing benthic community distributions, and especially when predicting consequences of future environmental change.
We also found strong correlations of simple assemblage variables (number of taxa and individuals; Figure 4) and changes in assemblage composition (Figures 7, 8), with depth. Across the Southern Ocean, deep sea faunal composition differs from that on the Shelf (Brandt et al., 2007, 2012). For example, there is a general decline in the number of some macrofaunal groups (bivalves, gastropods, polychetes) from the Shelf to the Slope, followed by stable, lower numbers at greater depth (Brandt et al., 2009). However, the relationship with depth is not consistent among groups (e.g., isopods increase in abundance from the Slope to the Abyss; Ellingsen et al., 2007), and Brandt et al. (2007) comment that there is rarely any clear relationship of biodiversity pattern with depth (or indeed latitude or environmental parameters). This is particularly apparent from previous analyses of Shelf faunal assemblages in the Ross Sea (Cummings et al., 2010), despite the broad depth range sampled (i.e., 50 – 750 m). As noted above, our data show distinct, tight clustering of Shelf assemblages for mega-epifauna and macro-infauna, but more variation in assemblages within the Slope and Abyssal environments (e.g., Figure 5). In fact, some of the same macro-infaunal species characterize both the Shelf and Abyssal sites (presence-absence ordination; Figure 5D). Several ecologically important variables, notably pressure, light, and the availability of food, co-vary with depth (Levin et al., 2001), and it is likely that these and other important environmental factors (e.g., hydrodynamic conditions) will be influential in determining distributions (e.g., Pineda-Metz et al., 2019). Past colonization history will also be key (e.g., Thatje, 2012).
It is also highly probable that biotic interactions between faunal classes contribute to concordant patterns of distribution. For instance, the activities of, and habitats provided by, mega-epifauna might affect macro-infaunal community composition, and will be but one factor influencing the types and living positions of infaunal taxa (e.g., Supplementary Figure 1; Gutt, 2006). When the effect of depth was removed from the concordance analyses, the relationship between macro-infauna and mega-epifauna remained significant.
Ross Sea MPA
The Ross Sea MPA was established in December 2018 to enhance understanding of the effects of fishing and climate change on a valued high latitude marine ecosystem, and is the focus of an on-going research and monitoring program (CCAMLR, 2016; Dunn et al., 2017; Parker and Dunn, 2018). The sites sampled in this study span areas of interest to the Ross Sea MPA: all of the Shelf sites sampled (C1 – C5, D3, D4, and D34) fall within General Protection Zone 1 (GPZ I); Slope sites straddle the boundary of GPZ I off the Adare Peninsula, including cross-Shelf-break sites within GPZ I (C25, C26, and C27) and outside the MPA in an area of high fishing intensity for toothfish (C15, C16, C17, D27, D28); the Abyssal sites include one that lies within GPZ I (adjacent to Admiralty Seamount), and two that lie just outside of GPZ III (encompassing Scott Island and associated features). The data presented in this paper are from a 2008 voyage, conducted over a decade after the toothfish fishery was first established in 1995 and a decade before the MPA was established. These data analyses can aid our understanding of the distributions of seabed habitats and fauna inside and outside the Ross Sea MPA boundaries, and along with information from earlier studies (e.g., Bullivant and Dearborn, 1967; Barry et al., 2003; Kröger and Rowden, 2008; Bowden et al., 2011; Clark and Bowden, 2015), contribute to an expanding baseline of data against which the success of the MPA, and variability and change in benthic communities can be evaluated. A broader analysis, combining all available benthic community data from earlier Ross Sea studies (abundance, diversity, and feeding traits) with information on sea ice and productivity trends, would be a valuable addition to understanding the status of benthic habitats in the MPA.
Conclusion
Net primary productivity and seabed organic flux, along with sea ice concentrations and variability over time are important structuring factors for both mega- and macro-infaunal communities (e.g., Pineda-Metz et al., 2020). Even though the influence of sea ice conditions on surface productivity occurs far above the seafloor, we have demonstrated their influence on benthic communities (e.g., Jansen et al., 2018a). This illustrates the importance of better understanding bentho-pelagic coupling in this region, and the need to consider water circulation and currents (not considered here, and not always well resolved at small-intermediate scales) and so the dispersal, distribution and flux of this surface derived food source (e.g., Jansen et al., 2018b). Future changes in Ross Sea sea ice conditions, circulation patterns and ocean chemistry are predicted as a result of climate change and ocean acidification that will alter these important variables, and will in turn, significantly affect ecosystem dynamics. Monitoring these factors longer term will be key to understanding natural variability and trends in benthic ecosystems. Their inclusion, along with biological information (e.g., species dispersal modes and potential, inter- and intraspecific interactions, community dynamics), in biogeographic distribution and process-based models, will also enable meaningful predictions of how these ecosystems may be impacted by future projected environmental changes.
Data Availability Statement
The original contributions presented in the study are included in the article/Supplementary Material, further inquiries can be directed to the corresponding author/s.
Author Contributions
VC and DB designed the sampling and sample processing and analyses. NH coordinated the macroinvertebrate processing and constructed the functional traits data set. MP analyzed the satellite sea ice and productivity components. JH and DB conducted the statistical analyses. VC planned and wrote the initial manuscript, with input from JH and DB. All the authors edited and approved the final version.
Funding
Data collection for this research was funded by the New Zealand Government under the New Zealand International Polar Year-Census of Antarctic Marine Life Project (IPY2007-01). The write up and analyses were funded by NIWA Coasts and Oceans SSIF.
Conflict of Interest
The authors declare that the research was conducted in the absence of any commercial or financial relationships that could be construed as a potential conflict of interest.
Acknowledgments
We thank the officers and crew of RV Tangaroa and the science staff on the 2008 RV Tangaroa voyage to the Ross Sea (IPY-CAML) for their help with sample collection and processing on board. Sincere thanks are due to the many international expert taxonomists who examined and verified invertebrate identifications, and to Peter Marriott (NIWA) for his contribution to the functional trait analyses. Thanks to the reviewers for their constructive comments that improved the manuscript, and the editor for the opportunity to contribute to this topic.
Supplementary Material
The Supplementary Material for this article can be found online at: https://www.frontiersin.org/articles/10.3389/fmars.2021.629787/full#supplementary-material
References
Arntz, W. E., Brey, T., and Gallardo, V. A. (1994). Antarctic zoobenthos. Oceanogr. Mar. Biol. 32, 241–304.
Aronson, R. B., and Blake, D. B. (2001). Global climate change and the origin of modern benthic communities in Antarctica. Am. Zool. 41, 27–39. doi: 10.1093/icb/41.1.27
Aronson, R. B., Thatje, S., McClintock, J. B., and Hughes, K. A. (2011). Anthropogenic impacts on marine ecosystems in Antarctica. Ann. N. Y. Acad. Sci. 1223, 82–107. doi: 10.1111/j.1749-6632.2010.05926.x
Arrigo, K. R., and van Dijken, G. L. (2004). Annual changes in sea-ice, chlorophyll a, and primary production in the Ross Sea, Antarctica. Deep Sea Res. 2 Top. Stud. Oceanogr. 51, 117–138. doi: 10.1016/j.dsr2.2003.04.003
Arrigo, K. R., van Dijken, G. L., and Bushinsky, S. (2008). Primary production in the Southern Ocean, 1997–2006. J. Geophys. Res. 113:C08004. doi: 10.1029/2007JC004551
Arrigo, K. R., Van Dijken, G. L., and Strong, A. L. (2015). Environmental controls of marine productivity hot spots around Antarctica. J. Geophys. Res. Oceans 120, 5545–5565. doi: 10.1002/2015jc010888
Barnes, D. K. A., Kuklinski, P., Jackson, J. A., Keel, G. W., Morley, S. A., and Winston, J. E. (2011). Scott’s collections help reveal accelerating marine life growth in Antarctica. Curr. Biol. 21, R147–R148. doi: 10.1016/j.cub.2011.01.033
Barry, J. P., Grebmeier, J. M., Smith, J., and Dunbar, R. B. (2003). Oceanographic versus seafloor-habitat control of benthic megafaunal communities in the S.W. Ross Sea, Antarctica. Antarct. Res. Ser. 78, 327–354. doi: 10.1029/078ars21
Behrenfeld, M. J., and Falkowski, P. G. (1997). Photosynthetic rates derived from satellite-based chlorophyll concentration. Limnol. Oceanogr. 42, 1–20. doi: 10.4319/lo.1997.42.1.0001
Bowden, D. A., and Jones, D. O. B. (2016). “Towed cameras,” in Biological Sampling in The Deep Sea, eds M. R. Clark, A. A. Rowden, and M. Consalvey (Chichester: Wiley & Sons Ltd), 260–284. doi: 10.1002/9781118332535.ch12
Bowden, D. A., Schiaparelli, S., Clark, M. R., and Rickard, G. J. (2011). A lost world? Archaic crinoid-dominated assemblages on an Antarctic seamount. Deep Sea Res. 2 Top. Stud. Oceanogr. 58, 119–127. doi: 10.1016/j.dsr2.2010.09.006
Brandt, A., De Broyer, C., Ebbe, B., Ellingsen, K. E., Gooday, A. J., and Janussen, D. (2012). “Southern Ocean deep benthic biodiversity,” in Antarctic Ecosystems: An Extreme Environment in a Changing World, 1st Edn, eds A. D. Rogers, N. M. Johnston, E. J. Murphy, and A. Clarke (Chichester: Blackwell Publishing Ltd), 291–334.
Brandt, A., Gooday, A. J., Brandao, S. N., Brix, S., Brökeland, W., Cedhagen, T., et al. (2007). First insights into the biodiversity and biogeography of the Southern Ocean deep sea. Nature 447, 307–311. doi: 10.1038/nature05827
Brandt, A., Linse, K., and Schüller, M. (2009). Bathymetric distribution patterns of Southern Ocean macrofaunal taxa: Bivalvia, Gastropoda, Isopoda and Polychaeta. Deep Sea Res. 1 56, 2013–2025. doi: 10.1016/j.dsr.2009.06.007
Brey, T., and Clarke, A. (1993). Population dynamics of marine benthic invertebrates in Antarctic and Subantarctic environments: are there unique adaptations? Antarct. Sci. 5, 253–266. doi: 10.1017/s0954102093000343
Bullivant, J. S. (1959). An oceanographic survey of the Ross Sea. Nature 184, 422–423. doi: 10.1038/184422a0
Bullivant, J. S., and Dearborn, J. H. (1967). The fauna of the Ross Sea. Part 5. General accounts, station lists, and benthic ecology. New Zealand Oceanographic Institute memoirs No. 32. Wellington: New Zealand Dept. of Scientific and Industrial Research. 77.
Cael, B. B., Bisson, K., and Follett, C. (2018). Can rates of ocean primary production and biological carbon export be related through their probability distributions? Global Biogeochem. Cycles 32, 954–970. doi: 10.1029/2017GB005797
Cavalieri, D., Gloerson, P., and Zwally, J. (1990/2007). “DMSP SSM/I daily polar gridded sea-ice concentrations, 1997 to 2006,” in Digital Media, eds J. Maslanik, J. Stroeve, and C. O. Boulder, National Snow Ice Data Center. Available online at: https://nsidc.org/data/NSIDC-0079/versions/3 (accessed June, 2018).
Cavalieri, D. J., Campbell, W. J., and Gloersen, P. (1984). Determination of sea ice parameters with the NIMBUS 7 SMMR. J. Geophys. Res. 89, 5355–5369. doi: 10.1029/jd089id04p05355
CCAMLR (2016). Conservation Measure 91-05 (2016): Ross Sea Region Marine Protected Area. Unpublished document. Hobart, TAS: CCAMLR.
Chevenet, F., Doledec, S., and Chessel, D. (1994). A fuzzy coding approach for the analysis of long-term ecological data. Freshw. Biol. 31, 295–309. doi: 10.1111/j.1365-2427.1994.tb01742.x
Clark, M. R., and Bowden, D. A. (2015). Seamount biodiversity: high variability both within and between seamounts in the Ross Sea region of Antarctica. Hydrobiologia 761, 161–180. doi: 10.1007/s10750-015-2327-9
Clarke, A., Aronson, R. B., Crame, J. A., Gil, J. M., and Blake, D. B. (2004). Evolution and diversity of the benthic fauna of the Southern Ocean continental shelf. Antarct. Sci. 16, 559–568. doi: 10.1017/s0954102004002329
Clarke, A., and Crame, J. A. (1992). The Southern Ocean benthic fauna and climate change–a historical perspective. Philos. Trans. R. Soc. Lond. B Biol. Sci. 338, 299–309. doi: 10.1098/rstb.1992.0150
Clarke, A., and Johnston, N. M. (2003). Antarctic marine benthic diversity. Oceanogr. Mar. Biol. 41, 47–114.
Clarke, K. R., and Warwick, R. M. (2001). Change in Marine Communities: An Approach to Statistical Analysis, 2nd Edn. Plymouth: PRIMER-E Ltd.
Comiso, J. C. (1983). Sea ice effective microwave emissivities from satellite passive microwave and infrared observations. J. Geophys. Res. 88, 7686–7704. doi: 10.1029/jc088ic12p07686
Comiso, J. C. (1995). SSM/I Sea Ice Concentrations Using the Bootstrap Algorithm. NASA Report 1380. Washington, D.C: National Aeronautics and Space Administration.
Comiso, J. C. (2003). “Large-scale characteristics and variability of the global sea ice cover,” in Sea Ice: An Introduction to its Physics, Chemistry, Biology and Geology, eds D. N. Thomas and G. S. Dieckmann (Oxford: Blackwell Science), 112–142. doi: 10.1002/9780470757161.ch4
Convey, P., Chown, S. L., Clarke, A., Barnes, D. K. A., Bokhorst, S., Cummings, V., et al. (2014). The spatial structure of Antarctic biodiversity. Ecol. Monogr. 84, 203–244. doi: 10.1890/12-2216.1
Cummings, V. J., Hewitt, J. E., Thrush, S. F., Marriott, P. M., Halliday, N. J., and Norkko, A. M. (2018). Linking Ross Sea coastal benthic ecosystems to environmental conditions: documenting baselines in a changing world. Front. Mar. Sci. 5:232. doi: 10.3389/fmars.2018.00232
Cummings, V. J., Thrush, S. F., Chiantore, M., Hewitt, J. E., and Cattaneo-Vietti, R. (2010). Macrobenthic communities of the north-western Ross Sea shelf: links to depth, sediment characteristics and latitude. Antarct. Sci. 22, 793–804. doi: 10.1017/s0954102010000489
Dayton, P. K., Jarrell, S. C., Kim, S., Parnell, P. E., Thrush, S. F., Hammerstrom, K., et al. (2019). Benthic responses to an Antarctic regime shift: food particle size and recruitment biology. Ecol. Appl. 29:e01823.
Dayton, P. K., Kim, S., Jarrell, S. C., Oliver, J. S., Hammerstrom, K., Fisher, J. L., et al. (2013). Recruitment, growth and mortality of an Antarctic hexactinellid sponge, Anoxycalyx joubini. PLoS One 8:e56939. doi: 10.1371/journal.pone.0056939
Dayton, P. K., Robilliard, G. A., Paine, R. T., and Dayton, L. B. (1974). Biological accommodation in the benthic community at McMurdo Sound, Antarctica. Ecol. Monogr. 44, 105–128. doi: 10.2307/1942321
Deppeler, S. L., and Davidson, A. T. (2017). Southern Ocean phytoplankton in a changing climate. Front. Mar. Sci. 4:40. doi: 10.3389/fmars.2017.00040
Doney, S. C., Ruckelshaus, M., Duffy, J. E., Barry, J. P., Chan, F., English, C. A., et al. (2012). Climate change impacts on marine ecosystems. Ann. Rev. Mar. Sci. 4, 11–37.
Ducklow, H. W., Fraser, W. R., Meredith, M. P., Stammerjohn, S. E., Doney, S. C., Martinson, D. G., et al. (2013). West Antarctic Peninsula: an icedependent coastal marine ecosystem in transition. Oceanography 26, 190–203. doi: 10.5670/oceanog.2013.62
Dunn, A., Vacchi, M., and Watters, G. (2017). The Ross Sea Region Marine Protected Area Research and Monitoring Plan. CCAMLR document SC-CAMLR-XXXVI/20. Hobart, TAS.
Ellingsen, K. E., Brandt, A., Ebbe, B., and Linse, K. (2007). Diversity and species distribution of polychaetes, isopods and bivalves in the Atlantic sector of the deep Southern Ocean. Polar Biol. 30, 1265–1273. doi: 10.1007/s00300-007-0287-x
Frederich, M., Sartoris, F. J., and Pörtner, H. O. (2001). Distribution patterns of decapod crustaceans in polar areas: a result of magnesium regulation? Polar Biol. 24, 719–723. doi: 10.1007/s003000100270
Gloersen, P., and Cavalieri, D. J. (1986). Reduction of weather effects in the calculation of sea ice concentrations from microwave radiances. J. Geophys. Res. 91, 3913–3919. doi: 10.1029/jc091ic03p03913
Griffiths, H. J., Whittle, R. J., Roberts, S. J., Belchier, M., and Linse, K. (2013). Antarctic crabs: invasion or endurance? PLoS One 8:e66981. doi: 10.1371/journal.pone.0066981
Gutt, J. (2006). Coexistence of macro-zoobenthic species on the Antarctic shelf: an attempt to link ecological theory and results. Deep Sea Res. 2 Top. Stud. Oceanogr. 53, 1009–1028. doi: 10.1016/j.dsr2.2006.02.012
Gutt, J., Arndt, J., Kraan, C., Dorschel, B., Schröder, M., Bracher, A., et al. (2019). Benthic communities and their drivers: a spatial analysis off the Antarctic Peninsula. Limnol. Oceanogr. 62, 2341–2357. doi: 10.1002/lno.11187
Gutt, J., Isla, E., Xavier, J. C., Adams, B. J., Ahn, I. Y., Cheng, C. C., et al. (2020). Antarctic ecosystems in transition – life between stresses and opportunities. Biol. Rev. doi: 10.1111/brv.12679
Gutt, J., Zurell, D., Bracegridle, T. J., Cheung, W., Clark, M. S., Convey, P., et al. (2012). Correlative and dynamic species distribution modelling for ecological predictions in the Antarctic: a cross-disciplinary concept. Polar Res. 31:11091. doi: 10.3402/polar.v31i0.11091
Halpern, B. S., Walbridge, S., Selkoe, K. A., Kappel, C. V., Micheli, F., D’Agrosa, C., et al. (2008). A global map of human impact on marine ecosystems. Science 319, 948–952.
Henley, S. F., Cavan, E. L., Fawcett, S. E., Kerr, R., Monteiro, T., Sherrell, R. M., et al. (2020). Changing biogeochemistry of the Southern Ocean and its ecosystem implications. Front. Mar. Sci. 7:581. doi: 10.3389/fmars.2020.00581
Hewitt, J. E., Lundquist, C. J., and Ellis, J. (2018). Assessing sensitivities of marine areas to stressors based on biological traits. Conserv. Biol. 33, 142–151. doi: 10.1111/cobi.13181
Hewitt, J. E., Thrush, S. F., and Dayton, P. D. (2008). Habitat variation, species diversity and ecological functioning in a marine system. J. Exp. Mar. Biol. Ecol. 366, 116–122. doi: 10.1016/j.jembe.2008.07.016
Hill, P. (2009). Designing a deep-towed camera vehicle using single conductor cable. Sea Technol. 50, 49–51.
Huetten, E., and Greinert, J. (2008). Software Controlled Guidance, Recording and Post-Processing Of Seafloor Observations by ROV And Other Towed Devices: the Software Package OFOP. Geophysical Research Abstracts 10: EGU2008-A-03088, EGU General Assembly 2008 (poster). Vienna.
Ingels, J., Vanreusel, A., Brandt, A., Catarino, A. I., David, B., De Ridder, C., et al. (2012). Possible effects of global environmental changes on Antarctic benthos: a synthesis across ?ve major taxa. Ecol. Evol. 2, 453–485. doi: 10.1002/ece3.96
Isla, E. (2016). “Environmental controls on sediment composition and particle fluxes over the Antarctic continental shelf,” in Source-to Sink Fluxes in Undisturbed Cold Environments, eds A. Beylich, J. Dixon, and Z. Zwolinski (Cambridge: Cambridge University Press), 199–212. doi: 10.1017/cbo9781107705791.017
Jacobs, S. S., and Giulivi, C. F. (2010). Large multidecadal salinity trends near the Pacific-Antarctic continental margin. J. Clim. 23, 4508–4524. doi: 10.1175/2010JCLI3284.1
Jansen, J., Hill, N. A., Dunstan, P. K., Eléaume, M. P., and Johnson, C. R. (2018a). Taxonomic resolution, functional traits, and the influence of species groupings on mapping Antarctic seafloor biodiversity. Front. Ecol. Evol. 6:81. doi: 10.3389/fevo.2018.00081
Jansen, J., Hill, N. A., Dunstan, P. K., McKinlay, J., Sumner, M. D., Post, A. L., et al. (2018b). Abundance and richness of key Antarctic seafloor fauna correlates with modelled food availability. Nat. Ecol. Evol. 2, 71–80. doi: 10.1038/s41559-017-0392-3
Jones, G. A., and Kaiteris, P. (1983). A vacuum gasometric technique for rapid and precise analysis of calcium carbonate in sediments and soils. J. Sediment. Res. 53, 655–660. doi: 10.1306/212f825b-2b24-11d7-8648000102c1865d
Kim, S., Hammerstrom, K., and Dayton, P. K. (2019). Epifaunal community response to iceberg-mediated environmental change in McMurdo Sound, Antarctica. Mar. Ecol. Prog. Ser. 613, 1–14. doi: 10.3354/meps12899
Kim, S., Saenz, B., Scanniello, J., Daly, K., and Ainley, D. (2018). Local climatology of fast ice in McMurdo Sound, Antarctica. Antarct. Sci. 30, 125–142. doi: 10.1017/s0954102017000578
Kröger, K., and Rowden, A. A. (2008). Polychaete assemblages of the northwestern Ross Sea shelf: worming out the environmental drivers of Antarctic macrobenthic assemblage composition. Polar Biol. 31, 971–989. doi: 10.1007/s00300-008-0437-9
Law, C. S., Rickard, G. J., Mikaloff-Fletcher, S. E., Pinkerton, M. H., Behrens, E., Chiswell, S. M., et al. (2017). Climate change projections for the surface ocean around New Zealand. N. Z. J. Mar. Freshwater Res. 52, 1–27. doi: 10.1080/00288330.2017.1390772
Legendre, P., and Anderson, M. J. (1999). Distance-based redundancy analysis: testing multispecies responses in multifactorial ecological experiments. Ecol. Monogr. 69, 1–24. doi: 10.1890/0012-9615(1999)069[0001:dbratm]2.0.co;2
Levin, L. A., Etter, R. J., Rex, M. A., Gooday, A. J., Smith, C. R., Pineda, J., et al. (2001). Environmental influences on regional deep-sea species diversity. Ann. Rev. Ecol. Syst. 32, 51–93. doi: 10.1146/annurev.ecolsys.32.081501.114002
Lutz, M. J., Caldeira, K., Dunbar, R. B., and Behrenfeld, M. J. (2007). Seasonal rhythms of net primary production and particulate organic carbon flux to depth describe the efficiency of biological pump in the global ocean. J. Geophys. Res. 112:C10011. doi: 10.1029/2006JC003706
Maksym, T. (2019). Arctic and Antarctic sea ice change: contrasts, commonalities, and causes. Ann. Rev. Mar. Sci. 11, 187–213. doi: 10.1146/annurev-marine-010816-060610
McArdle, B. H., and Anderson, M. J. (2001). Fitting multivariate models to community data: a comment on distance-based redundancy analysis. Ecology 82, 290–297. doi: 10.1890/0012-9658(2001)082[0290:fmmtcd]2.0.co;2
Moreau, S., Mostajir, B., Belanger, S., Schloss, I. R., Vancoppenolle, M., and Demers, S. (2015). Climate change enhances primary production in the Western Antarctic Peninsula. Glob. Chang. Biol. 21, 2191–2205. doi: 10.1111/gcb.12878
NASA Goddard Space Flight Center, Ocean Ecology Laboratory, and Ocean Biology Processing Group. (2018a). MODIS/Aqua Ocean Color Reprocessing 2018.0. Available online at: https://oceancolor.gsfc.nasa.gov/reprocessing/r2018/aqua/ (accessed May, 2018).
NASA Goddard Space Flight Center, Ocean Ecology Laboratory, and Ocean Biology Processing Group. (2018b). SeaWiFS Ocean Color Reprocessing 2018.0. Available online at: https://oceancolor.gsfc.nasa.gov/reprocessing/r2018/seawifs/ (accessed May, 2018).
Orr, J. C., Fabry, V. J., Aumont, O., Bopp, L., Doney, S. C., Feely, R. A., et al. (2005). Anthropogenic ocean acidification over the twenty-first century and its impact on calcifying organisms. Nature 437, 681–686. doi: 10.1038/nature04095
Parker, S. J., and Dunn, A. (2018). Guidelines for Fisheries-Directed Research Addressing the Ross Sea Region Marine Protected Area Research and Monitoring Plan. CCAMLR document WG-SAM-18/21. Hobart, TAS: CCAMLR, 10.
Peck, L. S. (2005). Prospects for surviving climate change in Antarctic aquatic species. Front. Zool. 2:9. doi: 10.1186/1742-9994-2-9
Peck, L. S., Morley, S. A., and Clark, M. S. (2010). Poor acclimation capacities in Antarctic marine ectotherms. Mar. Biol. 157, 2051–2059. doi: 10.1007/s00227-010-1473-x
Pineda-Metz, S. E., and Gerdes, D. (2018). Seabed images versus corer sampling: a comparison of two quantitative approaches for the analysis of marine benthic communities in the southern Weddell Sea (Southern Ocean). Polar Biol. 41, 515–526. doi: 10.1007/s00300-017-2211-3
Pineda-Metz, S. E. A., Gerdes, D., and Richter, C. (2020). Benthic fauna declined on a whitening Antarctic continental shelf. Nat. Commun. 11:2226. doi: 10.1038/s41467-020-16093-z
Pineda-Metz, S. E. A., Isla, E., and Gerdes, D. (2019). Benthic communities of the Filchner Region (Weddell Sea, Antarctica). Mar. Ecol. Prog. Ser. 628, 37–54. doi: 10.3354/meps13093
Pörtner, H. O., Peck, L. S., and Somero, G. N. (2007). Thermal limits and adaptation: an integrative view. Philos. Trans. R. Soc. Lond. B 362, 2233–2258. doi: 10.1098/rstb.2006.1947
Reynolds, R. W., Rayner, N. A., Smith, T. M., Stokes, D. C., and Wang, W. (2002). An improved in situ and satellite SST analysis for climate. J. Clim. 15, 1609–1625. doi: 10.1175/1520-0442(2002)015<1609:aiisas>2.0.co;2
Rowden, A., Kröger, K., and Clark, M. (2015). Compositional patterns of benthic assemblages on the northwestern Ross Sea shelf, Antarctica: interacting environmental drivers operating at multiple spatial scales. Hydrobiologia 761, 1–23.
Sartory, D. P. (1982). Spectrophotometric Analysis of Chlorophyll a in Freshwater Phytoplankton. Report No. TR 115. Pretoria: Hydrological Research Institute, Department of Environment Affairs, 163.
Smith, C. R., Mincks, S., and DeMaster, D. J. (2006). A synthesis of bentho-pelagic coupling on the Antarctic shelf: food banks, ecosystem inertia and global climate change. Deep Sea Res. 2 Top. Stud. Oceanogr. 53, 875–894. doi: 10.1016/j.dsr2.2006.02.001
Smith, W. O., Ainley, D., Cattaneo-Vietti, R., and Hofmann, E. (2012). “Chap. 7 The Ross Sea continental shelf: regional biogeochemical cycles, trophic interactions, and potential future changes,” in Antarctic Ecosystems: An Extreme Environment in a Changing World, eds A. D. Rogers, N. M. Johnston, E. J. Murphy, and A. Clarke (New Jersey, NJ: Blackwell Publishing Ltd), 213–235. doi: 10.1002/9781444347241.ch7
Somerfield, P. J., Clarke, K. R., and Olsgard, F. (2002). A comparison of the power of categorical and correlational tests applied to community ecology data from gradient studies. J. Anim. Ecol. 71, 581–593. doi: 10.1046/j.1365-2656.2002.00624.x
Stammerjohn, S. E., and Maksym, T. (2017). “Gaining (and losing) Antarctic sea ice: variability, trends and mechanisms,” in Sea Ice, ed. D. N. Thomas (Chichester: Wiley & Sons), 261–289. doi: 10.1002/9781118778371.ch10
Stammerjohn, S. E., Martinson, D. G., Smith, R. C., Yuan, X., and Rind, D. (2008). Trends in Antarctic annual sea ice retreat and advance and their relation to El Niño–Southern Oscillation and Southern Annular mode variability. J. Geophys. Res. 113:C03S90. doi: 10.1029/2007JC004269
Stammerjohn, S. E., Massom, R., Rind, D., and Martinson, D. G. (2012). Regions of rapid sea ice change: an interhemispheric seasonal comparison. Geophys. Res. Lett. 39:L06501. doi: 10.1029/2012GL050874
Steinberg, D. K., Ruck, K. E., Gleiber, M. R., Garzio, L. M., Cope, J. S., Bernard, K. S., et al. (2015). Long-term (1993-2013) changes in macrozooplankton off the Western Antarctic Peninsula. Deep Sea Res. 1 101, 54–70. doi: 10.1016/j.dsr.2015.02.009
Sumida, P. Y. G., Smith, C. R., Bernardino, A. F., Polito, P. S., and Vieira, D. R. (2014). Seasonal dynamics of megafauna on the deep West Antarctic Peninsula shelf in response to variable phytodetrital influx. R. Soc. Open Sci. 1:140294. doi: 10.1098/rsos.140294
Ter Braak, C. J. F., and Smilauer, P. (1998). CANOCO Release 4 Reference Manual and User’s Guide to Canoco for Windows-Software for Canonical Community Ordination. Ithaca, NY: Microcomputer Power.
Thatje, S. (2012). Effects of capability for dispersal on the evolution of diversity in Antarctic benthos. Integr. Comp. Biol. 52, 470–482. doi: 10.1093/icb/ics105
Thrush, S. F., and Cummings, V. J. (2011). Massive icebergs, alteration in primary food resources and change in benthic communities at Cape Evans, Antarctica. Mar. Ecol. 32, 289–299. doi: 10.1111/j.1439-0485.2011.00462.x
Keywords: Antarctica, benthic community, sea ice, productivity, environmental change, marine protected area, functional traits
Citation: Cummings VJ, Bowden DA, Pinkerton MH, Halliday NJ and Hewitt JE (2021) Ross Sea Benthic Ecosystems: Macro- and Mega-faunal Community Patterns From a Multi-environment Survey. Front. Mar. Sci. 8:629787. doi: 10.3389/fmars.2021.629787
Received: 16 November 2020; Accepted: 01 March 2021;
Published: 06 April 2021.
Edited by:
Katrin Linse, British Antarctic Survey (BAS), United KingdomReviewed by:
Santiago Pineda Metz, Alfred Wegener Institute, Helmholtz Centre for Polar and Marine Research (AWI), GermanyJan Jansen, University of Tasmania, Australia
Copyright © 2021 Cummings, Bowden, Pinkerton, Halliday and Hewitt. This is an open-access article distributed under the terms of the Creative Commons Attribution License (CC BY). The use, distribution or reproduction in other forums is permitted, provided the original author(s) and the copyright owner(s) are credited and that the original publication in this journal is cited, in accordance with accepted academic practice. No use, distribution or reproduction is permitted which does not comply with these terms.
*Correspondence: Vonda J. Cummings, dm9uZGEuY3VtbWluZ3NAbml3YS5jby5ueg==