 Todd R. Robeck
 Karen J. Steinman
 Celeste B. Parry
 Forrest M. Gomez2
- 1Species Preservation Laboratory, SeaWorld Parks & Entertainment, Inc., San Diego, CA, United States
- 2National Marine Mammal Foundation, San Diego, CA, United States
- 3United States Navy Marine Mammal Program, Naval Information Warfare Center Pacific, San Diego, CA, United States
Although previous studies have described progesterone profiles during pregnancy in the bottlenose dolphin (Tursiops truncatus), most of these focused on normal pregnancy (NORM) or compared NORM to only one or two abnormal pregnancy types, such as abortion (AB) or perinatal loss (PNL). Hormonal pregnancy biomarker analysis from reproductive events with different outcomes may reveal differences in concentrations so that we are able to identify high risk pregnancies. The aim of this study was to describe longitudinal profiles of circulating progesterone and progestagens during reproductive events in the female bottlenose dolphin, including NORM, failure to thrive, PNL, AB, early loss (EL), and false pregnancy (FP). Progesterone differed from NORM during EL at EARLY (month post conception [MPC] 1–4), AB at MID (MPC 5–8), and FP at LATE (MPC 9–12) stages. Progestagens differed from NORM during AB and FP at MID and LATE stages and during MPC 12 in PNL and MPC 4 in EL. Progestagens may be better at predicting poor reproductive outcome in the bottlenose dolphin and a suite of hormone tests, including progesterone and progestagens, should be incorporated into existing clinical diagnostic and management practices in this species. Furthermore, analysis of multiple hormonal pregnancy biomarkers from a single sample may enable pregnancy diagnosis for wild animals.
Introduction
Characterization of hormones during normal pregnancy in the bottlenose dolphin (Tursiops truncatus) has been previously described (O’Brien and Robeck, 2012; West et al., 2014; Steinman et al., 2016; Bergfelt et al., 2017). These studies include analysis of progestagens (PG), estrogens, androgens, glucocorticoids, relaxin, and thyroid hormones. However, direct comparisons between hormone concentrations in normal versus abnormal pregnancies in the bottlenose dolphin have been limited to progesterone (P4, O’Brien and Robeck, 2012), relaxin and P4 (Bergfelt et al., 2011, 2013, 2017), and thyroid hormones (West et al., 2014). Furthermore, hormonal investigation of differing subsets of abnormal reproductive outcomes (e.g., perinatal loss, abortion, and early embryonic loss) or pregnancy type compared to normal pregnancy (live birth with calf survival of a minimum of 30 days) is primarily limited to one study in the killer whale (Orcinus orca, Robeck et al., 2018) and two studies in the bottlenose dolphin (O’Brien and Robeck, 2012; Bergfelt et al., 2017), while two other studies compared hormones during normal pregnancy and perinatal loss (Bergfelt et al., 2011; West et al., 2014).
A study of longitudinal profiles of P4 in viable and non-viable bottlenose dolphin pregnancies with known conception/breeding dates has demonstrated that females with known fetal loss or suspected early embryonic loss decrease P4 production during mid-gestation (O’Brien and Robeck, 2012). In another study in the bottlenose dolphin, analysis of serum samples collected at irregular intervals across 28 pregnancies has shown that P4 concentrations during mid-gestation are higher in pregnancies that result in a live birth compared to those that result in a stillborn calf (Bergfelt et al., 2011). Although elevated P4 concentrations are not pregnancy specific, in bottlenose dolphins, relaxin and P4 together appear to be useful for diagnosing pregnancy from mid- to late-term and reduced concentrations may be useful for detecting pregnancies destined for an abortion (Bergfelt et al., 2011, 2013, 2017).
These previously mentioned studies in the bottlenose dolphin relied on analysis of serum P4 using assays with antibodies that have cross-reactivity primarily for P4 with limited cross-reactivity with other PGs [Sorge et al., 2008 (Immuchem double antibody P4 radioimmunoassay from MP Biomedicals, used by Bergfelt et al., 2011, 2013); TOSOH Bioscience Corporation, 2017 (ST AIA-Pack Prog II directional insert used by O’Brien and Robeck, 2012)]. However, recent analysis of bottlenose dolphin serum using liquid chromatography tandem mass spectrometry (LCMS) has revealed that P4, and hydroxylated and 5α-reduced metabolites are the predominant pregnanes during the luteal phase and pregnancy in this species (Legacki et al., 2020). Because assays used in previous studies had little to no-cross-reactivity for these PG metabolites, an antibody with a larger cross-reactivity and broader specificity for these metabolites, and not just P4, may be able to provide more information regarding PG-related normal and abnormal pregnancy dynamics.
The ability to determine pregnancy from hormone concentrations within a single time point sample continues to be an important and yet unresolved component of wild annual health assessment programs (Dalle Luche et al., 2020). For most wild species, only single sample analysis is possible, and typically these animals are assigned as pregnant or non-pregnant based on progesterone or progestagen concentrations in blood, feces or blubber (Kellar et al., 2013, 2014; Wasser et al., 2017; Pallin et al., 2018). Once an animal has been assigned as pregnant based on that single sample, pregnancy confirmation or progression from a subsequent, second sample collection is rarely achieved. When or if this animal is recaptured or re-sighted outside the window of gestation, the presence or absence of a calf is then used to indicate pregnancy success or failure, and perhaps more importantly, when that failure may have occurred. The understanding of when pregnancy loss is occurring and the frequency of loss within a population is critical for identifying what and when potential stressors are having an abnormal impact on the overall health of the population.
Comparisons of P4 and PG hormone profiles in bottlenose dolphin pregnancies with different reproductive outcomes may be able to detect problematic pregnancies and lead to improved pre-natal care in cetaceans. The overall goal of this study was to describe profiles of circulating P4 and PGs during normal and abnormal pregnancies in the bottlenose dolphin. The specific objectives were to: (1) Determine if and at what stage of pregnancy P4 and PG concentrations diverge from luteal phase concentrations; (2) characterize profiles of circulating P4 and PGs during months and stages of pregnancies with different reproductive outcomes, including live birth, perinatal loss, abortion, false pregnancy and failure to thrive; and (3) identify if concentrations of either of these hormones can be used as indicators of a successful pregnancy outcome and/or fetal health.
Materials and Methods
All samples were collected as part of routine husbandry procedures for the bottlenose dolphin. All procedures at Sea World (SEA) parks were reviewed and approved by the SeaWorld Parks and Entertainment Incorporated Research Review Committee and were performed in accordance with the United States Animal Welfare Act for the care of marine mammals. Samples collected from animals at the United States Navy Marine Mammal Program (MMP) were collected during their routine care and under the authority of United States Code, Title 10, USC 7524. MMP is accredited by AAALAC International and adheres to the national standards of the United States Public Health Service Policy on the Humane Care and Use of Laboratory Animals and the Animal Welfare Act.
Study Animals
Stored samples (−80°C) from 84 animals during the period from 1984 through 2017 were used for retrospective analysis. These samples had been collected as part of routine monitoring of animals for detection of reproductive events (n = 159, Table 1). Reproductive events were defined as periods during which serum progesterone concentrations were increased above 1 ng/ml for longer than the normal luteal phase length of 21 days (O’Brien and Robeck, 2012). Animals were housed at SeaWorld Parks in Orlando, San Antonio and San Diego and the United States Navy Marine Mammal Program (San Diego, CA, United States). Animals were housed in enclosures containing ≥850 m3 of either natural processed or manufactured salt-water (at SEA) or open-ocean netted enclosures (at MMP).
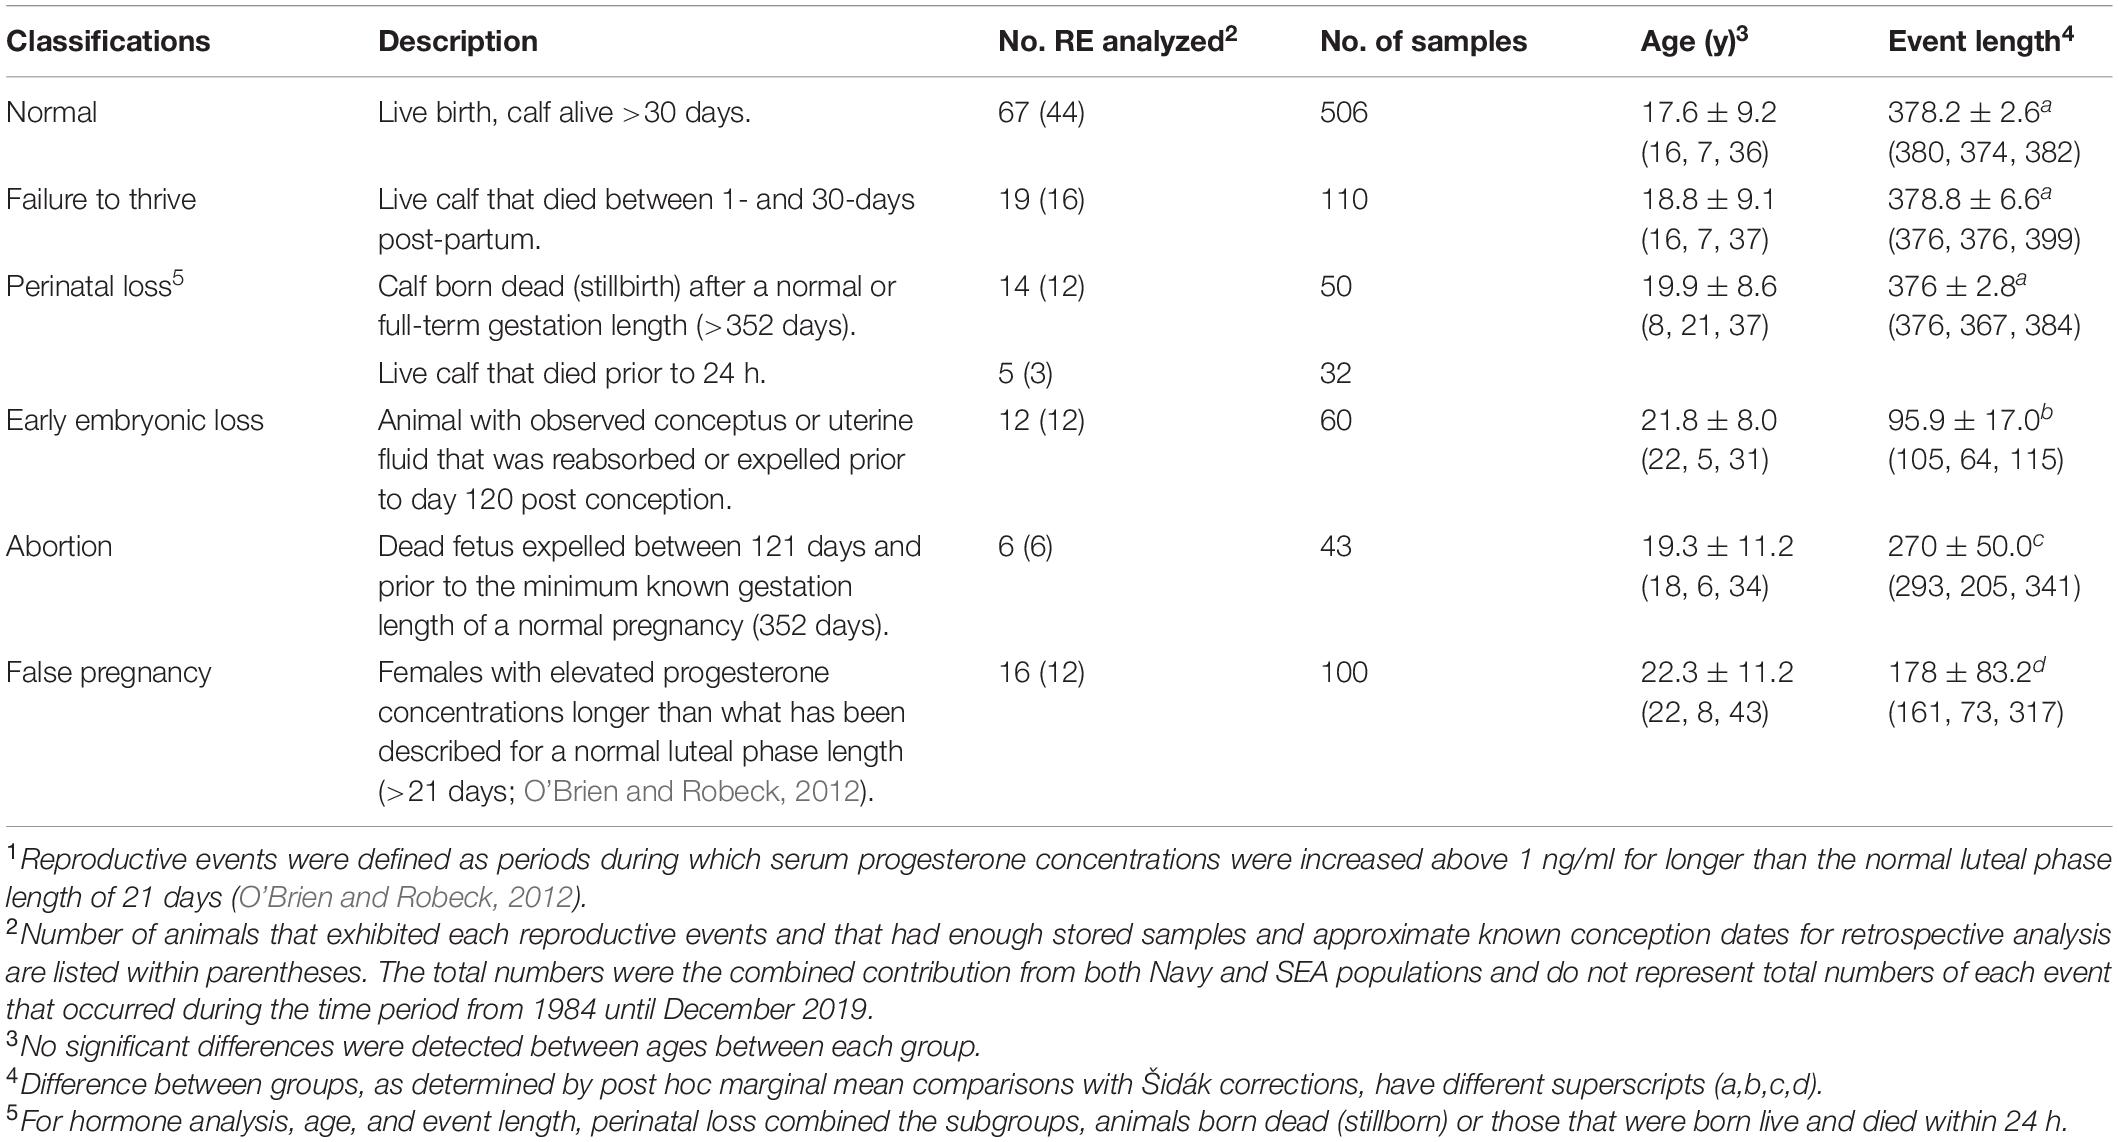
Table 1. Classification of and number (no.) of samples analyzed from females within each reproductive event (RE1) group, mean (± sd) age of animals and event length (50th, 5th, and 95th percentile) within each group and from March 1984 until December 2019.
Data and Sample Collection
Blood samples (n = 1138 samples) were collected from animals ranging from every other day for peri-post ovulatory monitoring, to weekly for post artificial insemination monitoring (Robeck et al., 2013) or monthly to quarterly as part of routine husbandry management. If an animal was identified with elevated progesterone during a routine exam or was observed breeding with males, sample collection was increased to every 2 weeks to establish if pregnancy may have occurred and then monthly, once pregnancy had been confirmed via ultrasonography. Samples were collected either voluntarily or using manual restraint from the peripheral periarterial venous rete (PAVR) on the ventral tail fluke using a 18 to 22 gauge winged blood collection set or attached to a vacutainer collection system. Blood was collected by either the veterinary technician or veterinarian on staff and into BD Vacutainers (Becton Dickinson, Franklin Lakes, NJ, United States) containing activated thrombin. The thrombin-coagulated blood was centrifuged at 1,500 rpm for 10 min, and the serum was decanted and frozen at −80°C for further testing. Although sampling time was not recorded for every sample, routine blood samples were typically collected in the mornings (before 12:00 h).
Hormone Assays
All hormone concentrations were expressed as ng hormone per ml serum. While no quantitative evaluation of progestagen stability over time when stored at −80°C was conducted for this study, it is generally accepted that steroids are extremely stable during storage in temperatures as great as −20°C with negligible amounts of hormone being degraded over time (Key et al., 1991; Holl et al., 2008).
Progesterone (P4) Assay
P4 was analyzed using an immunoenzymometric assay (TOSOH Bioscience NV, Tessenderlo, Belgium) as previously described (O’Brien and Robeck, 2012). Assay validations for this species including sample parallelism and accuracy information are described in detail in the aforementioned study. Inter-assay coefficients of variation for three quality controls (low [1.0 ng/ml], medium [8.9 ng/ml], high [23.3 ng/ml]) were 11.2, 7.4, and 4.9%, respectively (n = 8).
Progestagen (PG) Assay
PG concentrations were measured using an in-house, single antibody, direct enzyme immunoassay (EIA) as described for use in bottlenose dolphin urine in Robeck et al. (2005). While the cross-reactivities of the PG antibody with corticosterone and androstenedione is <0.1% (Graham et al., 2001), but, to our knowledge, the cross-reactivities against cortisol and testosterone have not been reported. Therefore, to determine the cross-reactivity of each of these standards with our PG antibody, two sets of serially diluted hormone standards (range: 2,500–1.22 ng/ml) in EIA buffer were created and analyzed using the PG EIA. The hormone concentration observed (ng/ml) for each standard at ∼50% antibody binding was then divided by the known concentration of standard added (also at ∼50% antibody binding) to determine the percent cross-reactivity for each standard. The cross-reactivities for cortisol and testosterone were <0.01 and <0.1%, respectively.
For sample analysis, serum, 0.002 to 0.05 ml, depending on the concentration, was analyzed as described for urine in the aforementioned study. To test for intra-assay variation, a single serum sample was tested at different locations (n = 10) across the microtiter plate, and the coefficient of variation (CV) was 4.9%. Parallel displacement of serum compared to the standard curve was demonstrated (r = 0.993) and the recovery of known concentrations of standard to serum was 104.1 ± 16.7% (linear regression, y = 1.15x − 0.4, r2 = 0.998). Inter-assay CVs for two quality controls with antibody binding at 30% (45 pg/well) and 70% (10 pg/well) were 10.4 and 10.1%, respectively (n = 61). A cetacean-specific biological control with antibody binding at 50% (12.5 pg/well) had an inter-assay CV of 9.0% (n = 61).
Effects of Stress on P4 and PG Concentrations
To evaluate if stress of capture could influence progestagens (P4 and PG) concentrations in delphinids, we analyzed serum samples (n = 14 samples) which had previously been collected during a stress test (Steinman et al., 2020) from a closely related delphinid, the killer whale (Orcinus orca), for PG and P4 concentrations as described above. For collection methods and animal descriptions see the previous publication (Steinman et al., 2020) and Supplementary Table 1.
Data Partitioning
The date of ovulation, for animals with samples collected during a reproductive event, was determined retrospectively to align samples for analysis. For this process, ovulation was determined by either knowing the date (n = 84) or by estimating the date (n = 64). An ovulation date was considered “known” when data had been previously collected which allowed for the following conditions: when ovulation was determined by taking the midpoint between when P4 concentrations were at baseline and the first observation post ovulation when P4 was elevated and then only relying on this estimation when the maximum time between these two samples was 4 weeks or less; or when based on observed estrus followed by elevated progesterone, ultrasonographic detection of ovulation, or daily urinary hormone analysis. Estimated ovulation dates were determined for normal births only by subtracting the mean gestation length for bottlenose dolphins (376 days, O’Brien and Robeck, 2012) from the date of parturition. For hormone concentrations during abnormal pregnancies, only samples with known ovulation dates were included in the study (Table 1). Once the ovulation date was determined, the reproductive event period was divided based on stage or month post ovulation or conception (MPC). For non-pregnant animals, the follicular phase was considered to represent any sample collected between one through 5 days before the day of ovulation, and luteal phase samples were samples collected during peak progesterone which occurs between 10 and 18 days post ovulation (O’Brien and Robeck, 2012). For pregnant animals, “STAGE” time periods were based on trimesters of a normal pregnancy and were thus divided as follows: EARLY (days 1 to day 120 post ovulation), MID (days 121 to 240), or LATE (Days 241 until parturition). Reproductive event categories (STATUS) were defined as follows: Normal pregnancy (NORM) – a live calf that survived for longer than 30 days; Failure to thrive (FTT) – live calf that survived from 2 to 30 days; Perinatal loss (PNL) – calf born either dead or alive but dies prior to 24 h post-partum (McDermott et al., 1992) and had gestated for at least 352 days (the minimum gestational period in a bottlenose dolphin that has resulted in a normal calf, E. Jensen unpublished data); Early embryonic or fetal loss (EL) – a pregnant female, confirmed via ultrasonography, that either reabsorbs or expels the conceptus or fetal tissue prior to day 121; Abortion (AB) – dead calf aborted after day 121 of gestation and prior to a normal minimum successful gestation length of 352 days; and False pregnancy (FP) – female with elevated progesterone longer than a normal luteal phase without any ultrasonographic evidence of pregnancy (uterine membranes, fluid, or conceptus) or without access to a breeding age male at or around ovulation.
Statistical Analyses
Unless stated otherwise, statistical analyses were performed using STATA statistical software (version 1416; StataCorp LP, College Station, TX, United States). The reproductive event (RE) category (NORM, FTT, PNL, EL, AB, and FP) incident rate from all females within the SEA population from 2000 through 2019 for each category (regardless of whether samples for hormone analysis were included within this research) and the proportion of each pregnancy related event (thus excluding FP) that occurred was determined. Prior to 2000, all pregnancies in bottlenose dolphins were from natural inseminations, therefore, there was no intensive reproductive monitoring program in place. Thus, the detection of all reproductive events, especially ovulation dates, early pregnancies and false pregnancies within the SEA population was incomplete and therefore not included for the incident rate analysis. Likewise, the MMP population was excluded from this analysis because only a small subset of all potential reproductive events had been identified within the population, and therefore, with only an incomplete picture of the occurrence of each event, the overall percentage of events within each category could not be determined.
Age of females at conception (age) within and length of time (days) for each reproductive outcomes (NORM, FTT, PNL, EL, AB, or FP) were compared using a two-level mixed effects restricted maximum likelihood (REML) factorial model (West et al., 2015; Robeck et al., 2017). Within this model, the dependent variable (length of event, or age) and fixed effect factorial variable (reproductive outcome, coded 0 to 5) were compared with animal ID (level 2 or random effect). The random effect variable was used to adjust for the variance associated with an unequal number of repeated events per animal. Post hoc marginal means were compared with Šidák corrections.
Hormone concentration comparisons were only made between NORM and one of the other abnormal reproductive events and the analysis repeated until each potential paired comparison was completed. To compare hormone concentrations during either different STAGES or MPC between NORM and one of the other reproductive events, we used a two-level or three level REML regression model (West et al., 2015; Robeck et al., 2017). Within this model, the dependent variable (hormone) and fixed effect variables were STATUS (NORM and one of the other reproductive events), pregnancy time period (either STAGE or MPC), animal age, and season and the random intercept variable, animal ID (level 2), and pregnancy id (level 3). A two versus a three-level mixed model was determined by comparing the full (3 level) versus a reduced (2 level) model using the likelihood ratio (LR) test. The use of a mixed model (2 or 3) was confirmed by comparing the final mixed model versus a simple linear regression using the LR Test. Season was defined as samples collected during winter (December through February), spring (March through May), summer (June through August) or fall (September through November). Animal age and season were included as covariates to control for the effect that these variables may have on the different hormone concentrations evaluated (Steinman et al., 2016; O’Brien et al., 2017; Robeck et al., 2017). All final mixed effects models were checked for normality using quantile plots of the standard residuals. If quantile–quantile plots of standardized residuals exhibited non-normal distribution then data was transformed as predicted by the Shapiro–Wilk test (Ladder command, STATA) until residuals were normalized. The significance of the final model was determined using a Wald χ2 test. Paired comparisons of the dependent variable marginal (predicted) means within each reproductive event against normal for each time category were made at a significance of P < 0.05. If appropriate, multiple comparisons of marginal means were performed using Šidák corrections at P < 0.05. For text, tables, and graphs any transformed data were first back-transformed, and then all data were presented as marginal means with 95% confidence intervals (CI) unless noted otherwise.
Results
While numbers were too small for meaningful comparative statistical analysis, no subjective differences were detected within PG or P4 before during or after a stress event with both hormone concentrations remaining at baseline throughout the trial (Supplementary Table 1).
Demographic Data and Pregnancy Characteristics
Across both facilities, serum samples representing 84 individual females and a total of 159 reproductive events from 1984 through 2017 were identified and analyzed (Table 1). For these reproductive events that had banked serum for hormone analysis, no significant differences within this data set were detected for the mean age of the females within each category of reproductive events (P > 0.05, Table 1). Length of time for the reproductive events, whereby ovulation dates were known or estimated within 2 weeks, were reduced for EL, AB, and FP compared to each of the other reproductive events (P < 0.05, Table 1).
Within the SEA population, from January 2000 through December 2019, a total of 174 pregnancies was diagnosed. The total number of live calves born was 142 (81.6%) with a total pregnancy loss rate of 11.5% and a stillbirth rate of 5.2% (Table 2). Of the live calves, 88% lived beyond day 30 of age, and 85.2% were alive after 1 year of age (Table 2).
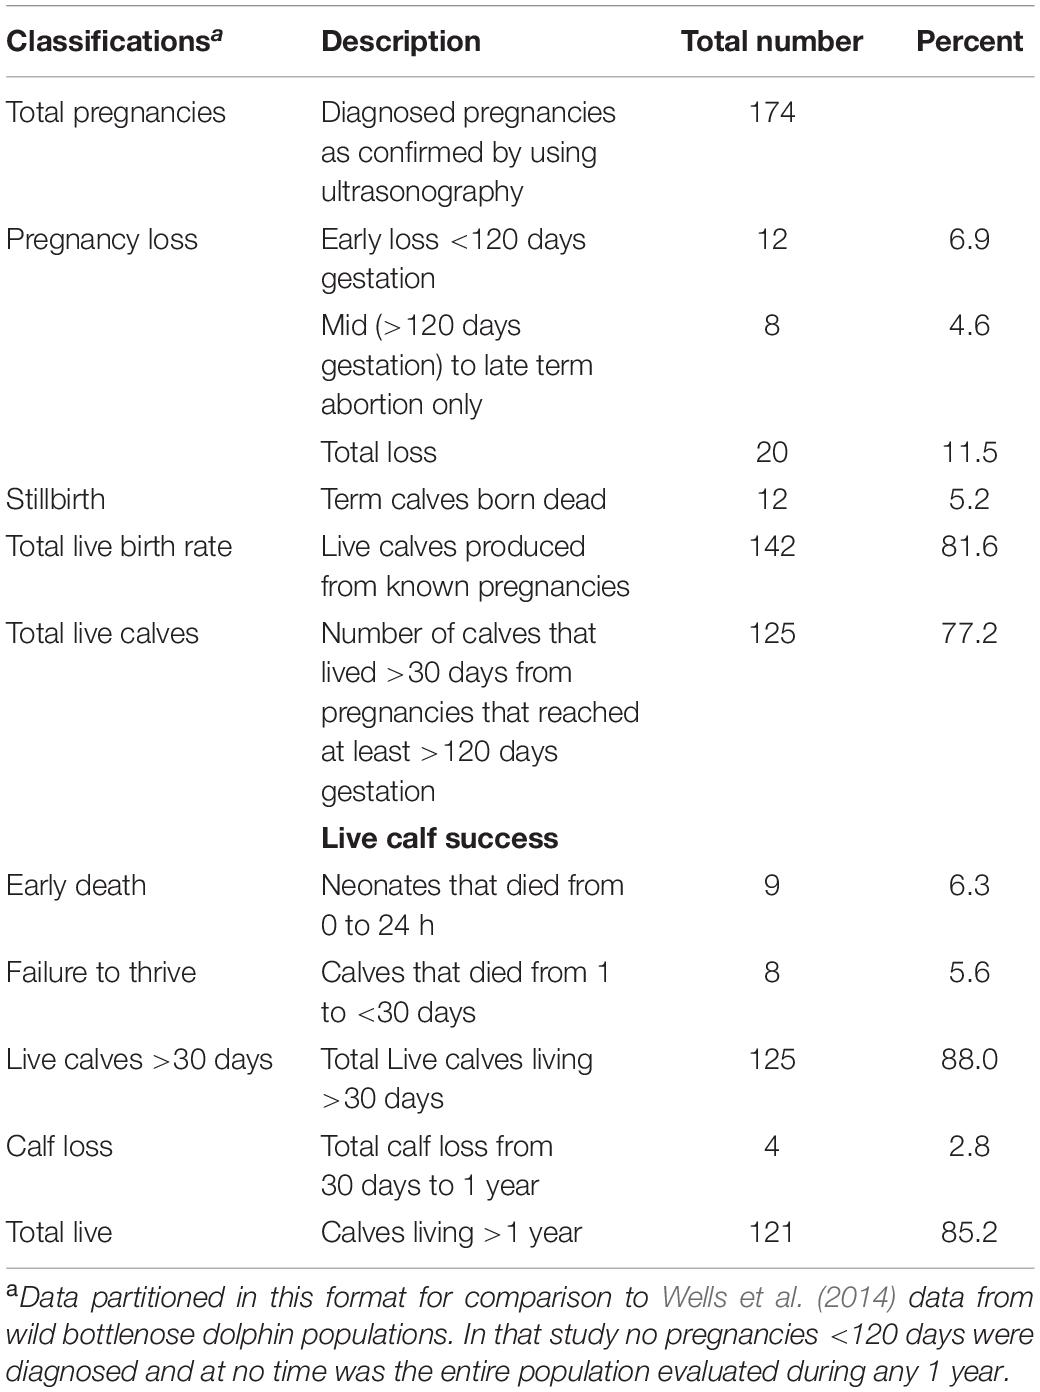
Table 2. Pregnancy characteristics for SEA animals from 2000 through December 2019.
Progesterone (P4)
Based on standardized residual analysis, all final models used the square-root of P4 transformation for analysis.
Comparisons Between Non-pregnancy Reproductive States and Pregnancy
For P4 analysis, a three-level mixed model with animal id as level 2 random intercept and pregnancy id as level 3 was significant (Table 3). Post hoc marginal mean comparisons of P4 concentrations between all time periods, pre- or post-pregnancy, indicated that luteal phase concentrations (7.7 ng/ml, 95% CI 4.0–12.6 ng/ml) were greater (P ≤ 0.05) than follicular phase (0.3 ng/ml, 95% CI 0.08–2.1 ng/ml), and ovulatory period concentrations (0.91 ng/ml, 95% CI 0.09–2.6 ng/ml) were less than MPC 2 through 5 (Figure 1).
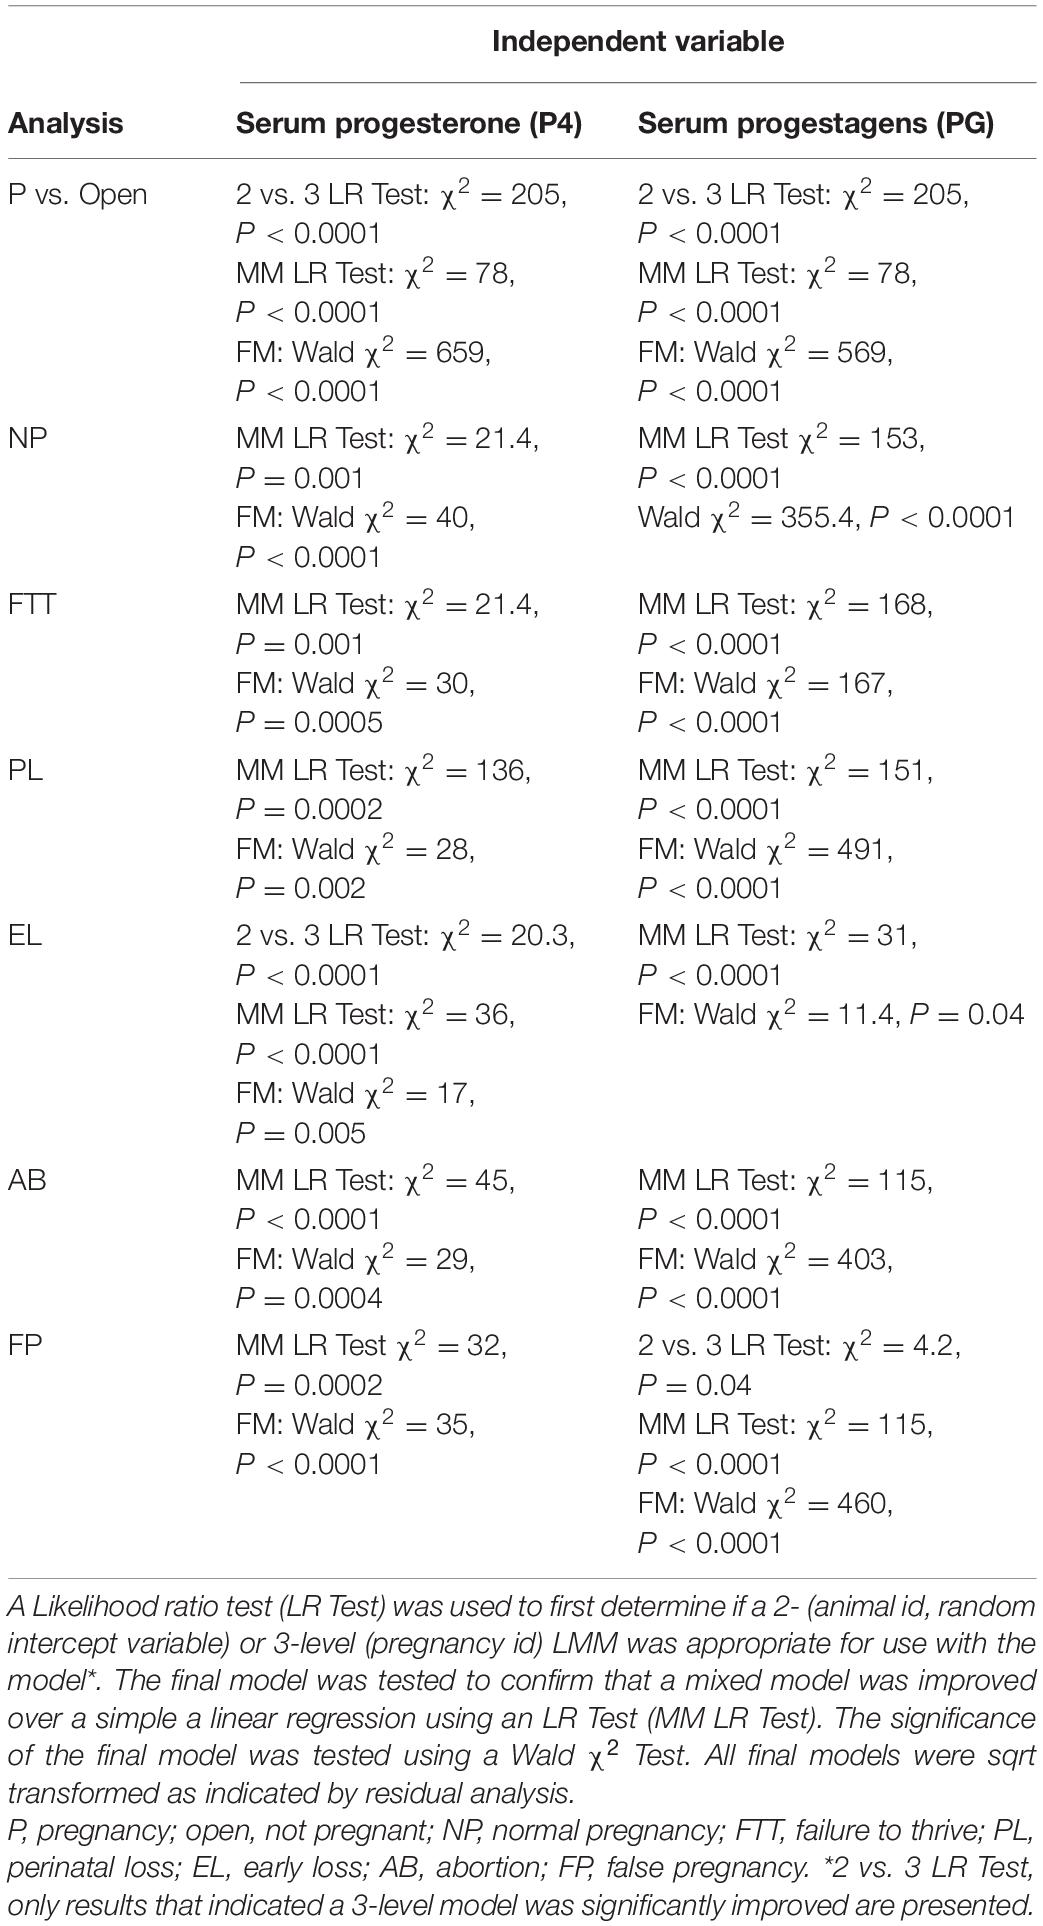
Table 3. Model statistics from the restricted maximum likelihood linear mixed model (LMM) analysis of hormone concentrations within each status and time variable.
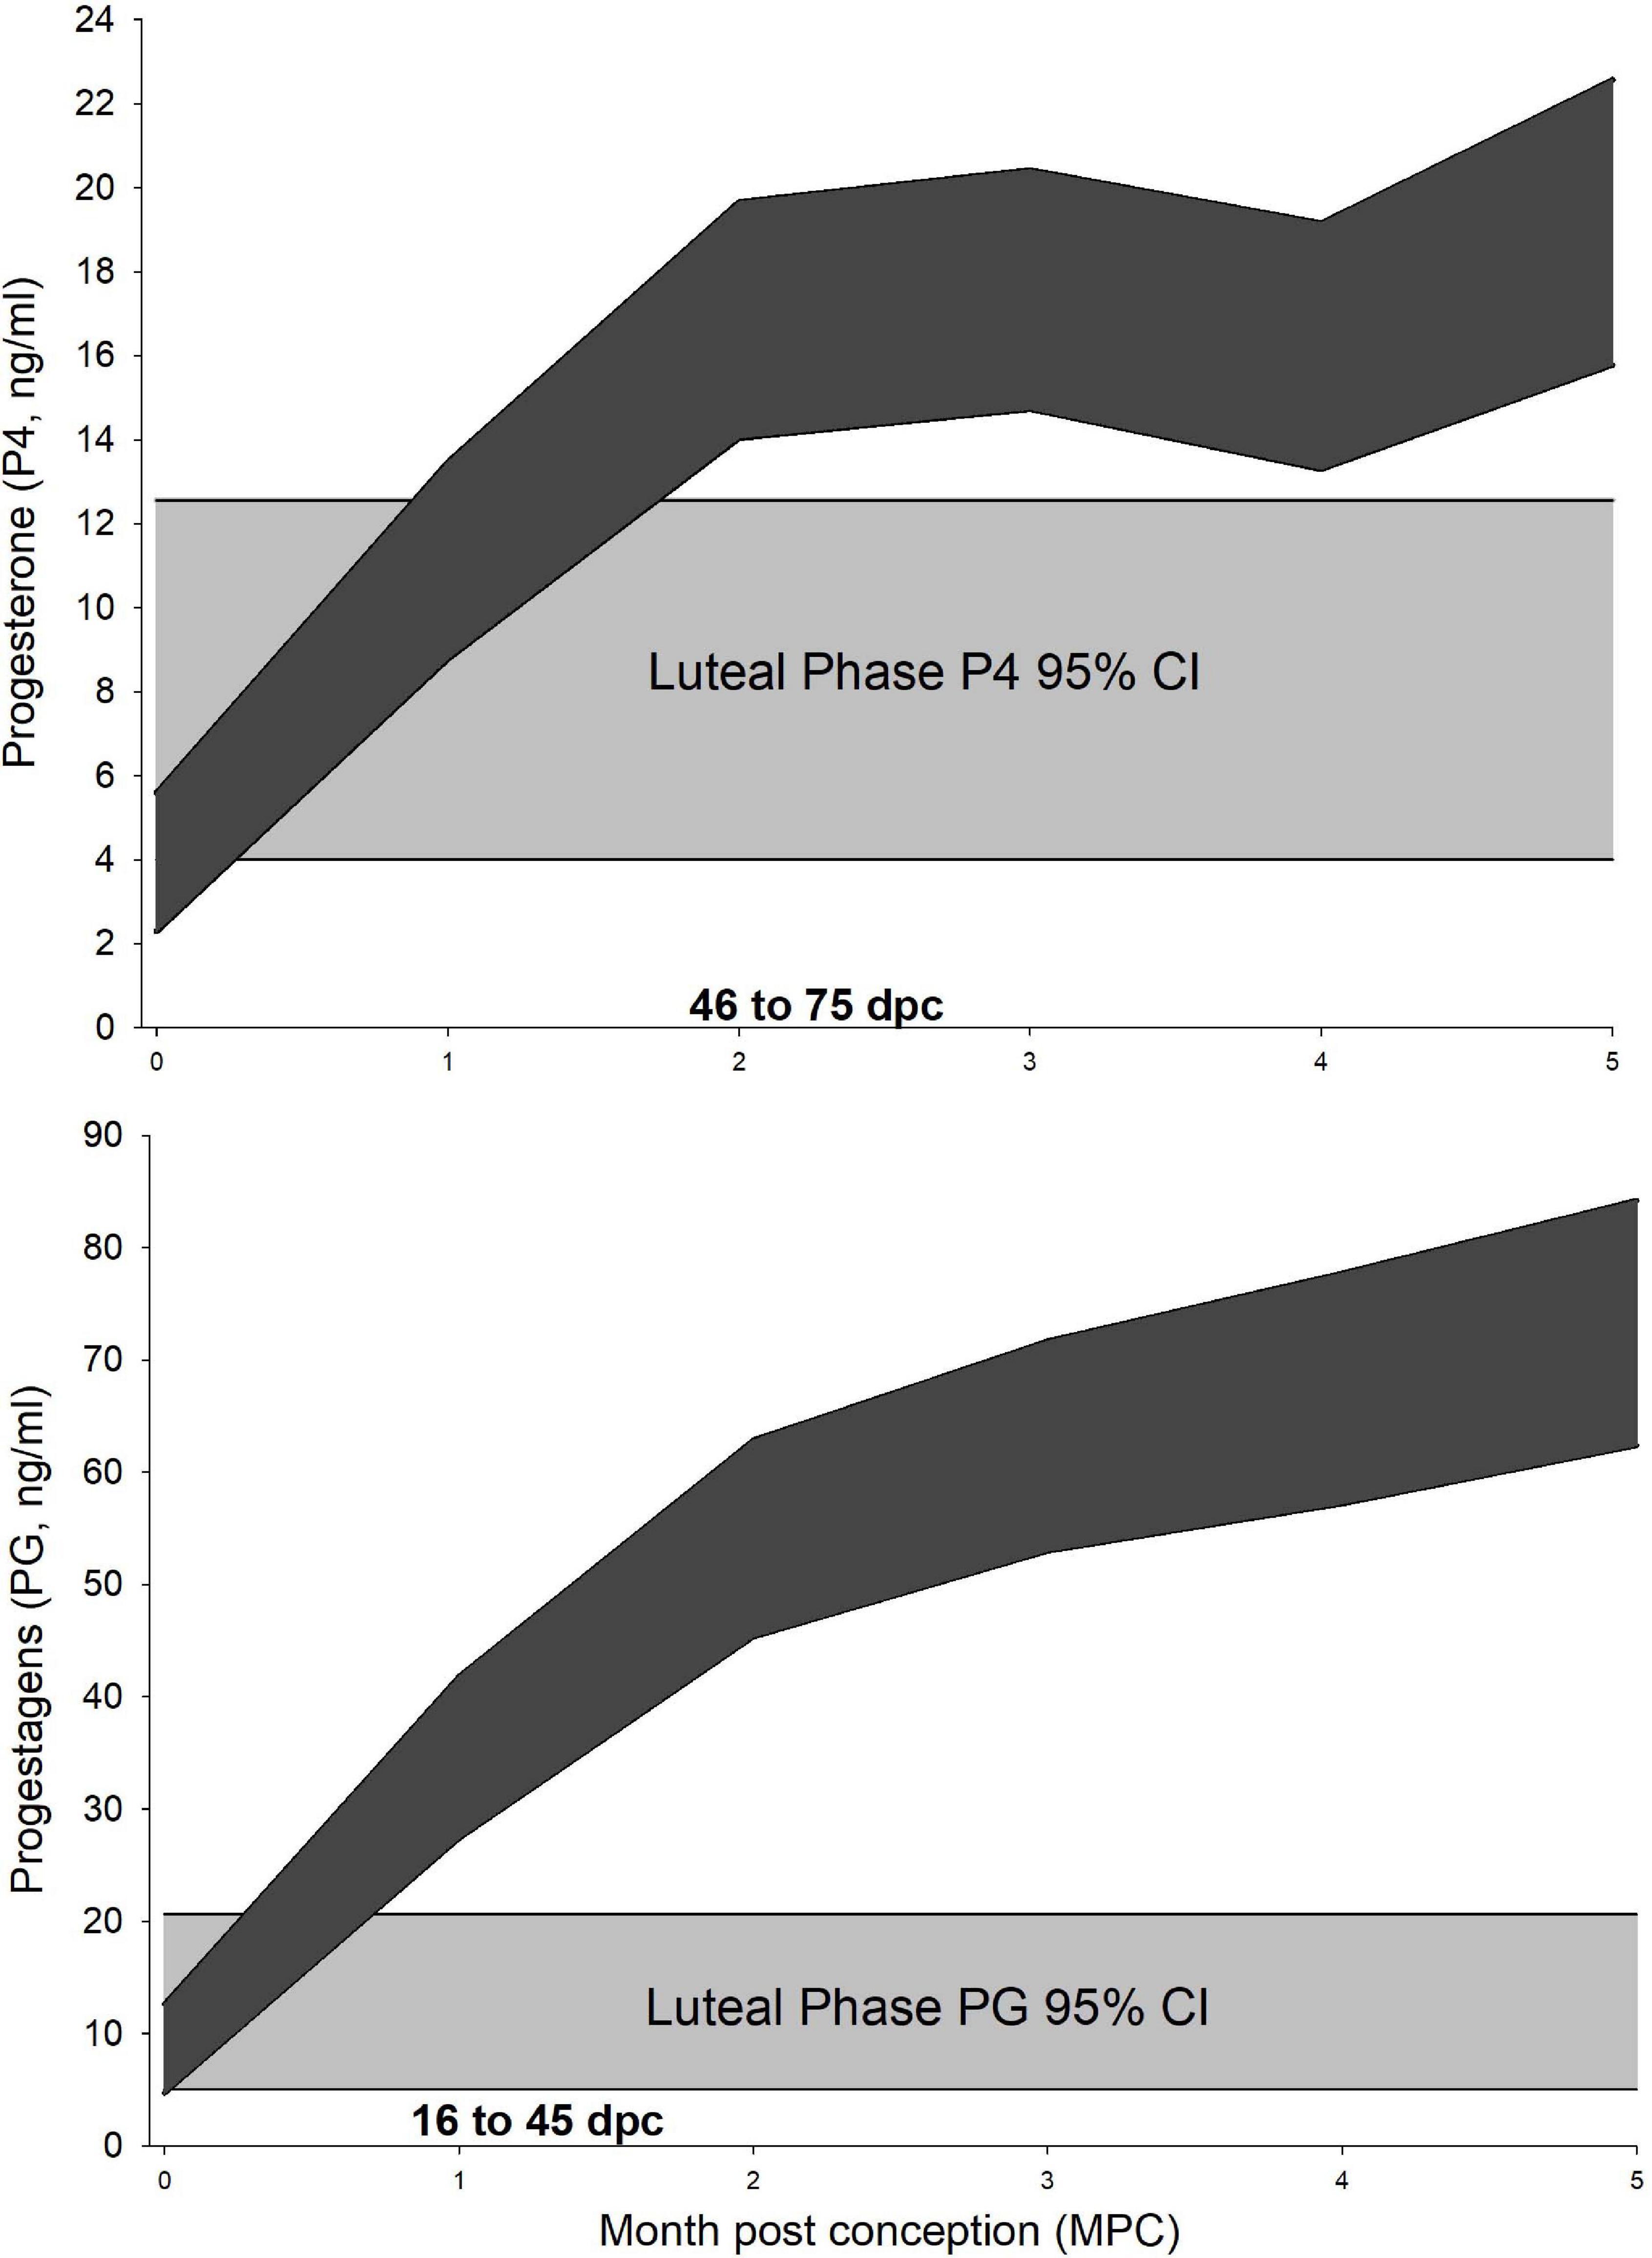
Figure 1. Progesterone and progestagens during the luteal phase and normal pregnancy. Marginal predicted 95% confidence interval (CI) for serum progesterone (P4, Upper) and progestagens (PG, Lower) from normal pregnancies. The shaded curves (dark gray) represent the 95% CI for each month post conception (MPC) for each hormone, respectively. Month 0 – represents samples collected from day 1 to day 15 post conception (pc). Month 1 – from day 16 to day 45 pc, Month 2 – from day 46 to 75 pc, etc. The 95% CI for each hormone during the luteal phase is represented by light gray. Overlapping CIs represent non-significant differences between the MPC and luteal phase concentrations.
Normal Pregnancies (NORM)
For P4 analysis, a two-level mixed model with animal id as the random intercept was significant (Table 3). Both STAGE (χ2 = 18.9, P = 0.0001) and MPC (χ2 = 107, P < 0.0001) were significant within the separate analysis. No significant effect of season or age was detected on model variance. Post hoc analysis indicated P4 concentrations during EARLY were significantly less than MID and LATE pregnancy (Table 4). For MPC, P4 concentrations during the first 15 days (MPC 0, 4.0 ng/ml, 95% CI 2.5–5.9) were reduced compared to all other MPCs, while MPC 1 (11.4 ng/ml, 95% CI 9–14) was reduced (P < 0.05) compared to peaks observed in MPCs 5 (19 ng/ml, 95% CI 16–21 ng/ml), 6 (18 ng/ml, 95% CI 15–20 ng/ml), and 11 (20 ng/ml, 95% CI 16–24 ng/ml; Figure 2).
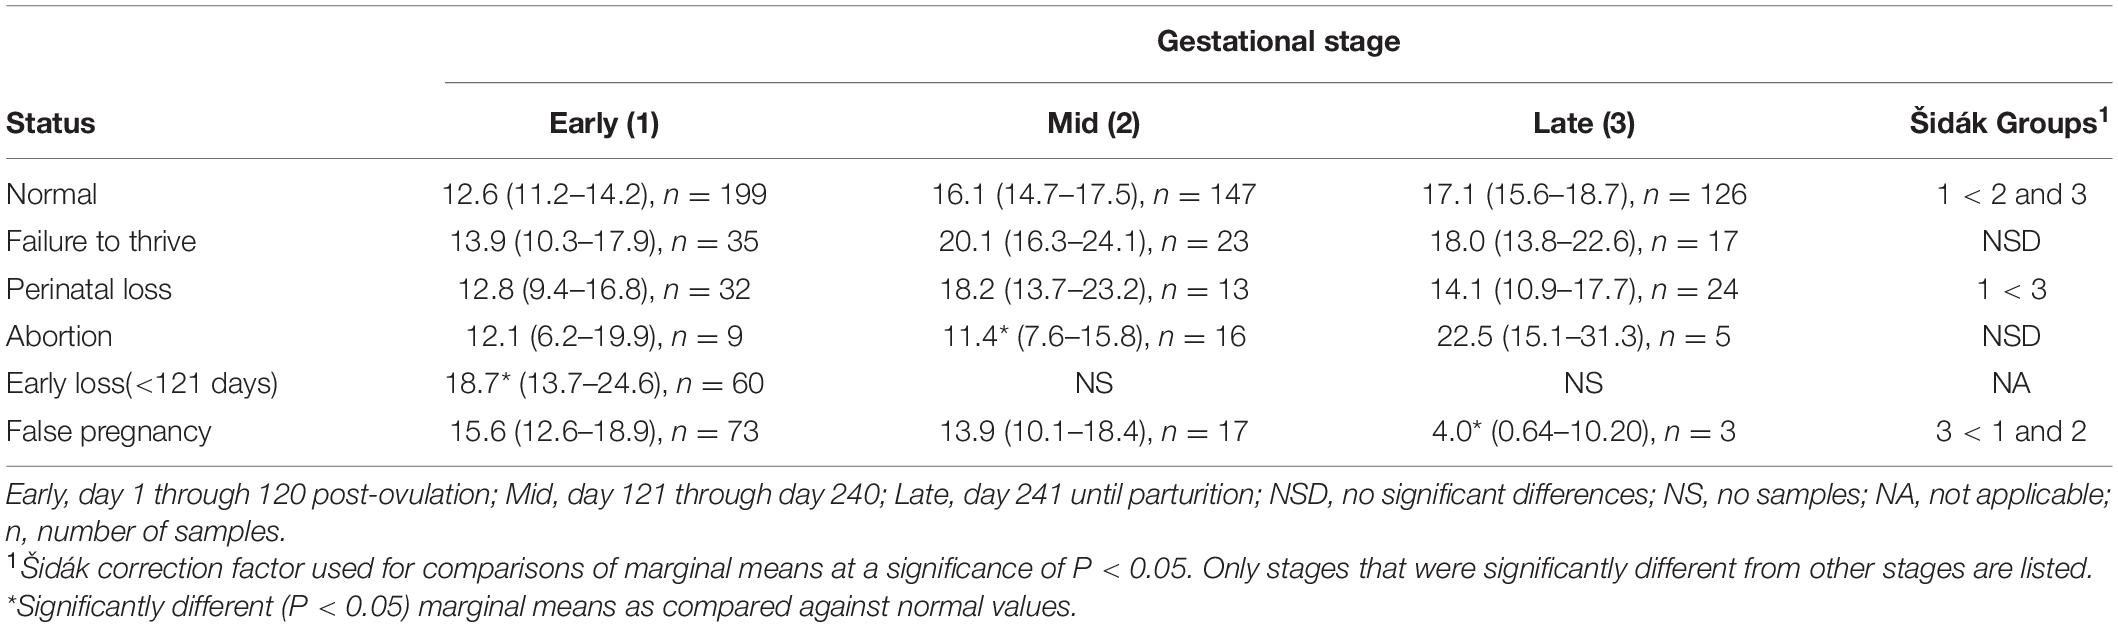
Table 4. Marginal mean (95% confidence interval) progesterone (P4) concentration (ng/ml) during each stage of normal and abnormal bottlenose dolphin pregnancies.
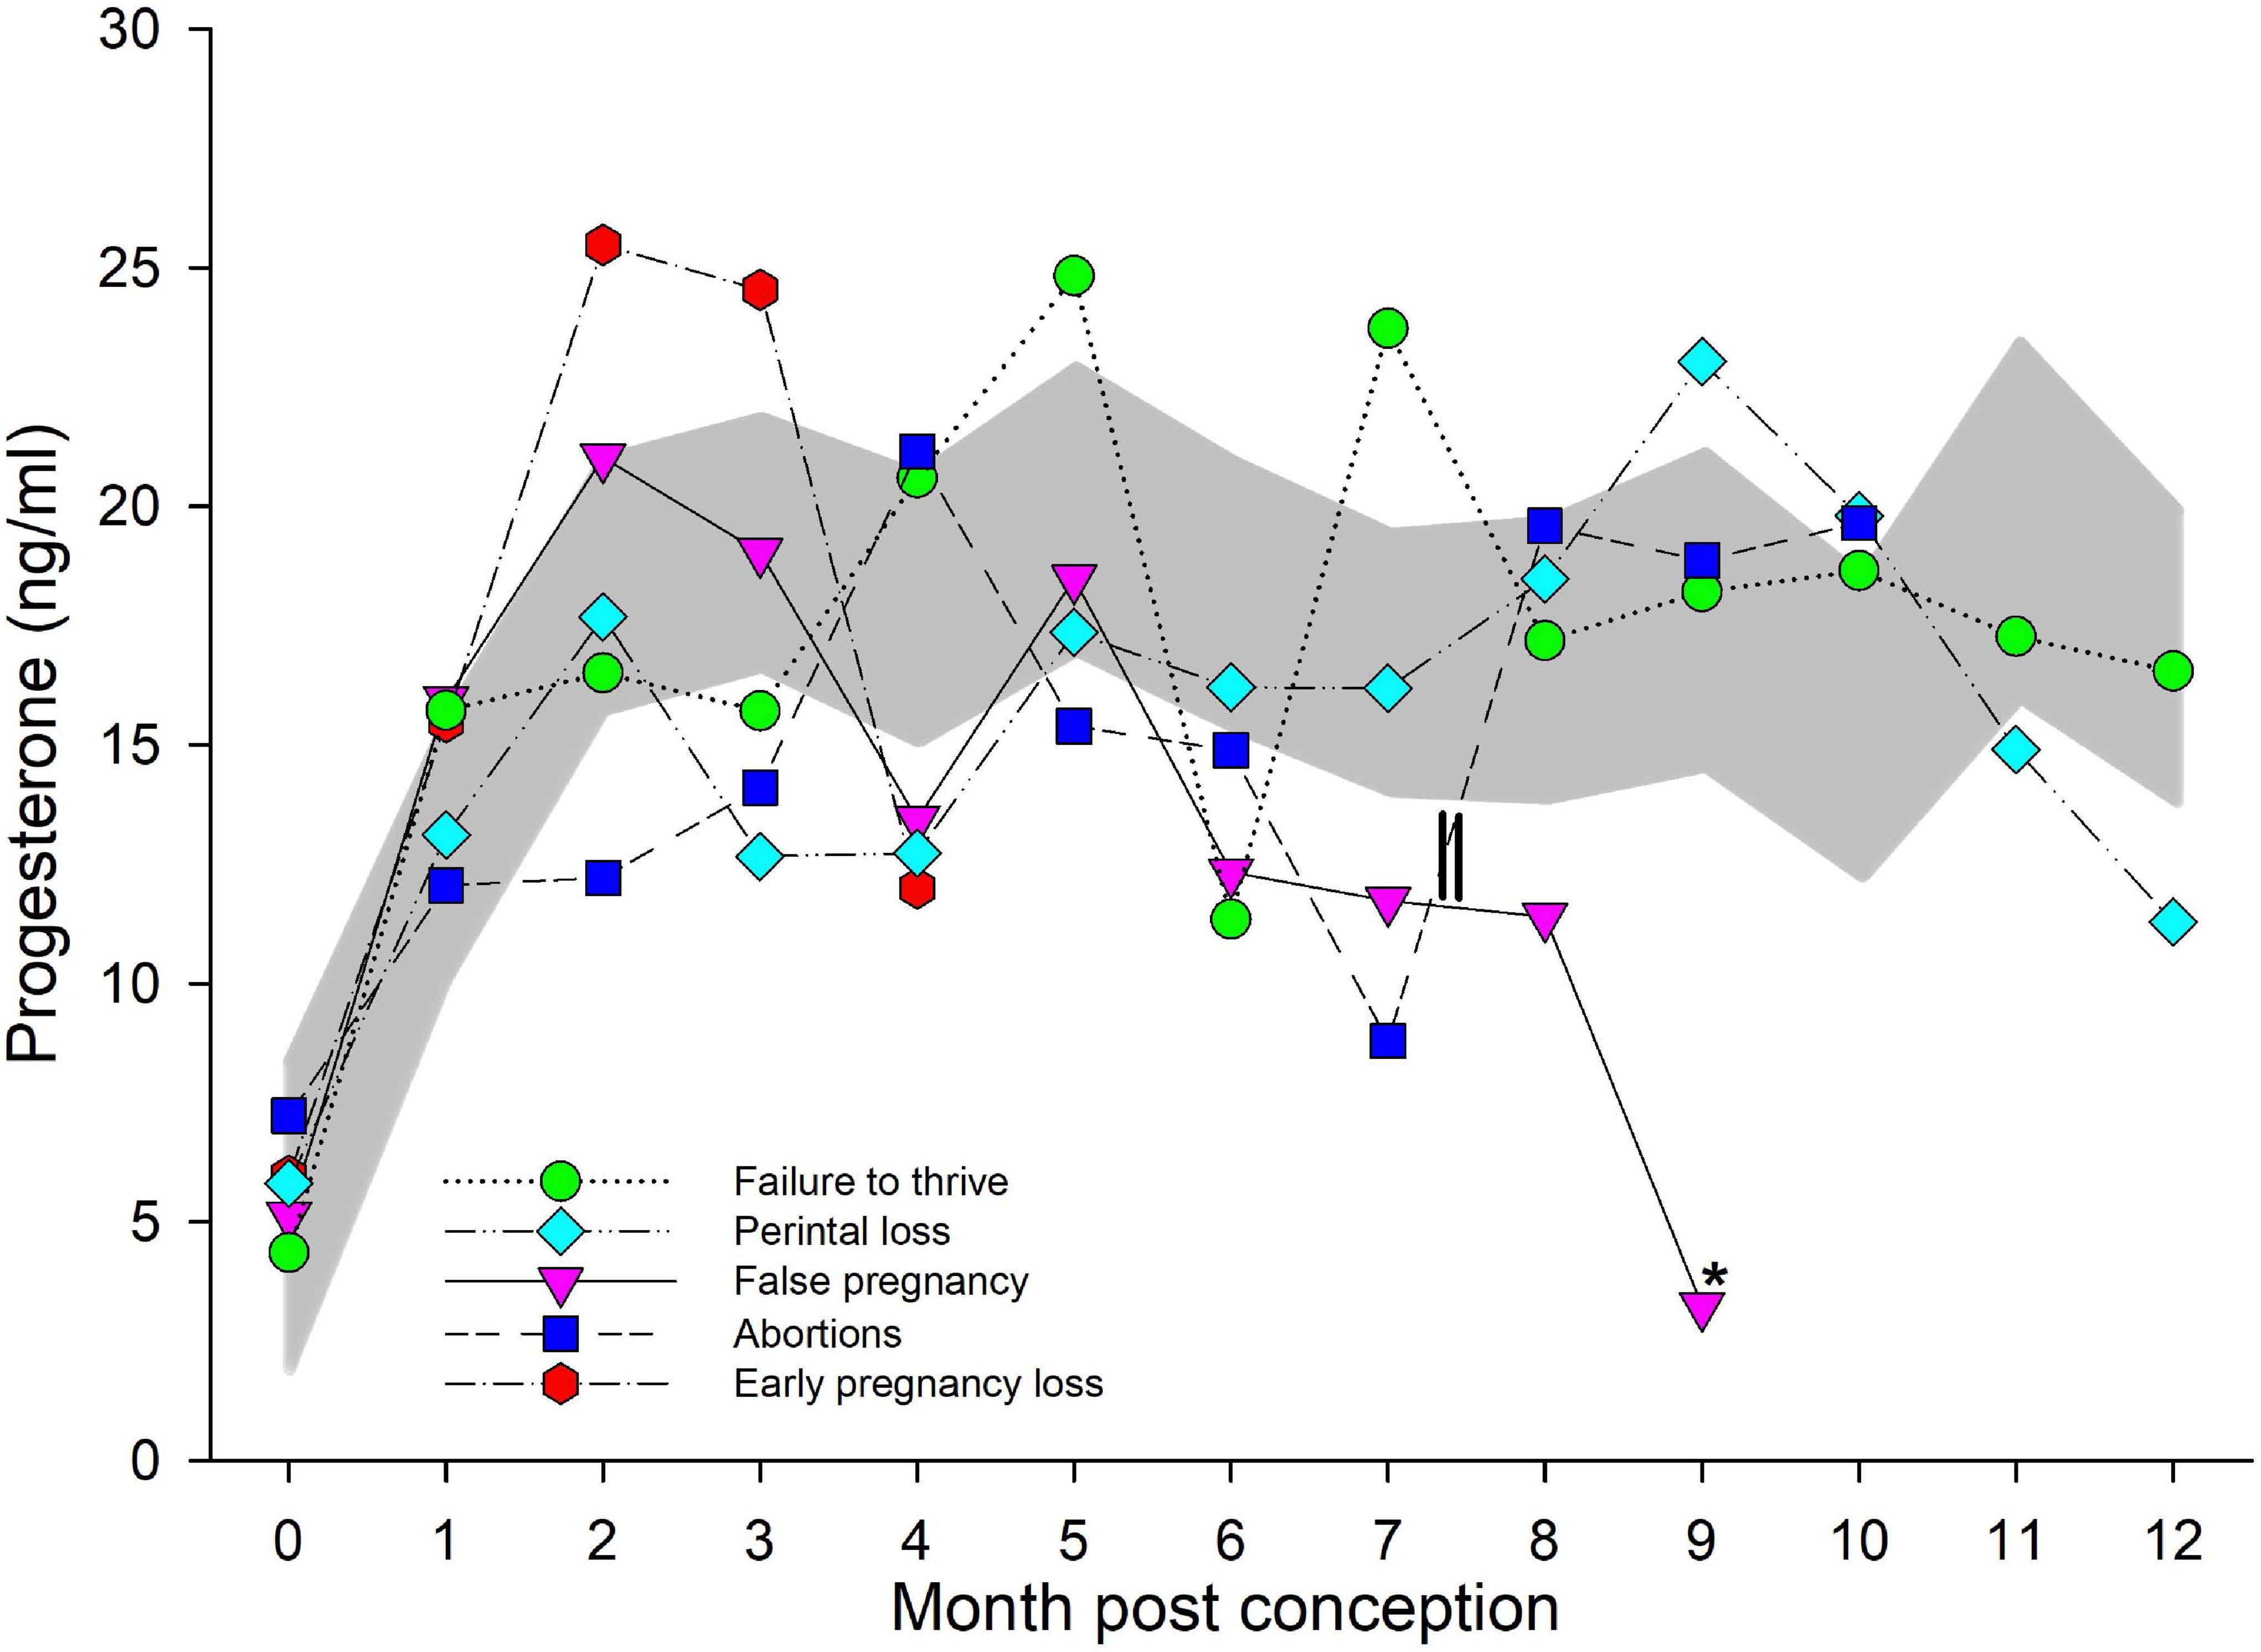
Figure 2. Progesterone during normal, abnormal, and false pregnancy. The marginal predicted 95% confidence interval (CI) for progesterone during each month post conception (MPC) of normal pregnancies as represented by the dark gray shaded portion of the graph. Each line graph with different symbols (see legend embedded in graph) represent the marginal mean MPC concentration of progesterone (95% CI were not included for readability) during each abnormal pregnancy type. MPC of abnormal pregnancies that had mean concentrations that were significantly different than normal are highlighted with an asterisk (*). The parallel lines on the line graph for abortions represent the period prior to which two of the abortions occurred, and thus, the decrease in progesterone concentrations during MPC 7 was influenced by these events.
Failure to Thrive (FTT)
For comparison of P4 between NORM and live calves that did not live beyond 30 days (FTT), a two-level mixed model with animal id as the random intercept was significant (Table 3). No significant effect of season, age, STATUS or the interaction between STAGE by STATUS (FTT or NORM) on model variance was detected. Additionally, and unlike NORM, no significant increase in P4 was detected after EARLY, and concentrations during all three stages were similar (Table 4). Similar to STAGE, no significant effect of season, age, STATUS or MPC by STATUS was found, but combined MPC exhibited effects (χ2 = 117, P < 0.0001) on the model variance. Within FTT, MPCs 4, 5, and 7 through 9 were significantly increased over months 0 and 1. Bimodal peaks occurred in MPC 5 (25 ng/ml, 95% CI 18–32 ng/ml) and 7 (24 ng/ml, 95% CI 15–34 ng/ml; Figure 2).
Perinatal Loss (PNL)
For comparison of P4 between NORM and PNL, a two-level mixed model with animal id as the random intercept was significant (Table 3). Although combined STAGE had an effect (χ2 = 19.8, P < 0.0001), no significant effect of season, age, STATUS or the interaction between STAGE by STATUS on model variance was detected. Within PNL, no difference in P4 concentrations between stages was observed (Table 4).
An effect of both MPC (χ2 = 109, P < 0.0001) and MPC by STATUS (χ2 = 22.5, P = 0.032), with no effect of season, age or STATUS, was observed. No post hoc paired marginal mean comparisons within MPC between NORM and PNL were detected (Figure 2). Within PNL, MPC 8 through 10 had significantly increased P4 compared to MPC 0. Within this group, P4 peaked in MPC 9 at 21 ng/ml (95% CI 16–27 ng/ml; Figure 2).
Early Loss (EL)
For comparison of P4 between NORM and animals that lost an embryo or fetus prior to day 120 of gestation (EL), a three-level mixed model with animal id as level two random intercept and the third level pregnancy id was significant (Table 3). Because EL pregnancies did not extend beyond STAGE EARLY, only this STAGE could be compared against NORM. Differences (χ2 = 4.3, P = 0.039) in concentrations between NORM and EL animals during EARLY and season (χ2 = 12.3, P = 0.007) were detected, but none with age (Table 4). For season, winter (19.3 ng/ml) was greater than spring (12.4 ng/ml) and fall (12.6 ng/ml).
A significant effect of MPC (χ2 = 61, P < 0.0001) was detected, but not with STATUS, MPC by STATUS, season or age. No post hoc paired marginal mean comparisons within MPC between NORM and EL were detected (Figure 2). Within EL, significant increases during MPC 1 through 3 were detected with a peak of 25 ng/ml (95% CI 19–34 ng/ml) during MPC 2 (Figure 2).
Abortion (AB)
For P4 comparison between NORM and animals that aborted a fetus between days 121 and 352 days of gestation (AB) a two-level mixed model with animal id as the random intercept was significant (Table 3). Both STAGE (χ2 = 19.6, P < 0.0001) and STAGE by STATUS (χ2 = 6, P = 0.049) influenced model variance, while STATUS, season nor age had no detectable effect. Post hoc paired marginal mean comparisons within each stage indicated that P4 during AB MID was significantly reduced compared to NORM (Table 4). Within AB, no differences between STAGEs were observed (Table 4).
An effect was observed for MPC (χ2 = 117, P < 0.0001), while no effect for STATUS, MPC by STATUS, season or age was detected. Post hoc paired marginal mean comparisons within MPC between NORM and AB did not detect any significant differences (Figure 2). Within AB, no significant differences in P4 concentrations during any MPC were detected (Figure 2).
False Pregnancy (FP)
For comparison of P4 between NORM and non-pregnant animals with increased progesterone >21 days (FP), a two-level mixed model with animal id as the random intercept was significant (Table 3). Both STAGE (χ2 = 18, P = 0.0001), and STAGE by STATUS (χ2 = 16, P = 0.0003) influenced model variance, while STATUS, season nor age had no detectable effect. Post hoc paired marginal mean comparisons of P4 concentrations between NORM and FP within each stage indicated that only FP LATE was decreased (P < 0.05) compared to NORM (Table 4). Within FP, P4 concentrations in LATE were significantly reduced compared to MID and EARLY (Table 4).
A significant effect of both MPC (χ2 = 41, P < 0.0001) and MPC by STATUS (χ2 = 23, P = 0.005) was found but no effect of STATUS, season or age was observed. Post hoc paired marginal mean comparisons of P4 concentrations between NORM and FP within each MPC did not detect any differences (Figure 2). Within FP, P4 significantly increased and peaked in MPC 2 (21 ng/ml, 95% CI 16–27 ng/ml) then started decreasing in MPC 6 with a significant drop detected in the final MPC 9 (3 ng/ml, 95% CI 0.32–9 ng/ml; Figure 1).
Progestagens (PG)
Based on standardized residual analysis, all final models used the square-root of PG transformation for analysis.
Comparisons Between Non-pregnancy Reproductive States and Pregnancy
For PG analysis, a three-level mixed model with animal id as level 2 random intercept and pregnancy id as level 3 was significant (Table 3). Post hoc marginal mean comparisons of P4 concentrations between all time periods pre- or post-pregnancy indicated that luteal phase (11.5 ng/ml, 95% CI 5.0–20.6) was greater than the follicular phase (0.41 ng/ml, 95% CI 0.65–4.4 ng/ml, P < 0.01), and concentrations during the ovulatory period (0.34 ng/ml, 95% CI 0.65–4.0 ng/ml) were less than MPC 1 through 5 (Figure 1).
Normal Pregnancies (NORM)
A two-level mixed model with animal id as the random intercept provided significant explanation of PG variance (Table 3). Both STAGE (χ2 = 324, P < 0.0001) and MPC (χ2 = 740, P < 0.0001) were significant, with no effect of season or age being detected. Marginal effects indicated that all STAGEs were significantly different between themselves with concentrations increasing throughout pregnancy (Table 5).
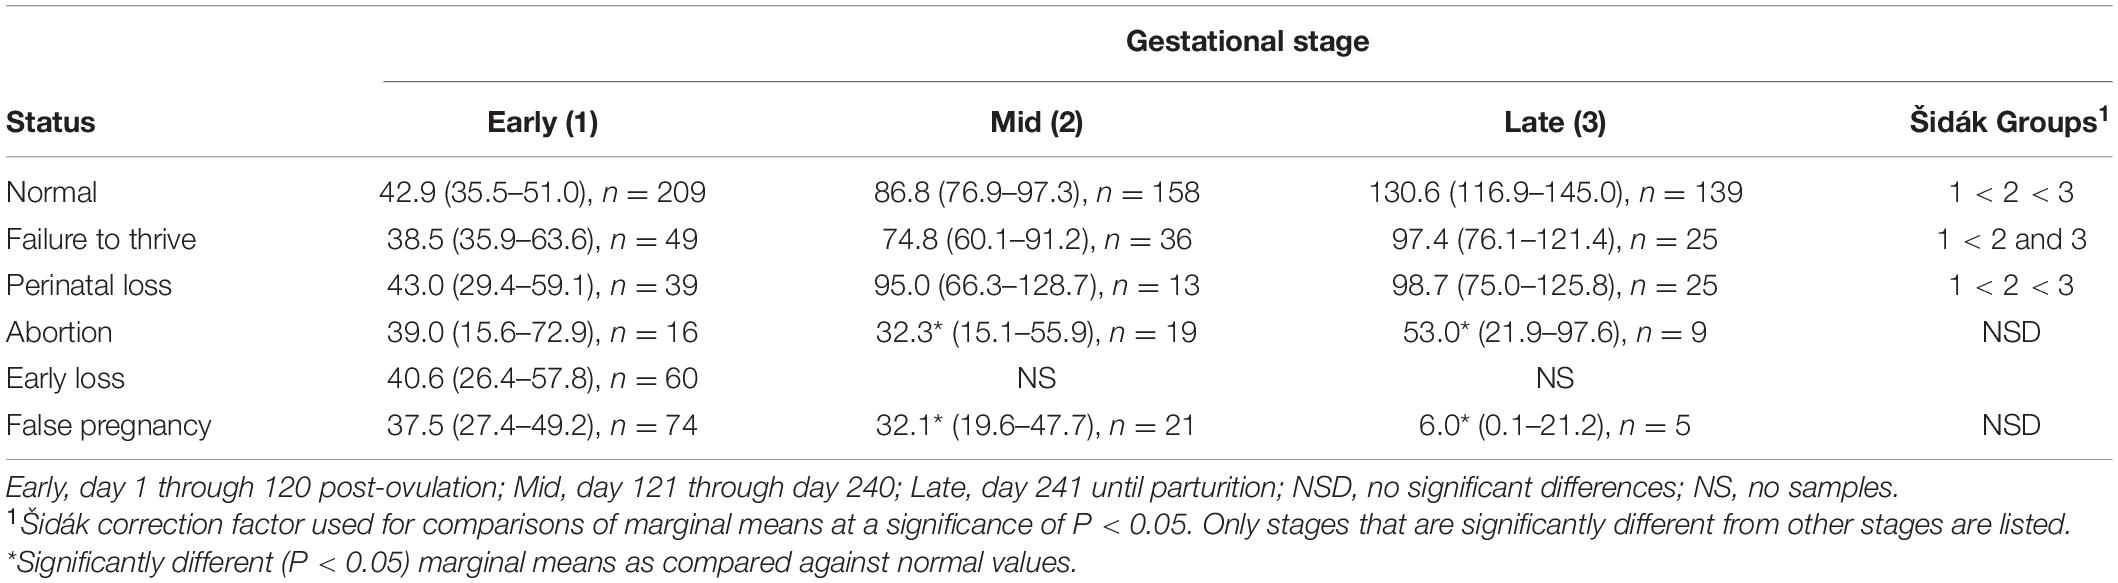
Table 5. Marginal mean (95% CI) progestagen concentration (ng/ml) during each stage of normal and abnormal bottlenose dolphin pregnancies.
The first 30 days (MPC 0, 8.9 ng/ml, 95% CI 4.8–14.2) and MPC 1 (34.4 ng/ml, 95% CI 26.8–43.1) were different (P < 0.006) than all other months, with PG increasing each month post conception. A slow increase during the first 2 months resulted in significant peak in MPCs 2–5 (53.9–66.7 ng/ml), and was followed by a second significant peak during MPCs 6 to 9 (84.6–110.5 ng/ml). Concentrations continued to significantly increase during the final 3 months with a peak occurring in month 12 at 153 ng/ml (95% CI 132.1–177.0 ng/ml; Figure 3).
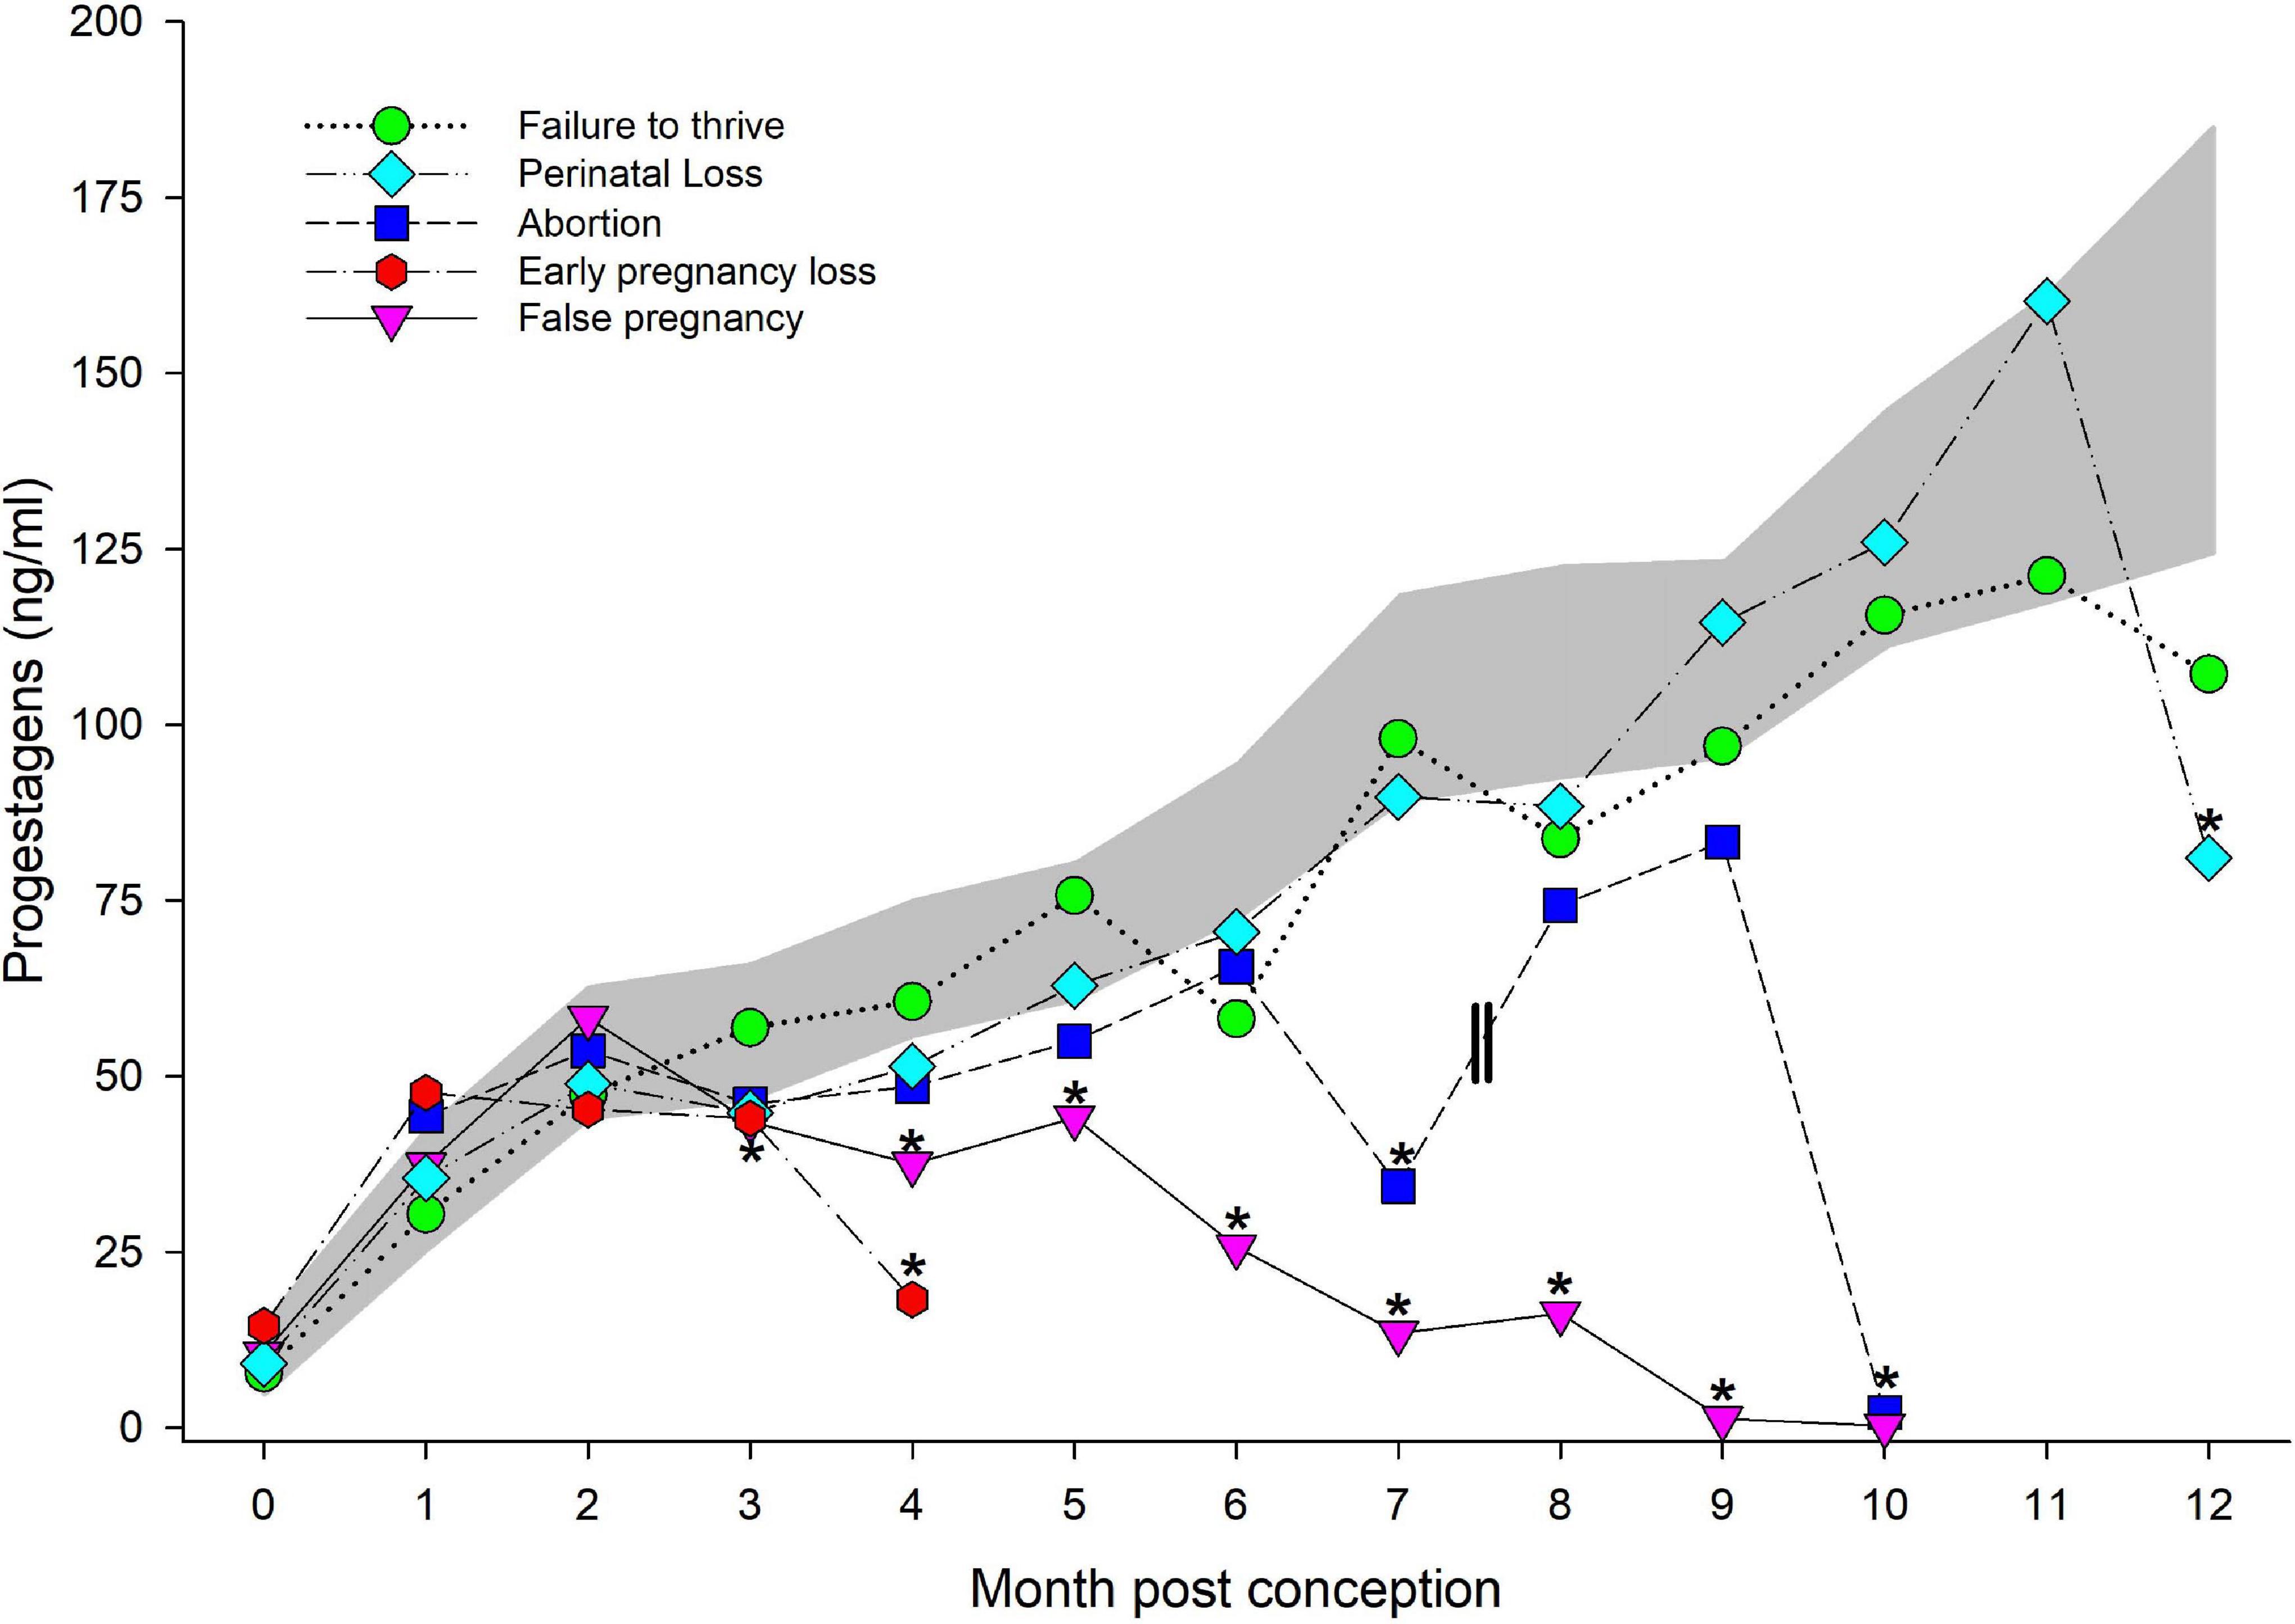
Figure 3. Progestagens during normal, abnormal and false pregnancy. The marginal predicted 95% confidence interval (CI) for progestagens during each month post conception (MPC) of normal pregnancies as represented by the dark gray shaded portion of the graph. Each line graph with different symbols (see legend embedded in graph) represent the marginal mean MPC concentration of progestagens (95% CI were not included for readability) during each abnormal pregnancy type. MPC of abnormal pregnancies that had mean concentrations that were significantly different than normal are highlighted with an asterisk (*). Parallel lines on the line graph for abortions represent the period prior to which two of the abortions occurred, and thus, the decrease in progestagen concentrations during MPC 7 was influenced by these events.
Failure to Thrive (FTT)
For comparison of PG between NORM and FTT, a two-level mixed model with animal id as the random intercept was significant (Table 3). No effect of STATUS, STAGE, season, or age was detected (Table 4). Within FTT, PG concentrations during EARLY stage were significantly reduced (P < 0.05) compared to the MID and LATE stages, while MID and LATE were similar (Table 5).
Like STAGE, no significant effect of season, age or MPC by STATUS was observed, but combined MPC exhibited significant effects on the model variance (χ2 = 702, P < 0.0001). No post hoc paired marginal mean comparisons within MPC between NORM and FTT were different (Figure 3). Within FTT, significant increases during each MPC were detected in a similar pattern to that observed for NORM, except peak concentration occurred in month 11 (122 ng/ml, 95% CI 68.9–188.1 ng/ml) versus MPC 12.
Perinatal Loss (PNL)
For comparison of PG between NORM and PNL, a three-level mixed model with animal id as the level 2 random intercept and pregnancy id as level 3 random variable was significant (Table 3). STAGE had an effect (Wald χ2 = 346, P < 0.0001), but no significant effect of season, age or the interaction between STAGE by STATUS (PNL or NORM) on model variance was detected. No post hoc paired marginal mean comparisons within each stage were different (Table 4). Within PNL, each stage sequentially significantly increased throughout pregnancy (Table 4).
An effect of both MPC (χ2 = 702, P < 0.0001) and MPC by STATUS (χ2 = 21.2, P = 0.049), but no significant effect of season or age, was observed. Post hoc paired marginal mean comparisons within MPC between NORM and PNL indicated a difference (P = 0.02) during month 12 post conception, whereby concentrations were reduced compared to NORM (Figure 3). Like FTT, significant increases during each MPC were detected in a similar pattern to that which was observed with NORM, except peak concentration occurred in month 11 (146 ng/ml, 95% CI 113–185 ng/ml) versus MPC 12.
Early Loss (EL)
For comparison of PG concentrations between NORM and EL, a two-level mixed model with animal id as the random intercept was significant (Table 3). Because EL pregnancies did not extend beyond STAGE EARLY, only this STAGE could be compared against NORM. No differences were detected in PG concentrations between NORM and EL animals during STAGE EARLY (Table 4). Age did not influence PG during EL, however, season did have an effect (χ2 = 11.4, P = 0.01) with winter (53.2 ng/ml) being greater than spring (33.7 ng/ml) and summer (36 ng/ml).
A significant effect of both MPC (χ2 = 702, P < 0.0001) and MPC by STATUS (χ2 = 21.2, P = 0.049) was detected with no effect of season or age. Post hoc paired marginal mean comparisons between MPC indicated a difference (P = 0.008) between NORM and EL during MPC 4 (the final month for an EL pregnancy, Figure 3), whereby concentrations for EL were lower compared to NORM. Significant increases during each MPC were only detected between MPCs 0 and 1, and thereafter concentrations plateaued in MPCs 1 through 3 (47–43 ng/ml, respectively) until significantly dropping in MPC 4 (the final month, 18 ng/ml, 95% CI 4.6–41.0; Figure 3).
Abortion (AB)
Comparison of PG concentrations between NORM and AB indicated a two-level mixed model with animal id as the random intercept was significant (Table 3). Both STAGE (χ2 = 367, P < 0.0001) and STAGE by STATUS (χ2 = 12.7, P < 0.002) influenced model variance, while neither season nor age had any detectable effect. Post hoc paired marginal mean comparisons within each stage indicated that AB MID and LATE were decreased (P < 0.05) compared to NORM (Table 3). Within AB, no differences between STAGEs were observed (Table 4).
A significant effect of MPC (χ2 = 645, P < 0.0001), STATUS (χ2 = 55, P < 0.0001) and MPC by STATUS (χ2 = 68, P < 0.0001), but no effect of season or age was observed. Post hoc paired marginal mean comparisons between MPC indicated a significant difference (P < 0.05) between NORM and AB during MPCs 7 and 10 (Figure 3). Within AB, PG did not significantly increase during each MPC. A non-significant peak in concentrations occurred in MPC 9 at (83 ng/ml) with a significant drop during MPC 10 (2.1 ng/ml, 95% CI 3.4–23 ng/ml).
False Pregnancy (FP)
For comparison of PG between NORM and FP, a three-level mixed model with animal id as the second level random intercept and third level pregnancy id was significant (Table 3). Both STAGE (χ2 = 370, P < 0.0001) and STAGE by STATUS (χ2 = 70, P < 0.0001) influenced model variance, while neither season nor age had any detectable effect. Post hoc paired marginal mean comparisons within each stage indicated that both FP MID and LATE were significantly decreased compared to NORM (Table 4). Within FP, no differences between STAGES were observed (Table 4).
An effect of both MPC (χ2 = 738, P < 0.0001) and MPC by STATUS (χ2 = 118, P < 0.0001) was detected, but no effect of season or age was observed. Post hoc paired marginal mean comparisons between MPC indicated a significant difference between NORM and FP in all months after MPC 2 (Figure 3). Within FP, progestagens significantly increased and peaked in MPC 3 (50 ng/ml, 95% CI 36–66 ng/ml), then significantly decreased after MPC 5 until MPC 10 (Figure 3).
Discussion
This study provides a retrospective analysis of progesterone (P4) and progestagens (PGs) as well as direct comparisons of bottlenose dolphin pregnancies with unsuccessful outcomes or false pregnancies against normal, successful pregnancies. Progestagens continued to increase throughout normal pregnancy while P4 increased during the EARLY stage and leveled off during MID and LATE gestational stages. Within the abnormal pregnancies, P4 concentrations only varied from normal during early loss (EL), abortion (AB), and false pregnancy (FP), while PG concentrations varied from normal within perinatal loss (PNL), EL, AB, and FP. Within known or estimated ovulation dates, P4 and PGs can provide accurate diagnostic confirmation of pregnancy; however, for samples collected from animals with unknown conception dates or pregnancy status, PGs have greater utility for differentiating between pregnancy and luteal states. Additionally, PG concentrations appear to be better than P4 for differentiating between normal and abnormal pregnancies and false pregnancies, but its usefulness is somewhat limited. The differing ability of these hormones to be relied on as potential sentinels for gestational health can, in part, be inferred from the physiologic role within the ovarian-placental-fetal unit that each of these hormones play during these abnormal reproductive outcomes.
No differences were detected in gestation lengths between normal gestations, PNL, and FTT. However, conception dates for almost half of the normal pregnancies were estimated, therefore, our limited samples within each group may have precluded us from detecting a relationship between total gestational length and these reproductive outcomes. As more pregnancies with known conception dates are added to the data set, the utility or not of gestation length as a predictor of overall fetal health may eventually be revealed. For example, in cattle, stillbirth incidence rate is higher when gestations are shorter than the mean length (Meyer et al., 2000). This emphasizes the importance of routine endocrine monitoring in the bottlenose dolphin to pinpoint conception. If gestation lengths could be a predictor of reproductive outcome, reference ranges could be established and, possibly, in combination with a suite of hormone tests, higher risk pregnancies could be identified. Once labor has initiated, the gestation length would be known and compared to the reference ranges. If a gestation length identifies a possible FTT at risk calf, animal care staff and management could then mobilize efforts to increase monitoring and be prepared for intervention, if needed.
The live birth rate of 81.6% and an abortion rate (early loss + abortions) of 11.5% observed within the SEA population are in line with what has been previously described for other cetaceans and domestic species. In killer whales, a 75% live birth rate and 11% abortion rate has been reported (Robeck et al., 2018), and abortion rates from 8 to 12% have also been documented in cattle and horses (Forar et al., 1995). Furthermore, calf survival of ≥30 days (88%) and 1 year (85.2%) reported herein for captive bottlenose dolphins were similar to rates of 85.1 and 80.7%, respectively, that were previously reported by Sweeney et al. (2010).
To our knowledge this is the first report of perinatal mortality rates based on known, total reproductive events for a captive population of bottlenose dolphins. Although difficulty arises in direct comparisons across species and research publications that use differing criteria, our overall perinatal mortality rate of 11.5%, which included term animals born dead or stillbirths (5.2%) and live calves (6.3%) that did not live beyond 24 h, was less than the 17% estimate that has been reported for one healthy population of wild bottlenose dolphins (Wells et al., 2014). If we included mid to late term abortions in our total, the loss (16.7%) would be similar to estimates by Wells et al. (2014). In another odontocete, the killer whale, estimates of perinatal loss in wild populations have ranged from 37 to 42% (Bain, 1990; Olesiuk et al., 1990). In compromised wild killer whale and bottlenose dolphin populations, losses have been estimated from 66 to 80%, respectively [Lane et al., 2015 (bottlenose dolphin); Wasser et al., 2017 (killer whale)].
Stillbirth rates are difficult to determine in wild populations because the opportunity to observe birth events is extremely rare, so it is unknown if calves were alive or dead at or within 24 h following parturition. Therefore, zoo based populations can provide valuable birth rate information that can be extrapolated to expectations in the wild. As such, our stillbirth rate of 5.2% was very similar to the only other (to our knowledge) published rate for an odontocete, the killer whale at 6.7% for PNL (Robeck et al., 2018). Stillbirth rates in cattle range from 5 to 13% (Meyer et al., 2001; Jonker, 2004), and dystocia, with estimates of up to 50%, is the major cause (Meyer et al., 2000; Mee et al., 2014). In cattle and horses, dystocia has a complex multifactorial etiology with primary influences being parity or age at first calf and genetics (i.e., calf size), as demonstrated by a dystocia rate that is twice as common in primiparous females compared to multiparous females (McDermott et al., 1992; Meyer et al., 2000; Johanson and Berger, 2003). Although human intervention during prolonged or dystocic labor is common for dairy cattle and horses, this type of intervention is still rare with bottlenose dolphins and calf size may be an important variable that influences stillbirth rates in bottlenose dolphins (Robeck et al., 2012). Furthermore, historically inaccurate identification of conception dates or data collection at birth impedes evaluation using obvious factors, such as gestation length, length of labor and calf birth weight, as potential risk-increasing identifiers of perinatal mortality in bottlenose dolphins. As techniques for monitoring reproductive activity (Robeck et al., 2013), gestational development (Ivancić et al., 2020), and early calf development (Sweeney et al., 2010) are integrated into bottlenose dolphin reproductive management programs, and as more data is collected under these conditions, future research should be conducted to evaluate risk factors on bottlenose dolphin neonatal mortality.
The FP rate of 6% reported herein is half or less than half of the previously reported rate for bottlenose dolphins (12%, O’Brien and Robeck, 2012) and killer whales, respectively (15%, Robeck et al., 2018). Because the recent FP rate reported by O’Brien and Robeck (2012) was derived from animals across multiple facilities and only in animals that had been monitored closely with combination of urinary and serum hormone analysis and ultrasonography, it may represent a more accurate estimation of its occurrence.
The potential use of a single sample for P4 or a combination of hormone concentrations for pregnancy determination in cetaceans is an important yet unanswered component of annual, wild animal health assessment programs (Dalle Luche et al., 2020). Our results provide some guidelines for the use of P4 and/or PGs for just such an assessment. We found that serum P4 concentrations greater than 14 ng/ml is indicative of pregnancy with a 95% probability. This concentration would not be expected to regularly occur until between 46 and 75 days post conception. However, P4 concentrations from samples collected during MPC 4 can also potentially overlap with concentrations during the luteal phase. Based on the 95% CI, PG concentrations greater than 29 ng/ml from samples collected from day 16 to 45 (MPC 1) post conception are consistent with pregnancy. Additionally, the mean PG from all other MPCs was significantly greater than luteal phase concentrations. These results support other recent research that indicates PGs appear to be more pregnancy specific and better at detecting pregnancy than P4 (Legacki et al., 2020). Therefore, the potential for P4 concentrations to overlap with luteal phase concentrations at least until the 4th month of pregnancy and the lack of known conception dates may complicate using P4 or PG a sole metric for pregnancy diagnosis in wild populations. Future efforts to combine PG analysis with other placental or pregnancy specific hormones, for example androgens (Steinman et al., 2016) or relaxin (Bergfelt et al., 2013; Robeck et al., 2018) may provide a single point diagnostic result with the sensitivity and specificity needed for field research where typically only one sample can be collected.
In the present study, P4 exhibited a bimodal, longitudinal profile like previous studies during normal pregnancy (Cornell et al., 1987; Schroeder and Keller, 1990; O’Brien and Robeck, 2012) with some notable differences. Schroeder and Keller (1990) has shown P4 increases significantly during the first 3 months of gestation compared to estrus, decreases by ∼60% during month 4, then undergoes a secondary increase that is maintained through the end of pregnancy. We observed significant peaks in P4 concentrations during MPCs 5, 6, and 11 when compared to MPC 1. A decrease in P4 during MPC 4 was also observed but was not significant. This bimodal pattern in the bottlenose dolphin was only observed for P4, and not PG, in our study. Progestagens increased in a relatively linear fashion compared to P4, and peaked during MPC 12, the final month of pregnancy. Analysis of pregnanes using liquid chromatography tandem mass spectrometry (LC-MS/MS) has found that P4 decreases by at least 50% from early to mid-gestation in the bottlenose dolphin when measured as a percentage of the total pregnane concentration, whereas, 3β, 20α dihydroprogesterone (DHP) and 20α DHP increase linearly during pregnancy (Legacki et al., 2020). This could explain the differences we observed between the P4 and PG profiles for bottlenose dolphins. The P4 antibody we used has little to no cross-reactivity to other pregnanes and PGs (TOSOH Bioscience Corporation, 2017), but the PG antibody has much broader antibody specificity for pregnanes (see Graham et al., 2001). The predominant pregnane in MID and LATE pregnancy is 3β, 20α DHP and represents greater than 50 and 80% of the pregnanes during these stages, respectively (Legacki et al., 2020). Thus, an antibody with a greater cross-reactivity with pregnanes/PGs would be expected to continue to increase throughout pregnancy, and the same would not be expected with a P4 specific antibody. Moreover, the observed 5-α reduced metabolites increase with a concomitant P4 decrease during pregnancy (Legacki et al., 2020) suggests that PGs, in combination with other hormones (i.e., androgens) may be more appropriate indicators of placental, fetal function by mid-gestation.
When analyzed by stage of pregnancy, in normal pregnancies, we found P4 was higher in MID and LATE pregnancy compared to EARLY, but MID and LATE were not different from one another, similar to what has been reported in the killer whale (Robeck et al., 2017). However, this is contrary to observations by O’Brien and Robeck (2012) that show P4 concentrations during EARLY and LATE are similar, and MID-gestational stage P4 is higher than both EARLY and LATE stages. Bergfelt et al. (2011) demonstrated that P4 concentrations are highest in the EARLY and MID stages and lowest during LATE. Recently with Indo Pacific bottlenose dolphins (Tursiops aduncus), Zhang et al. (2020) did not detect any difference in P4 concentrations between each stage of pregnancy but observed a non-significant increase during the last month. These discrepancies of LATE stage P4 concentrations may be due to absence of peri-parturient serum data in the present study. No samples within the 2-week period prior to parturition were analyzed in our study and, thus, samples representative of the typical peri-parturient drop in P4 in odontocetes that would have reduced the overall mean for LATE stage were not included (O’Brien and Robeck, 2012; Robeck et al., 2016).
For calves that failed to thrive (FTT), neither P4 nor PG concentrations were adequate predictive indicators of a potentially adverse reproductive outcome. Although reduced P4 concentrations have been previously linked to early fetal loss and abnormal corpus luteum (CL) function in dolphins (O’Brien and Robeck, 2012; Robeck et al., 2012), the etiology for the poor outcome of these calves within the current study was not due to ovarian-uterine progesterone deficiency. Prior published evidence suggests that the majority (71%) of calf deaths after the first 24 h are related to failure of passive transfer and malnutrition, both of which are typically associated with poor or no nursing (Sweeney et al., 2010). Therefore, it would have been surprising for either P4 or PGs to have any correlation with these events. Because this phenomenon appears to be maternally influenced, hormones associated with maternal care, such as oxytocin, may be able to distinguish between post-natal calf survival and FTT calves (Robinson et al., 2019).
Similar to FTT, for PNL, P4 concentrations did not differ from NORM at any stage of gestation. However, PG concentrations in PNL pregnancies were lower, compared to NORM, during MPC 12. This provides support that PGs are of placental origin and may be an indicator of reduced placental function. In the bottlenose dolphin, the CL is the primary source of P4 during pregnancy (O’Brien and Robeck, 2012). The source and role of 5α-reduced pregnanes in dolphin pregnancy is unknown (Legacki et al., 2020); it could be a result of synthesis and metabolism of P4 by the placenta like the horse (Legacki et al., 2018) or due to placental metabolism only, like cattle (Conley et al., 2019). In the killer whale, the placenta is thought to be the major source of 5α pregnane production during the last half of pregnancy, while the CL, the major source of P4 in cetaceans, is active throughout pregnancy and plays an important role in the maintenance of pregnancy (Robeck et al., 2016). This is supported by measurements of PGs in both cord blood and maternal serum in this species, where PG concentrations in cord blood are considerably higher compared to maternal serum and provides evidence that the feto-placental unit is the major source of pregnanes (Robeck et al., 2016). The differences we observed for PG concentrations between NORM and other pregnancy outcomes in our study, where PG was lower during certain stages and MPCs for PNL, EL, AB, and FP, also provides support that PGs may also be of placental origin in the bottlenose dolphin. Furthermore, for P4, the only differences from NORM were observed during stages for EL, AB and FP but not during any MPC; this would be expected because the source of P4 in both NORM, EL and FP is the CL, and the decrease in P4 during EL and FP coincides with the increase in PG concentrations as placenta production increases in NORM.
Interestingly, Bergfelt et al. (2011) showed a difference in P4 measures between NORM and PNL pregnancies during mid-pregnancy (Bergfelt et al., 2011). However, that study used a different P4 assay that may have a higher cross-reactivity to 20α DHP (5.41%, Sorge et al., 2008) compared to the P4 antibody used in our study (20α DHP cross-reactivity not reported, TOSOH Bioscience Corporation, 2017). This pregnane increases linearly throughout normal pregnancy (Legacki et al., 2020), but changes in pregnane concentrations during non-normal pregnancies, as observed via LCMS-MS analysis, is unknown. If there are differences in pregnane abundance between pregnancy types, then we may expect to see differences with antibodies that have greater cross-reactivities to PGs. We only observed a significant difference between NORM and PNL during MPC 12 in our PG analysis, which utilized an antibody with greater cross-reactivity with 5-reduced pregnanes compared to both the P4 antibody we used and the antibody in Bergfelt et al. (2011). For females with calves that experienced perinatal loss, both P4 and PG had significant interactions with month post conception, however, a significant drop was only detected for PG concentrations during MPC 12. As described earlier, for the purposes of analysis, it was assumed that most females that experienced perinatal loss were due to dystocia or prolonged labor that resulted in a weak, compromised calf. Although this may be true, the significantly reduced PG concentrations at term may also have been the result of a subset of animals that experienced fetal death and subsequent placental demise prior to parturition due to some uterine-placental abnormality. Research into causes of PNL in combination with endocrine monitoring, especially during the peri-parturient window, with a larger number of animals may be able to provide more insight into this phenomenon.
Although differences from NORM in PG concentrations were detected in AB pregnancies during MPC 7, this month was when two (out of six) of the abortive events occurred. Mean gestation length of aborted pregnancies was 270 days (Table 1), approximately 7 months. Hence, the differences we observed could be attributed to samples collected during or around when abortions occurred and when a drop in PGs would be expected. The other PG concentration difference from NORM for AB was during MPC 10 (∼80% of normal gestation length) just prior to onset of the late term abortion. This drop could be an indicator of gestational complications. When analyzed by stage of pregnancy, concentrations of both P4 and PG were lower in MID pregnancy, while PG was also lower during LATE compared to NORM. Similarly, in the killer whale, PG during AB is also lower compared to NORM during LATE stage and MPCs 14 and 15 (latest abortive event in MPC 15, Robeck et al., 2018), which is also approximately ∼80% of normal gestation. Regardless, for clinical management during pregnancy, if a P4 or PG concentration is detected that is outside of the 95% CI reference ranges given here, a second sample for re-testing should be collected immediately as well as fetal evaluation with ultrasonography. If concentrations remain low, the pregnancy should be identified as high risk and enhanced monitoring activities of the fetus and dam should be implemented. Furthermore, androgens and cortisol, which increase in MID and LATE stages, respectively (Steinman et al., 2016) may be better predictors of reproductive outcome; this also emphasizes the need for consistent monthly or semi-monthly endocrine monitoring for clinical management of pregnancy in this species.
During pregnancies that resulted in EL, we found P4 concentrations were higher during early stage compared to NORM, although when separated by MPC, these differences were not significant. In instances of EL after maternal recognition of pregnancy, it is suggested that for species that do not experience embryonic diapause, prolonged maintenance of the CL after EL occurrence may be reflected in increased P4 concentrations (Hinrichs, 1977; Ginther, 1990). The observation of a histologically active CL along with a degenerated embryo on post mortem analysis of a short-finned pilot whale supports the theory of EL-induced prolonged CL maintenance in cetaceans (Benirschke and Marsh, 1984). The lack of a difference from NORM observed for PG concentrations during EARLY stage may be a result of the proportion of pregnanes during this stage. Legacki et al. (2020) has shown P4 constitutes >50% of pregnane concentration and is the predominant metabolite during EARLY stage of pregnancy in the bottlenose dolphin. Therefore, a P4 specific antibody may be better able to detect any differences during this stage. Despite the lack of significant differences in PG concentrations at the stage level, they became significant when partitioned out by MPC, with concentrations during MPC 4 lower for EL compared to NORM. This is probably due to embryonic death and termination of the pregnancy. Although concentrations of P4 are largely derived from the CL, as mentioned above, PGs are most likely produced by the feto-placental unit. Hence, following embryonic death, which occurs <120 days post conception, we would expect PG production to be significantly reduced. This is supported by our observations of lower PG during MPC 4. Because androgens and cortisol do not increase in normal bottlenose dolphin pregnancy until MID and LATE stages, respectively (Steinman et al., 2016), analysis of these hormones may not be useful as a predictor of pregnancy outcome for EL, therefore, P4 and PG should be considered as the only sentinels of EL currently identified in the bottlenose dolphin.
False pregnancies are characterized by a retained CL and elevated concentrations of P4 and/or PG for the duration of retention. Differences in P4 concentrations from NORM were significant during LATE after termination of the FP and regression of the CL. This would be expected because, as previously mentioned, the CL is presumed to be the primary source of P4 production. Mean length of FP was 178 days (approximately 6 months) and coincided with the decrease in P4 concentrations that continued through MPC 9. Progestagen concentrations were significantly lower during both MID and LATE stages and from MPC 3 onwards. This is similar to the killer whale, where PG concentrations during FP are also lower during MID and LATE when compared to normal pregnancy (Robeck et al., 2018). Although PG production is also observed during the luteal phase indicating production by non-fetal-placental sources occurs (Legacki et al., 2020), the significant increase in PG we detected throughout bottlenose dolphin pregnancy coincided with the increase in placental production and points to the placenta as the major source of PGs. Our observation of a decline in PG concentrations during FP in the present study, as well as in the killer whale, also supports this theory.
Presently P4, in combination with ultrasonography, is used as a clinical diagnostic tool of pregnancy in bottlenose dolphins, whereas PG analysis is typically only performed retrospectively. Future diagnostics that use a suite of hormone tests, including PG, relaxin, and potentially androgens conducted monthly or semi-monthly may be better able to identify problematic pregnancies that may benefit from improved monitoring during pregnancy and at the time of parturition. Although LCMS-MS may also be able to identify the exact pregnanes and concentrations in samples, the availability of laboratories to provide immediate clinical support for this is almost non-existent and much of the research using this methodology is retrospective. Laboratories that run EIAs using antibodies with a broad specificity for pregnanes, in particular 5α-reduced pregnanes, are more readily available and can provide quicker turnaround for results and, as a result, can be easily incorporated into existing clinical diagnostics. Longitudinal hormone monitoring in a zoo or aquarium-based setting provides researchers with the sufficient sample sizes necessary to establish reference ranges for hormone pregnancy dynamics in this species and makes the development of a single sample pregnancy diagnostic test a possibility. Furthermore, while recognizing the potential effects on certain hormone or analyte concentrations that may occur do to the stress of capture during health assessments, the development of a suite of hormone tests for pregnancy health diagnostics using a single sample would have application to in situ populations of bottlenose dolphins, especially where the long-term reproductive potential and overall success of a population may be compromised due to environmental or anthropogenic causes.
Data Availability Statement
The raw data supporting the conclusions of this article will be made available by the authors, without undue reservation, to any qualified researcher.
Ethics Statement
The animal study described within was reviewed and approved by the SeaWorld Parks and Entertainment Incorporated Research Review Committee and performed in strict accordance with the United States Animal Welfare Act for the care of marine mammals. Samples collected from animals at the United States Navy Marine Mammal Program (MMP) and at all SeaWorld facilities were collected during their routine care. The samples collection at the Navy MMP were collected under the authority of United States Code, Title 10, USC 7524. MMP is accredited by AAALAC International and adheres to the national standards of the United States Public Health Service Policy on the Humane Care and Use of Laboratory Animals and the Animal Welfare Act.
Author Contributions
TR and KS conceived the study and drafted the manuscript. The data curation and analyses was completed by TR. Sample collection and processing was done by KS, CP, FG, and EJ. All authors read and approved the final version of the manuscript.
Funding
This project was funded by SeaWorld Parks & Entertainment, Inc. (SEAS). This research was made possible in part by a grant from The Gulf of Mexico Research Initiative. Funder (SEAS) also provided support in form of salary for KS and TR. Funder had no role in study design, data collection and analysis, decision to publish, or preparation of the manuscript.
Conflict of Interest
KS and TR were employed by the company SeaWorld Parks & Entertainment, Inc. The authors also declare that this study received funding from SeaWorld Parks and Entertainment, Inc. The funder was not involved in the study design, collection, analysis, interpretation of data, the writing of this article, or the decision to submit it for publication.
The remaining authors declare that the research was conducted in the absence of any commercial or financial relationships that could be construed as a potential conflict of interest.
Acknowledgments
The authors would like to acknowledge Dr. Cynthia Smith from the National Marine Mammal Foundation for her contributions to this paper. The authors wish to thank the MMP biotechnicians and managers, and the SeaWorld and National Marine Mammal Foundation trainers, veterinary and medical records staff who helped facilitated this study. Technical assistance for hormone assays was provided by Species Preservation Laboratory research technicians Amanda McDonnell and Jacqueline Posy and intern Miranda Neumann. This research was made possible in part by a grant from The Gulf of Mexico Research Initiative. This is a SeaWorld Parks and Entertainment contribution number 2020-17.
Supplementary Material
The Supplementary Material for this article can be found online at: https://www.frontiersin.org/articles/10.3389/fmars.2021.630563/full#supplementary-material
References
Bain, D. (1990). Examining the validity of inferences drawn from photo-identification data, with special reference to studies of the killer whales (Orcinus orca) in British Columbia. Rep. Int. Whal. Comm. Spec. Issue 12, 93–100.
Benirschke, B., and Marsh, H. (1984). Anatomic and pathologic observations of female reproductive organs in the short-finned pilot whale, Globicephala macrorhynchus. Rep. Int. Whal. Comm. Spec. Issue 6, 451–455.
Bergfelt, D. R., Blum, J. L., Steinetz, B. G., Steinman, K. J., O’Brien, J. K., and Robeck, T. R. (2017). Relaxin as a hormonal aid to evaluate pregnancy and pregnancy loss in bottlenose dolphins (Tursiops truncatus). Gen. Comp. Endocrinol. 242, 24–29. doi: 10.1016/j.ygcen.2015.12.024
Bergfelt, D. R., Steinetz, B. G., Lasano, S., West, K. L., Campbell, M., and Adams, G. P. (2011). Relaxin and progesterone during pregnancy and the post-partum period in association with live and stillborn calves in bottlenose dolphins (Tursiops truncatus). Gen. Comp. Endocrinol. 170, 650–656. doi: 10.1016/j.ygcen.2010.12.002
Bergfelt, D. R., Steinetz, B. G., Reif, J. S., Schaefer, A. M., Bossart, G. D., Mazzoil, M. S., et al. (2013). Evaluation of single-sample analysis of progesterone in combination with relaxin for diagnosis of pregnancy status in wild bottlenose dolphins (Tursiops truncatus). Aquat. Mamm. 39, 198–206.
Conley, A. J., Legacki, E. L., Corbin, C. J., Stanley, S., Dahlen, C. R., and Reynolds, L. P. (2019). Serum and tissue pregnanes and pregnenes after dexamethasone treatment of cows in late gestation. Reproduction 157, 413–422. doi: 10.1530/rep-18-0558
Cornell, L. H., Asper, E. D., Antrim, J. E., Searles, S. S., Young, W. G., and Goff, T. (1987). Progress report: results of a long range captive breeding program for the bottlenose dolphin, Tursiops truncatus and Tursiops truncatus gilli. Zoo Biol. 6, 41–53. doi: 10.1002/zoo.1430060106
Dalle Luche, G., Boggs, A. S. P., Kucklick, J. R., Groß, J., Hawker, D. W., and Bengtson Nash, S. (2020). Androstenedione and testosterone but not progesterone are potential biomarkers of pregnancy in Humpback whales (Megaptera novaeangliae) approaching parturition. Sci. Rep. 10:2954. doi: 10.1038/s41598-020-58933-4
Forar, A. L., Gay, J. M., and Hancock, D. D. (1995). The frequency of endemic fetal loss in dairy cattle: a review. Theriogenology 43, 989–1000. doi: 10.1016/0093-691x(95)00063-e
Ginther, O. J. (1990). Prolonged luteal activity in mares–a semantic quagmire. Equine Vet. J. 22, 152–156. doi: 10.1111/j.2042-3306.1990.tb04235.x
Graham, L. H., Schwarzenberger, F., Mostl, E., Galama, W., and Savage, A. (2001). A versatile enzymeimmunoassay for the determination of progestogens in feces and serum. Zoo Biol. 20, 227–236. doi: 10.1002/zoo.1022
Hinrichs, K. (1977). “Irregularities of the estrous cycle in mares,” in Current Therapy in Large Animal Theriogenology, ed. R. S. Youngquist (Philadelphia, PA: W.B. Saunders), 166–171.
Holl, K., Lundin, E., Kaasila, M., Grankvist, K., Afansaeyeva, Y., Hallmans, G., et al. (2008). Effect of long-term storage on hormone measurements in samples from pregnant women: the experience of the Finnish Maternity Cohort. Acta Oncol. 47, 406–412. doi: 10.1080/02841860701592400
Ivancić, M., Gomez, F. M., Musser, W. B., Barratclough, A., Meegan, J. M., Waitt, S. M., et al. (2020). Ultrasonographic findings associated with normal pregnancy and fetal well-being in the bottlenose dolphin (Tursiops truncatus). Vet. Radiol. Ultrasound 61, 1–12. doi: 10.1111/vru.12835
Johanson, J. M., and Berger, P. J. (2003). Birth weight as a predictor of calving ease and perinatal mortality in holstein cattle. J. Dairy Sci. 86, 3745–3755. doi: 10.3168/jds.s0022-0302(03)73981-2
Jonker, F. H. (2004). Fetal death: comparitive aspects in large domestic animals. Anim. Reprod. Sci. 8, 415–430. doi: 10.1016/j.anireprosci.2004.05.003
Kellar, N. M., Trego, M. L., Chivers, S. J., and Archer, F. I. (2013). Pregnancy patterns of pantropical spotted dolphins (Stenella attenuata) in the eastern tropical Pacific determined from hormonal analysis of blubber biopsies and correlations with the purse-seine tuna fishery. Mar. Biol. 160, 3113–3124. doi: 10.1007/s00227-013-2299-0
Kellar, N. M., Trego, M. L., Chivers, S. J., Archer, F. I., and Perryman, W. L. (2014). From progesterone in biopsies to estimates of pregnancy rates: large scale reproductive patterns of two sympatric species of common dolphin, Delphis spp., off of California, USA and Baja, Mexico. Bull. South. Calif. Acad. Sci. 113, 58–80. doi: 10.3160/0038-3872-113.2.58
Key, T. J., Pike, M. C., Baron, J. A., Moore, J. W., Wang, D. Y., Thomas, B. S., et al. (1991). Cigarette smoking and steroids hormones in women. J. Steroid Biochem. Mol. Biol. 39, 529–534.
Lane, S. M., Smith, C. R., Mitchell, J., Balmer, B. C., Barry, K. P., McDonald, T., et al. (2015). Reproductive outcome and survival of common bottlenose dolphins sampled in Barataria Bay, Louisiana, USA, following the Deepwater Horizon oil spill. Proc. R. Soc. B 282:20151944. doi: 10.1098/rspb.2015.1944
Legacki, E. L., Corbin, C. J., Ball, B. A., Scoggin, K. E., Stanley, S. D., and Conley, A. J. (2018). Stroidogenic enzyme activities in the pre- and post-parturient equine placenta. Reproduction 155, 51–59. doi: 10.1530/rep-17-0472
Legacki, E. L., Robeck, T. R., Steinman, K. J., and Conley, A. J. (2020). Comparative analysis of steroids in cyclic and pregnant killer whales, beluga whales and bottlenose dolphins using liquid chromatography tandem mass spectrometry. Gen. Comp. Endocrinol. 285:113273. doi: 10.1016/j.ygcen.2019.113273
McDermott, J. J., Allen, O. B., Martin, S. W., and Alves, D. M. (1992). Patterns of stillbirths and dystocia in Ontario cow-calf herds. Can. J. Vet. Res. 56, 47–55.
Mee, J. F., Sánchez-Miguel, C., and Doherty, M. (2014). Influence of modified risk factors on the incidence of stillbirth/perinatal mortality in dairy cattle. Vet. J. 199, 19–23. doi: 10.1016/j.tvjl.2013.08.004
Meyer, C. L., Berger, P. J., and Koehler, K. J. (2000). Interactions among factors affecting stillbirths in holstein cattle in the United States. J. Dairy Sci. 83, 2657–2663. doi: 10.3168/jds.s0022-0302(00)75159-9
Meyer, C. L., Berger, P. J., Koehler, K. J., Thompson, J. R., and Sattler, C. G. (2001). Phenotypic trends in incidence of stillbirth for holsteins in the united states. J. Dairy Sci. 84, 515–523. doi: 10.3168/jds.s0022-0302(01)74502-x
O’Brien, J. K., and Robeck, T. R. (2012). The relationship of maternal characteristics and circulating progesterone concentrations with reproductive outcome in the bottlenose dolphin (Tursiops truncatus) after artificial insemination, with and without ovulation induction, and natural breeding. Theriogenology 78, 469–482. doi: 10.1016/j.theriogenology.2012.02.011
O’Brien, J. K., Steinman, K. J., Fetter, G. A., and Robeck, T. R. (2017). Androgen and glucocorticoid production in the male killer whale (Orcinus orca): influence of age, maturity, and environmental factors. Andrology 5, 180–190. doi: 10.1111/andr.12254
Olesiuk, P. F., Bigg, M. A., and Ellis, G. M. (1990). Life history and population dynamics of resident killer whales (Orcinus orca) in the coastal waters of British Columbia and Washington State. Rep. Int. Whal. Comm. Spec. Issue 12, 209–243.
Pallin, L., Robbins, J., Kellar, N., Berube, M., and Friedlaender, A. (2018). Validation of blubber-based pregnancy test for humpback whales. Conserv. Physiol. 6:coy031. doi: 10.1093/conphys/coy031
Robeck, T. R., Blum, J. L., Steinman, K. J., Ratner, J. R., Bergfelt, D. R., and O’Brien, J. K. (2018). Longitudinal profiles of relaxin and progestagens during pregnancy, pregnancy loss and false pregnancy in the killer whale (Orcinus orca). Gen. Comp. Endocinol. 267, 98–108. doi: 10.1016/j.ygcen.2018.06.008
Robeck, T. R., Gili, C., Doescher, B. M., Sweeney, J., De Laender, P., Van Elk, C. E., et al. (2012). Altrenogest and progesterone therapy during pregnancy in bottlenose dolphins (Tursiops truncatus) with progesterone insufficiency. J. Zoo Wildl. Med. 43, 296–308. doi: 10.1638/2011-0166.1
Robeck, T. R., Montano, G. A., Steinman, K. J., Smolensky, P., Sweeney, J., Osborn, S., et al. (2013). Development and evaluation of deep intra-uterine artificial insemination using cryopreserved sexed spermatozoa in the bottlenose dolphin (Tursiops truncatus). Anim. Reprod. Sci. 139, 168–181. doi: 10.1016/j.anireprosci.2013.04.004
Robeck, T. R., Steinman, K. J., and O’Brien, J. K. (2016). Characterization and longitudinal monitoring of serum progestagens and estrogens during normal pregnancy in the killer whale (Orcinus orca). Gen. Comp. Endocrinol. 236, 83–97. doi: 10.1016/j.ygcen.2016.07.010
Robeck, T. R., Steinman, K. J., and O’Brien, J. K. (2017). Characterization and longitudinal monitoring of serum androgens and glucocorticoids during normal pregnancy in the killer whale (Orcinus orca). Gen. Comp. Endocrinol. 247, 116–129. doi: 10.1016/j.ygcen.2017.01.023
Robeck, T. R., Steinman, K. J., Yoshioka, M., Jensen, E., O’Brien, J. K., Katsumata, E., et al. (2005). Estrous cycle characterization and artificial insemination using frozen-thawed spermatozoa in the bottlenose dolphin (Tursiops truncatus). Reproduction 129, 659–674. doi: 10.1530/rep.1.00516
Robinson, K. J., Ternes, K., Hazon, N., Wells, R. S., and Janick, V. M. (2019). Bottlenose dolphin calves have multi-year elevations of plasma oxytocin compared to all other age classes. Gen. Comp. Endocrinol. 286:113323. doi: 10.1016/j.ygcen.2019.113323
Schroeder, J. P., and Keller, K. V. (1990). “Artificial insemination of bottlenose dolphins,” in The Bottlenose Dolphin, eds S. Leatherwood and R. R. Reeves (San Diego, CA: Academic Press), 447–460. doi: 10.1016/b978-0-12-440280-5.50030-5
Sorge, U. S., Kelton, D. F., and Staufenbiel, R. (2008). Short communication: prepartal concentration of estradiol-17β in heifers with stillborn calves. J. Dairy Sci. 91, 1433–1437. doi: 10.3168/jds.2007-0567
Steinman, K. J., Robeck, T. R., Fetter, G. A., Schmitt, T., Osborn, S., DiRocco, S., et al. (2020). Circulating and excreted corticosteroids and metabolites, hematological, and serum chemistry parameters, in the killer whale (Orcinus orca) before and after a biological stress response. Front. Mar. Sci. 6:830. doi: 10.3389/fmars.2019.00830
Steinman, K. J., Robeck, T. R., and O’Brien, J. K. (2016). Characterization of estrogens, testosterone, and cortisol in normal bottlenose dolphin (Tursiops truncatus) pregnancy. Gen. Comp. Endocrinol. 226, 102–112. doi: 10.1016/j.ygcen.2015.12.019
Sweeney, J. C., Stone, R., Campbell, M., McBain, J., St. Leger, J., Xitco, M., et al. (2010). Comparative survivability for Tursiops neonates from three U.S. institutions for the decades 1990–1999 and 2000 to 2009. Aquat. Mamm. 36, 248–261. doi: 10.1578/am.36.3.2010.248
TOSOH Bioscience Corporation (2017). ST AIA-Pack Prog II Directional Insert. Available online at: st aia-pack progii - Tosoh Bioscience (Diagnostics) www.diagnostics.eu.tosohbioscience.com > TSEN > IFU. (accessed June 30, 2018).
Wasser, S. K., Lundin, J. I., Ayres, K., Seely, E., Giles, D., Balcomb, K., et al. (2017). Population growth is limited by nutritional impacts on pregnancy success in endangered Southern resident killer whales (Orcinus orca). PLoS One 12:e0179824. doi: 10.1371/journal.pone.0179824
Wells, R. S., Smith, C. R., Sweeney, J. C., Townsend, F. I., Fauquier, D. A., Stone, R., et al. (2014). Fetal survival of common bottlenose dolphins (Tursiops truncatus) in Sarasota Bay, Florida. Aquat. Mamm. 4, 252–259. doi: 10.1578/AM.40.3.2014.252
West, B. T., Welch, K. B., and Galecki, A. T. (2015). Linear Mixed Models: A Practical Guide Using Statisical Software, 2nd Edn. Boca Raton, FL: CRC Press.
West, K. L., Ramer, J., Brown, J. L., Sweeney, J., Hanahoe, E. M., Reidarson, T., et al. (2014). Thyroid hormone concentrations in relation to age, sex, pregnancy, and perinatal loss in bottlenose dolphins (Tursiops truncatus). Gen. Comp. Endocrinol. 197, 73–81. doi: 10.1016/j.ygcen.2013.11.021
Keywords: steroids, progestagen, pregnancy loss, bottlenose dolphin, progesterone
Citation: Robeck TR, Steinman KJ, Parry CB, Gomez FM and Jensen ED (2021) Comparisons of Serum Progesterone and Progestagen Concentrations in Normal and Abnormal Bottlenose Dolphin (Tursiops truncatus) Pregnancies. Front. Mar. Sci. 8:630563. doi: 10.3389/fmars.2021.630563
Received: 17 November 2020; Accepted: 02 February 2021;
Published: 25 February 2021.
Edited by:
Valerio Matozzo, University of Padua, ItalyReviewed by:
Peijun Zhang, Institute of Deep-Sea Science and Engineering (CAS), ChinaAshley Boggs, National Institute of Standards and Technology (NIST), United States
Copyright © 2021 Robeck, Steinman, Parry, Gomez and Jensen. This is an open-access article distributed under the terms of the Creative Commons Attribution License (CC BY). The use, distribution or reproduction in other forums is permitted, provided the original author(s) and the copyright owner(s) are credited and that the original publication in this journal is cited, in accordance with accepted academic practice. No use, distribution or reproduction is permitted which does not comply with these terms.
*Correspondence: Todd R. Robeck, VG9kZC5Sb2JlY2tAU2VhV29ybGQuY29t; dHJvYmVja0BtZS5jb20=