 Brooke A. Lowman1,2*
 Andrew W. Jones3
 Jeffrey P. Pessutti3Anna M. Mercer3John P. Manderson4
 Benjamin Galuardi2,5
- 1ERT, Inc. under Contract to Northeast Fisheries Science Center, National Marine Fisheries Service, National Oceanic and Atmospheric Administration, Narragansett, RI, United States
- 2School for Marine Science and Technology, University of Massachusetts Dartmouth, New Bedford, MA, United States
- 3Northeast Fisheries Science Center, National Marine Fisheries Service, National Oceanic and Atmospheric Administration, Narragansett, RI, United States
- 4OpenOcean Research, Philadelphia, PA, United States
- 5Greater Atlantic Regional Fisheries Office, National Marine Fisheries Service, National Oceanic and Atmospheric Administration, Gloucester, MA, United States
Northern shortfin squid (Illex illecebrosus) have presented a challenge for US fishery management because of their life history traits and broad population distribution. They are characterized by a short semelparous lifespan and high interannual variability in recruitment. Much of the stock resides outside of the boundaries of existing US fisheries surveys and US fishing effort. Based on the annual migration pattern and broad geographic distribution of shortfin squid, it is believed that the US squid fishery in the Mid-Atlantic has not had a substantial impact on the stock; however, recent catches are viewed as tightly constrained by quotas. To better estimate the potential impact of fishing on the resource, we worked with industry representatives, scientists, and managers to estimate the availability of the northern shortfin squid stock on the US continental shelf to the US fishery. Taking a novel analytical approach, we combine a model-based estimate of the area occupied by northern shortfin squid with the empirical US commercial shortfin squid fishery footprint to produce estimates of the area of overlap. Because our method overestimates the fishery footprint and underestimates the full distribution of the stock, we suggest that our estimates of the overlap between the area occupied by the squid and the fishery footprint is a way to develop a conservative estimate of the potential fishery impact on the stock. Our findings suggest a limited degree of overlap between the US fishery and the modeled area occupied by the squid on the US continental shelf, with a range of 1.4–36.3%. The work demonstrates the value of using high-resolution, spatially explicit catch and effort data in a species distribution model to inform management of short-lived and broadly distributed species, such as the northern shortfin squid.
Introduction
There are many uncertainties inherent in fisheries science and management. For example, natural mortality, catchability, and recruitment dynamics are often unknown. These uncertainties are exacerbated when surveys are not designed for the species of interest, its lifespan is very short, and recruitment is highly variable. Fishery footprints (i.e., the geographical area exposed to fishing effort) have been used as a means of quantifying the potential impact of fishing on a population (Swartz et al., 2010; Jennings et al., 2012; Amoroso et al., 2018; Kroodsma et al., 2018). Species distribution modeling allows for the identification and estimation of areas critical to species’ populations and is often used for management applications such as designing spatial or spatiotemporal fishery closures (Tserpes et al., 2008; Jalali et al., 2015; Rooper et al., 2019). Together, these two quantities can provide insight into the relative severity of fishing pressure. We propose to use the proportion of the occupied area on the US continental shelf as estimated by a species distribution model overlapped by the US fishery footprint to calculate a conservative estimate of stock availability to the fishery as an approximation of the potential impact of the fishery.
Northern shortfin squid (hereafter shortfin squid), Illex illecebrosus, live <1 year, die soon after spawning, and have highly variable recruitment that is believed to be environmentally controlled (Dawe and Beck, 1997; Hendrickson, 2004). Since 1996, assessments of this squid stock have recommended in-season assessment and fishery management to ensure sufficient spawner escapement from the US fishery to provide adequate recruitment levels in the subsequent year (Hendrickson et al., 1996). Subsequent stock assessments applied depletion-based models (using a weekly time step) using tow-based shortfin squid fishery catch per unit effort (CPUE) data, reported electronically by shortfin squid harvesters in real time (Hendrickson et al., 2003), to demonstrate the utility of this type of management regime (Northeast Fisheries Science Center [NEFSC], 1999, 2003, 2006). However, the depletion-based methods have not been effective due, in part, to the continuous immigration of cohorts into the relatively small US fishery in some years. Given the limited information available, US fisheries management has set the acceptable biological catch based on biomass and catch history because an overfishing limit cannot be determined by the stock assessment (Federal Register, 2012, 2018). Maximum fishery catches have been limited by quotas during the late 1990s and early 2000s and during recent years. Methods for estimating possible levels of fishing mortality and spawner escapement for the squid would be valuable for informing specifications of acceptable biological catch.
The shortfin squid stock ranges from Florida (approximately 25° N) to southern Labrador (approximately 52° N) in the Northwest Atlantic Ocean and occupies continental shelf to slope sea habitats, which they use as spawning, nursery, and feeding grounds (Dawe and Hendrickson, 1998; Roper et al., 2010; O’Dor and Dawe, 2013). In the spring, some proportion of the shortfin squid stock migrates inshore from the shelf edge to occupy summer and fall feeding and spawning habitats (Hendrickson, 2004) on the US and Canadian continental shelf and in waters managed by the Northwest Atlantic Fisheries Organization (NAFO), while the remaining proportion of adults and juveniles remain in the shelf slope sea (e.g., Rathjen, 1981; Roper et al., 2010; Shea et al., 2017). In the fall, the inshore portion of the stock migrates off-shelf (Hendrickson and Holmes, 2004). Analyses of spatial patterns of sexual maturity using US and Canadian shelf-wide surveys and fisheries-dependent biosampling collections indicate that shortfin squid migrate onto and off of the continental shelf at approximately the same maturity stages and sizes in US and Canadian waters at approximately the same time (Northeast Fisheries Science Center [NEFSC], 1999). The US and Canadian fisheries operate exclusively on the continental shelf (Hendrickson and Showell, 2019; Figure 1).
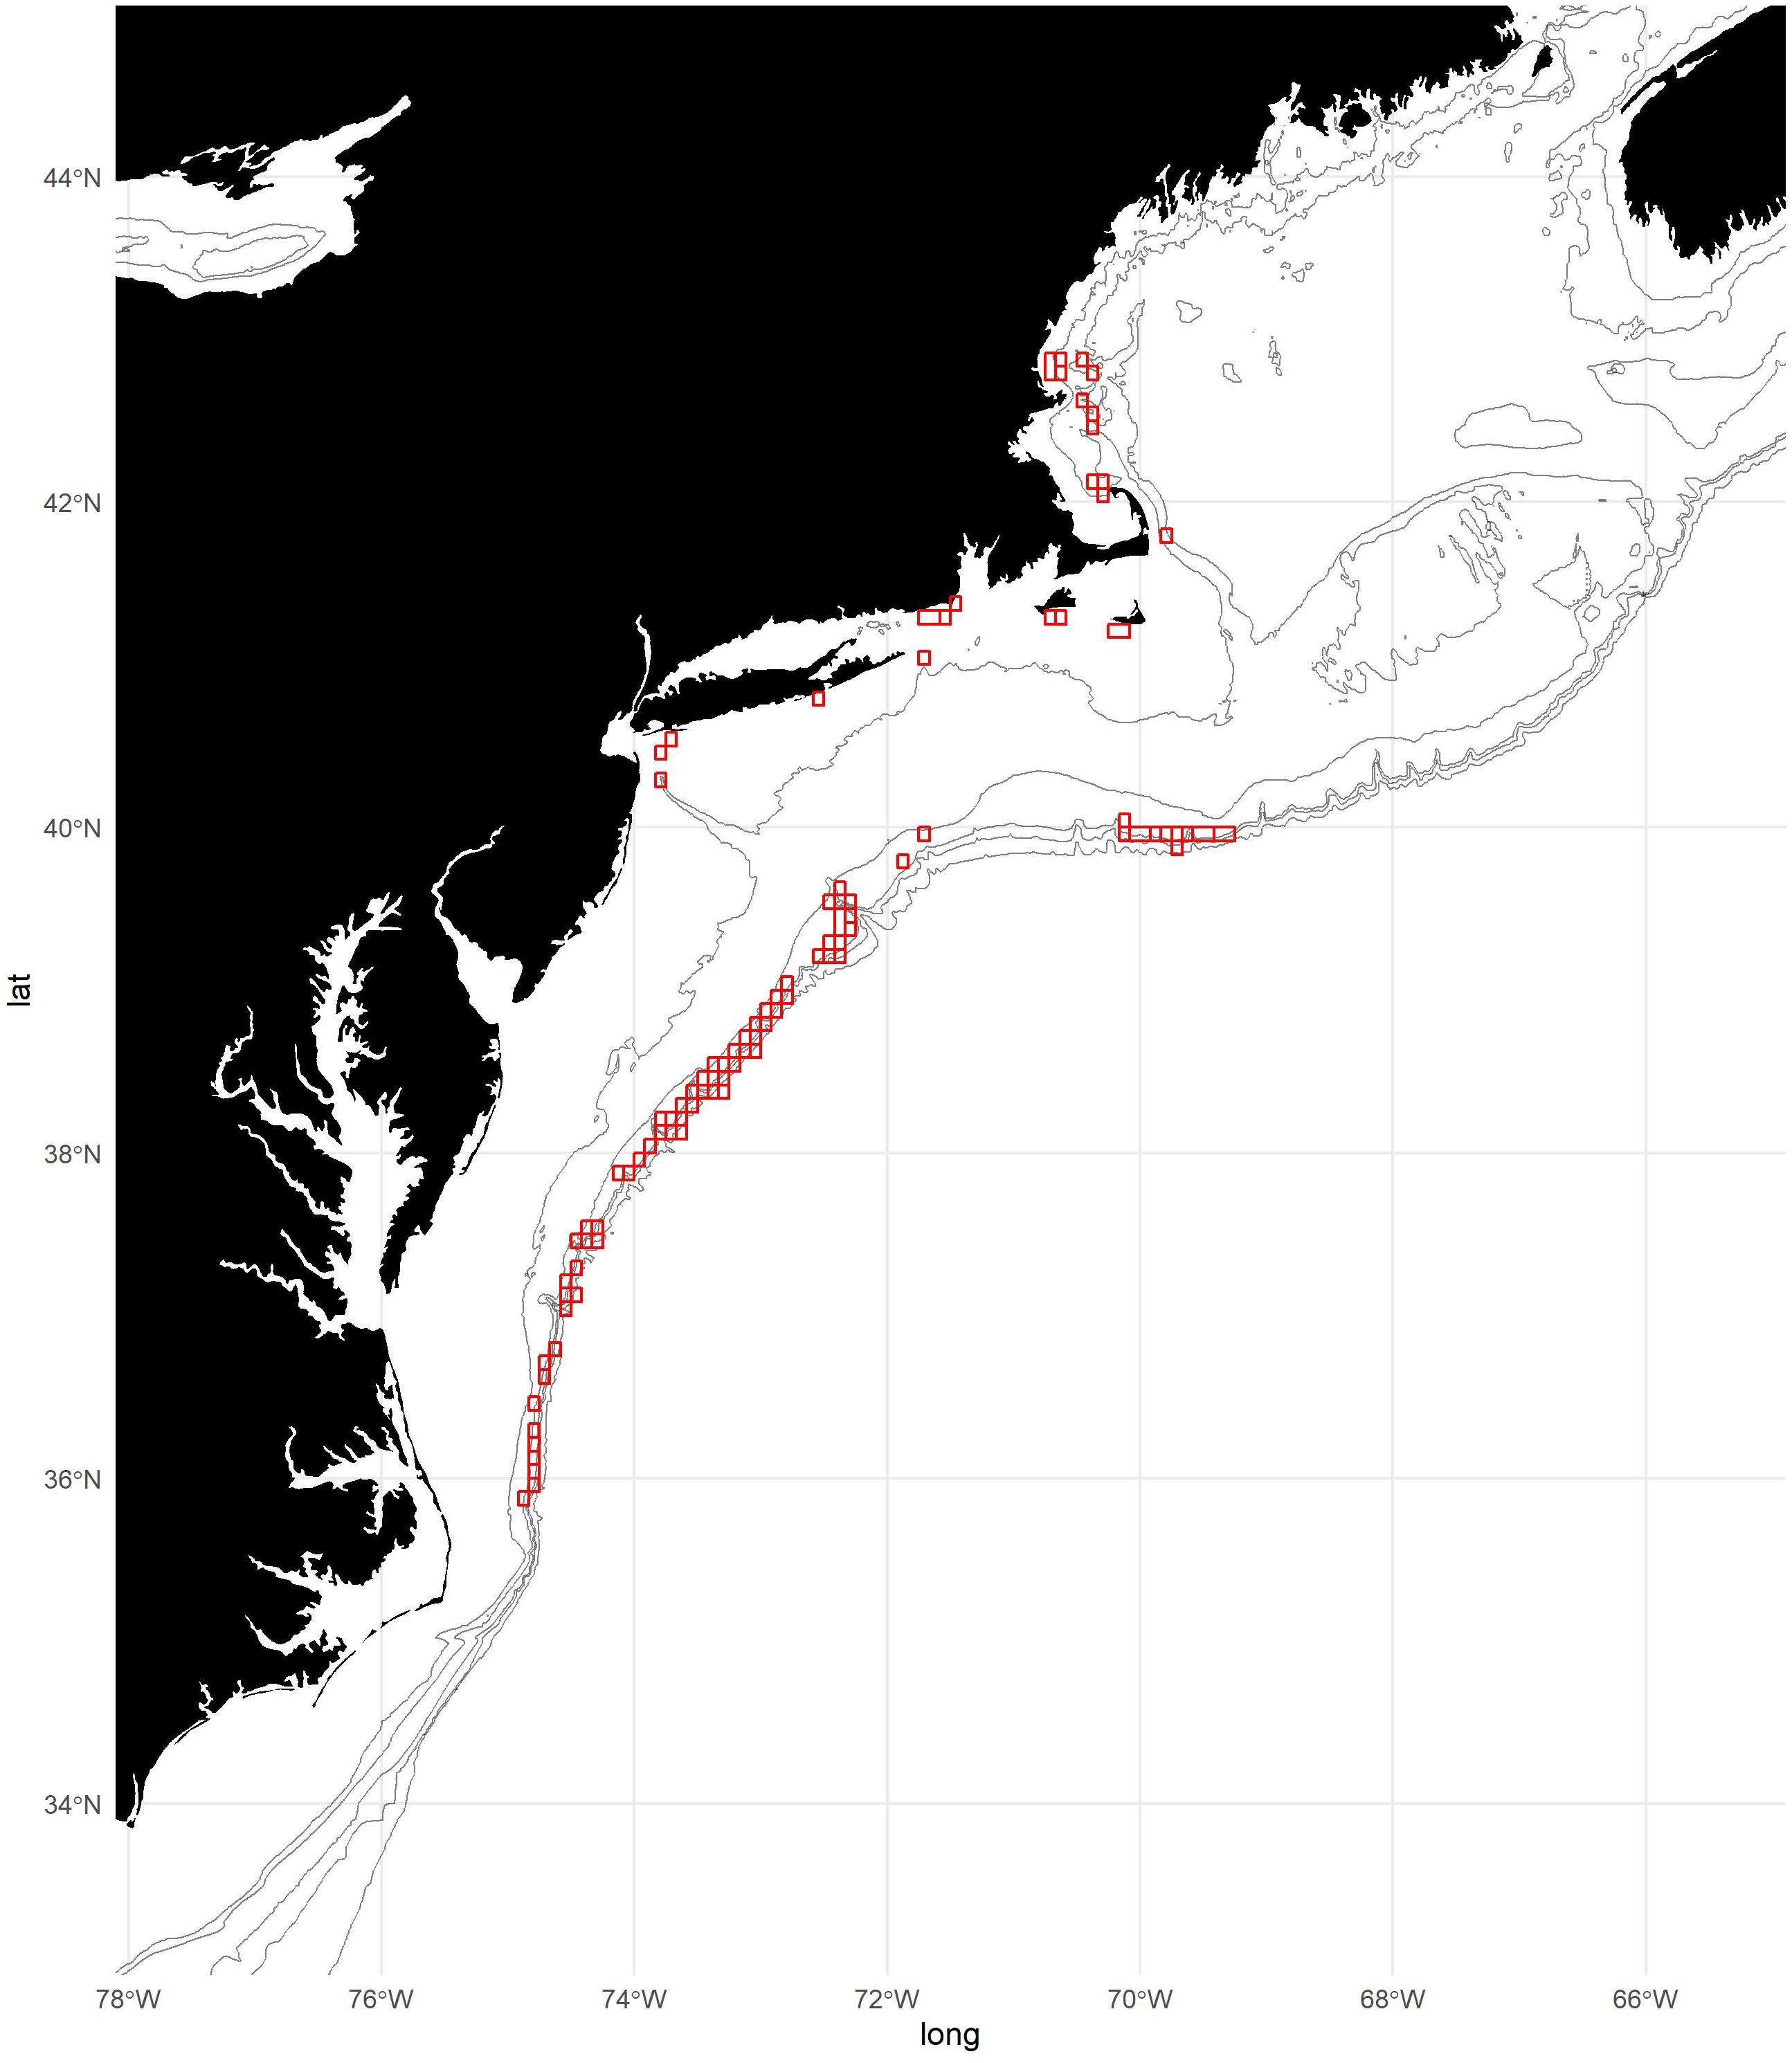
Figure 1. Map of study area with 50, 100, 300, 500, and 1,000 m isobaths. Locations of fishing effort aggregated to 5-min squares are shown in red. Note that some areas of fishing effort have been excluded from the figure to maintain confidentiality.
Under the assumption that shortfin squid move onto and off of the shelf over a broad area of the US and Canadian continental shelf as noted above (Northeast Fisheries Science Center [NEFSC], 1999), the vulnerability of shortfin squid to the fishery can be roughly approximated in two dimensions by the ratio of the area fished, Af, to the area occupied by the stock, Ao. This spatial overlap can be considered an index of availability ρ = Af/Ao of the stock to the fishery. The complement of ρ (i.e., 1 - ρ) is the proportion of the area occupied by the stock that is not fished. This statistic can be viewed as an index of proportional area of escapement from the fishery.
Shortfin squid occupy an area much larger than the Northeast US continental shelf, including Labrador, the Flemish cap, Baffin Island, and Southern Greenland, and shelf slope sea (Roper et al., 2010). However, the current analysis focuses on the southern component of the stock that constitutes the US management unit. We adopted a conservative approach to develop estimates of the availability of shortfin squid to the fishery (ρ) and proportional escapement (1 - ρ) by confining analysis to fishery-dependent and fishery-independent survey data collected in US continental shelf waters. The shelf slope sea has not routinely been surveyed, and although shelf-wide bottom trawl surveys are conducted in northern waters, including the Scotian Shelf, Bay of Fundy, and Flemish Cap where shortfin squid are abundant, effort data are unavailable for the small Canadian inshore jig fishery (Hendrickson and Showell, 2019). Therefore, we did not include the shelf slope sea and northern shelf waters in our analysis of the area occupied. Our estimates of fishery overlap (ρ) are therefore overestimated, while estimates of proportional escapement (1 - ρ) are underestimated.
In this paper, we quantify the area occupied by the southern component of the shortfin squid stock on the US shelf available to the fishery and describe how the area of squid occupancy and overlap with the fishery has changed through time. We illustrate how the proportional availability of the stock varies with differing thresholds of probability of occurrence used to characterize occupancy. We then discuss the value of our approach and findings to precautionary fisheries management.
Materials and Methods
Data Sets
We used shortfin squid catch data from bottom trawl surveys conducted in the fall in offshore waters by the Northeast Fishery Science Center (NEFSC) and inshore waters by the Northeast Area Monitoring and Assessment Program (NEAMAP) and state agencies of Maine and New Hampshire (MENH) as well as commercial fishery data from a cooperative study fleet in this analysis (Figure 2 and Table 1).
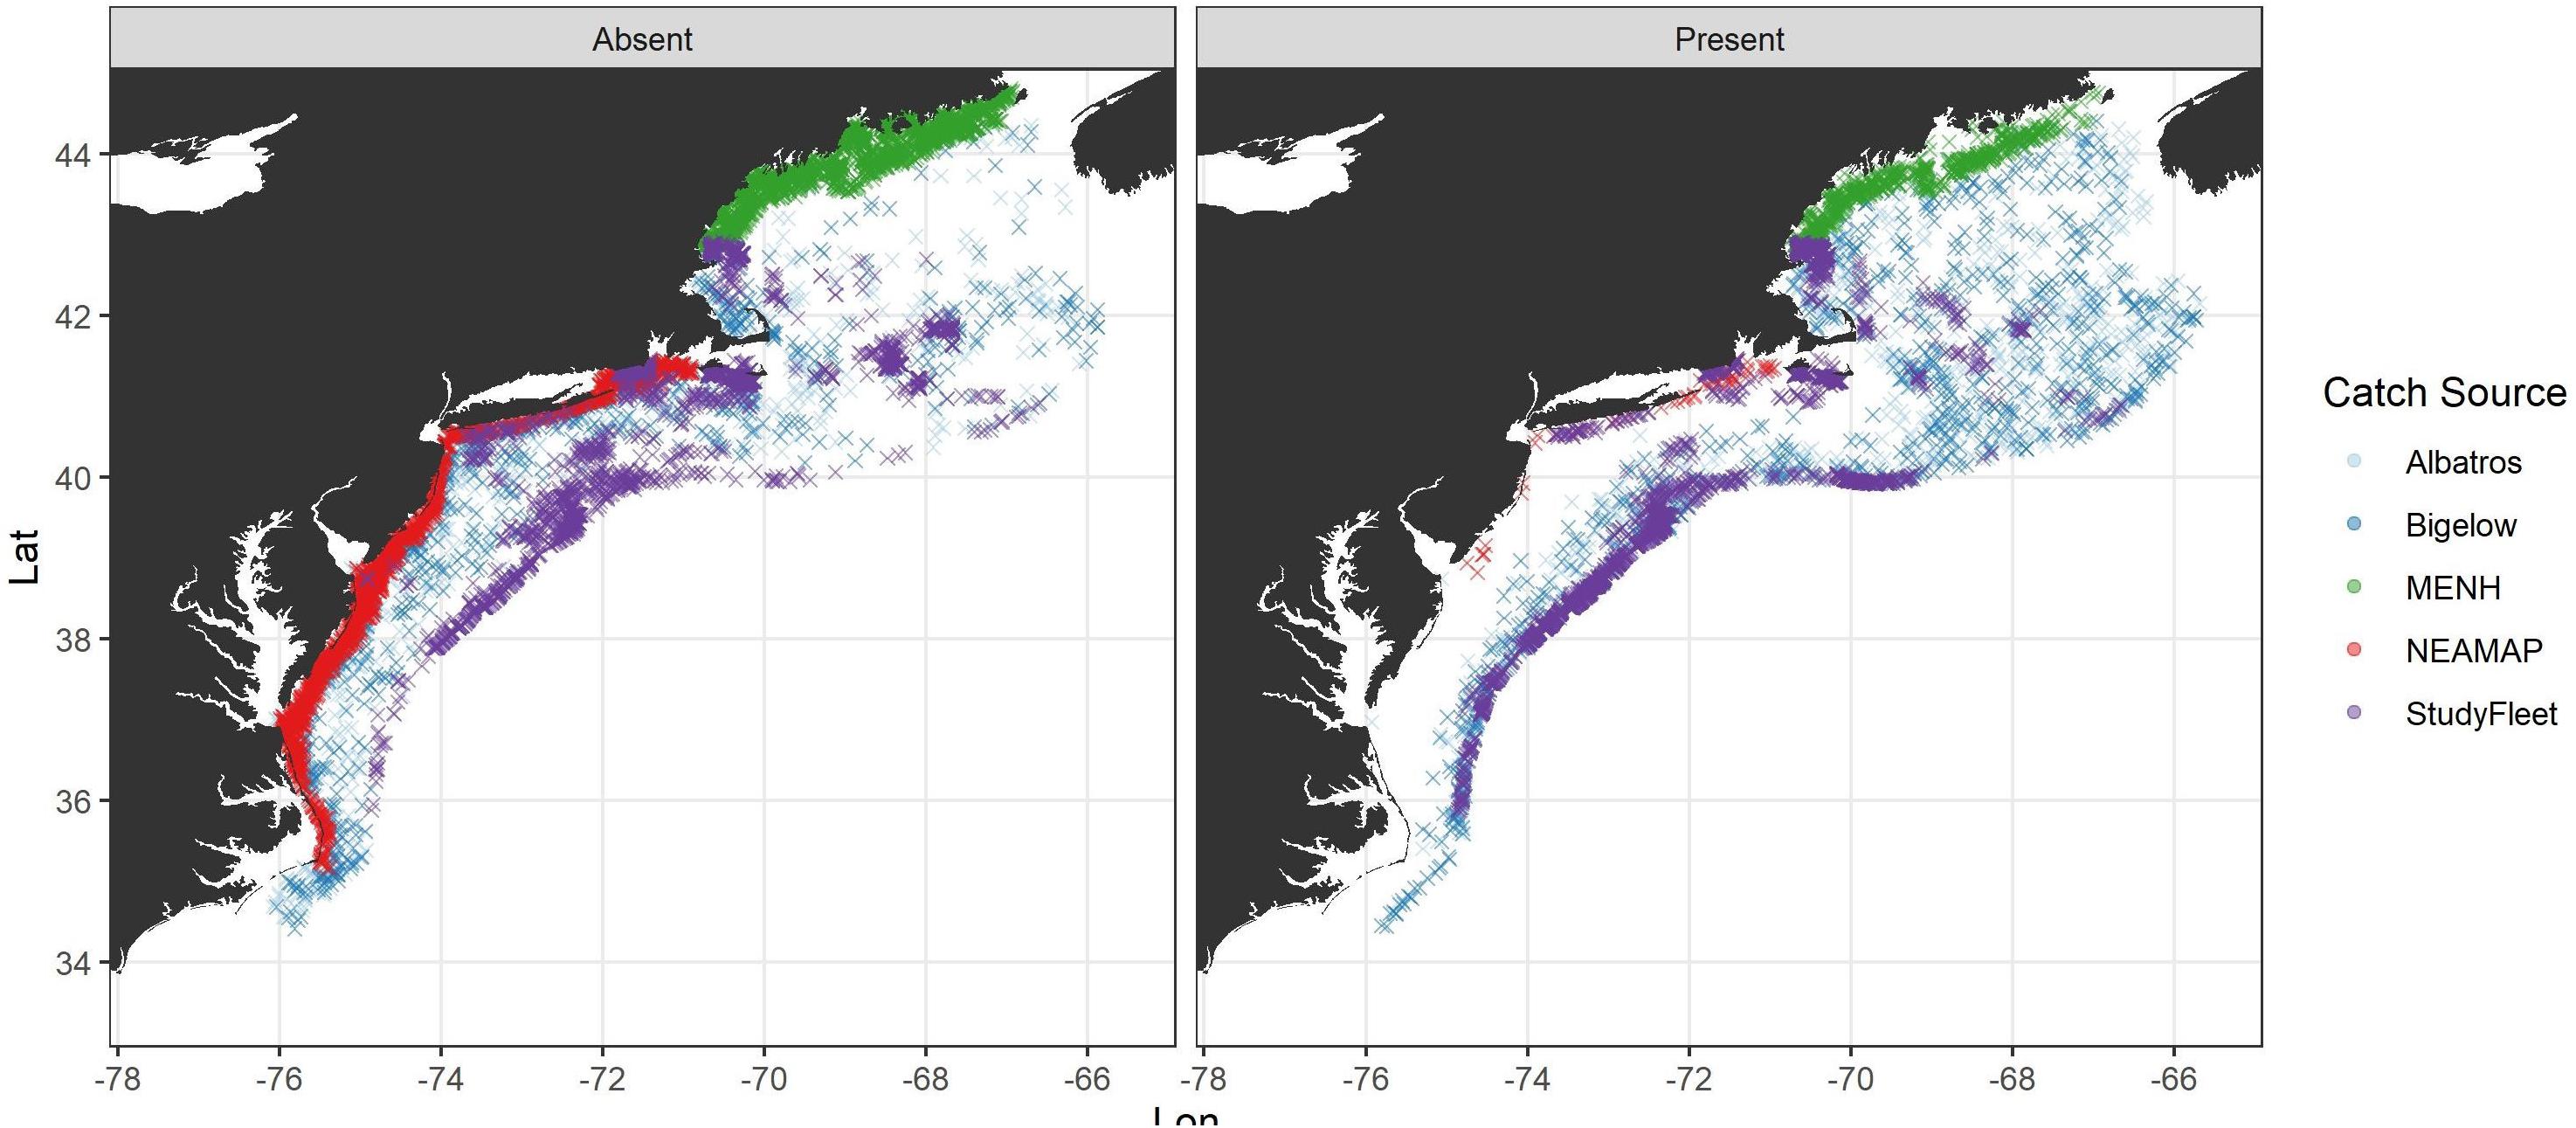
Figure 2. Map of fishery-independent surveys [bottom trawls conducted by the Northeast Fishery Science Center (NEFSC), Northeast Area Monitoring and Assessment Program (NEAMAP), and the Maine Department of Marine Resources and New Hampshire Fish and Game Department (MENH)] and Study Fleet coverage 2000–2018. Data from the two research vessels (Albatros and Bigelow) that have been used in the NEFSC bottom trawl are shown separately.
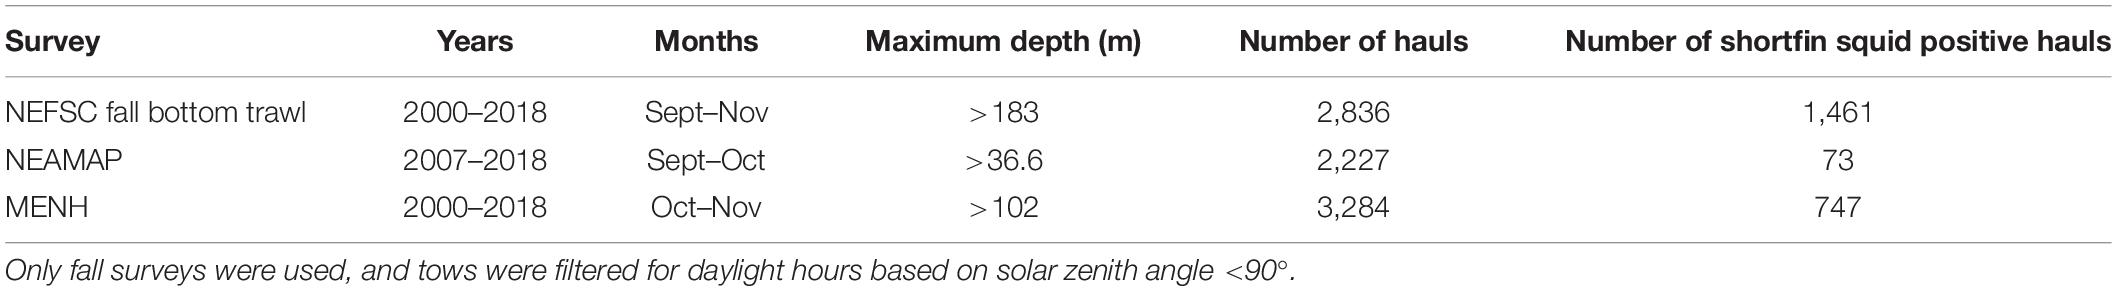
Table 1. Fishery-independent surveys used for building shortfin squid habitat map.
The NEFSC fall bottom trawl survey is conducted in September–November, and tows are made during both day and night. The survey follows a stratified random design and used a standardized Yankee 36 trawl prior to 2009 and a three-bridle, four-seam trawl thereafter. The vessel used for conducting the survey transitioned from the Albatross to the Bigelow in 2009, following a calibration study in 2008 (Miller et al., 2010). The NEFSC bottom trawl survey gear and protocols are described in Politis et al. (2014). The NEAMAP fall bottom trawl survey is conducted from September to October, and tows are made during the day. The NEAMAP survey follows a stratified random design and uses a trawl with the same design as used in the surveys conducted by the Bigelow but with a 3-in cookie sweep instead of a rockhopper sweep. Full details of the survey protocols are described in Bonzek et al. (2017). The MENH fall bottom trawl survey is conducted from October to November, and tows are made during the day. The survey follows a stratified random design and uses a modified shrimp net design. For a complete description of the MENH survey sampling protocols, see Sherman et al. (2005). We analyzed data collected on the Fall MENH survey from 2000 to 2018 (Table 1). We used Fall NEFSC bottom trawl survey data from 2000 to 2018. We used NEAMAP survey data from 2007 (the first year of the survey) to 2018.
The surveys used for this analysis have limited spatial overlap, which could be problematic for teasing apart differences in spatial effects versus vessel effects on catch abundance. For this application, however, we considered only the presence and absence of shortfin squid. We used this approach to minimize the impacts of variable shortfin squid detectability in the survey resulting from differences in survey vessel characteristics and net efficiencies.
All bottom trawl survey data were filtered to account for variations in shortfin squid detectability, as described below. Each of the surveys are designed for multispecies sampling and, thus, use different gear than the shortfin squid fishery. Since shortfin squid probably have a low detectability in gears used in the fishery-independent surveys, catch information was reclassified as presence/absence data for this analysis. Furthermore, shortfin squid exhibit diel vertical migration and are typically associated with bottom water during the day. Thus, we only used bottom trawl survey data from “daytime” tows in this analysis. Following the method of Jacobson et al. (2015), we used the astrocalc function in the fishmethods package (Nelson, 2019) to derive the solar zenith angle at the time and geographic position of each tow. The solar zenith angle is 90° when the sun is at the horizon (i.e., local sunrise and sunset), so tows that correspond to solar zenith angles of <90° occurred during the day. The final factor considered when filtering data was seasonality. Fall bottom trawl surveys are conducted near the end of the shortfin squid fishing season, while spring bottom trawl surveys occur during the period of inshore migration of shortfin squid from the slope sea. Thus, the proportion of positive shortfin squid tows and relative abundance indices for the spring survey are much lower than for the fall survey (Northeast Fisheries Science Center [NEFSC], 2006). As a result, only fall bottom trawl survey data are used in assessments to estimate shortfin squid stock size (Northeast Fisheries Science Center [NEFSC], 1999). For consistency with assessments, we also only used data from fall surveys that are more closely aligned with the fishing season.
After filtering the survey data using these criteria, we were left with a data set of 2,836 tows from the NEFSC surveys, 2,227 NEAMAP tows, and 3,284 tows from the MENH survey (Table 1). Along with the fishery-independent survey data, we included 5,170 tows from the NEFSC Study Fleet.
The NEFSC Study Fleet began in 2006 and is comprised of approximately 50 commercial fishing vessels (Bell et al., 2017; Blackburn, 2017). The captains join the program voluntarily and are paid for their participation. Captains report tow-specific effort, location, gear characteristics, catch, bycatch, and environmental conditions (e.g., bottom temperature) during their normal fishing operations, and the data are collected through an electronic logbook system. Our current analysis uses data from 2013 to 2018 because there were few shortfin squid trips reported in earlier years.
We include the Study Fleet data in the habitat model along with fishery-independent data to provide temporal and spatial representation of shortfin squid across the shelf during the fishing season. The shortfin squid fishery operates primarily in the summer months, while the surveys are conducted in the fall. Depending on the productivity of the fishery, there may be little to no temporal overlap with the surveys (e.g., in some highly productive years, the fishery has closed in August). Given the goal of determining fishery footprint overlap with habitat, it is important to incorporate data from the fishing season, and model results based on the surveys alone become difficult to interpret across years when there is temporal overlap between the fishery and surveys in some years and no temporal overlap in others. The authors recognize that using commercial fishing data to determine habitat presents the problem of nonrandom sampling (i.e., the fishery will complete more tows in an area where they expect to catch squid than in other areas). Moreover, using a subset of fishery data (i.e., the Study Fleet) in both the numerator and denominator of our fishery overlap metric is somewhat circular (i.e., some amount of fishery/habitat overlap is guaranteed by the mere fact that a portion of the same data are used to define both the footprint and the habitat). However, the logistical considerations described above justify the use of the Study Fleet data in the habitat model. Finally, the potential direction of bias introduced by the inclusion of Study Fleet data in the habitat model would err on the side of conservatism by tending to increase the degree of fishery/habitat overlap. For these reasons, it is the authors’ belief that the benefits gained by including the Study Fleet data in the habitat model outweigh the complications created by using it.
The Fishery and the US Fishery Footprint
The US fishery targets shortfin squid during the warm summer months primarily at depths of 109–365 m on the outer edge of the southern New England and Mid-Atlantic Bight continental shelf. Shortfin squid are a highly perishable seafood product that sells for relatively low prices. To be profitable, the vessels must catch large volumes of squid and process them quickly at shoreside plants and at sea (Manderson, 2019). Since 1999, the US fishery has accounted for approximately 97% of the annual catch of shortfin squid in the Northwest Atlantic (Hendrickson and Showell, 2019). The fishery uses large mesh bottom trawls towed primarily during daylight hours when the squid, which migrate diurnally, are usually concentrated near the seabed. Fishermen report that squid abundance on the shelf break varies at length scales of 10–20 km along the shelf, 0.09–0.5 km cross-shelf, and at time scales of 1–2 days (Manderson, 2019). These space–time scales are similar to those characterizing the dynamics of the shelf slope front (Chen and He, 2010; Todd et al., 2012; Gawarkiewicz et al., 2018). The fishing area is largely determined by technical and regulatory constraints. The fleet is currently prevented from fishing in water deeper than 400–600 m in the mid-Atlantic and New England by coral protection areas, including the Frank R. Lautenberg Deep-Sea Coral Protection Area. Furthermore, the current fleet of vessels is generally not capable of fishing in waters deeper than about 700 m, and capital investments required for deep water trawling in the slope sea are not justified by the current market economics of the fishery.
To develop the fishery footprint, we used Vessel Trip Report (VTR) data provided by the US Greater Atlantic Regional Fisheries Office (GARFO). Records of fishing locations for trips that reported any shortfin squid landings were aggregated to 5-min squares (∼9.25 × 6.90 km = 63.8 km2 at 42°N) for each year from 2000 to 2019 (Figure 1). This approach is at a finer scale than the 10-min square regularly used to characterize the spatial dynamics of the shortfin squid fishery (Hendrickson, 2019). Each 5-min square was attributed as presence/absence of fishing. Vessel Monitoring System (VMS) data were considered for this analysis but ultimately were not used because complete years were only available from 2017 to 2019.
Species Distribution Model
The area shortfin squid occupied within the surveyed portion of the shelf was estimated with a Vector Autoregressive Spatiotemporal (VAST version 3.3.0) model (Thorson J.T., 2019) in R version 3.6.2 (R Core Team, 2019). VAST is a spatiotemporal generalized linear mixed model (GLMM), which by default is a delta style model to model probability of occurrence and a conditional positive catch component. Following the methods of Grüss et al. (2017, 2018), we used only the probability of occurrence model component by turning off all parameters used in the conditional abundance equation (Thorson J., 2019). The probability of occurrence model uses a binomial distribution and logit link. We used 500 spatial knots to fit the model, and we built an extrapolation grid based on the NEFSC survey strata with prediction points placed on a 3 × 3 nautical mile (5.56 × 5.56 km) grid. Area swept is accounted for directly, and we allowed for overdispersion by turning on random effects of vessels on the catchability. The probability of occurrence (pi) for each sample i was estimated by the binomial GLMM as:
where β(ti) is an intercept for year ti, ω(si) is a random spatial effect at location si, ε(si,ti) is a random spatiotemporal effect at location si in year ti, and η(vi) is a random effect of vessel vi.
The NEAMAP, MENH, and NEFSC fall surveys and NEFSC Study Fleet catch data were used in the model to determine the area of the US shelf waters occupied by the shortfin squid southern stock component based on the probability of occurrence. We did not include environmental covariates, such as bottom temperature in the VAST model because measurements were unavailable for a large number of stations in each of the surveys. We considered filling data gaps with model estimates from the Regional Oceanographic Modeling System (ROMS; Wilkin et al., 2005) but found model-based estimates to be inaccurate compared with in situ measurement.
The output prediction points were converted to Voronoi polygons, then joined to form polygons based on the probability of occurrence (i.e., <20%, 20–39.9%, 40–59.9%, 60–79.9%, and >80% probability of occurrence) using the sf package (Pebesma, 2018). These areas of binned probability of occurrence from the VAST model analysis were annual estimates of US continental shelf area occupied by the southern stock component of shortfin squid (Ao), which served as the denominator in computations of the US shortfin squid fishery overlap.
Overlap of Fishery Footprint and SDM
Raster files of shortfin squid fishing effort were converted to polygons, then intersected with the habitat areas using the sf (Pebesma, 2018) and raster (Hijmans, 2020) packages. The habitat area overlapping with fishing effort divided by the total habitat area (at each threshold) is the metric of availability of the shortfin squid stock to the fishery such that the spatial estimate of the overlap of the fishery with the stock is given as ρ = Af/Ao, where Af is the area fished and Ao is the area occupied by the stock.
Results
Species Distribution Model
Model diagnostics showed no evidence that the model did not converge: parameter estimates did not approach upper or lower bounds, the final gradient for all parameters was close to zero (maximum gradient = 9.3 × 10⁻⁹), and the Hessian matrix was positive definite (Appendix A). Observed encounter frequencies were within the 95% confidence interval for nearly all predicted probabilities <0.8, and the observed encounter frequencies at high predicted probabilities tended to be greater than the predicted value and slightly outside the 95% CI (Appendix A). Pearson residual values did not suggest spatial or temporal trends in errors for probability of occurrence (Appendix A).
Differences in spatial patterns of occurrence did not vary systematically between years of high (e.g., 2004, 2017, 2018) and low landings (e.g., 2001, 2002, 2013, 2015) (Figures 3, 4). Model-based estimates of areas occupied by shortfin squid were broadly similar across time in the Mid-Atlantic region but were more variable in the Gulf of Maine and Georges Bank (Figure 4). Much of the Gulf of Maine is characterized by relatively low probabilities of occurrence (mostly <40%) in 2000 and 2002, with areas of intermediate probability of occurrence (40–79%) increasing through 2007. Concurrently, the probability of occurrence remained slightly higher on much of Georges Bank (except for the center of the bank, which remains an area of low probability, likely due to lack of sampling). From 2007 to 2019, the probability of occurrence is high in most of the Gulf of Maine and Georges Bank area, except in 2010 and 2015–2016. The highest probabilities of occurrence over the largest area occurred in 2007 and 2018 (Figure 4).
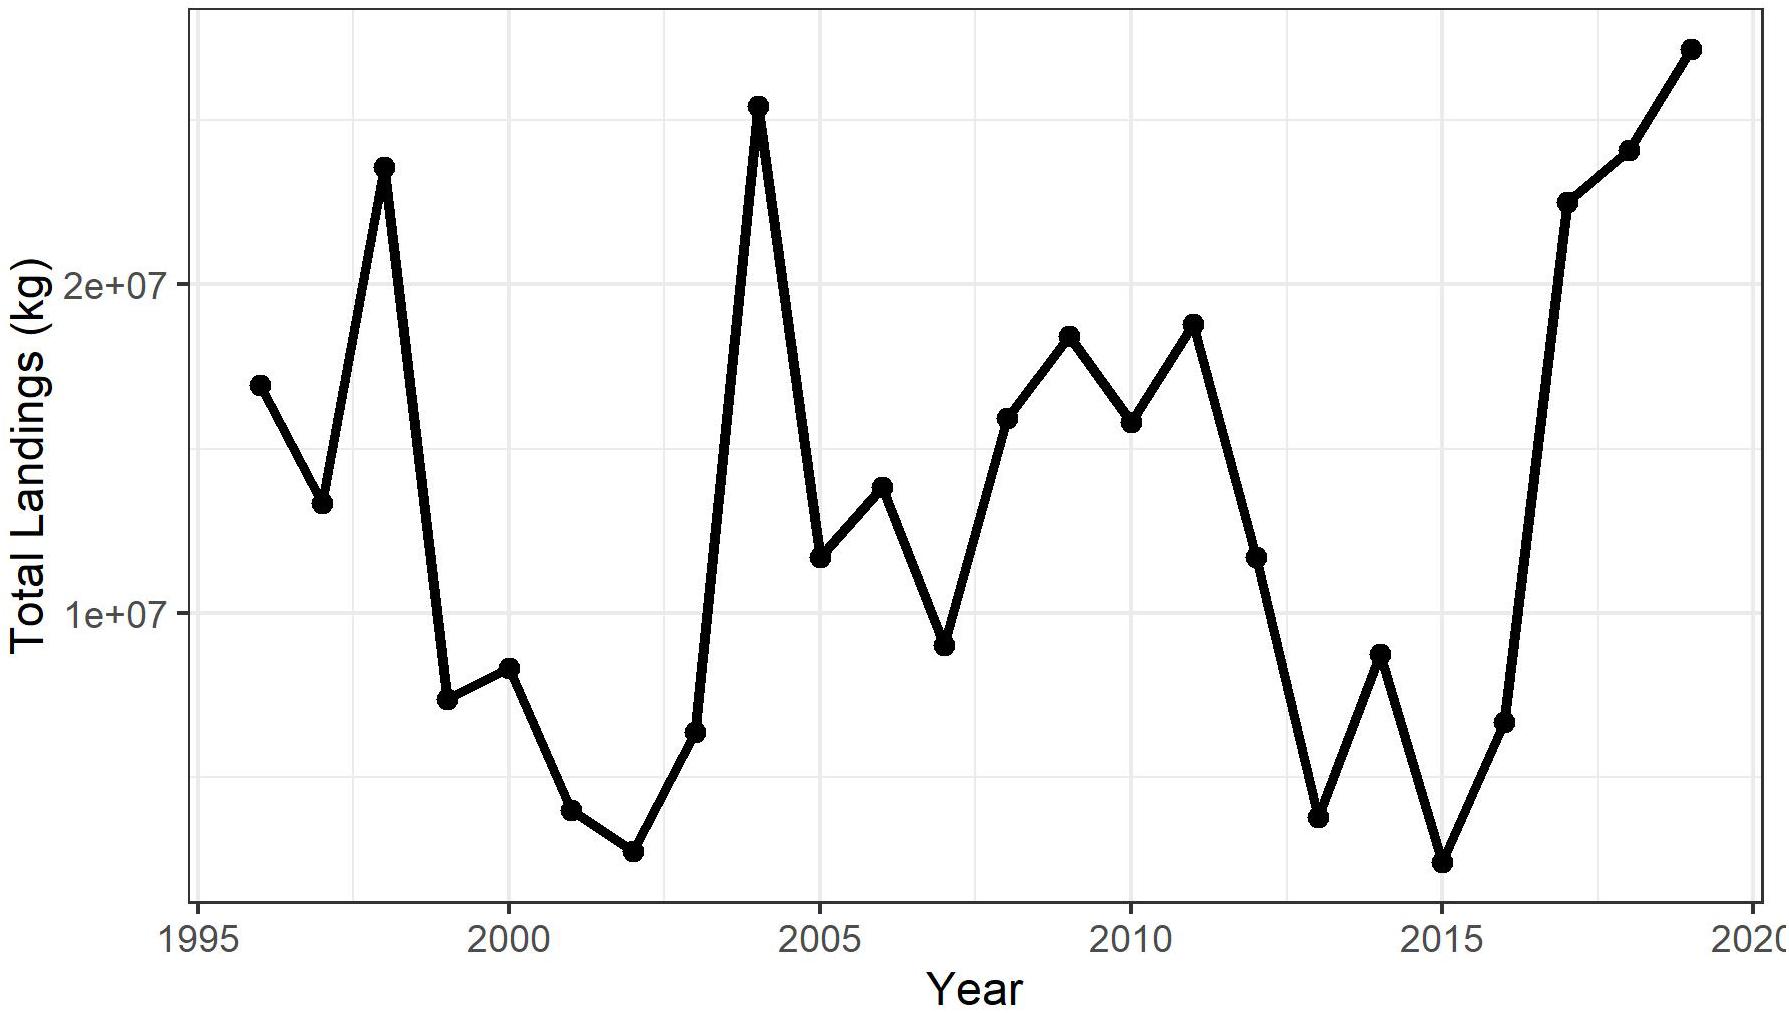
Figure 3. Shortfin squid landings in the US fishery from 1996 to 2018.
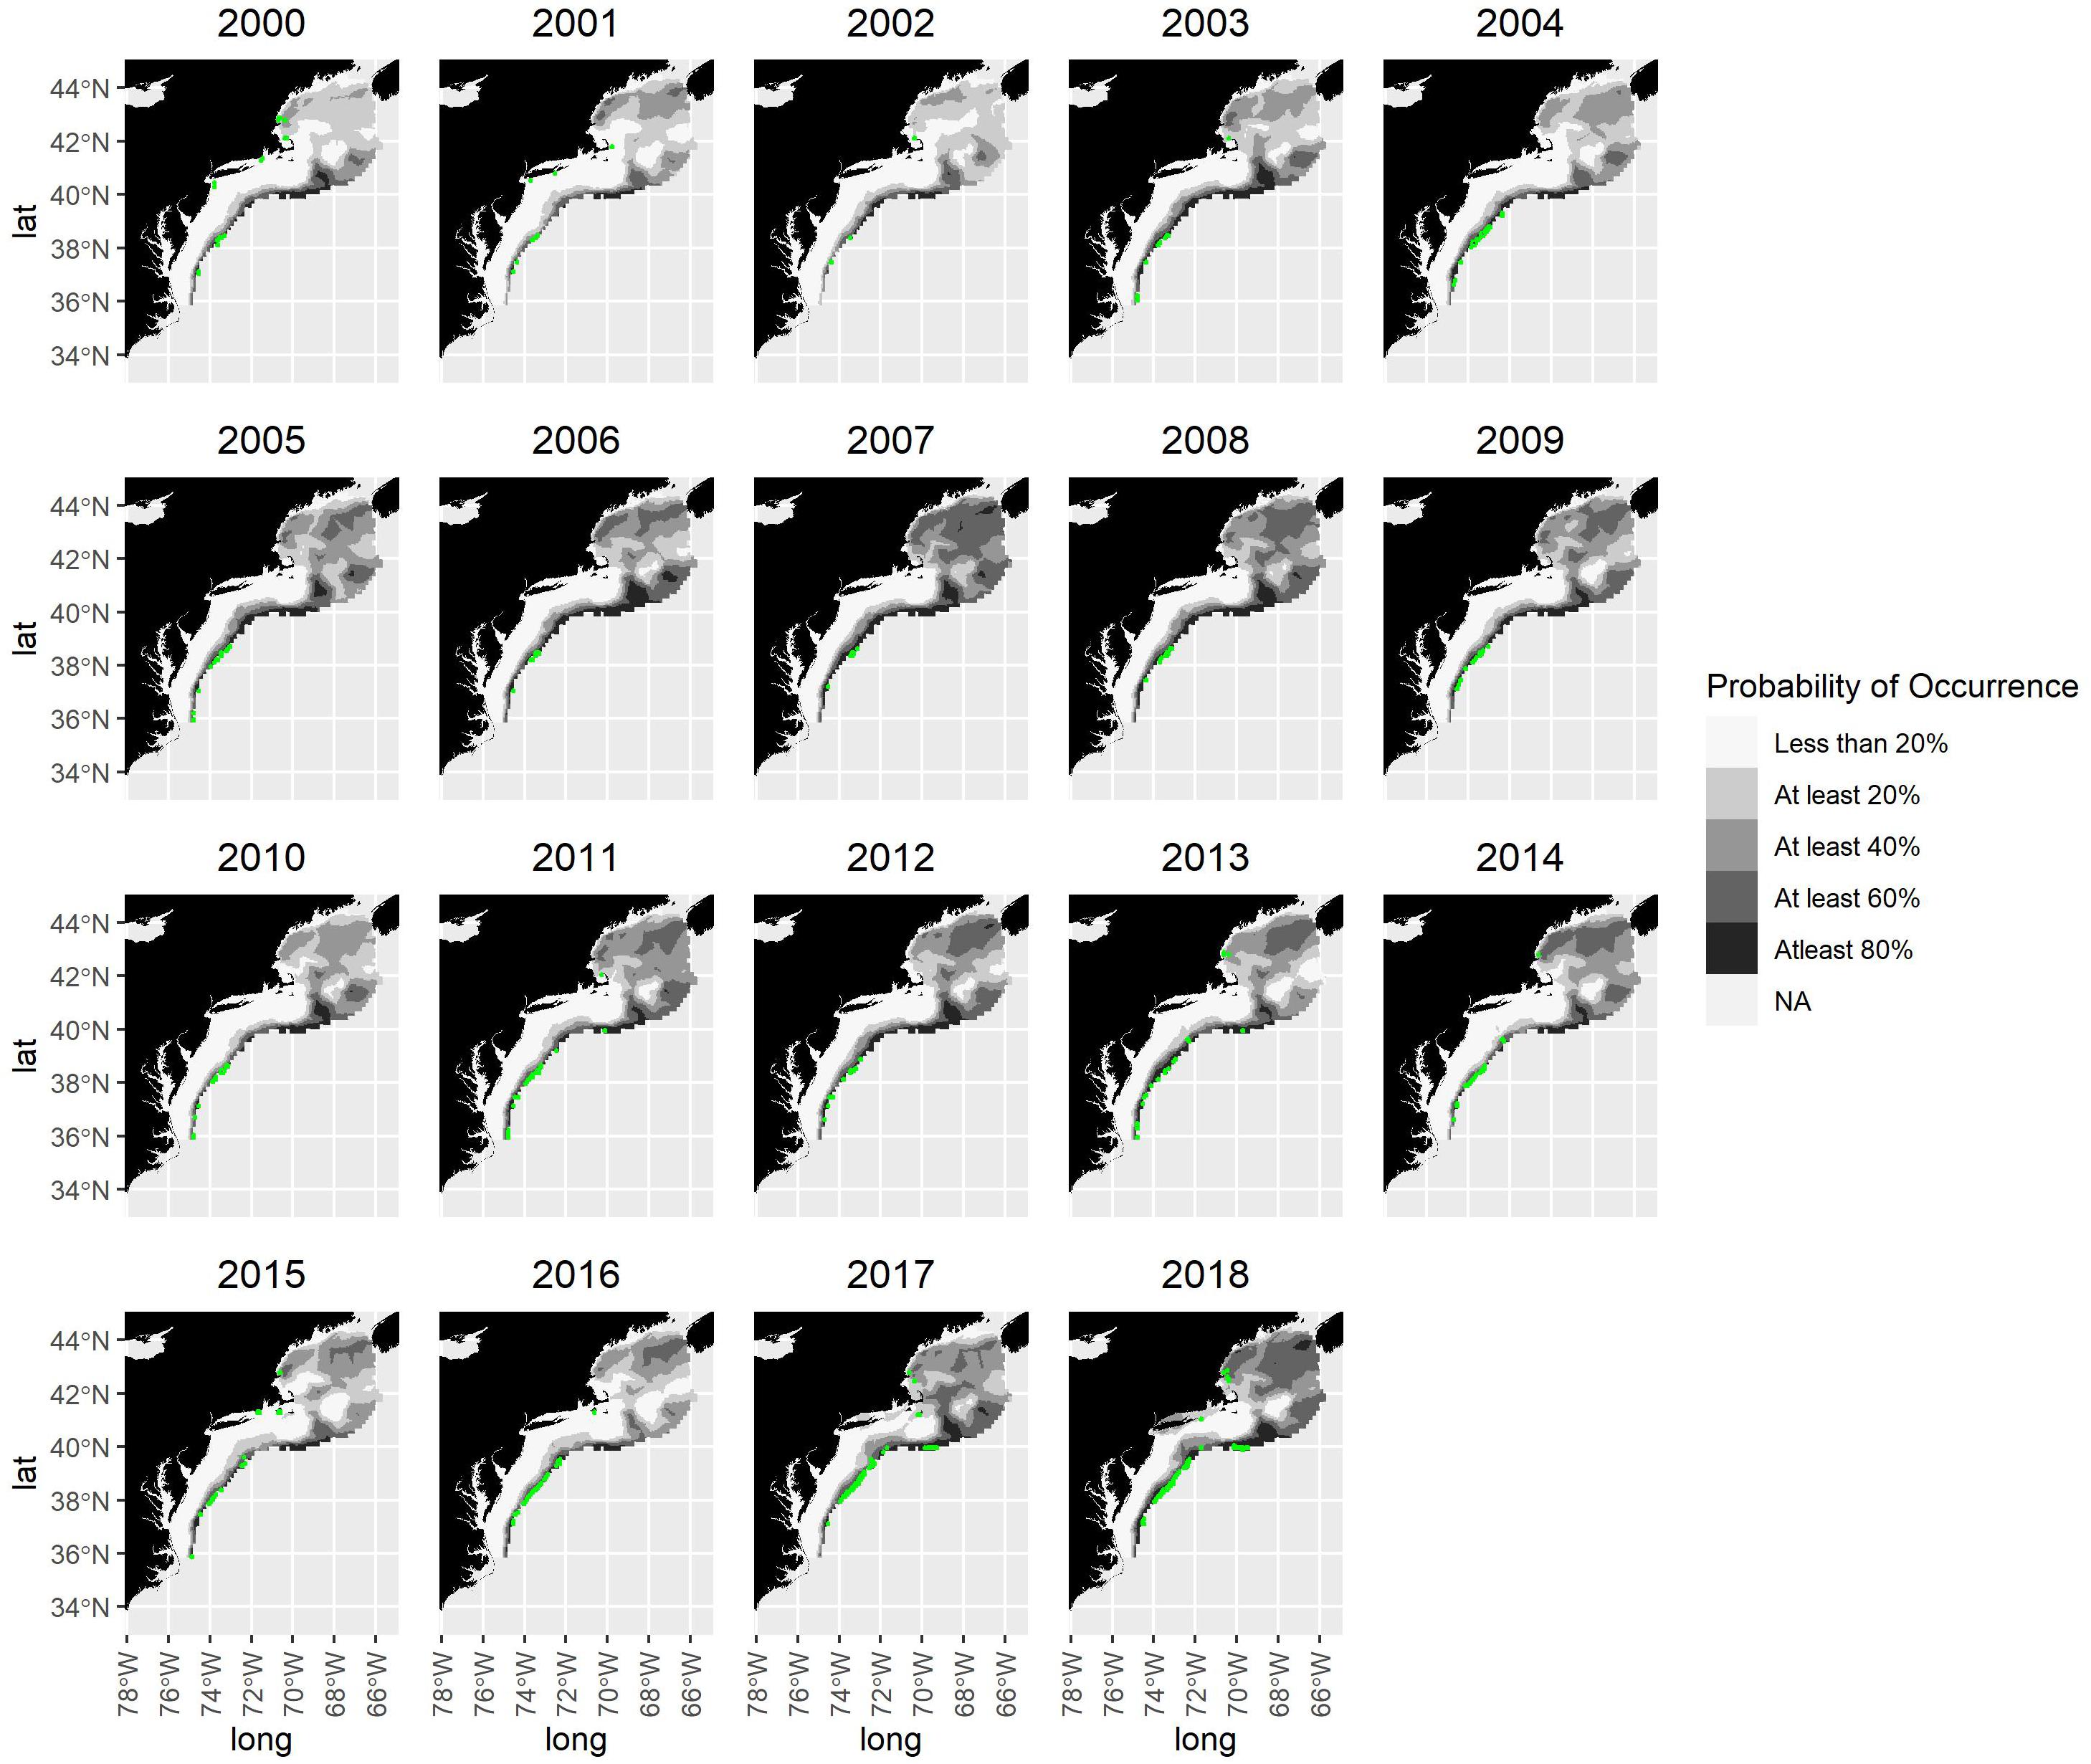
Figure 4. Shortfin squid probability of occurrence map. Quintiles of probability of occurrence are shown in shading. Locations of fishing effort aggregated to 5-min squares are shown in green. Note that some areas of fishing effort have been excluded from the figure to maintain confidentiality.
The shortfin squid habitat area on the Northeast US continental shelf ranged from 4,262 to 22,656 km2 using the 80% probability threshold of habitat area and from 51,311 to 151,382 km2 using the 40% threshold (Figure 5). The wide range of habitat area reflects the highly variable nature of shortfin squid catch. The area occupied by squid based on the 40 and 60% thresholds increased from 2000 to 2007. This was followed by a decrease and then a period of lower variability from 2010 to 2016. The area occupied increased at the end of the time series (Figure 5). The habitat area based on the 80% threshold is relatively constant throughout the series.
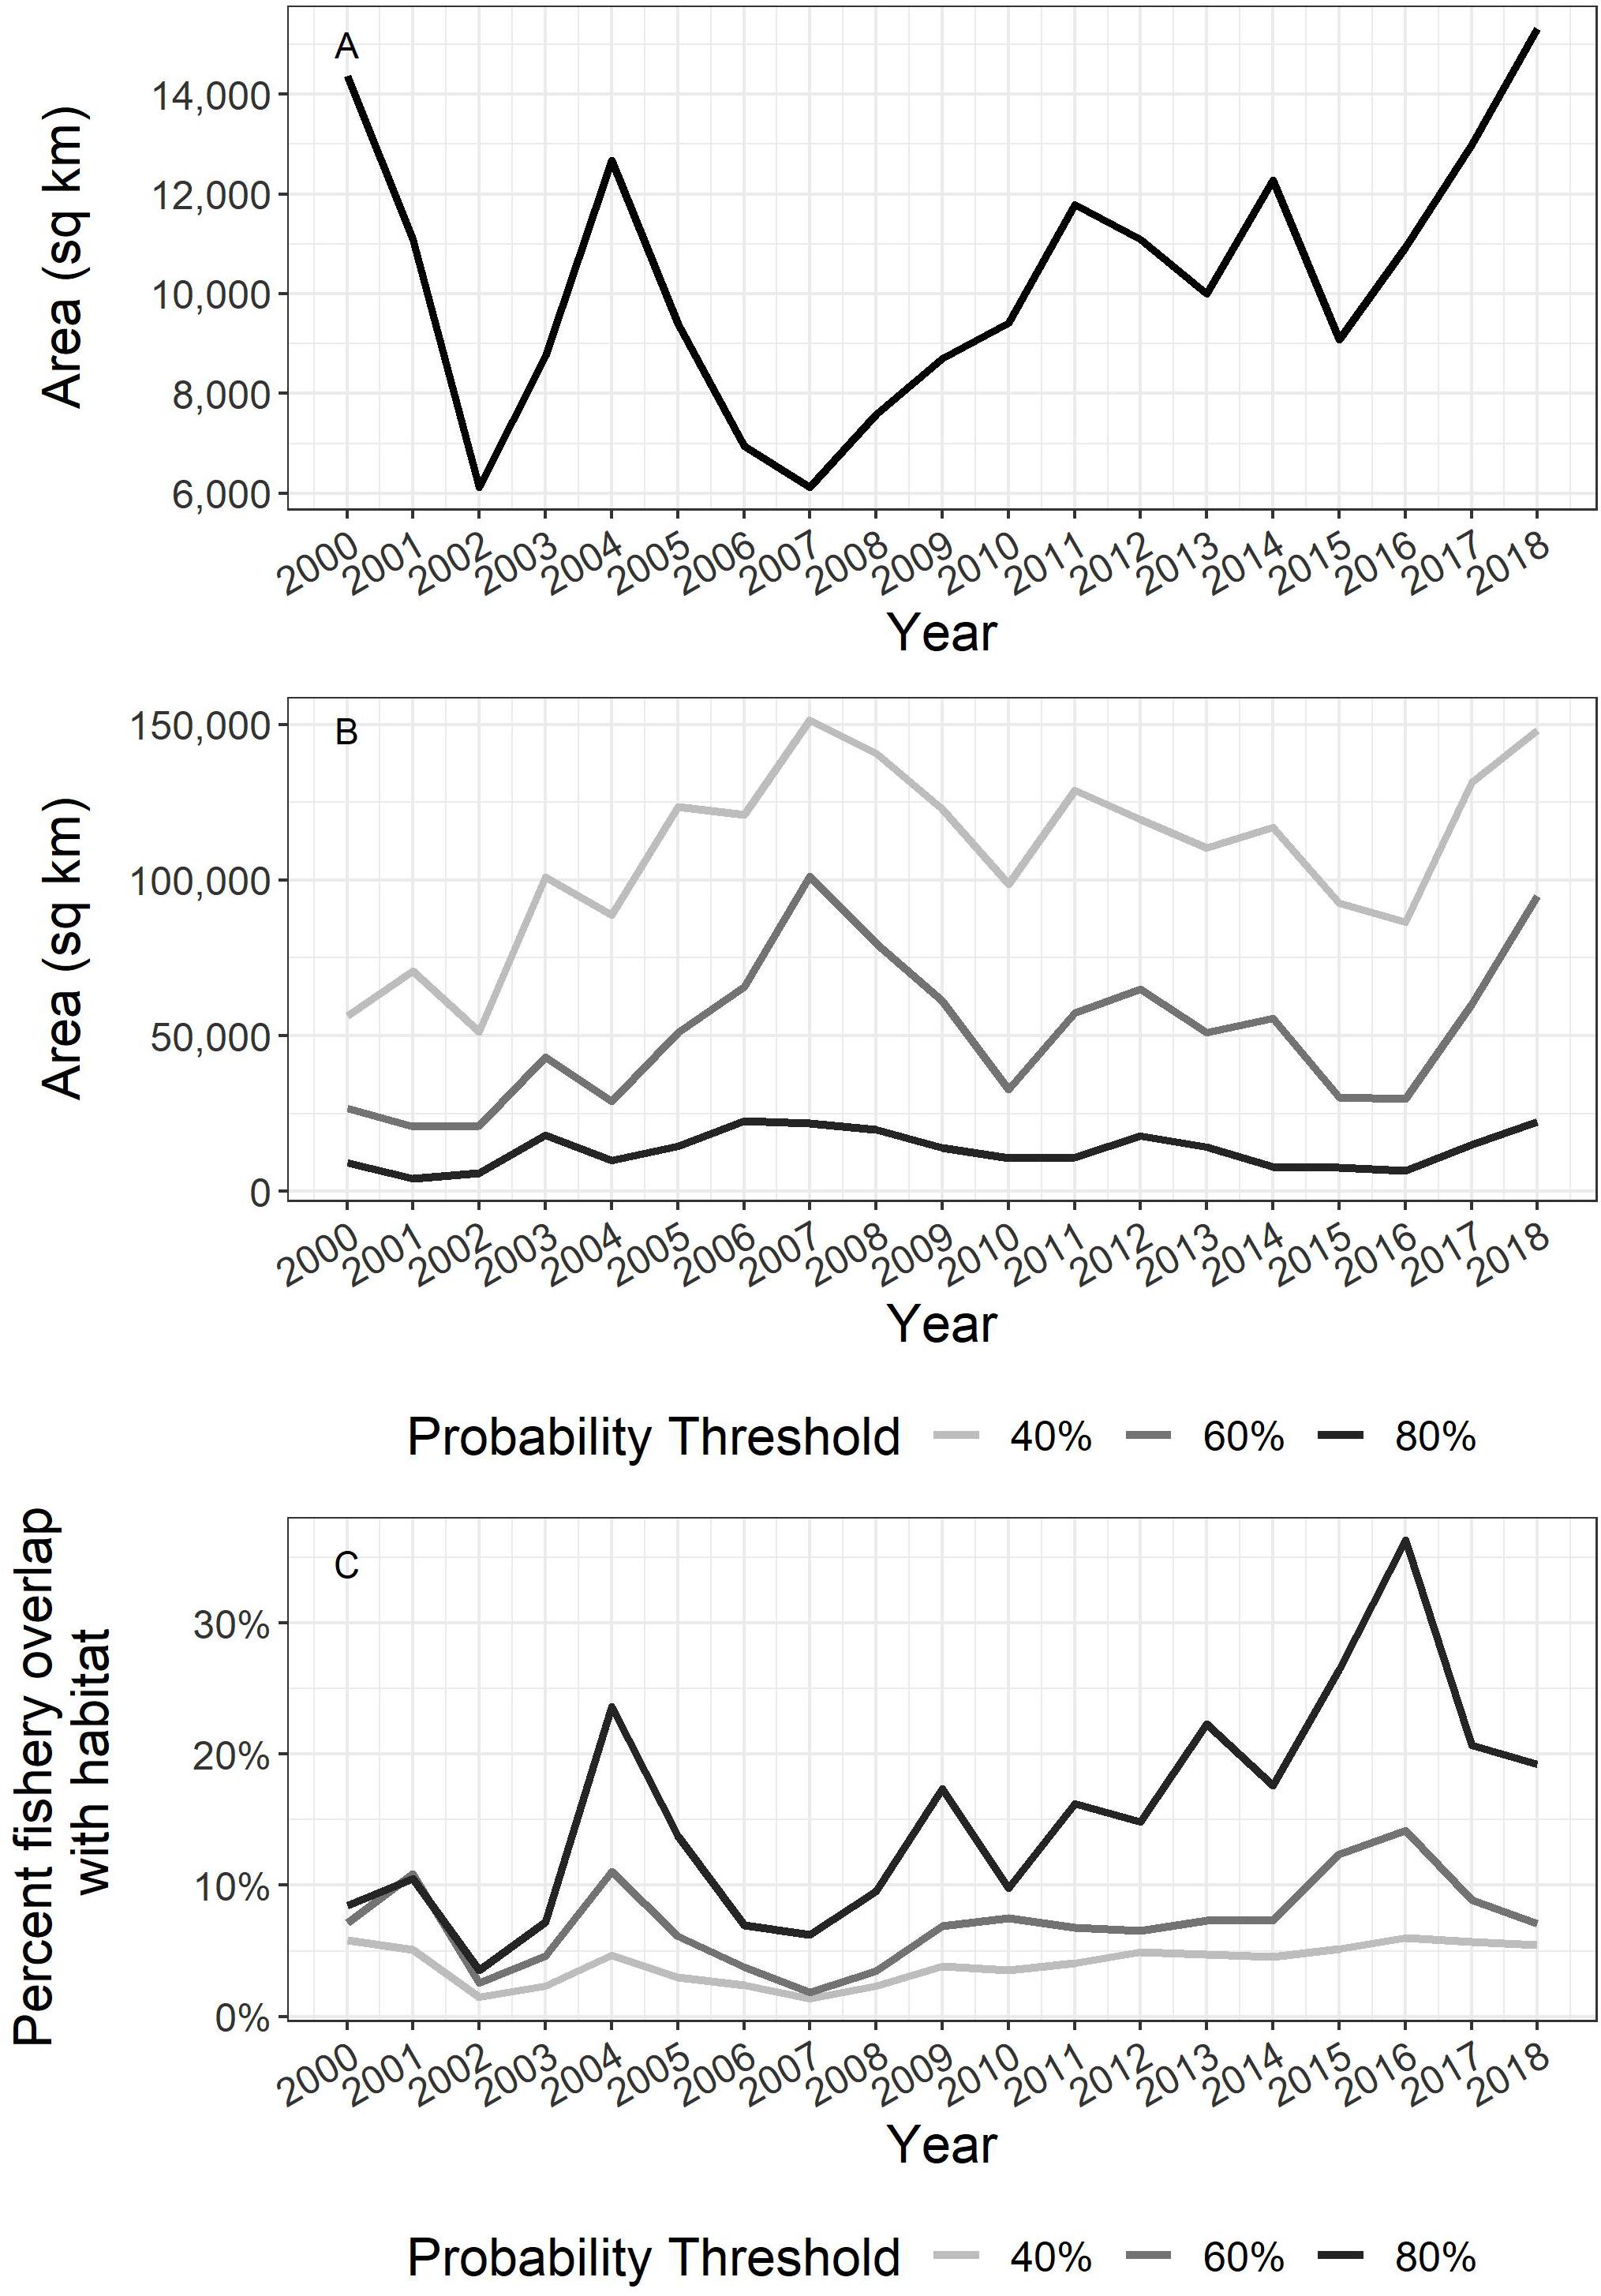
Figure 5. (A) Approximate area fished based on Vessel Trip Reports (VTR) aggregated to 5 minute squares. (B) Shortfin squid habitat area on the US continental shelf and (C) US fishery overlap based on 40%, 60%, and 80% probability of occurrence threshold for defining habitat.
Fishing Footprint
The spatial distribution of shortfin squid fishing effort is consistent at the shelf break in the Mid-Atlantic where the commercial fishery has traditionally been located (Figure 4). Fishing effort was more widespread, covering more inshore areas in early years (2000–2004). From 2005 to 2019, fishing effort is mostly confined to a narrow band along the shelf break. In a few years, fishing effort was evident inshore in the Gulf of Maine and on Georges Bank (e.g., 2012 and 2014); however, these areas are not typical for directed shortfin squid trips and appear to be indicative of incidental catch since the squid are targeted in the Mid-Atlantic.
Overlap of Fishery Footprint and SDM
The proportion of shortfin squid habitat on the US continental shelf that is accessed by the fishery (i.e., proportion of fished area overlapping with habitat area) varied each year probability threshold chosen to define habitat area (the largest difference is approximately 30 percentage points, and the average difference is approximately 11 percentage points) (Figure 5C). Across years, the minimum estimate for the percent of fishery/habitat overlap was 1.4% (2007 based on 40% threshold), and the maximum estimate for the percent of fishery/habitat overlap was 36.3% (2016 based on 80% threshold). The estimates of proportional area of shortfin squid escapement ranged from a maximum of 98.6% to a minimum of 63.7%.
Discussion
We developed estimates of availability (ρ) and proportional escapement (1 – ρ) for the southern stock component of shortfin squid by confining our analysis to US continental shelf waters where the fishery is well monitored and routine fishery-independent bottom trawl surveys are conducted. Results suggest that even when considering only the US shelf as habitat, a relatively small proportion of the resource (1.4–36.3%) interacts with the fishery, regardless of the threshold chosen to indicate habitat. Given that (1) shortfin squid are known to occupy waters in the shelf slope sea much deeper than those sampled in the available surveys (Rathjen, 1981; Vecchione and Pohle, 2002; Roper et al., 2010; Harrop et al., 2014: Shea et al., 2017) as well as areas beyond the northern and southern extent of surveys considered here (Dawe and Beck, 1985; Hendrickson and Hart, 2006; Roper et al., 2010) and (2) fishing effort is aggregated to a coarse scale representing a much larger area than the actual tow path, the results of this research provide a conservative estimate of habitat with an overestimate of fishing footprint.
The shortfin squid habitat estimated by this research is conservative for several reasons. First, the geographic range of shortfin squid extends far beyond the spatial domain of this research, from South of Cape Hatteras, North Carolina in the Florida Straits (Dawe and Beck, 1985; Hendrickson and Hart, 2006; Roper et al., 2010), Northeast to Labrador, the Flemish cap, Baffin Island, and Southern Greenland. There are confirmed reports of shortfin squid farther east in Iceland, the Azores, and in the Bristol Channel, England (O’Dor and Lipinski, 1998; Roper et al., 1998; O’Dor and Dawe, 2013). In addition, the squid occupy shelf slope sea habitats as adults as well as in the juvenile and larval phases. Bottom and midwater trawl and submersible surveys of the shelf slope sea have documented high concentrations of shortfin squid to bottom depths up to 2,000 m (Rathjen, 1981; Vecchione and Pohle, 2002; Roper et al., 2010; Harrop et al., 2014; Shea et al., 2017), far beyond the domains of fishery-independent bottom trawl surveys of the US continental shelf (max depth = 542 m; Politis et al., 2014). Stomach content analysis of large pelagic fishes caught in the central Atlantic showed that ommastrephid squids appeared to be the primary food source for these fishes in this region of the ocean (Logan et al., 2013). Thus, the geographic area occupied by shortfin squid is far larger than the area included in this analysis, leading to a conservative estimate of habitat.
Shortfin squid also spend significant amounts of time in pelagic habitats on the continental shelf and the shelf slope sea. Submersible as well as mid-water trawl surveys of the slope sea have observed large concentrations of adult shortfin squid in the water column (Vecchione and Pohle, 2002; Harrop et al., 2014; Shea et al., 2017). There is also evidence that shortfin squid occupy the pelagic environment on the US and Canadian continental shelf (Froerman, 1981; Brodziak and Hendrickson, 1998; Roper et al., 2010). The pelagic lifestyle of shortfin squid makes its space use volumetric rather than areal. However, this analysis used daytime data when shortfin squid are more closely associated with the seafloor. A volumetric calculation of the availability (ρ) of the squid to these fisheries may be different than the value we calculated using surface areas occupied by shortfin squid and the fishery.
The shortfin squid fishing footprint estimated by this research is likely overestimated, as the scale of fishing effort data is far coarser than actual tow paths. Quantifying fishery footprints has become an increasingly common exercise in recent years on regional (e.g., Jennings et al., 2012; Amoroso et al., 2018) as well as global scales (Kroodsma et al., 2018) as a means to approximate the impacts of fishing. Amoroso et al. (2018) quantified fishery footprints on two dozen shelf/slope areas using VMS and logbook data and found that trawling footprints tended to be smaller in areas where fishery management reference points were being met. Jennings et al. (2012) estimated fishing area and landings by VMS records assigned to a 3 × 3-km grid. They found that the total fishing footprint (i.e., the area that accounted for 100% of fishing effort) ranged from about 43 to 51% of the total study area and included “core areas” where much of the effort was concentrated as well as large “margins” that contained areas with much less of the effort. Similarly, our finding that the proportion of fishing effort overlap is considerably greater based on the 80% threshold relative to the 60 and 40% thresholds (Figure 5) suggests that captains are able to identify and target prime shortfin squid habitat within the study area. Even with this targeting behavior, the impact of the fishing fleet on the population is limited to approximately one-third of the “best” habitat within our study area on the US continental shelf.
This research suggests that shortfin squid have ample opportunity for escapement from the fishery on the northeast continental shelf. Additional opportunities for escapement may be provided in the northern stock area and areas closed to fishing, as explained below. We limited our analysis to US waters, despite the availability of Canadian fishery-independent survey data (Table 2) because the Canadian commercial fishery and recreational fishery are not as well monitored as the US fishery (Hendrickson and Showell, 2019). However, examination of available fishery statistics indicates that the capacity of the Canadian commercial fishery is currently quite small when compared with the US fishery (Table 3). Since the prohibition of foreign vessels in the Canadian Fishery in 1999, the US summer bottom trawl fishery has accounted for approximately 97% of the total landings of shortfin squid in the Northwest Atlantic (Table 3). Fisheries operating in the Gulf of Saint Laurence, Scotian Shelf, and Newfoundland have been responsible for approximately 3% of the landings. The Canadian fishery has achieved only about 1% of the Total Allowable Catch for NAFO areas 3 and 4 (range, 0–21%) since 2000. Thus, the northern shortfin squid stock area, which is not included in our analysis, represents an additional portion of the species range that provides for escapement of potential spawners because the Canadian fishery has remained small in capacity (Hendrickson and Showell, 2019; Table 3).
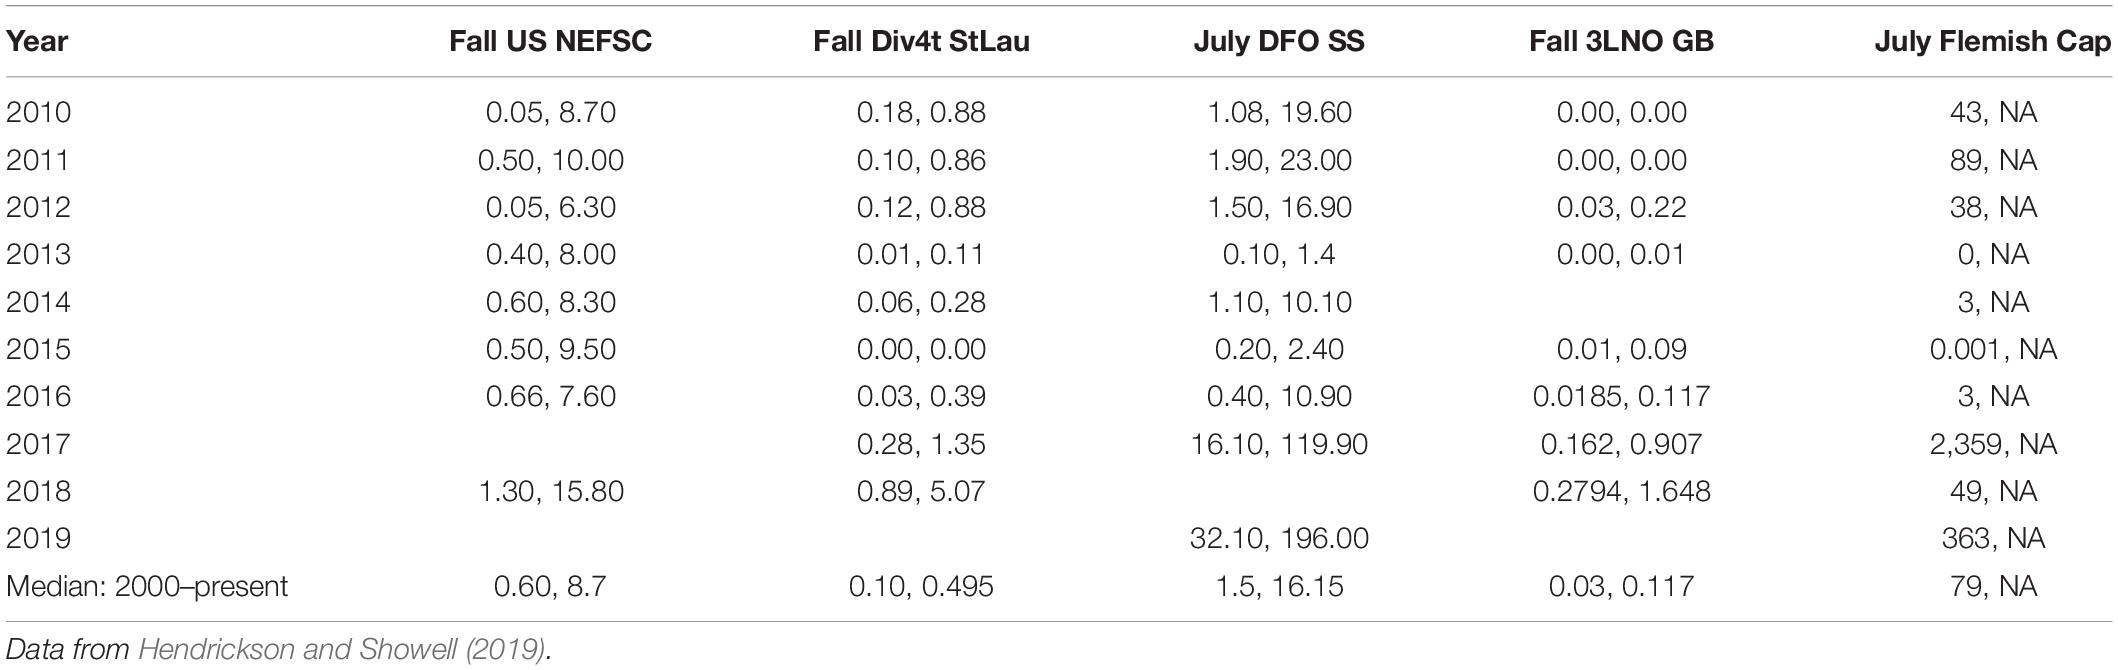
Table 2. Indices ofshortfin squid abundance (mean kilogram per tow, mean number per tow) from fishery-independent bottom trawls surveys: Fall North East Fisheries Science Center (US NEFSC), Fall southern Gulf of St. Lawrence (Div4t StLau), July Scotian Shelf and Bay of Fundy (DFO SS), Fall Grand Banks (3LNO GB), and July Flemish Cap.
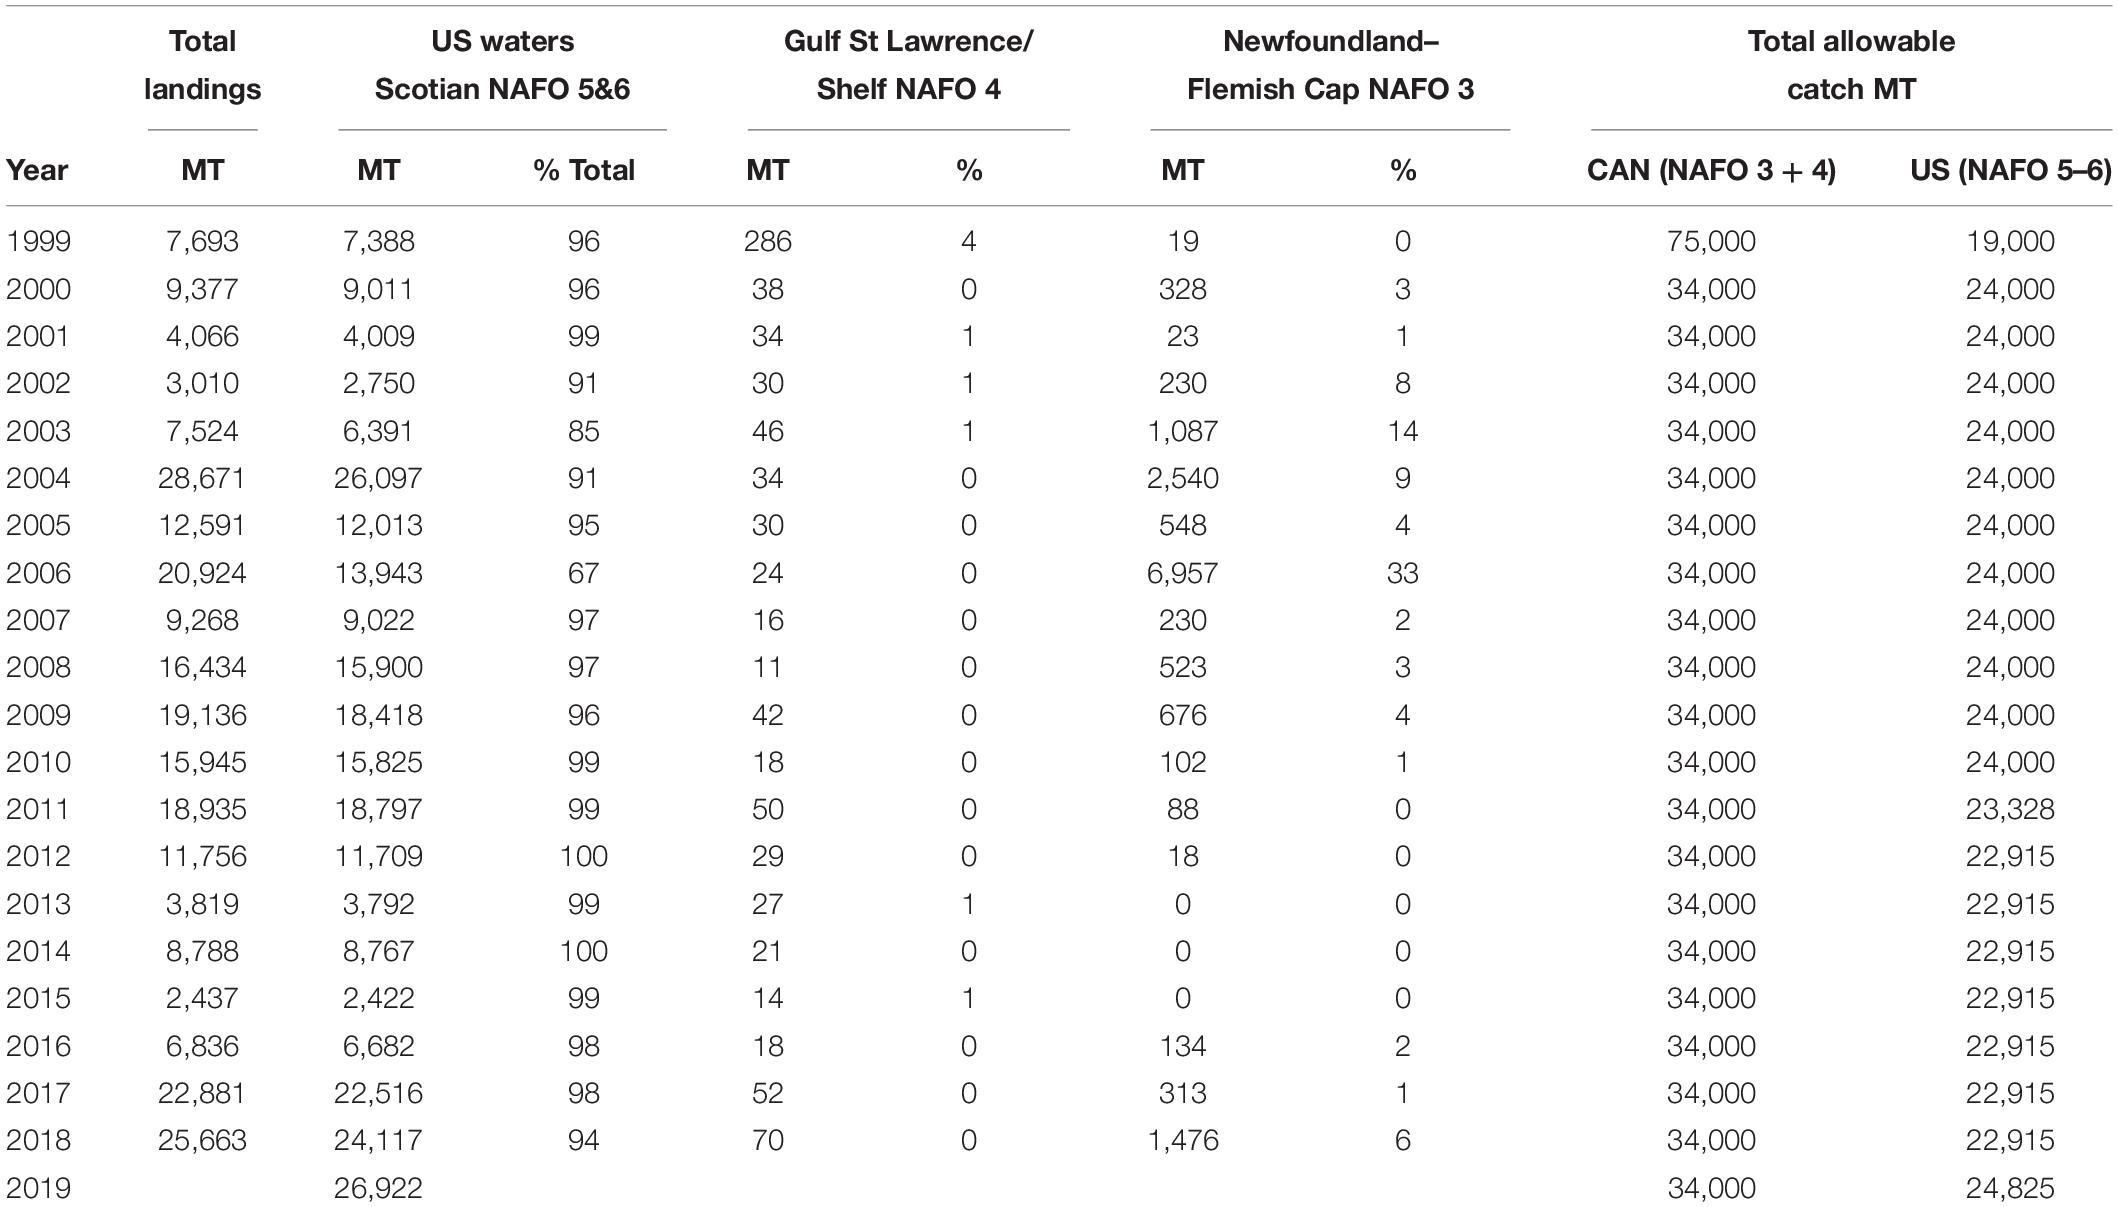
Table 3. Shortfin squid landings (in metric tons, MT) and percent of total landings in US (NAFO 5&6), and Canadian waters (NAFO 3&4) since 1999 when Canadians ceased licensing foreign fishing on the Nova Scotia Shelf.
US fishery regulations that prevent fishing in areas on the outer continental shelf and slope sea also provide shortfin squid with permanent regions of escapement from the fishery. These areas include the Frank R. Lautenberg Deep-Sea Coral Protection Area, the tilefish and lobster gear-restricted areas, and other regulated mesh areas in Gulf of Maine and Georges Bank that prohibit the use of fine mesh trawls used by the squid fishery. The Coral Protection Area occurs along the shelf break at depths >450 m, covers 38,000 square nautical miles including a large area of the slope sea, and 15 canyon areas where the fishery cannot operate. Large concentrations of shortfin squid have also been observed in the slope sea near seamounts within the 4,913 square mile Monument Area that is now closed to mobile fishing gear (Shea et al., 2017). Given these areas of squid occupancy outside of our current study area, our results may overestimate the availability of shortfin squid to the fishery despite our fishery footprint area being based on presence/absence and unscaled to catch or effort.
A clear next step for this research is to incorporate environmental factors in the shortfin squid habitat model. A study of 67 cephalopod time series indicated population increases from the 1950s through the 2010s across various taxa and life histories, suggesting that common large-scale processes drive the increase, aided by biological aspects of cephalopods (Doubleday et al., 2016). Similarly, an examination of the relationship between oceanographic characteristics and spatial distribution of cephalopods in the Yellow Sea suggested that shifts in spatial distribution of cephalopods over the study period was consistent with environmental drivers rather than fishing pressure (Jin et al., 2020).
In conclusion, our findings are consistent with advice to regional management that the shortfin squid stock is unlikely to be negatively impacted by a modest increase in catch (Didden, 2018) because the US fishery overlaps a small portion of the area occupied by the southern stock component. The overlap of fishing area with areas where shortfin squid are likely to occur does not account for the variations in density. Fishing is concentrated on the shelf break because this is where squid are concentrated prior to their subsequent use of shoreward habitats. In some years, these areas may have had sufficient densities or detectability by the fishing fleets to support commercial harvest. In view of the limited understanding of recruitment dynamics of shortfin squid, the potential impacts of harvests on spawning stock escapement are not known. By the same measure, there is no direct evidence of recruitment overfishing for shortfin squid. However, several lines of evidence suggest low potential effects of fishing activity. The near absence of fishing activity in the known historical range of shortfin squid in the US and Canada and the occurrence of shortfin squid at depths and distances well offshore suggest a large region of unfished resource. A high fishing mortality on the entire resource would be possible only if a large fraction of the resource passed through the actual fishing areas of the US. Thus, it is unlikely that the US fishery has had a substantial impact on the southern stock component of shortfin squid.
Data Availability Statement
Publicly available datasets were analyzed in this study. This data can be found here: The Maine-New Hampshire survey data are available through the Maine Marine Resources data portal (https://mainedmr.shinyapps.io/MaineDMR_Trawl_Survey_Portal/). The NEAMAP survey data are available by request through the NEAMAP data access page (http://www.neamap.net/dataAccess.html). The NEFSC survey data are available by request, and more information can be found in the NOAA data catalog (https://catalog.data.gov/dataset/fall-bottom-trawl-survey). Study Fleet and Vessel Trip Report data are confidential but can be made available in aggregated form upon request.
Author Contributions
BL, AJ, JP, AM, and JM conceived of the study. AJ, BG, and JM curated the data. BL performed the data analysis. BL and JM wrote the manuscript with contributions from all authors.
Funding
This research was provided by the National Oceanic and Atmospheric Administration, Northeast Fisheries Science Center.
Conflict of Interest
BL was employed by ERT, Inc. JM was employed by OpenOcean Research.
The remaining authors declare that the research was conducted in the absence of any commercial or financial relationships that could be construed as a potential conflict of interest.
Acknowledgments
We gratefully acknowledge the assistance from Sara Murray, James Gartland, Rebecca Peters, Kim McKown, Matt Camisa, and Linda Barry for providing data from the state inshore surveys. We are grateful to Tyler Pavlowich and Rich Bell for providing assistance with coding. Meghan Lapp offered useful suggestions on an earlier version of the text. We thank Paul Rago, Jason Didden, and Charles Adams for providing helpful feedback on early versions of the manuscript. We thank the captains and crew of vessels who participate in the Study Fleet. We also thank the shortfin squid harvesters and processors who provided useful insight. Members of the Mid-Atlantic Fishery Management Council Scientific and Statistical Committee and the Illex Working Group provided useful comments and suggestions.
Supplementary Material
The Supplementary Material for this article can be found online at: https://www.frontiersin.org/articles/10.3389/fmars.2021.631657/full#supplementary-material
References
Amoroso, R. O., Pitcher, C. R., Rijnsdorp, A. D., McConnaughey, R. A., Parma, A. M., Suuronen, P., et al. (2018). Bottom trawl fishing footprints on the world’s continental shelves. Proc. Natl. Acad. Sci. U.S.A. 115, E10275–E10282. doi: 10.1073/pnas.1802379115
Bell, R. J., Gervelis, B., Chamberlain, G., and Hoey, J. (2017). Discard estimates from self-reported catch data: an example from the US Northeast Shelf. N. Am. J. Fish. 37, 1130–1144. doi: 10.1080/02755947.2017.1350219
Blackburn, J. (2017). Study Fleet Inventory of Data Uses: A Tool for Stakeholder Engagement. US Dept Commer, Northeast Fish Sci Cent Ref Doc. 17-06. (Woods Hole, MA: Northeast Fisheries Science Center), 18. doi: 10.7289/V5/RD-NEFSC-17-06
Bonzek, C. F., Gartland, J., Gauthier, D. J., and Latour, R. J. (2017). Northeast Area Monitoring and Assessment Program (NEAMAP) Data Collection and Analysis in Support of Single and Multispecies Stock Assessments in the Mid−Atlantic: Northeast Area Monitoring and Assessment Program Near Shore Trawl Survey. (Gloucester Point, VA: Virginia Institute of Marine Science, College of William and Mary). doi: 10.25773/7206-KM61
Brodziak, J., and Hendrickson, L. (1998). An analysis of environmental effects on survey catches of squids Loligo pealei and Illex illecebrosus in the northwest Atlantic. Fish. Bull. 97, 9–24.
Chen, K., and He, R. (2010). Numerical investigation of the middle Atlantic bight shelfbreak frontal circulation using a high-resolution ocean hindcast model. J. Phys. Oceanogr. 40, 949–964. doi: 10.1175/2009jpo4262.1
Dawe, E. G., and Beck, P. C. (1985). Distribution and size of short-finned squid (Illex illecebrosus) larvae in the Northwest Atlantic from winter surveys in 1969, 1981 and 1982. J. Northwest Atl. Fish. Sci. 6, 43–55. doi: 10.2960/j.v6.a5
Dawe, E. G., and Beck, P. C. (1997). Population structure, growth, and sexual maturation of short-finned squid (Illex illecebrosus) at Newfoundland. Can. J. Fish. Aquat. Sci. 54, 137–146. doi: 10.1139/f96-263
Dawe, E. G., and Hendrickson, L. C. (1998). A review of the biology, population dynamics, and exploitation of short-finned squid in the northwest Atlantic Ocean, in relation to assessment and management of the resource. NAFO SCR Doc. 98/59, Ser. No. N3051, 33.
Didden, J. (2018). llex ABC [Memorandum]. Mid-Atlantic Fishery Management Council. Available online at: https://static1.squarespace.com/static/511cdc7fe4b00307a2628ac6/t/5b8990764ae237ecb08cb785/1535742070744/IllexABC.pdf (accessed August 31, 2018).
Doubleday, Z. A., Prowse, T. A. A., Arkhipkin, A., Pierce, G. J., Semmens, J., Steer, M., et al. (2016). Global proliferation of cephalopods. Curr. Biol. 26, R406–R407. doi: 10.1016/j.cub.2016.04.002
Federal Register (2012). Fisheries of the Northeastern United States; Atlantic Mackerel, Squid, and Butterfish Fisheries; Framework Adjustment 6, 77 Federal Register 51857 (August 27, 2012) (codified at 50 C.F.R. 648). Federal Register. Washington, D.C.
Federal Register (2018). Fisheries of the Northeastern United States; Mid-Atlantic Fishery Management Council; Omnibus Acceptable Biological Catch Framework Adjustment, 83 Federal Register 15512 (April 11, 2018) (codified at 50 C.F.R. 648). Federal Register. Washington, D.C.
Froerman, Y. M. (1981). Approach to Stock Assessment of Nerito-Oceanic Squids of the Family Ommastrephidae in the Atlantic Ocean on the Example of North-Western Atlantic Shortfin Squid Illex illecebrosus (Lesueur, 1821). Status of Resources and Basis of Rational Fishery in the Atlantic Ocean. (Kaliningrad: AtlantNIRO publishing), 60–69.
Gawarkiewicz, G., Todd, R. E., Zhang, W., Partida, J., Gangopadhyay, A., Monim, M.-U.-H., et al. (2018). The changing nature of shelf-break exchange revealed by the OOI Pioneer Array. Oceanography 31, 60–70. doi: 10.5670/oceanog.2018.110
Grüss, A., Thorson, J. T., Sagarese, S. R., Babcock, E. A., Karnauskas, M., Walter, J. F. I. I. I., et al. (2017). Ontogenetic spatial distributions of red grouper (Epinephelus morio) and gag grouper (Mycteroperca microlepis) in the US Gulf of Mexico. Fish. Res. 193, 129–142. doi: 10.1016/j.fishres.2017.04.006
Grüss, A., Thorson, J. T., Babcock, E. A., and Tarnecki, J. H. (2018). Producing distribution maps for informing ecosystem-based fisheries management using a comprehensive survey database and spatio-temporal models. ICES J. Mar. Sci. 75, 158–177. doi: 10.1093/icesjms/fsx120
Harrop, J., Vecchione, M., and Felley, J. D. (2014). In situ observations on behaviour of the ommastrephid squid genus shortfin squid (Cephalopoda: Ommastrephidae) in the northwestern Atlantic. J. Nat. Hist. 48, 2501–2516. doi: 10.1080/00222933.2014.937367
Hendrickson, L. C. (2004). Population biology of northern shortfin squid (Illex illecebrosus) in the Northwest Atlantic Ocean and initial documentation of a spawning area. ICES J. Mar. Sci. 61, 252–266. doi: 10.1016/j.icesjms.2003.10.010
Hendrickson, L. C. (2019). 2019 Fishery and Survey Data Update Report for the Southern Stock Component of Northern Shortfin Squid (Illex illecebrosus). Report to Mid-Atlantic Fishery Management Council Scientific and Statistical Meeting. Available online at: http://www.mafmc.org/ssc-meetings/2019/may-7-8 (accessed March 13, 2020).
Hendrickson, L. C., and Hart, D. R. (2006). An age-based cohort model for estimating the spawning mortality of semelparous cephalopods with an application to per-recruit calculations for the northern shortfin squid, Illex illecebrosus. Fish. Res. 78, 4–13. doi: 10.1016/j.fishres.2005.12.005
Hendrickson, L. C., and Holmes, E. M. (2004). Essential Fish Habitat Source Document: Northern Shortfin Squid, Illex illecebrosus, Life History and Habitat Characteristics: NOAA Tech Memo NMFS-NE-191, 2nd Edn. (Woods Hole, MA: Northeast Fisheries Science Center), 46.
Hendrickson, L. C., and Showell, M. A. (2019). 2019 Assessment of Northern Shortfin Squid (Illex illecebrosus) in Subareas 3+4. (Dartmouth, NS: Northwest Atlantic Fisheries Organization). Serial No. N6973
Hendrickson, L. C., Brodziak, I., Basson, M., and Rago, P. (1996). Stock Assessment of Northern Shortfin Squid in the Northwest Atlantic During 1993. Northeast Fish. Sci. Cent. Ref. Doc. 96-05g. (Woods Hole, MA: Northeast Fisheries Science Center), 63.
Hendrickson, L. C., Hiltz, D. A., McBride, H. M., North, B. M., and Palmer, J. E. (2003). Implementation of Electronic Logbook Reporting in a Squid Bottom Trawl Study Fleet During 2002. Northeast Fish. Sci. Cent. Ref. Doc. 03-07. (Woods Hole, MA: National Marine Fisheries Service), 30.
Hijmans, R. J. (2020). raster: Geographic Data Analysis and Modeling. R Package Version 3.0-12. Available online at: https://CRAN.R-project.org/package=raster (accessed February 27, 2020).
Jacobson, L. D., Hendrickson, L. C., and Tang, J. (2015). Solar zenith angles for biological research and an expected catch model for diel vertical migration patterns that affect stock size estimates for longfin inshore squid (Doryteuthis pealeii). Can. J. Fish. Aquat. Sci. 72, 1329–1338. doi: 10.1139/cjfas-2014-0436
Jalali, M. A., Ierodiaconou, D., Monk, J., Gorfine, H., and Rattray, A. (2015). Predictive mapping of abalone fishing grounds using remotely-sensed LiDAR and commercial catch data. Fish. Res. 169, 26–36. doi: 10.1016/j.fishres.2015.04.009
Jennings, S., Lee, J., and Hiddink, J. G. (2012). Assessing fisher footprints and the trade-offs between lanings value, habitat sensitivity, and fishing impacts to inform marine spatial plannin and an ecosystem approach. ICES J. Mar. Sci. 69, 1053–1063. doi: 10.1093/icesjms/fss050
Jin, Y., Jin, X., Gorfine, H., Wu, Q., and Shan, X. (2020). Modeling the oceanographic impacts on the spatial distribution of common cephalopods during autumn in the Yellow Sea. Front. Mar. Sci. 7:432. doi: 10.3389/fmars.2020.00432
Kroodsma, D. A., Mayorga, J., Hochberg, T., Miller, N. A., Boerder, K., Ferretti, F., et al. (2018). Tracking the global footprint of fisheries. Science 359, 904–908. doi: 10.1126/science.aao5646
Logan, J. M., Toppin, R., Smit, S., Galuardi, B., Porter, J., and Lutcavage, M. (2013). Contribution of cephalopod prey to the diet of large pelagic fish predators in the central North Atlantic Ocean. Deep Sea Res. Part II Top. Stud. Oceanogr. 95, 74–82. doi: 10.1016/j.dsr2.2012.06.003
Manderson, J. P. (2019). Summary Report of the Northern Shortfin Squid (Illex Illecebrosus) Population Ecology & the Fishery Summit, November 25-26, 2019 Wakefield, Rhode Island. Available online at: https://www.dropbox.com/s/ph2t7l1hjpzzeae/DraftSummary_NorthernShortfinSquidPopulationEcologyAndTheFisherySummit_03242020.pdf?dl=0 (accessed March 24, 2020).
Miller, T. J., Das, C., Politis, P. J., Miller, A. S., Lucey, S. M., Legault, C. M., et al. (2010). Estimation of Albatross IV to Henry B. Bigelow Calibration Factors. Northeast Fish. Sci. Cent. Ref. Doc. 10-05. (Woods Hole, MA: National Marine Fisheries Service), 233.
Nelson, G. A. (2019). fishmethods: Fishery Science Methods and Models. R Package Version 1.11-1. Available online at: https://CRAN.R-project.org/package=fishmethods (accessed June 1, 2020).
Northeast Fisheries Science Center [NEFSC] (1999). Report of the 29th Northeast Regional Stock Assessment Workshop (29th SAW): Stock Assessment Review Committee SARC) Consensus Summary of Assessments: Northeast Fish. Sci. Cent. Ref. Doc. 99–14. (Woods Hole, MA: Northeast Fisheries Science Center [NEFSC]).
Northeast Fisheries Science Center [NEFSC] (2003). Report of the 37th Northeast Regional Stock Assessment Workshop (37th SAW): Stock Assessment Review Committee (SARC) Consensus Summary of Assessments: Northeast Fish. Sci. Cent. Ref. Doc. 03–16. (Woods Hole, MA: Northeast Fisheries Science Center [NEFSC]).
Northeast Fisheries Science Center [NEFSC] (2006). 42nd Northeast Regional Stock Assessment Workshop (42nd SAW) Stock Assessment Report Part A: Silver Hake, Mackerel, & Northern Shortfin Squid: Northeast Fish. Sci. Cent. Ref. Doc. 06–09a. (Woods Hole, MA: Northeast Fisheries Science Center).
O’Dor, R. K., and Dawe, E. G. (2013). “Illex illecebrosus, northern short-finned squid,” in Advances in Squid Biology, Ecology and Fisheries, eds R. Rosa, G. Pierce, and R. O’Dor (Hauppauge, NY: Nova Science Publishers).
O’Dor, R. K., and Lipinski, M. R. (1998). “The genus Shortfin Squid (Cephalopoda, Ommastrephidae): characteristics, distribution and fisheries,” in Squid Recruitment Dynamics. The Genus Illex as a Model, the Commercial Illex Species and Influences on Variability, eds P. G. Rodhouse, E. G. Dawe, and R. K. O’Dor (Rome: FAO fisheries technical paper). doi: 10.1016/s0165-7836(02)00006-1
Pebesma, E. (2018). Simple features for R: standardized support for spatial vector data. R J. 10, 439–446. doi: 10.32614/RJ-2018-009
Politis, P. J., Galbraith, J. K., Kostovick, P., and Brown, R. W. (2014). Northeast Fisheries Science Center Bottom Trawl Survey Protocols for the NOAA Ship Henry B. Bigelow US Dept Commer 14-06. (Woods Hole, MA: Northeast Fisheries Science Center), 138.
R Core Team (2019). R: A Language and Environment for Statistical Computing. Vienna: R Foundation for Statistical Computing.
Rathjen, W. F. (1981). Exploratory squid catches along the continental slope of the Eastern United States. J. Shellfish Res. 1, 153–159.
Rooper, C. N., Hoff, G. R., Stevenson, D. E., Orr, J. W., and Spies, I. B. (2019). Skate egg nursery habitat in the eastern Bering Sea: a predictive model Mar. Ecol. Prog. Ser. 609, 163–178. doi: 10.3354/meps12809
Roper, C. F. E., Lu, C. C., and Vecchione, M. (1998). “A revision of the systematics and distribution of Shortfin squid species (Cephalopoda: Ommastrephidae),” in Systematics and Biogeography of Cephalopods, eds N. A. Voss, M. Vecchione, R. B. Toll, and M. J. Sweeney (Tokyo: Tokai University Press), 405–423.
Roper, C. F. E., Nigmatullin, C., and Jereb, P. (2010). “Family ommastrephidae,” in Cephalopods of the World. An Annotated and Illustrated Catalogue of Species Known to Date. Volume 2. Myopsid and Oegopsid Squids. FAO Species Catalogue for Fishery Purposes, Vol. 2, eds P. Jereb and C. F. E. Roper (Rome: FAO), 269–347.
Shea, E. K., Judkins, H., Staudinger, M. D., Dimkovikj, V. H., Lindgren, A., and Vecchione, M. (2017). Cephalopod biodiversity in the vicinity of Bear Seamount, western North Atlantic based on exploratory trawling from 2000 to 2014. Mar. Biodivers. 47, 699–722. doi: 10.1007/s12526-017-0633-3
Sherman, S. A., Stepanek, K., and Sowles, J. (2005). Maine-New Hampshire Inshore Groundfish Trawl Survey Procedures and Protocols. ME DMF Research Reference Document 05/01, 42. Augusta, ME. Maine Department of Marine Resources.
Swartz, W., Sala, E., Tracey, S., Watson, R., and Pauly, D. (2010). The spatial expansion and ecological footprint of fisheries (1950 to present). PLoS One 5:e15143. doi: 10.1371/journal.pone.0015143
Thorson, J. (2019). VAST Model Structure and User Interface [PDF File]. Available online at: https://github.com/James-Thorson-NOAA/VAST/blob/master/manual/VAST_model_structure.pdf (accessed December 10, 2019).
Thorson, J. T. (2019). Guidance for decisions using the vector autoregressive spatio-temporal (VAST) package in stock, ecosystem, habitat and climate assessments. Fish. Res. 210, 143–161. doi: 10.1016/j.fishres.2018.10.013
Todd, R. E., Gawarkiewicz, G. G., and Owens, W. B. (2012). Horizontal scales of variability over the middle Atlantic bight shelf break and continental rise from finescale observations. J. Phys. Oceanogr. 43, 222–230. doi: 10.1175/jpo-d-12-099.1
Tserpes, G., Politou, C.-Y., Peristeraki, P., Kallianiotis, A., and Papconstantinou, C. (2008). Identification of hake distribution pattern and nursery grounds in the Hellenic seas by means of generalized additive models. Hydrobiologia 612, 125–133. doi: 10.1007/s10750-008-9486-x
Vecchione, M., and Pohle, G. (2002). Midwater cephalopods in the western North Atlantic Ocean off Nova Scotia. Bull. Mar. Sci. 71, 883–892.
Keywords: Illex illecebrosus, fishery footprint, northern shortfin squid, species distribution model, spatiotemporal model
Citation: Lowman BA, Jones AW, Pessutti JP, Mercer AM, Manderson JP and Galuardi B (2021) Northern Shortfin Squid (Illex illecebrosus) Fishery Footprint on the Northeast US Continental Shelf. Front. Mar. Sci. 8:631657. doi: 10.3389/fmars.2021.631657
Received: 20 November 2020; Accepted: 21 January 2021;
Published: 23 February 2021.
Edited by:
Mark J. Henderson, U.S. Geological Survey, United StatesReviewed by:
Francois Bastardie, Technical University of Denmark, DenmarkStephanie Brodie, University of California, Santa Cruz, United States
Copyright © 2021 Lowman, Jones, Pessutti, Mercer, Manderson and Galuardi. This is an open-access article distributed under the terms of the Creative Commons Attribution License (CC BY). The use, distribution or reproduction in other forums is permitted, provided the original author(s) and the copyright owner(s) are credited and that the original publication in this journal is cited, in accordance with accepted academic practice. No use, distribution or reproduction is permitted which does not comply with these terms.
*Correspondence: Brooke A. Lowman, YnJvb2tlLmxvd21hbkBub2FhLmdvdg==