 Sara D. Williams
 Cory S. Walter
 Erinn M. Muller
- 1Coral Health and Disease Program, Mote Marine Laboratory, Sarasota, FL, United States
- 2International Center for Coral Reef Research and Restoration, Mote Marine Laboratory, Summerland Key, FL, United States
One of the latest threats to Florida’s Coral Reef is the stony coral tissue loss disease (SCTLD) outbreak which affects all but a few Caribbean scleractinian species and has spread throughout the Caribbean since 2014. Without a known pathogen, ecological studies of disease dynamics are essential for understanding SCTLD susceptibility at the individual colony and reef level. We investigated the epizootiology of the SCTLD outbreak in the lower Florida Keys at two spatial scales (among reefs ∼1 km and within reefs <10 m) over a 19 month period. In May 2018, three sites absent of SCTLD were established to characterize coral demographics (i.e., live tissue cover and colony diameter) along an offshore to nearshore gradient, and were subsequently surveyed for disease every 2–3 weeks until December 2019. SCTLD was first noted within the offshore and mid-channel reef sites in early October 2018 and later appeared at the nearshore site in early February 2019. SCTLD was negatively correlated with thermal stress, showing reduced progression and incidence rates after 2–3 weeks of water temperatures above the mean monthly maximum temperature for the region (i.e., 2–3 degree heating weeks). Although Pseudodiploria strigosa, Dichocoenia stokesii, Colpophyllia natans, and Diploria labyrinthiformis were the most susceptible species at our sites, areas with more Montastraea cavernosa and Orbicella faveolata colonies had higher prevalence and greater tissue loss associated with disease. The disease was more severe within quadrats with high species diversity, high coral cover, and disproportionately affected larger colonies. Our spatial analyses suggest that (1) SCTLD followed a contagious disease model within small (<10 m) spatial scales, (2) colonies within 1.5–3 m of a diseased coral were at higher risk for subsequently showing disease signs compared with those farther away, and (3) high incidence rates coincided with the loss of small scale (<10 m radius) spatial clustering, suggesting pulses of contagious spread on large spatial scales.
Introduction
Coral diseases have caused widespread deterioration of coral reefs over the last four decades (Porter et al., 2001; Sutherland et al., 2004); however, where, when, why, and how these outbreaks have occurred are largely unanswered questions (Shore and Caldwell, 2019). Addressing these questions is essential for mitigating outbreaks, like one of the latest threats, the stony coral tissue loss disease (SCTLD). Studies of the epizootiology (i.e., disease ecology) of coral diseases are encumbered by similar physical characteristics of multiple diseases (Sutherland et al., 2004; Pollock et al., 2011), species-specific susceptibilities (Williams et al., 2020), environmental influences (Mydlarz et al., 2006; Kaczmarsky and Richardson, 2011; van Woesik and Randall, 2017), difficulties in defining marine pathogens (Ritchie, 2006; Burge et al., 2016), and the large temporal and spatial scales of disease dynamics (Muller and van Woesik, 2012). While the epizootiology of SCTLD has been described on a large scale in the Florida Keys (10–100’s of kilometers, Muller et al., 2020), the ecology of this unprecedented disease on a reef scale (among reefs ∼ 1 km and within reefs <10 m) has not yet been well-characterized, including environmental relationships, species-specific susceptibilities and responses, reef-indicators of susceptibility, and the spatial scale of local transmission dynamics.
The SCTLD epidemic occurring throughout Florida’s Coral Reefs and several sites throughout the Caribbean since 2014 (Precht et al., 2016; Alvarez-Filip et al., 2019; Kramer et al., 2019; Rippe et al., 2019; Muller et al., 2020), is affecting all but a few Caribbean scleractinian coral species. Although SCTLD spread more rapidly to the north of its origin off the coast of Miami (Precht et al., 2016; Walton et al., 2018), it has spread farther southward, hitting the middle FL keys in 2017 (Muller et al., 2020) and the Mexican Caribbean in 2018 (Alvarez-Filip et al., 2019; Estrada-Saldívar et al., 2020) as well as several other sites within the Caribbean (Kramer et al., 2019). Ex situ experiments suggest that SCTLD is contagious and transmissible through waterborne processes and direct contact with diseased corals (Aeby et al., 2019). Hydrodynamic modeling also suggests that transmission via neutrally buoyant particles can predict the spread of the disease throughout the lower Florida Keys (Dobbelaere et al., 2020). However, investigations are hampered by limited capacity to rapidly and accurately diagnose the etiological agent(s) of SCTLD (Meyer et al., 2019; Rosales et al., 2020), a common issue within marine diseases in general (Burge et al., 2016) and coral disease diagnostics in particular (Ritchie, 2006).
As temperatures are increasing in the Florida Keys resulting in near annual high stress events due to climate change (Manzello, 2015), a better understanding of how thermal stress interacts with SCTLD dynamics is needed. Elevated sea surface temperatures and subsequent bleaching are known drivers of several coral diseases and are linked with increased disease severity and related mortality, though may be disease specific (Brandt and McManus, 2009; Cróquer and Weil, 2009; Miller et al., 2009; Muller and van Woesik, 2014; Randall et al., 2014; Randall and van Woesik, 2015; van Woesik and Randall, 2017). Abnormally high temperatures and a severe bleaching event may have led to increased coral susceptibility in 2014 before the SCTLD outbreak began (Precht et al., 2016) and again in 2016 (Walton et al., 2018). However, Muller et al. (2020) did not find a significant relationship between SCTLD occurrence and severity within reefs and sea surface temperatures in their study from May 2014 to December 2017. In fact, Meiling et al. (2020) showed a decrease in tissue loss rate associated with SCTLD as thermal stress accumulated prior to a bleaching event. Sharp et al. (2020) also saw a decrease in SCTLD incidence and death rates during the 2018 coral bleaching season in the Middle Keys, but not during the 2019 coral bleaching season.
Stony coral tissue loss disease affects more than 20 scleractinian coral species (NOAA, 2018) that exhibit varying levels of susceptibility across the spatial extent of the outbreak. Moderately to highly susceptible species include Meandrina meandrites, Dichocoenia stokesii, Colpophyllia natans, Pseudodiploria strigosa, Eusmilia fastigiata, Diploria labyrinthiformis, Orbicella annularis, Dendrogyra cylindricus, Siderastrea siderea, Stephanocoenia intersepta, and Montastraea cavernosa; while Porites spp. and Acropora spp. appear unaffected (Precht et al., 2016; Walton et al., 2018; Alvarez-Filip et al., 2019; Estrada-Saldívar et al., 2020; Muller et al., 2020). Observations of species-specific susceptibility to SCTLD and quantitative measures like progression rates should be further characterized to identify possible indicator species or even super-spreaders, individuals responsible for a disproportionate number of transmission events (Paull et al., 2012), that will affect disease dynamics on a reef scale. In addition to species-level differences, larger, older colonies are often at higher risk to disease (Muller and van Woesik, 2014; Caldwell et al., 2018, 2020), and thus size-dependent susceptibility may influence SCTLD dynamics.
At a reef level, factors like coral density and diversity can influence disease dynamics. Coral disease prevalence is typically associated with high coral colony densities (Bruno et al., 2007; Aeby et al., 2011), but this has not yet been associated with SCTLD (Muller et al., 2020). The diversity-disease hypothesis predicts that lower host species diversity should result in higher disease severity for specialist pathogens (Elton, 1958). This hypothesis has mostly been tested in terrestrial systems where results typically support that specialist pathogens thrive in areas with low species diversity, but disease prevalence also depends on host abundance and species composition (Mitchell et al., 2002). However, few species are unaffected by SCTLD, and thus its generalist nature may be sustained by more diverse reefs. This has been supported by Muller et al.’s (2020) analysis showing diverse and deep reefs were more affected by SCTLD. Higher abundances of susceptible species or specific differences in species composition may be underlying factors supporting higher prevalence of this generalist disease on more diverse reefs.
Using spatial epidemiology, Muller et al. (2020) confirmed the contagious nature of SCTLD at a large spatial scale (10–100s of km) and Dobbelaere et al. (2020) tied spreading dynamics to hydrodynamics. Spatial epidemiology, the use of spatial statistics to describe and quantify disease transmission, is an effective tool for determining the contagious nature of many coral diseases (Bruckner et al., 1997; Foley et al., 2005; Zvuloni et al., 2009; Lentz et al., 2011; Muller and van Woesik, 2012). A clustered distribution of diseased colonies relative to the distribution of the entire coral population suggests a contagious mode of disease transmission (Jolles et al., 2002). Mapping the spatial distribution of disease prevalence at multiple scales within Florida’s Coral Reef is critical to understanding the epizootiology of the SCTLD outbreak (Muller and van Woesik, 2012, 2014; Randall et al., 2014).
In the absence of a definitive diagnosis, a characterized etiology, and an understanding of environmental drivers, management efforts to potentially control the spread of SCTLD and/or treat, mitigate, or manage affected corals are hindered (Neely et al., 2020). We characterized the epizootiology of SCTLD as it spread among reefs (∼1 km scale) and within reefs (10s of m scale) in the lower Florida Keys over a 19 month period from May 2018 to December 2019. We captured the fine-scale spreading dynamics of SCTLD on a reef by mapping the locations of every colony in the surveyed quadrats. The fine-scale observations of our study over an extended time period allowed us to (i) assess the temporal dynamics of SCTLD on an offshore to nearshore gradient, (ii) determine the association between thermal stress and disease dynamics, (iii) determine colony-level indices of susceptibility such as species and size, (iv) determine reef-level indices of susceptibility such as density or diversity, and (v) assess the spatial dynamics of SCTLD within reefs (10s of m).
Materials and Methods
Site Establishment and Surveys
In May 2018, we established three focal reef sites, offshore (24.547590, −81.456950), mid-channel (24.560810, −81.501370), and nearshore (24.584780, −81.496820, ∼ 4.8 km from shore) in the lower section of Florida’s Coral Reef and all colonies showed no signs of SCTLD (Supplementary Figure 1). By having an offshore to nearshore reef gradient, we documented whether the appearance of disease on reefs occurred simultaneously or whether it appeared within a certain geographical region prior to another. All sites were between 7 and 8 m deep. Within each site, we established two 10 m × 10 m quadrats. All coral colonies with a maximum width >10 cm in size were mapped using SCUBA, given an x, y coordinate, identified to species, and the percent of living tissue and maximum diameter were recorded (cm). All quadrats were photographed using underwater still photography prior to the onset of SCTLD (July 2018). Sites were again photographed in May 2019 to capture the diseased state and December 2019 to capture the final state of the sites. Non-overlapping photographs were taken at every meter along ten 10 × 1 m transects, thus each photo was a 1 m2 area of the reef resulting in approximately 100 photographs per quadrat. Photographs were randomly selected for Coral Point Count with Excel extensions (CPCe) analysis (Kohler and Gill, 2006) to determine the percent coral cover of each quadrat. A total of 25 points were analyzed per photograph and a total of 50 random non-overlapping photographs were assessed per quadrat.
After the initial data collection surveys, each site was rapidly assessed every 2–3 weeks. The rapid assessments consisted of one dive at each site with two divers visually scanning for SCTLD approximately 15 min at each plot. Disease was first observed in early October 2018. Detailed surveys were then conducted every 2–4 weeks until December 2019. During the surveys, each individual coral was visually assessed for signs of SCTLD, including discoloration and tissue loss. Diseased corals were identified within the site map and photographs were taken of the entire coral and the diseased area (Figures 1A,B). Coral tissue loss (percentage surface area lost) was recorded for every colony at each survey time point.
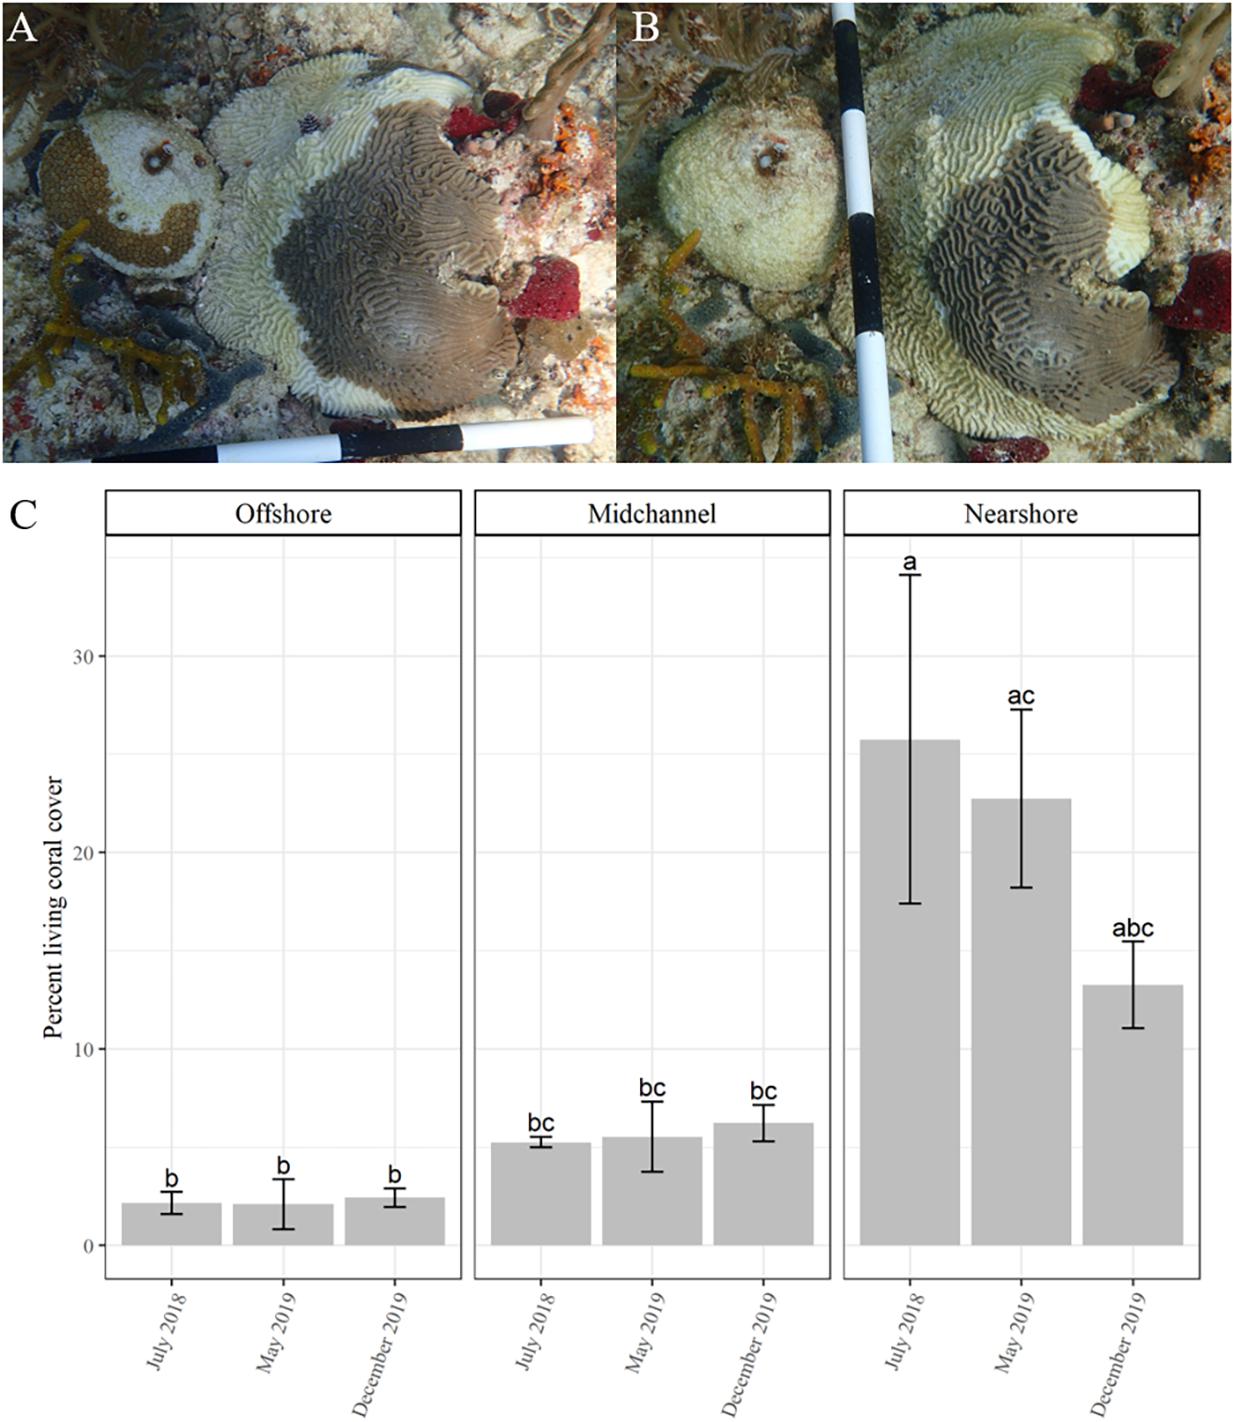
Figure 1. Time series of two corals, Dichocoenia stokesii (coral on left) and Pseudodiploria strigosa (coral on right) showing signs of stony coral tissue loss disease on March 4, 2019 (A) and again on March 22, 2019 (B). (C) Percent coral cover over time (mean ± SE) as measured by CPCe at each site: offshore (left), mid-channel (center), and nearshore (right). Different letters denote significant differences according to the post hoc pairwise comparison tests.
Statistical Analyses of Disease Dynamics and Susceptibility
All statistical analyses were conducted in the program R (version 4.0.2 R Development Core Team, 2019). Assumptions for statistical analyses were checked visually using diagnostic plots and normality was checked using Shapiro–Wilk tests. If data did not meet assumptions for any statistical analysis, then the data were transformed or nonparametric tests were performed.
The incidence (number of new diseased colonies since the last time point), prevalence (fraction of population with active disease), and deaths (cumulative fraction of population dead) were visually assessed for each survey and compared through time for the total population of corals among and within sites. We did not see new recruitment of colonies >10 cm during our survey period and all tissue loss was from apparent disease. A two-way ANOVA and post hoc pairwise comparison tests were used to determine significant differences in percent coral cover (as measured by CPCe) among sites and time points. Additionally, disease progression was analyzed as the percent coral tissue loss (as measured by in situ surveys) between time points on a per colony basis. These values were transformed to percent coral tissue loss per week by accounting for the time differences between surveys, allowing us to analyze a standardized measure for progression rate. We used a Kruskal–Wallis rank sum test to determine differences in percent coral tissue loss per week among the three sites.
Sea surface temperature (SST, °C) and degree heating weeks (DHW, °C weeks, measure of how much heat stress has accumulated in a given region over the last 12 weeks) are reliable predictors of coral thermal stress resulting in bleaching (Heron et al., 2016) and these data are freely available from NOAA Coral Reef Watch (NOAA Coral Reef Watch, 2017). We used the data provided for the Florida Keys virtual station, detailed methods for the calculation of DHW by NOAA Coral Reef Watch are available in Skirving et al. (2020). To determine if SCTLD dynamics were associated with thermal stress, we conducted Pearson correlation analyses of disease incidence and progression with SST and DHW. Total incidence of SCTLD and progression rate (average percent coral loss between surveys) across all sites were considered from January 4, 2019 (first date with incidence >5 colonies) to the survey end date on December 6, 2019. Test assumptions were assessed as stated above and values were log-transformed for the Pearson correlation tests.
Observations of thermal stress were made during the in situ surveys. Any observation of “paling,” “bleached,” or slight variations of those conditions were used to indicate that a colony was thermally “stressed.” These observations were combined into a “stressed category” and a Chi-squared test was used to determine whether colonies that showed signs of thermal stress were more susceptible to SCTLD than by chance.
Disease metrics were separated by species to explore species-specific susceptibility to SCTLD. We used a Fisher’s exact test to determine if there were certain species more susceptible to SCTLD rather than random chance, based on frequency of healthy and diseased colonies present for each species. We then used the results to subset the data to include only susceptible species for all following analyses. Significant differences among species-specific progression rates (percent of coral tissue loss per week) were tested using a Kruskal–Wallis rank sum test. Additionally, we quantified the timing of disease onset for each species as the number of weeks after the first disease signs were seen at a site before a colony showed initial signs of SCTLD. To test for size-dependent susceptibility, we used multiple Wilcoxon rank analyses to test for significant differences in the maximum widths of susceptible corals that stayed healthy and those that showed signs consistent with SCTLD over the entire survey time period for each quadrat and then used a weighted Z-transformed combined probability test to compute a combined P-value (combine.test function in survcomp package; Schroeder et al., 2011). Individual Wilcoxon rank analyses were used to test for significant differences in size for all susceptible species (using pooled data across quadrats to obtain an adequate sample size per species) and a Benjamini–Hochberg correction to reduce the false discovery rate was applied to the multiple two-way tests.
Coral colony density (number of colonies per m2), initial percent coral cover as measured by CPCe, species richness (number of species), species diversity (Shannon diversity index based on number of colonies), relative abundance of the susceptible species, and average colony maximum width (cm) were analyzed to determine if disease severity was associated with these covariates using the individual quadrats as observational units (n = 6). We used linear regressions to test for significant relationships between total disease prevalence and the covariates at each quadrat. To further explore differences in species composition among the quadrats in relation to disease prevalence, particularly of the ten most abundant susceptible species, we used a principal components analysis to examine the relationship of and variance in abundances of these species across the six quadrats. This analysis was conducted using the “PCA” function in the R package FactoMineR (Lê et al., 2008). The species’ abundances were normalized by total coral abundance at each quadrat. We visualized the data across principal component space using the function “fviz_pca_biplot” in the R package Factoextra (Kassambara and Mundt, 2020). The “dimdesc” function was used to identify the variables significantly associated with the first principal component by applying one factor ANOVA models for each dimension, deriving F-tests to determine influence, and applying T-tests species by species to determine significant P-values (Kassambara and Mundt, 2020).
Spatial Statistical Analyses
Only colonies of the previously determined susceptible species were used in the spatial analyses. Colonies were treated as points located by their x, y coordinates (colony centers) within the quadrats. We quantified spatial patterns of disease within the two quadrats with the most diseased colonies using three distance metrics and analyses: Euclidean distance, nearest previously diseased neighbor distance (NPDN), and Ripley’s K. These analyses tested whether the outbreak followed a predictable contagion spatial model through time.
We calculated the Euclidean distance, the straight line distance between two colonies, for all colonies and then for just the diseased colonies at each quadrat. A colony was counted in the diseased group if it showed signs of SCTLD at any time during the survey period. For each quadrat, the distributions of distances between all colonies and the distances between just diseased were compared using a one-sided Kolmogorov–Smirnov test to determine if the median distance between diseased colonies was significantly smaller than the median distances between all colonies, thus indicating spatial clustering of the disease.
Nearest neighbor (NN) distance, the distance between an individual and the next closest individual (NN), is a common metric in spatial ecology to determine clustering of individuals. The spatial epidemiological version of this metric is the nearest diseased neighbor (NDN), the distance from a diseased individual to its closest diseased neighbor. However, NDN is usually quantified at one point in time after an outbreak has occurred and this lack of temporal resolution misses key information. Thus, we use the NPDN, the distance between a newly diseased coral colony and its closest neighbor that showed signs of SCTLD during the previous time point. NPDN measured distances between a diseased colony and colonies that posed a potential transmission risk.
We calculated the NPDN for all colonies that showed signs of SCTLD at each quadrat separately. Monte Carlo simulations were performed to assess the statistical significance of the observed NPDN values. We randomly sampled n new pairs of coordinates from the existing set of coordinates for susceptible colonies (each quadrat was considered separately), where n is the number of diseased colonies, and used those coordinates to calculate the NPDN distance for random diseased colonies. The random sampling and calculation steps were repeated 1000 times thus generating a null distribution of NPDN distance values. We calculated the P-value as the proportion of times the average NPDN distance of the simulated random diseased colonies was smaller than or equal to the average NPDN distance of the actual diseased colonies. A significant P-value (i.e., P-value < 0.05) indicates that the observed NPDN distance was significantly smaller than if diseased colonies were randomly distributed within the sample population, and thus the diseased corals were more clustered than expected.
Ripley’s K analyses were applied to the two quadrats with the most diseased colonies starting at the time points at which they had seven or more diseased colonies through the end of the surveys. We used a modified Ripley’s K analysis, similar to Muller and van Woesik (2012), to test for significant spatial clustering, but also to determine the radii of the clusters. The radius is the distance from a diseased coral colony that “healthy” corals are at risk for contagious disease transmission. Data were analyzed in R using functions from the spatstat package (Baddeley et al., 2015). The Ripley’s K statistic was standardized to account for spatial aggregation of susceptible individuals within the quadrats (see Zvuloni et al., 2009). The transformation, Besag’s L function was calculated as
where K(r) is the Ripley’s K statistic determined by the “Kest” function and r is the distance at which the Ripley’s K statistic was evaluated. When L(r) = 0, the spatial distribution was random. We generated a null distribution of L(r) by randomly sampling the locations of n (number of diseased colonies at the timepoint and quadrat) from all susceptible colonies in the quadrat 1000 times. L(r) was then calculated for only the diseased colony locations at each quadrat and timepoint and was compared to the null distribution. There was significant spatial clustering when the realized L(r) values were higher than the null distribution.
We further condensed the Ripley’s K analyses into three measures: the peak clustering radius (R), the range of significant clustering, and the area between the realized distribution of Besag’s L values for the diseased colonies and the top of the null distribution (area between the curves, ABC, see Supplementary Figure 2 for conceptual diagram). R, the peak clustering radius, was the radius at which the Besag’s L-value was highest above the null distribution. The range of significant clustering values included all radii where the Besag’s L-values were above the null distribution. While R and its range are commonly used when presenting the results of Ripley’s K analyses, the ABC value is often ignored. The ABC represents the magnitude of the differences between the Besag’s L-values of the diseased colonies and those of the null distribution, thus indicating the strength of clustering at the spatial scale measured.
Results
Temporal Dynamics of SCTLD
The total number of corals within each quadrat ranged from 225 to 470 (Supplementary Table 1). Species richness within each quadrat ranged from 9 to 14 species (Supplementary Figure 3 and Supplementary Table 1). Percent living coral cover as determined from the CPCe analysis significantly differed among sites (df = 2/9, F = 25.275, P < 0.001), but not among the three time points (df = 2/9, F = 1.014, P = 0.4) or with the interaction of site and time (df = 4/9, F = 1.391, P = 0.31; Figure 1C). Nearshore coral cover was initially significantly higher than both the mid-channel and offshore sites according to the post-hoc comparisons (Figure 1C). The nearshore site saw a decline in living coral from ∼ 26% to ∼ 13% coral cover.
Stony coral tissue loss disease was first observed within the offshore and mid-channel sites at the beginning of October 2018 (Supplementary Table 2), though the first comprehensive survey that indicated SCTLD presence at these two sites did not take place until October 30, 2018 (Figures 2A,B). Although SCTLD was not documented at the nearshore site until early February 2019, total disease prevalence (fraction of colonies affected by SCTLD over the entire study period) was highest at this site with the disease affecting 16% of all nearshore colonies (Figure 2C and Supplementary Table 1). Only 4–5% of mid-channel and offshore site colonies showed signs of SCTLD during the survey period (Supplementary Table 1).
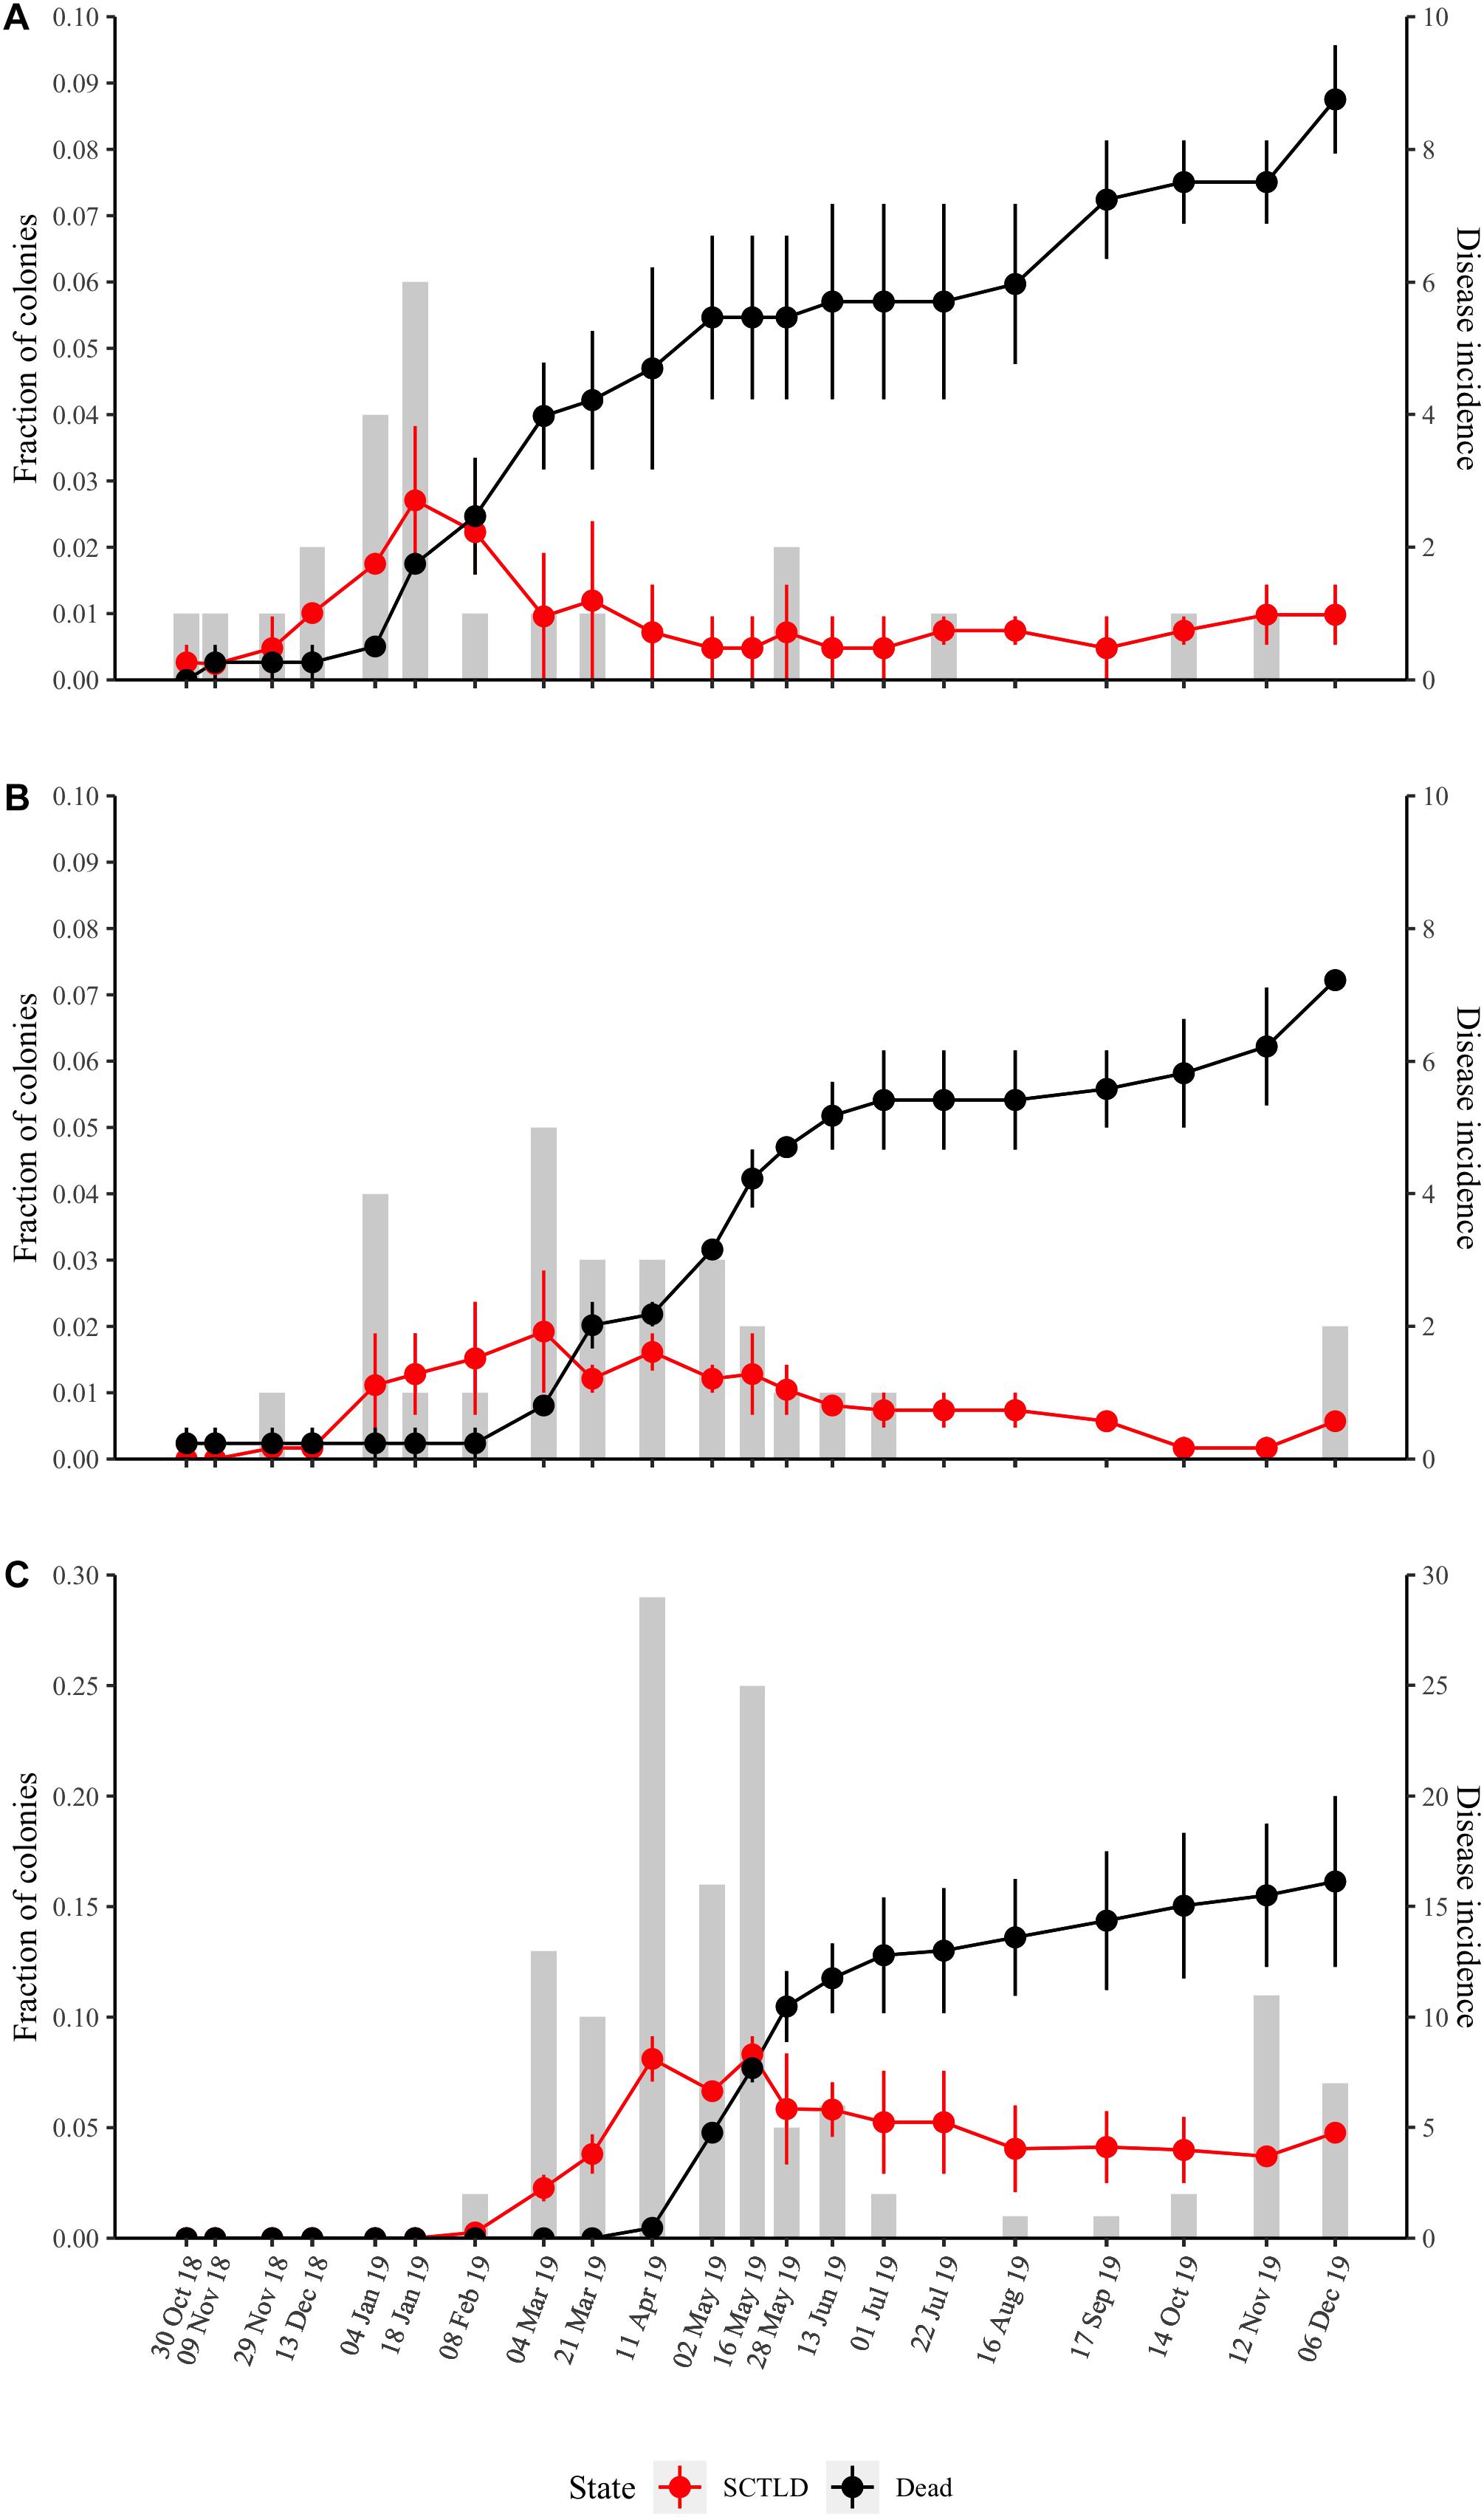
Figure 2. Temporal dynamics of SCTLD prevalence at the three sites (A) offshore, (B) mid-channel, (C) nearshore. The red line is the fraction of colonies showing disease signs (average of the two quadrats ± SE). The black line is the fraction of dead colonies (average of quadrat deaths ± SE). The total disease incidence (new disease cases per time point) is given by the gray bars and the right vertical axis.
Although disease onset varied by site (Figure 2), disease incidence across all sites peaked from the beginning of February to the end of May 2019 and then remained low throughout the summer months (Figure 3). The number of new disease occurrences began to increase again in the middle of October 2019 and remained elevated until the end of the study in December 2019. Progression rates (percent loss of living coral tissue per week) did not vary significantly among sites (P = 0.496) and the progression rate, as measured by percent loss between surveys, followed the same temporal pattern as total incidence (Figure 3).
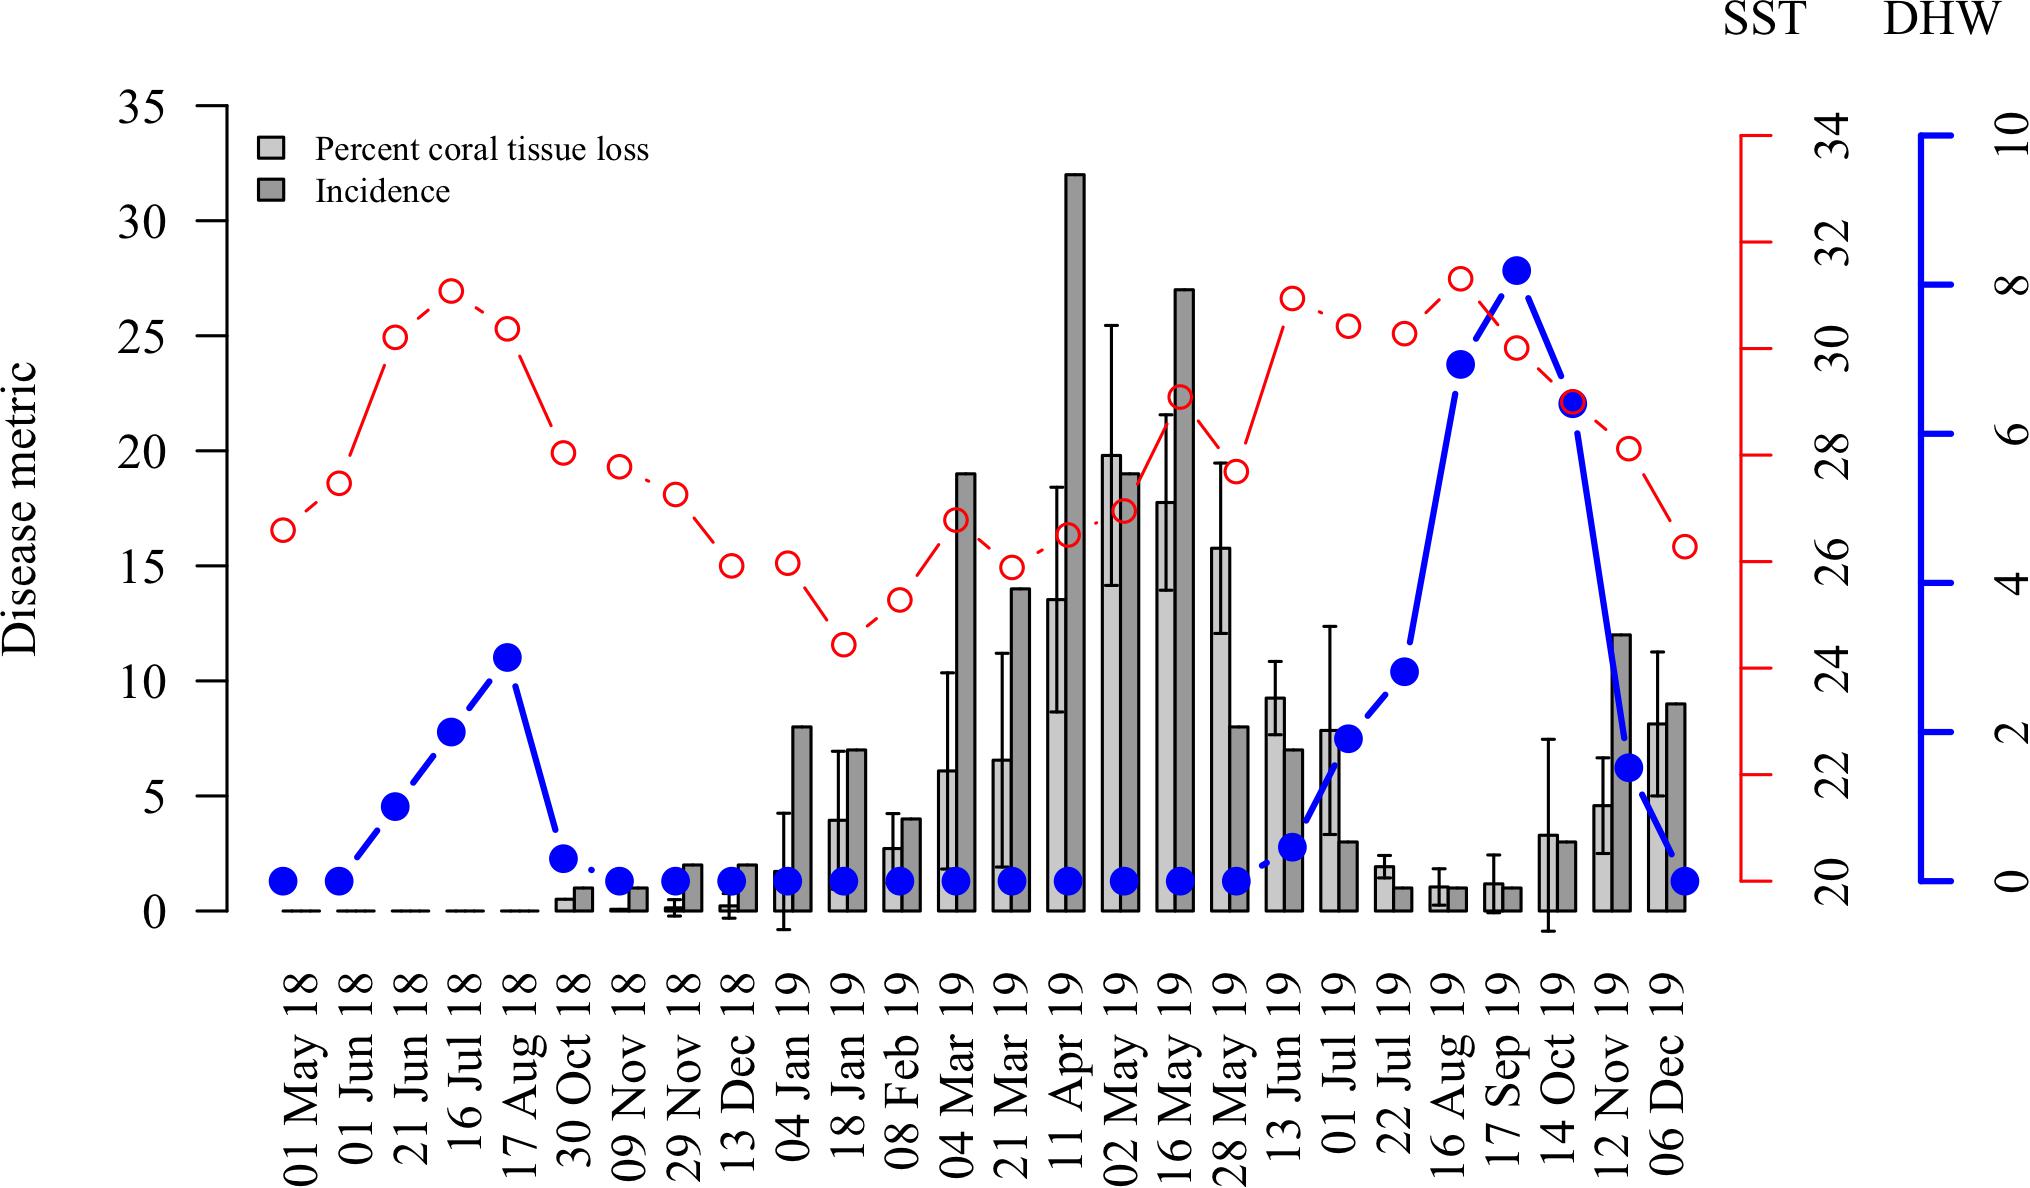
Figure 3. Temporal dynamics of the 2018–2019 SCTLD outbreak in the lower Florida Keys in relation to thermal stress during the study period. The red line represents the sea surface temperature (SST, °C) and the blue line with solid circles represents the degree heating weeks (DHW, °C weeks). Average percent of coral tissue loss recorded between surveys (per colony averaged across sites ± SE, light gray bars) and disease incidence (new disease cases, dark gray bars) negatively correlate with sea surface temperature (SST) and degree heating weeks (DHW).
In 2018, the maximum amount of heat stress that accumulated in the Florida Keys over a time period of 3 months during the summer was 5.3°C weeks (DHW), which is above the 4°C weeks threshold for coral bleaching and bleaching was observed at our survey quadrats. The accumulated thermal stress, DHW, dropped below 2°C weeks by mid-October. The first cases of SCTLD at our survey sites appeared in late October 2018. Cumulative thermal stress levels were above 3°C weeks from the end of July to the beginning of November 2019, during this time very little tissue loss or disease incidence was recorded (Figure 3).
Average progression rates and total incidence among sites were negatively associated with SST and DHW from January 4, 2019 when the disease incidence was first over five cases to the end of the surveys on December 6, 2019 (Figure 3). The average progression rate was not correlated with SST (cor = −0.21, P = 0.423, df = 15, t = −0.82); however, it was significantly negatively correlated with DHW (cor = −0.67, P < 0.01, df = 15, t = −3.49). Total incidence was significantly negatively correlated with both SST (cor = −0.56, P < 0.05, df = 15, t = −2.62) and DHW (cor = −0.78, P < 0.001, df = 15, t = −4.81).
Additionally, observations of thermal stress in colonies that became diseased were not significantly more frequent than in colonies that stayed healthy over the survey period (χ2 3.13, df = 1, P = 0.077). Only 30 of the 146 colonies that showed signs of SCTLD also showed signs of thermal stress and all showed signs of thermal stress before signs of SCTLD. One colony bleached after showing signs of SCTLD and then recovered from both bleaching and disease.
Colony and Reef Susceptibility to SCTLD
A total of 11 out of 21 surveyed species showed signs of SCTLD over the length of the study: D. stokesii (DSTO), C. natans (CNAT), P. strigosa (PSTR), M. cavernosa (MCAV), Solenastrea bournoni (SBOU), S. intersepta (SINT), O. annularis (OANN), S. siderea (SSID), D. labyrinthiformis (DLAB), Orbicella faveolata (OFAV), and Pseudodiploria clivosa (PCLI; Figure 4A and Supplementary Figures 3–6). Coral colony susceptibility to SCTLD significantly depended on the species of the colony (P < 0.001). The most susceptible species included P. strigosa (51% diseased and 62% mortality), P. clivosa (33% diseased and 40% mortality), D. stokesii (42% diseased and 68% mortality), D. labyrinthiformis (46% diseased and 70% mortality), and C. natans (61% diseased and 72% mortality; Supplementary Figures 3–6 and Supplementary Table 6).
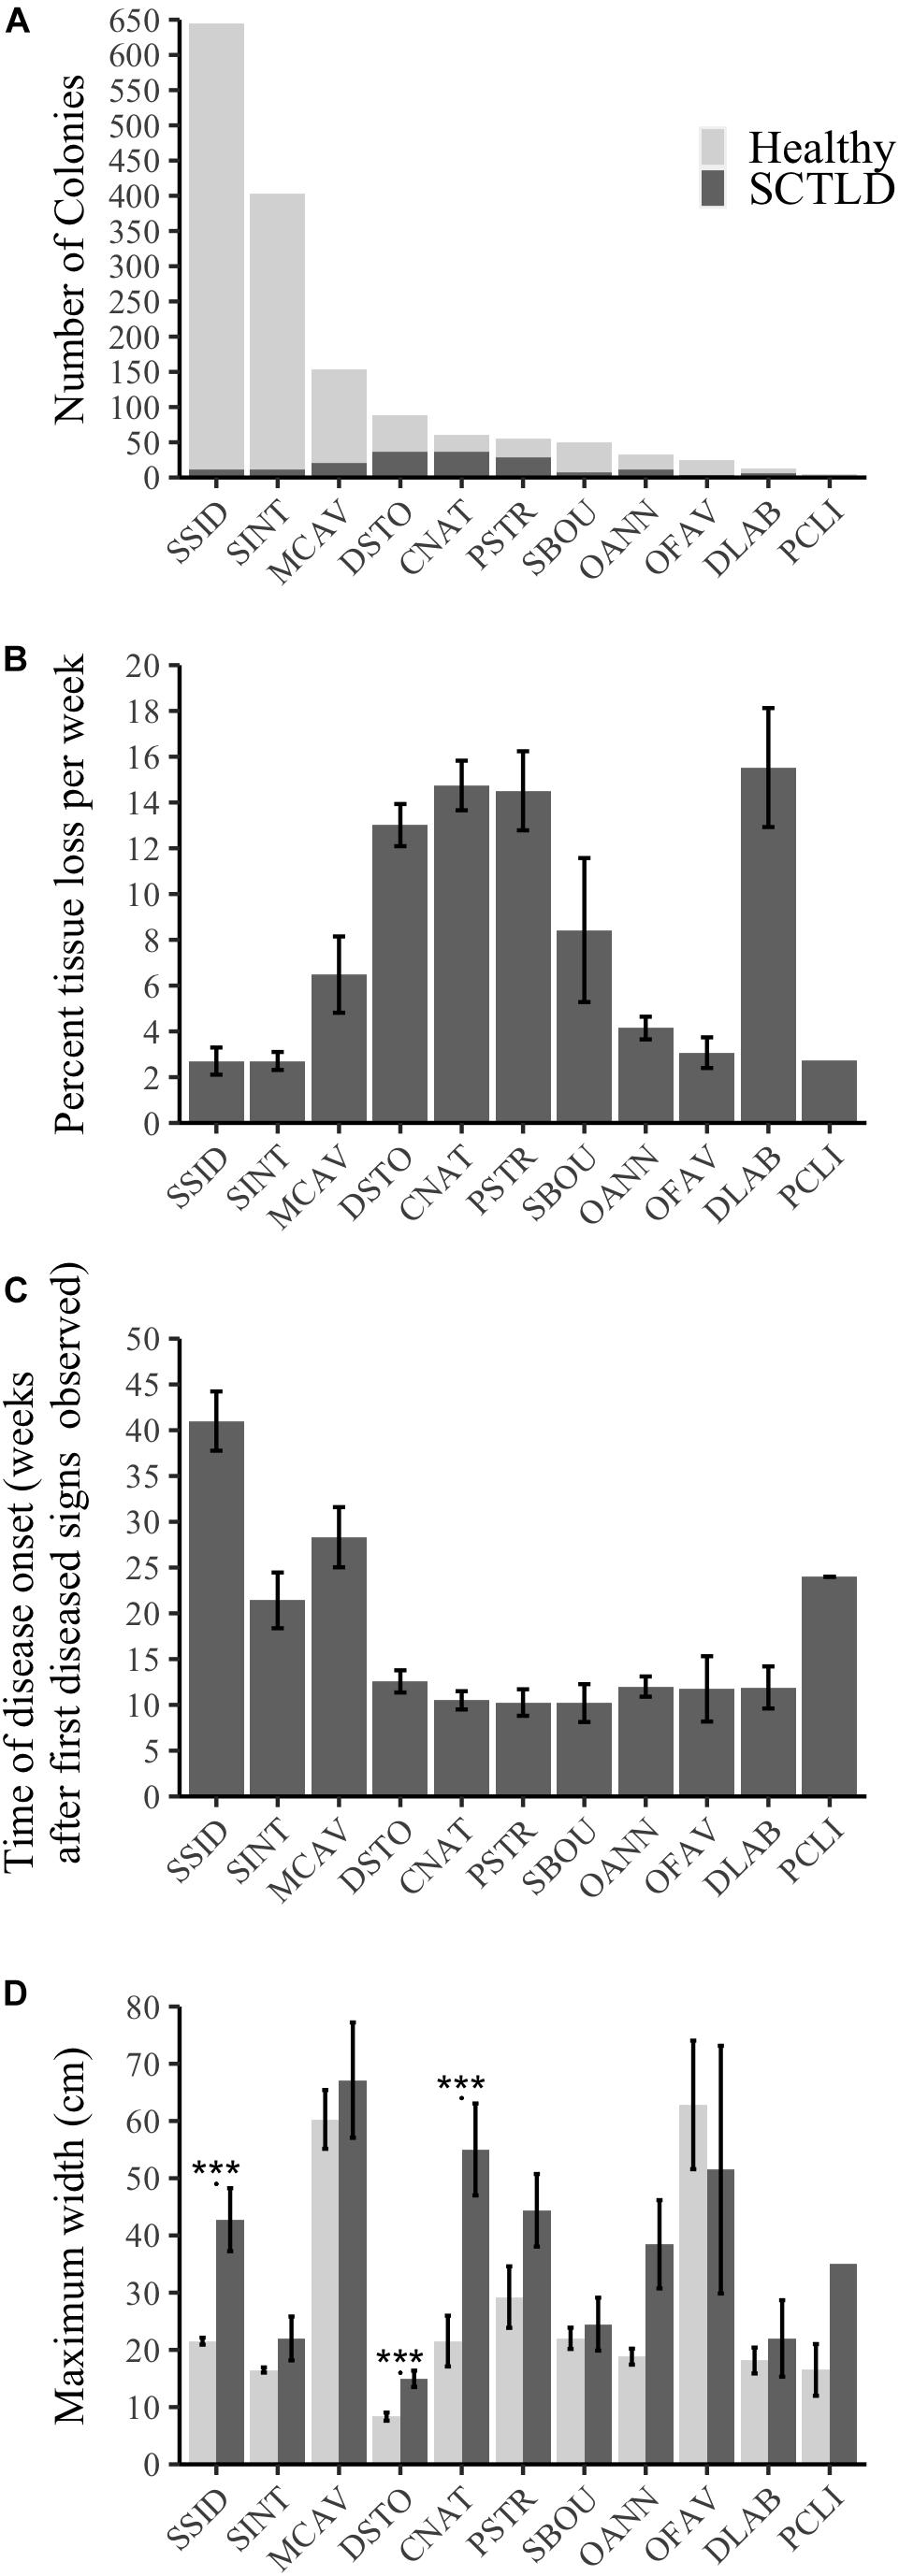
Figure 4. Species-specific susceptibility across all sites and the 11 species that showed signs of SCTLD as indicated by (A) number of colonies that showed signs of SCTLD over the survey period compared to those that stayed healthy, (B) progression rate measured as average percent living coral tissue loss per colony per week (±SE), (C) the timing of disease onset as measured by the average number of weeks a colony initially showed disease signs after the first diseased colony was seen at a site (±SE), (D) average maximum width (cm, ±SE) of healthy colonies and of those that showed disease signs for each of the 11 susceptible species. *** represents significant differences between healthy and diseased colonies within a species (P < 0.001).
There were significant differences in progression rates among species (Figure 4B, Kruskal–Wallis χ2 = 82.97, df = 10, P < 0.001). D. labyrinthiformis, C. natans, D. stokesii, and P. strigosa were among the species with the highest progression rates (∼13–15.5% tissue lost per week, Figure 4B). M. cavernosa and S. bournoni had medium to high progression rates (∼6.5–8.4% tissue lost per week), while S. intersepta, S. siderea, O. faveolata, P. clivosa, and O. annularis had slower progression rates (∼2.7–4.1% tissue lost per week, Figure 4B).
Dichocoenia stokesii was the first species with disease signs at both the offshore and mid-channel sites, while P. strigosa was the first to show disease signs at the nearshore site. D. stokesii and P. strigosa may be early indicator species of a new outbreak, however, most species (7 out of 11) showed disease signs within 10–13 weeks after the first sign of disease was observed at their respective sites (Figure 4C). The median time to disease onset, measured as the number of weeks after the first diseased observation was seen at a site, was 11.4 weeks (Figure 4C). S. intersepta, M. cavernosa, P. clivosa, and S. siderea all showed signs of disease much later (>20 weeks, Figure 4C).
Size was another indicator of colony-level susceptibility to SCTLD. Most corals (99.7%) were under 200 cm wide. Of the susceptible species, colonies that contracted SCTLD during the survey period were significantly larger than colonies that remained healthy (P = 0.004, Supplementary Figure 7). Only colonies of C. natans (P < 0.001), D. stokesii (P < 0.001), and S. siderea (P < 0.001) that showed disease signs were significantly larger than colonies within the same species that stayed healthy (Figure 4D).
Although we had a small sample size (n = 6), we explored how colony density, species richness, species diversity, relative abundance of the susceptible species, initial percent coral cover, and average colony size related to total disease prevalence at the quadrats. There was no relationship between the density of the coral colonies (number of colonies per m2) and the total disease prevalence (R2 = 0.17, P = 0.4115; Figure 5A). However, there was a significant relationship between the initial percent cover of living coral at a quadrat and the total disease prevalence experienced at that quadrat (R2 = 0.81, P = 0.015, Figure 5B). Total disease prevalence did not significantly increase with increasing richness (R2 = 0.32, P = 0.14, Figure 5C), but it did significantly increase with increasing diversity as measured by the Shannon diversity index of the coral community (R2 = 0.97, P < 0.001, Figure 5D). There was no significant relationship between the relative abundance of susceptible species and disease prevalence (R2 = −0.04, P = 0.41, Figure 5E). Disease prevalence was significantly higher at quadrats with large colonies (R2 = 0.96, P = 0.0005, Figure 5F).
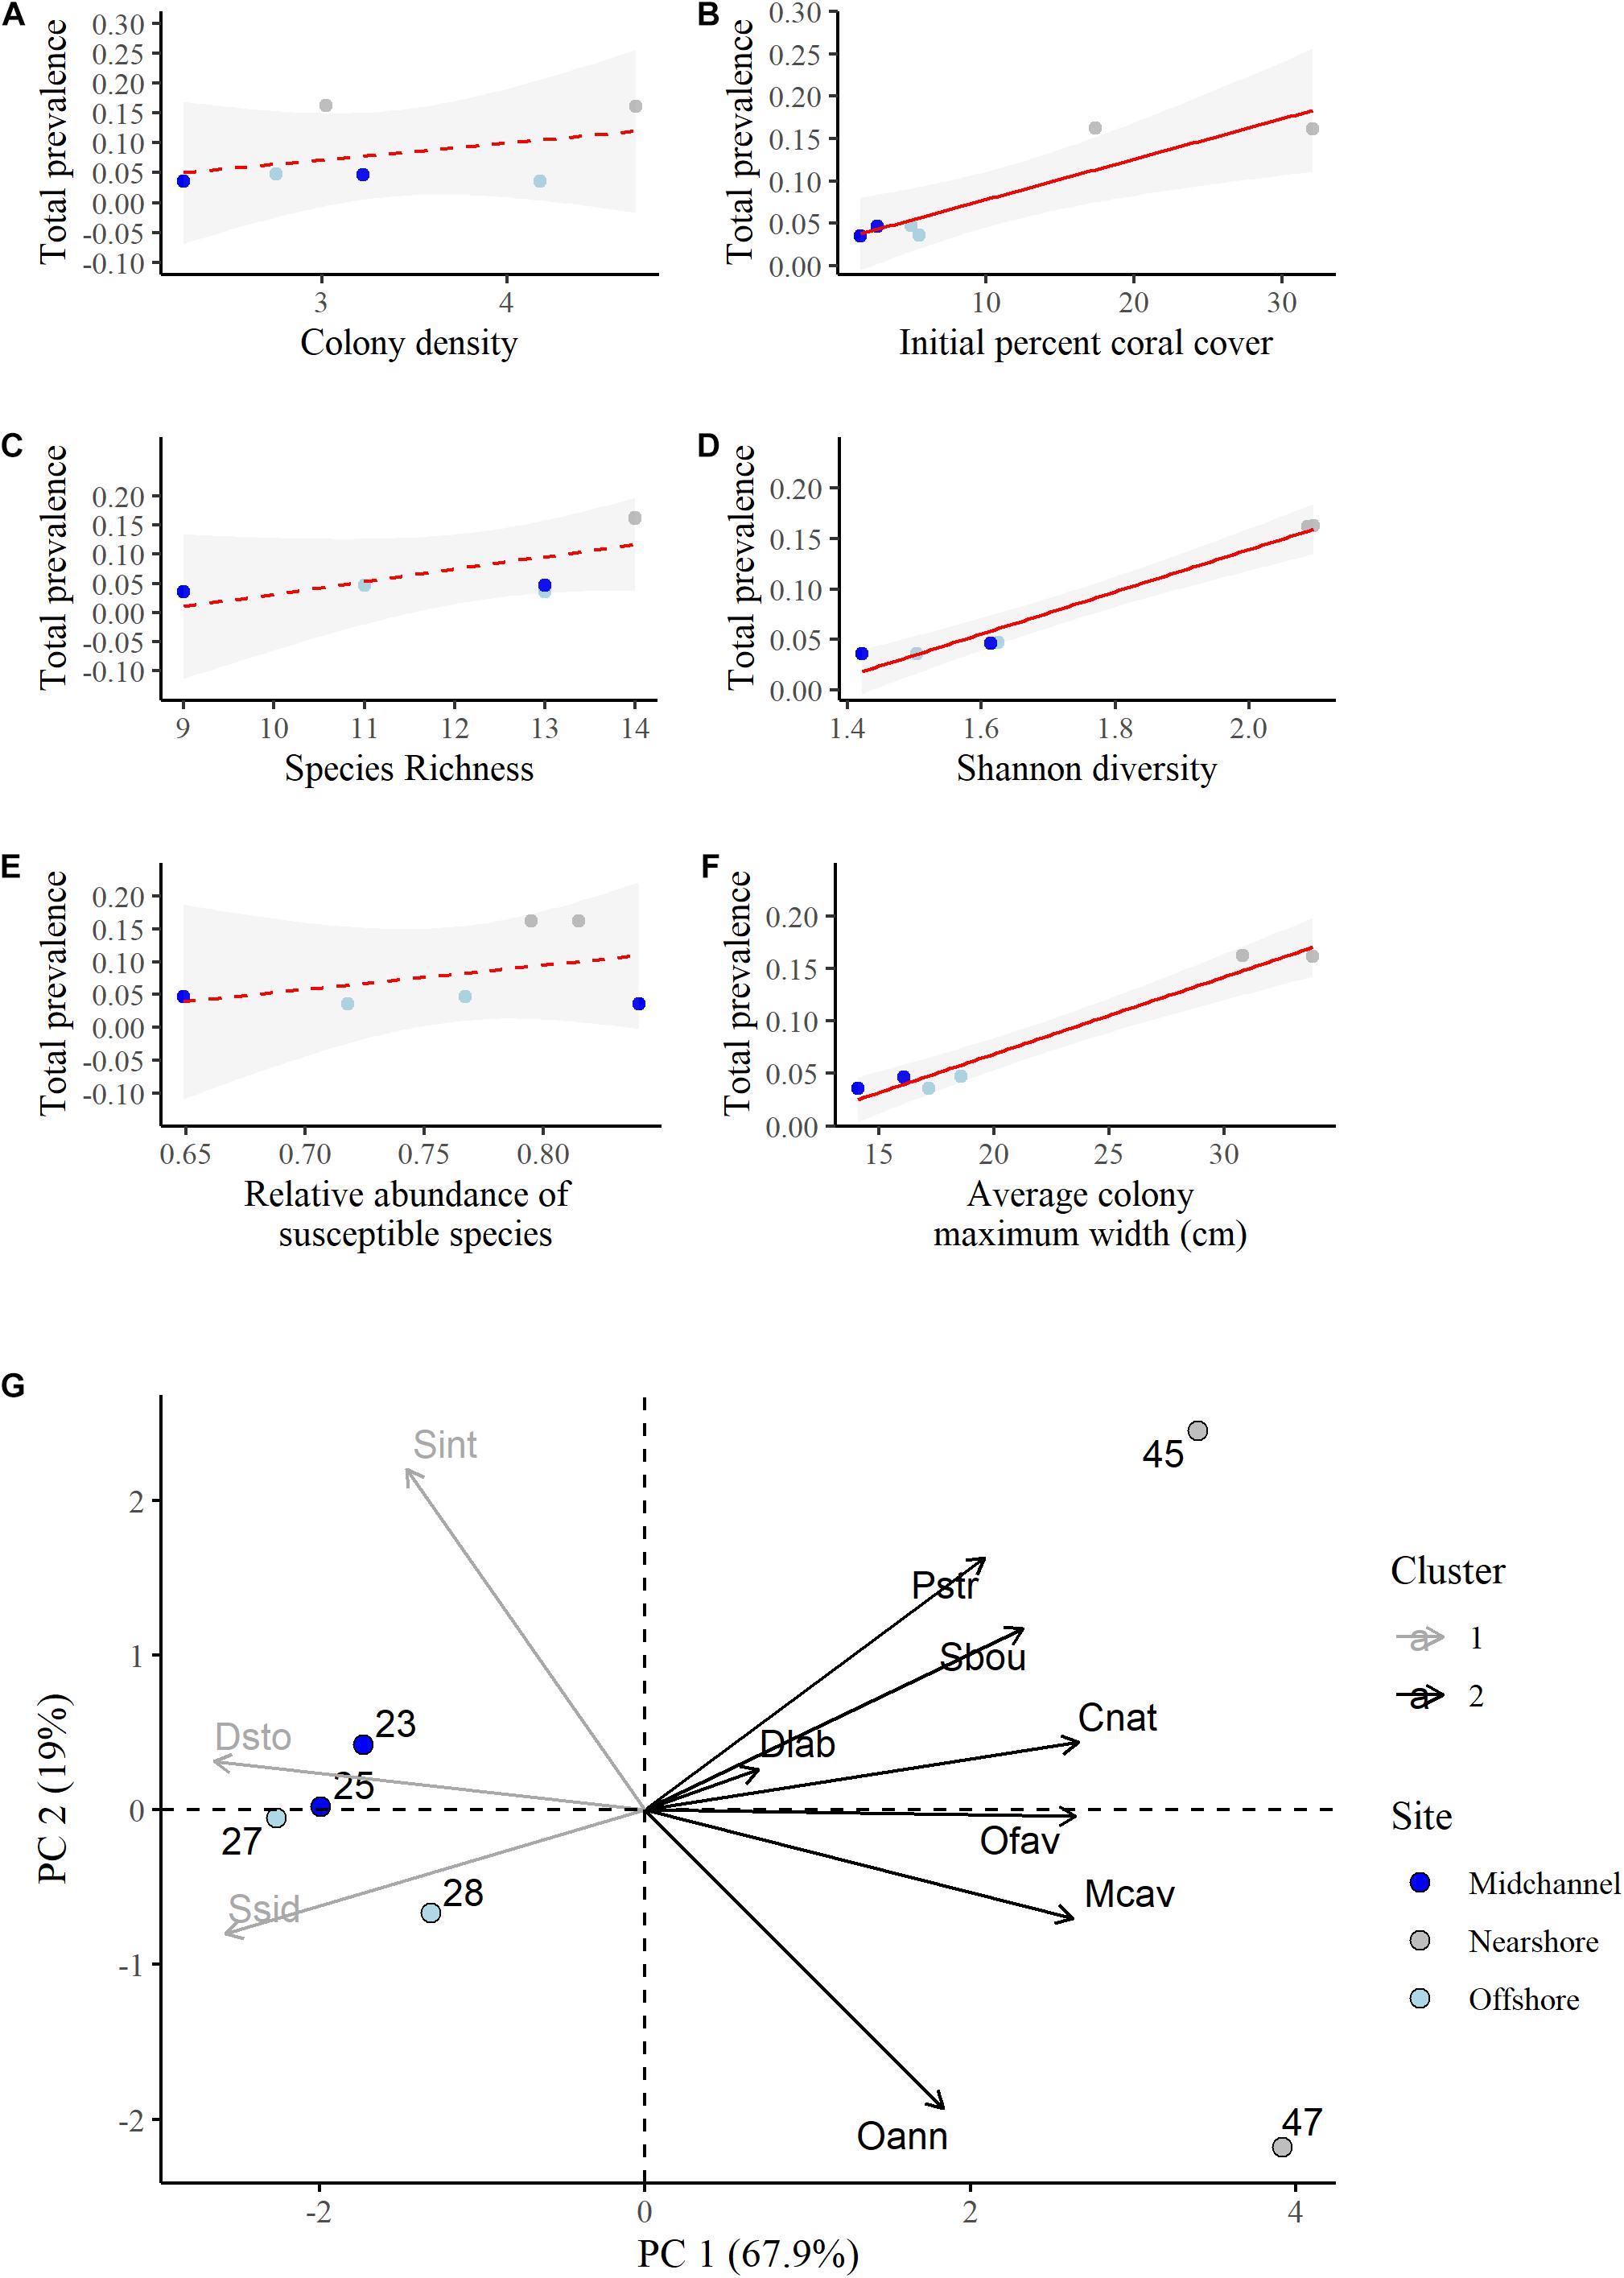
Figure 5. Linear regressions of total disease prevalence as a function of (A) colony density (number of colonies per m2), (B) initial percent living coral cover, (C) species richness, (D) Shannon diversity index, (E) relative abundance of susceptible species, (F) average colony maximum width (cm). Point colors represent site identity (nearshore, mid-channel, or offshore) of each quadrat. Red lines represent the best fit regressions and the shaded gray areas are the 95% confidence bands. (G) Principal component analysis biplot showing the proportion of variation in the species composition at each quadrat explained by each susceptible species. A survey quadrat on the same side as a given species (variable) has a higher abundance of this species. Positively correlated species are grouped together. Species that are close to the origin explain less of the variation in the data. Cluster identity was determined using the k-means method for two centers.
A principal components analysis was conducted to determine how species compositions, not just diversity, and individual species may have influenced differences in disease prevalence among the quadrats. While we found that there was no relationship between disease prevalence and the combined relative abundance of the susceptible species (Figure 5E), the PCA allowed us to determine the influence of each species separately. We discuss the results of the PCA on just the susceptible species here as it explained the variance in the data better and had the same overall results as the same analysis using all species (Supplementary Figures 8, 9). The first two principal components explained a total of 86.9% of the variance in the data (Figure 5G and Supplementary Table 3). P. strigosa, S. bournoni, C. natans, O. faveolata, M. cavernosa, and O. annularis were all positively associated and more abundant at the nearshore quadrats with higher disease prevalence. Of those species, C. natans, O. faveolata, and M. cavernosa were significantly positively correlated with the first principal component (Supplementary Table 4). D. labyrinthiformis was in this first group as well, however, that species contributed the least to the variance explained by the first two components (Supplementary Table 5). S. siderea, D. stokesii, and S. intersepta were all positively associated and more abundant in the mid-channel and offshore quadrats that had lower disease prevalence. Only S. siderea and D. stokesii were significantly negatively correlated with the first component (Supplementary Table 4).
Spatial Dynamics of SCTLD
Spatial patterns of diseased colonies were assessed for the two quadrats with more than 20 diseased colonies each, the nearshore quadrats. Distances between diseased colonies (quadrat 47 median = 4.7 m and quadrat 45 median = 4.5 m) were significantly less than distances between all colonies (quadrat 47 median = 5.0 m and quadrat 45 median = 4.8 m) at both quadrats (P < 0.001 for both tests), suggesting significant spatial clustering of diseased colonies (Figure 6). The average distance between the nearest previously diseased coral to a newly diseased coral (NPDN) was 1.2 ± 0.1 m at quadrat 47, and this distance was not significantly smaller than random as determined by the Monte Carlo simulations (P = 0.45). However, the NPDN distance determined for quadrat 45, 1.4 ± 0.1 m, was determined to be significantly smaller than the random simulations (P = 0.011).
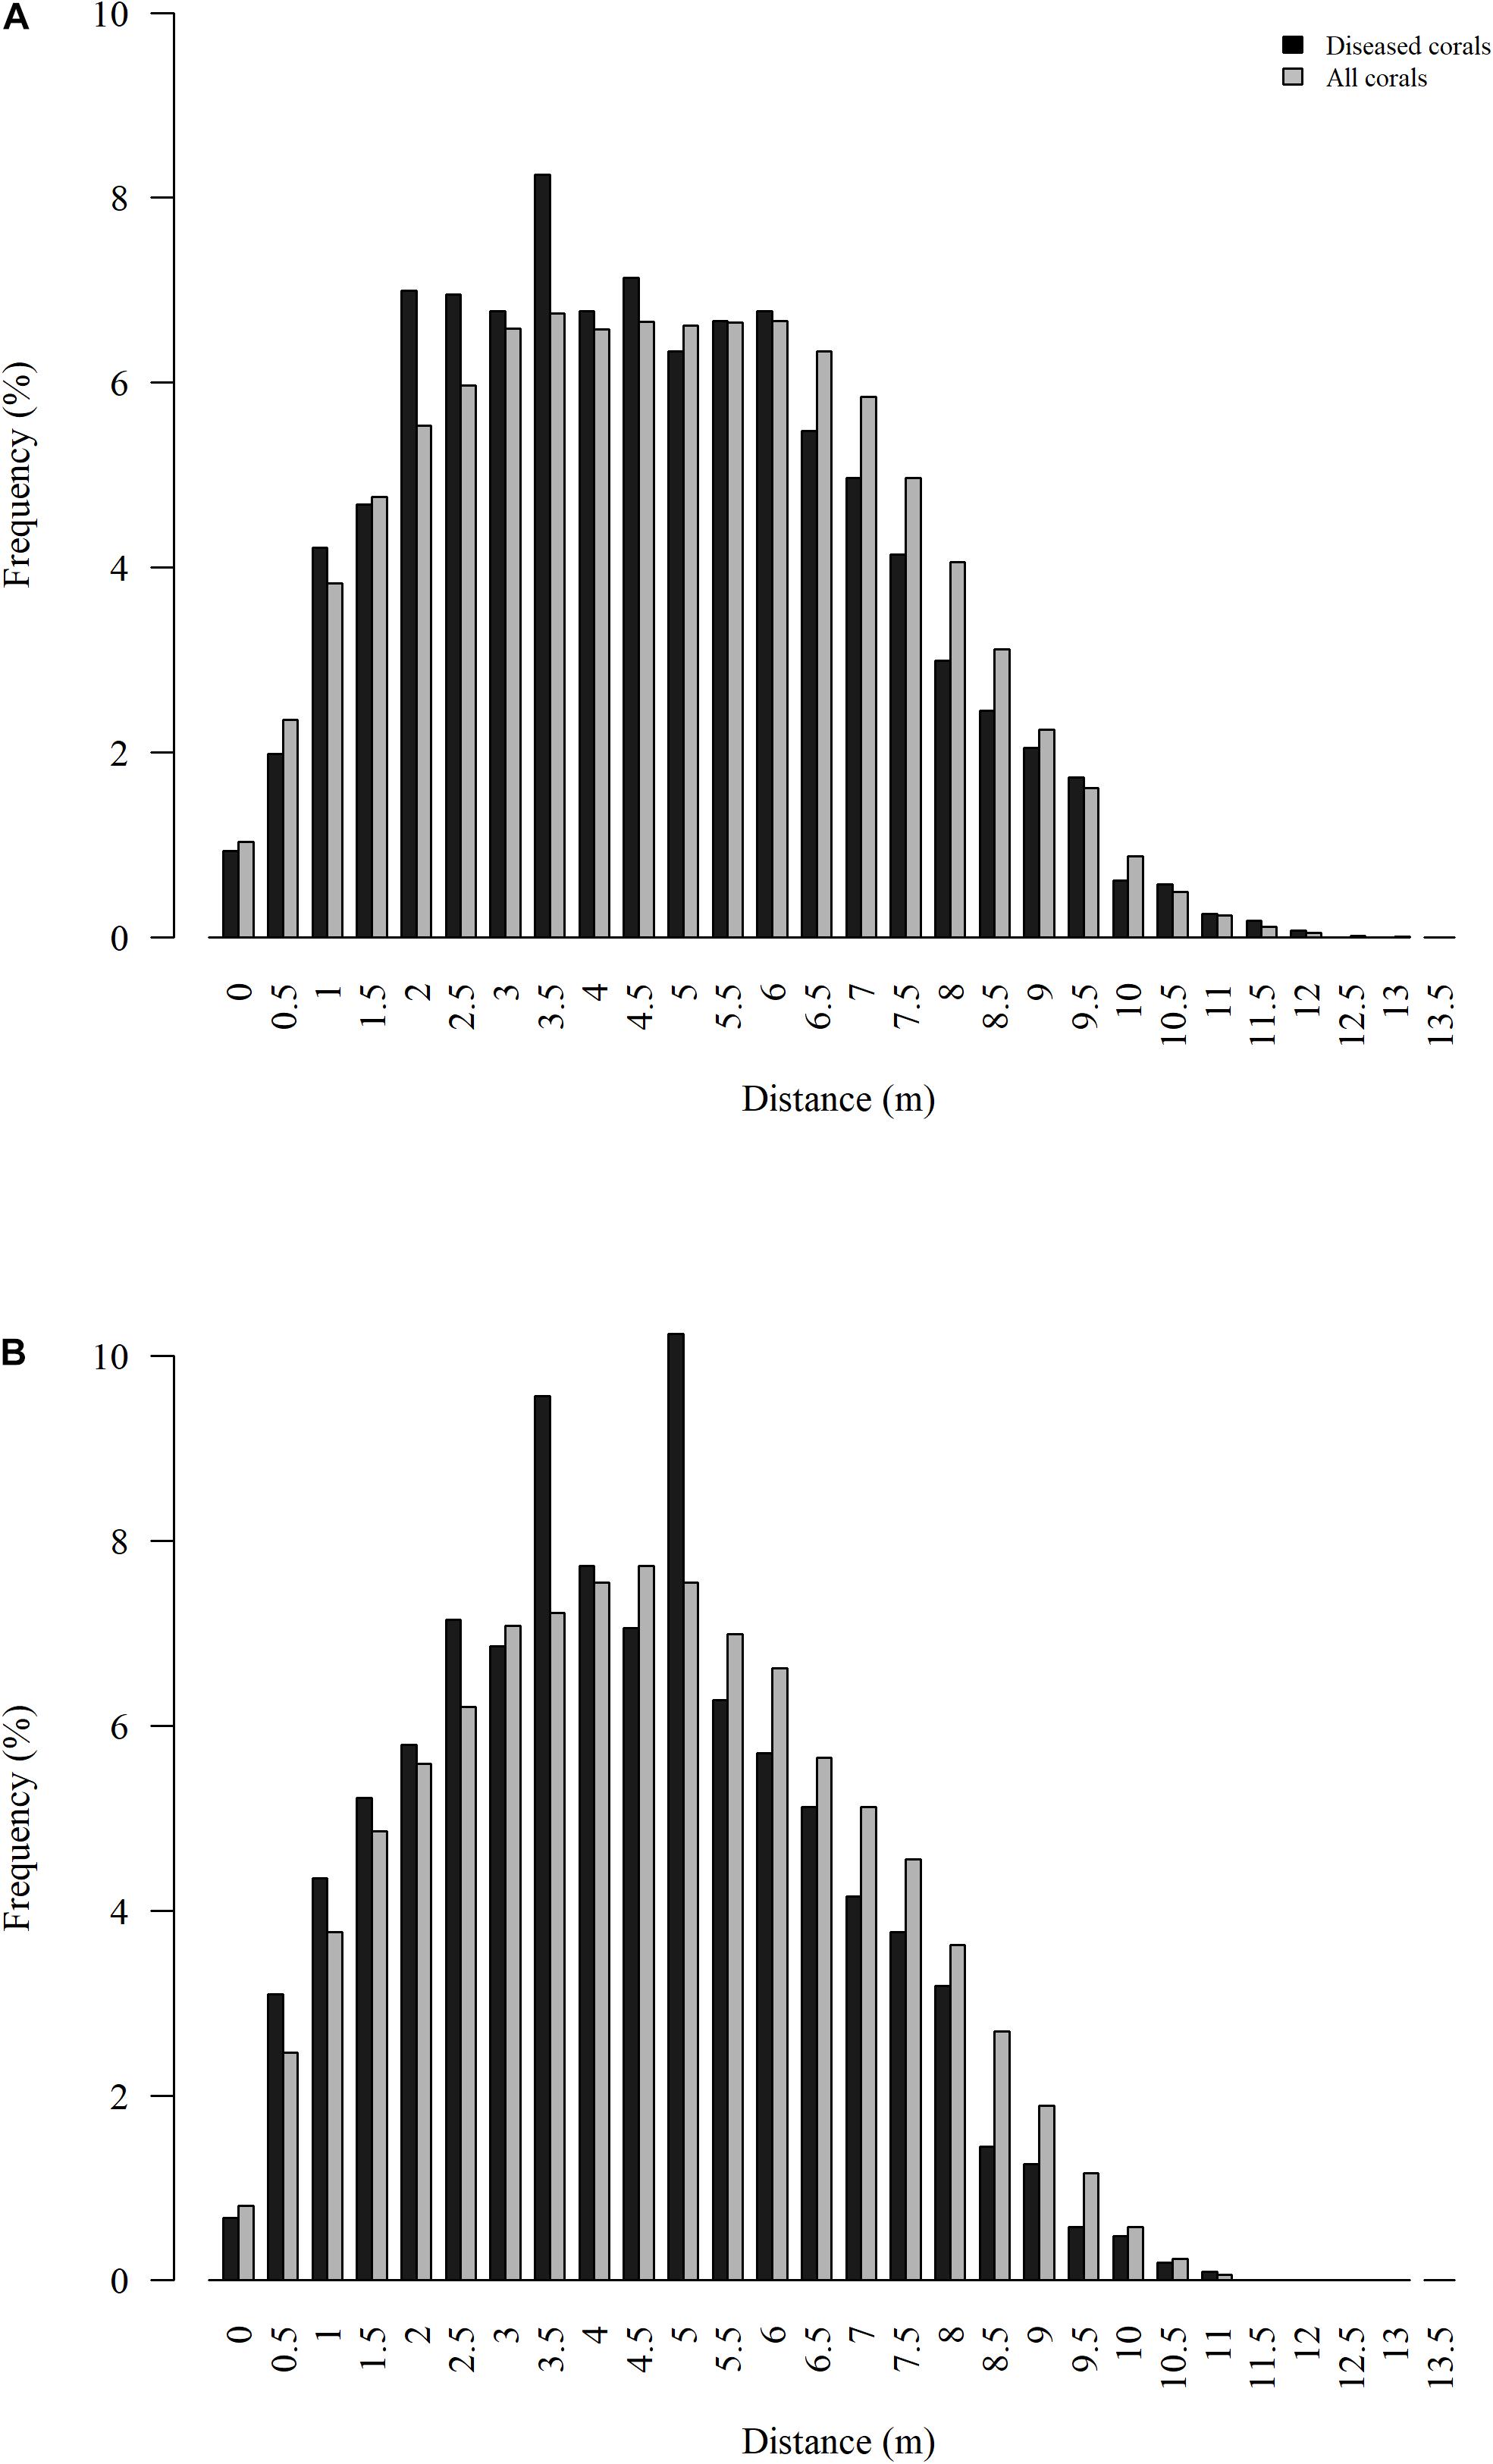
Figure 6. Distribution of Euclidean distances between all colonies surveyed (gray) and all colonies that showed signs of SCTLD (black) for nearshore quadrats 47 (A) and 45 (B).
Ripley’s K analyses were applied to the two nearshore quadrats to test whether the disease outbreak followed a predictable contagion spatial model through time. The two nearshore quadrats had high incidence levels from March through May 2019. Both quadrats experienced significant spatial clustering from March 2019 to the end of our survey period in December 2019 (Figure 7 and Supplementary Figures 10, 11). The peak clustering radius, R, and the range of significant clustering varied through time for both quadrats, as did the strength of clustering as measured by the area between the realized distribution of Besag’s L-values and the null distribution, the ABC.
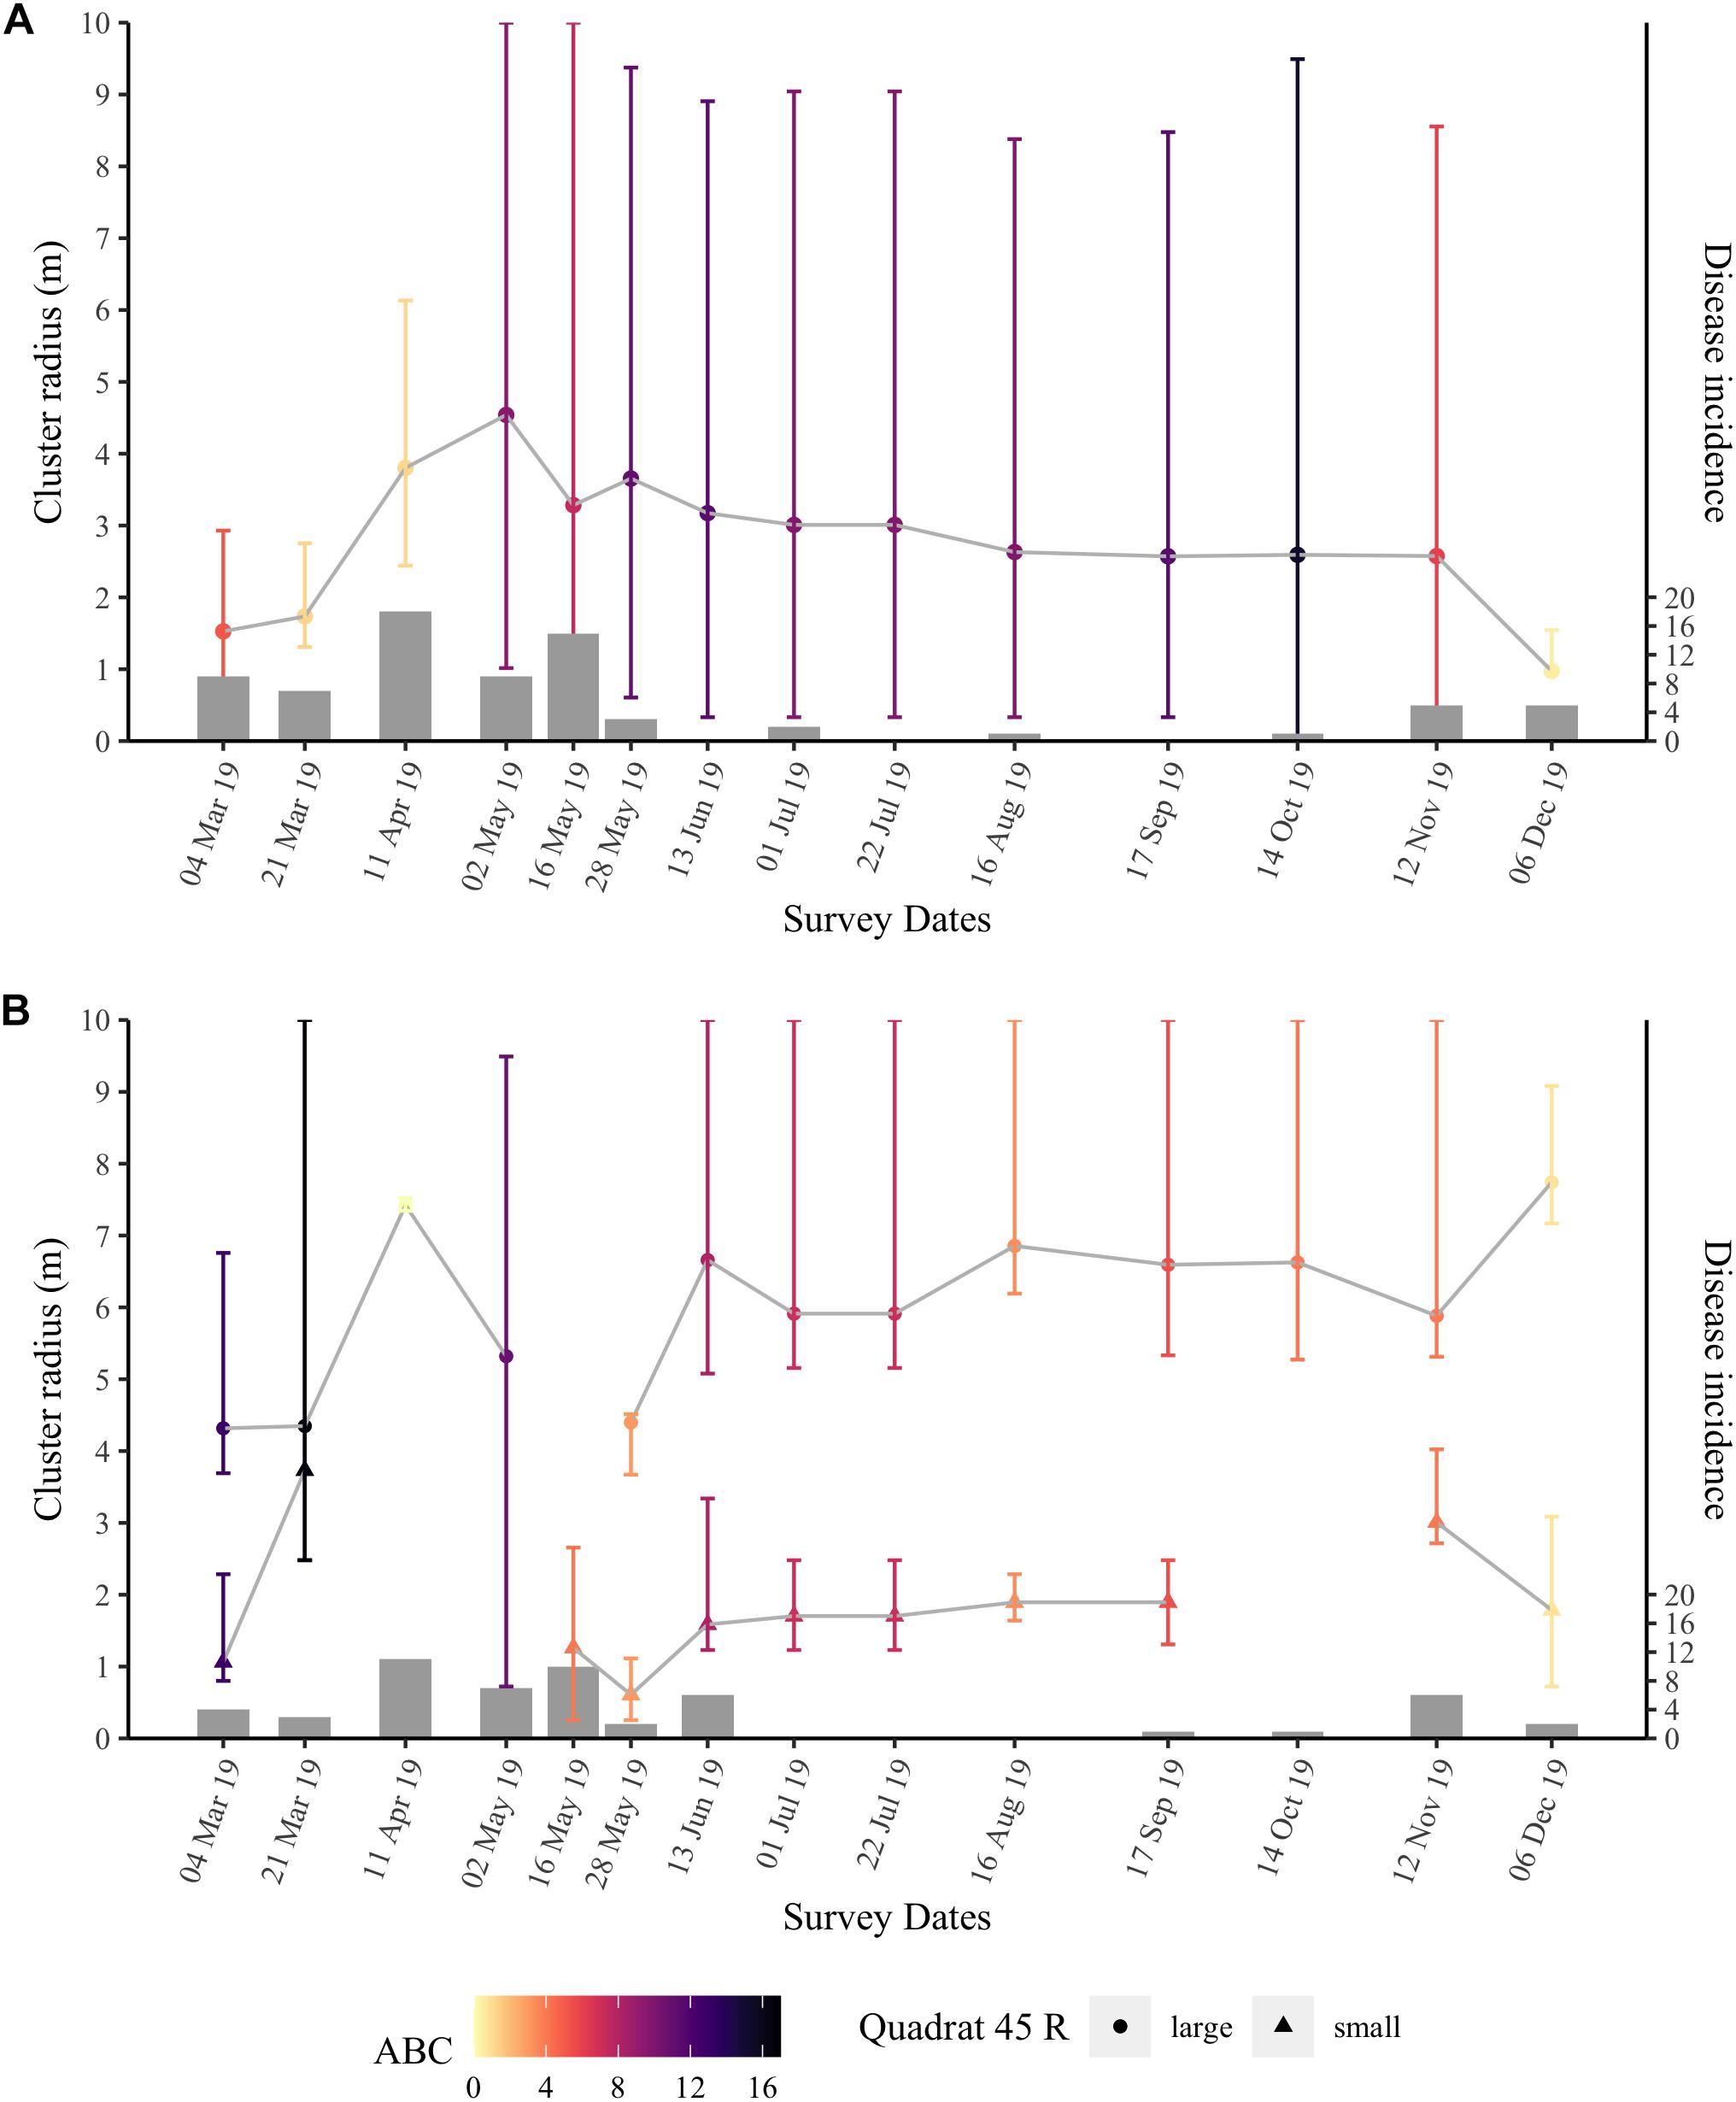
Figure 7. Ripley’s K results over time for quadrat 47 (A) and quadrat 45 (B) at the nearshore site. Points are the peak clustering radius R (m) with error bars representing the range of significant clustering. Quadrat 45 (B) typically had two peak clustering radii per time point, and thus are split by a large (circles) and a small R (triangles). Points are colored by the value of the area between the Besag’s L-values for the realized distribution of diseased colonies and those of the null distribution (ABC) that represents the strength of the significant clustering at the spatial scale considered. Bars are the number of new diseased colonies at each time point (right vertical axis).
Throughout the survey period, quadrat 47 had an average R of 2.8 ± 0.25 m. When SCTLD first appeared at quadrat 47, the area had high numbers of new cases in March (15) and April (18); during these months, the peak clustering radius, R, was between 1 and 4 m (Figure 7A). However, the low ABC values, i.e., low clustering strength, in late March (ABC = 1.25) and early April (ABC = 1.13) 2019 indicated that while SCTLD was starting to spread inside the quadrat, initial transmission may have occurred at a spatial scale larger than the quadrat. Disease incidence was high through May 2019, and the ABC increased to more than 3× that of the earlier months indicating that the disease was highly clustered and spreading among colonies in the quadrat. Additionally, in May, the peak clustering radius started to stabilize at ∼ 3 m and was consistent through November. Significant clustering ranged from 0 to 10 m within quadrat 47 indicating that disease clustering was widespread throughout the quadrat and likely extended beyond the boundaries of the quadrat. During the second large wave of disease incidence in November and December 2019, the significance level of the clustering (ABC) again decreased, as well as the peak clustering radius, suggesting that an influx of new cases again occurred at a spatial scale larger than the quadrat, rather than continued transmission from within the quadrat.
Ripley’s K analyses for quadrat 45 (Figure 7B) showed similar results to quadrat 47. However, quadrat 45 had a bimodal peak clustering radius, R. There was a significant cluster with an average R of 6 ± 0.30 m and another cluster with an average R of 1.8 ± 0.2 m, which were consistent through time. In quadrat 45, the ABC values were higher in March 2019 (ABC = 16.59) compared with April 2019 (ABC = 0.01) when the quadrat had its highest number of newly diseased colonies. These results suggest that there was little to no significant spatial clustering at that time and transmission was occurring over a spatial scale larger than the quadrat. The small cluster disappeared in April and at the first time point in May when incidence was relatively high. Quadrat 45 had smaller ABC values than quadrat 47 from late May through November. Similarly to quadrat 47, the peak clustering radii at the large and small cluster stabilized during the summer months and the ABC value for quadrat 45 was reduced as incidence increased again in November and December.
Discussion
We determined temporal and spatial patterns of this unprecedented outbreak among reefs on a nearshore to offshore gradient (∼ 1 km) and within reefs (10’s of m) as SCTLD moved through the lower Florida Keys, from October 2018 through December 2019. Our fine-scale observations of the spatial pattern of SCTLD spread confirmed the contagious nature of the disease within a reef scale. The data collected in the present study helped characterize the effect of temperature on SCTLD dynamics, colony and reef level indices of susceptibility, and patterns of transmission within a reef scale – all important parameters for future modeling and management efforts.
Temporal Dynamics of SCTLD and Relation to Thermal Stress
Muller et al. (2020) did not find a significant relationship between SCTLD presence and sea surface temperatures, however, the present study documented a significant negative correlation between SCTLD (incidence and progression) and thermal stress (SST and DHW) from January to December 2019. Few new cases occurred during the summer months when thermal stress was highest and disease progression slowed considerably. A similar negative correlation was quantified between progression rates of SCTLD and DHW in St. Thomas, United States Virgin Islands (Meiling et al., 2020) and a decline in SCTLD activity coincided with increasing water temperatures in the Middle Keys in 2018, but not in 2019 (Sharp et al., 2020). Within the present study, there appeared to be a threshold at approximately 2–3°C weeks (DHW) of accumulated thermal stress where the disease stopped progressing, and thus the diseased material in the coral tissue was no longer sloughing off into the water potentially transmitting to new corals as supported by the low incidence values. These findings could be the result of other seasonal environmental differences not studied here, however, our study and others (Meiling et al., 2020; Sharp et al., 2020) indicate that temperature may have an important influence on SCTLD dynamics.
Furthermore, from our observations of physiological signs of stress (bleaching and/or paling) we did not find evidence of thermally stressed corals being more at risk to SCTLD. Typically, similar tissue loss diseases like white plague, white pox, and white band increase in severity with increasing thermal stress, likely because of increased host susceptibility after bleaching or increased pathogen abundance at higher temperatures (Rosenberg and Ben-Haim, 2002; Muller et al., 2008; Brandt and McManus, 2009; Cróquer and Weil, 2009; Miller et al., 2009; Muller and van Woesik, 2014; van Woesik and Randall, 2017). Our results indicate that SCTLD dynamics may have an inverse relationship with temperature and thermal stress. However, more fine-scale, repeated observations of individual coral health during and after bleaching events, as well as laboratory-based experiments, are needed to relate water temperature, bleaching severity, and SCTLD incidence over longer time scales.
Species and Size Specific Susceptibility to SCTLD
A total of 11 out of the 21 surveyed species showed signs of SCTLD during our survey period and additional metrics confirm species-specific differences in susceptibility. In contrast with other studies (Precht et al., 2016; Walton et al., 2018; Alvarez-Filip et al., 2019; Estrada-Saldívar et al., 2020), we did not see signs of SCTLD on Meandrina meandrites or E. fastigiata; however, these species had low abundances (one M. meandrites) or were absent (E. fastigiata) at our sites. Our study found that P. strigosa, D. stokesii, C. natans, and D. labyrinthiformis were the most susceptible species to SCTLD and had the fastest progression rates, ∼ 14% of colony tissue lost per week. Our results are similar to those found in the middle Florida Keys by Sharp et al. (2020). These species were also some of the earliest species showing signs of SCTLD at our sites and may serve as early indicators of SCTLD outbreaks on reefs. Orbicella spp., M. cavernosa, S. intersepta, and S. siderea had considerably slower progression rates compared with the other species monitored. These species may be more likely to sustain local SCTLD outbreaks as they shed diseased material for longer periods of time compared to species with faster progression rates.
Large colonies of the susceptible species were at greater risk of showing SCTLD signs compared with small colonies as was also found in the Middle Keys (Sharp et al., 2020). In fact, the average size of diseased colonies was twice as large (average maximum width of 40 cm) compared with healthy colonies (average maximum width of 20 cm). Moreover, this result held for individual species. Large colonies of S. siderea, D. stokesii, and C. natans were significantly more likely to show disease signs. The same trend was clear in most of the other eight species, although it was not significant. These results suggest that colonies with a large surface area may be more susceptible to the disease because of a higher probability of interacting with a waterborne pathogen. Large corals are also more likely to suffer from other diseases such as Montipora capitata disease (Caldwell et al., 2018) and white pox disease (Muller and van Woesik, 2014). Alternatively, large colonies may be older and suffer senescence, thus making them more susceptible to pathogenic agents (Bak, 1983).
Indicators of Reef Susceptibility to SCTLD
The highest prevalence of SCTLD was documented within the highly diverse, low colony density, high coral cover, nearshore reef site with large corals. Although signs of SCTLD appeared at the offshore and mid-channel sites first, the greatest disease prevalence was documented within the nearshore site. Nearshore reef coral cover went from ∼ 25 to 13% live coral cover within just a few months. These results are in contrast to Rippe et al. (2019) which showed that offshore reefs had greater disease severity compared with nearshore reefs. Additionally, Muller et al. (2020) documented that diverse and deep reefs (i.e., offshore) were more likely to be affected by SCTLD compared with shallow less diverse sites. The differences in SCTLD dynamics across the nearshore to offshore gradient between the results of Rippe et al. (2019) and Muller et al. (2020) with that of the present study may be from geographical differences in SCTLD dynamics and reef communities as the data sets in the two previous studies focused on the South Florida and upper Keys regions, whereas the present study was located in the lower Florida Keys. Previous studies on the coral community composition indicate significant differences in the biological construct within the different ecological zones of the Florida reef tract (Marszalek et al., 1977; Murdoch and Aronson, 1999; Burman et al., 2012). Differences in these coral assemblages may be influencing the disease dynamics. Within the present study, the depth of the offshore site did not differ from the mid-channel and nearshore sites, and we saw the opposite pattern in diversity (a more diverse nearshore site). Furthermore, environmental conditions change throughout the reef area, which could be altering susceptibility of reef sites (Szmant and Forrester, 1996; Manzello, 2015).
Our results and those of Muller et al. (2020) showed that diverse reefs were more affected by SCTLD. Quadrats at all sites had a similar number of species present (species richness ranged from 9 to 14) and had high relative abundances of susceptible species (∼65–85%). However, species composition, not just overall diversity, varied by quadrat and influenced SCTLD dynamics. Specifically, we found that reefs with higher abundances of C. natans, O. faveolata, and M. cavernosa suffered more severe effects of SCTLD. In accordance with our result of higher SCTLD prevalence on large colonies, these highly susceptible species are often large reef-building corals. Both M. cavernosa and O. faveolata had slower progression rates and were thus shedding disease particles onto the reef for longer, perhaps sustaining the local outbreak. Susceptible species with large biomass, like M. cavernosa and O. faveolata, may act as potential super-spreaders shedding large amounts of disease agents into the water column. These colonies should be targeted first for treatment (Neely et al., 2020) or when considering other mitigation techniques to slow the outbreak.
Contagion Dynamics of SCTLD
When examining only coral species susceptible to SCTLD in this study and limited to the two quadrats with the most disease presence, diseased coral colonies were more clustered than healthy colonies suggesting a contagious mode of transmission for SCTLD within a reef. The median distance between all corals that showed signs of SCTLD during our survey period was ∼ 4.6 m. The average distance between the nearest previously diseased colony and a newly diseased colony (NPDN distance) was ∼ 1.2–1.5 m. These results indicate that colonies within 1.5 m of a diseased coral are at a higher risk of subsequently showing disease signs compared with those at a larger distance. Our fine scale monitoring allowed us to calculate this NPDN distance, which improves upon the NDN distance used throughout disease ecology because it considers the temporal disease dynamics.
Results of the Ripley’s K tests on the two quadrats with the highest disease prevalence indicated that the radius of transmission during local transmission may extend to ∼ 3 m and that there was significant clustering throughout the spatial scale of our quadrats (10’s of meters), again supporting a contagious mode of transmission for SCTLD. Taken with the NPDN result, corals within 1.5–3 m of a diseased coral are at a higher risk of becoming diseased on the local, reef scale of 10 m. This transmission risk distance is similar to that of black band disease as also determined using Ripley’s K analysis (Zvuloni et al., 2009). Black band disease is considered to be contagious and transmitted through the water column (Zvuloni et al., 2009), thus the similar transmission distances may be a function of local hydrodynamics on a reef.
While the Ripley’s K results indicated significant clustering throughout the study period, the strength of the significant clusters (ABC values) decreased when there were many new diseased colonies. This indicates that the transmission may often also occur on a scale larger than was measured in the present study (10 m). Thus, initial transmission events came from outside the surveyed area, potentially from much farther away, before there was local transmission within the quadrats, supporting a contagious disease model for SCTLD over large and small spatial scales. Muller et al. (2020) showed significant clusters on the scale of tens of kilometers at annual time steps also supporting the conclusion that SCTLD transmits at large spatial scales even over short periods of time.
Conclusion
Stony coral tissue loss disease has devastated the reefs of Florida since 2014 causing further declines in an already depauperate reef system. Although prevalence reached only a maximum of 16%, within the nearshore reef, this translated to a ∼ 50% decline in coral cover during the 19 months of the study. This site was also the most diverse and had the highest coral cover with the largest corals. These results suggest that some of the last vestiges of diverse coral reefs are at the greatest risk of decline from this disease outbreak. SCTLD, which has spread throughout the Caribbean, is arguably the largest and most deadly coral disease outbreak ever recorded. The present study provided novel insights into the epizootiology of SCTLD and showcased the advantage of fine scale spatial and temporal observations. As the frequency and severity of coral disease outbreaks continue to increase (Ward and Lafferty, 2004; Maynard et al., 2015), diverse and multi-strategic approaches are needed to address this ongoing driver of coral reef decline. Further assessments to characterize the disease dynamics, spatial epidemiology, and treatment options for SCTLD are essential for preventing or reducing the impacts of future disease outbreaks within our oceans.
Data Availability Statement
The datasets and analyses presented in this study can be found at the online repository: https://github.com/saradwms/SCTLDepizootiology_lowerFLkeys.
Author Contributions
EM acquired the funding for the project and designed the study. CW conducted the field research and data collection. SW performed statistical analyses and modeling. SW and EM wrote the manuscript. All authors contributed to the article and approved the submitted version.
Funding
Funding for this study was provided by a Florida Fish and Wildlife Conservation State Wildlife Grant, FWC Agreement Number: 16007. Field surveys associated with this project were conducted under permit FKNMS-2016-081.
Conflict of Interest
The authors declare that the research was conducted in the absence of any commercial or financial relationships that could be construed as a potential conflict of interest.
Acknowledgments
We would like to acknowledge Raymond Banister, Joseph Kuehl, Erich Bartels, and Katherine Eaton for assistance with data collection.
Supplementary Material
The Supplementary Material for this article can be found online at: https://www.frontiersin.org/articles/10.3389/fmars.2021.631776/full#supplementary-material
References
Aeby, G. S., Bourne, D. G., Wilson, B., and Work, T. M. (2011). Coral diversity and the severity of disease outbreaks: a cross-regional comparison of Acropora White Syndrome in a species-rich region (American Samoa) with a species-poor region (Northwestern Hawaiian Islands). J. Mar Biol. 2011:490198. doi: 10.1155/2011/490198
Aeby, G. S., Ushijima, B., Campbell, J. E., Jones, S., Williams, G., Meyer, J. L., et al. (2019). Pathogenesis of a tissue loss disease affecting multiple species of corals along the Florida reef tract. Front. Mar. Sci. 6:678. doi: 10.3389/fmars.2019.00678
Alvarez-Filip, L., Estrada-Saldívar, N., Pérez-Cervantes, E., Molina-Hernández, A., and González-Barrios, F. J. (2019). A rapid spread of the stony coral tissue loss disease outbreak in the Mexican Caribbean. PeerJ 7:e8069. doi: 10.7717/peerj.8069
Baddeley, A., Rubak, E., and Turner, R. (2015). Spatial Point Patterns: Methodology and Applications with R. Boca Raton, FL: CRC Press.
Bak, R. P. M. (1983). Neoplasia, regeneration and growth in the reef-building coral Acropora palmata. Mar. Biol. 77, 221–227. doi: 10.1007/bf00395810
Brandt, M. E., and McManus, J. W. (2009). Disease incidence is related to bleaching extent in reef−building corals. Ecology 90, 2859–2867. doi: 10.1890/08-0445.1
Bruckner, A. W., Bruckner, R. J., and Williams, E. H. Jr. (1997). Spread of a black-band disease epizootic through the coral reef system in St. Ann’s Bay, Jamaica. Bull. Mar Sci. 61, 919–928.
Bruno, J. F., Selig, E. R., Casey, K. S., Page, C. A., Willis, B. L., Harvell, C. D., et al. (2007). Thermal stress and coral cover as drivers of coral disease outbreaks. PLoS Biol. 5:e124. doi: 10.1371/journal.pbio.0050124
Burge, C. A., Friedman, C. S., Getchell, R., House, M., Lafferty, K. D., Mydlarz, L. D., et al. (2016). Complementary approaches to diagnosing marine diseases: a union of the modern and the classic. Phill. Trans. R Soc. B Biol. Sci. 371:20150207. doi: 10.1098/rstb.2015.0207
Burman, S. G., Aronson, R. B., and van Woesik, R. (2012). Biotic homogenization of coral assemblages along the Florida reef tract. Mar. Ecol. Prog. Ser. 467, 89–96. doi: 10.3354/meps09950
Caldwell, J. M., Aeby, G., Heron, S. F., and Donahue, M. J. (2020). Case-control design identifies ecological drivers of endemic coral diseases. Sci. Rep. 10:2831.
Caldwell, J. M., Donahue, M. J., and Harvell, C. D. (2018). Host size and proximity to diseased neighbours drive the spread of a coral disease outbreak in Hawai ‘i. Proc. R Soc. B Biol. Sci. 285:20172265. doi: 10.1098/rspb.2017.2265
Cróquer, A., and Weil, E. (2009). Changes in Caribbean coral disease prevalence after the 2005 bleaching event. Dis. Aquat. organ. 87, 33–43. doi: 10.3354/dao02164
Dobbelaere, T., Muller, E. M., Gramer, L. J., Holstein, D. M., and Hanert, E. (2020). Coupled epidemio-hydrodynamic modeling to understand the spread of a deadly coral disease in Florida. Front. Mar. Sci. 7:591881. doi: 10.3389/fmars.2020.591881
Estrada-Saldívar, N., Molina-Hernández, A., Pérez-Cervantes, E., Medellın-Maldonado, F., González-Barrios, F. J., and Alvarez-Filip, L. (2020). Reef-scale impacts of the stony coral tissue loss disease outbreak. Coral Reefs 39, 861–866. doi: 10.1007/s00338-020-01949-z
Foley, J. E., Sokolow, S. H., Girvetz, E., Foley, C. W., and Foley, P. (2005). Spatial epidemiology of Caribbean yellow band syndrome in Montastrea spp. coral in the eastern Yucatan. Mexico. Hydrobiol. 548, 33–40. doi: 10.1007/s10750-005-3619-2
Heron, S. F., Johnston, L., Liu, G., Geiger, E. F., Maynard, J. A., De La Cour, J. L., et al. (2016). Validation of reef-scale thermal stress satellite products for coral bleaching monitoring. Remote Sens. 8:59. doi: 10.3390/rs8010059
Jolles, A. E., Sullivan, P., Alker, A. P., and Harvell, C. D. (2002). Disease transmission of aspergillosis in sea fans: inferring process from spatial pattern. Ecology 83, 2373–2378. doi: 10.1890/0012-9658(2002)083[2373:dtoais]2.0.co;2
Kaczmarsky, L., and Richardson, L. L. (2011). Do elevated nutrients and organic carbon on Philippine reefs increase the prevalence of coral disease? Coral Reefs 30, 253–257. doi: 10.1007/s00338-010-0686-2
Kassambara, A., and Mundt, F. (2020). factoextra: extract and visualize the results of multivariate data analyses. R package version 1.0.7. Available online at: https://CRAN.R-project.org/package=factoextra (accessed May 24, 2020).
Kohler, K. E., and Gill, S. M. (2006). Coral Point Count with Excel extensions (CPCe): a Visual Basic program for the determination of coral and substrate coverage using random point count methodology. Comput. Geosci. 32, 1259–1269. doi: 10.1016/j.cageo.2005.11.009
Kramer, P. R., Roth, L., and Lang, J. (2019). Map of Stony Coral Tissue Loss Disease Outbreak in the Caribbean. Available online at: www.agrra.org (accessed May 24, 2020).
Lê, S., Josse, J., and Husson, F. (2008). FactoMineR: a package for multivariate analysis. J. Stat. Softw. 25, 1–18.
Lentz, J. A., Blackburn, J. K., and Curtis, A. J. (2011). Evaluating patterns of a white-band disease (WBD) outbreak in Acropora palmata using spatial analysis: a comparison of transect and colony clustering. PLoS One 6:e21830. doi: 10.1371/journal.pone.0021830
Manzello, D. P. (2015). Rapid recent warming of coral reefs in the Florida keys. Sci. Rep. 5:16762. doi: 10.1038/srep16762
Marszalek, D. S., Babashoff, G. Jr., Noel, M. R., and Worley, D. R. (1977). Reef distribution in south Florida. Proc. 3rd Int. Coral Reef Symp 2, 223–230.
Maynard, J., Van Hooidonk, R., Eakin, C. M., Puotinen, M., Garren, M., Williams, G., et al. (2015). Projections of climate conditions that increase coral disease susceptibility and pathogen abundance and virulence. Nat. Clim. Chan. 5, 688–694. doi: 10.1038/nclimate2625
Meiling, S., Smith, T. B., Muller, E. M., and Brandt, M. E. (2020). 3D photogrammetry reveals dynamics of stony coral tissue loss disease (SCTLD) lesion progression across a thermal stress event. Front. Mar. Sci. 7:597643. doi: 10.3389/fmars.2020.597643
Meyer, J. L., Castellanos-Gell, J., Aeby, G. S., Häse, C. C., Ushijima, B., and Paul, V. J. (2019). Microbial community shifts associated with the ongoing stony coral tissue loss disease outbreak on the florida reef tract. Front. Microbiol. 10:2244. doi: 10.3389/fmicb.2019.02244
Miller, J., Muller, E., Rogers, C., Waara, R., Atkinson, A., Whelan, K. R., et al. (2009). Coral disease following massive bleaching in 2005 causes 60% decline in coral cover on reefs in the US Virgin Islands. Coral Reefs 28:925. doi: 10.1007/s00338-009-0531-7
Mitchell, C. E., Tilman, D., and Groth, J. V. (2002). Effects of grassland plant species diversity, abundance, and composition on foliar fungal disease. Ecology 83, 1713–1726. doi: 10.1890/0012-9658(2002)083[1713:eogpsd]2.0.co;2
Muller, E. M., Rogers, C. S., Spitzack, A. S., and Van Woesik, R. (2008). Bleaching increases likelihood of disease on Acropora palmata (Lamarck) in Hawksnest Bay, St John, US virgin islands. Coral Reefs 27, 191–195. doi: 10.1007/s00338-007-0310-2
Muller, E. M., Sartor, C., Alcaraz, N. I., and van Woesik, R. (2020). Spatial epidemiology of the stony-coral-tissue-loss disease in Florida. Front. Mar. Sci. 7:163. doi: 10.3389/fmars.2020.00163
Muller, E. M., and van Woesik, R. (2012). Caribbean coral diseases: Primary transmission or secondary infection? Glob Chang Biol 18, 3529–3535. doi: 10.1111/gcb.12019
Muller, E. M., and van Woesik, R. (2014). Genetic susceptibility, Colony size, and water temperature drive white-pox disease on the coral Acropora palmata. PLoS One 9:e110759. doi: 10.1371/journal.pone.0110759
Murdoch, T. J. T., and Aronson, R. B. (1999). Scale-dependent spatial variability of coral assemblages along the Florida Reef Tract. Coral Reefs 18, 341–351. doi: 10.1007/s003380050210
Mydlarz, L. D., Jones, L. E., and Harvell, C. D. (2006). Innate immunity, environmental drivers, and disease ecology of marine and freshwater invertebrates. Annu. Rev. Ecol. Evol. Syst. 7, 251–288. doi: 10.1146/annurev.ecolsys.37.091305.110103
Neely, K. L., Macaulay, K. A., Hower, E. K., and Dobler, M. A. (2020). Effectiveness of topical antibiotics in treating corals affected by stony coral tissue loss disease. PeerJ 8:e9289. doi: 10.7717/peerj.9289
NOAA (2018). Stony Coral Tissue Loss Disease Case Definition. Available online at: https://nmsfloridakeys.blob.core.windows.net/floridakeys-prod/media/docs/20181002-stony-coral-tissue-loss-disease-case-definition.pdf (accessed May 24, 2020).
NOAA Coral Reef Watch (2017). Updated daily. NOAA Coral Reef Watch Version 3.0 Daily Global 5-km Satellite Virtual Station Time Series Data for Florida Keys, Oct. 30, 2018-Dec. 06, 2019. Washington, D.C: NOAA. Available online at: https://coralreefwatch.noaa.gov/vs/data.php (accessed May 1, 2020).
Paull, S. H., Song, S., McClure, K. M., Sackett, L. C., Kilpatrick, A. M., and Johnson, P. T. (2012). From super spreaders to disease hotspots: linking transmission across hosts and space. Front Ecol Environ 10:75–82. doi: 10.1890/110111
Pollock, F. J., Morris, P. J., Willis, B. L., and Bourne, D. G. (2011). The urgent need for robust coral disease diagnostics. PLoS Pathog 7:e1002183. doi: 10.1371/journal.ppat.1002183
Porter, J. W., Dustan, P., Jaap, W. C., Patterson, K. L., Kosmynin, V., Meier, O. W., et al. (2001). “Patterns of spread of coral disease in the Florida Keys,” in The Ecology and Etiology of Newly Emerging Marine Diseases, ed. J. W. Porter (Dordrecht: Springer), 1–24.
Precht, W. F., Gintert, B. E., Robbart, M. L., Fura, R., and van Woesik, R. (2016). Unprecedented disease-related coral mortality in Southeastern Florida. Sci. Rep. 6:31374.
R Development Core Team. (2019). R: A Language and Environment for Statistical Computing. Vienna: R Foundation for Statistical Computing.
Randall, C. J., Jordan-Garza, A. G., Muller, E. M., and Van Woesik, R. (2014). Relationships between the history of thermal stress and the relative risk of diseases of Caribbean corals. Ecology 95, 1981–1994. doi: 10.1890/13-0774.1
Randall, C. J., and van Woesik, R. (2015). Contemporary white-band disease in Caribbean corals driven by climate change. Nat. Clim. Chan. 5, 375–379. doi: 10.1038/nclimate2530
Rippe, J. P., Kriefall, N. G., Davies, S. W., and Castillo, K. D. (2019). Differential disease incidence and mortality of inner and outer reef corals of the upper Florida Keys in association with a white syndrome outbreak. Bull. Mar. Sci. 95, 305–316. doi: 10.5343/bms.2018.0034
Ritchie, K. B. (2006). Regulation of microbial populations by coral surface mucus and mucus-associated bacteria. Mar. Ecol. Prog. Ser. 322, 1–14. doi: 10.3354/meps322001
Rosales, S. M., Clark, A. S., Huebner, L. K., Ruzicka, R. R., and Muller, E. M. (2020). Rhodobacterales and Rhizobiales are associated with stony coral tissue loss disease and its suspected sources of transmission. Front. Microbiol. 11:681. doi: 10.3389/fmicb.2020.00681
Rosenberg, E., and Ben-Haim, Y. (2002). Microbial diseases of corals and global warming. Environ. Microbiol. 4, 318–326. doi: 10.1046/j.1462-2920.2002.00302.x
Schroeder, M. S., Culhane, A. C., Quackenbush, J., and Haibe-Kains, B. (2011). survcomp: anR/Bioconductor package for performance assessment and comparison of survival models. Bioinformatics 27, 3206–3208. doi: 10.1093/bioinformatics/btr511
Sharp, W. C., Shea, C. P., Maxwell, K. E., Muller, E. M., and Hunt, J. H. (2020). Evaluating the small-scale epidemiology of the stony-coral-tissue-loss disease in the middle Florida Keys. PLoS One 15:e0241871. doi: 10.1371/journal.pone.0241871
Shore, A., and Caldwell, J. M. (2019). Modes of coral disease transmission: how do diseases spread between individuals and among populations? Mar Biol 166, 45.
Skirving, W., Marsh, B., De La Cour, J., Liu, G., Harris, A., Maturi, E., et al. (2020). coraltemp and the coral reef watch coral bleaching heat stress product suite version 3.1. Remote Sens. 12:3856. doi: 10.3390/rs12233856
Sutherland, K. P., Porter, J. W., and Torres, C. (2004). Disease and immunity in Caribbean and Indo-Pacific zooxanthellate corals. Mar. Ecol. Prog. Ser. 266, 273–302. doi: 10.3354/meps266273
Szmant, A. M., and Forrester, A. (1996). Water column and sediment nitrogen and phosphorus distribution patterns in the Florida Keys. USA. Coral Reefs 15, 21–41. doi: 10.1007/s003380050026
van Woesik, R., and Randall, C. J. (2017). Coral disease hotspots in the Caribbean. Ecosphere 8:e01814. doi: 10.1002/ecs2.1814
Walton, C. J., Hayes, N. K., and Gilliam, D. S. (2018). Impacts of a regional, multi-year, multi-species coral disease outbreak in Southeast Florida. Front. Mar. Sci. 5:323.
Ward, J. R., and Lafferty, K. D. (2004). The elusive baseline of marine disease: are diseases in ocean ecosystems increasing? PLoS Biol 2:e120. doi: 10.1371/journal.pbio.0020120
Williams, L., Smith, T. B., Burge, C. A., and Brandt, M. E. (2020). Species-specific susceptibility to white plague disease in three common Caribbean corals. Coral Reefs 39, 27–31. doi: 10.1007/s00338-019-01867-9
Keywords: stony coral tissue loss disease, coral disease, coral reefs, spatial epidemiology, Florida’s Coral Reef
Citation: Williams SD, Walter CS and Muller EM (2021) Fine Scale Temporal and Spatial Dynamics of the Stony Coral Tissue Loss Disease Outbreak Within the Lower Florida Keys. Front. Mar. Sci. 8:631776. doi: 10.3389/fmars.2021.631776
Received: 20 November 2020; Accepted: 30 March 2021;
Published: 26 April 2021.
Edited by:
William F. Precht, Dial Cordy and Associates, Inc., United StatesReviewed by:
Craig W. Osenberg, University of Georgia, United StatesRaven Delaney Blakeway, Texas A&M University at Galveston, United States
Copyright © 2021 Williams, Walter and Muller. This is an open-access article distributed under the terms of the Creative Commons Attribution License (CC BY). The use, distribution or reproduction in other forums is permitted, provided the original author(s) and the copyright owner(s) are credited and that the original publication in this journal is cited, in accordance with accepted academic practice. No use, distribution or reproduction is permitted which does not comply with these terms.
*Correspondence: Sara D. Williams, c3dpbGxpYW1zQG1vdGUub3Jn