 Takahiro Shimada
 Carlos M. Duarte
 Abdulaziz M. Al-Suwailem
 Lyndsey K. Tanabe
 Mark G. Meekan
- 1Australian Institute of Marine Science, The University of Western Australia, Crawley, WA, Australia
- 2Red Sea Research Center, King Abdullah University of Science and Technology, Thuwal, Saudi Arabia
- 3UWA Oceans Institute and School of Biological Sciences, The University of Western Australia, Crawley, WA, Australia
- 4Beacon Development Company, King Abdullah University of Science and Technology, Thuwal, Saudi Arabia
Major aggregations of nesting green turtles (Chelonia mydas) occur in the northern Red Sea, although little is known about the reproductive ecology of this endangered species in the region. To address this issue, we satellite-tracked 30 female green turtles to document their movements and to identify factors driving habitat use at two major rookeries in the Red Sea, Jazirat Mashabah (Mashabah Island) and Ras Al Baridi in Saudi Arabia. Between successive nesting events, turtles displayed high fidelity to nesting beaches and adjacent in-water habitats (inter-nesting habitats). Using generalized linear mixed models, we estimated the mean probability of nesting per beach emergence (nesting success rate) to be 0.628, and the mean duration between a successful nesting event and the successive emergence onto the beach (re-nesting interval) to be 10.8 days at each site. The nesting success rate was relatively high (>0.8) when the preceding daytime land surface temperature (LST) was lower than 37°C but decreased with elevated daytime LST (<0.4 when >47°C). Re-nesting interval was longer at lower water temperatures and towards the end of the nesting season of individuals. Our study improves the robustness of abundance estimates from census data (e.g., track counts) and shows that the protection of nesting and inter-nesting habitats during a breeding season would be an effective conservation strategy for the species. We discuss how global warming could increase energy expenditure due to lowered nesting success, ultimately compromising the reproductive fitness of these populations.
Introduction
Marine megafauna often use distinct habitats during different life history stages (Hussey et al., 2015). Individuals may spread over different habitats to forage, whereas, during breeding seasons they may migrate to particular sites, aggregating in large numbers within relatively small areas (Boyd et al., 2002; Robinson et al., 2012; Ferreira et al., 2021). Due to the spatial concentration of reproductive adults, such breeding sites can be critical habitats for many species and are often a target of conservation efforts (Oppel et al., 2018).
Sea turtles are a good example of taxa that exhibit this pattern of habitat use. Every few years, adult females return to the same natal nesting areas to lay several clutches of eggs on a beach, although foraging grounds of each turtle can be separated by thousands of kilometers (Miller, 1997; Jensen et al., 2013; Shimada et al., 2020). Between nesting events, females rest in nearshore waters (inter-nesting habitats) to prepare their eggs for the next clutch (Houghton et al., 2002; Ferreira et al., 2021; Shimada et al., 2021). This aggregation and fidelity to specific breeding areas makes turtles extremely vulnerable to sudden alteration or loss of nesting and inter-nesting habitats, due to both natural (e.g., coastal erosion) and anthropogenic (e.g., development, climate change) threats (Lutcavage et al., 1997; Hamann et al., 2013).
In the Red Sea, there are three major rookeries of green turtles; Ras Al Baridi and Jazirat Mashabah1 (Mashabah Island) in Saudi Arabia, and Zabargad Island in Egypt, where, on average a few hundred females nest annually (Shimada et al., in press) and face important conservation challenges. At Ras Al Baridi, cement dust produced by factories adjacent to the rookery has impacted hatchling survival by creating hard domes above nests that reduce emergence by up to 60% (Pilcher, 1999). Along the nesting beaches, vehicles operate throughout the day and night. The noise, artificial light, and movement of vehicles and their occupants can disturb nesting turtles and may cause females to leave the beach without depositing eggs. Jazirat Mashabah is currently uninhabited but is subject to ongoing residential and industrial development projects (Chalastani et al., 2020), which have the potential to increase threats such as artificial light and noise. Global threats such as warming temperature could affect the likelihood of nesting – i.e., nesting success, and the time required to prepare a clutch of eggs between oviposition (egg laying) and a successive beach emergence – i.e., re-nesting interval (Davenport, 1997; Limpus et al., 2003).
The aggregations of nesting green turtles (Chelonia mydas) in the Red Sea are likely genetically distinct from populations in the wider Indian Ocean (Jensen et al., 2019). If effective conservation strategies are to be developed and implemented for this endangered species in the region, it is essential to understand details of their nesting and inter-nesting habitat use. Here, we address this issue through satellite tracking of green turtles that nested at Jazirat Mashabah and Ras Al Baridi rookeries. Using accurate Fastloc GPS tracks, we documented patterns of nesting, identified inter-nesting habitats, and examined the biological and environmental factors likely driving these patterns. The nesting success rate identified through satellite tracking can improve abundance estimates of nesting turtles and allow us to explore how reproductive fitness of breeding females may be affected by predicted regional climate changes due to global warming.
Materials and Methods
Field Research
We conducted this study on the Red Sea coast of Saudi Arabia at the Jazirat Mashabah and Ras Al Baridi rookeries during the mid to late nesting season (September – October) in 2019 (Pilcher and Al-Merghani, 2000; Shimada et al., in press). Jazirat Mashabah is an uninhabited island located 65 km from the nearest city (Al Wajh), whereas, Ras Al Baridi lies next to Yanbu Cement Factory on the mainland coast (Figure 1). We searched for adult female green turtles as they emerged from the sea at night to lay eggs. Once turtles completed or abandoned nesting, we used small aluminum fences to restrain them for tag deployment. Turtles selected for tagging had no obvious injuries or scars that could have impeded nesting (e.g., missing hind flippers). Prior to tag deployment we removed epibionts (barnacles, algae) from the first two ventral scutes of the carapace, which were then roughened with sandpaper and cleaned with acetone. An Argos-linked Fastloc GPS satellite tag (Wildlife Computers Inc.) was glued to the cleaned carapace using a two-part epoxy bond (DeWalt PURE150-PRO). We also attached titanium flipper tags (Stockbrands Co. Pty Ltd) and measured the curved carapace length along the midline of the carapace (Limpus et al., 1994). Turtles were released on the night of capture.
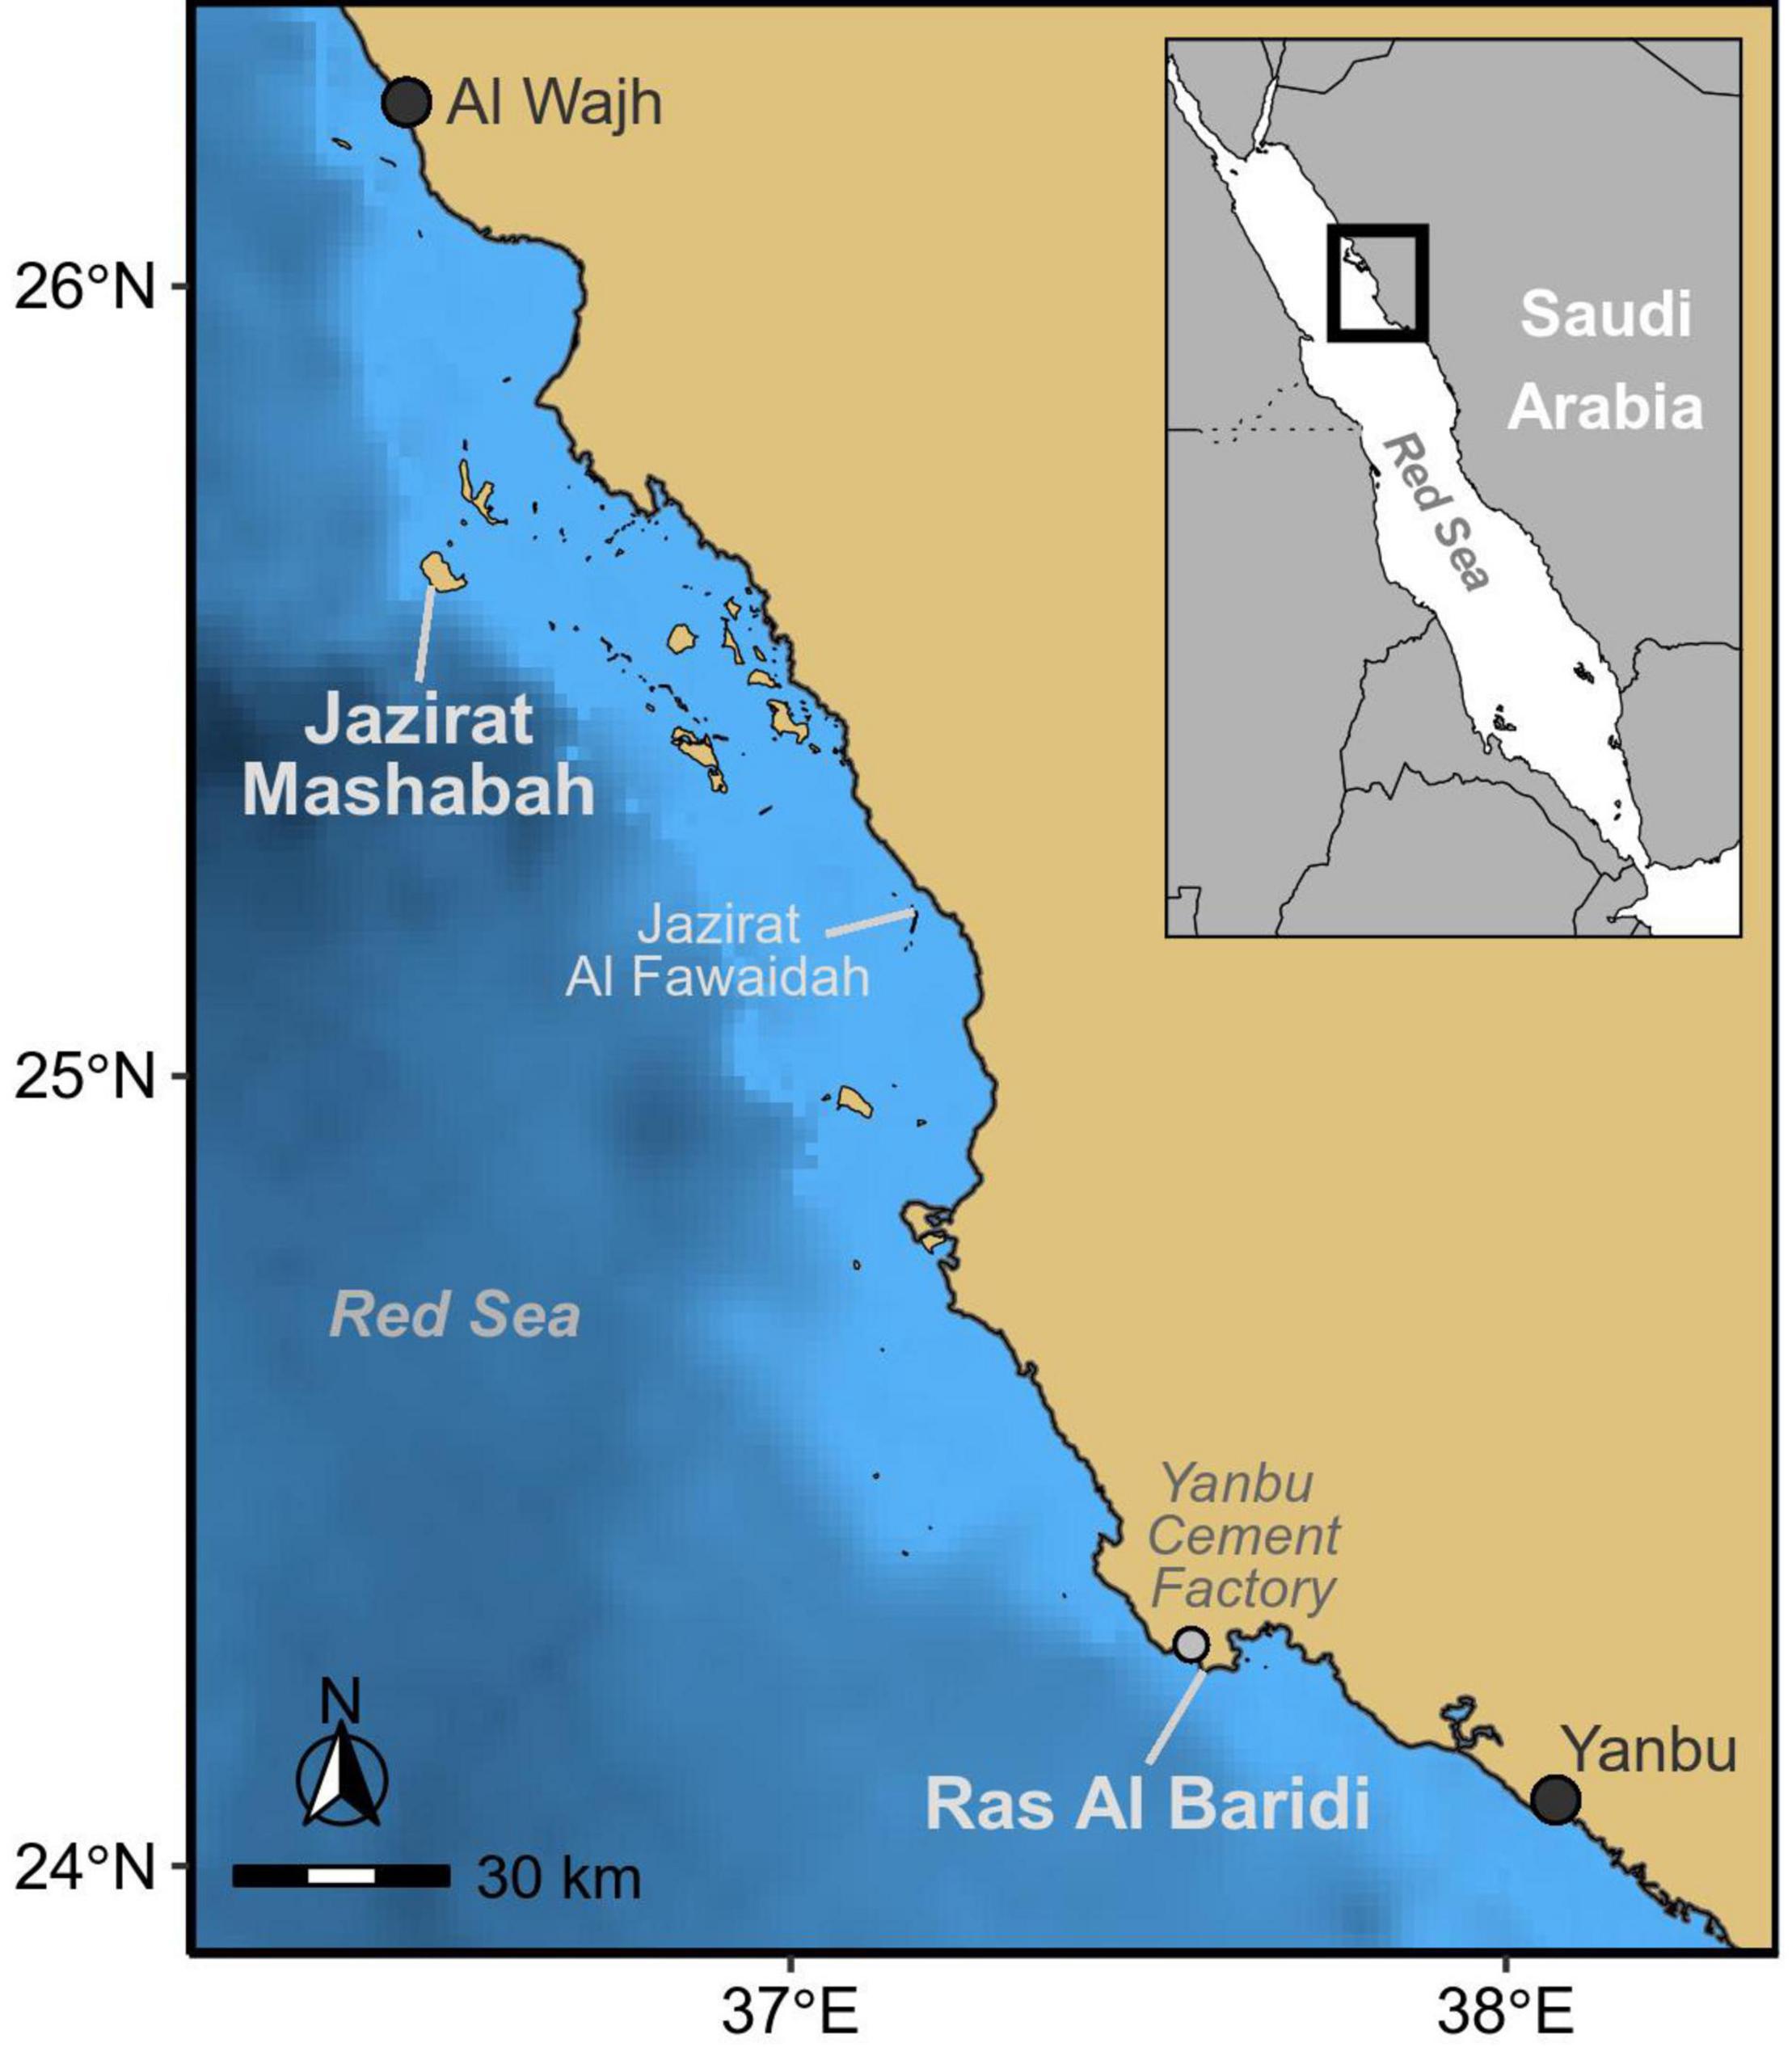
Figure 1. Study sites at the major rookeries of green turtles in the Red Sea; Jazirat Mashabah, and Ras Al Baridi.
Tracking Data
The Fastloc GPS tags were configured to receive GPS signals every 30 min and transmitted data via the Argos satellite system. Raw transmitted GPS data were decoded into GPS locations (Fastloc GPS locations hereafter) on the Wildlife Computers Portal. Using the SDLfilter package in R software, we filtered locations that were temporally or spatially identical to avoid pseudoreplication and retained only one fix per time and location (Shimada et al., 2016b; Shimada, 2018; R Core Team, 2020). We identified and removed erroneous Fastloc GPS locations (usually <5% of all data) based on high residual errors >30 and biologically unrealistic travel speeds and turning angles (Shimada et al., 2012). The filtered Fastloc GPS data were assumed to be within 47.1 ± 61.0 m (mean ± SD) from the true locations of the animal (Shimada et al., 2012). The data were then segmented into “breeding” or “foraging” phases separated by post-breeding migrations due to changes in the 2-day average of traveling speed and angle (Shimada et al., 2021). Here, we focused on the breeding phase (nesting, inter-nesting) of each track.
Beach Emergence and Nesting Success
When the turtles were on land for >10 min (haul-out events), the Fastloc tags also recorded the start and end time and GPS positions of each event. To determine if a beach emergence resulted in oviposition, we considered that a turtle must require >8 days to prepare a clutch of eggs for the successive oviposition (Hamann et al., 2003). Thus, if no GPS locations were recorded on land for >8 days after a beach emergence, we assumed that a nest had been laid on the final beach emergence.
We modeled nesting success as a function of site, rainfall, and land surface temperature (LST). Satellite-derived daily precipitation data (0.1° spatial resolution) and daytime LST data (0.05° spatial resolution) were obtained from the US Geological Survey and the National Aeronautics and Space Administration (Wan et al., 2015; Huffman et al., 2019). For precipitation, we used the daily estimates at the observation coordinates that were nearest to each rookery (25.65°S, 36.45°E for Jazirat Mashabah; 24.25°S, 37.55°E for Ras Al Baridi). This approach was not possible for the LST data because estimates were not always available at the observation points nearest to our sites. Instead, we averaged the daytime LSTs from multiple observation coordinates that were within 1 degree of distance from each rookery and 5 km from the coastline.
Re-nesting Interval
We examined how re-nesting intervals were affected by nesting site, ambient water temperature that each individual experienced during each re-nesting phase, and the number of remaining clutches in the nesting season. Ambient temperature was recorded every 10 min by the sensor integrated on the Fastloc GPS tag. However, due to limitations of the Argos system, transmitted data were categorized into 11 bins ranging from 16 to 36°C with an interval of 2°C and summarized over 12 h. From the binned data, we calculated the mean temperature (± 1°C) over each 12 h period using the mid-point of each temperature bin. The mean temperature that each individual experienced during a re-nesting phase was then calculated from the 12-hourly data obtained between a successful nesting event and the successive emergence on a beach. We modeled the re-nesting interval as a function of site, water temperature, and remaining clutches. The lower boundary of the re-nesting interval was set to 8 days so that the minimum duration required for egg preparation was accounted for in the model.
Utilization Distribution
For each turtle, we estimated the utilization distribution (UD) of the inter-nesting period using a movement-based kernel density estimator (Benhamou, 2011). We imposed a spatial grid of 50 m and the coastline as a boundary (Benhamou and Cornélis, 2010). All other parameters required for UD estimation were adopted from Benhamou (2011) and Shimada et al. (2016a) – Supplementary Table 2. The UD and the 95% volume (i.e., home range) were calculated using the adehabitatHR and spatialEco R packages (Calenge, 2006; Evans, 2020). We then overlaid each UD and averaged the spatial probability at each 50 m grid cell so that the extent and relative importance within a collective inter-nesting habitat could be quantified, and visualized as a density heat map (Shimada et al., 2017, 2021). We also assessed the adequacy of our sample sizes (the number of tags) to describe the distributions of inter-nesting habitats using the overlap probability approach (Shimada et al., 2021). This method quantifies the probability of each individual to be within merged habitats of other turtles through bootstrapping and fits a rational function to the mean probabilities that are associated with their respective sample sizes. Overlap probabilities were calculated using the ‘PHR’ method and horizontal asymptotes were estimated from 4,000 random permutations using the SDLfilter R package (Shimada, 2018). Sample sizes were considered sufficient once the mean overlap probability reached 95% of the estimated asymptote.
Site Fidelity
We also quantified the degree of fidelity of each individual to nesting sites and inter-nesting habitats across the breeding season. For nest sites, we calculated the distances between successive nests and modeled the distances as a function of sites. To assess fidelity to inter-nesting habitats, we calculated the re-nesting UDs of each turtle and compared the similarity within each individual and among different individuals. For this analysis, each re-nesting UD was paired with another of the same individual (WITHIN) or with one of a different individual (BETWEEN). We then calculated the mean integrated squared error (MISE) for each pair of the UDs as:
where, n was the number of grid points, x and y were the longitude and latitude at each grid point, fa(xi, yi) and fb(xi, yi) were the estimated probabilities of the animals a and b to be at the ith grid point. MISE represented the absolute relative differences among each pair of the UDs, with a smaller MISE indicating more similarity (Seaman and Powell, 1996; Shimada et al., 2012). The MISE values were then modeled as a function of sites and pairs (i.e., within or between individuals).
Statistical Analysis
Generalized linear mixed models (GLMMs) were fitted to the data with individual turtles as a random intercept. Distributions and link functions used for each model are presented in Table 1. We used the R package lme4 (Bates et al., 2015) to fit GLMMs and compute the Wald confidence intervals (CI). Continuous predictors were centered and scaled prior to analysis and we confirmed non-collinearity by computing the variance inflation factor using the Car package (Fox and Weisberg, 2019). Models were validated by simulating standardized residuals from the fitted models using the R package DHARMa (Hartig, 2020) and plotted against fitted values, each predictor, and the random intercept (Zuur et al., 2009). For the binomial model, we confirmed goodness of fit and no over-dispersion by the standardized residuals and deviance of the fitted model.
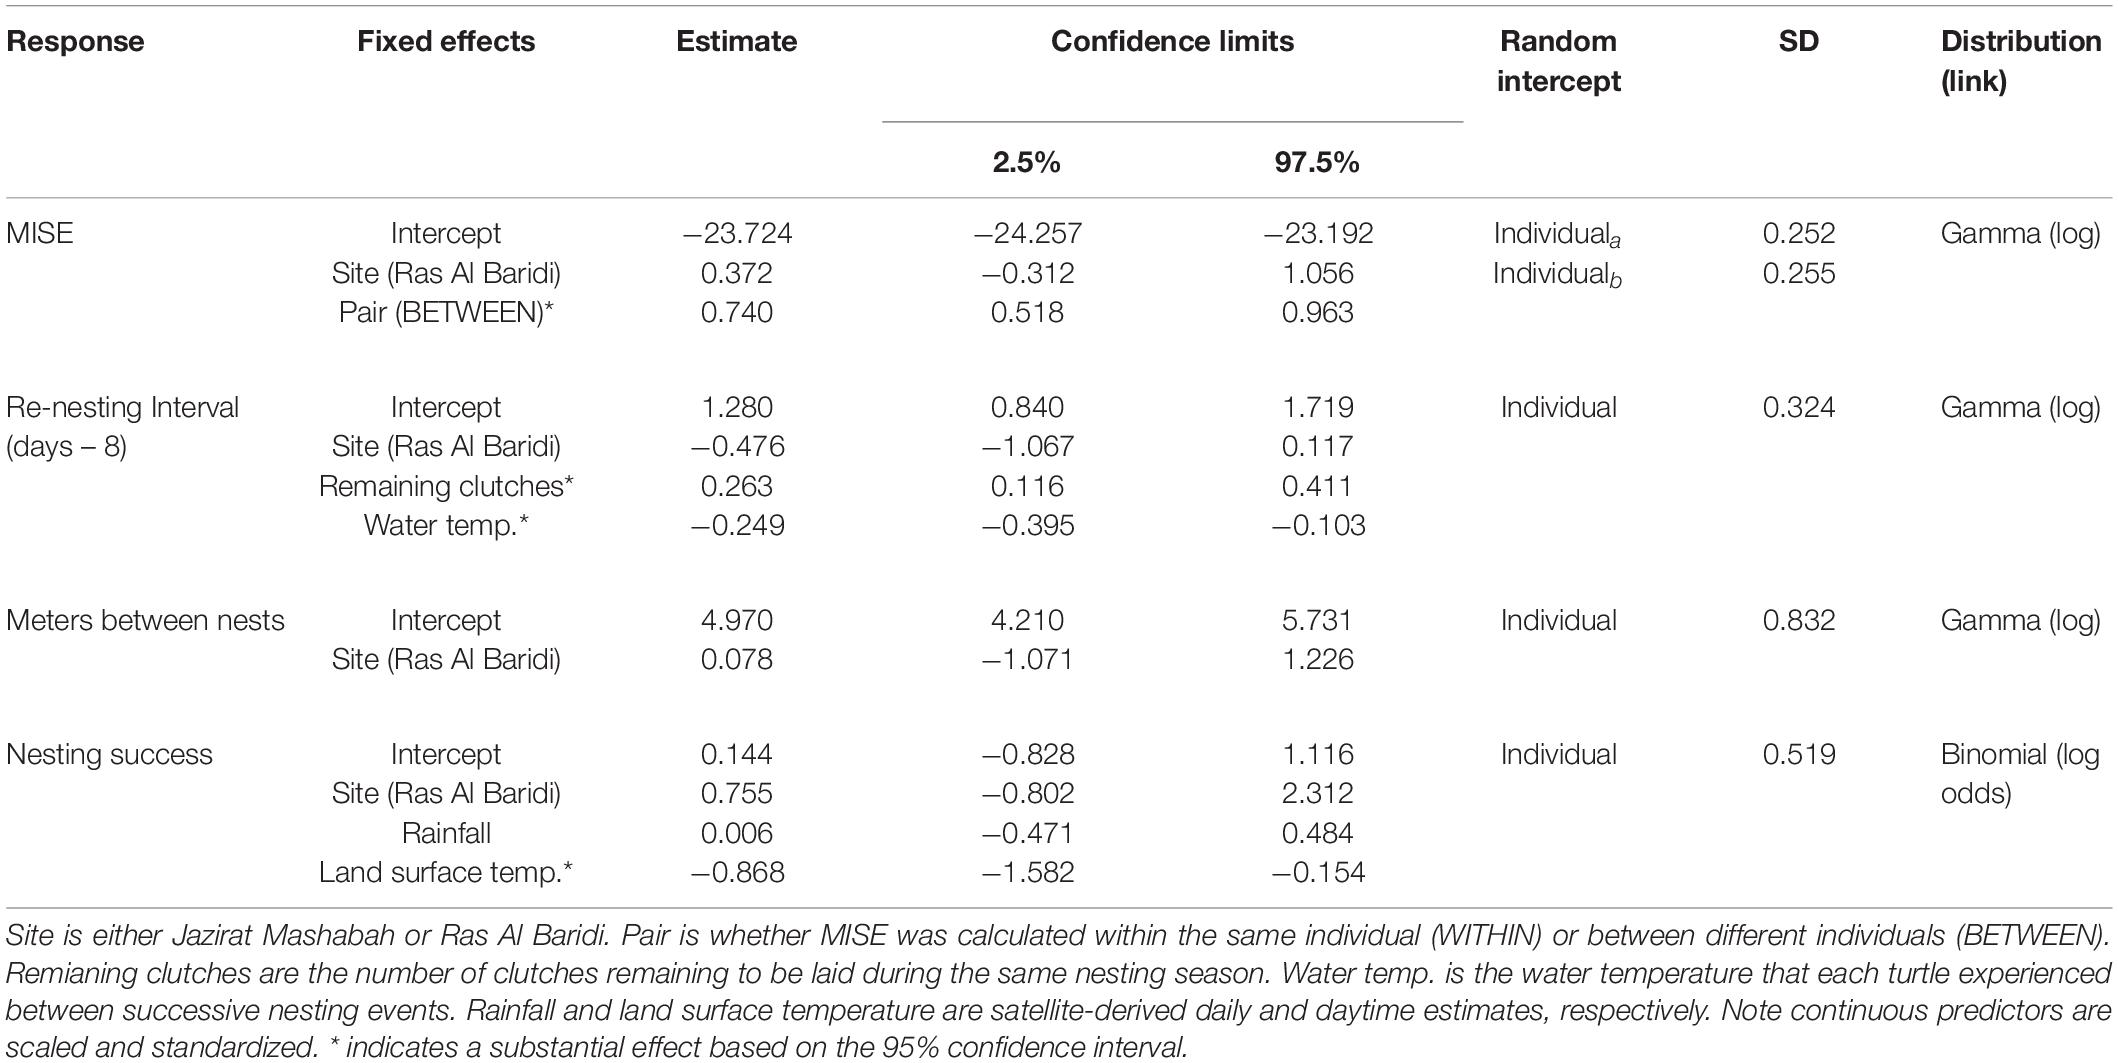
Table 1. Summary of GLMMs fitted to mean integrated squared errors (MISE) as a measure of individual’s fidelity to inter-nesting habitat, re-nesting interval as the number of days between a nesting event and the successive emergence onto the beach, meters between nests as a measure of individual’s fidelity to nest site, and nesting success as the probability of nesting by a female per an emergence onto the beach.
Results
We tracked a total of 30 nesting green turtles (Appendix A), ranging from 91.8 to 111.7 cm in curved carapace length at Jazirat Mashabah (n = 20) and Ras Al Baridi (n = 10). Following tag deployment, 29 turtles moved to inter-nesting habitats to prepare for successive clutches (n = 20) or to rest before commencing their post-breeding migrations (n = 9). One turtle immediately began its post-breeding migration after tag deployment at Ras Al Baridi and was excluded from further analyses. There were confirmed and suspected incidents of mortality for two of the 29 turtles. One individual tracked from Jazirat Mashabah died during a nesting attempt, likely from a fall off a ledge as it was found dead at the base of a cliff, and another turtle tracked from Ras Al Baridi potentially died in its inter-nesting habitat (Appendix B). Each of the 29 turtles were tracked between 5 September and 12 December 2019 (mean = 24 days, range = 1 to 92) and on average nested 2.5 times (range = 1 to 8, inclusive of nesting at tag deployment) prior to their post-breeding migrations or confirmed/suspected mortality incidences.
Inter-Nesting Patterns and Drivers
The degree of fidelity to inter-nesting habitats was examined using 11 turtles that were tracked over ≥2 nesting events. This included the period after final nesting and before post-breeding migration (post-nesting, pre-migration period) because the turtles returned to the inter-nesting habitats before departure. For these individuals, the MISE values were substantially smaller within than between turtles (Figure 2A and Table 1), confirming individual’s high fidelity to the respective inter-nesting habitat prior to the post-breeding migration (Figures 2B,C, Appendix C). Turtles at both sites showed a similar degree of fidelity to inter-nesting habitats (Table 1).
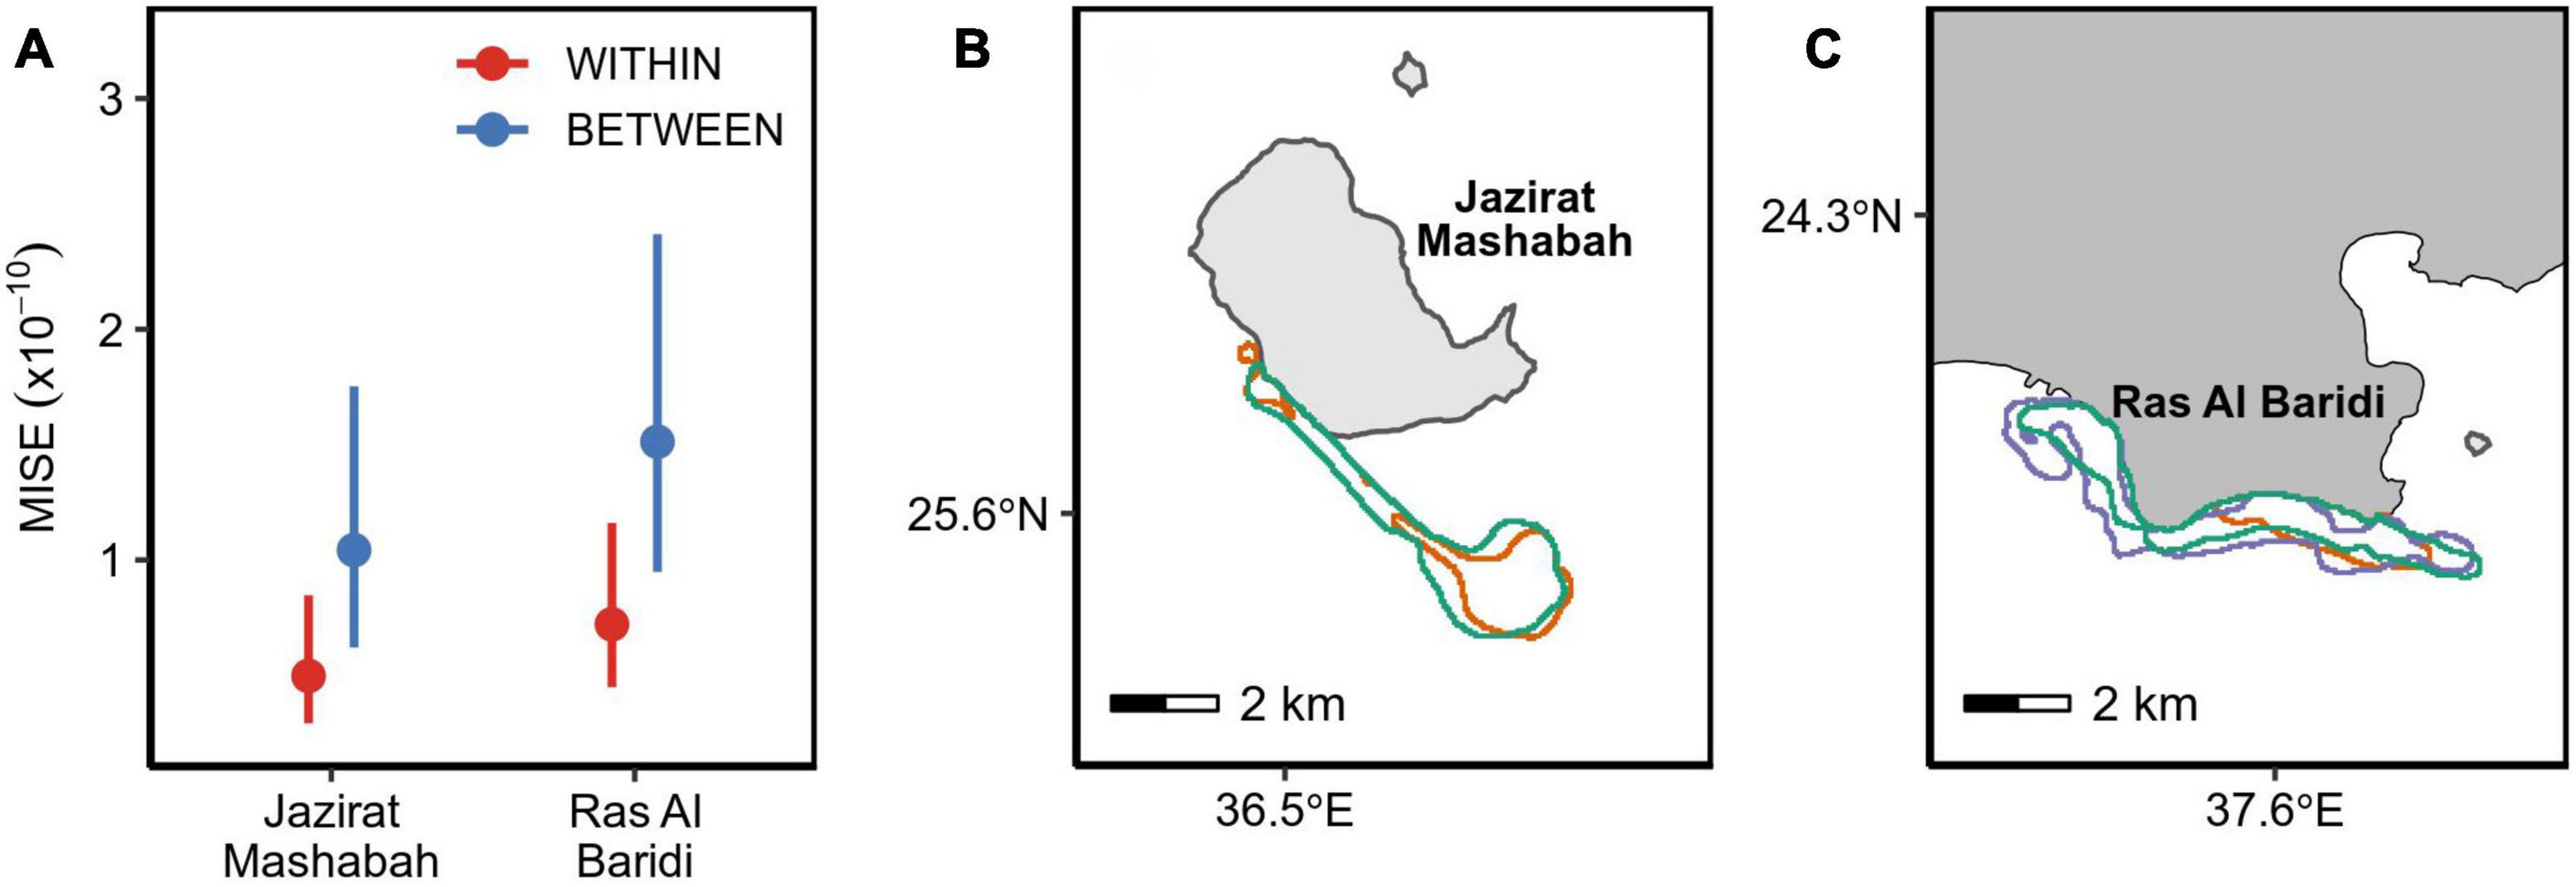
Figure 2. (A) Similarity in re-nesting habitats within the same individual (red) and between different individuals (blue) across a breeding season. A smaller MISE indicates more similarity. Points are the estimated means with error bars denoting 95% confidence intervals. (B,C) Each panel is an example of an individual’s inter-nesting habitat (95% utilization distributions). A post-nesting period prior to migration is denoted by green color and each re-nesting period is represented by other colors.
We calculated inter-nesting home ranges for 29 tracked turtles. This included 9 turtles that did not nest after tag deployment but stayed in areas near the nesting beaches, which are likely their inter-nesting habitats (above paragraph), before commensing their post-breeding migration. The home range areas (95% UD) averaged 18 km2 and ranged from <1 to 222 km2 (Appendix A). The turtles remained adjacent to their nesting sites during the inter-nesting phase, with the center of each home range being located <1 to 64.2 km (mean ± SD = 5.1 ± 12.1 km) from the nesting sites and within 14.5 km (mean ± SD = 1.9 ± 2.7 km) from the mainland coast and islands at any time (Figure 3). The collective inter-nesting home range (95% volume of the mean UD) was 72 km2 for turtles that nested at Jazirat Mashabah and 16 km2 for those nesting at Ras Al Baridi (Figure 3). Based on the overlap probability analysis, the sample size of our tracking data was sufficient to describe the general distributions of the inter-nesting habitats, with the minimum number of tracks required for the distribution analyses estimated to be 13 at Jazirat Mashabah and 6 at Ras Al Baridi (Figure 4).
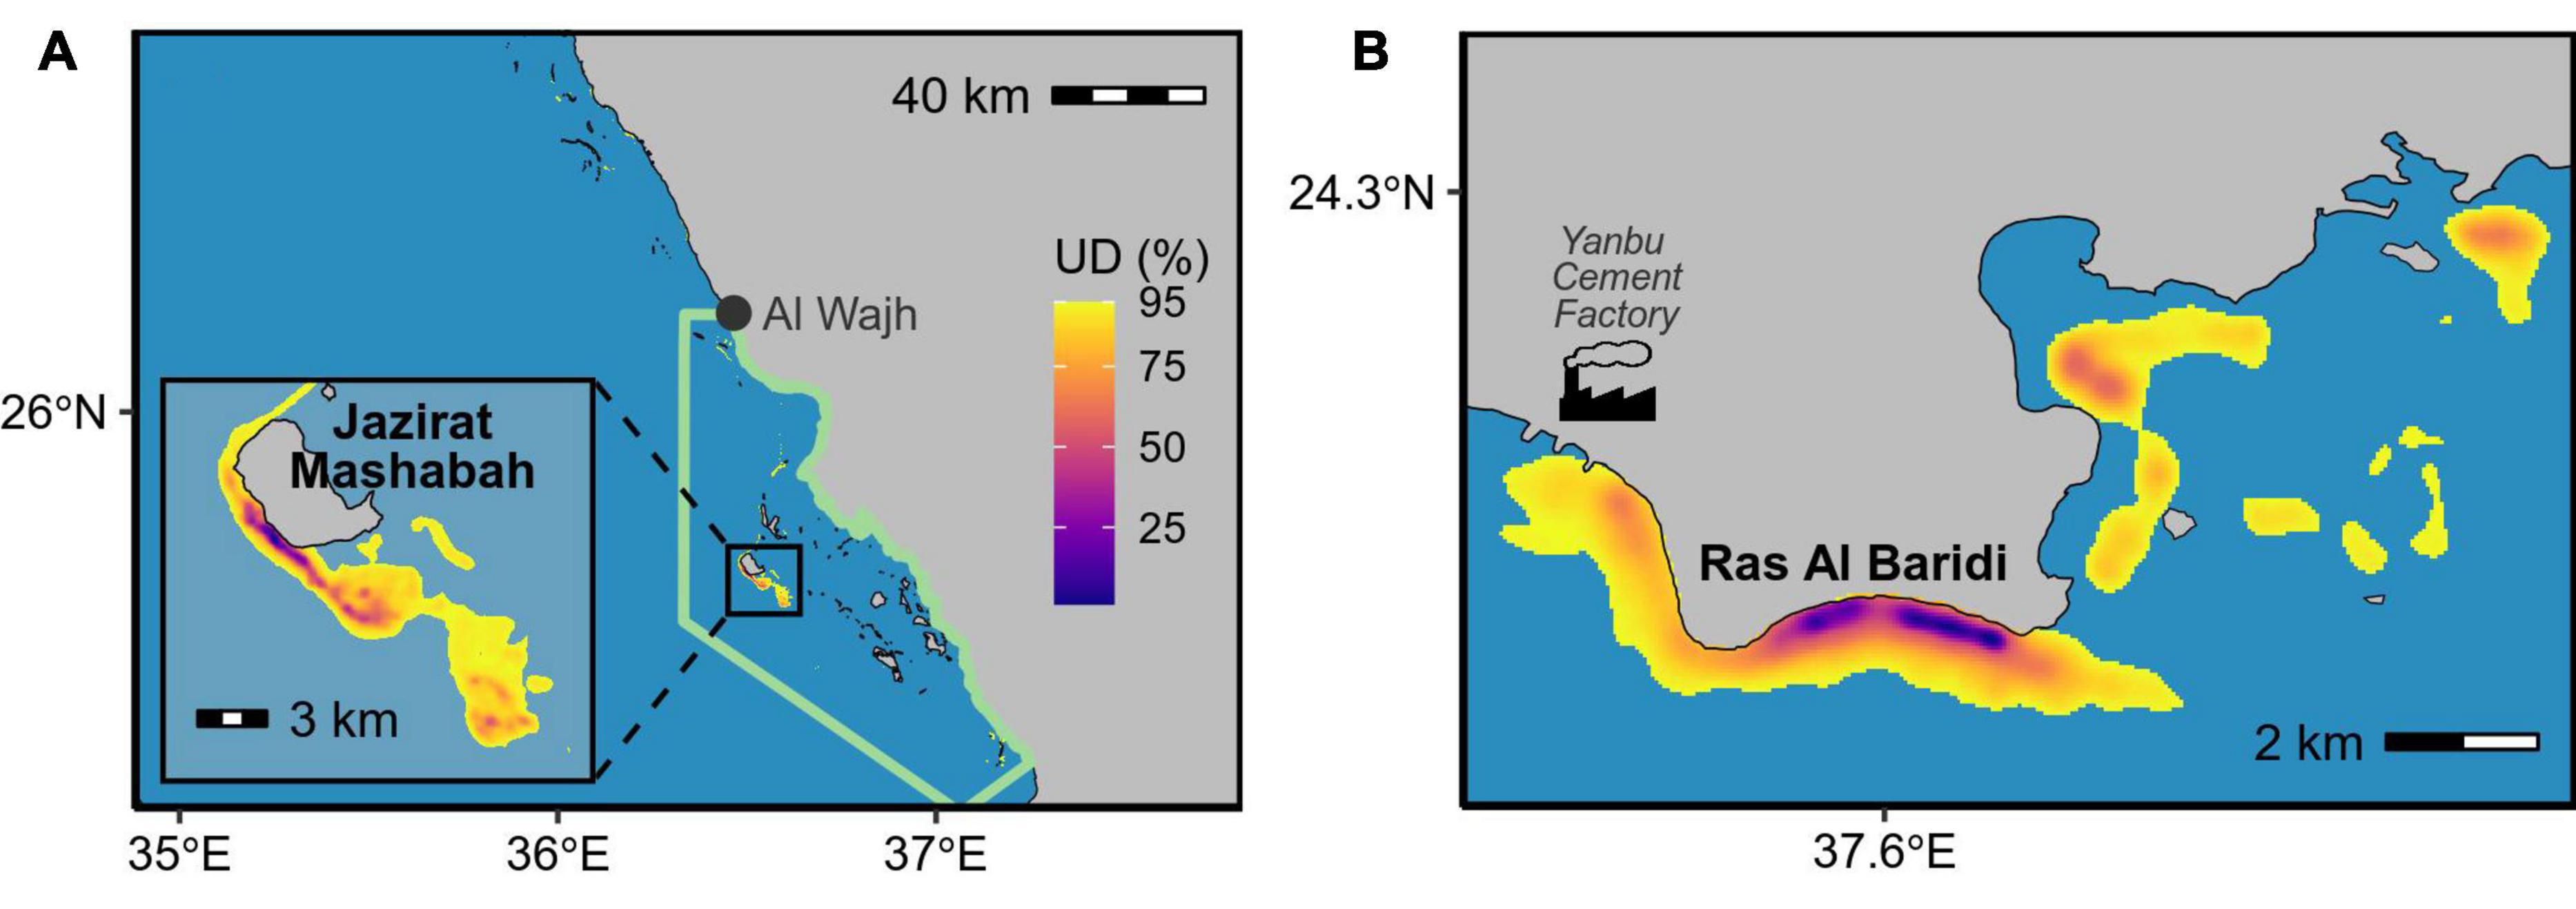
Figure 3. Collective inter-nesting habitats (i.e., mean of all UDs) of green turtles that nested at (A) Jazirat Mashabah (n = 20) and (B) Ras Al Baridi (n = 9). Green line in panel (A) encloses the area managed by the Red Sea Development Company.
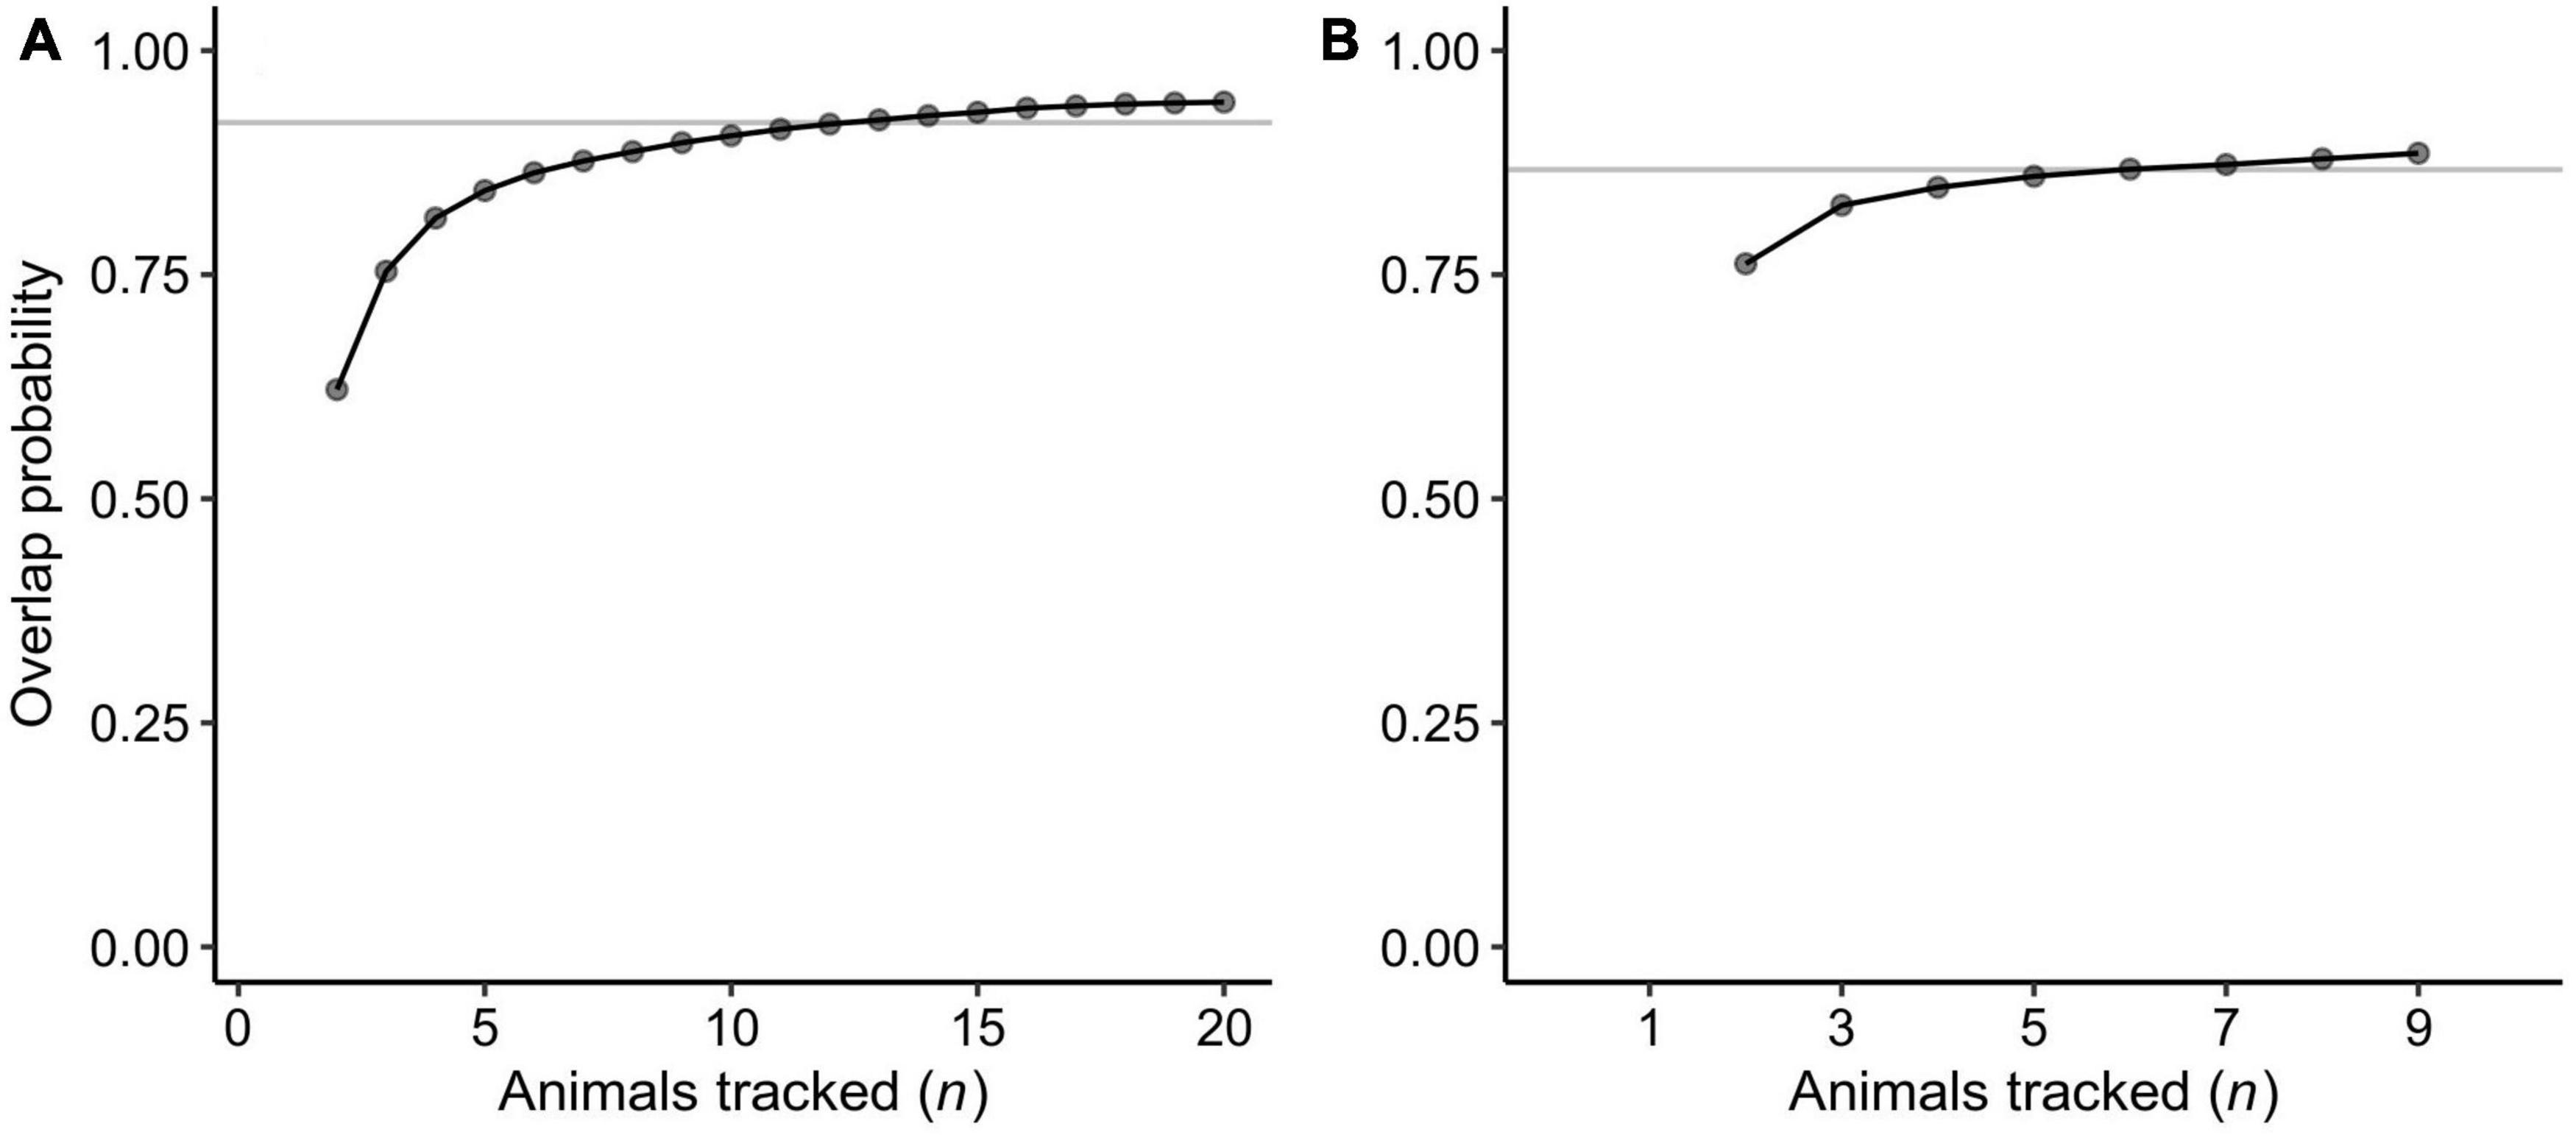
Figure 4. Results of the overlap probability analysis to assess adequacy of the sample sizes (n = the number of animals tracked) to describe the general inter-nesting habitat distributions of the green turtles that nested at (A) Jazirat Mashabah and (B) Ras Al Baridi. Each point is the mean probability of an additional nth individual to be within the areas used by the previously tracked n-1 turtles. Curves are rational functions fitted to the means. Gray lines denote 95% of the estimated horizontal asymptotes and after this point sample size is deemed to be adequate (see Shimada et al., 2021).
The re-nesting interval (n = 31) was calculated from 13 turtles and ranged from 9 to 20 days. This variation was partially explained by the ambient water temperature during the re-nesting phases and the number of clutches still to be laid (Table 1). Re-nesting interval was longer at lower water temperatures and toward the end of the nesting season of each individual (Figure 5). There was no interaction between these terms, indicating the effects were independent. The mean re-nesting interval during the last half of the nesting season was estimated to be 10.8 days (95% CI = 10.0 – 11.9 days) when the continuous predictors (ambient water temperature and remaining number of clutches) were at their means. Site had little effect on the re-nesting interval (Table 1).
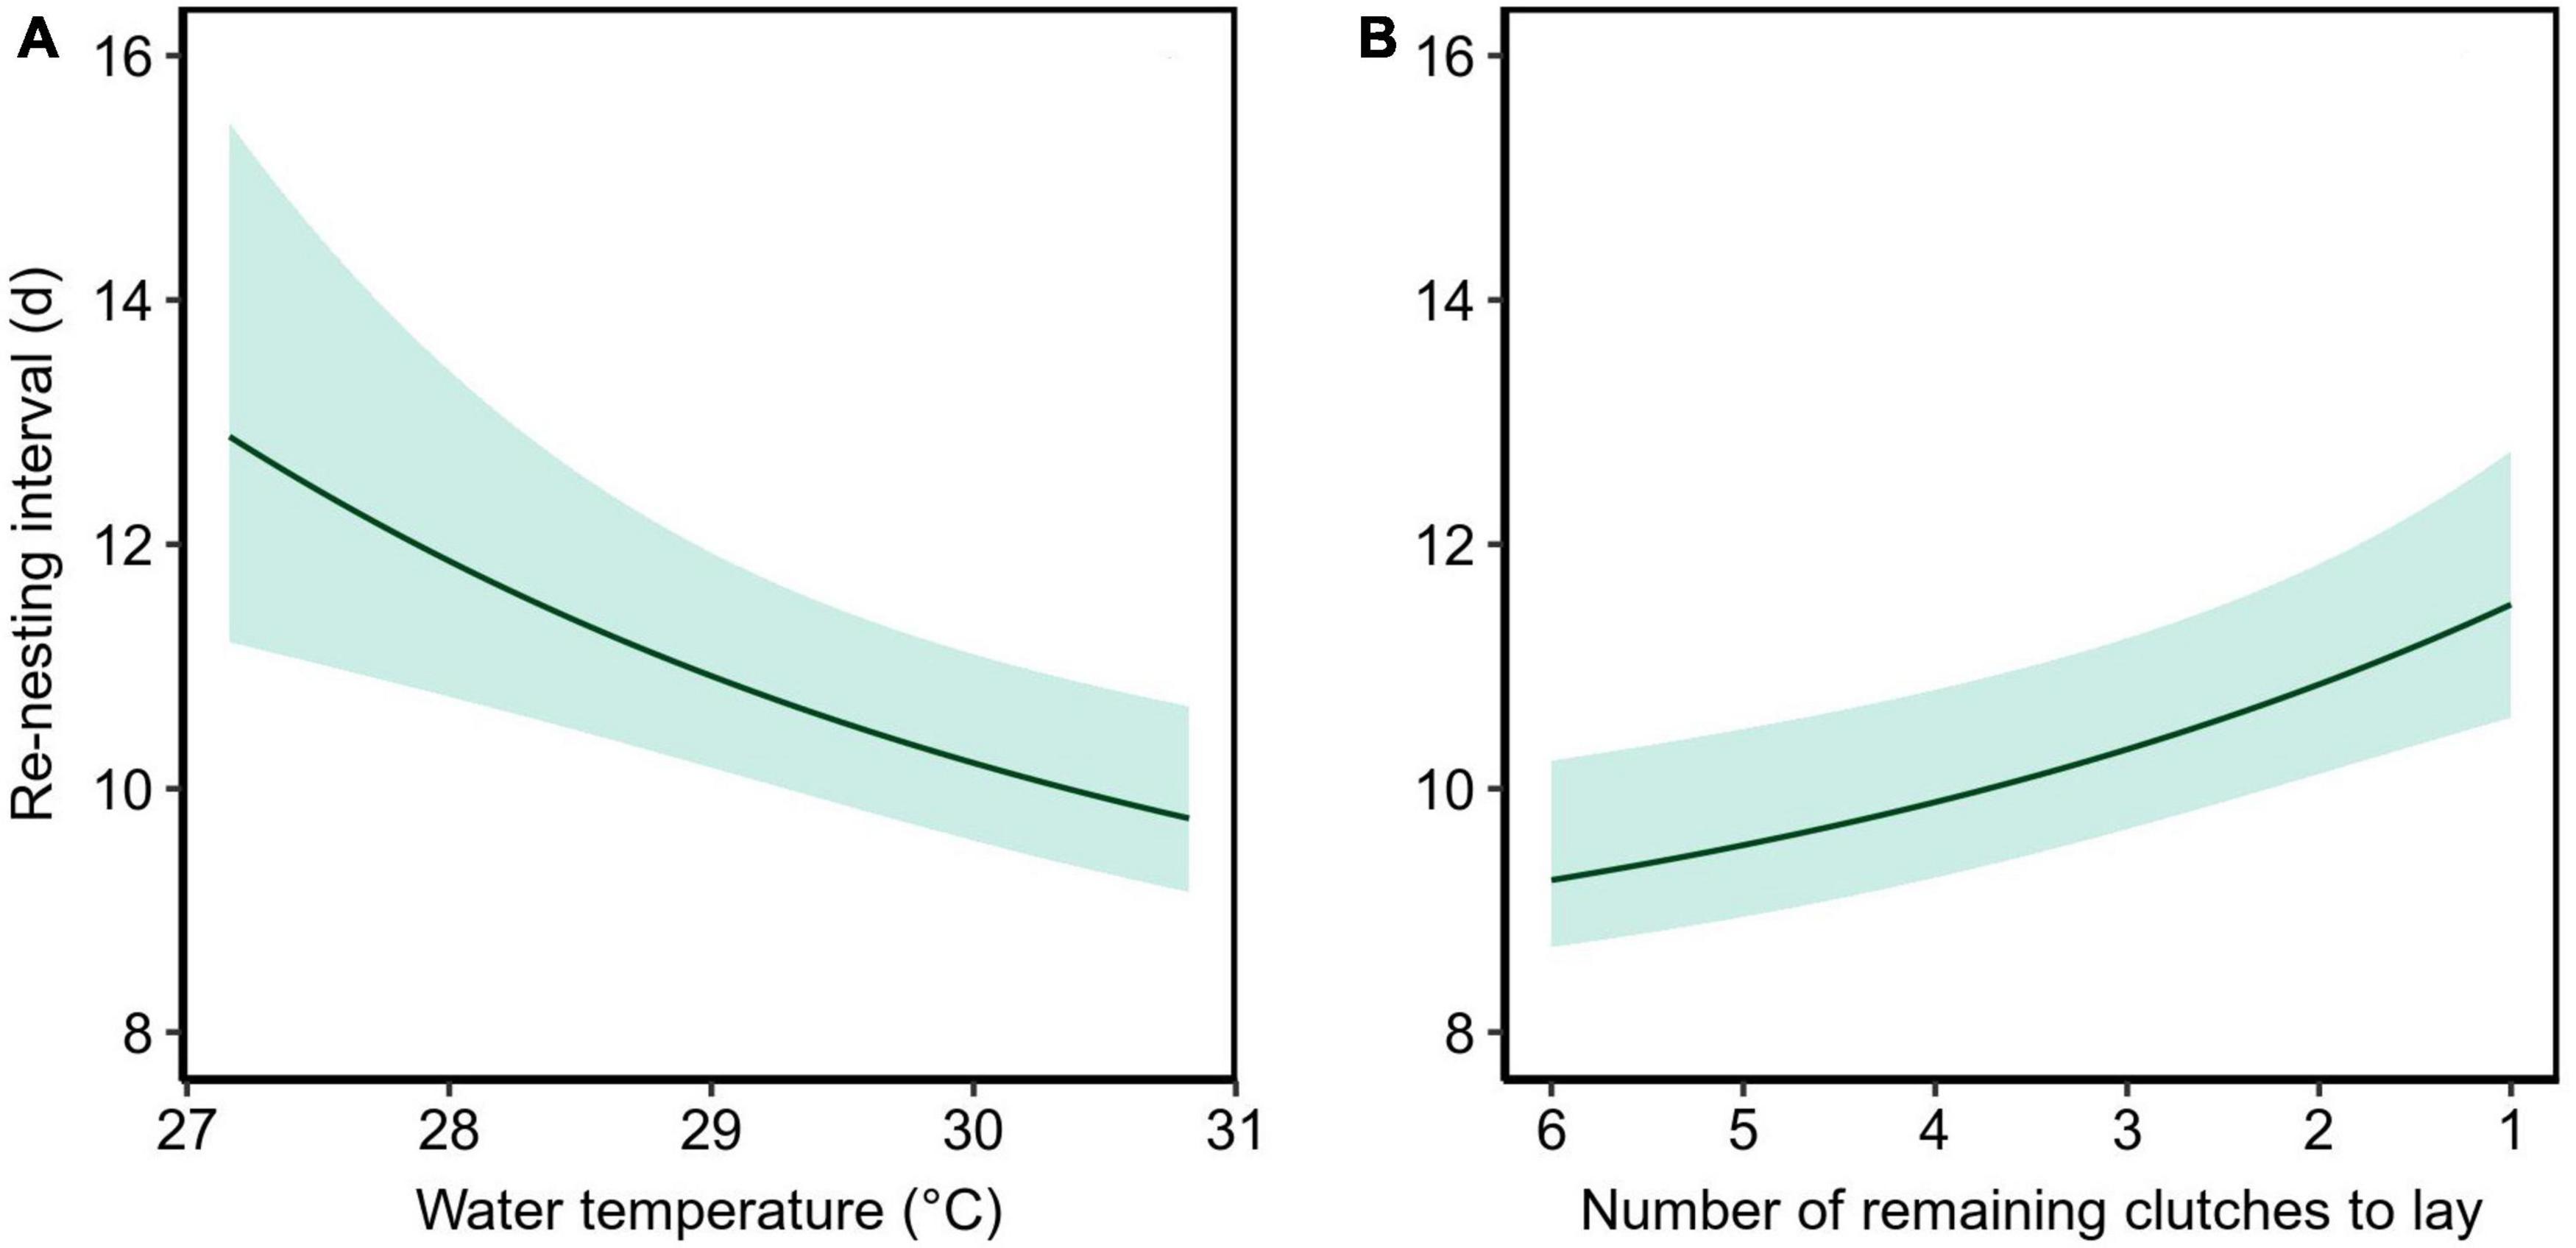
Figure 5. Effects of (A) the water temperature experienced by the turtles and (B) the number of remaining clutches to lay on the re-nesting interval observed from 20 turtles that nested after tag deployment at Jazirat Mashabah (n = 13) and Ras Al Baridi (n = 7). Each solid line represents the estimated relationship when held at the other covariate’s mean with the bands showing the 95% confidence intervals.
Nesting Patterns and Drivers
We examined fidelity to nesting sites using 20 turtles that nested after tag deployment at Jazirat Mashabah (n = 13) and Ras Al Baridi (n = 7). Each turtle repeatedly nested at the same site throughout the breeding season. Although one turtle that originally nested on Jazirat Mashabah traveled once to Jazirat Al Fawaidah2, 84 km south-east of Jazirat Mashabah (Figure 1), it failed to nest and returned to Jazirat Mashabah on the following night and nested successfully. The mean distance between successive nests of each turtle was 150 m (95% CI = 84 – 265 m), but some turtles occasionally nested as far as 2.4 km from earlier nests. The variation in the distance was largely attributable to differences among individuals (random effects in the model) based on the estimated standard deviation among individual turtles relative to the magnitude of the fixed effects (Table 1).
GPS and haul-out data allowed us to measure each turtle’s nesting success, which ranged from 0.28 to 1 (Appendix A). Rates were partly affected by the preceding daytime LST, where, elevated temperatures during the day resulted in lower nesting success (Table 1 and Figure 6). The mean rate of nesting success was estimated to be 0.628 (95% CI = 0.469 – 0.762) at mean daytime LST (42.03 °C). Site and rainfall had little effect on nesting success, although rainfall totals were low during most of the beach emergences (mean ± SD, max = 3 ± 11, 51 mm d–1). Variation in nesting success not explained by temperature, site, and rainfall were partly attributable to the individuals (Table 1).
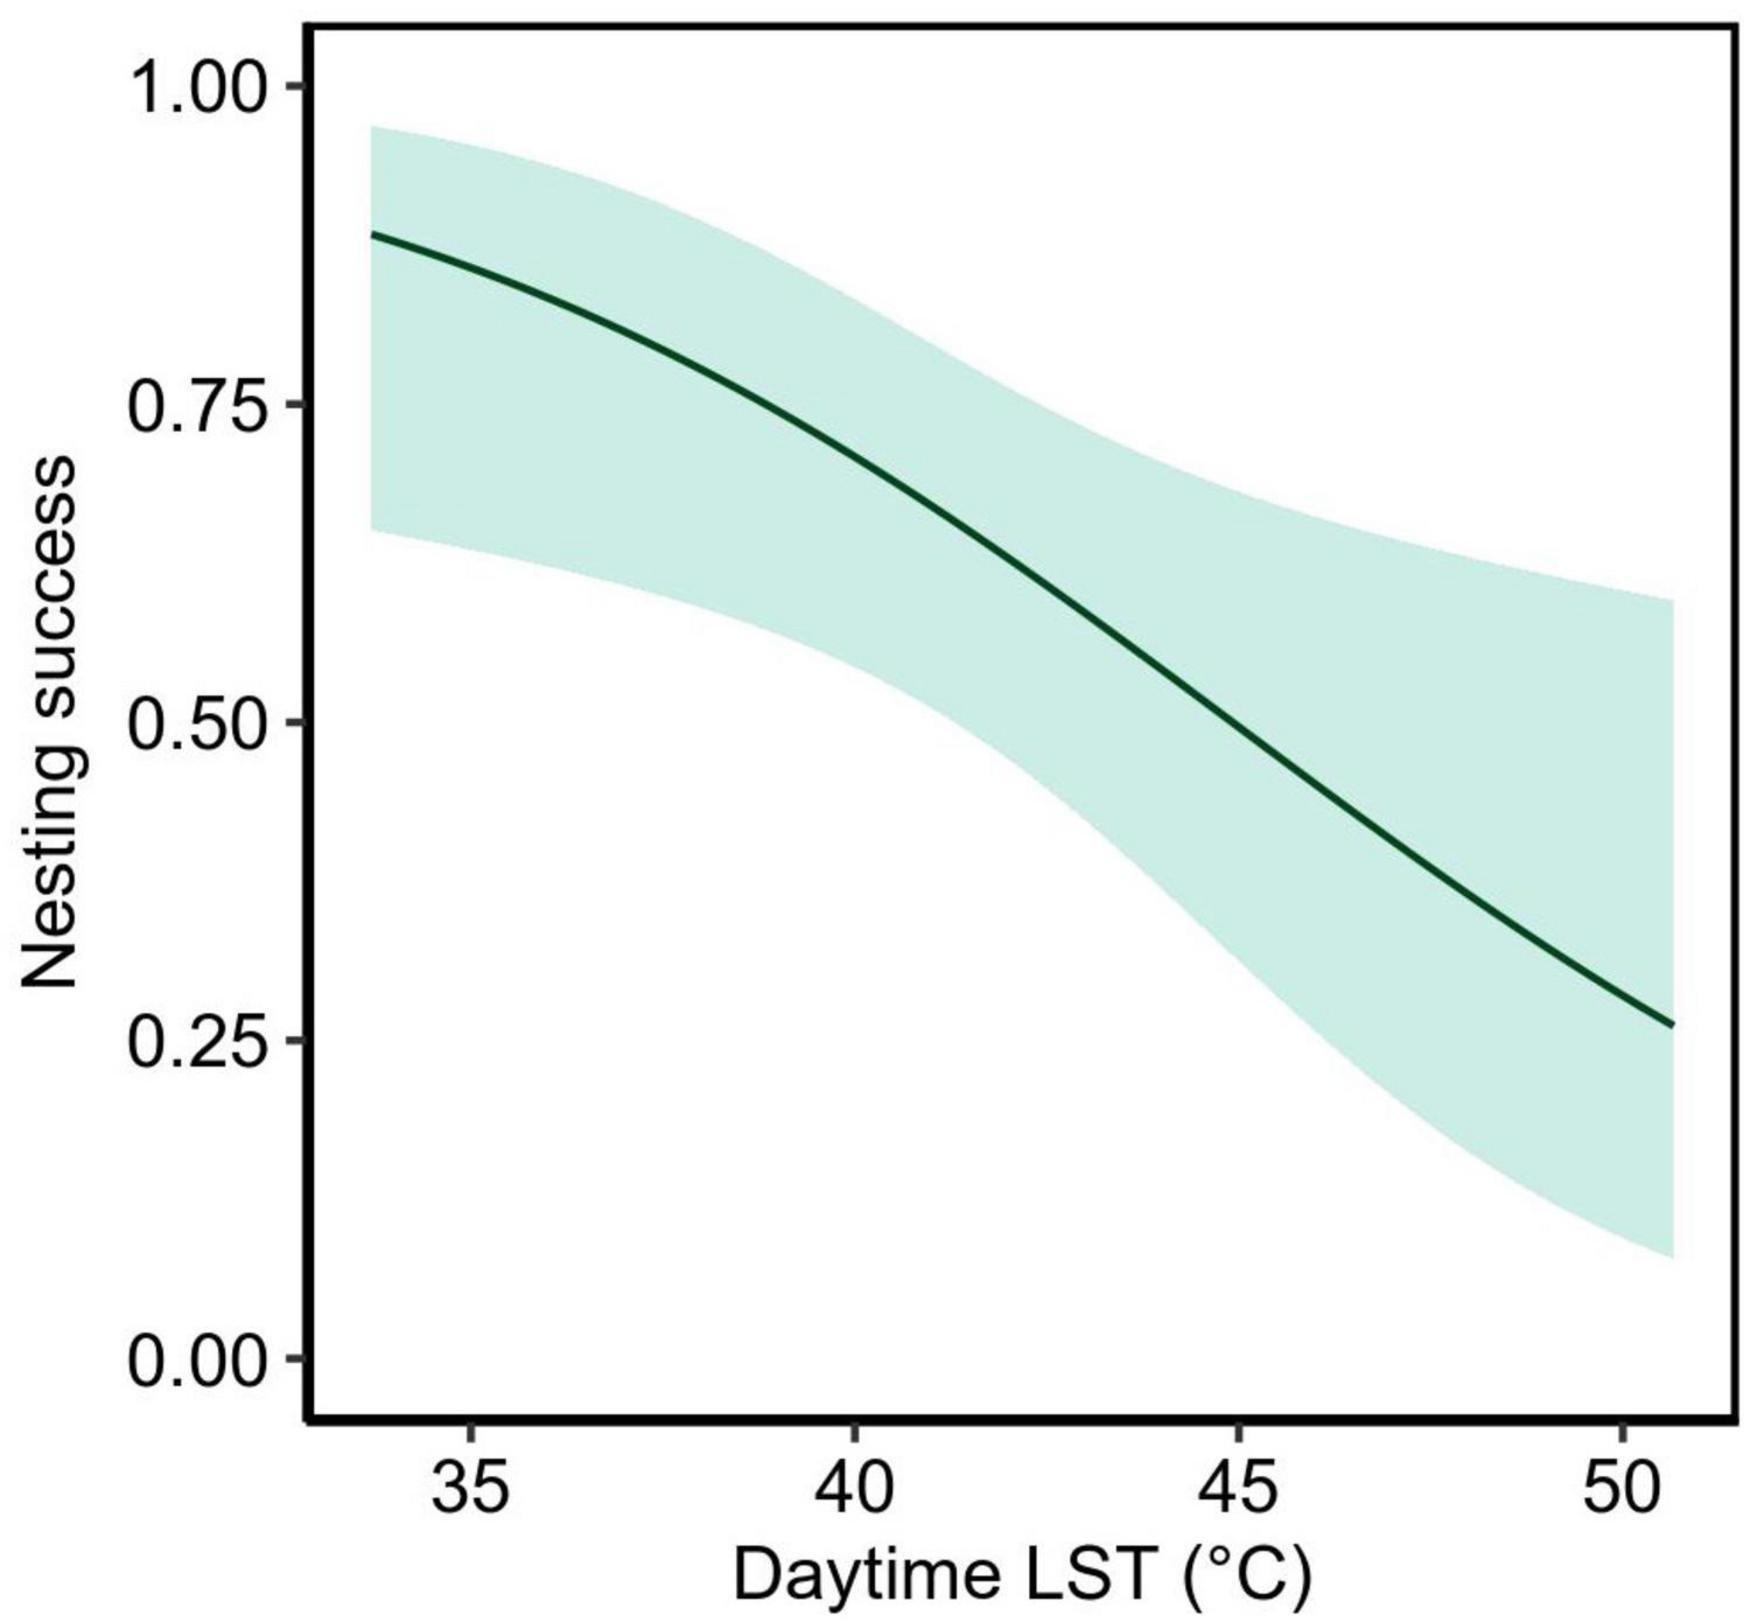
Figure 6. Nesting success (probability of successful nesting per emergence to the beach) in response to the land surface temperature (LST) during a day of each nesting event. The solid line represents the estimated relationship and the band shows the 95% confidence interval.
Discussion
Conservation Opportunities
Our study provides the first detailed assessment of the use of rookeries and inter-nesting habitats by female green sea turtles at Jazirat Mashabah and Ras Al Baridi on the Saudi Arabian coast. We found strong fidelity by individuals to both nesting beaches and inter-nesting habitats throughout the breeding season. Between nesting events, turtles aggregated in waters adjacent to the nesting beaches, suggesting that management strategies targeting these times and places could produce effective conservation outcomes for green turtles in the Red Sea. Of particular conservation importance, there was an average probability of 0.98 that that turtles nesting at Jazirat Mashabah remained within the area managed by the Red Sea Project Development Company during the nesting season.
Our data also provides key metrics that could improve the abundance estimation of nesting turtles from track count data on a beach, and thus enabling tracking of population status through time as a conservation management tool. Counting tracks of nesting turtles is an important means of estimating abundances of nesting sea turtles, especially in remote areas, and is increasingly popular due to the advances in remote technology such as satellites and unmanned aerial vehicles or drones (Rees et al., 2018; Casale and Ceriani, 2019). However, such approaches will over-estimate abundances if nesting success rate is not considered in the analysis. We found a mean nesting success rate of 0.628 at both sites, suggesting that over a third of tracks will represent failed attempts at nesting. Globally, rates of nesting success by green turtles varies from as low as <0.1 to as high as >0.9 among locations (Godley et al., 2001; Limpus et al., 2003; Bourjea et al., 2015). This variation highlights the importance of estimating nesting success for the area of interest to accurately calculate abundance of nesting turtles using track count data. Individuals’ clutch frequency also has the potential to inflate abundance estimates. Although our satellite tracking data provided the number of clutches each turtle laid after tag deployment, this probably under-estimated total clutch frequency as we did not know how many clutches each turtle had laid prior to tagging. Given that our field work occurred immediately after the peak of the nesting season, we expected that on average, each tracked turtle would have already laid more than half of their total clutches before tagging. If correct, this would double our estimates of mean total clutch frequency from 2.5 to 5 or more. This rough estimate seems plausible because it is consistent with the average clutch frequency (5-6) of this species reported from different rookeries across the species range (Limpus et al., 2001; Limpus, 2009; Esteban et al., 2017).
Satellite tracking data combined with beach surveys also provided an important opportunity to reveal potential threats to the green turtles at Jazirat Mashabah and Ras Al Baridi, and in the surrounding inter-nesting habitats. Cliff falls on eroding beaches appear to be an overlooked source of mortality for nesting females. If an adult turtle lands upside down on the carapace after a fall, it cannot right itself and will die due to heat exhaustion, dehydration or predation. Together with potential risks in inter-nesting habitats (e.g., boat strikes), our results suggest that the mortality rate of nesting green turtles may be substantial on these rookeries (two deaths out of 30 tagged individuals). This is concerning given the depleted status of this species and data deficiency for the populations in the Red Sea (Seminoff, 2004). Although we were able to rescue some turtles during our field work (Supplementary Video 1 and Supplementary Figure 1D), such opportunistic practices cannot be a sustainable solution without a long-term daily monitoring program. A simpler option might be to erect fences along the cliff edge to direct nesting turtles back to the sea, together with interventions aimed at protecting nesting beaches from erosion and realigning the beaches to yield slopes safe for nesting turtles. Additionally, seasonal restrictions (e.g., March – December) on boating at the inter-nesting habitats that we identified could be effective to reduce the potential for boat strikes (e.g., Limpus and Limpus, 2003).
Implications for Reproductive Ecology
Our results identified daytime temperatures as a key determinant of suitability for nesting females at both Jazirat Mashabah and Ras Al Baridi. The probability of nesting success was >0.8 when daytime LST was lower than 37°C but declined by more than half (<0.4) when daytime LST was above 47°C. It is likely that extreme heat during the day facilitated the evaporation of moisture trapped in the sand, making the beach too dry for a turtle to make an egg chamber (Limpus et al., 2003). At lower but relatively high LST (e.g., ∼37°C), a sufficient amount of moisture might have been retained within the sand due to the fine to medium-coarse sand granularity of the beaches (Pilcher and Oakley, 1989), enabling a turtle to nest successfully. Rainfall can improve nesting success by moistening the sand (Limpus et al., 2003), however, there was little rain during our study, which is typical in the northeast Red Sea (Mashat and Abdel Basset, 2011).
Unsuccessful nesting attempts due to high LST and low precipitation can have important implications for the total reproductive output of female turtles. Nesting individuals generally use endogenous reserves (fat, follicles) as a primary source of energy throughout a breeding season (Hamann et al., 2002). Limpus (unpublished data) estimated that the energy expended in ≥8 unsuccessful nesting attempts resulted in the loss of one or more clutches being laid within the breeding season. In our study, females would be required to crawl up beaches approximately 13 times to lay 5 clutches when daytime LST remained above 47°C. This would utilize the endogenous reserves equivalent to a clutch of eggs, assuming the estimate by Limpus is applicable to Red Sea populations. For a green turtle with sufficient reserves to lay 6 clutches, the loss of one clutch would equate a 17% reduction in total clutch frequency for the breeding season. If replicated across all nesting females, this would be a substantial reduction in reproductive output for the stock. Extreme heat is also lethal to embryonic development of all species of sea turtles (Howard et al., 2014). Such possible reductions in nesting and hatching success induced by high temperatures suggest that total reproductive output of this species will likely be compromised in the Red Sea if global warming continues as predicted.
Re-nesting interval varied among individuals and was partially related to water temperature. This is expected, since as ectotherms, the metabolism of green turtles and thus the process of ovulation and egg formation are driven by ambient temperatures (Davenport, 1997; Sato et al., 1998; Hays et al., 2002). However, there were still variations in the re-nesting interval that could not be explained solely by water temperatures. For example, two turtles (QA93527 and QA93579) nested 3 days apart (8th and 11th of October 2019, respectively) and experienced similar temperatures during the successive re-nesting periods (on average 29.9°C and 29.0°C, respectively). Based on these water temperatures, the difference in re-nesting interval was expected to be no more than 1 day (Figure 5A), however the re-nesting interval was 10 days for turtle QA93527 and 13 days for turtle QA93579, a difference of 3 days. This difference was related with the number of clutches that remained for each female to lay, with QA93527 having 4 clutches whereas, QA93579 had only one remaining clutch (Figure 5B). To the best of our knowledge, no studies have reported any effect of the number of mature follicles on re-nesting interval. Nonetheless, in the predicted warmer climate, re-nesting interval will be shortened and this may increase survival rates of the nesting turtles through the reduction of exposure to potential risks in the breeding habitats (e.g., predators, vessel strikes, and interactions with fishing). However, the effect of water temperature may also counter-act the energy expenditure spent for nesting if temperatures are too high to achieve good nesting success. This complex interaction between water and land temperatures, together with the effect of remaining mature follicles, warrants further investigations to improve our understanding on the processes of their reproductive ecology.
In addition to environmental effects, we found strong patterns of individual variation in nesting success, re-nesting intervals, and site fidelity. These differences may be partially attributable to age, with older turtles more efficient at nesting and having greater fidelity to certain nesting sites than younger individuals. Such ontogenetic shifts in site fidelity have been reported for many sea birds and are thought to benefit reproductive fitness (Pyle et al., 2001; Votier et al., 2017). Testing this hypothesis for sea turtles would be very challenging because they are slow to mature (typically >30 years for green turtles), each individual can breed multiple times over several decades, and at present we lack a non-lethal means for aging (Miller, 1997; Avens and Snover, 2013). Notwithstanding, small proportions of nesting sea turtles (potentially younger individuals) are reported to nest over a much wider range than others within populations (Dethmers et al., 2006; Limpus and Miller, 2008). It is argued that this is a mechanism that increases gene flow and may be an adaptation to changing environmental conditions.
Conclusion
Green turtles nesting in the northeast Red Sea displayed strong fidelity to nesting beaches and inter-nesting habitats, typical of this species throughout their range (e.g., Clyde-Brockway et al., 2019; Mettler et al., 2020). Our study provided key metrics for long-term assessment of population trends using remote or in-situ techniques. Importantly, some emerging threats were identified, notably the possibility of reduced reproductive output with increasing land temperatures due to climate change. There are immediate opportunities for conservation gains for the species, through targeted spatial and temporal management of nesting beaches and inter-nesting habitats using simple solutions such as fencing cliff edges, along with more long-term efforts involving interventions to prevent and correct beach erosion (e.g., Dunstan and Robertson, 2018). Actions such as these contribute to sustainable coastal development and conservation of this charismatic species. These efforts not only benefit the ecosystem but also have the potential to provide opportunities for environmental education by attracting large numbers of tourists to observe nesting and hatching of turtles (Tisdell and Wilson, 2005).
Data Availability Statement
The raw data supporting the conclusions of this article are available on request to the corresponding author.
Ethics Statement
The animal study was reviewed and approved by The Institutional Animal Care and Use Committee, King Abdullah University of Science and Technology (KAUST). Written informed consent was obtained from the individual(s) for the publication of any potentially identifiable images or data included in this article.
Author Contributions
TS conceived the study, led the data collection assisted by LT, AA-S, and CD, analyzed the data, and wrote the manuscript with MM with contribution from CD and LT. CD and AA-S secured funding with TS. All authors approved the submitted version.
Funding
This research was funded by The Red Sea Development Company (TRSDC), KAUST, and Australian Institute of Marine Science.
Conflict of Interest
The authors declare that this study received funding from TRSDC. The funder had the following involvement with the study: approved the submission before publication.
The authors declare that the research was conducted in the absence of any commercial or financial relationships that could be construed as a potential conflict of interest.
Publisher’s Note
All claims expressed in this article are solely those of the authors and do not necessarily represent those of their affiliated organizations, or those of the publisher, the editors and the reviewers. Any product that may be evaluated in this article, or claim that may be made by its manufacturer, is not guaranteed or endorsed by the publisher.
Acknowledgments
We thank the staff and numerous volunteers of TRSDC, BDC, and KAUST for their support, in particular Russell E. Brainard, Raied A. Ajahdali, Fawaz Najdi, Kirsty Scott, Tito P. Pancho, Amr Gusti, Reny Devassy, James Massey, Alexander Kattan, Susann Rossbach, Alejandra Ortega, and Nathan Geraldi. We also thank Colin J. Limpus for providing flipper tagging equipment as an in-kind contribution and sharing valuable unpublished findings.
Supplementary Material
The Supplementary Material for this article can be found online at: https://www.frontiersin.org/articles/10.3389/fmars.2021.633814/full#supplementary-material
Footnotes
References
Avens, L., and Snover, M. L. (2013). “Age and age estimation in sea turtles,” in The Biology of Sea Turtles, Volume III, eds J. Wyneken, K. J. Lohmann, and J. A. Musick (Boca Raton, FL: CRC Press), 97–133. doi: 10.1201/b13895
Bates, D., Mächler, M., Bolker, B., and Walker, S. (2015). Fitting linear mixed-effects models using lme4. J. Stat. Softw. 67:48. doi: 10.18637/jss.v067.i01
Benhamou, S. (2011). Dynamic approach to space and habitat use based on biased random bridges. PLoS One 6:e14592. doi: 10.1371/journal.pone.0014592
Benhamou, S., and Cornélis, D. (2010). Incorporating movement behavior and barriers to improve kernel home range space use estimates. J. Wildl. Manage. 74, 1353–1360. doi: 10.2193/2009-441
Bourjea, J., Dalleau, M., Derville, S., Beudard, F., Marmoex, C., M’Soili, A., et al. (2015). Seasonality, abundance, and fifteen-year trend in green turtle nesting activity at Itsamia. Endanger. Species Res. 27, 265–276. doi: 10.3354/esr00672
Boyd, I. L., Staniland, I. J., and Martin, A. R. (2002). Distribution of foraging by female Antarctic fur seals. Mar. Ecol. Prog. Ser. 242, 285–294. doi: 10.3354/meps242285
Calenge, C. (2006). The package “adehabitat” for the R software: a tool for the analysis of space and habitat use by animals. Ecol. Model. 197, 516–519. doi: 10.1016/j.ecolmodel.2006.03.017
Casale, P., and Ceriani, S. A. (2019). Satellite surveys: a novel approach for assessing sea turtle nesting activity and distribution. Mar. Biol. 166:47. doi: 10.1007/s00227-019-3494-4
Chalastani, V. I., Manetos, P., Al-Suwailem, A. M., Hale, J. A., Vijayan, A. P., Pagano, J., et al. (2020). Reconciling tourism development and conservation outcomes through marine spatial planning for a Saudi Giga-Project in the Red Sea (The Red Sea Project, Vision 2030). Front. Mar. Sci. 7:168. doi: 10.3389/fmars.2020.00168
Clyde-Brockway, C., Robinson, N. J., Blanco, G. S., Morreale, S. J., Spotila, J. R., Tomillo, P. S., et al. (2019). Local variation in the internesting behavior of green turtles in the Gulf of Papagayo. Chelonian Conserv. Biol. 18, 217–230. doi: 10.2744/CCB-1352.1
Davenport, J. (1997). Temperature and the life-history strategies of sea turtles. J. Therm. Biol. 22, 479–488. doi: 10.1016/S0306-4565(97)00066-1
Dethmers, K. E. M., Broderick, D., Moritz, C., Fitzsimmons, N. N., Limpus, C. J., Lavery, S., et al. (2006). The genetic structure of Australasian green turtles (Chelonia mydas): exploring the geographical scale of genetic exchange. Mol. Ecol. 15, 3931–3946. doi: 10.1111/j.1365-294X.2006.03070.x
Dunstan, A. J., and Robertson, K. (2018). Raine Island Recovery Project: 2017-18 Season technical report to the Raine Island Scientific Advisory Committee and Raine Island Reference Group. Brisbane: Department of National Parks, Sport and Racing, Queensland Government.
Esteban, N., Mortimer, J. A., and Hays, G. C. (2017). How numbers of nesting sea turtles can be overestimated by nearly a factor of two. Proc. Biol. Sci. 284:20162581. doi: 10.1098/rspb.2016.2581
Evans, J. S. (2020). spatialEco: Spatial Analysis and Modelling Utilities. Available online at: https://github.com/jeffreyevans/spatialEco (accessed July 8, 2020).
Ferreira, L. C., Thums, M., Fossette, S., Wilson, P., Shimada, T., Tucker, A. D., et al. (2021). Multiple satellite tracking datasets inform green turtle conservation at a regional scale. Divers. Distrib. 27, 249–266. doi: 10.1111/ddi.13197
Fox, J., and Weisberg, S. (2019). An R Companion to Applied Regression. 3rd Edn. Thousand Oaks, CA: SAGE Publications, Inc. Available online at: https://socialsciences.mcmaster.ca/jfox/Books/Companion/ (accessed May 17, 2020).
Godley, B. J., Broderick, A. C., and Hays, G. C. (2001). Nesting of green turtles (Chelonia mydas) at Ascension Island, South Atlantic. Biol. Conserv. 97, 151–158. doi: 10.1016/S0006-3207(00)00107-5
Hamann, M., Fuentes, M. M. P. B., Ban, N. C., and Mocellin, V. J. L. (2013). “Climate change and marine turtles,” in The Biology of Sea Turtles, Volume III, eds J. Wyneken, K. J. Lohmann, and J. A. Musick (Boca Raton, FL: CRC Press), 353–378.
Hamann, M., Limpus, C. J., and Owens, D. W. (2003). “Reproductive cycles of males and females,” in The Biology of Sea Turtles, Volume II, eds P. L. Lutz, J. A. Muzick, and J. Wyneken (Boca Raton, FL: CRC Press), 135–161.
Hamann, M., Limpus, C., and Whittier, J. (2002). Patterns of lipid storage and mobilisation in the female green sea turtle (Chelonia mydas). J. Comp. Physiol. B 172, 485–493. doi: 10.1007/s00360-002-0271-2
Hartig, F. (2020). DHARMa: Residual Diagnostics for Hierarchical (multi-level / mixed) Regression Models. Available online at: https://cran.r-project.org/package=DHARMa (accessed April 08, 2021).
Hays, G. C., Broderick, A. C., Glen, F., Godley, B. J., Houghton, J. D. R., and Metcalfe, J. D. (2002). Water temperature and internesting intervals for loggerhead (Caretta caretta) and green (Chelonia mydas) sea turtles. J. Therm. Biol. 27, 429–432. doi: 10.1016/S0306-4565(02)00012-8
Houghton, J. D. R., Broderick, A. C., Godley, B. J., Metcalfe, J. D., and Hays, G. C. (2002). Diving behaviour during the internesting interval for loggerhead turtles Caretta caretta nesting in Cyprus. Mar. Ecol. Prog. Ser. 227, 63–70. doi: 10.3354/meps227063
Howard, R., Bell, I., and Pike, D. A. (2014). Thermal tolerances of sea turtle embryos: current understanding and future directions. Endanger. Species Res. 26, 75–86. doi: 10.3354/esr00636
Huffman, G. J., Stocker, E. F., Bolvin, D. T., Nelkin, E. J., and Tan, J. (2019). GPM IMERG Final Precipitation L3 1 day 0.1 degree x 0.1 degree V06. doi: 10.5067/GPM/IMERGDF/DAY/06.p
Hussey, N. E., Kessel, S. T., Aarestrup, K., Cooke, S. J., Cowley, P. D., Fisk, A. T., et al. (2015). Aquatic animal telemetry: a panoramic window into the underwater world. Science 348:1255642. doi: 10.1126/science.1255642
Jensen, M., Miller, J., FitzSimmons, N., and Al-Merghani, M. (2019). Identification of chelonia mydas populations in The Kingdom of Saudi Arabia through regional genetic analyses. Mar. Turtle Newslett. 156, 16–20.
Jensen, M. P., FitzSimmons, N. N., and Dutton, P. H. (2013). “Molecular genetics of sea turtles,” in The Biology of Sea Turtles, Volume III, eds J. Wyneken, K. J. Lohmann, and J. A. Musick (Boca Raton, FL: CRC Press), 135–161.
Limpus, C. J. (2009). A Biological Review of Australian Marine Turtles. ed. L. Fien Brisbane: Queensland Environmental Protection Agency.
Limpus, C. J., Carter, D., and Hamann, M. (2001). The green turtle. Chelonian Conserv. Biol. 4, 34–46.
Limpus, C. J., Couper, P. J., and Read, M. A. (1994). The green turtle. Mem. Queensl. Mus. 35, 139–154.
Limpus, C. J., and Limpus, D. J. (2003). “Biology of the loggerhead turtle in western south Pacific Ocean foraging areas,” in Loggerhead Sea Turtles, eds A. B. Bolten and B. E. Witherington (Washington, DC: Smithsonian Books), 93–113.
Limpus, C. J., and Miller, J. D. (2008). Australian Hawksbill Turtle Population Dynamics Project. ed. L. Fien Queensland: Environmental Protection Agency.
Limpus, C. J., Miller, J. D., Parmenter, C. J., and Limpus, D. J. (2003). The green turtle. Mem. Queensl. Mus. 49, 349–440.
Lutcavage, M. E., Plotkin, P., Witherington, B., and Lutz, P. L. (1997). “Human impacts on sea turtle survival,” in The Biology of Sea Turtles, Volume I, eds P. L. Lutz and J. A. Musick (Boca Raton, FL: CRC Press), 387–409. doi: 10.1201/9780203737088
Mashat, A., and Abdel Basset, H. (2011). Analysis of rainfall over Saudi Arabia. JKAU. Met. Env. Arid Land Agric. Sci. 22, 59–78.
Mettler, E. K., Clyde-Brockway, C. E., Sinclair, E. M., Paladino, F. V., and Honarvar, S. (2020). Determining critical inter-nesting, migratory, and foraging habitats for the conservation of East Atlantic green turtles (Chelonia mydas). Mar. Biol. 167:106. doi: 10.1007/s00227-020-03724-8
Miller, J. D. (1997). “Reproduction in sea turtles,” in The Biology of Sea Turtles, Volume I, eds P. L. Lutz and J. A. Musick (Boca Raton, FL: CRC Press), 51–81.
Oppel, S., Bolton, M., Carneiro, A. P. B., Dias, M. P., Green, J. A., Masello, J. F., et al. (2018). Spatial scales of marine conservation management for breeding seabirds. Mar. Policy 98, 37–46. doi: 10.1016/j.marpol.2018.08.024
Pilcher, N. J. (1999). Cement dust pollution as a cause of sea turtle hatchling mortality at Ras Baridi, Saudi Arabia. Mar. Pollut. Bull. 38, 966–969. doi: 10.1016/S0025-326X(99)00110-1
Pilcher, N. J., and Al-Merghani, M. (2000). Reproductive biology of green turtles at Ras Baridi, Saudi Arabia. Herpetol. Rev. 31, 142–147.
Pilcher, N., and Oakley, S. G. (1989). The Green Turtle Chelonia Mydas in Saudi Arabia - 1989. Riyadh: National Commission for Wildlife Conservation and Development (NCWCD).
Pyle, P., Sydeman, W. J., and Hester, M. (2001). Effects of age, breeding experience, mate fidelity and site fidelity on breeding performance in a declining population of Cassin’s auklets. J. Ani. Ecol. 70, 1088–1097. doi: 10.1046/j.0021-8790.2001.00567.x
Core Team (2020). R: a Language and Environment for Statistical Computing. Vienna: R Foundation for Statistical Computing.
Rees, A. F., Avens, L., Ballorain, K., Bevan, E., Broderick, A. C., Carthy, R. R., et al. (2018). The potential of unmanned aerial systems for sea turtle research and conservation: a review and future directions. Endanger. Species Res. 35, 81–100. doi: 10.3354/esr00877
Robinson, P. W., Costa, D. P., Crocker, D. E., Gallo-Reynoso, J. P., Champagne, C. D., Fowler, M. A., et al. (2012). Foraging behavior and success of a mesopelagic predator in the northeast Pacific Ocean: insights from a data-rich species, the northern elephant seal. PLoS One 7:e36728. doi: 10.1371/journal.pone.0036728
Sato, K., Matsuzawa, Y., Tanaka, H., Bando, T., Minamikawa, S., Sakamoto, W., et al. (1998). Internesting intervals for loggerhead turtles, Caretta caretta, and green turtles, Chelonia mydas, are affected by temperature. Can. J. Zool. 76, 1651–1662. doi: 10.1139/z98-107
Seaman, D. E., and Powell, R. A. (1996). An evaluation of the accuracy of kernel density estimators for home range analysis. Ecology 77, 2075–2085. doi: 10.2307/2265701
Seminoff, J. A. (2004). Chelonia mydas. The IUCN Red List of Threatened Species 2004: e.T4615A11037468, Gland, Switzerland: IUCN. doi: 10.2305/IUCN.UK.2004.RLTS.T4615A11037468.en
Shimada, T. (2018). SDLfilter: R Package for Filtering and Assessing the Sample Size of Tracking Data. doi: 10.5281/zenodo.3631115
Shimada, T., Meekan, M. G., Baldwin, R., Al-Suwailem, A. M., Clarke, C., Santillan, A. S., et al. (in press). Distribution and temporal trends in the abundance of nesting sea turtles in the Red Sea. Biol. Conserv. doi: 10.1016/j.biocon.2021.1092305
Shimada, T., Jones, R., Limpus, C., Groom, R., and Hamann, M. (2016a). Long-term and seasonal patterns of sea turtle home ranges in warm coastal foraging habitats: lmplications for conservation. Mar. Ecol. Prog. Ser. 562, 163–179. doi: 10.3354/meps11972
Shimada, T., Jones, R., Limpus, C., and Hamann, M. (2012). Improving data retention and home range estimates by data-driven screening. Mar. Ecol. Prog. Ser. 457, 171–180. doi: 10.3354/meps09747
Shimada, T., Limpus, C. J., Hamann, M., Bell, I., Esteban, N., Groom, R., et al. (2020). Fidelity to foraging sites after long migrations. J. Ani. Ecol. 89, 1008–1016. doi: 10.1111/1365-2656.13157
Shimada, T., Limpus, C., Jones, R., and Hamann, M. (2017). Aligning habitat use with management zoning to reduce vessel strike of sea turtles. Ocean Coastal Manage. 142, 163–172. doi: 10.1016/j.ocecoaman.2017.03.028
Shimada, T., Limpus, C., Jones, R., Hazel, J., Groom, R., and Hamann, M. (2016b). Sea turtles return home after intentional displacement from coastal foraging areas. Mar. Biol. 163:8. doi: 10.1007/s00227-015-2771-0
Shimada, T., Thums, M., Hamann, M., Limpus, C. J., Hays, G. C., FitzSimmons, N. N., et al. (2021). Optimising sample sizes for animal distribution analysis using tracking data. Methods Ecol. Evol. 12, 288–297. doi: 10.1111/2041-210X.13506
Tisdell, C., and Wilson, C. (2005). Perceived impacts of ecotourism on environmental learning and conservation: turtle watching as a case study. Environ. Dev. Sustain. 7, 291–302. doi: 10.1007/s10668-004-7619-6
Votier, S. C., Fayet, A. L., Bearhop, S., Bodey, T. W., Clark, B. L., Grecian, J., et al. (2017). Effects of age and reproductive status on individual foraging site fidelity in a long-lived marine predator.Proc. Biol. Sci. 284:20171068. doi: 10.1098/rspb.2017.1068
Wan, Z., Hook, S., and Hulley, G. (2015). MOD11C1 MODIS/Terra Land Surface Temperature/Emissivity Daily L3 Global 0.05Deg CMG V006 [Data Set], Sioux Falls, South Dakota: NASA EOSDIS Land Processes DAAC. doi: 10.5067/MODIS/MOD11C1.006
Keywords: reproductive ecology, climate change, coastal development, Fastloc GPS telemetry, warming temperature, nesting success, re-nesting intervals, inter-nesting habitat
Citation: Shimada T, Duarte CM, Al-Suwailem AM, Tanabe LK and Meekan MG (2021) Satellite Tracking Reveals Nesting Patterns, Site Fidelity, and Potential Impacts of Warming on Major Green Turtle Rookeries in the Red Sea. Front. Mar. Sci. 8:633814. doi: 10.3389/fmars.2021.633814
Received: 26 November 2020; Accepted: 30 April 2021;
Published: 28 July 2021.
Edited by:
Peter H. Dutton, Southwest Fisheries Science Center (NOAA), United StatesReviewed by:
Nathan Jack Robinson, Fundación Oceanográfica, SpainJérôme Bourjea, Institut Français de Recherche pour l’Exploitation de la Mer (IFREMER), France
Copyright © 2021 Shimada, Duarte, Al-Suwailem, Tanabe and Meekan. This is an open-access article distributed under the terms of the Creative Commons Attribution License (CC BY). The use, distribution or reproduction in other forums is permitted, provided the original author(s) and the copyright owner(s) are credited and that the original publication in this journal is cited, in accordance with accepted academic practice. No use, distribution or reproduction is permitted which does not comply with these terms.
*Correspondence: Takahiro Shimada, dGFrYS5zaGltYWRhQGdtYWlsLmNvbQ==