 Nanou Bao1
 Kunshan Gao1,2*
- 1State Key Laboratory of Marine Environmental Science, College of Ocean and Earth Sciences, Xiamen University, Xiamen, China
- 2Co-Innovation Center of Jiangsu Marine Bio-industry Technology, Jiangsu Ocean University, Lianyungang, China
Synechococcus is a major contributor to the primary production in tropic and subtropical oceans worldwide. Responses of this picophytoplankton to changing light and CO2 levels is of general concern to understand its ecophysiology in the context of ocean global changes. We grew Synechococcus sp. (WH7803), originally isolated from subtropic North Atlantic Ocean, under different PAR levels for about 15 generations and examined its growth, photochemical performance and the response of these parameters to elevated CO2 (1,000 μatm). The specific growth rate increased from 6 μmol m–2 s–1 to reach a maximum (0.547 ± 0.026) at 25 μmol m–2 s–1, and then became inhibited at PAR levels over 50 μmol m–2 s–1, with light use efficiency (α) and photoinhibition coefficient (β) being 0.093 and 0.002, respectively. When the cells were grown at ambient and elevated CO2 concentration (400 vs. 1,000 μatm), the high-CO2 grown cells showed significantly enhanced rates of electron transport and quantum yield as well as significant increase in specific growth rate at the limiting and inhibiting PAR levels. While the electron transport rate significantly increased at the elevated CO2 concentration under all tested light levels, the specific growth did not exhibit significant changes under the optimal growth light condition. Our results indicate that Synechococcus WH7803 grew faster under the ocean acidification (OA) treatment induced by CO2 enrichment only under limiting and inhibiting light levels, indicating the interactive effects and implying that the picophytoplankton respond differentially at different depths while exposing changing light conditions.
Introduction
Synechococcus is a group of picoplanktonic cyanobacteria, along with Prochlorococcus constituting the most widespread and abundant group of marine pico-prokaryotic primary producers (Varkey et al., 2016; Kim et al., 2018). Synechococcus strains are distributed widely in both freshwater and oceanic environments, with stain-specific physiological traits under influences of nutrients, temperature and light (Partensky et al., 1999; Callieri et al., 2013; Flombaum et al., 2013; Kim et al., 2018). In marine environments, most species and/or strains of Synechococcus are found more abundantly in mesotrophic and moderately oligotrophic marine environments (Scanlan et al., 2009; Domínguez-Martín et al., 2016) in tropical to subtropical oceans from 40°S to 40°N, contributing by about 16% of the global oceanic annual net primary production (Badger et al., 2006; Flombaum et al., 2013).
Among various strains of Synechococcus, WH7803 is featured with the presence of abundant phycoerythrin (PE), awarding it a distinguishable red appearance (Morris and Glover, 1981; Stockner and Antia, 1986). The absorption spectra of PE (450–600 nm) is similar to the spectra at the bottom of euphotic zone where the irradiance intensity is about 1% of the surface, suggesting this strain can be adapted to dim light levels (Fogg, 1986; Glover et al., 1986; Stockner and Antia, 1986; Piazena et al., 2002; Flombaum et al., 2013). However, vertical mixing processes in the oceans can episodically move Synechococcus cells to shallower layers where light levels are higher (Flombaum et al., 2013), possibly resulting in photoinhibition (Huner et al., 1998). Based on the light attenuation coefficient (Kd) in the clearest pelagic waters, the theoretical light intensity for WH7803 to survive was estimated to be about 23% of the surface intensity (Smith and Baker, 1981). However, laboratory studies revealed that the optimum light levels for its growth ranged from 25 to 200 μmol m–2 s–1 of PAR (Glover and Morris, 1981; Alberte et al., 1984; Barlow and Alberte, 1985; Campbell and Carpenter, 1986; Kana and Glibert, 1987). In spite of the reported wide range of PAR for optimal growth, little has been documented on its photophysiological performances under different PAR levels.
With progressive ocean climate changes, on the other hand, it has been predicted that the abundance of Synechococcus would increase by about 14%, with its distribution range extended to higher latitudes including the Bering Sea, Gulf of Alaska, and Southern Ocean (Flombaum et al., 2013). While increased levels of CO2 and higher temperature were both suggested to influence Synechococcus, experimental tests on its responses to these drivers have been rarely examined (Synechococcus sp. CCMP1334 strain under pCO2 of 750 ppmv at 24°C, pCO2 380 ppmv at 24°C, and pCO2 750 ppmv at 20°C, Fu et al., 2007; Lu et al., 2006). Growth of Synechococcus strains can be stimulated (Fu et al., 2007; Synechococcus sp. CCMP839 strain under pCO2 of 800 ppmv, Lu et al., 2006) or unaffected (Synechococcus elongatus CCMP1379 strain under pCO2 of 350, 600, 800 ppmv and Synechococcus sp. CCMP839 strain under pCO2 of 350 and 600 ppmv, Lu et al., 2006) by elevated CO2 concentrations, showing a strain-specific response when grown under constant light levels (40–45 μmol m–2 s–1 of PAR). It has been suggested that increased availability of CO2 and the associated acidic stress can affect phytoplankton growth to different directions, leading to positive, neutral and negative effects under different light levels (Gao et al., 2012) due to carbon concentration mechanisms (CCMs) regulation and involved energetic changes. Synechococcus strains possess active CCMs, that can concentrate intracellular CO2 up to about 1,000 times higher than that in seawater (Badger and Andrews, 1982). Therefore, we hypothesize that Synechococcus respond differently under different light levels to elevated CO2 concentration projected to future ocean acidification (OA), and increasing CO2 availability and different light levels would result in interactive effects on Synechococcus WH7803 strain, which was isolated from subtropical North Atlantic Ocean where anthropogenic CO2 has been drastically increased with progressive OA (Bates and Johnson, 2020). In this work, we examined physiological performances of the strain WH7803 under various light levels and two CO2 levels (ambient and elevated levels for the present and end of this century, which were about 400 or 1,000 μatm, respectively), and found that the elevated CO2 concentration to 1,000 μatm did not affect its growth rate at the optimal growth light level but enhanced it at light-limiting and inhibiting levels.
Materials and Methods
Synechococcus WH7803 strain, originally isolated from the North Atlantic Ocean (67.496°W, 33.748°N), was obtained from Professor Rui Zhang’s lab at the College of Ocean and Earth, Xiamen University, Xiamen, China. The cells were maintained in A+ medium in 100 mL Quartz tubes under 6 μmol m–2 s–1 light intensity with a light-dark period of 12:12 h at 23.5 ± 0.5°C in an illuminating incubator (HP1000G-D, Wuhan Ruihua Instrument and Equipment Co., Ltd., China). Before inoculation, the medium and quartz tubes were sterilized at 110°C for 30 min in an autoclave.
Light (PAR) intensity within the incubator was measured using Datalogging Radiometer Model PMA2100 (Solar Light Company, Inc., United States). Six PAR levels of 6, 13, 25, 38, 50, and 100 μmol m–2 s–1 were set to grow the Synechococcus cells by adjusting distance from the light source and/or covering with neutral filters. The cultures were aerated (30 ml min–1) with filtered air (0.22 μm, PVDF Syringe Filter, AllPure, United States). There were three replicates of culture at each treatment (n = 3). Each culture under different light levels was run for 15 generations before measurements of the physiological and biochemical parameters, including specific growth rate, electron transport rate, effective quantum yield and pigments concentration. The initial cell concentration was set at about 500,000 cells mL–1. The concentration of cells was monitored at 9:00 am every other day.
Then we set up experiments to test how the picophytoplankton respond to future OA under the elevated CO2 level (1,000 ppmv) based on RCP8.5 senario using the current CO2 level as control (Gattuso et al., 2010; Gao et al., 2012). CO2 concentrations in the culture medium were initially set up at 400 (LC) or 1,000 (HC) μatm by using the CO2 pre-equilibrated medium, which were aerated and prepared through a sterilized filter with outdoor air for LC and the air of 1,000 ppmv CO2 (achieved by using a plant CO2 chamber) for HC, respectively. After pre-equilibration, the pH of the medium was measured by a pH meter (Orion Star A211, Thermo Fisher Scientific, United States). In the cultures at LC and HC treatments (pH 8.1 vs. 7.8), the pHnbs was significantly different at the early phase (4 days) with less difference at the end (day 10) of the cultures. The initial cell concentrations in the cultures under both CO2 levels were 500,000 cells mL–1.
Measurement of Specific Growth Rate
The cell concentration in the cultures was enumerated (each sample for at least 30 s) by a flow cytometer (CytoFLEX S, Beckman Coulter, Inc., United States) with a 488 nm emitter (PE and Chl a are both excited by this laser beam, with the emitted wavelengths of 575 and 675 nm, respectively) (Givan, 2011). The tunnels of the auxiliary software CytExpert 2.0 (Beckman Coulter, Inc., United States) were FSC-A (forward scatter light for diameter), PI-A (690 nm for Chl a) and PAO-A (585 nm for PE). When phycoerythrin and chlorophyll a in Synechococcus cells become excited by 488 light, they emit the characteristic lights as mentioned above. By analyzing those emitted light signals through the software, a Synechococcus cell could be distinguished from other particles based on its species-specific emission wavelength characteristics. The specific growth rates were calculated using the following formula based on the enumerated cells (Iturriaga and Mitchell, 1986):
where N indicates the cell concentration at T time, N0 the initial cell concentration at T0, and Δt the duration (days, T − T0). The non-linear fitting of the specific growth rates to growth light levels was performed using the following formula (Platt et al., 1980):
where PAR is the growth light intensity. The μmax, α and β indicate maximal growth rate, light use efficiency and growth photoinhibition coefficient, respectively.
Measurement of Electron Transport Rate and Effective Quantum Yield
Samples for the measurement of relative electron transport rate (rETR) were collected directly during the exponential growth phase, which had different concentrations of cells as well as the contents of intracellular chlorophyll. The ETR was measured by using a Multi-color Pulse Amplitude Modulated chlorophyll fluorometer (Multi-color PAM, Walz, Germany), setting measuring wavelength of actinic light at 625 nm (measuring mode Al white, with all samples showing the similar basic fluorescence levels). The range of light curve measurement was from 0 to 798 μmol m–2 s–1, which included 13 irradiance steps and each irradiance step was about 10 s. The saturating light pulse (800 ms, 5,000 μmol photons m–2 s–1) was applied for determination of ETR. The rETR was calculated as follows (Ralph and Gademann, 2005):
where ΦPSII represents the measured effective quantum yield of photosystem II, and PAR the measuring or assay light intensity. ΦPSII was determined by setting actinic light level to the growth light level for each sample that had been grown under different light levels.
Measurement of Pigments Concentrations
A 10 mL of culture from each replicate culture was used for the extraction of Chl a and total carotenoids (CARs), and another 10 mL was used for the extraction of APC (allophycocyanin), PC (phycocyanin), and PE (phycoerythrin), respectively. For measurements of Chl a and CARs, cells were collected on 0.22 μm GF/F filter and then extracted in 5 mL of pure methanol for 24 h at 4°C in darkness before being centrifuged at 6,000 × g for 10 min. The supernatant was scanned for absorbance from 400 to 800 nm by using a spectrophotometer (model DU800 Beckman Coulter, United States). The concentrations of Chl a and CARs were determined according to Ritchie (2006) and Strickland and Parsons (1972).
Extractions of APC, PC, and PE were performed according to Lüder et al. (2001) as described by Zhang et al. (2013). Briefly, the collected cells were suspended in 10 mL phosphate buffer. The freezing (liquid nitrogen) and thawing (4°C) processes were repeated for at least four times for each extraction. Optical absorbances of the supernatant after centrifugation were scanned as mentioned above using the spectrophotometer. The concentrations of APC, PC, and PE were calculated according to Lüder et al. (2001).
Data Analysis
One-way ANOVA with post hoc multiple comparisons of Tukey was operated for distinguishing significant (P < 0.05) differences using SPSS (PASW 18.0, IBM, United States), since we need to compare more than two groups with the follow-up post hoc test for analysis of equality of multiple overall mean values. The significant levels (p-values) are given in the Supplementary Material. The fitting and charting were conducted by OriginPro 9.0.0 (64-bit) b45 (OriginLab Corp., United States). All data are presented as the means ± SD of three independent cultures.
Results
The specific growth rate (μ) of Synechococcus WH7803 increased from 6 μmol m–2 s–1 to reach a maximum at 25 μmol m–2 s–1, but thereafter declined with increased levels of PAR (Figure 1), resulting in no significance in μ at between 6 and 100 μmol m–2 s–1 (Supplementary Table 1). The results derived from the non-linear fitting of μ revealed that the growth light use efficiency (α) and high light inhibiting coefficient (β) were 0.093 and 0.002, respectively.
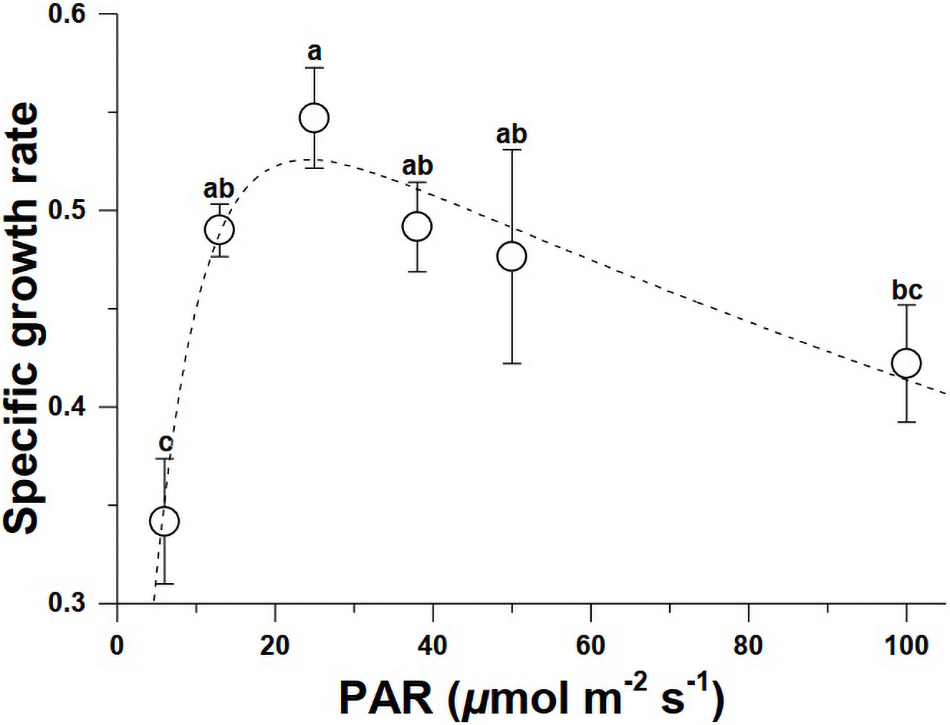
Figure 1. The specific growth rates of Synechococcus WH7803 grown under various PAR levels (n = 3, triplicate cultures). Different letters above the data indicate significant difference (p < 0.05).
The relative electron transport (rETR) during photochemical reactions of the cells grown under 6, 12, 25, and 38 μmol m–2 s–1 of PAR were nearly superimposed, however, the rETRs in the cells grown under 50 and 100 μmol m–2 s–1 significantly increased further with increased levels of PAR (Figure 2A). The maximal rETR in the cells grown at 100 μmol m–2 s–1 was nearly twice that grown at 38 μmol m–2 s–1 or lower PAR levels (Figure 2A). The effective quantum yield did not show significant changes (Figure 2B) (Supplementary Table 2).
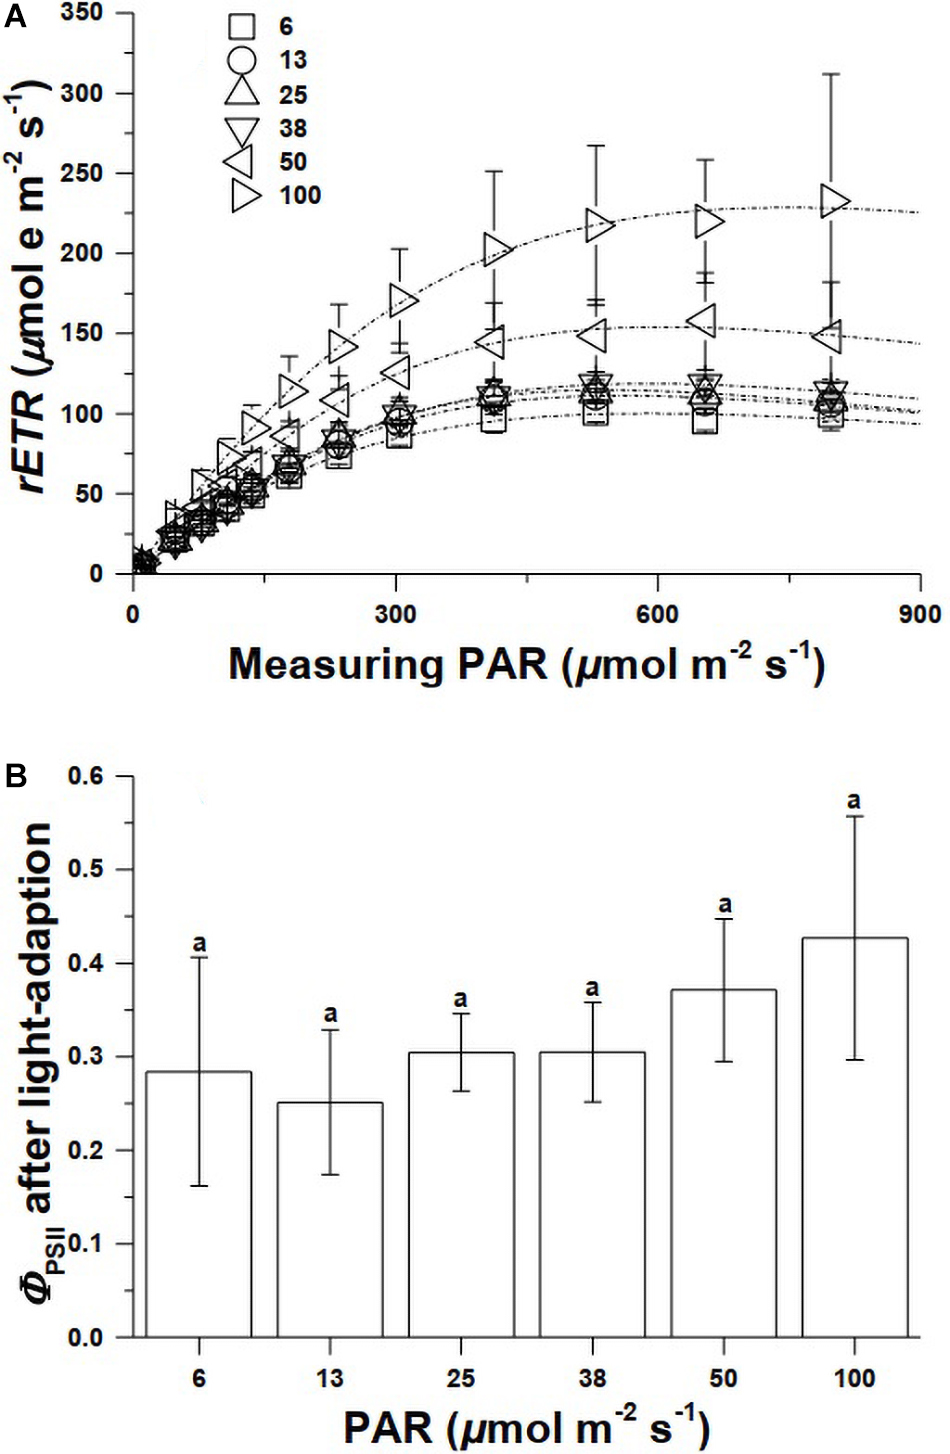
Figure 2. The photosynthetic electron transport vs. light curves of Synechococcus WH7803 grown under different PAR levels (A), and the effective quantum yield (ΦPSII) of the cells adapted to growth light levels (B) (n = 3, triplicate cultures).
When the cells were exposed to elevated CO2 concentrations for about 10 days under 6 (limiting), 25 (optimal), and 100 (inhibiting) μmol m–2 s–1 of PAR, its specific growth rate significantly increased at the limiting and inhibiting growth light levels of 6 and 100 μmol m–2 s–1, respectively (Supplementary Table 3). No significant change was observed between the two CO2 levels under the optimal light level of 25 μmol m–2 s–1 (Figure 3A). The photosynthetic electron transport rate increased significantly with increased light levels, with higher values in the high CO2-grown cells (Figure 3B) (Supplementary Table 4). While elevated CO2 availability appeared to enhance the quantum yield at all test light levels, significant difference was only found at growth light of 100 μmol m–2 s–1 (Figure 3C), though the specific growth rate was enhanced in the high CO2-grown cells at both limiting and inhibiting light levels (Figure 3A).
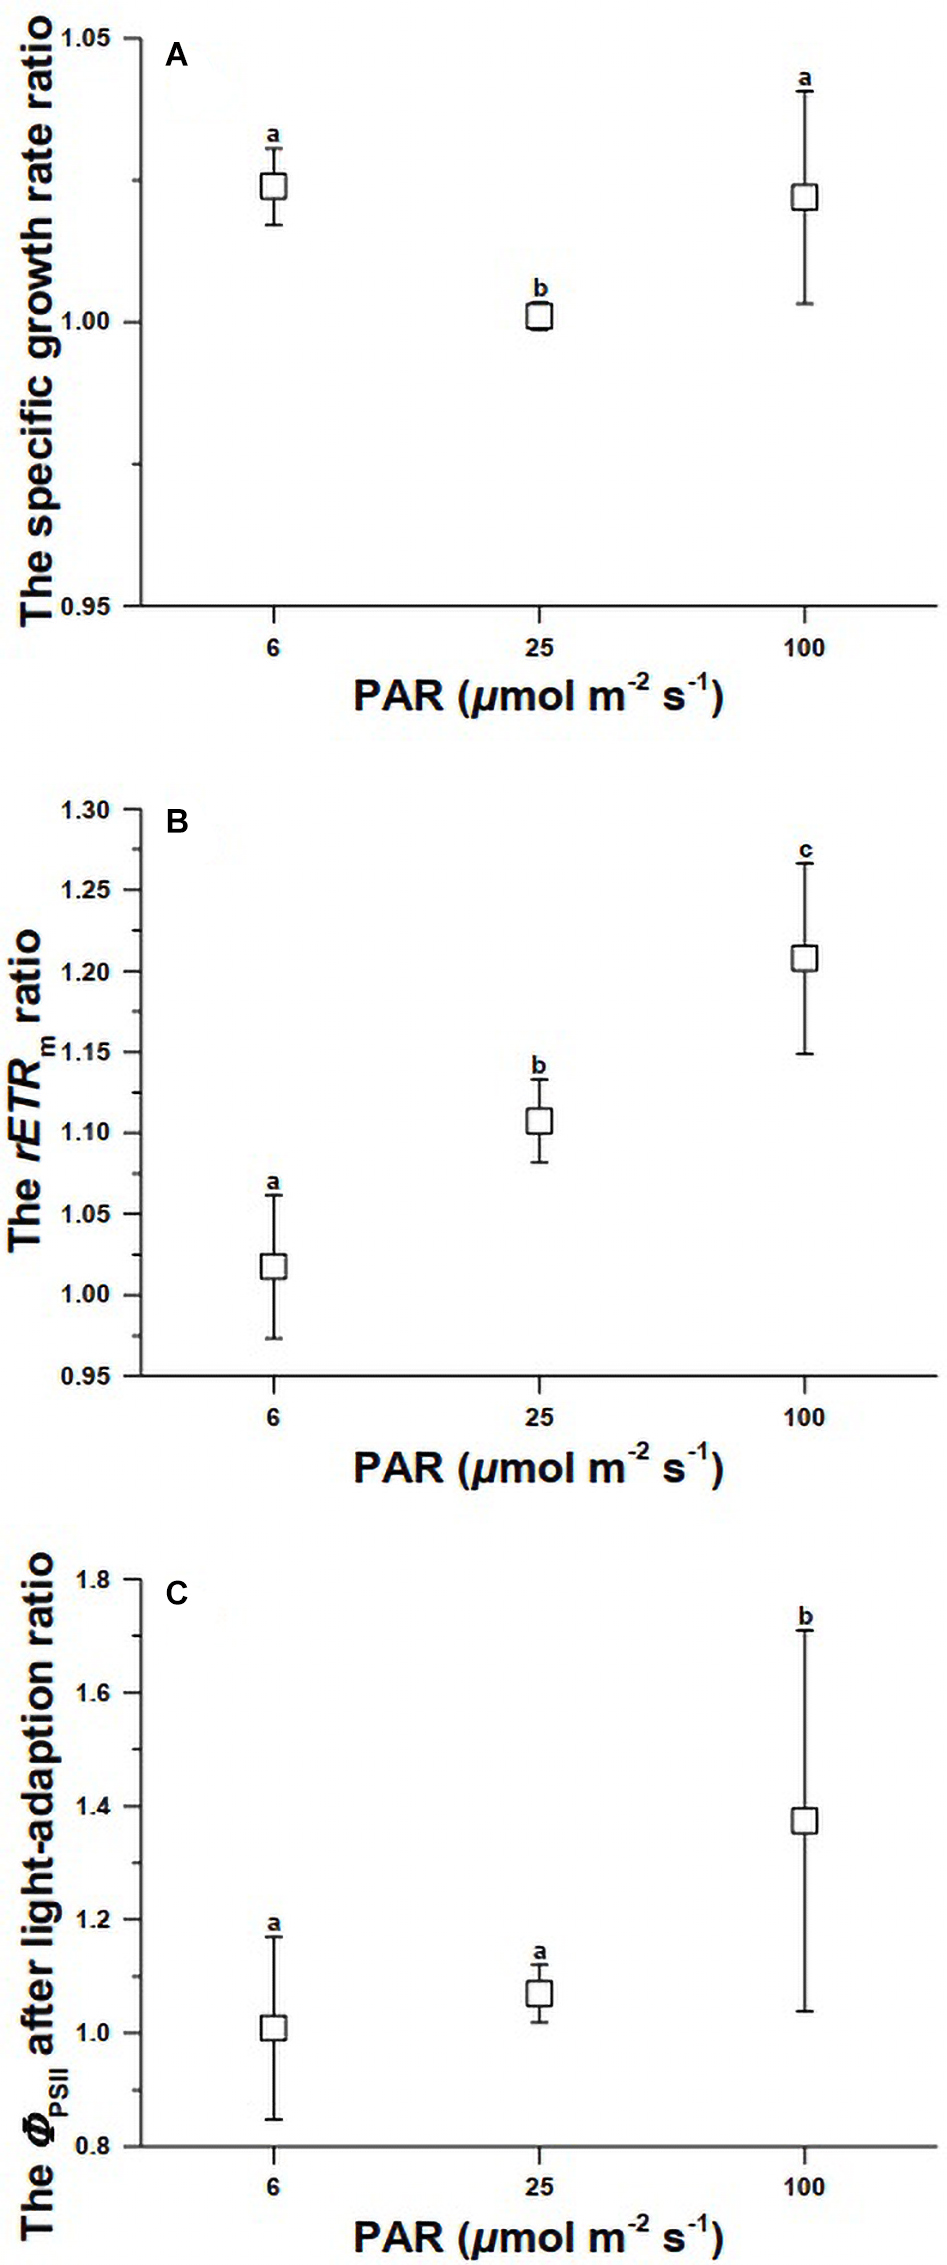
Figure 3. The growth (A), rETR (B), and ΦPSII (C) ratios of high- to low-CO2-grown Synechococcus cells. Different letters above the data indicate significant difference at P < 0.05. The ratios of high CO2-grown to ambient CO2 grown cells were based on the data obtained under three levels of light and two levels of CO2 (18 cultures with each treatment of three replicates). The absolute values for high CO2-grown cells can be obtained using the ratio and the values in Figures 1, 2.
While contents of Chl a (0.013 ± 0.001 for LC and 0.021 ± 0.001 pg cell–1 for HC), carotenoids (0.012 ± 0.002 for LC and 0.019 ± 0.001 pg cell–1 for HC) and phycoerythrin (0.208 ± 0.079 for LC and 0.485 ± 0.030 pg cell–1 for HC) showed significantly higher values at the optimal growth light of 25 μmol m–2 s–1, no significant changes were found among the light levels for allophycocyanin and phycoerythrin (Table 1) (Supplementary Table 5). However, at any of the growth light levels, all types of photosynthetic pigments increased significantly at the elevated CO2 level compared to the ambient level, by 58.76, 57.96, 82.10, 177.13, and 132.91%, respectively, for Chl a, carotenoids, allophycocyanin, phycocyanin, and phycoerythrin in the cells grown at the optimal light intensity (Table 1) (Supplementary Table 5).
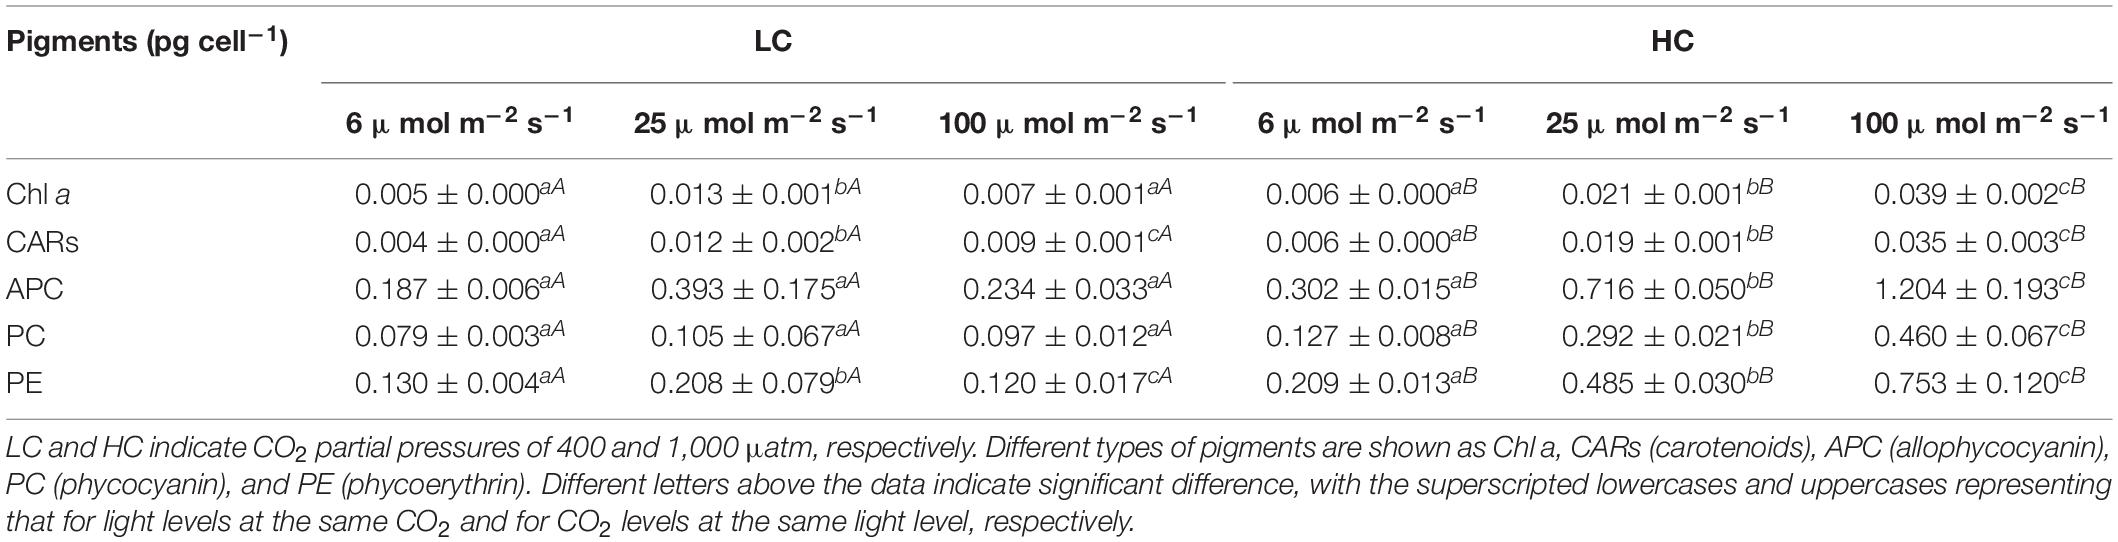
Table 1. The per cell concentrations of pigments (pg cell–1) of Synechococcus WH7803 grown under different light and CO2 levels (n = 3, triplicate cultures).
Discussion
Our results indicate that Synechococcus strain WH7803 accelerated its electron transport rate with increased growth light and CO2 levels, and the elevated CO2 to 1,000 μatm significantly enhanced its growth under limiting (6 μmol m–2 s–1) and inhibiting (100 μmol m–2 s–1) light levels, but did not bring about significant effect on it at the optimal light level of 25 μmol m–2 s–1. Although the extent of the enhancement due to increased CO2 availability at the low and high light levels was only by 2–2.5% per day (Figure 3A), the accumulative effects over longer periods can hardly be ignored considering the large proportion of Synechococcus’s contribution to marine primary productivity. Insignificant effects of elevated CO2 on Synechococcus strains CCM 839 and 1334 were reported when they were grown at optimal light levels of about 40 μmol m–2 s–1 (Lu et al., 2006; Fu et al., 2007). Our finding first demonstrated the positive effects of elevated CO2 on Synechococcus cells grown under limiting and inhibiting light levels and showed consistency with the previous reports (Lu et al., 2006; Fu et al., 2007) on the CO2 effects at optimal light intensity.
In the present study, the specific growth rate of Synechococcus (WH7803) increased to reach a peak at 25 μmol m–2 s–1 but then gradually declined at higher light levels, showing a photoinhibition. Barlow and Alberte (1985) showed that Synechococcus WH7803 as well as clone WH8018 became light saturated for growth at light levels between 25 and 50 μmol m–2 s–1, and was severely inhibited at 250 μmol m–2 s–1. This is consistent with our growth vs. light curves (Figure 1). While Morris and Glover (1981) reported that growth of Synechococcus (WH7803) saturated at 45 μmol m–2 s–1, Kana and Glibert (1987) reported that growth of the same strain was saturated at about 200 μmol m–2 s–1. Since culture vessels of different materials and culture volumes may lead to different levels of light exposures to the cells within them, such difference in light levels for saturating its growth can be attributed to different transparency of light and to different volumes of culture, since large volume of cultures and the flasks made of polystyrene attenuate or block considerable amount of light. We have used 100 mL Quartz tubes, and the high transparency of the tubes with small volume of water provided higher light exposures to the cells, therefore leading to relatively lower saturating light level for growth (Figure 1) compared to other works aforementioned.
Photosynthetic electron transport increased with growth light levels till 100 μmol m–2 s–1 of PAR, with faster tempo at the elevated CO2 level across all the growth light levels (Figure 3B). The faster electron drainage, which means faster energy supply for physiological processes, can be attributed to enhanced CO2 assimilation processes and/or photorespiration (Gao et al., 2012). While increased light levels are known to enhance CCMs in phytoplankton species, but elevated CO2 levels usually down-regulate CCMs (Giordano et al., 2005; Beardall and Raven, 2020), the enhanced electron transport and growth of Synechococcus strain WH7803 by elevated CO2 could be attributed to enhancement of carboxylation under the elevated CO2, which resulted in faster growth rate under growth limiting and inhibiting light levels (Figure 3A). The inhibited growth rate at 100 μmol m–2 s–1 (Figure 1) could be due to light stress, since the cells increased their electron transport with increasing growth light levels to result photoinhibition (Figure 2). The reason why growth at optimal growth light level was not enhanced by the elevated CO2 could be attributed to balanced carbon loss and carboxylation, since the acidic stress associated with elevated CO2 can stimulate respiratory carbon loss in phytoplankton (see the review by Gao and Campbell (2014) and literatures therein).
Synechococcus strains are known to operate active CCMs, though they lack extracellular carbonic anhydrase (Badger and Andrews, 1982; Price, 2011). Elevated CO2 concentrations down-regulate the CCMs in microalgae and cyanobacteria, with depressed activity of carbonic anhydrase (Beardall and Raven, 2020). The down-regulated operation of CCMs in Synechococcus strain WH7803 could have saved energy (operation of CCMs requires energy expenditure), and the saved energy helps to enhance growth of Synechococcus strain WH7803 when light is limiting. That is, it is not the CO2 fertilization effect that led to enhanced growth of the picophytoplankton under limited light condition. When CCMs become down-regulated, photorespiration or Rubisco-catalyzed oxygenation can speed up at high light levels due to decreased ratio of CO2 to O2 (Bailey et al., 2008). In the present work, when Synechococcus strain WH7803 was grown under inhibiting light level (100 μmol m–2 s–1), its photorespiration might have been enhanced to result in negative effects on growth under the elevated CO2. However, on the contrary, the increased CO2 availability enhanced its growth significantly under the high light (Figure 3A). It has been shown that Synechococcus releases CO2 by about 30% of the CCMs concentrated DIC while its CCMs operate (Badger et al., 1985), elevated CO2 concentration in milieu might have counteracted the CO2 release, therefore aiding the cells with enhancement of electron transport and quantum yield (Figures 3B,C) with stimulated growth (Figure 3A). More photosynthetic carbon fixation would demand more energy. In the present work, the picophytoplankton increased its photosynthetic pigments with increased levels of light and CO2, which is consistent with that reported by Fu et al. (2007). Increased availability of CO2 significantly increased the cells’ light capturing capacity, as reflected in the increased photosynthetic pigments (Table 1). Under the high levels of light and CO2, the cells of Synechococcus showed the highest increase in Chl. a content to ensure sufficient energy supply to support increased levels of carboxylation and photorespiration, which has been shown to increase under OA conditions (Gao et al., 2012).
In natural marine environments, phytoplankton cells are exposed to different light levels spatio-temporally. Synechococcus strains are usually distributed in the lower part of euphotic zone, being exposed relatively low light. However, during noon period or during periods of intensive mixing, the picophytoplankton cells may episodically exposed to high inhibiting light levels. Therefore, elevated CO2 concentrations can positively and negatively affect its productivity at different depths or times during daytime. Consequently, the effects of OA on Synechococcus productivity could be strain-, depth-, and time-dependent, showing spatiotemporal differences in its response to progressive ocean acidification.
Data Availability Statement
The raw data supporting the conclusions of this article will be made available by the authors, without undue reservation.
Author Contributions
KG and NB contributed to the designing and planning the experiments and writing the manuscript. NB performed the experiments. Both authors contributed to the article and approved the submitted version.
Funding
The study was supported by the National Natural Science Foundation (41890803 and 41720104005).
Conflict of Interest
The authors declare that the research was conducted in the absence of any commercial or financial relationships that could be construed as a potential conflict of interest.
Acknowledgments
The authors thank Prof. Rui Zhang for his kind support, and are grateful to Prof. Sven Beer for his helpful comments on the data during his visit to the Xiamen University. The authors also thank Dr. Aziz Ullah for his technical assistance during his visit to the Xiamen University.
Supplementary Material
The Supplementary Material for this article can be found online at: https://www.frontiersin.org/articles/10.3389/fmars.2021.634189/full#supplementary-material
References
Alberte, R. S., Wood, A. M., Kursar, T. A., and Guillard, R. R. L. (1984). Novel phycoerythrins in marine Synechococcus spp – characterization and evolutionary and ecological implications. Plant Physiol. 75, 732–739. doi: 10.1104/pp.75.3.732
Badger, M. R., and Andrews, T. J. (1982). Photosynthesis and inorganic carbon usage by the marine cyanobacterium, Synechococcus sp. Plant Physiol. 70, 517–523. doi: 10.1104/pp.70.2.517
Badger, M. R., Bassett, M., and Comins, H. N. (1985). A model for HCO3– accumulation and photosynthesis in the cyanobacterium Synechococcus sp – theoretical predictions and experimental-observations. Plant Physiol. 77, 465–471. doi: 10.1104/pp.77.2.465
Badger, M. R., Price, G. D., Long, B. M., and Woodger, F. J. (2006). The environmental plasticity and ecological genomics of the cyanobacterial CO2 concentrating mechanism. J. Exp. Bot. 57, 249–265. doi: 10.1093/jxb/eri286
Bailey, S., Melis, A., Mackey, K. R. M., Cardol, P., Finazzi, G., van Dijken, G., et al. (2008). Alternative photosynthetic electron flow to oxygen in marine Synechococcus. Biochim. Biophy. Acta 1777, 269–276. doi: 10.1016/j.bbabio.2008.01.002
Barlow, R. G., and Alberte, R. S. (1985). Photosynthetic characteristics of phycoerythrin-containing marine Synechococcus spp. I. Responses to growth photon flux-density. Mar. Biol. 86, 63–74. doi: 10.1007/bf00392580
Bates, N. R., and Johnson, R. J. (2020). Acceleration of ocean warming, salinification, deoxygenation and acidification in the surface subtropical North Atlantic Ocean. Commun. Earth Environ. 1:33. doi: 10.1038/s43247-020-00030-5
Beardall, J., and Raven, J. A. (2016). “Carbon acquisition by microalgae,” in The Physiology of Microalgae. Developments in Applied Phycology, Vol. 6, eds M. Borowitzka, J. Beardall, and J. Raven (Switzerland: Springer, Cham). doi: 10.1007/978-3-319-24945-2_4
Beardall, J., and Raven, J. A. (2020). “Acquisition of inorganic carbon by microalgae and cyanobacteria,” in Microbial Photosynthesis, ed. Q. Wang (Singapore: Springer Singapore), 151–168. doi: 10.1007/978-981-15-3110-1_8
Callieri, C., Coci, M., Corno, G., Macek, M., Modenutti, B. E., Balseiro, E. G., et al. (2013). Phylogenetic diversity of nonmarine picocyanobacteria. FEMS Microbiol. Ecol. 85, 293–301. doi: 10.1111/1574-6941.12118
Campbell, L., and Carpenter, E. J. (1986). Diel patterns of cell-division in marine Synechococcus spp (Cyanobacteria) – use of the frequency of dividing cells technique to measure growth-rate. Mar. Ecol. Prog. Ser. 32, 139–148. doi: 10.3354/meps032139
Domínguez-Martín, M. A., Díez, J., and García-Fernández, J. M. (2016). Physiological studies of glutamine synthetases I and III from Synechococcus sp. WH7803 Reveal Differential Regulation. Front. Microbiol. 7:969. doi: 10.3389/FMICB.2016.00969
Flombaum, P., Gallegos, J. L., Gordillo, R. A., Rincon, J., Zabala, L. L., Jiao, N., et al. (2013). Present and future global distributions of the marine cyanobacteria Prochlorococcus and Synechococcus. Proc. Natl. Acad. Sci. U.S.A. 110, 9824–9829. doi: 10.1073/pnas.1307701110
Fogg, G. E. (1986). Ocean ecology: light and ultraphytoplankton. Nature 319:96. doi: 10.1038/319096a0
Fu, F. X., Warner, M. E., Zhang, Y., Feng, Y., and Hutchins, D. A. (2007). Effects of increased temperature and CO2 on photosynthesis, growth, and elemental ratios in marine Synechococcus and Prochlorococcus (Cyanobacteria). J. Phycol. 43, 485–496. doi: 10.1111/j.1529-8817.2007.00355.x
Gao, K., and Campbell, D. A. (2014). Photophysiological responses of marine diatoms to elevated CO2 and decreased pH: a review. Funct. Plant Biol. 41, 449–459. doi: 10.1071/FP13247
Gao, K., Xu, J., Gao, G., Li, Y., Hutchins, D. A., Huang, B., et al. (2012). Rising CO2 and increased light exposure synergistically reduce marine primary productivity. Nat. Clim. Chang. 2, 519–523. doi: 10.1038/NCLIMATE1507
Gattuso, J. P., Lee, K., Rost, B., and Schulz, K. G. (2010). “Approaches and tools to manipulate the carbonate chemistry,” in Guide to Best Practices for Ocean Acidification Research and Data Reporting, eds J.-P. Gattuso, K. Lee, B. Rost, and K. G. Schulz (Luxembourg: Publications Office of the European Union), 41–52.
Giordano, M., Beardall, J., and Raven, J. A. (2005). CO2 concentrating mechanisms in algae: mechanisms, environmental modulation, and evolution. Annu. Rev. Plant Biol. 56, 99–131. doi: 10.1146/ANNUREV.ARPLANT.56.032604.144052
Givan, A. L. (2011). “Flow cytometry: an introduction,” in Flow Cytometry Protocols, eds T. S. Hawley and R. G. Hawley (Totowa, NJ: Humana Press), 1–29. doi: 10.1002/9781118487969.ch1
Glover, H. E., Keller, M. D., and Guillard, R. R. L. (1986). Light quality and oceanic ultraphytoplankters. Nature 319, 142–143. doi: 10.1038/319142a0
Glover, H. E., and Morris, I. (1981). Photosynthetic characteristics of coccoid marine cyanobacteria. Arch. Microbiol. 129, 42–46. doi: 10.1007/bf00417177
Huner, N. P. A., Oquist, G., and Sarhan, F. (1998). Energy balance and acclimation to light and cold. Trends Plant Sci. 3, 224–230. doi: 10.1016/s1360-1385(98)01248-5
Iturriaga, R., and Mitchell, B. G. (1986). Chroococcoid cyanobacteria – a significant component in the food web dynamics of the open ocean. Mar. Ecol. Prog. Ser. 28, 291–297. doi: 10.3354/meps028291
Kana, T. M., and Glibert, P. M. (1987). Effect of irradiances up to 2000 E m–2 s–1 on marine Synechococcus WH7803-I. Growth, pigmentation, and cell composition. Deep Sea Res. A 34, 479–495. doi: 10.1016/0198-0149(87)90001-x
Kim, Y., Jeon, J., Kwak, M. S., Kim, G. H., Koh, I., and Rho, M. (2018). Photosynthetic functions of Synechococcus in the ocean microbiomes of diverse salinity and seasons. PLos One 13:e0190266. doi: 10.1371/journal.pone.0190266
Lu, Z. Q., Jiao, N. Z., and Zhang, H. Y. (2006). Physiological changes in marine picocyanobacterial Synechococcus strains exposed to elevated CO2 partial pressure. Mar. Biol. Res. 2, 424–430. doi: 10.1080/17451000601055419
Lüder, U. H., Knoetzel, J., and Wiencke, C. (2001). Acclimation of photosynthesis and pigments to seasonally changing light conditions in the endemic Antarctic red macroalga Palmaria decipiens. Polar Biol. 24, 598–603. doi: 10.1007/s003000100260
Morris, I., and Glover, H. (1981). Physiology of photosynthesis by marine coccoid cyanobacteria - some ecological implications. Limnol. Oceanogr. 26, 957–961. doi: 10.4319/lo.1981.26.5.0957
Partensky, F., Hess, W. R., and Vaulot, D. (1999). Prochlorococcus, a marine photosynthetic prokaryote of global significance. Microbiol. Mol. Biol. Rev. 63, 106–127. doi: 10.1128/MMBR.63.1.106-127.1999
Piazena, H., Perez-Rodrigues, E., Hader, D. P., and Lopez-Figueroa, F. (2002). Penetration of solar radiation into the water column of the central subtropical Atlantic Ocean – optical properties and possible biological consequences. Deep Sea Res. II Top. Stud. Oceanogr. 49, 3513–3528. doi: 10.1016/s0967-0645(02)00093-0
Platt, T., Gallegos, C. L., and Harrison, W. G. (1980). Photoinhibition of photosynthesis in natural assemblages of marine-phytoplankton. J. Mar. Res. 38, 687–701.
Price, G. D. (2011). Inorganic carbon transporters of the cyanobacterial CO2 concentrating mechanism. Photosynth. Res. 109, 47–57. doi: 10.1007/s11120-010-9608-y
Ralph, P. J., and Gademann, R. (2005). Rapid light curves: a powerful tool to assess photosynthetic activity. Aquat. Bot. 82, 222–237. doi: 10.1016/j.aquabot.2005.02.006
Ritchie, R. J. (2006). Consistent sets of spectrophotometric chlorophyll equations for acetone, methanol and ethanol solvents. Photosynth. Res. 89, 27–41. doi: 10.1007/s11120-006-9065-9
Scanlan, D. J., Ostrowski, M., Mazard, S., Dufresne, A., Garczarek, L., Hess, W. R., et al. (2009). Ecological genomics of marine picocyanobacteria. Microbiol. Mol. Biol. Rev. 73, 249–299. doi: 10.1128/MMBR.00035-08
Smith, R. C., and Baker, K. S. (1981). Optical-properties of the clearest natural-waters (200-800 nm). Appl. Opt. 20, 177–184. doi: 10.1364/ao.20.000177
Stockner, J. G., and Antia, N. J. (1986). Algal picoplankton from marine and fresh-water ecosystems – a multidisciplinary perspective. Can. J. Fish. Aquat. Sci. 43, 2472–2503. doi: 10.1139/f86-307
Strickland, J. D. H., and Parsons, T. R. (1972). A Practical Handbook of Seawater Analysis. Ottawa, ON: The Alger Press Ltd.
Varkey, D., Mazard, S., Ostrowski, M., Tetu, S. G., Haynes, P., and Paulsen, I. T. (2016). Effects of low temperature on tropical and temperate isolates of marine Synechococcus. ISME J. 10, 1252–1263. doi: 10.1038/ISMEJ.2015.179
Keywords: CO2, growth, light, Synechococcus, WH7803
Citation: Bao N and Gao K (2021) Interactive Effects of Elevated CO2 Concentration and Light on the Picophytoplankton Synechococcus. Front. Mar. Sci. 8:634189. doi: 10.3389/fmars.2021.634189
Received: 27 November 2020; Accepted: 01 February 2021;
Published: 24 February 2021.
Edited by:
Nina Bednarsek, Southern California Coastal Water Research Project, United StatesReviewed by:
Rajani Kanta Mishra, Ministry of Earth Sciences, IndiaMichael William Lomas, Bigelow Laboratory for Ocean Sciences, United States
Wanchun Guan, Wenzhou Medical University, China
Copyright © 2021 Bao and Gao. This is an open-access article distributed under the terms of the Creative Commons Attribution License (CC BY). The use, distribution or reproduction in other forums is permitted, provided the original author(s) and the copyright owner(s) are credited and that the original publication in this journal is cited, in accordance with accepted academic practice. No use, distribution or reproduction is permitted which does not comply with these terms.
*Correspondence: Kunshan Gao, a3NnYW9AeG11LmVkdS5jbg==