 Angel Borja1,2*
 Iratxe Menchaca1
 Joxe Mikel Garmendia1
 Javier Franco1
 Joana Larreta1
 Yolanda Sagarminaga1
 Yasmin Schembri3Rocío González3Rocío Antón3Tamara Micallef4
 Sarah Camilleri4
 Oihana Solaun1Ainhize Uriarte1
 María C. Uyarra1
- 1AZTI, Marine Research, Basque Research and Technology Alliance (BRTA), Pasaia, Spain
- 2Faculty of Marine Sciences, King Abdulaziz University, Jeddah, Saudi Arabia
- 3AIS-Environment, Fgura, Malta
- 4Environment and Resources Authority (ERA), Marsa, Malta
In the last few years, the concept of ecosystem-based approach has led to the need for developing integrative assessments that consider the different ecosystem components all together. In Europe, the Marine Strategy Framework Directive (MSFD) aims at achieving the Good Environmental Status for all regional seas. This requires Member States (MS) to implement monitoring networks and assess the status in 6-years management cycles, based on 11 qualitative descriptors, ranging from biodiversity to noise. For that assessment MS must apply criteria and methodological standards, following certain specifications. However, the number of MS which have undertaken quantitative assessments, or aggregated the different criteria and/or descriptors in holistic assessments, remains low. This is probably due to the few available tools that enable the aggregation of information at different scales (spatial and temporal) and the integration of a diverse range of indicators. In order to identify the main constraints tied to the integration of data from different indicators, criteria and descriptors, this study involved a comparative analysis of a national assessment of official marine data reported by Malta with the integrative Nested Environmental status Assessment Tool (NEAT). In total, we have used 282 indicators, 24 criteria, seven descriptors, and 12 ecosystem components. The results showed a good agreement in the assessment at the indicator level (as applied in the national assessment) and threw light on the advantages of integrating the information at criteria, descriptor or ecosystem component levels, when using NEAT. Such integration allows for a global assessment of status of Malta’s marine waters whilst allowing for the identification of management measures at different spatial levels and for different ecosystem components. Lessons learnt from this case study are applicable to remaining assessments for other European MS.
Introduction
Although the oceans cover 71% of the Earth’s surface, the list of human activities at sea has been relatively limited until recently, including amongst others fishing, shipping, and oil/gas exploitation. However, in the last two decades, some activities such as aquaculture, tourism and recreation, biotechnology applications or seabed mining have shown dramatic increases at a global level, constituting the so-called blue economy or blue growth (Eikeset et al., 2018). All these activities, either traditional or new, can result in multiple pressures on marine ecosystems and their services (Dailianis et al., 2018; Korpinen et al., 2019), which can be monitored through their impacts or footprints (Elliott et al., 2020).
In the past, such monitoring was used to assess the status of aquatic systems through individual ecosystem components (i.e., phytoplankton, macroalgae, fish, etc.) (Birk et al., 2012; Poikane et al., 2020). However, in the last few years, the emerging concept of the ecosystem-based approach (Kirkfeldt, 2019), has led to the need for integrative assessments that consider the different ecosystem components all together (Inniss et al., 2016; Reker et al., 2019). The ecosystem-based approach explicitly recognizes social-ecological systems interactions within environmental management contexts, including humans and their activities as part of the marine ecosystem components (O’Higgins et al., 2020). Nevertheless, the tools for performing such integration are still very limited (Personnic et al., 2014; Borja et al., 2016).
In general, developments of marine legislation of the different countries, such as Canada, United States, South Africa, Australia, or China; have been a main driver for the development of integrative assessments (Borja et al., 2008). In the case of Europe, the Marine Strategy Framework Directive (MSFD; European Commission, 2008), which applies to all European Union countries, created a new vision for achieving clean, healthy, and productive seas throughout the implementation of the ecosystem-based approach, in which humans are part of the marine ecosystem. This means that any human activity at sea must be managed at sustainable levels (Borja et al., 2010; Reker et al., 2019).
The MSFD aims at achieving the Good Environmental Status for all seas by 2020 or 2026, for which it requires Member States (MS) to carry out the implementation of marine monitoring networks, the assessment of the seas’ environmental status, and the definition of programs of measures to minimize human impacts, all in 6-years management cycles (European Commission, 2008). The environmental status is based upon 11 qualitative descriptors (D), which includes: D1-Biodiversity, D2-Non-indigenous Species, D3-Commercial fish, D4-Foodwebs, D5-Eutrophication, D6-Seafloor integrity, D7-Hydrography, D8-Contaminants in the environment, D9-Contaminants in seafood, D10-Litter, and D11-Noise/energy.
Following the first MSFD management cycle, assessment and reporting inconsistencies amongst MS, which led to the revision of the methodological standards to determine the environmental status in the European Commission (2010) decision (2010/477/EU), revealed that there was insufficient detail and clarity to support the determination of the environmental status (Palialexis et al., 2014). This resulted in the revised 2017 Commission Decision (2017/848/EU); presenting a more developed framework -including revised criteria and methodological standards—for MS to undertake the assessment during the second management cycle (European Commission, 2018b, 2019). This framework includes the (i) species groups (i.e., seabirds, mammals, reptiles, fish, and cephalopods); (ii) habitat types; (iii) ecosystem structure, functions, and processes, i.e., physical, hydrological, chemical, and biological; and (iv) anthropogenic pressures (i.e., biological, physical, contaminants, litter, and energy/noise), to be considered when determining/assessing the environmental status.
Within the framework of the MSFD, good environmental status has been progressively refined from its high-level definition in Art. 3(5), via the Descriptors of MSFD (Annex I), the defined characteristics, pressures/impacts in the marine environment (Annex III), and the outlined requirement for criteria and methodological standards for assessment as per Art. 9(3). In line with Art. 9(3), the revised Commission Decision (European Commission, 2017) sets criteria (i.e., “distinctive technical features that are closely linked to qualitative descriptors”) and methodological standards for MS to follow “to ensure consistency and to allow for comparison between marine regions or subregions of the extent to which good environmental status is being achieved.” Within this context, MS were to define good environmental status in their marine waters and select the most relevant elements to be included for their second assessment cycle (European Commission, 2020).
Furthermore, MS must follow certain specifications/requirements in the environmental status assessment (European Commission, 2017, 2018b, 2019, 2020), including: (i) elements for assessment and indication of whether good status has been achieved for those; (ii) criteria for assessment of the elements, including parameters to be used; (iii) threshold values for assessing quality and trends (including distinguishing good from non-good status); (iv) assessment scales (through so-called Marine Reporting Units); (v) approaches to express the extent to which good status is achieved; (vi) approaches/methods for data collection and monitoring; (vii) aggregation methods for the data (spatial and temporal) (Walmsley et al., 2017; European Commission, 2018b); and (viii) units of measurement for the criteria.
In both the first and the second cycle assessments, the number of MS which have undertaken quantitative assessments (i.e., using quantitative thresholds), or aggregated the different criteria and/or descriptors in holistic assessments, remains low (Palialexis et al., 2014; European Commission, 2020). In fact, most countries are assessing the environmental status at the level of criterion (aggregating species or habitats) and very few at the level of descriptor (European Commission, 2020). This is probably due to the few available tools that enable the aggregation of information at different scales (spatial and temporal) and the integration of indicators of different nature (Borja et al., 2016), but also because the discussions on the pros and cons of aggregating information at different levels are still in development (Ojaveer and Eero, 2011; Langhans et al., 2014; Palialexis et al., 2014; Probst and Lynam, 2016).
Amongst the tools available for integrated assessment is the Nested Environmental status Assessment Tool (NEAT; Borja et al., 2016), which allows the quantitative aggregation of selected indicators/criteria. The tool is designed to accommodate the Ecosystem-Based management approach (as described in O’Higgins et al., 2020); its interface incorporating multiple socio-ecological aspects including human activities and pressures (e.g., fishing, contaminants, litter, etc.), a variety of ecosystem components (from phytoplankton to mammals, from pelagic to benthic habitats), all defined according to the different criteria and descriptors applied within the MSFD framework. NEAT has been tested and validated in many locations around Europe (Uusitalo et al., 2016; Pavlidou et al., 2019), outside Europe (Nemati et al., 2017) and covering large regional seas (Kazanidis et al., 2020) or even the whole Europe (Borja et al., 2019c).
In order to demonstrate the possibilities and advantages of integrating indicators, criteria, and descriptors, the official MSFD data from a small Mediterranean country, Malta (ERA, 2020a,b) has been used within the NEAT framework. Since this country has quantitative data and adequate information from a relatively small number of reporting units, it constitutes a good candidate to compare the results obtained through an integrative assessment using NEAT with those of the official national assessment (wherein the integrated assessment of status was based on both qualitative and quantitative data/approaches). This research outlines the comparison of both approaches, highlighting the main differences in their outcomes, and their potential implications in management, thus providing insight for other MS when undertaking their assessments in upcoming MSFD implementation cycles.
Materials and Methods
Adaptations of NEAT for Comparability to Malta’s Official Assessment
Malta submitted the initial assessment of environmental status of its marine waters in October 20131, as part of the first MSFD implementation cycle. At that time, the report did not fully address the criteria as stipulated by the first MSFD Commission Decision (European Commission, 2010). Shortcomings of such assessment were particularly related to the qualitative nature of the good environmental status definitions, the limited ambition of the environmental targets and the limited reporting of impacts from pressures. Under the second implementation cycle, Malta implemented a monitoring and assessment program, through a European Union funded project, during the period 2017–2019 (Borja et al., 2019a,b). This project provided updated datasets that enabled a revised assessment in accordance with the new MSFD requirements (European Commission, 2017). Such targeted data collection process facilitated the application of the criteria laid down by the European Commission (2017). In addition, data and information robustness and updated environmental targets, focusing on the main pressures that are considered to put achievement of good status at risk, resulted in an improvement in terms of the degree of quantitative assessment involved (ERA, 2020a,b).
Malta officially reported data on all 11 descriptors. Whilst quantitative assessment was undertaken for most of the descriptors, in some cases—D2 (Non-indigenous Species) and D11 (Noise/energy)—the assessment was based on qualitative information. Meanwhile possibilities for assessment of D4 (Food webs) and D7 (Hydrography), are pending further developments of essential aspects such as indicators and baseline data. Within this context, for the purpose of the comparison between the official and the NEAT assessment, descriptors 2, 4, 7, and 11 have been excluded from this study (Supplementary Table 1). Further, 19 out of the 52 criteria2 applied within NEAT’s framework lacked data for Malta; and for another nine criteria, Malta’s official assessment lacked assessment methods or thresholds of good/non-good status (ERA, 2020a). In order to facilitate comparability these criteria were also omitted from this study. Further, not all secondary criteria (as defined in European Commission, 2017) were applied in view of their non-mandatory nature.
Following such conditions, the quantitative assessment in NEAT was finally based upon 24 criteria, covering seven descriptors (D1, D3, D5, D6, D8, D9, and D10), and including birds, mammals, reptiles, fish, cephalopods, and pelagic and benthic habitats as ecosystem components (Supplementary Table 1). The 24 criteria were assessed through 336 indicators, these indicators having also been applied within the national assessment reported to the European Commission [Supplementary Table 2, information obtained from ERA (2020a, b)].
Requirements of NEAT
The NEAT is a flexible and user-friendly software, which allows the hierarchical integration of multiple indicators and ecosystem components, represented by data collected from different monitoring sources at different spatial scales, for a robust assessment. To assess the status of any area, NEAT needs:
• Indicators: these are the basis of calculations in NEAT. For each indicator, the mean and standard error values for each assessed area are calculated.
• Marine reporting units: these are the areas to which the indicators are attributed. Their hierarchical, nested structure allows for the weighting of indicators in the assessment that is based on the reporting units’ surface areas.
• Normalization of indicators: in order to aggregate results for all indicators, their values are normalized along a scale of 0 (worst environmental status) to 1 (best environmental status). Specific thresholds of the indicators are also normalized e.g., good/non-good environmental status boundary is normalized at 0.6 in all indicators.
• Aggregation rules: By default, aggregation is done across all indicators belonging to a reporting unit, with options to visualize the status of the separate ecosystem components of the reporting unit.
• NEAT value: the outcomes of the aggregation are represented by a number and a color, which corresponds to the status. This NEAT value is obtained for the whole assessed area, but can be visualized at different spatial scales, descriptors, ecosystem components (e.g., fish, phytoplankton, etc.), or habitat types.
• Confidence on assessment values: each NEAT value is accompanied by its quantitative estimate of the confidence of the result, based on Carstensen and Lindegarth (2016). This estimate is performed on the basis of the standard error, and the performance of Monte-Carlo simulations, as a means to understand how this error propagates throughout the assessment.
The NEAT version 1.43 was applied in this study. Additional information on the software can be consulted in Borja et al. (2016, 2019c) and Berg et al. (2017).
Marine Reporting Units as Applied in the NEAT
The reporting units applied within the scope of the MSFD assessment and making up the Maltese waters are shown in Figure 1. These comprise:
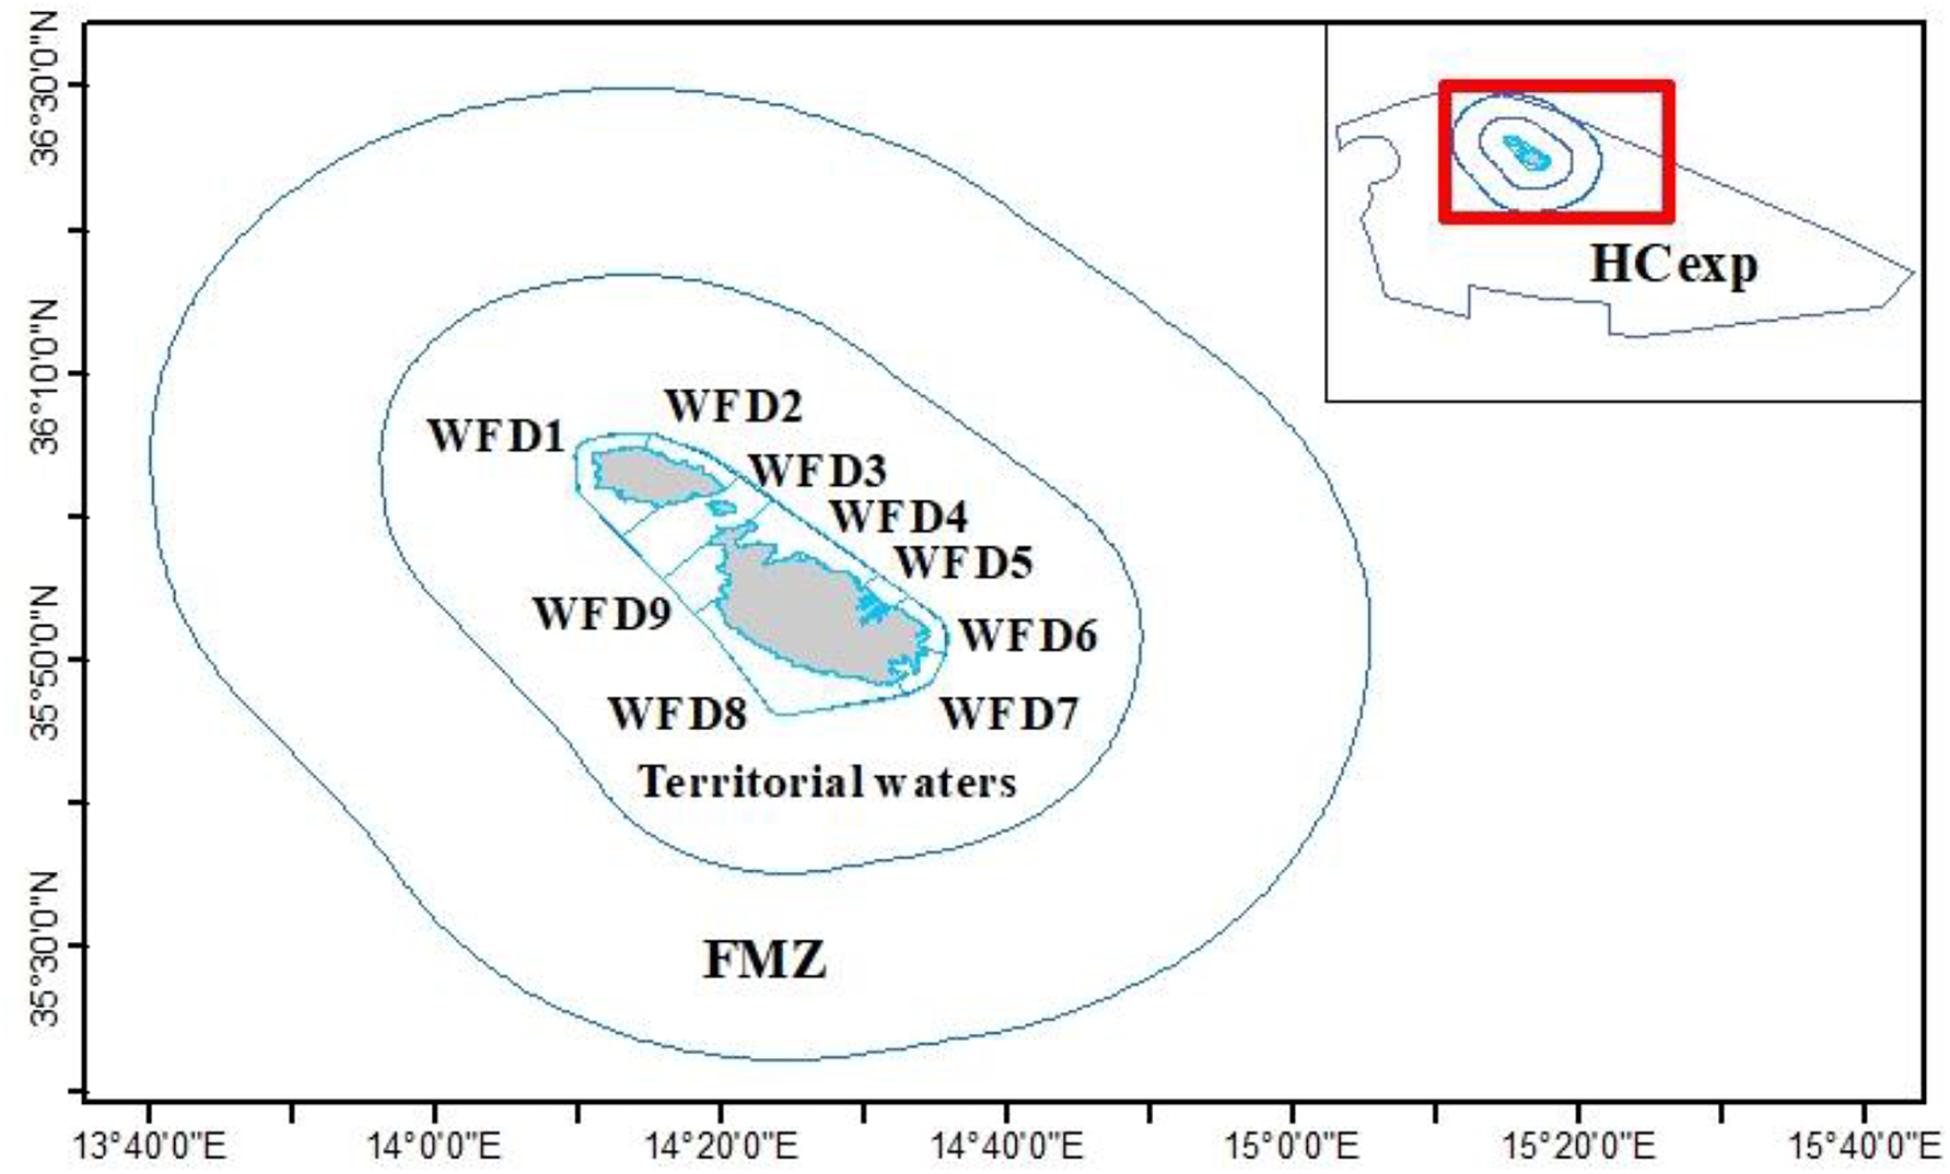
Figure 1. Map showing the Maltese Marine Reporting Units, including nine coastal water bodies as designated under the Water Framework Directive (WFD 1 to WFD 9), Territorial waters and internal waters, the Fisheries Management Zone (FMZ) and internal waters, and the area designated for hydrocarbon exploration and exploitation (HCexp). The given acronyms are solely used within the scope of this study, for the benefit of legibility.
• Nine coastal water bodies of sizes ranging between 13 and 97 km2 and covering a total area of 400 km2. These are referred to as the Water Framework Directive (WFD) waterbodies noting original designation under this directive.
• Territorial waters and internal waters, extending from the low-water coastline to the 12 nm (nautical mile) limit, and covering a total of 4,028 km2.
• The Fisheries Management Zone (FMZ) and internal waters, extending from the low-water coastline to the 25 nm limit, and covering a total of 11,678 km2.
• The designated area for hydrocarbon exploration and exploitation (referred to and HCexp within the scope of this study) and extending from the low water coastline to the outer limit of the continental shelf, and covering a total of 75,475 km2.
Indicators are associated to specific reporting units and then these are aggregated hierarchically, as indicated in Figure 2.
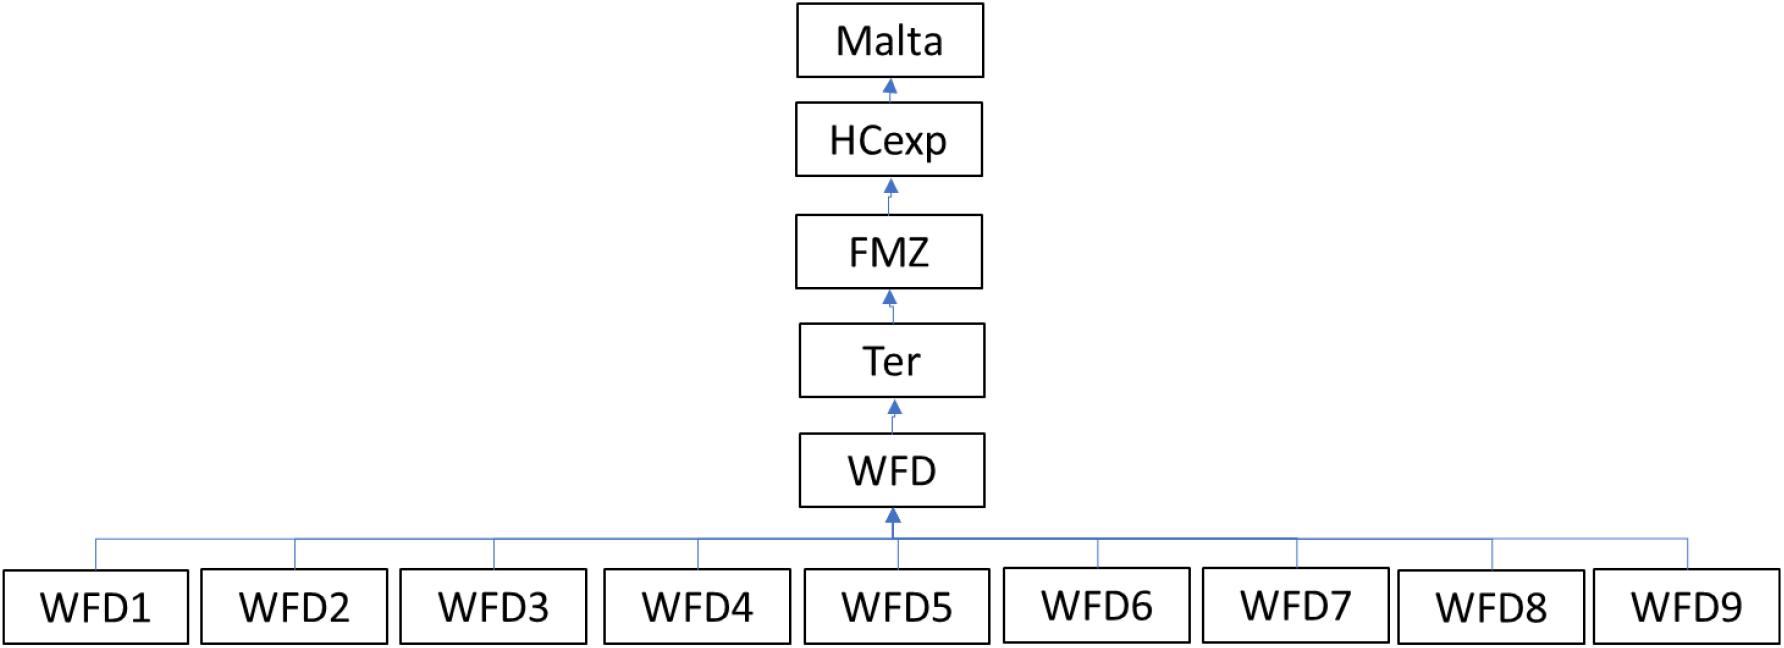
Figure 2. Nested aggregation of the Maltese Marine Reporting Units within NEAT. HCexp: area designated for hydrocarbon exploration and exploitation; FMZ, fisheries management zone; Ter, territorial waters; WFD, coastal water bodies as designated under the Water Framework Directive.
Adaptations Within the NEAT Reflecting MSFD Criteria and Ecosystem Components
The default setting of the NEAT software originally allowed for the hierarchical integration of data at the reporting units and habitat levels (Berg et al., 2017). As an example, habitats were classified as pelagic and benthic, benthic habitats were re-classified as rocky and soft-bottom substrata, soft-bottoms were re-classified as sandy, muddy and mixed substrata, and so on. For the purpose of this study, the NEAT software was manually adapted, to allow integration at other required levels or for other components of the marine environment. Following the hierarchical structure for habitats, similar hierarchies were re-defined considering relevant species groups, habitat types, ecosystems and pressures, as well as criteria, as in the European Commission (2019) Decision. As an example, for the “Species” category, the following categories were created: birds, mammals, reptiles, fish, and cephalopods; each of which was further defined reflecting MSFD requirements e.g., for birds, the included groups were surface feeding birds, pelagic feeding birds, etc. Further, each of these groups was associated with the relevant MSFD criteria, which were coded as DXCY_name (e.g., Descriptor 1, Criteria 2_BirdsPelagicFeeding Population Abundance). Supplementary Figure 1 provides a NEAT screenshot illustrating such hierarchical adaptations. Additional components were manually included as appropriate, reflecting available data (e.g., crustaceans, seagrasses).
Further, the NEAT assessment was carried on the basis of a total of 12 ecosystem components and associated criteria/indicators: (1) water column (associated with nutrients, oxygen, contaminants in water, or floating litter); (2) seafloor (associated to loss or disturbance of the seabed, and litter); (3) sediment (contaminants); (4) macroalgae, including quality indices such as CARLIT (Ballesteros et al., 2007) or species such as Lythophyllum; (5) seagrasses, the Posidonia Rapid Evaluation Index (PREI) (Gobert et al., 2009); (6) macroinvertebrates, the Bentix quality index (Simboura and Zenetos, 2002); (7) Crustacea (indicators of quality, contaminants); (8) cephalopods (indicators of quality, contaminants); (9) fish (indicators of quality, contaminants); (10) reptiles; (11) birds; and (12) mammals. Such grouping was adopted and tested under the NEAT approach here and was not considered a complete reflection of the revised Commission Decision (European Commission, 2017).
Further detail on these adaptations to the NEAT tool can be consulted in the NEAT database for which a direct link (MEDREGPROTO_prototype-Malta.db) is provided as Supplementary Material, accessible through the use of the NEAT software4. As this file contains all the original information used, it ensures the replicability of the study by any interested researcher.
Indicators and Threshold Setting Within the NEAT
To select the indicators, the criteria of the European Commission (2017) decision were followed as indicated in Supplementary Table 1. The use of primary criteria is mandatory to ensure consistency across the EU, whereas the use of secondary criteria should be decided by MS, where necessary, to complement a primary criterion or when, for a particular criterion, the marine environment is at risk of not achieving or not maintaining good environmental status.
From the 336 indicators applied within the national assessment, 282 indicators were used in the NEAT analyses (see Supplementary Table 2). The remaining 54 were omitted in view of the absence of quantitative data or quantitative threshold values for the definition of status (Supplementary Table 2). The dependence on quantitative data and thresholds can be considered as a shortcoming of NEAT approach, noting that the absence of such information for all criteria is common for many of the European Union Member States, preventing the application of this tool in its entirety. The generic indicators used, the associated descriptors, criteria and other details can be consulted in Table 1.
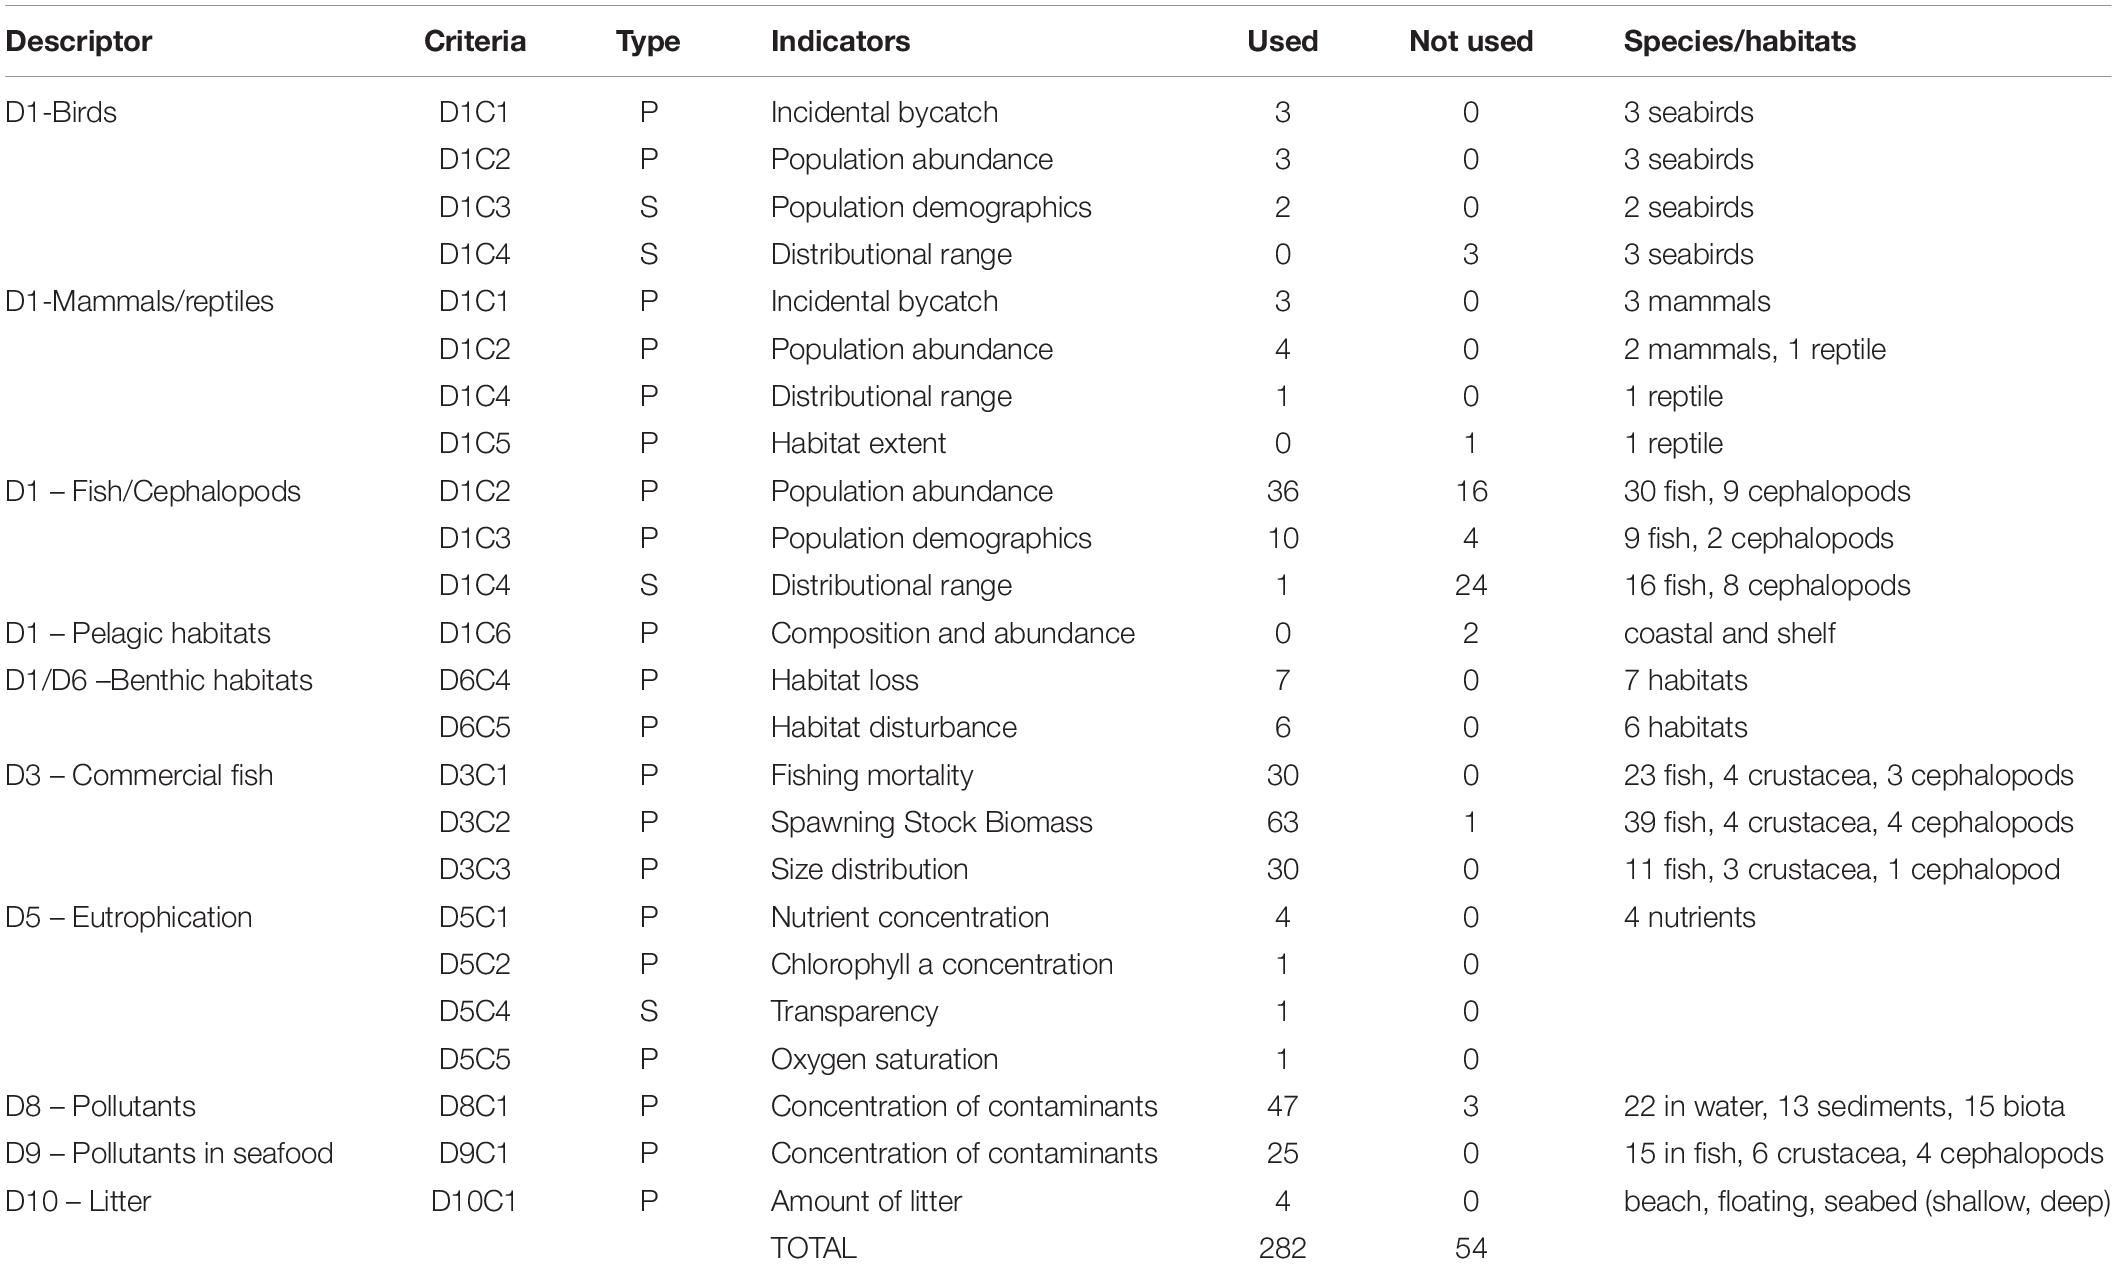
Table 1. Number of indicators used/not-used in the NEAT analysis, to assess the environmental status in Malta, related to the seven qualitative descriptors of the Marine Strategy Framework Directive, the criteria (see Supplementary Table 1 for description), type of criterion (P, primary; S, secondary), and number of species, habitats or matrices associated to each indicator.
For the NEAT analyses, each of the used indicators has a range of variation (from worst to best values, i.e., reference conditions), and at least a threshold between good/not good (i.e., moderate) environmental status. In most cases (257 out of the 282 indicators used), the threshold values included in the NEAT calculations were those also applied in Malta’s official assessment (Supplementary Table 2; ERA, 2020a). The origin of those thresholds is varied, including national thresholds intercalibrated with other MS (European Commission, 2018a); regional thresholds for nutrients and baselines for litter as set for the Mediterranean; or European thresholds for contaminants in the environment or in seafood (Supplementary Table 2, columns K and L). In a few cases thresholds were taken from relevant literature e.g., for D6, for habitat loss and habitat disturbance, thresholds from Kazanidis et al. (2020) were applied. Finally, in 15 cases, referred mostly to incidental bycatch and population abundance of seabirds and mammals, the thresholds were based on expert judgment, but supported on information and data from ERA (2020a) and the Habitats and Birds Directive. In some cases (e.g., indicators intercalibrated as per WFD requirements, such as chlorophyll, Bentix, PREI, CARLIT, etc.; European Commission, 2018a), threshold levels for other boundaries were available (e.g., High/Good, Good/Moderate, Moderate/Poor, Poor/Bad), and used in the calculations. When these intermediate thresholds were absent, they were generated through interpolations in NEAT (Berg et al., 2017). Such interpolations were strictly applied in the NEAT tool, but were not part of the official assessment.
Assessment of the Environmental Status in the NEAT
Data for the applied indicators was obtained from Malta’s marine environment database containing data collected through monitoring carried out under the EMFF 8.3.1 project, for the period June 2017 to June 2019. For each indicator, mean and standard error values for stations associated to the different reporting units, were generated. For indicators that were not covered by the said monitoring program, such as those associated to D1 (biodiversity of birds, reptiles, mammals, fish, and cephalopods) and D3 (commercial fish), the information was extracted from Malta’s MSFD assessment report (ERA, 2020a,b) with mean and standard error calculations undertaken following the same procedure. The mean and standard error of each indicator were included in the NEAT, with each indicator associated to a descriptor, a type of species/habitat, an ecosystem component, a criterion of those in Table 1, and a reporting unit (see details in Supplementary Table 2).
The indicator values were then normalized and aggregated across ecosystem component level (as defined in section “Adaptations Within the NEAT Reflecting MSFD Criteria and Ecosystem Components”), at the descriptor level and by aggregating all descriptors under (i) the option of weighting by reporting unit surface area, and (ii) without applying such weighting. The NEAT interface further allows one to visualize integration results across ecosystem components and the different spatial scales applied, allowing the tracing of the origin of low assessment values. The confidence associated to each assessment and scale is also presented, based on 1,000 Monte-Carlo iterations.
All the information included in the NEAT software (indicators, criteria, thresholds, mean and standard error values, by descriptor and reporting unit) is available in the database provided as Supplementary Material, that can be opened using NEAT (MEDREGPROTO_prototype-Malta.db).
Results
All the calculation results of NEAT assessment can be consulted in the Supplementary Material including: the outcomes of the weighting and non-weighting by reporting unit area (Supplementary Tables 3, 4, respectively); weighting and non-weighting by reporting unit area and sorted by ecosystem components (Supplementary Tables 5, 6, respectively); and weighting by reporting unit area and sorted by each descriptor (D1/D6: biodiversity and seafloor integrity in Supplementary Table 7; D1: biodiversity in Supplementary Table 8; D3: commercial fish in Supplementary Table 9; D5: eutrophication in Supplementary Table 10; D6: seafloor integrity in Supplementary Table 11; D8: contaminants in Supplementary Table 12; D9: contaminants in seafood in Supplementary Table 13; and D10: marine litter in Supplementary Table 14). The information from Supplementary Tables 3–14 has been summarized in Supplementary Table 15, showing the results by weighting and non-weighting by reporting unit area, and for each of the descriptors, criteria, and ecosystem components.
Comparison of Weighting (by Reporting Unit) and Non-weighting Scenarios in the NEAT Analysis
Taking into account the surface area of each reporting unit when nesting the results at the level of the WFD areas, territorial waters, FMZ and HCexp, and integrating to the whole Malta waters, filters for weighting and non-weighting by reporting unit area were applied through the NEAT interface. A comparison of outcomes indicated a similar status assessment for all descriptors except for the Biodiversity and Marine litter descriptors (D1 and D10) (Figure 3).
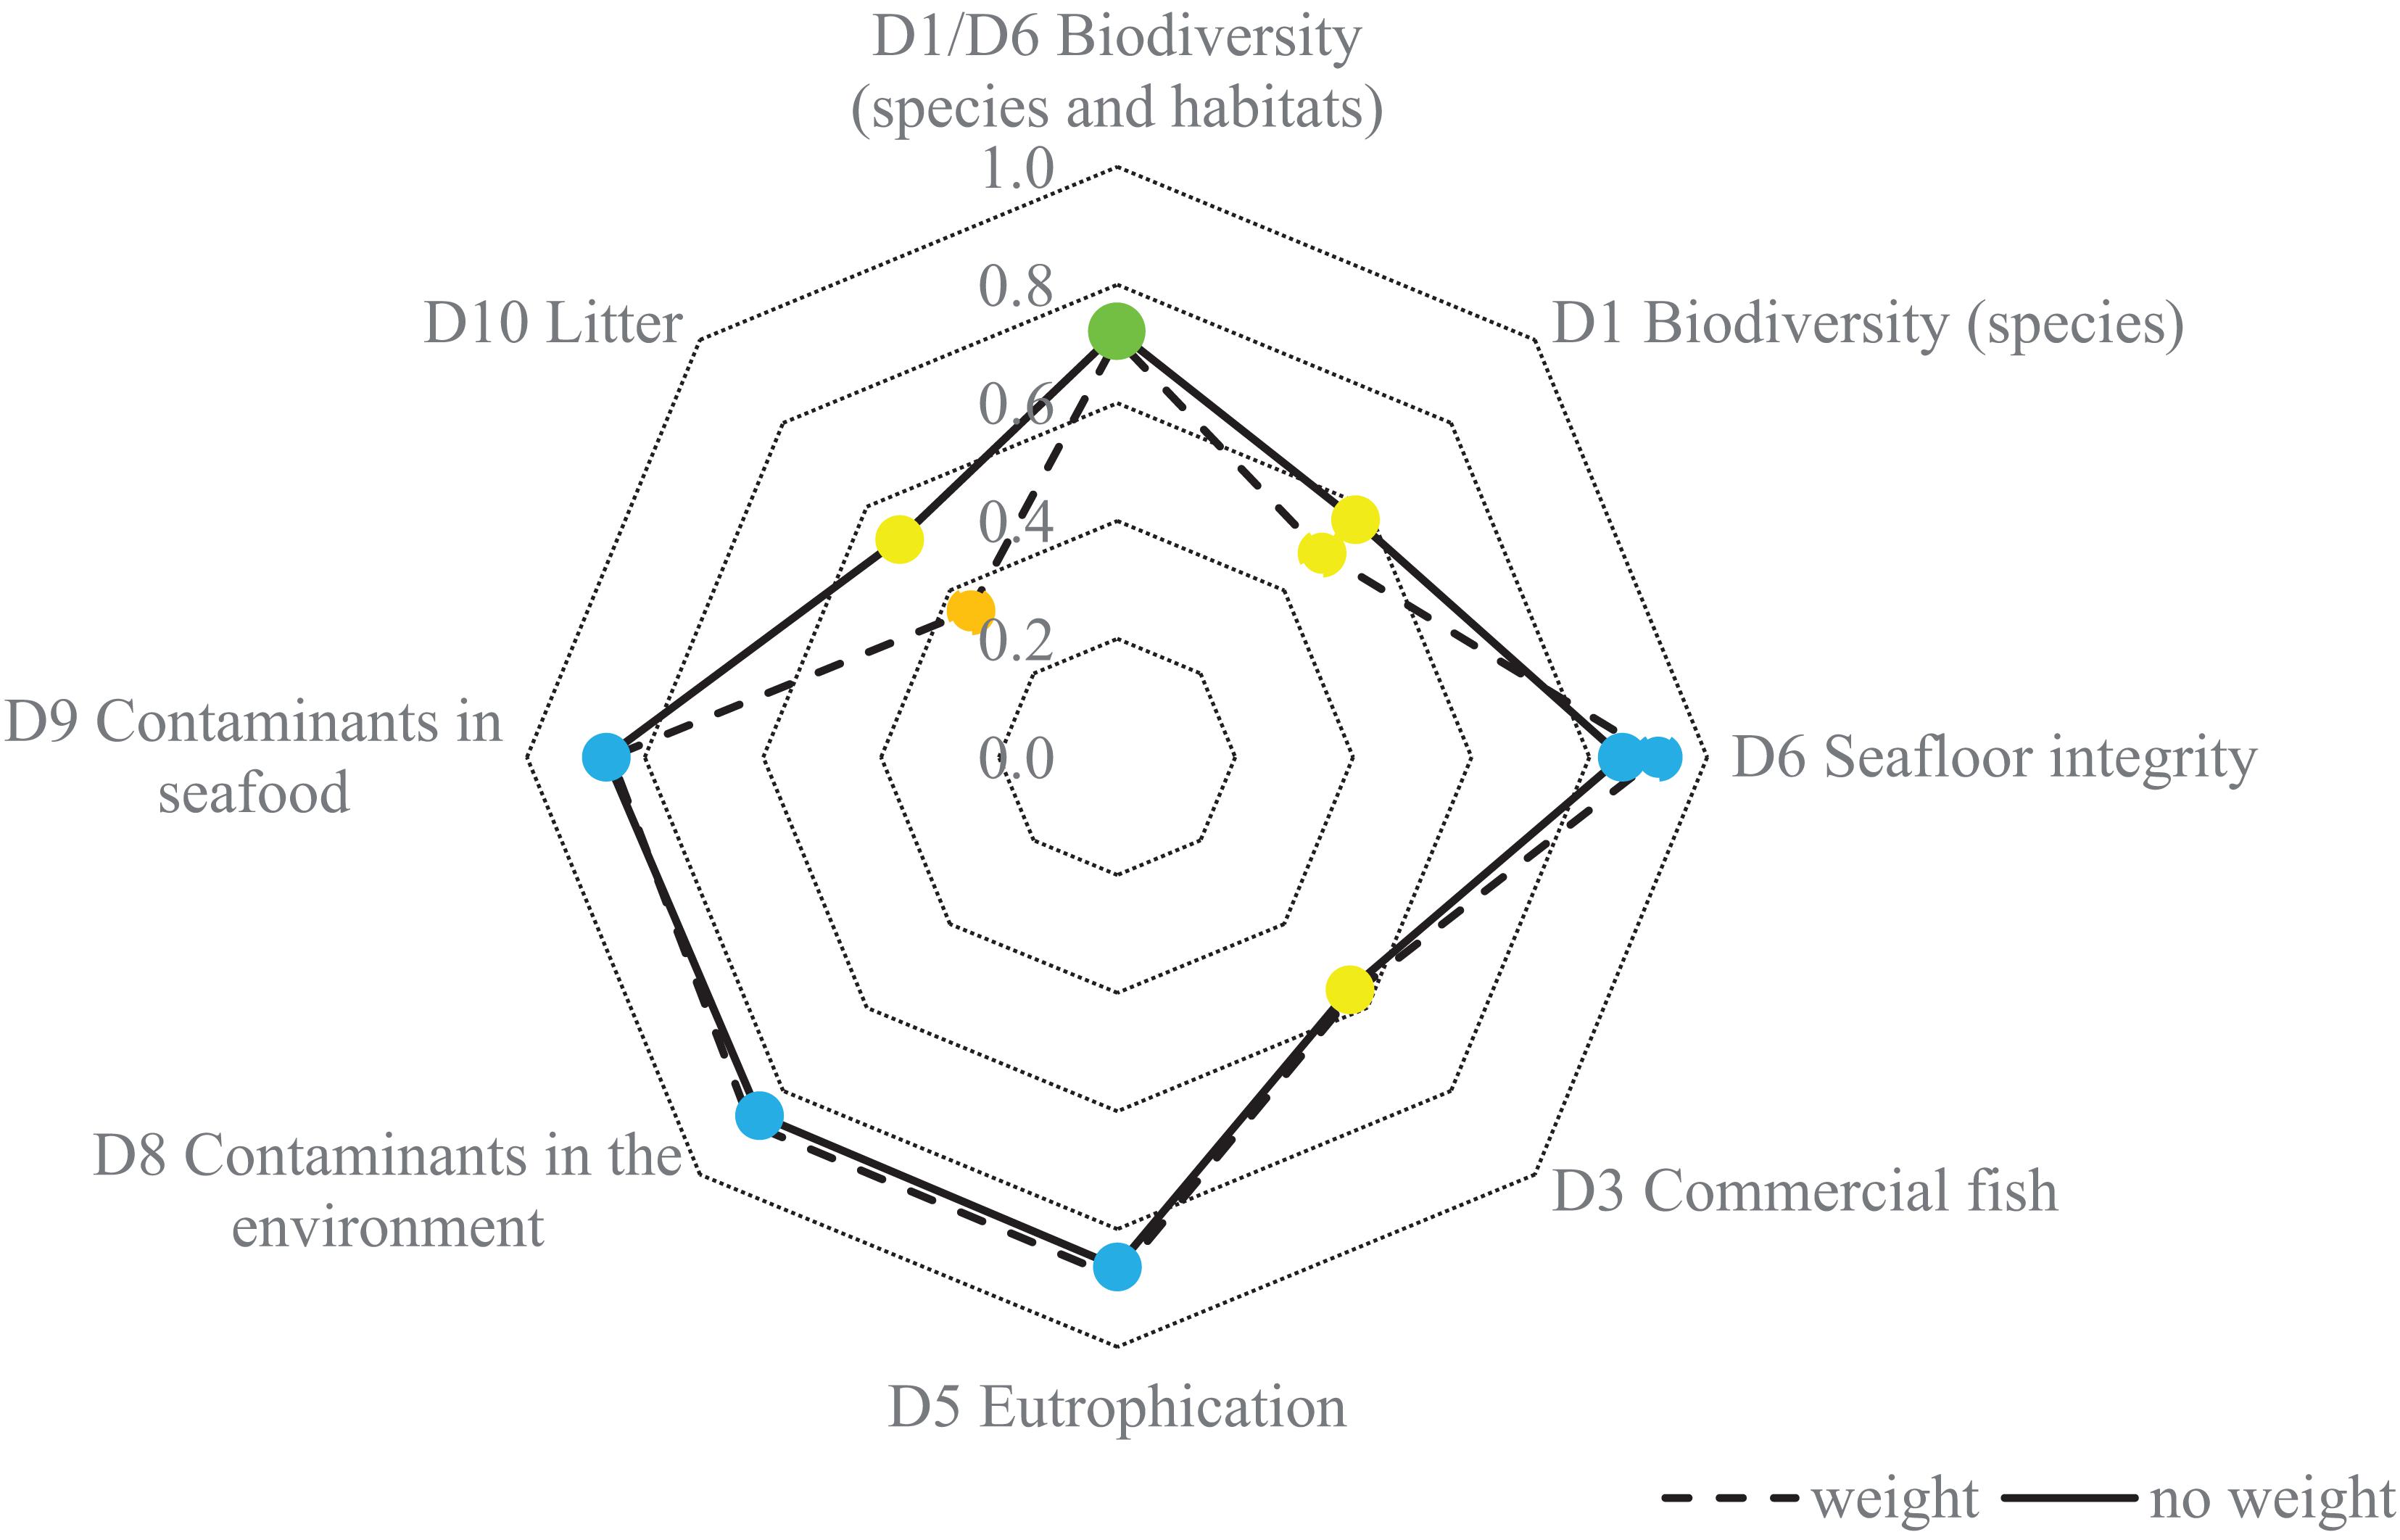
Figure 3. Comparison of the NEAT environmental status results, at descriptor (D) level, when weighting by the Marine Reporting Units (MRU) surface area and non-weighting (i.e., each MRU has the same weight in the integration, irrespective of its surface). Blue: high status; Green: good status; Yellow: moderate status; Orange: poor status.
Similarly, when comparing the two assessments at the ecosystem component level, the outputs are highly similar, with some differences (including a difference in quality class) for the sediments and macroalgae components (Figure 4).
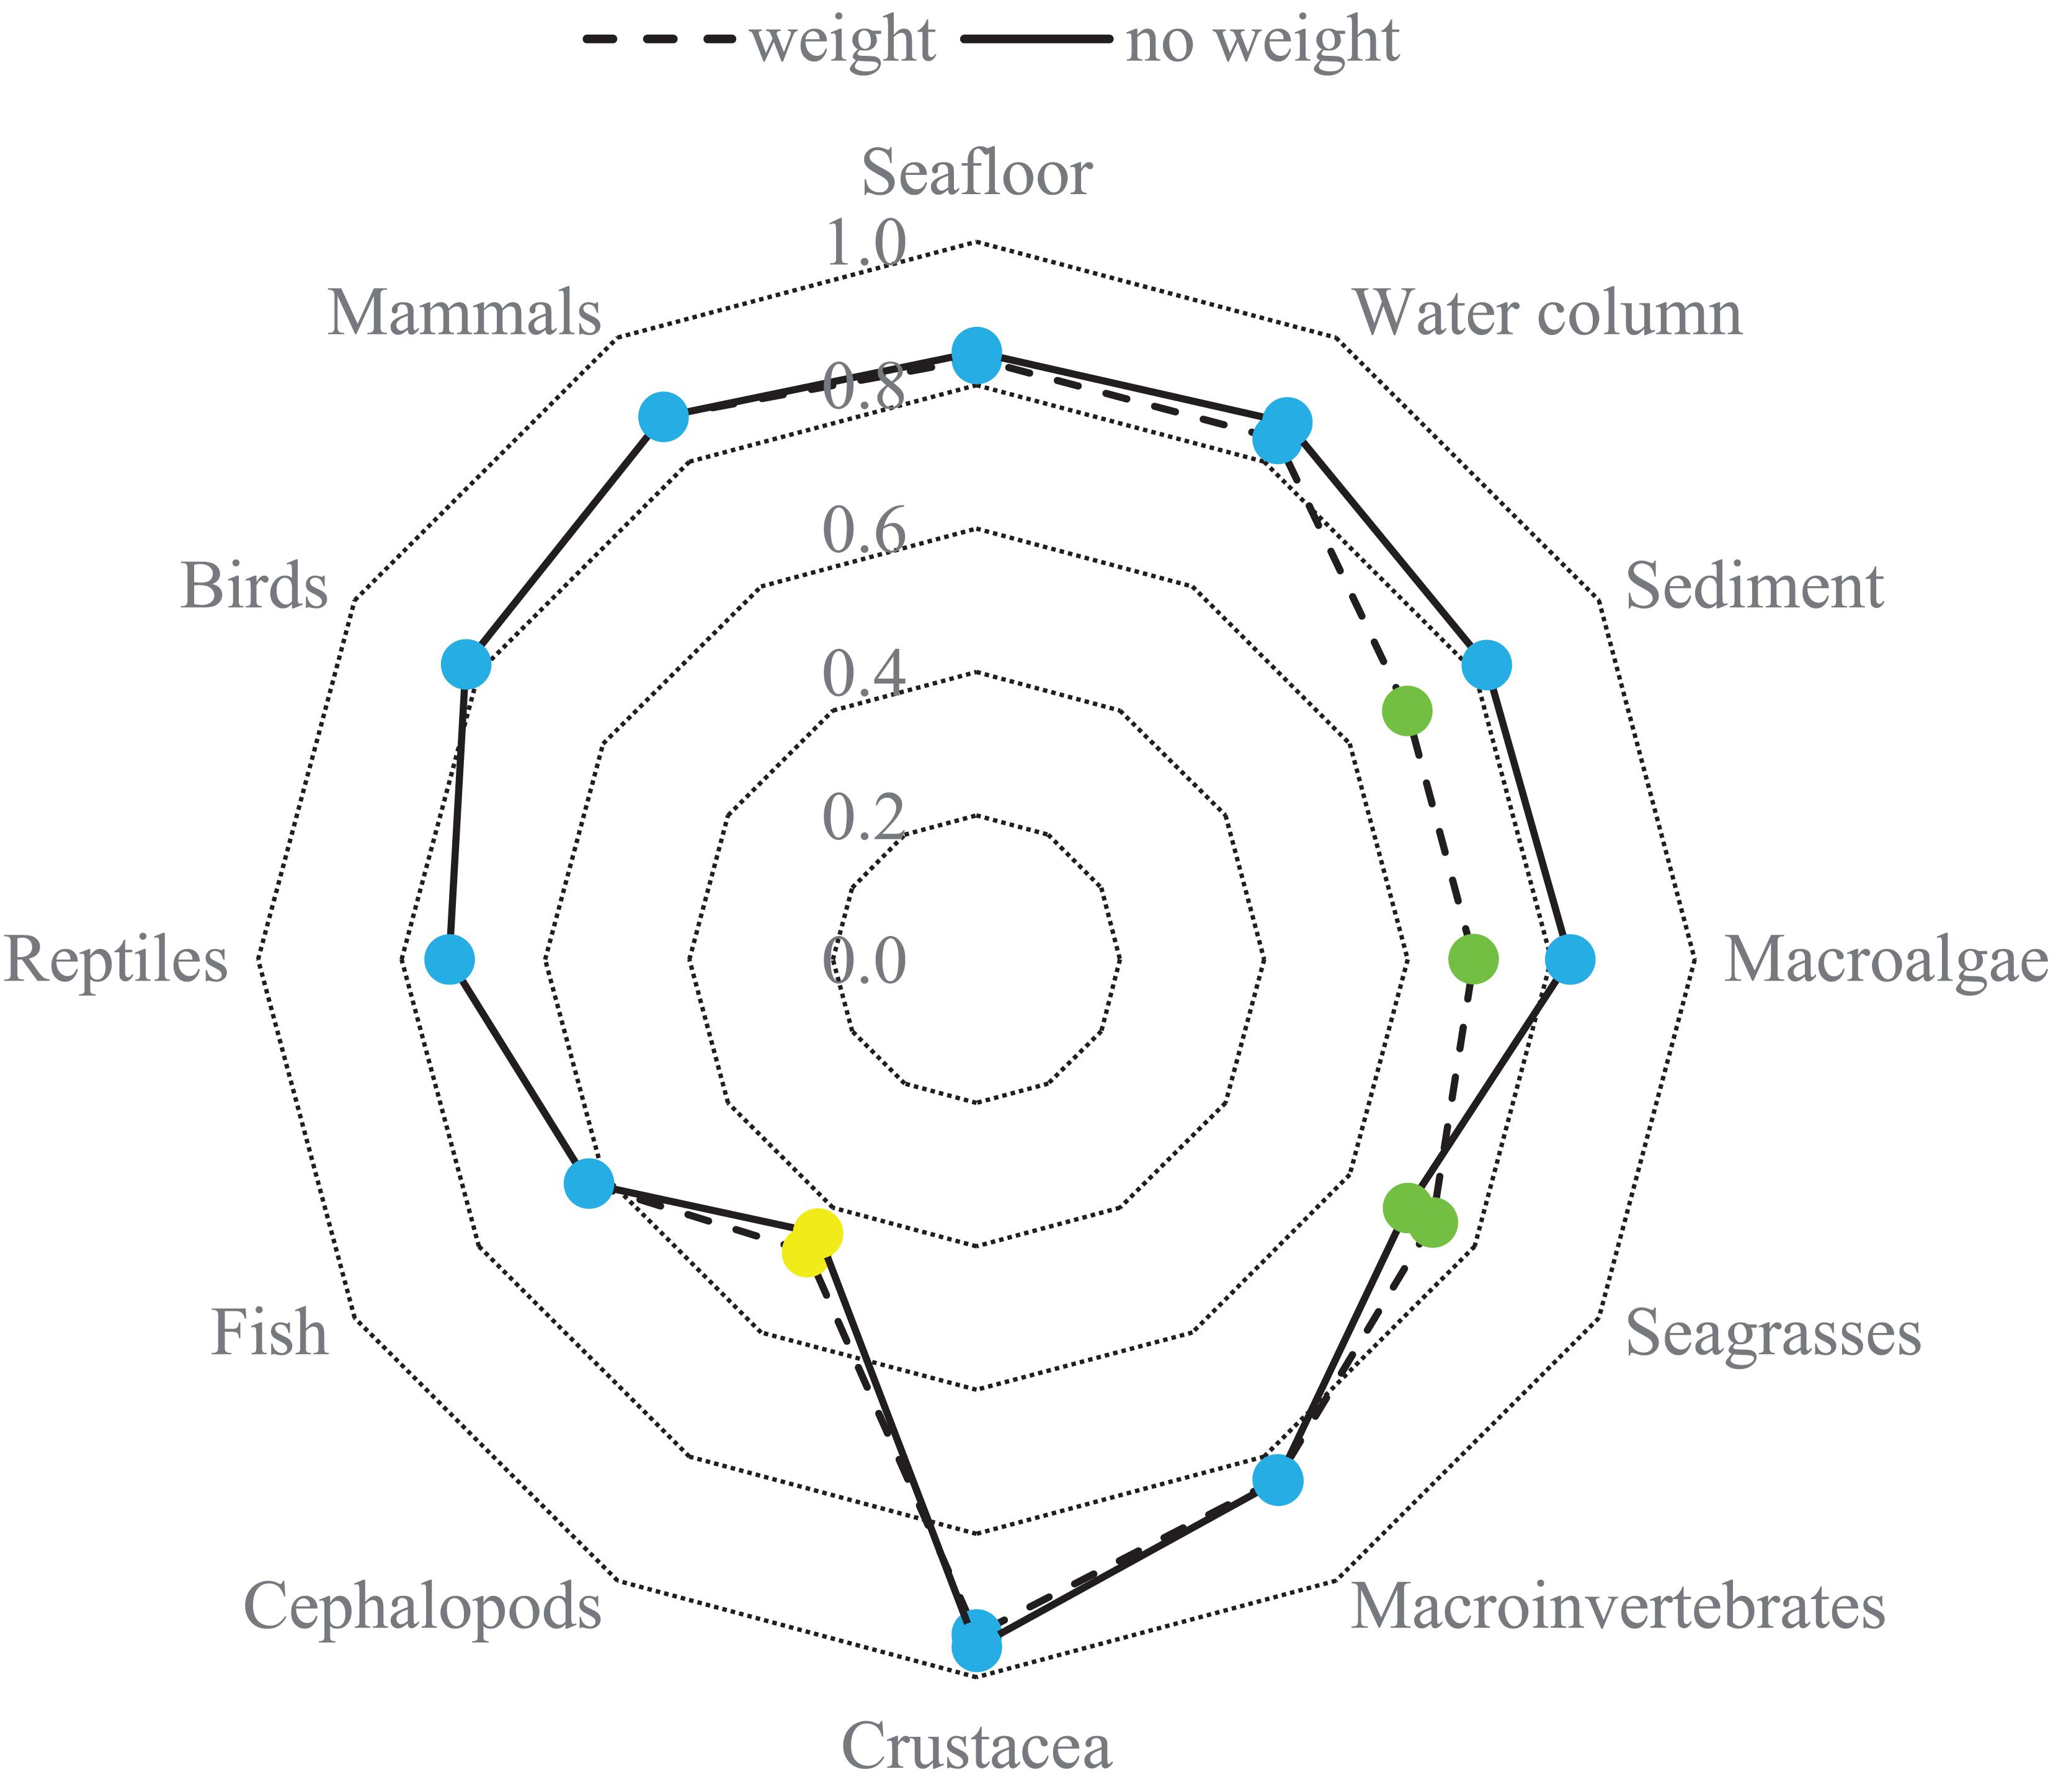
Figure 4. Comparison of the NEAT environmental status results, at ecosystem component level, when weighting by the Marine Reporting Units (MRU) surface area and non-weighting (i.e., each MRU has the same weight in the integration, irrespective of its surface). Blue: high status; Green: good status; Yellow: moderate status.
Global Results for Malta’s Marine Waters When Weighting by Marine Reporting Unit in NEAT
Taking into account the results from previous section, the results after weighting by reporting unit surface were further investigated. Under such an option, the larger the spatial cover of a reporting unit the greater the weight given to any associated indicator value. Thus, the overall assessment of Malta’s marine waters is a weighted average of indicators. Table 2 provides an overview of the outcomes of an integrated assessment of all reporting units, including criteria and descriptors (shown in columns) and an integrated assessment for criteria and descriptors, for each reporting unit (shown in rows).
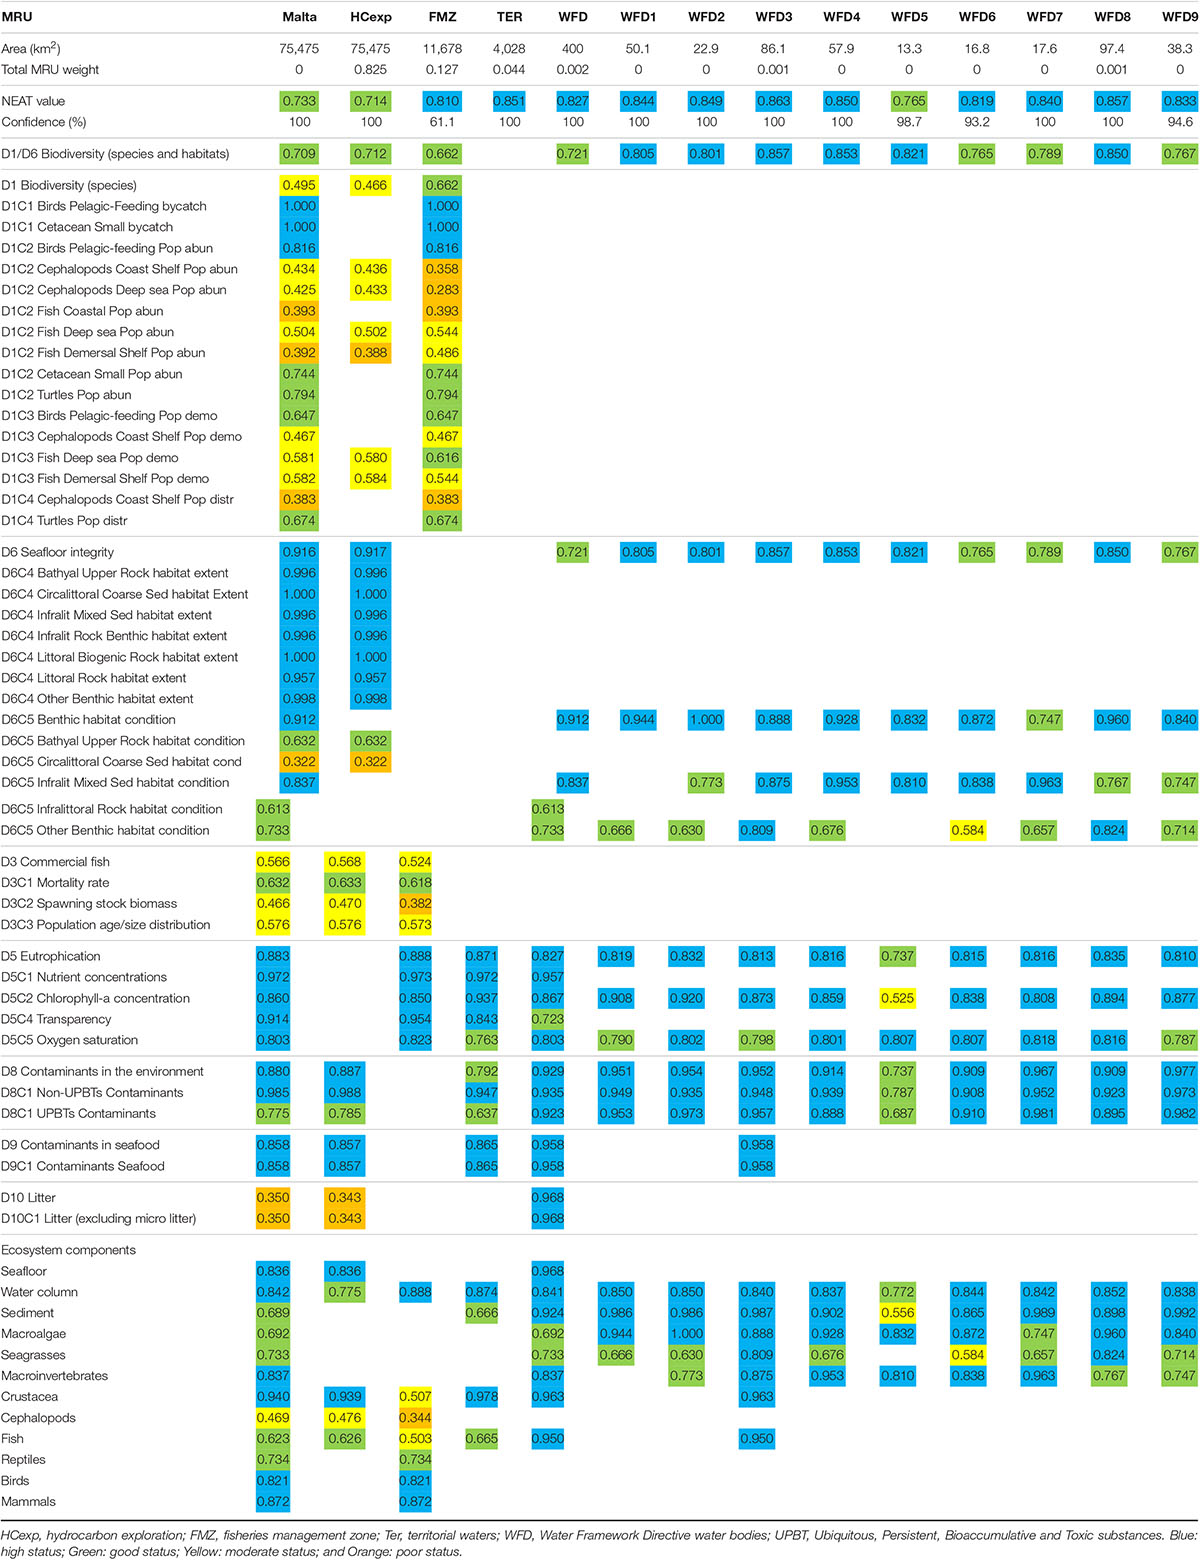
Table 2. Environmental status values, using NEAT (Nested Environmental status Assessment Tool), weighted by Marine Reporting Units (MRU) area, for each MRU, criterion (C) and descriptor (D) of the Marine Strategy Framework Directive, as well as for each ecosystem component.
Malta’s marine waters achieve an overall “good” status, mainly reflecting the “good” environmental status of the HCexp reporting unit, which represents Malta’s overall marine area. Most of the other contained reporting units achieve “high” status (Table 2). The confidence of the results is near 100% in all cases, with the exception of FMZ reporting unit, with a confidence level of 61.1% (Table 2).
Generally, NEAT results at coastal water (WFD) level are better than integrations at a larger scale, such a result also reflecting the larger number of indicators considered for the larger reporting units from NEAT results, and the status of these (Table 2). However, relatively low NEAT values were also noted for some criteria and ecosystem components at coastal reporting unit level e.g., for WFD5 and WFD6, such as habitat condition based on Posidonia oceanica (D6C5), chlorophyll concentration (D5C2), and sediments, which achieved “moderate” status (Table 2).
In spite of the overall “good” status achieved for Malta’s water though the NEAT application, a lower status was observed for some descriptor level integrations. For example, D1 (biodiversity) is in moderate status reflecting status for cephalopods and fish in coastal waters and/or deep seas under D1C2 (population abundance), D1C3 (population demographic characteristics), and D1C4 (population distribution range) criteria (Table 2).
Meanwhile, whilst the D6 (seafloor integrity) achieved “high” environmental status, a deeper look into its component criteria indicated the benthic habitat condition (D6C5) for circalittoral coarse sediments in “poor” status (Table 2), based on the indicator for extent of disturbed seafloor. Meanwhile an overall “moderate” status is achieved for commercial fish and shellfish (D3), reflecting the “moderate” status for the spawning stock biomass (D3C2) and population age/size distribution (D3C3), and fishing mortality rate (D3C1) in “good” status this being based on a NEAT value close to the good/moderate threshold (Table 2).
On the other hand, D5 (eutrophication), D8 (contaminants in the environment), and D9 (contaminants in seafood) are in “high” environmental status for the overall Maltese waters and in most of the contained reporting units (Table 2).
As for the “poor” environmental status of D10 (marine litter), detected by NEAT, this is reflection of floating and seafloor litter pressures in the HCexp reporting unit (as reflected by the “poor” status under these criteria), in contrast to the “high” status when assessed for coastal waters (WFD) (Table 2).
Finally, looking at integrations for elements representing ecosystem components (bottom of Table 2), good or high status is achieved in most cases. However, the detailed breakdown of the assessment outcome also indicates “poor/moderate” levels for fish, cephalopods and crustaceans assessed at the larger area assessment scales (HCexp and/or FMZ), as well as “moderate” levels for seagrasses in WFD6 and sediments in WFD5.
A Comparative Analysis of the NEAT Assessment Outcomes and Malta’s Official MSFD Assessment
Malta official national assessment reporting was carried out by integrating quantitative outcomes for indicators/criteria per descriptor where possible, and complementing with qualitative evaluation where necessary. A comparison of the results obtained through the use of NEAT and the results reported by Malta in its official assessment report, was therefore mostly possible at lower levels on the integration hierarchy i.e., for indicators and criteria. The comparative analysis is summarized in Table 3, in which the results (NEAT values) for the integrated assessment done using NEAT (per criterion, per descriptor and considering all descriptors), is shown aside the classification of the status of the indicators (good vs. not good vs. not assessed) as per the NEAT assessment, and as per Malta’s official assessment5.
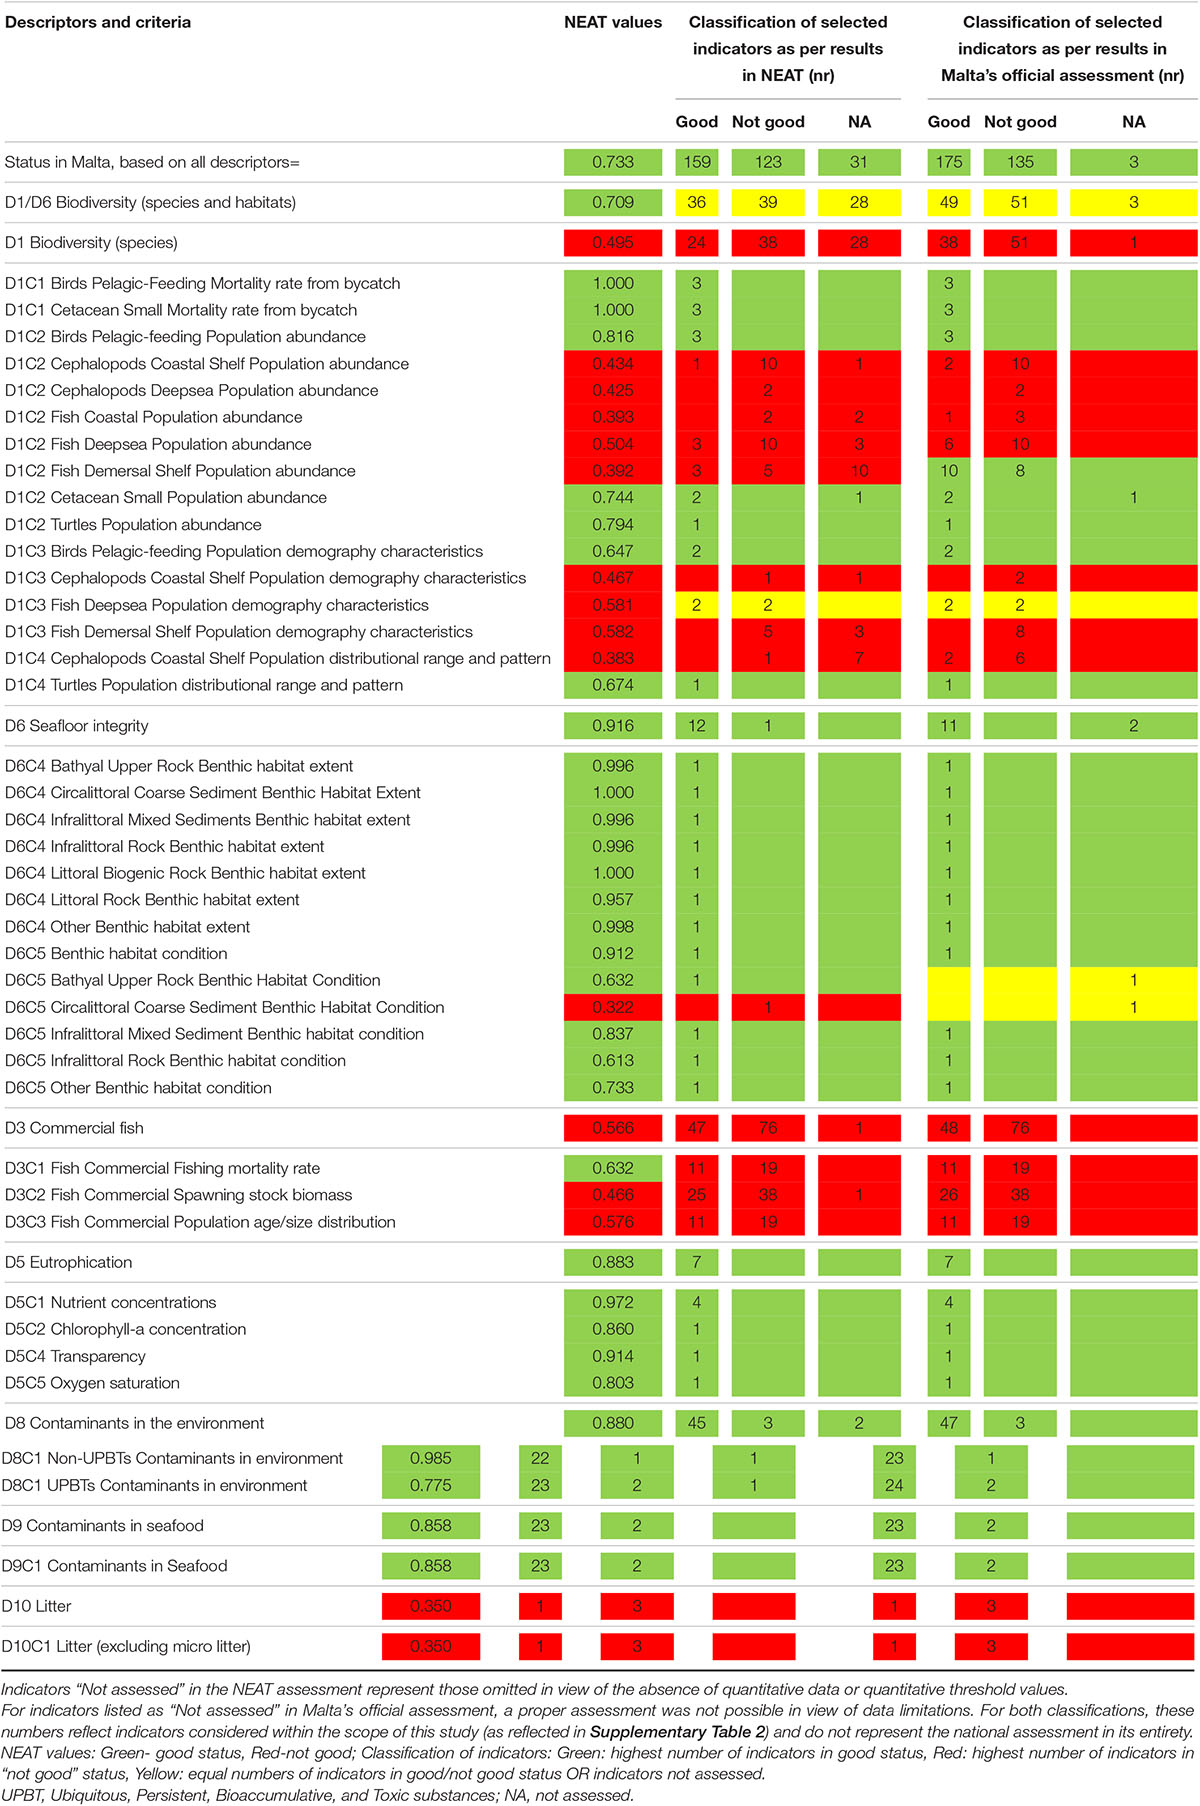
Table 3. Malta environmental status values, using NEAT (Nested Environmental status Assessment Tool), for each criterion (C) and descriptor (D) of the Marine Strategy Framework Directive; and a comparison of the classification of indicators as per results in NEAT vs. classification of indicators as per results in the official assessment.
The reporting units applied in the NEAT approach for the specific indicators reflect the reporting units applied within the national assessment, with some exceptions. Within Malta’s national assessment, species under D1 (Fish) and D3 (Commercial fish and shellfish) were assessed at the FMZ scale and also at the scale of the General Fisheries Commission for the Mediterranean (GFCM) and geographical sub-area (GSA) 15, the latter reflecting the regional scale for fisheries data collection. Meanwhile within the NEAT approach, in addition to assessment at FMZ, indicators for these descriptors were instead assessed at HCexp scale. In doing so it was assumed that data for the GSA 15 area, was also representative for the HCexp area.
The achievement of “good” status (0.733) when integrating the NEAT values of all seven descriptors for all of Malta’s waters, is a good reflection of the classification of indicators under both assessments, with 56% of indicators in good status in both cases (159 indicators in “good” status out of 282 indicators assessed in NEAT, and 175 indicators in “good” status out of out of 310 indicators assessed in the official assessment; see Table 3).
Meanwhile, for the majority of descriptors the high NEAT values were also reflected by the high proportion of indicators in “good” status under both the NEAT assessment and Malta’s official assessment (Table 3).
When comparing the different criteria, in 38 out of 40 cases from D1, D3, D5, D6, D8, D9, and D10, NEAT values mirror the classification of indicators in both the NEAT and the official assessment i.e., where NEAT values indicates “good” status, the proportion of indicators in “good” status is also high (92–100%) (based on proportions indicated in Table 3) and vice-versa. Such results may mask issues noted when looking at the assessment at indicator level e.g., for D9 (contaminants in seafood) mercury in Xiphias gladius and Merluccius merluccius is present at levels above established by the environmental quality standards; and for D8 (contaminants in the environment) mercury levels in fish and benzo(a)pyrene and fluoranthene in sediments are also above established standards (Supplementary Table 2). Meanwhile for criteria resulting in non-good NEAT values, the percentage of indicators in non-good status, in both the NEAT assessment and the official assessment varies from 59 to 100% (based on proportions indicated in Table 3). In the case of D1 (biodiversity), this reflects the numerous indicators not achieving good status including species from several genera, such as e.g., Diplodus, Epinephelus, Mustelus, Chimaera, Coelorinchus, or Etmopterus, in fish, and Illex, Octopus, Eledone, Scaeurgus, Sepia, or Todarodes, in cephalopods (Supplementary Table 2).
However, disagreements are also noted between the classification of indicator values from both the NEAT assessment and Malta’s official assessment (Table 3):
• When integrating D1 and D6 (species and habitats) disagreement was noted between the NEAT value indicating “good” status (0.71), and the higher proportion of indicators in non-good status for both assessments (Table 3), but with a high level of confidence (100%, Supplementary Table 7). Such a case exemplifies cases where integrated values coupled with weighting effects can mask differing scenarios/values evident at lower scales/levels.
• For population abundance of demersal fish in the shelf area (D1C2), low NEAT value (0.39) reflects the number of indicators in non-good status under the NEAT assessment. In contrast under the official assessment, the number of indicators in good status is higher (10) than those in non-good status (8). This difference is however explained by the fact that 10 indicators were excluded from the NEAT assessment due to the absence of quantitative thresholds.
• For population demography in deep-sea fish (D1C3) the non-good status (0.58, close to the threshold of 0.6), calculated with NEAT, does not provide a complete picture of the 50:50 ratio of indicators in good status (Chimaera monstruosa and Galeus melastomus, in FMZ) and non-good status (Etmopterus spinax and Galeus melastomus, in HCexp) in both NEAT and official assessments (Supplementary Table 2); and
• In the case of fishing mortality (D3C1), the “good” status (close to the 0.6 threshold) calculated using NEAT, contrasts with a 63% of the indicators in “not good” status in both NEAT and official assessments, once again reflecting the loss of detail when integrating values.
Discussion
Despite the progress made in the integrated assessment of the marine environment (Borja et al., 2016; Inniss et al., 2016), a number of challenges persist (Borja et al., 2019b; European Commission, 2020): absence of suitable indicators; absence of suitable reference conditions or thresholds; difficulty in aggregating/integrating indicator outcomes (e.g., challenges with approaches such as the OOAO—One Out All Out—principle); lack of guidance on the number of indicators to be used; and lack of traceability when integrating indicators or criteria (Borja and Rodríguez, 2010).
When assessing environmental status, the selection of indicators remains one of the most critical and limiting factors (Hummel et al., 2015; Teixeira et al., 2016; Uusitalo et al., 2016; Thibaut et al., 2017). There are different criteria for selecting suitable indicators, including ecological significance, sensitivity to pressures and measurability, among others (Shin et al., 2010; Queiros et al., 2016; Rossberg et al., 2017).
For Malta’s national official assessment of the status of the marine waters, as required under MSFD processes (ERA, 2020a), well-known indicators and criteria were used by Maltese authorities, together with legally binding thresholds, based upon international decisions, e.g., intercalibration exercises under the WFD (European Commission, 2017, 2018a), Environmental Quality Standards (European Commission, 2013), etc. In the absence of suitable reference conditions and thresholds values, it is not possible to undertake quantitative environmental assessments (Borja et al., 2012). Hence, when those binding thresholds were not available, Malta authorities used other sources for thresholds/boundaries of status as accepted by the scientific community (e.g., thresholds for fish and shellfish stocks – Froese et al., 2018) or under regional/sub-regional bodies (e.g., UNEP/MAP baselines for marine litter). Most of the threshold values employed within Malta’s official assessment was also used within the NEAT assessment.
Furthermore, the NEAT assessment was complemented with additional threshold values, referred to from academic sources (e.g., habitat loss and habitat disturbance thresholds from Kazanidis et al., 2020), or based on expert judgment. However, for other indicators, threshold values were deemed unavailable. Noting that the use of such values is a requirement of the NEAT software, such indicators were excluded from the NEAT assessment, giving rise to discrepancies when comparing outcomes to those of Malta’s official assessment (e.g., exclusion of indicators for criterion D1C2—fish demersal shelf population abundance, as shown in Table 3). This throws light on the importance of discussion and agreement on threshold values amongst countries implementing MSFD processes and sharing the same (sub)regional sea. Such values play a role in ensuring comparability of assessments across MS, especially in states sharing similar pressures, and facilitating the design of common management measures to achieve good status (Gorjanc et al., 2020; Murillas-Maza et al., 2020).
In spite of the mentioned challenges, taking into account experience in applying NEAT in the Mediterranean (Borja et al., 2019c; Pavlidou et al., 2019), and based on the available data and thresholds, the application of NEAT to Malta’s waters was still possible. An integrative assessment for Malta was performed, with a high confidence in the final result (from 61 to 100% in confidence), suggesting an overall achievement of good environmental status in Maltese marine waters.
In addition to assessing the overall status, the NEAT interface allows for the review of status at smaller geographical scales (reporting units) or at lower levels in the integration hierarchy. As an example, it was possible to note a lower NEAT value (albeit good) for reporting unit WFD5, wherein the capital (Valletta) and its harbor are located, based on the moderate status for some criteria (e.g., chlorophyll) and ecosystem components (e.g., sediments), and others with status values close to the good/non-good threshold e.g., descriptors D5 (eutrophication) and D8 (contaminants). All these observations reflect the intensive urban and harbor activities (e.g., discharges, shipping, dredging, etc.) downgrading the quality of this reporting unit, as also confirmed in previous studies (Romeo et al., 2015). With specific components of the marine environment failing to achieve good status, specific management measures are required (ERA, 2020a).
Furthermore, whilst good status is also achieved for the largest reporting units, FMZ and HCexp, the NEAT interface highlighted cases of non-achievement of good status) for specific criteria and descriptors. A number of such criteria (e.g., spawning stock biomass and population age/size distribution in descriptor D3 of commercial fish) are linked to fishing pressure, which is a general concern in the Mediterranean, with many stocks under the sustainable exploitation limits (de Juan et al., 2011; Raicevich et al., 2017; Froese et al., 2018; Borja et al., 2019c; Reker et al., 2019). With respect to criteria reflecting the status of fish stocks, the shortcomings of assessing such stocks at the scales referred to in section “A Comparative Analysis of the NEAT Assessment Outcomes and Malta’s Official MSFD Assessment” must be noted, whilst highlighting the importance of complimenting assessments and measures of stocks at the regional scale, as highlighted by Maltese authorities (ERA, 2020a).
Fishing pressure (from D3) is also known to affect other components of the Mediterranean ecosystem (Coll et al., 2006, 2009), as indicated by the NEAT assessment for several other biodiversity components (in D1), especially fish and cephalopods, under criteria such as population abundance, population demography, and population distribution, for coastal, shelf, and deep-sea areas. In addition, the circalittoral sediments reflect a poor status, reflecting 62.4% of this type of benthic habitat exposed to trawling activity to a lesser or a greater degree (ERA, 2020a), as in other Mediterranean areas (de Juan et al., 2011; Reker et al., 2019). Such quantification is, however, a reflection of the pressure exerted by such activities, and is considered an overestimation of extent of the actual impact on the seabed. This is due to the fact that the intensity with which trawling occurs is highly variable across the reported areas, cumulative dynamics with other pressures may exist and there is no data based on which pressure to impact extrapolations can be made (ERA, 2020a). This example illustrates the challenges encountered when integrating data from different sources to assess the status of large areas, including issues of scale, data accuracy, and knowledge gaps.
Marine litter is another descriptor failing to achieve good status under the NEAT assessment as shown for circalittoral and deep bottoms. Although an attempt was made to correlate its presence with fishing activities and environmental variables, no interpretable correlations were found (Mifsud et al., 2013), implying that litter abundance and distribution depends on factors others than those considered, which could include land-based sources and littering from shipping outside Malta, as shown in other Mediterranean areas (Arcangeli et al., 2018).
In the case of contaminants (D8 and D9), among 68 indicators, benzo(a)pyrene, fluoranthene, and mercury in matrices such as sediments, biota (fish) and seafood failed achievement of good status. Mercury is a substance of concern in the whole Europe (Višnjevec et al., 2014; Kuenen et al., 2018) in water, sediment, biota, as well as in seafood. There is a chronic contamination by this metal in many European locations indicating the need for solutions at the European level (Kuenen et al., 2018). As for the remaining contaminants, some of them could be related to the bunkering activities (ERA, 2020a), but this should be proven with additional sampling in future applications of the monitoring network (Borja et al., 2019b). Further, such results shed light on the need to ensure representative sampling of fish and cephalopods for future assessments under D9.
According to Table 3, 93.3% of the contaminant indicators achieved good status for D8, and 91.3% achieved good status for D9, using NEAT. However, had the OOAO principle been opted for (as suggested by some MS), these descriptors would have failed to achieve good status, on the basis of three out of 45 contaminants in D8, and two out of 23 in D9 failing to achieve the quality objectives. The use of the OOAO principle has been repeatedly criticized (Moss et al., 2003; Moss, 2008; Caroni et al., 2013; Langhans et al., 2014), because it tends to downgrade the quality of assessed locations unjustifiably, depending on the number of indicators included in the assessment, as demonstrated elsewhere (Borja and Rodríguez, 2010; Borja et al., 2019c). Although this principle is consistent with the precautionary principle, such as in cases all the indicators are considered as essential in the assessment; it tends to inflate Type I errors (concluding that the assessed area is below good status, even if the real status is good). Further, it has been demonstrated that in contrast to the OOAO, integrative assessments are more suitable in showing improvements/trends in the quality of marine areas after applying management measures (Borja and Rodríguez, 2010). The inability for the OOAO approach to demonstrate changes in status implies the risk of miscalculating the need for management measures where they are not really needed (Borja and Rodríguez, 2010). Therefore, OOAO principle increases the likelihood of misclassifying to a lower status class by sheer randomness (Hering et al., 2010) and increasing the number of indicators, ecosystem components or descriptors for the MSFD, the possibility of downgrading the quality status in the assessment increases exponentially (Borja et al., 2019c). In contrast, the NEAT represents an alternative approach allowing to trace back low environmental status to underlying indicators, and as a result the proposal of targeted management measures. Finally, under all circumstances, the appropriate choice of representative indicators is as important a factor as the choice of the approach chosen to integrate results.
Despite the human activities and pressures identified in Malta (e.g., high population density, massive tourism in summer, fishing, shipping, bunkering, aquaculture, etc.) (ERA, 2020a), only some reporting units and descriptors can be considered as affected, with some areas which can be considered near pristine and with most of the marine surface as highly oligotrophic (Farrugia et al., 2016).
The study offers an exemplary approach for an effective integrative assessment in spite of widely discussed challenges (Borja et al., 2014; Langhans et al., 2014; Link and Browman, 2014; Probst and Lynam, 2016). The NEAT offers flexibility through customization possibilities, as shown in a number of studies (Uusitalo et al., 2016; Nemati et al., 2017; Borja et al., 2019c; Pavlidou et al., 2019; Kazanidis et al., 2020), and once again here whereby the software was adapted to accommodate MSFD criteria, whilst allowing for assessments at the levels required by the European Commission (2017, 2018b).
Following the European Commission (2018b) guidelines, quantitative assessments in Malta’s official assessment for the MSFD were mainly performed at indicator level, with limitations in relation to integration process especially where quantitative data was not available. Such an assessment represents important progress when compared to the previous absence of marine environmental assessments in Europe, excepting those at sectoral levels e.g., fish stocks (Froese et al., 2018). Meanwhile the NEAT assessment moves quantitative integration to other levels, applying a transparent process whilst doing so. Its relevance within the scope of the ecosystem-based integrated assessment (O’Higgins et al., 2020) is to be acknowledged, allowing the incorporation of human activities and pressures (fishing, contaminants, litter, etc.), different ecosystem components (phytoplankton, macroalgae, macroinvertebrates, seagrasses, fish, cephalopods, seabirds, and mammals), habitats (pelagic, benthic), all under the framework of criteria and descriptors required by the MSFD. Such an integrated approach offers advantages of an easier communication of issues to society, providing an overall picture of the status without losing the traceability of each pressure-impact relationship.
This study is a lesson learnt based on adequate data from a small country like Malta, but this could be extended to remaining European Union Member States. Such an example provides the required insight for supporting countries in the process of choosing between different approaches for assessment also based on their management implications, for example when linking pressures and impacts, and allowing the identification of appropriate measures to achieve good environmental status (Cavallo et al., 2018; Murillas-Maza et al., 2020).
Data Availability Statement
The data analyzed in this study was obtained from ERA, any restriction of use, as well as requests to access these datasets should be directed to SC at ERA, email c2FyYWguZi5jYW1pbGxlcmlAZXJhLm9yZy5tdA==.
Author Contributions
AB developed the idea, wrote the first draft, and coordinated the works. YSc, RG, and RA participated in the monitoring and gathering data as part of the EMFF 8.3.1 project (see section “Funding” below). The project was carried out by the M3C consortium, integrated by AIS-Environment and AZTI, for ERA. TM and SC represented ERA as data provider and ensured that the contents reflect the MT official assessment. MU adapted NEAT for the assessment. IM, JG, AU, MU, and AB included all data in NEAT. These authors and JF, JL, YSa, and OS assessed each descriptor in NEAT. All authors made insights into the first drafts and contributed equally to the discussion and in writing the final manuscript.
Funding
The data used in this paper emanates from the EU funded project EMFF 8.3.1 under the European Maritime and Fisheries Fund 2014–2020 with a total cost of €1.6 million in public eligible EMFF funds (75% EU and 25% MT). The ultimate goals of this European Maritime and Fisheries Fund (EMFF 2014–2020) project are to devise a holistic approach toward marine monitoring and develop a comprehensive database of data collected about the Maltese waters. The copyright of such data is the property of the project in line with the provisions of CT 3031/2016 and will remain vested in the project in question. The project was carried out by the M3C consortium, integrated by AIS-Environment and AZTI, for the Environment and Resources Authority (ERA). In writing this manuscript, AZTI members have been funded by the project “Support Mediterranean Member States toward the implementation of the Marine Strategy Framework Directive new GES Decision and programs of measures and contribute to regional/subregional cooperation (MEDREGION),” from the European Commission DG ENV/MSFD 2018 call, Grant Agreement 110661/2018/794286/SUB/ENV.C2.
Conflict of Interest
YSc, RG, and RA were employed by company AISEnvironment.
The remaining authors declare that the research was conducted in the absence of any commercial or financial relationships that could be construed as a potential conflict of interest.
Acknowledgments
This is manuscript number 1024 from AZTI’s Marine Research, Basque Research and Technology Alliance (BRTA).
Supplementary Material
The Supplementary Material for this article can be found online at: https://www.frontiersin.org/articles/10.3389/fmars.2021.638232/full#supplementary-material
Footnotes
- ^ https://era.org.mt/en/Pages/MSFD-Initial-Assessment.aspx
- ^ It should be noted that the number of criteria quoted here (52) is higher than what is enlisted in the revised European Commission Decision (European Commission, 2017); in view of differences in the application of criteria for D1 (biodiversity) – mammals, seabirds, fish, and cephalopods, within the NEAT approach.
- ^ www.devotes-project.eu/neat
- ^ http://www.devotes-project.eu/neat/
- ^ For both classifications, these numbers reflect indicators considered within the scope of this study (as reflected in Supplementary Table 2) and do not represent the national assessment in its entirety.
References
Arcangeli, A., Campana, I., Angeletti, D., Atzori, F., Azzolin, M., Carosso, L., et al. (2018). Amount, composition, and spatial distribution of floating macro litter along fixed trans-border transects in the Mediterranean basin. Mar. Pollut. Bull. 129, 545–554. doi: 10.1016/j.marpolbul.2017.10.028
Ballesteros, E., Torras, X., Pinedo, S., García, M., Mangialajo, L., and De Torres, M. (2007). A new methodology based on littoral community cartography dominated by macroalgae for the implementation of the European Water Framework Directive. Mar. Pollut. Bull. 55, 172–180. doi: 10.1016/j.marpolbul.2006.08.038
Berg, T., Murray, C., Carstensen, J., and Andersen, J. H. (2017). NEAT - Nested Environmental Status Assessment Tool - Manual Version 1.3. DEVOTES Project. Belgium: European Commission, 38.
Birk, S., Bonne, W., Borja, A., Brucet, S., Courrat, A., Poikane, S., et al. (2012). Three hundred ways to assess Europe’s surface waters: An almost complete overview of biological methods to implement the Water Framework Directive. Ecol. Indicat. 18, 31–41. doi: 10.1016/j.ecolind.2011.10.009
Borja, Á, and Rodríguez, J. G. (2010). Problems associated with the ‘one-out, all-out’ principle, when using multiple ecosystem components in assessing the ecological status of marine waters. Mar. Pollut. Bull. 60, 1143–1146. doi: 10.1016/j.marpolbul.2010.06.026
Borja, Á, Dauer, D. M., and Grémare, A. (2012). The importance of setting targets and reference conditions in assessing marine ecosystem quality. Ecol. Indicat. 12, 1–7. doi: 10.1016/j.ecolind.2011.06.018
Borja, Á, Elliott, M., Carstensen, J., Heiskanen, A.-S., and van de Bund, W. (2010). Marine management - Towards an integrated implementation of the European Marine Strategy Framework and the Water Framework Directives. Mar. Pollut. Bull. 60, 2175–2186. doi: 10.1016/j.marpolbul.2010.09.026
Borja, Á, Prins, T., Simboura, N., Andersen, J. H., Berg, T., Marques, J. C., et al. (2014). Tales from a thousand and one ways to integrate marine ecosystem components when assessing the environmental status. Front. Mar. Sci. 1:72. doi: 10.3389/fmars.2014.00072
Borja, A., Bricker, S. B., Dauer, D. M., Demetriades, N. T., Ferreira, J. G., Forbes, A. T., et al. (2008). Overview of integrative tools and methods in assessing ecological integrity in estuarine and coastal systems worldwide. Mar. Pollut. Bull. 56, 1519–1537. doi: 10.1016/j.marpolbul.2008.07.005
Borja, A., Elliott, M., Andersen, J. H., Berg, T., Carstensen, J., Halpern, B. S., et al. (2016). Overview of integrative assessment of marine systems: the Ecosystem Approach in practice. Front. Mar. Sci. 3:20. doi: 10.3389/fmars.2016.00020
Borja, A., Franco, J., Garmendia, J. M., Larreta, J., Menchaca, I., Sagarminaga, Y., et al. (2019b). “Monitoring report and update to existing monitoring programme,” in Final report from M3C for ERA, (Belgium: EMFF), 188.
Borja, A., Franco, J., Garmendia, J. M., Larreta, J., Menchaca, I., Sagarminaga, Y., et al. (2019a). “Assessment of environmental status of Malta’s Marine Waters. As per Tender for the Implementation and Updating of Marine Monitoring Programmes, Assessment of Environmental Status and Development of a Marine Database System,” in Report from M3C for ERA, (Belgium: EMFF), 70.
Borja, A., Garmendia, J. M., Menchaca, I., Uriarte, A., and Sagarmínaga, Y. (2019c). Yes, We Can! Large-Scale Integrative Assessment of European Regional Seas, Using Open Access Databases. Front. Mar. Sci. 6:19. doi: 10.3389/fmars.2019.00019
Caroni, R., Bund, W., Clarke, R. T., and Johnson, R. K. (2013). Combination of multiple biological quality elements into waterbody assessment of surface waters. Hydrobiologia 704, 437–451.
Carstensen, J., and Lindegarth, M. (2016). Confidence in ecological indicators: A framework for quantifying uncertainty components from monitoring data. Ecol. Indicat. 67, 306–317. doi: 10.1016/j.ecolind.2016.03.002
Cavallo, M., Elliott, M., Quintino, V., and Touza, J. (2018). Can national management measures achieve good status across international boundaries? - A case study of the Bay of Biscay and Iberian coast sub-region. Ocean Coastal Manag. 160, 93–102. doi: 10.1016/j.ocecoaman.2018.04.005
Coll, M., Palomera, I., and Tudela, S. (2009). Decadal changes in a NW Mediterranean Sea food web in relation to fishing exploitation. Ecol. Model. 220, 2088–2102. doi: 10.1016/j.ecolmodel.2009.04.049
Coll, M., Shannon, L. J., Moloney, C. L., Palomera, I., and Tudela, S. (2006). Comparing trophic flows and fishing impacts of a NW Mediterranean ecosystem with coastal upwelling systems by means of standardized models and indicators. Ecol. Model. 198, 53–70. doi: 10.1016/j.ecolmodel.2006.04.009
Dailianis, T., Smith, C. J., Papadopoulou, N., Gerovasileiou, V., Sevastou, K., Bekkby, T., et al. (2018). Human activities and resultant pressures on key European marine habitats: An analysis of mapped resources. Mar. Policy 98, 1–10. doi: 10.1016/j.marpol.2018.08.038
de Juan, S., Demestre, M., and Sánchez, P. (2011). Exploring the degree of trawling disturbance by the analysis of benthic communities ranging from a heavily exploited fishing ground to an undisturbed area in the NW Mediterranean. Sci. Mar. 75, 507–516. doi: 10.3989/scimar.2011.75n3507
Eikeset, A. M., Mazzarella, A. B., Davíðsdóttir, B., Klinger, D. H., Levin, S. A., Rovenskaya, E., et al. (2018). What is blue growth? The semantics of “Sustainable Development” of marine environments. Mar. Policy 87, 177–179. doi: 10.1016/j.marpol.2017.10.019
Elliott, M., Borja, A., and Cormier, R. (2020). Activity-footprints, pressures-footprints and effects-footprints – Walking the pathway to determining and managing human impacts in the sea. Mar. Pollut. Bull. 155:111201. doi: 10.1016/j.marpolbul.2020.111201
ERA (2020a). Update on Articles 8, 9, and 10 of the Marine Strategy Framework Directive (2008/56/E C) in Malta’s Marine Waters. Malta: Environment and Resources Authority, 540.
ERA (2020b). “Update on Articles 8, 9, and 10 of the Marine Strategy Framework Directive (2008/56/E C) in Malta’s Marine Waters,” in Second assessment report-annexes, (Malta: Environment and Resources Authority), 223.
European Commission (2008). Directive 2008/56/EC of the European Parliament and of the Council establishing a framework for community action in the field of marine environmental policy (Marine Strategy Framework Directive). Offic. J. Eur. Union L164, 19–40.
European Commission (2010). Commission Decision of 1 September 2010 on criteria and methodological standards on good environmental status of marine waters (notified under document C(2010) 5956)(2010/477/EU). Offic. J. Eur. Union L232, 12–24.
European Commission (2013). Directive 2013/39/EU of the European Parliament and of the Council of 12 August 2013 amending Directives 2000/60/EC and 2008/105/EC as regards priority substances in the field of water policy. Offic. J. Eur. Union L226, 1–17.
European Commission (2017). Commission Decision (EU) 2017/848 of 17 May 2017 laying down criteria and methodological standards on good environmental status of marine waters and specifications and standardised methods for monitoring and assessment, and repealing Decision 2010/477/EU. Offic. J. Eur. Commun. L125, 43–74.
European Commission (2018b). Reporting on the 2018 update of articles 8, 9 & 10 for the Marine Strategy Framework Directive version 4.2. Brussels: DG Environment, 66.
European Commission (2018a). Commission Decision (EU) 2018/229 of 12 February 2018 establishing, pursuant to Directive 2000/60/EC of the European Parliament and of the Council, the values of the Member State monitoring system classifications as a result of the intercalibration exercise and repealing Commission Decision 2013/480/EU. Offic. J. Eur. Commun. L47, 1–91.
European Commission (2019). Reporting on the 2020 update of Article 11 for the Marine Strategy Framework Directive (version 2.0, draft). Brussels: European Commission, 41.
European Commission (2020). Report from the Commission to the European Parliament and the Council on the implementation of the Marine Strategy Framework Directive (Directive 2008/56/EC) Brussels, 25.6.2020 COM(2020) 259 final; {SWD(2020) 60 final} - {SWD(2020) 61 final} - {SWD(2020) 62 final}. Brussels: European Commission, 307.
Farrugia, H., Deidun, A., Gauci, A., and Drago, A. (2016). Defining the Trophic Status of Maltese (Central Mediterranean) Coastal Waters through the Computation of Water Quality Indices Based on Satellite Data. J. Coastal Res. 75, 632–636. doi: 10.2112/si75-127.1
Froese, R., Winker, H., Coro, G., Demirel, N., Tsikliras, A. C., Dimarchopoulou, D., et al. (2018). Status and rebuilding of European fisheries. Mar. Policy 93, 159–170. doi: 10.1016/j.marpol.2018.04.018
Gobert, S., Sartoretto, S., Rico-Raimondino, V., Andral, B., Chery, A., Lejeune, P., et al. (2009). Assessment of the ecological status of Mediterranean French coastal waters as required by the Water Framework Directive using the Posidonia oceanica Rapid Easy Index: PREI. Mar. Pollut. Bull. 58, 1727–1733. doi: 10.1016/j.marpolbul.2009.06.012
Gorjanc, S., Klanènik, K., Murillas-Maza, A., Uyarra, M. C., Papadopoulou, N. K., Paramana, T., et al. (2020). Coordination of pollution-related MSFD measures in the Mediterranean - Where we stand now and insights for the future. Mar. Pollut. Bull. 159:111476. doi: 10.1016/j.marpolbul.2020.111476
Hering, D., Borja, A., Carstensen, J., Carvalho, L., Elliott, M., Feld, C. K., et al. (2010). The European Water Framework Directive at the age of 10: A critical review of the achievements with recommendations for the future. Sci. Total Environ. 408, 4007–4019. doi: 10.1016/j.scitotenv.2010.05.031
Hummel, H., Frost, M., Juanes, J. A., Kochmann, J., Aneiros, F., Vandenbosch, F., et al. (2015). A comparison of the degree of implementation of marine biodiversity indicators by European countries in relation to the Marine Strategy Framework Directive (MSFD). J. Mar. Biol. Associat. U K. 95, 1519–1531.
Inniss, L., Simcock, A., Ajawin, A. Y., Alcala, A. C., Bernal, P., Calumpong, H. P., et al. (2016). The First Global Integrated Marine Assessment World Ocean Assessment I. New York, NY: United Nations General Assembly, 1751.
Kazanidis, G., Orejas, C., Borja, A., Kenchington, E., Henry, L.-A., Callery, O., et al. (2020). Assessing the environmental status of selected North Atlantic deep-sea ecosystems. Ecol. Indicat. 119:106624. doi: 10.1016/j.ecolind.2020.106624
Kirkfeldt, T. S. (2019). An ocean of concepts: Why choosing between ecosystem-based management, ecosystem-based approach and ecosystem approach makes a difference. Mar. Policy 106:103541. doi: 10.1016/j.marpol.2019.103541
Korpinen, S., Klanènik, K., Peterlin, M., Nurmi, M., Laamanen, L., Zupanèiè, G., et al. (2019). “Multiple pressures and their combined effects in Europe’s seas,” in ETC/ICM Technical Report 4/2019, (Copenhagen: European Environment Agency), 164.
Kuenen, J., Hendriks, C., Visschedijk, A., Smit, T., and Vermeulen, J. (2018). “Mercury in Europe’s environment. A priority for European and global action,” in European Environment Agency Report, Vol. 11(Copenhagen: European Environment Agency), 72.
Langhans, S. D., Reichert, P., and Schuwirth, N. (2014). The method matters: A guide for indicator aggregation in ecological assessments. Ecol. Indicat. 45, 494–507. doi: 10.1016/j.ecolind.2014.05.014
Link, J. S., and Browman, H. I. (2014). Integrating what? Levels of marine ecosystem-based assessment and management. ICES J. Mar. Sci. 71, 1170–1173. doi: 10.1093/icesjms/fsu026
Mifsud, R., Dimech, M., and Schembri, P. J. (2013). Marine litter from circalittoral and deeper bottoms off the Maltese islands (Central Mediterranean). Mediterr. Mar. Sci. 14, 298–308. doi: 10.12681/mms.413
Moss, B. (2008). The Water Framework Directive: Total environment or political compromise? Sci. Total Environ. 400, 32–41. doi: 10.1016/j.scitotenv.2008.04.029
Moss, B., Stephen, D., Alvarez, C., Becares, E., Bund, W. V. D., Collings, S. E., et al. (2003). The determination of ecological status in shallow lakes — a tested system (ECOFRAME) for implementation of the European Water Framework Directive. Aquat. Conserv. Mar. Freshw. Ecosyst. 13, 507–549. doi: 10.1002/aqc.592
Murillas-Maza, A., Uyarra, M. C., Papadopoulou, K. N., Smith, C. J., Gorjanc, S., Klancnik, K., et al. (2020). Programmes of measures of the marine strategy framework directive: Are they contributing to achieving good environmental status in the Mediterranean? Mar. Pollut. Bull. 161:111715. doi: 10.1016/j.marpolbul.2020.111715
Nemati, H., Shokri, M. R., Ramezanpour, Z., Ebrahimi Pour, G. H., Muxika, I., and Borja, Á (2017). Using multiple indicators to assess the environmental status in impacted and non-impacted bathing waters in the Iranian Caspian Sea. Ecol. Indicat. 82, 175–182. doi: 10.1016/j.ecolind.2017.06.054
O’Higgins, T. G., Lago, M., and DeWitt, T. H. (eds) (2020). Ecosystem-Based Management, Ecosystem Services and Aquatic Biodiversity. Switzerland: Springer, 567.
Ojaveer, H., and Eero, M. (2011). Methodological Challenges in Assessing the Environmental Status of a Marine Ecosystem: Case Study of the Baltic Sea. PLoS One 6:e19231. doi: 10.1371/journal.pone.0019231
Palialexis, A., Tornero, V., Barbone, E., Gonzalez, D., Hanke, G., Cardoso, A. C., et al. (2014). “In-Depth Assessment of the EU Member States’ Submissions for the Marine Strategy Framework Directive under articles 8, 9 and 10,” in JRC Scientific and Policy Reports, (Belgium: European Commission), 153.
Pavlidou, A., Simboura, N., K, Pagou, Assimakopoulou, G., Gerakaris, V., Hatzianestis, I., et al. (2019). Using a holistic ecosystem-integrated approach to assess the environmental status of Saronikos Gulf, Eastern Mediterranean. Ecol. Indicat. 96, 336–350. doi: 10.1016/j.ecolind.2018.09.007
Personnic, S., Boudouresque, C. F., Astruch, P., Ballesteros, E., Blouet, S., Bellan-Santini, D., et al. (2014). An Ecosystem-Based Approach to Assess the Status of a Mediterranean Ecosystem, the Posidonia oceanica Seagrass Meadow. PLoS One 9:e98994. doi: 10.1371/journal.pone.0098994
Poikane, S., Salas Herrero, F., Kelly, M. G., Borja, A., Birk, S., and van de Bund, W. (2020). European aquatic ecological assessment methods: A critical review of their sensitivity to key pressures. Sci. Total Environ. 740:140075. doi: 10.1016/j.scitotenv.2020.140075
Probst, W. N., and Lynam, C. P. (2016). Integrated assessment results depend on aggregation method and framework structure – A case study within the European Marine Strategy Framework Directive. Ecol. Indicat. 61, 871–881. doi: 10.1016/j.ecolind.2015.10.040
Queiros, A. M., Strong, J. A., Mazik, K., Carstensen, J., Bruun, J., Somerfield, P. J., et al. (2016). An objective framework to test the quality of candidate indicators of good environmental status. Front. Mar. Sci. 3:73. doi: 10.3389/fmars.2016.00073
Raicevich, S., Battaglia, P., Fortibuoni, T., Romeo, T., Giovanardi, O., and Andaloro, F. (2017). Critical Inconsistencies in Early Implementations of the Marine Strategy Framework Directive and Common Fisheries Policy Objectives Hamper Policy Synergies in Fostering the Sustainable Exploitation of Mediterranean Fisheries Resources. Front. Mar. Sci. 4:316. doi: 10.3389/fmars.2017.00316
Reker, J., Murray, C., Royo Gelabert, E., Abhold, K., Korpinen, S., Peterlin, M., et al. (2019). Marine Messages II. Navigating the course towards clean, healthy and productive seas through implementation of an ecosystem-based approach. Copenhagen: European Environment Agency, 82.
Romeo, T., D’Alessandro, M., Esposito, V., Scotti, G., Berto, D., Formalewicz, M., et al. (2015). Environmental quality assessment of Grand Harbour (Valletta, Maltese Islands): a case study of a busy harbour in the Central Mediterranean Sea. Environ. Monitori. Assess. 187:747.
Rossberg, A. G., Uusitalo, L., Berg, T., Zaiko, A., Chenuil, A., Uyarra, M. C., et al. (2017). Quantitative criteria for choosing targets and indicators for sustainable use of ecosystems. Ecol. Indicat. 72, 215–224. doi: 10.1016/j.ecolind.2016.08.005
Shin, Y.-J., Shannon, L. J., Bundy, A., Coll, M., Aydin, K., Bez, N., et al. (2010). Using indicators for evaluating, comparing, and communicating the ecological status of exploited marine ecosystems. 2. Setting the scene. ICES J. Mar. Sci. 67, 692–716. doi: 10.1093/icesjms/fsp294
Simboura, N., and Zenetos, A. (2002). Benthic indicators to use in ecological quality classification of Mediterranean soft bottom marine ecosystems, including a new biotic index. Mediterranean Mar. Sci. 3/2, 77–111. doi: 10.12681/mms.249
Teixeira, H., Berg, T., Uusitalo, L., Fürhaupter, K., Heiskanen, A.-S., Mazik, K., et al. (2016). A Catalogue of marine biodiversity indicators. Front. Mar. Sci. 3:207. doi: 10.3389/fmars.2016.00207
Thibaut, T., Blanfuné, A., Boudouresque, C. F., Personnic, S., Ruitton, S., Ballesteros, E., et al. (2017). An ecosystem-based approach to assess the status of Mediterranean algae-dominated shallow rocky reefs. Mar. Pollut. Bull. 117, 311–329. doi: 10.1016/j.marpolbul.2017.01.029
Uusitalo, L., Blanchet, H., Andersen, J., Beauchard, O., Berg, T., Bianchelli, S., et al. (2016). Indicator-based assessment of marine biological diversity – lessons from 10 case studies across the European Seas. Front. Mar. Sci. 3, doi: 10.3389/fmars.2016.00159
Višnjevec, A. M., Kocman, D., and Horvat, M. (2014). Human mercury exposure and effects in Europe. Environ. Toxicol. Chem. 33, 1259–1270. doi: 10.1002/etc.2482
Keywords: marine strategy framework directive, ecosystem-based approach, NEAT, ocean status, integrative assessment
Citation: Borja A, Menchaca I, Garmendia JM, Franco J, Larreta J, Sagarminaga Y, Schembri Y, González R, Antón R, Micallef T, Camilleri S, Solaun O, Uriarte A and Uyarra MC (2021) Big Insights From a Small Country: The Added Value of Integrated Assessment in the Marine Environmental Status Evaluation of Malta. Front. Mar. Sci. 8:638232. doi: 10.3389/fmars.2021.638232
Received: 05 December 2020; Accepted: 22 March 2021;
Published: 13 April 2021.
Edited by:
Heliana Teixeira, University of Aveiro, PortugalReviewed by:
José Lino Vieira De Oliveira Costa, University of Lisbon, PortugalThierry Thibaut, Aix-Marseille Université, France
Copyright © 2021 Borja, Menchaca, Garmendia, Franco, Larreta, Sagarminaga, Schembri, González, Antón, Micallef, Camilleri, Solaun, Uriarte and Uyarra. This is an open-access article distributed under the terms of the Creative Commons Attribution License (CC BY). The use, distribution or reproduction in other forums is permitted, provided the original author(s) and the copyright owner(s) are credited and that the original publication in this journal is cited, in accordance with accepted academic practice. No use, distribution or reproduction is permitted which does not comply with these terms.
*Correspondence: Angel Borja, YWJvcmphQGF6dGkuZXM=