 Tiffany Monfort1,2†
 Adrien Cheminée1,3*†
 Olivier Bianchimani1
 Pierre Drap4
 Arthur Puzenat1
 Thierry Thibaut2
- 1Septentrion Environnement, Marseille, France
- 2IRD, CNRS, Aix Marseille Univ., Université de Toulon, CNRS, IRD, MIO UM 110, Marseille, France
- 3Faculté des Sciences, Aix Marseille Université, Marseille, France
- 4CNRS, Aix-Marseille Univ., Université de Toulon, LIS UMR 7020, Marseille, France
In the Mediterranean Sea, shallow rocky reefs and the associated three-dimensional (3D) structure support rich and abundant communities; they are therefore of functional importance, in particular for the renewal of fish stocks. However, these habitats and their functions are likely to be altered by anthropogenic pressures inducing habitat transformations. It is therefore necessary to assess their 3D structure, their transformations and relationship to communities, especially for management and conservation purposes. In this article we aimed (i) to compare two methods that quantify the metrics of the 3D structure (rugosity) of shallow rocky reefs (chain-and-tape method and photogrammetry), and (ii) to quantify the possible links between this habitat structure and the fish assemblages. We found that photogrammetry and the chain-and-tape method yielded a similar estimate of rugosity, but photogrammetry was the most efficient method in terms of measurement quality and time (when considering in-water acquisition). This method also displayed the best repeatability. The 3D habitat descriptors (mean surface rugosity, variation of surface rugosity, and depth) differed significantly between the studied sites and were therefore included as covariables. Total fish abundance and species richness increased with higher mean surface rugosity. In addition, the composition of fish assemblages was significantly influenced by surface rugosity, although this effect was modulated by depth. When focusing on specific taxa, neither density patterns nor size class distributions displayed clear patterns in relation to rugosity metrics. However, this study demonstrated that spatial variability of teleost fish assemblages can be explained by habitat rugosity which probably increases the number of shelters and food resources, and therefore improves chances of survival. In addition, our study has shown that photogrammetry is an appropriate method to assess 3D structure metrics in a temperate rocky reef.
Introduction
The Mediterranean Basin is described as a hotspot of diversity for its various fish species and its specific marine ecosystems (Bianchi and Morri, 2000; Cuttelod et al., 2009). The infralittoral (i.e., subtidal) rocky reef provides various habitats for different species such as teleost fishes. This zone is important because of the strong benthic primary production provided by macrophytes, and because of the associated secondary production (Harmelin, 1987). Many coastal species at different life stages coexist making the subtidal rocky reef an ideal area for fish species. However, climate change and the transformation of habitat due to coastal urbanization are anthropogenic pressures that can impact the 3D structure of these rocky habitats (Thiriet et al., 2014). Therefore it may also affect endemic species (Airoldi et al., 2008; Coll et al., 2012).
The structure of these habitats is defined as the quantity, the composition and the three-dimensional (3D) arrangement of the physical components (biotic and abiotic) at a specific location (Cheminée et al., 2017b; Cuadros et al., 2019). It is constituted of complexity which is the absolute abundance of the individual structural components (Beck, 2000; Byrne, 2007; Bell et al., 2012; Cuadros et al., 2019), and of the heterogeneity of their spatial settings (August, 1983). In order to understand the effects that habitat complexity could have on teleost fish assemblages, it is necessary to define and use metrics (also known as environmental descriptors) of complexity. One widely employed descriptor is rugosity. It can be interpreted as a category of the structural complexity of underwater habitats (Friedman et al., 2012; Burns et al., 2015; Storlazzi et al., 2016; Calders et al., 2020). It has been observed that rugosity is an important ecological parameter for shaping fish and other benthic assemblages (Luckhurst and Luckhurst, 1978; Friedman et al., 2012; Storlazzi et al., 2016). It has been reported that rugosity plays a role in interactions between species such as predation or competition (Harborne et al., 2012).
In the history of marine ecology field work, the chain-and-tape method has been commonly used to quantitatively estimate rugosity (Risk, 1972; Luckhurst and Luckhurst, 1978; McCormick, 1994; Hill and Wilkinson, 2004; Storlazzi et al., 2016). More recent methods exist such as the use of photogrammetry: an approach that requires 2D images to create a 3D model of the environment and can therefore estimate precise measurements (Drap et al., 2013; Bryson et al., 2017; Calders et al., 2020). These methods are mainly used to characterize tropical coral reefs. However little is known regarding their comparative efficiency and precision in temperate waters (Ventura et al., 2020).
Environmental descriptors are known to influence community metrics (Hewitt et al., 2005; Harborne et al., 2012; Komyakova et al., 2013; Figueira et al., 2015). It has been shown that fish abundance is greatly influenced by the quantity and quality of the structure of the coral reef habitat (Messmer et al., 2011; Harborne et al., 2012; Kovalenko et al., 2012). This trend has often been described in tropical waters (Luckhurst and Luckhurst, 1978; Gratwicke and Speight, 2005; Graham and Nash, 2013) but rarely in temperate environments (Charton and Ruzafa, 1998; Meager et al., 2011; Rees et al., 2014). The possible relationships between the 3D structure of the Mediterranean rocky reefs and metrics of nektobenthic species have been little studied, while understanding the role of habitat complexity is to allow better preservation of biodiversity and the function of the ecosystem (Kovalenko et al., 2012; Rees et al., 2018; Sinopoli et al., 2018). To characterize habitat complexity, a precise method is needed in order to adequately comprehend the interactions between species and the environment.
The present study aimed to assess how substrate rugosity may affect fish community on temperate reefs, after previously assessing how good rugosity metrics are derived from photogrammetry as a proxy of the classic chain-and-tape rugosity measurement. Indeed, such comparison has been done in tropical environments (Young et al., 2017) but remains poorly explored in temperate environments of the Mediterranean Sea. However, some specific cases have been studied in this region, such as biogenic reefs bio-constructed by Sabellaria alveolata (Ventura et al., 2020). First, we have studied which method (chain-and-tape or photogrammetry-based) can best measure the rugosity metric of Mediterranean rocky reefs. More precisely, it aimed to determine whether the estimation of the mean rugosity of a site and the in situ acquisition time (efficiency) are different depending on the method used, the habitat category, and the site studied. It also estimated which method provides a more precise measurement (repeatability). Moreover, this study proposed to verify whether there is a relationship between the complexity of rocky reefs and fish assemblages. It attempted to identify the effects of descriptors of the 3D structure (mean rugosity, variation of the rugosity) on the descriptors of the teleost assemblages linked to the substrate (i.e., benthic taxa).
We predicted that photogrammetry would be the most robust, efficient and should be easier to repeat than the chain-and-tape method. Furthermore, we expected that one or several metrics describing the teleost assemblage would be influenced by habitat rugosity. More specifically, we expected that rocky reefs with higher rugosity mean and/or higher variation of rugosity would host richer, more abundant, and more diversified fish assemblages. Two datasets from the same study area have been analyzed: one dedicated to the method comparison and the other to the understanding of the relation between 3D structure and teleost populations.
Materials and Methods
The study was conducted in the north-western Mediterranean Sea, at the Calanques National Park (western Provence, France) where two datasets were sampled in the Riou Archipelago (Figure 1) during spring 2017 and 2018. The 2017 dataset was used to compare the two methods (chain-and-tape method and photogrammetry), while the 2018 dataset was used to understand the influence of substrate complexity on teleost assemblages.
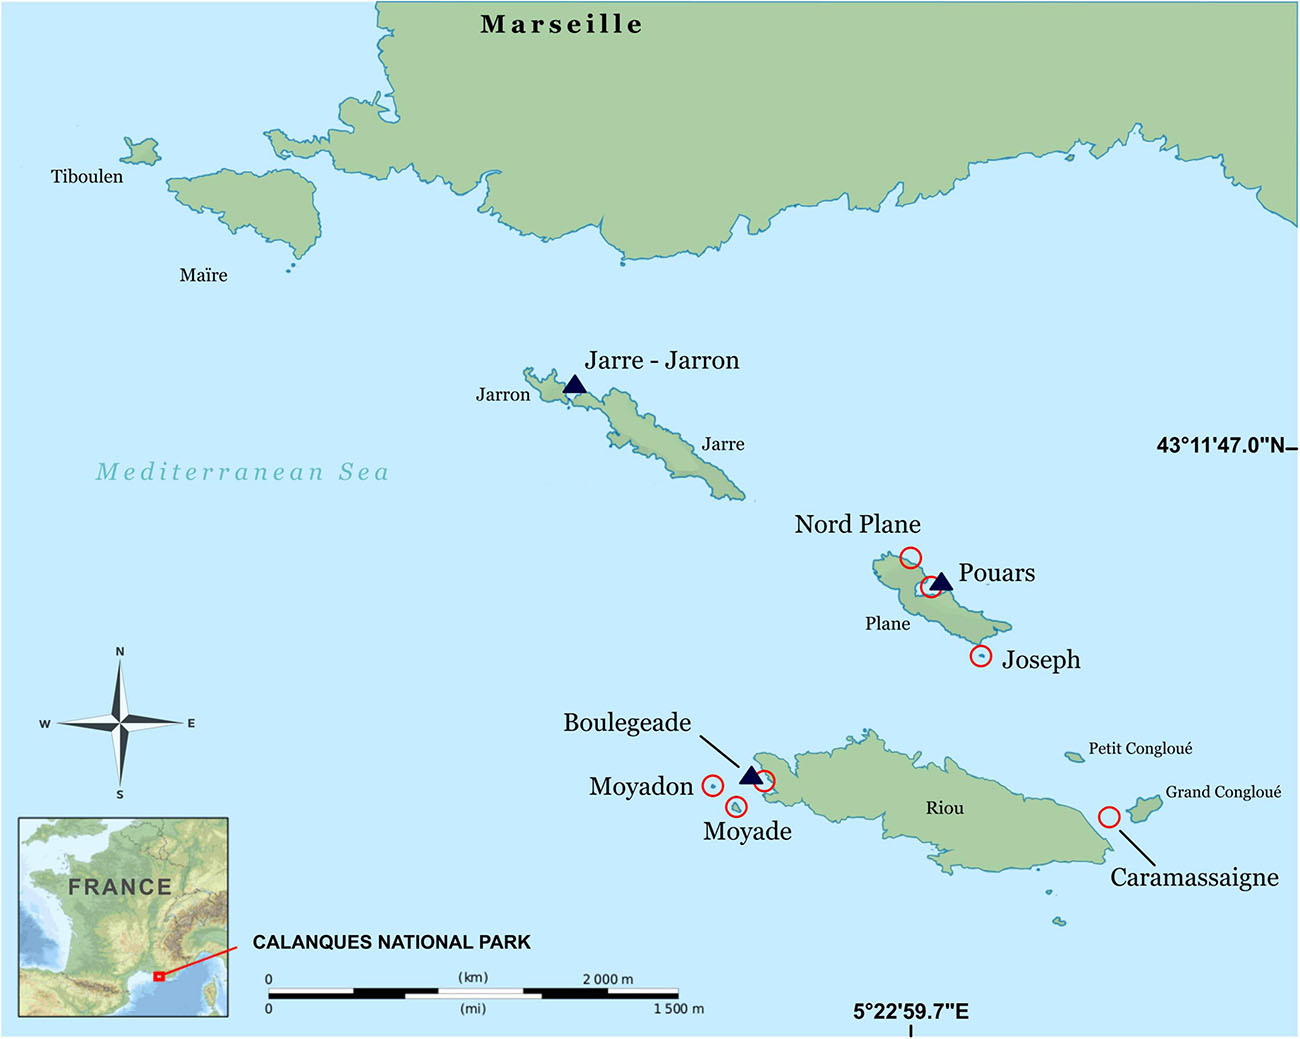
Figure 1. Study area located in the Calanques National Park (France), where sites were sampled in 2017 (dark blue triangles) and in 2018 (red circles). This map was modified from an online source, i.e. from OpenStreetMap data, available on Wikipedia as a public domain image: https://commons.wikimedia.org/wiki/File:Archipel_de_Riou_topographic_map-fr.svg.
Methods Comparison
Background Definitions
Efficiency in our study is defined as the time (in seconds) spent underwater acquiring data, while precision is defined as “the closeness of agreement between results of independent tests obtained under stipulated conditions (repeatability and reproducibility)” (Arnal, 2017). Repeatability is the part of variability caused by the measuring device in the measurement system studied. Reproducibility is the part of variability induced by the differences between operators. In this study, a single observer managed the data acquisition. For this reason, repeatability was the only concept considered.
Sampling Design and Data Collection
A preliminary sampling design was used to estimate the number of quadrats needed to obtain a reliable measurement of rugosity (sampling effort). Two other sampling designs were used to compare the chain-and-tape method with photogrammetry. The first design evaluated i) the mean rugosity and ii) the efficiency of each method, while the second design was used to study their repeatability. In the first design, sampling effort was evaluated using the cumulative mean rugosity. This procedure was conducted to determine the minimum sampling effort needed to estimate the mean rugosity with both methods. The minimum sampling effort was reached when the cumulative mean rugosity was stabilized. This response variable was studied at one site and in one habitat (at Jarre-Jarron, Infralittoral Rock with Photophilic Algae (IRPA): block facies). In the second design, the responses of mean rugosity and efficiency (time in seconds) were tested as a function of two fixed factors (method: chain-and-tape vs. photogrammetry; and habitat: continuous rocks vs. block fields) and a random factor (site, with 3 levels: Boulegeade, Jarre-Jarron, and Pouars; Figure 1). In the third design, repeatability response was tested according to the fixed factor method (same levels: chain-and-tape and photogrammetry). A single site in a single habitat was studied for this design (Pouars, IRPA: block facies).
For all designs, quadrats (3 m × 3 m) were used as the measurement unit. The cumulative mean rugosity was calculated with the mean rugosity of each quadrat added one by one into the calculation of the mean in a delimited area. The quadrats were randomly arranged and placed so that the cumulative mean rugosity was representative of the study area. The minimum sampling effort was reached when the cumulative mean rugosity was stabilized. The mean linear rugosity in each quadrat was estimated with four segments (2 bisectors and 2 medians). The first design was composed of 12 different quadrats (for each habitat-site combinations), whereas the rugosity was estimated by measuring the same quadrat 10 times in a row for each method when precision was evaluated.
When the chain-and-tape method was used to estimate linear rugosity, a diver positioned the chain (link size: 30 mm) along one of the four segments (from A point to A’ point, as in Storlazzi et al., 2016; Supplementary Figures 1A,B). The same area was created virtually using photogrammetry. Specifically, the diver took pictures zigzagging at a constant distance (1 m) above the quadrat (Supplementary Figure 1B). For each quadrat, an average of 100 pictures were taken to allow satisfactory reconstruction. The same camera handled by the same operator (OB) was used during the entire study: a NIKON D700 protected inside a Nauticam housing, with 14 mm lens and two Ikelite flashes DS 160.
All the photographs were oriented with the Photoscan software (currently Metashape) from the company Agisoft (Royer et al., 2018). A metal square of 50 cm × 50 cm has been placed on the edge of the area to be studied. It was equipped with a buoyancy target for vertical referencing and six coded targets whose distances have been calibrated a priori.
The bundle adjustment performed by the photogrammetry software took into account the scaling constraints on the coded targets and offered an accuracy of about 1 mm considering the readable signal on the coded targets (Drap et al., 2015). The vertical referencing was obtained a posteriori by introducing the coded target read on the float. In a more recent version of the equipment used, a spirit level has been placed on the bracket as well as three adjustable feet with screws allowing the horizontal adjustment of the reference bracket before the shots. Under these conditions, the coordinates of the coded targets were directly expressed in a vertical reference frame and used as a control point by the bundle adjustment. This had no influence on the overall accuracy obtained. If we took into account on the one hand the short shooting distance and thus the large scale of the photographs and on the other hand the high resolution of the “full frame” sensors of the DSLR (Digital Single Lens Reflex) cameras used, the GSD of the photographs was much smaller than a millimeter (The GSD for Ground Sample Distance is the distance on the ground between two consecutive pixel centers). Such specific parameters (i.e., GSD and RMS error) used to build the quadrat models are compiled in the Table 1. Once the orientation of the photographs and the reference systems were validated, a 3D point cloud uniformly distributed on the surface studied was calculated. 3D models were generated using Photoscan software (Royer et al., 2018). In order to obtain a uniformly distributed point cloud with a defined average distance between points the Metashape “Filter Dense Cloud” tool (Tools Dense Cloud) was used. This tool removes or interpolates the necessary points with the colorimetric information to arrive to a dense cloud of the desired spacing. A mesh was then built in Metashape based upon this dense cloud and this was used to assess rugosity. In order to have comparable results with the in situ measurements, the average density of the 3D point cloud was adjusted to the chain-link used for the comparison of the methods (3 cm) (e.g., Supplementary Table 1). The spacing of vertices in the resulting mesh was verified to be 3 cm by using a small software (coded in JAVA) that analyze the meshes. It produced elementary statistics reliable on the length of the arcs obtained after meshing. It allowed us to validate the two meshes produced and to keep for the production the one generated with Agisoft. This enabled the treatment with the software. It therefore allowed us to verify the spacing of vertices to be 3 cm. We draw reader’s attention on the fact that it was necessary to develop a small analysis tool of the meshes because it was not available neither in Agisoft nor in Meshlab.

Table 1. GSD and RMS error of the quadrat models.
Finally, it should be noted that the flexibility of the photogrammetric method enabled us to obtain results comparable in quality to those obtained by the chain method. The adjustment of the altitude of the photographs and thus of their GSD, the position of the cameras during the shooting determined the resulting 3D model. For example, the use of photographs with vertical axes only induced a 3D model very close to a DTM or an elevation grid which corresponded to the results obtained with the chain. On the other hand, it would be possible to go further by multiplying the oblique or even quasi-horizontal shots and to integrate into the terrain model the overhangs or even the cavities inaccessible with the chain method.
Once the 3D model was obtained, CloudCompare software was used to perform measurements (CloudCompare, 2018). The same segments were drawn on the model providing thereby the value of the mean rugosity.
Data Treatment and Statistical Analysis
The mean rugosity and method efficiency data were analyzed by performing PERMutational univariate Analyses Of VAriance (PERMANOVAs) (Anderson et al., 2008), including terms and all interactions. The resemblance matrices were calculated from the initial data matrix containing, for each sample, the response variable (rugosity or time). Analyses were based on Euclidean distances and p-values were calculated by 999 residual permutations under a reduced model. When the number of permutations was less than 200, Monte Carlo p-values were used (Clarke et al., 2014). The PERMDISP procedure was conducted when it was when necessary to see whether significant differences between levels were due to differences in terms of mean or in terms of dispersion of the data. In addition, this procedure was also used to quantify the proportion of variation of each method, and therefore to determine if they were repeatable. Smaller variation indicates higher repeatability (the method is more precise). Coefficient of variation (CV) was also taken into account in order to measure the relative dispersion.
Teleost Assemblages
Ethics Statement
The observational protocol was submitted to the regional authority Direction inter-régionale de la mer Méditerranée (the French administration in charge of Maritime Affairs). No special permit was required since no extractive sampling or animal manipulations were conducted (only visual censuses in natural habitats) and since the surveyed locations were not privately owned.
Sampling Design and Data Collection
Our experimental design was built in order to address the following hypothesis: higher rugosity or variation of rugosity may induce richer, more abundant and more diversified fish assemblages. Additionally, the assemblage of spatial categories (i.e., relative abundances by fish categories as defined by Harmelin (Harmelin, 1987; Table 2 and Supplementary Figure 2) was expected to vary according to substrate rugosity and depth, which are known to shape e.g., food and refuges availability and therefore influence the interactions among taxa (see Introduction for previously cited references). For the same reasons, the size-class distributions of given taxa were expected to be somehow correlated with rugosity, since bottoms with high rugosity may e.g., provide more refuges and be therefore of better “habitat quality”—sensu Dahlgren and Eggleston (2000)—for juvenile individual.
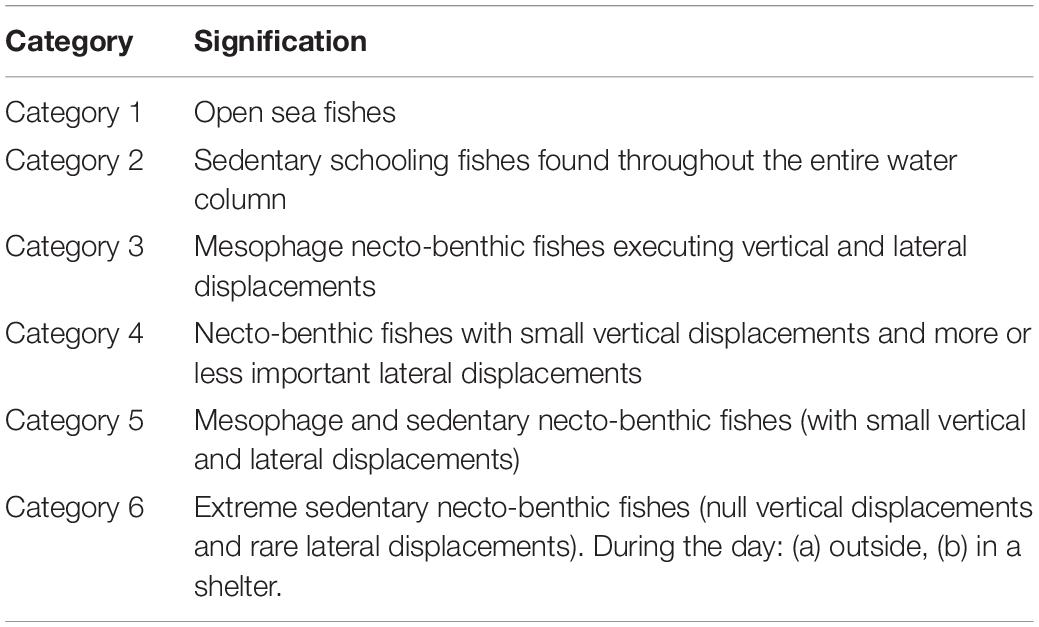
Table 2. Spatial category assemblage types as described by Harmelin (1987).
In order to test these assumptions, teleost assemblages were inventoried and described according to a predefined list of selected species (nektobenthic and cryptobenthic fishes) (Table 3), i.e., species having a way of life related to the bedrock of the rocky infralittoral, therefore likely to be influenced by 3D structuration. Response variables describing teleost assemblages were: (i) total abundance (including all species), (ii) species richness, (iii) Shannon index, (iv) species assemblage (species composition and relative abundances), (v) assemblage of spatial categories. In addition, for a subset of dominant species (see “Results”), we studied: (vi) specific abundance, (vii) size (TL: total length in mm) of each species, and (viii) abundance by size class (small, medium, large). The data were collected using Underwater Visual Census (UVC) (Harmelin-Vivien et al., 1985; Friedlander and DeMartini, 2002; Sala et al., 2012). The size classes were standardized using the work of Louisy (2002). Thresholds of each species size class were defined according to maximum sizes referenced in this work. The predictor variables were: (i) mean surface rugosity, (ii) variation in surface rugosity, (iii) depth, and (iv) site. Photogrammetry was the method used to measure these environmental descriptors.
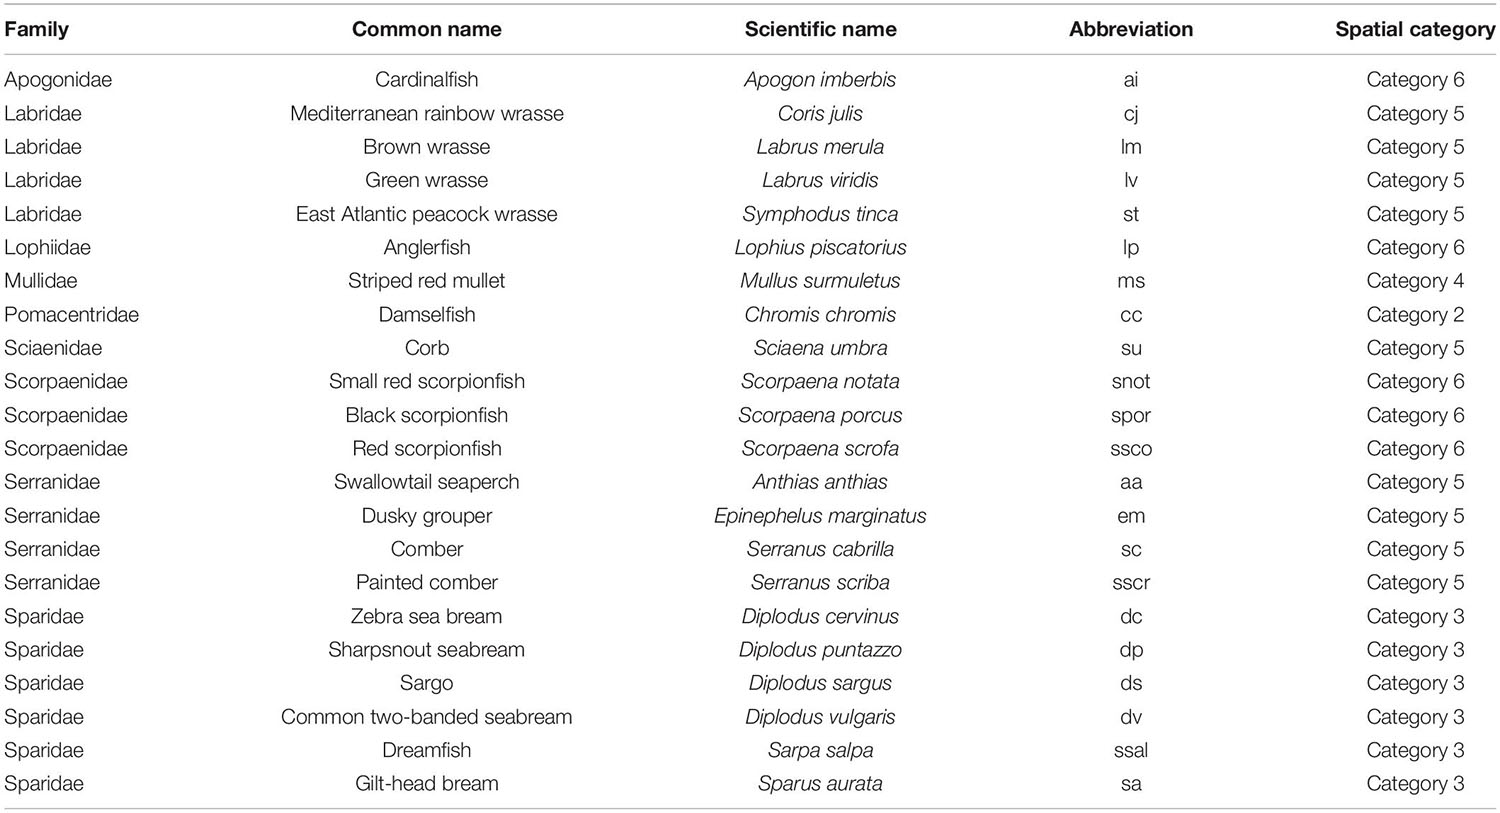
Table 3. Teleost fish assemblage studied: (i) species (ii) spatial category (see Table 1 and Supplementary Figure 2), as described by Harmelin (1987).
The relationship between teleost assemblages and substrate rugosity and other factors was investigated in a single habitat, i.e., continuous infralittoral rocky reef (IRPA), using transects (25 m × 5 m) as the unit of measure. 30 transects were randomly distributed among 7 different sites around Riou and Plane islands (fixed factor; Figure 1), with a minimum of 3 transects in each site.
The initial transects were divided into four smaller transects (6.25 m × 5 m) to estimate the surface rugosity for each of them using the same photogrammetric method as mentioned previously (Supplementary Figure 1C). Subsequently, mean surface rugosity was calculated for the entire initial transect using the mean surface rugosity of these small transects. The variation in surface rugosity was evaluated the same way.
Data Treatment and Statistical Analyses
First, the variability of environmental variables was tested against site factor (fixed). Three transects (20, 22, and 23) were deleted from the database due to environmental conditions (high turbidity/low visibility) as the creation of 3D models was unrealizable. Only 6 sites and 27 transects were taken into account because of this operation. It was observed that environmental variables were not constant between sites (see section “Results”). Consequently, it was justified, in a second analysis, to perceive these environmental descriptors as covariates of the site factor, in order to study the part of environmental variable effects on teleost descriptors.
The analysis model included 3 covariates (mean surface rugosity, variation in surface rugosity and depth: which are continuous variables) and the site factor (fixed factor with 6 levels). When the size of each species was studied, individuals (fishes) were used as unit of replication instead of transects.
PERMANOVAs were used to compare teleost descriptors between different factor levels, using the same procedure as in the first analysis (method comparisons). However, interactions between the factors were not taken into account. Univariate data were not transformed, and a resemblance matrix was created using Euclidean distance. When multivariate data were involved, modified Gower was used to produce the resemblance matrix after transformation of the data (log base2; Anderson et al., 2008). All three covariates produced a significant response on univariate teleost descriptors when PERMANOVAs were executed (see section “Results”). Therefore, residuals were plotted and calculated using linear model means (in agreement with the establishment of PERMANOVAs).
Since ecological data give rise to inherent variability, significance was considered—for all designs (including in the first analysis to compare methods)—when p-value < 0.1. Each data treatment was carried out using R 3.1.3 (R Core Team, 2017) and PRIMER 6/PERMANOVA + (Clarke and Gorley, 2006; Anderson et al., 2008) software.
Results
Methods Comparison
Sampling Effort
Regardless of the method, the cumulative mean rugosity stabilized around 12 quadrats in the rocky reef habitat (field block facies) (Figure 2). It seems that both methods required the same sampling effort. In addition, the two methods obtained an equivalent value of cumulative mean rugosity (cumulative = 1.32).
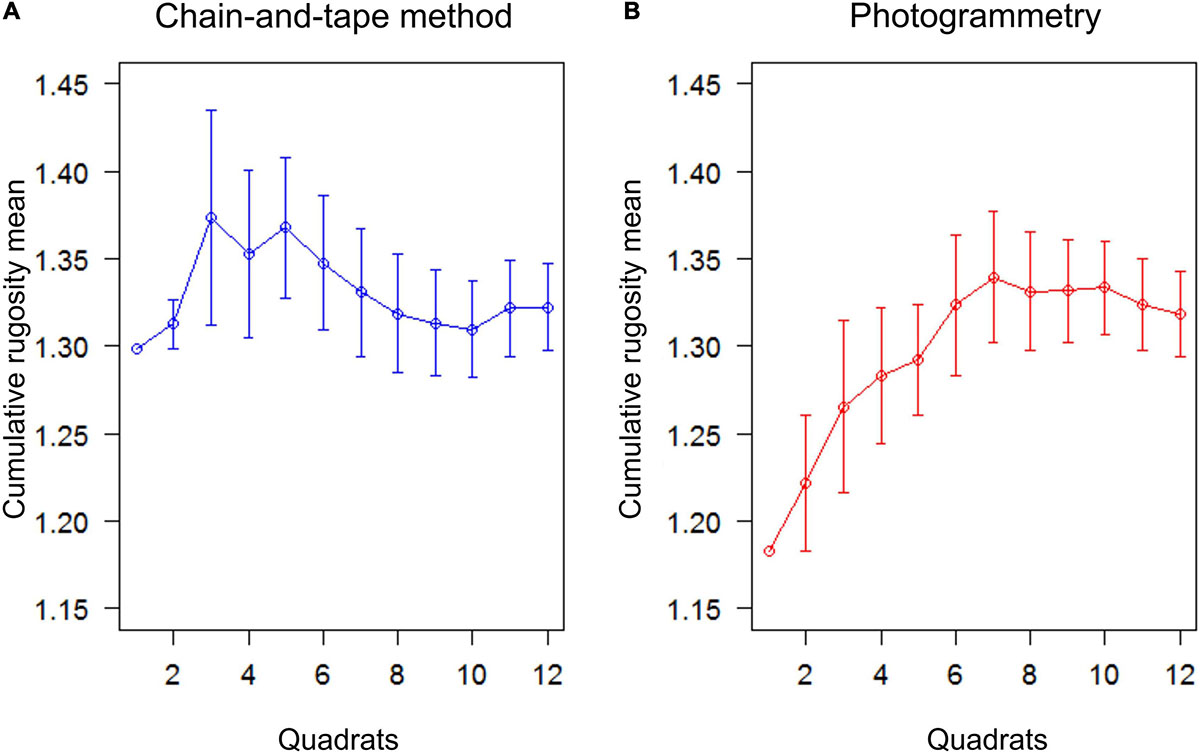
Figure 2. Cumulative rugosity mean obtained according to an increasing number of replicates (quadrats), using alternatively (A) the chain-and-tape method or (B) the photogrammetry method; the sampling effort required for each method is deduced as the number of quadrats that is necessary to obtain a relative stable measurement of linear rugosity (i.e., when the plot reaches stabilization).
Rugosity Estimation and Methods Efficiency
Habitat type had a significant effect on rugosity: regardless of site and method used, block field habitat consistently exhibited higher rugosity values than continuous rock habitat. This difference was greater at some sites, resulting in a significant habitat × site interaction (PERMANOVA, P = 0.001, Figure 3 and Table 4). The habitat × method interaction was also significant (PERMANOVA, P = 0.024, Figure 3 and Table 4). In a continuous rocky habitat, the difference between photogrammetry and the chain-and-tape method, although not significant, was closer to the significance levels (PERMANOVA, pair test, P = 0.153) than in block field habitat (PERMANOVA, pair test, P = 0.977, Figure 3). In addition, the method had no effect on the dispersion of the rugosity measurements (PERMDISP, P = 0.504). On the other hand, the habitat had a significant effect on this dispersion (PERMDISP, P = 0.001): the dispersion of rugosity measurements was greater in block field habitat (from 1.10 to 1.50) than in continuous rocky habitat (1.02–1.15, Figure 3 and Table 4). The acquisition time was longer using the chain-and-tape method than with photogrammetry (Figure 3 and Table 5). It was also more prominent in block field habitat than in continuous rock, regardless of the method used.
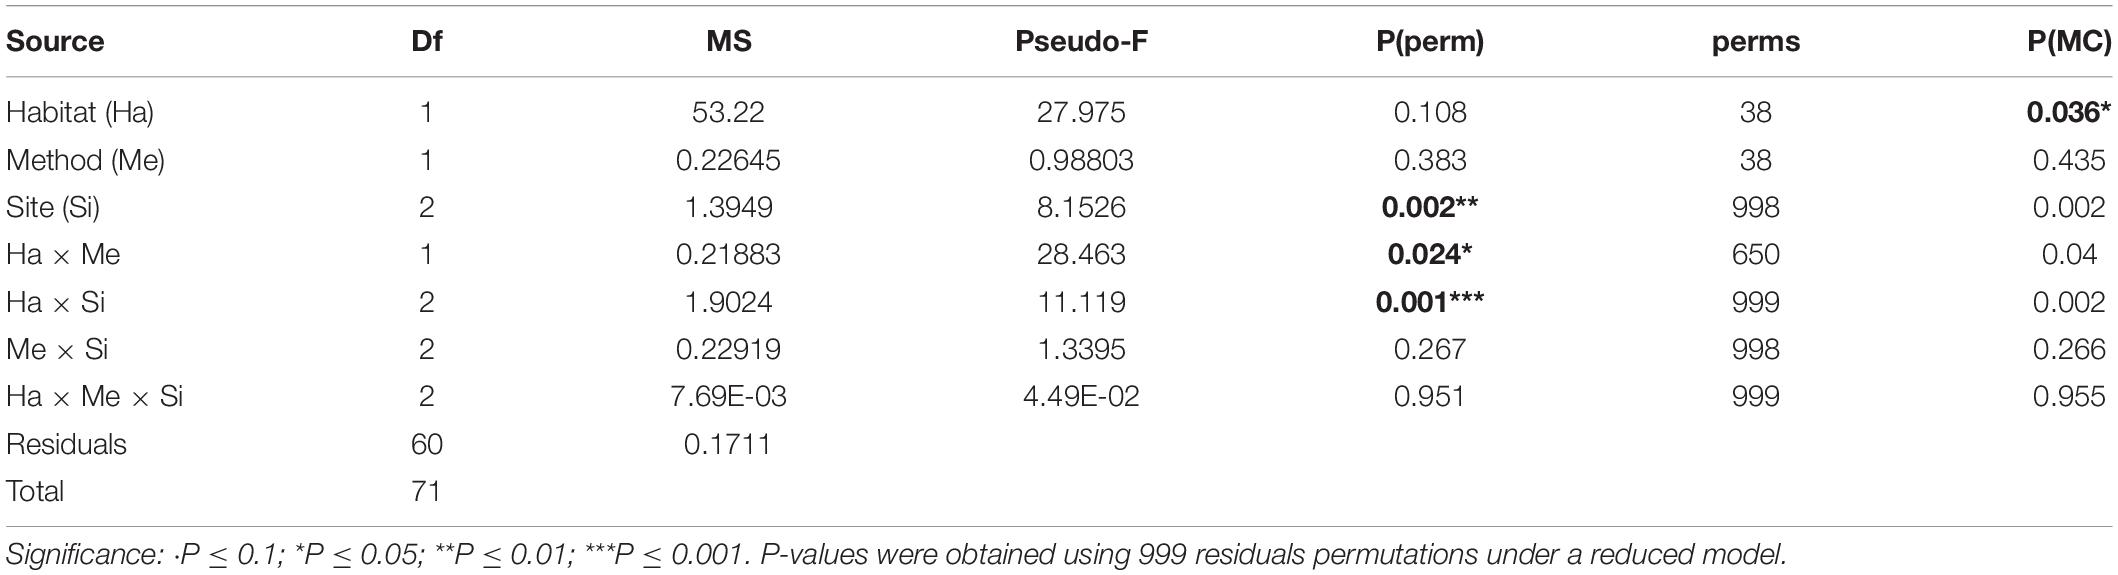
Table 4. PERMANOVA table of results for rugosity; Variation source, degree of freedom (df), mean squares (MS), F statistic (Pseudo-F), P-value obtained by permutations [P(perm)] or using the Monte-Carlo test [P(MC)] and numbers of permutations (perms).
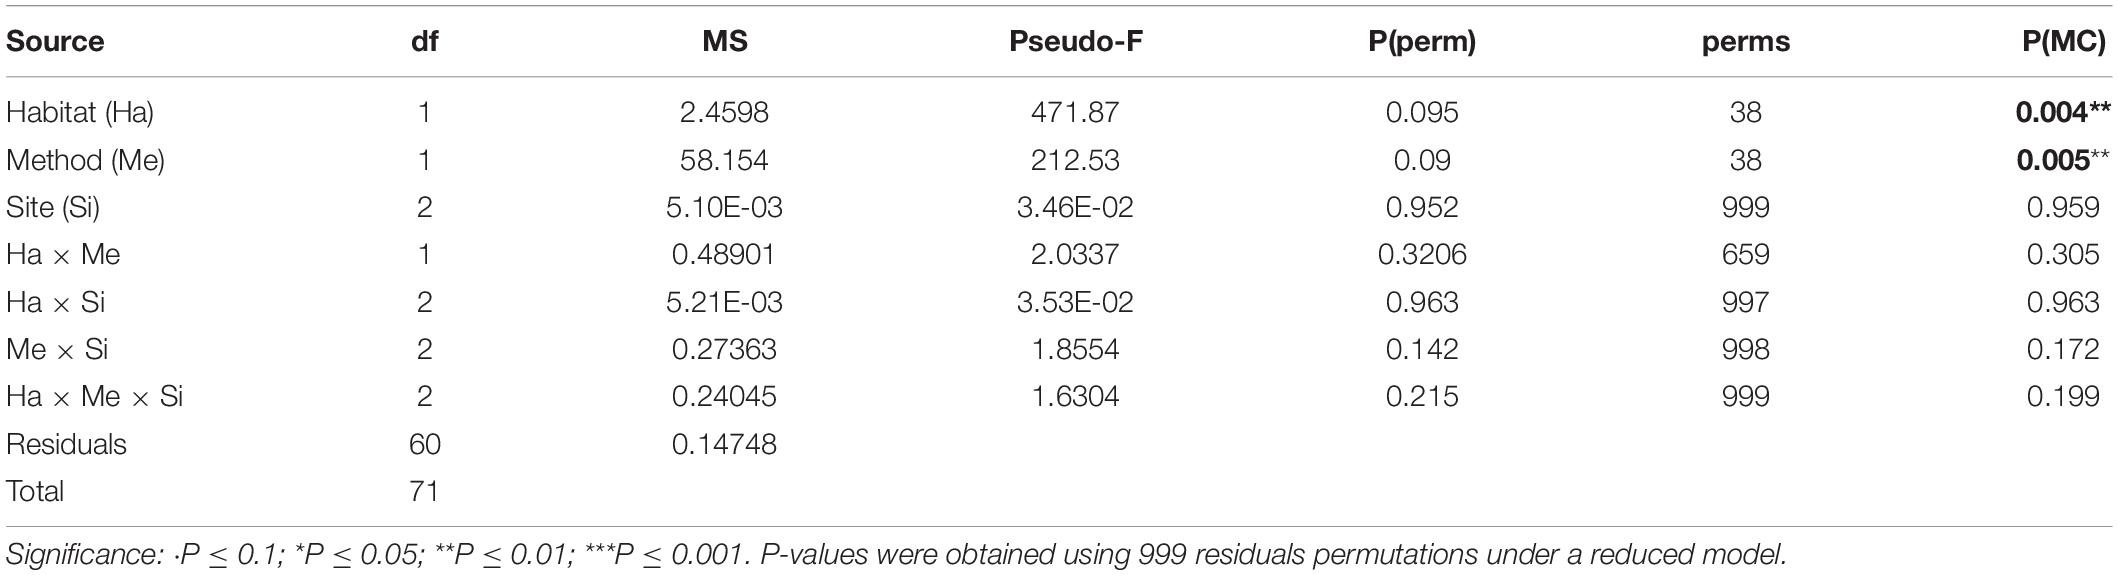
Table 5. PERMANOVA table of results for time; Variation source, degree of freedom (df), mean squares (MS), F statistic (Pseudo-F), P-value obtain by permutations [P(perm)] or using the Monte-Carlo test [P(MC)] and numbers of permutations (perms).
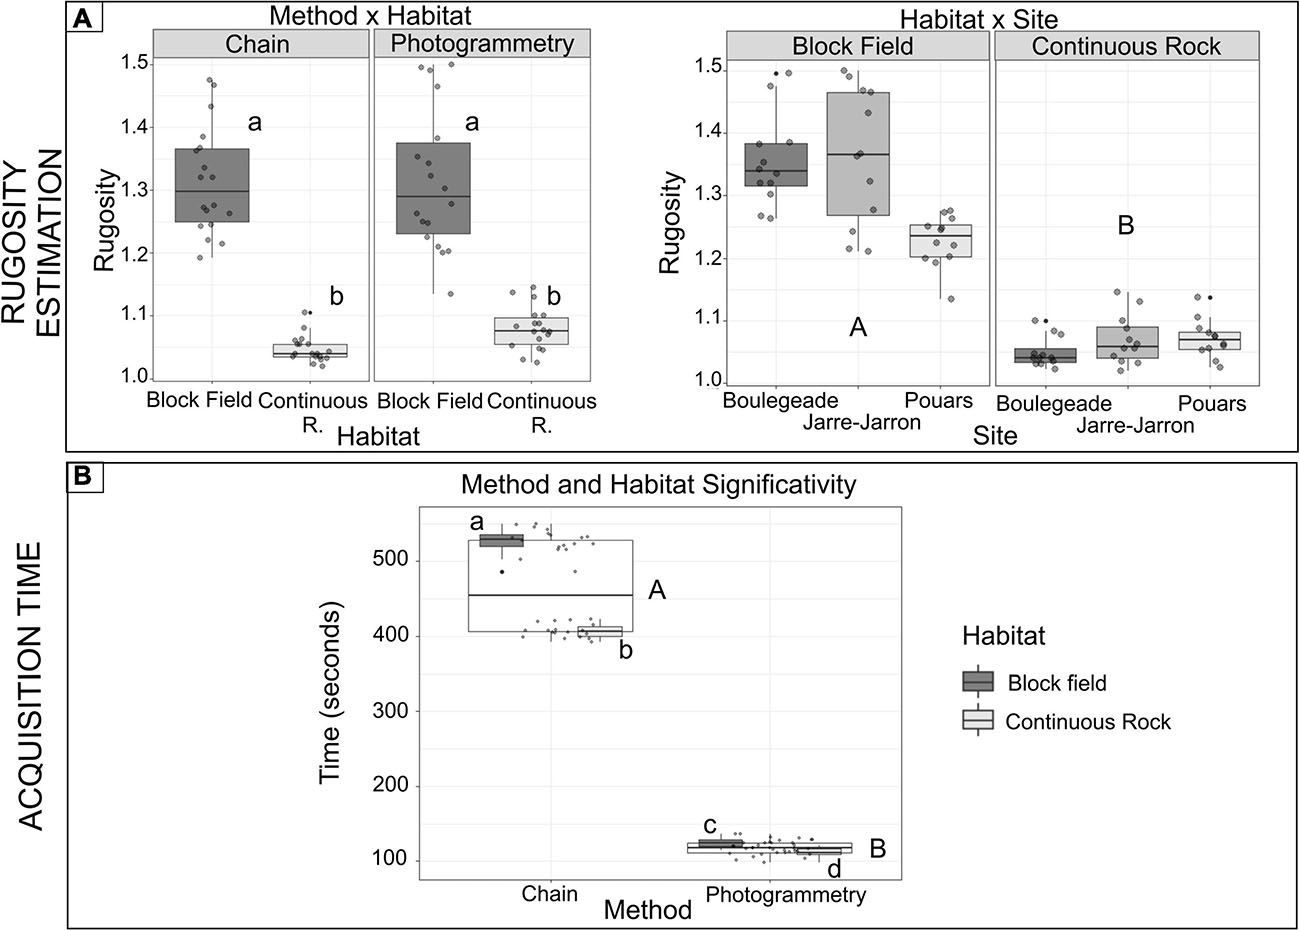
Figure 3. Tukey boxplots of (A) rugosity (mean per quadrats) and (B) acquisition time per quadrat (seconds)—boxes display levels of treatments. Boxplots indicate the median (bold line near the center), the first and third quartile (the box), the extreme values where distance from the box is at most 1.5 times the inter-quartile range (whiskers), and remaining outliers (dark circles). Pair-wise tests between treatments are given with lower- and upper-case characters for significant terms from tests (Tables 2, 3). Capital letters represent pair-wise tests between method modalities, whilst lowercase letters represent pairwise tests between modalities of the method × habitat treatment.
Precision/Repeatability
In the second experimental set-up, the dispersion of measurement was greater (low repeatability) with the chain-and-tape method than with the photogrammetry as shown by the coefficients of variation (CVchain = 1.66%; CVphotogrammetry = 0.62%), and by PERMDISP procedure (P = 0.015; SE (chain) = 4.8931 × 10⁻² and SE (photogrammetry) = 2.0435 × 10⁻²; Figure 4).
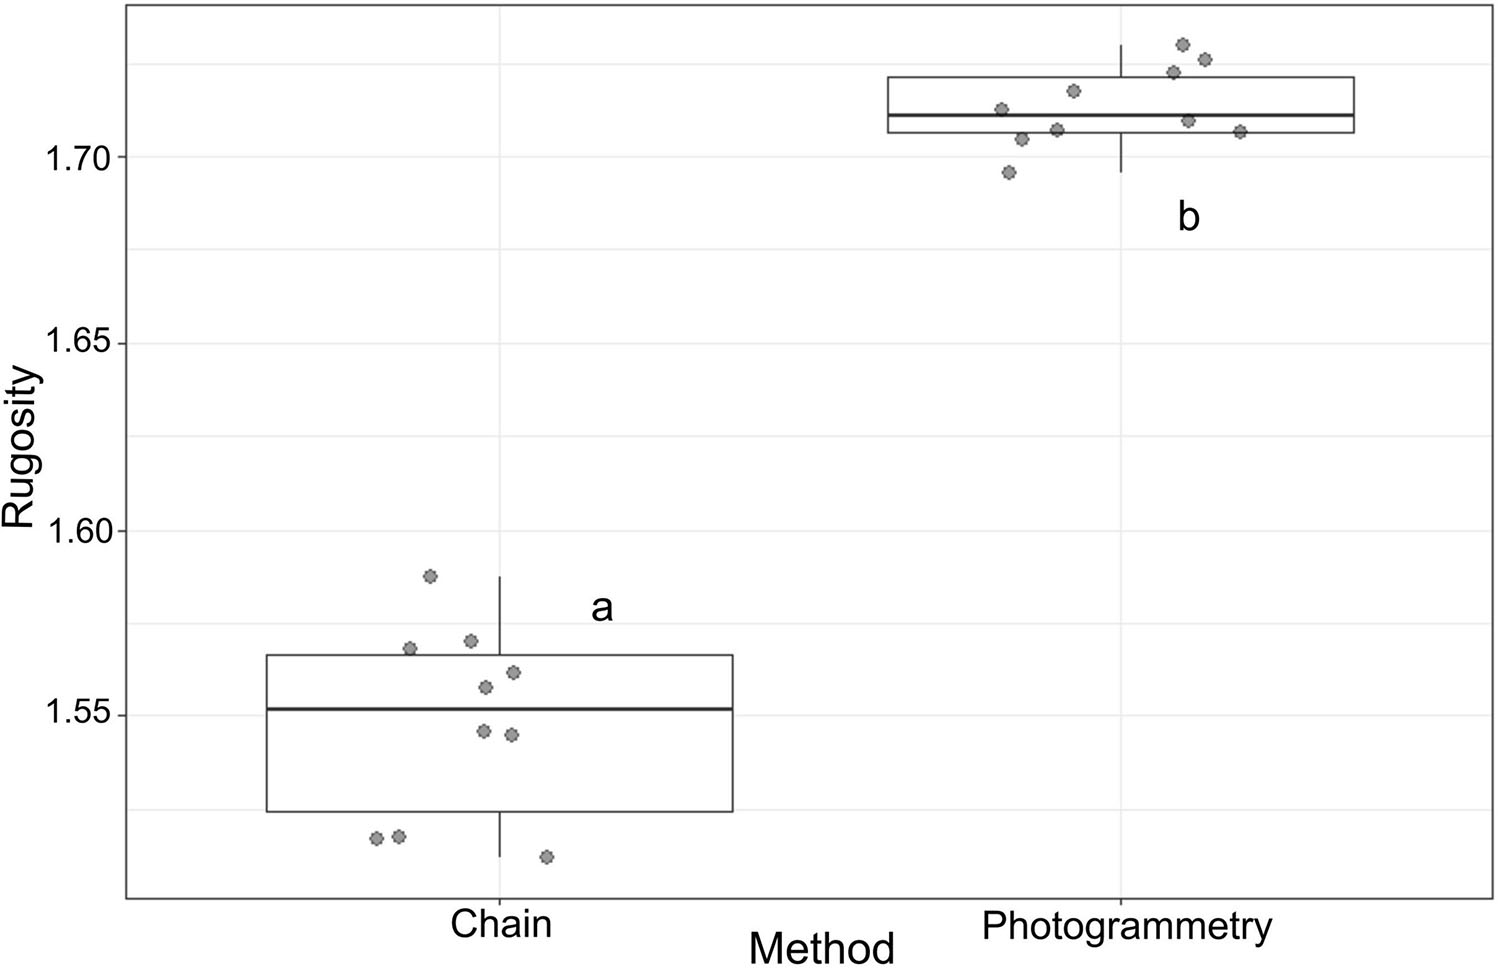
Figure 4. Boxplots evaluating the precision of the chain-and-tape (Chain) and photogrammetry (Photogrammetry) based on the repeatability of each method. Boxes display levels of treatments. Boxplots indicate the median (bold line near the center), the first and third quartile (the box), the extreme values where distance from the box is at most 1.5 times the inter-quartile range (whiskers), and remaining outliers (dark circles).
Teleost Assemblages
Environmental Variables According to the Site Factor
The mean surface rugosity, its variation and depth were significantly different according to the site (PERMANOVAs, respectively, P = 0.009; P = 0.002, and P = 0.001; Supplementary Data Figure 3). These variables were thus included as covariables in the factorial analysis (see M&M).
Covariables Study: Effects of Mean Rugosity, Its Variation and Depth on Teleost
As the mean surface rugosity increased, the total abundance and species richness were greater once the other variable effects were removed (respectively, PERMANOVA, P = 0.032; P = 0.045; Figure 5 and Supplementary Table 2). These descriptors also had a residual variability when tested in response to the site (independently; Supplementary Table 2). When the site effect was exclusively taken into account, the total abundance was greater and more variable at certain sites (e.g., Joseph; Figure 5). The species richness was also higher and more variable at certain sites, but the results were different from those of the total abundance (e.g., Moyade; Figure 5). The Shannon index was not significantly influenced, either by the site factor or by covariables (Supplementary Table 2). Species assemblage (i.e., relative abundances) varied as a function of mean surface rugosity and depth covariables and site factor (Figure 6 and Supplementary Table 2).
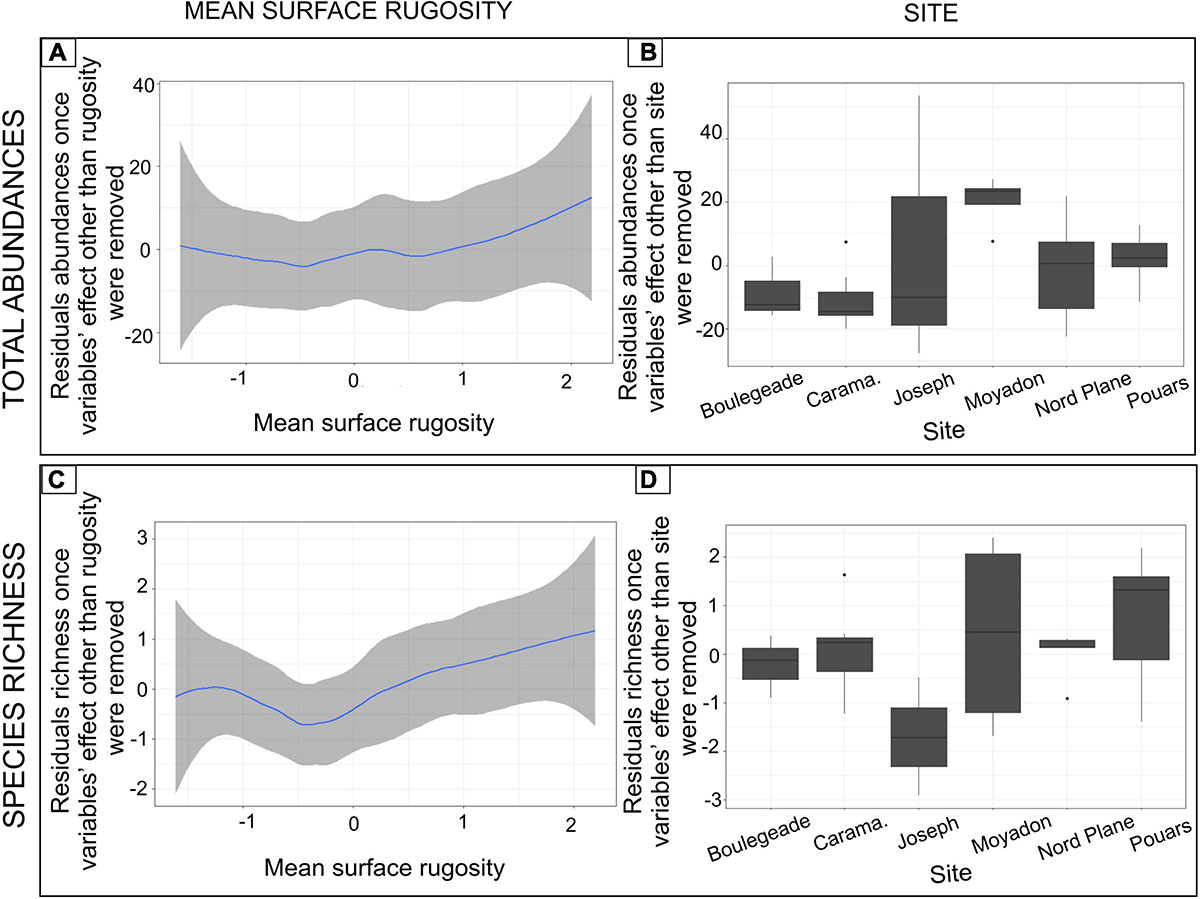
Figure 5. Influence of the mean surface rugosity and the site factor on the total abundances of fish and the fish species richness. More precisely, (A) Smoothed curves of residuals of total abundances once the effect of all variables except the mean surface rugosity was removed; (B) Boxplots of residuals of total abundances once the effect of all variables except the site factor was removed; (C) Smoothed curves of residuals of species richness once the effect of all variables except the mean surface rugosity were removed; (D) Boxplots of residuals of species richness once the effect of all variables except the site factor was removed. Graphs show significant terms from tests (Supplementary Table 2).
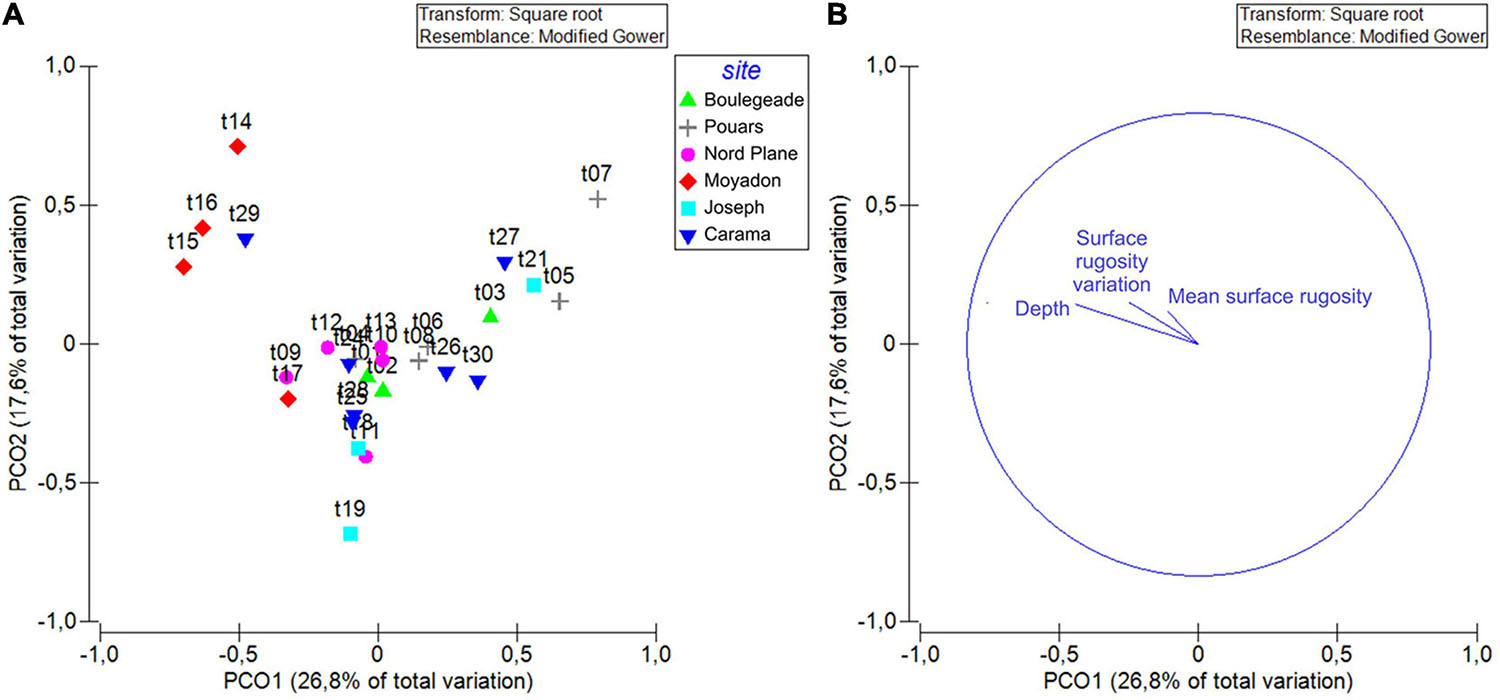
Figure 6. Principal coordinate analysis (PCO) ordinations plot of species assemblage samples (transects) according to the site factor (fixed). (A) Each dot corresponds to a single transect attributed to one of the 6 sites (Boulegeade, Pouars, Nord Plane, Moyadon, Joseph and Camara for Camarassaigne). (B) Correlation vectors (Spearman) of the mean surface rugosity, the variation of surface rugosity and depth covariables are plotted.
The assemblage of spatial categories differed only as a function of the mean surface rugosity and depth (Supplementary Table 2).
The specific abundance results differed among the species studied. The mean surface rugosity influenced the abundances of Apogon imberbis and Anthias anthias. The abundance of the latter species increased when mean surface rugosity was the only effect studied. The variation of surface rugosity only affected the abundance of Coris julis: which increased slightly with the increasing variation in surface rugosity. Depth only had an effect on the abundance of A. anthias, in particular its abundance increased with increasing depth. The site factor simultaneously influenced the abundance of Diplodus vulgaris, A. anthias, Serranus cabrilla, and A. imberbis. The abundance of D. vulgaris was significantly different from one site to another (when the effects of covariate were removed): it was greater at the Joseph site (Supplementary Figure 4). The abundance of other species did not differ in function of the factors (Supplementary Table 2).
The size variation results (TL: total length in mm) of each species differed according to the species studied. The mean surface rugosity only influenced the sizes of A. anthias and S. cabrilla. The size of this latter species increased with increasing mean surface rugosity. The variation in surface rugosity only affected the sizes of C. julis and D. sargus. The size of C. julis decreased as the variation in surface rugosity variation increased (once all other variable effects were removed). Depth influenced the sizes of C. julis, C. chromis, and D. vulgaris. As the depth increased, the size of these three species decreased, and this tendency was more pronounced for C. chromis. The site had a significant effect on the size of C. julis, C. chromis, D. vulgaris, A. anthias, and S. cabrilla. When the site effect was exclusively represented, the sizes of C. julis and C. chromis did not differ as much between sites as the sizes of D. vulgaris and A. anthias. In this analysis, A. imberbis and Sarpa salpa were not taken into account because only a few individuals of each size were sampled. The other species sizes did not vary according to these factors (Supplementary Table 2).
The results of abundance by size-class were different depending on the species studied. The mean surface rugosity only influenced C. julis, A. anthias, and A. imberbis distribution of abundance by size-class. The variation in surface rugosity did not influence the abundance of a single species by size-class. The depth significantly affected the abundance by size-class of C. julis, A. anthias, A. imberbis, and S. salpa. The site factor modalities influenced the distribution of A. anthias and A. imberbis abundances by size-class. S. cabrilla was excluded from this analysis because too few individuals were observed, resulting in a negative p-value.
Discussion
Methods Comparison
The chain-and-tape method was compared to photogrammetry to determine which approach was the most robust for characterizing habitat complexity. On one hand, we observed that the two methods gave similar estimates of the mean rugosity. More precisely, on a small sample (second experimental set-up), the mean rugosity estimate differed slightly from one method to another. However, on a larger scale (first experimental set-up) this difference was not significant according to the method. It should be noted that in continuous rocky habitat the difference between the methods was closer to the significance level, which might suggest that photogrammetry can detect rugosity more finely than the chain-and-tape method.
The methods differed considerably in terms of acquisition time. Specifically, the time was longer when the chain-and-tape method was used, while photogrammetry was much faster. This contrast is probably due to the manual in situ positioning of the chain, a phase that is not necessary with photogrammetry as data acquisition is carried out from pictures. It is interesting to identify which method is the most time-consuming in situ, because underwater fieldwork is expensive. It should be, however, noted that photogrammetry could require expensive equipment such as computers, specific software, and cameras. The time post-processing (e.g., the time needed to create 3D models)—which is not considered here—could be substantial according to the material available.
The dispersion of rugosity measurement (i.e., the dispersion around the median of the rugosity) was not significantly different in the first experimental device. However, when repeatability was studied, the dispersion was greater using the chain-and-tape method. In addition, the values of the coefficient of variation—quantifying precision—remained low but, in the case of photogrammetry the coefficient was close to zero. The chain-and-tape method therefore seems less reliable in terms of repeatability, and therefore less precise than photogrammetry. However, it would be interesting in future studies to consider a larger sample in order to verify this tendency. It is to be noted that previous studies highlighted that the chain-and-tape method has the disadvantage of needing many samples to give a robust estimation of rugosity (Storlazzi et al., 2016).
The lack of efficiency and precision of the chain-and-tape method is probably explained by the subjective placement of the chain along the segments (Storlazzi et al., 2016). It is possible that it imperfectly fits and follows the contour of the seabed, leading to an erroneous estimation of rugosity. If the chain links are small, it is possible to characterize the rugosity on a small scale and increase the measurement precision. These complications do not apply using photogrammetry, although it should be noted that one of the weaknesses of photogrammetry resides in the potential lack of pictures in an area, which can lead to an incomplete 3D representation (Ferrari et al., 2016). Photogrammetry could also be affected by the site conditions such as water turbidity (poor visibility). Under these circumstances, it might become very difficult to create models from the photos taken. On the other hand, the chain-and-tape method could still be used and give an acceptable result. Environmental conditions could therefore influence the quality of the images incidentally by reducing the precision of photogrammetry and adding noise in the models (Troisi et al., 2015; Urbina-Barreto, 2020). In addition, photogrammetry is known to cover larger areas than the chain-and-tape method (Leon et al., 2015; Bryson et al., 2017). The software used to create the 3D representation may also have a minimal influence on the results (e.g., Burns and Delparte, 2017).
Overall, photogrammetry appears as the most efficient method since it estimates rugosity more finely and more quickly than the chain-and-tape method during field acquisition. It is also the more repeatable method that estimates rugosity non-invasively (Friedman et al., 2012; Bridge et al., 2014).
Teleost Assemblages
Our work highlights the significant and independent effect of rugosity and other predictors on teleost fish assemblages. To do this, we first studied environmental variables (i.e., mean rugosity, variation of rugosity, and depth) as a function of the site factor and we observed that the site had a significant effect on these three variables. This result was not surprising because no site has strictly similar environmental specificities.
Then, through the factorial analysis, it has been shown that the total abundance and species richness of fish increased with a higher mean surface rugosity (effects of other factors removed). These results reinforce the conclusions from previous studies since they reported the same trends (Gratwicke and Speight, 2005; Komyakova et al., 2013). The abundance results for each species were taxon specific. Some species such as C. julis and A. imberbis were influenced by an increase of, respectively, the variation of rugosity and the mean surface rugosity, leading to the increase of their abundance.
High rugosity implies a greater quantity of food because the available surface is diversified: the algal cover can further develop and extend, and invertebrates can be more present (Luckhurst and Luckhurst, 1978; Vigliola et al., 1998; Gratwicke and Speight, 2005; Verges et al., 2011; Sinopoli et al., 2015). With more resources available, more species can coexist. It is likely that the number of available niches (Hutchinson niche: theoretical niche) will increase and species that are habitat specialists could then inhabit and occupy these spaces (Johnson et al., 2003; Willis et al., 2005; Bryson et al., 2017; Sinopoli et al., 2017). In addition, high rugosity implies high complexity leading to a greater number of shelters (Harborne et al., 2011, 2012; Ménard et al., 2012; Ferrari et al., 2016; Ferrari, 2017). Species such as nektobenthic and cryptobenthic fishes can easily find refuge. Through the use of these refuges, species can live in high-flow environments (Johansen et al., 2008).
Complexity can play a part in interactions such as predator-prey dynamics. Prey can use these shelters to escape predators (Hixon, 1991; Cheminée et al., 2017b), which improves their chances of survival, while predators can use habitat complexity to their advantage as hiding places to search or pursue prey, depending on their predation tactic (Thiriet et al., 2014; Chacin and Stallings, 2016; Mercader et al., 2019). Prey could be disadvantaged by complexity since it could reduce their visual field and therefore force them, to either risk predation by feeding outside their refuge or to remain in their shelter and risk starvation, and have difficulty in finding reproductive partners (Rilov et al., 2007). The trophic interactions can then depend on the refuges provided by habitat complexity to the predator-prey component (Grabowski, 2004). All these aspects could increase the reproduction of a species or a component but also its growth rate, depending on the interactions that take place, and therefore improve survival. Better habitat provides a given species at a given phase of its life cycle with the best trade-off between growth rate and predation-induced mortality (Dahlgren and Eggleston, 2000); therefore, a complex and heterogeneous seascape can offer various configurations, well-suited to fulfill the diverse needs of different species in terms of habitat quality.
Behavioral strategies can be responsible for specific abundance trends (Almany, 2004). For instance, A. imberbis—which has a strong specialization for rocky habitat—exhibits during the day a high degree of fidelity to its resting sites, likely to escape predators (Hoban, 2012). This could possibly illustrate the influence of the mean surface rugosity on the abundance of this species. As for C. julis, it is known to compete for the size of its territory (Lejeune, 1987), which could explain why its abundance varied according to the variation in rugosity. In addition, habitat complexity could favor interactions between species leading to specific behaviors. For example, C. julis can be a facultative cleaner at its first stage of life by feeding on other species if they are present, such as S. salpa (Neto, 2018), making habitat an important selection factor. The link between predator identity and habitat complexity influences the intensity of the behavioral interactions by affecting trophic cascades (Grabowski et al., 2008).
Furthermore, our results indicated that depth, in interaction with surface rugosity, also had a significant effect on species assemblage and spatial category assemblage. Size patterns (the size of each species and the abundance in each size class) were taxon specific, but in general were also influenced by depth. The effect on spatial category assemblage was not particularly surprising since this variable separates species by their lifestyle (Harmelin, 1987), which can be directly linked to this environmental variable. However, it should be noted that this response variable was created from the spatial organization of diurnal species. The results could therefore differ significantly if we consider the nocturnal activity.
The depth effect has been demonstrated in previous studies (Friedlander and Parrish, 1998; Letourneur et al., 2003; Anderson and Millar, 2004; Milazzo et al., 2011, 2016; Schultz et al., 2014; Ferrari et al., 2018). More recently, works on rocky reefs have shown the significant and independent effect of depth and complexity of canopy-forming algae (Cheminée et al., 2017b; Cuadros et al., 2019), or the cumulative effects of depth and the complexity of habitat (Ferrari et al., 2018).
It could be interesting to integrate algal cover, which can be a proxy of complexity (Cuadros et al., 2019), such as the cover of Cystoseira sensu lato, in order to simultaneously consider the complexity of the inert substrate but also the complexity built by species such as in macrophytes forests or biogenic reefs, as well as with the depth factor. In addition, it is known that many fishes graze on epilithic algae (Gratwicke and Speight, 2005; Hinz et al., 2019), and that Cystoseira may provide preferred habitats for coastal fishes throughout their life stages (Lejeune, 1987; Rodrigues, 2010; Cheminée et al., 2013; Thiriet et al., 2014, 2016; Thibaut et al., 2017; Hinz et al., 2019).
The depth preference can be linked to the food requirements of the studied species (Bell, 1983) but also to the need to find a suitable habitat (with low temperature and/or reduced light for example Malcolm et al., 2011). The last assumption mainly applies to great depths, which is not the case in our study. In addition (Bell, 1983) demonstrated that some species preferred shallow to deep habitats. In our sample, some species classified as preferring deep conditions by this author were observed in shallow water (e.g., C. chromis), and so may have influenced our results.
Several other reasons could explain why species are seen at different depths, such as: avoidance strategy (i.e., species could be using several space-sharing mechanisms; Luckhurst and Luckhurst, 1978), behavior linked to a species’ history traits, interactions between species (e.g., competition; Malcolm et al., 2011), trophic interactions, or ontogeny. These last three hypotheses could also coincide with rugosity. For instance, opposed gradients of densities according to depth were observed in the Mediterranean for the labrids C. julis and Thalassoma pavo (Milazzo et al., 2011; Sinopoli et al., 2017). Milazzo et al. (2011, 2016) highlighted the partitioning of these two species according to both vertical and horizontal gradients as a function of their affinities to colder (C. julis) vs. warmer waters (T. pavo). These studies underline the shifting trends of this partitioning as a result of global change and the rise of sea surface temperatures in the Mediterranean.
In the case of ontogeny, different ecological processes could be taking place including recruitment, settlement, and post-settlement (Vigliola et al., 1998; De La Morinière et al., 2002; Malcolm et al., 2011). It also must be noted that trophic interactions are intricate, difficult to describe and must be considered on the basis of specific factors, for instance relative to the species’ behavior and habitat complexity (Grabowski, 2004). The literature reveals that sizes of some species are smaller in shallow water, concluding that this zone plays a role as nursery habitats (Bell, 1983; Cheminée et al., 2011, 2013, 2016, 2017a, 2020; Cuadros et al., 2017a, b, 2018). Our results do not support this hypothesis, but it is possible that we have omitted a key environmental variable influencing size patterns and masking an influence of depth on size. This could be a consequence of species-specific association: when juveniles of some species could prefer a particular habitat with specific characteristics, while in adulthood they might tend to favor another type of habitat structure (Bonin, 2012; Komyakova et al., 2018). Besides, some of our response variables such as total abundance and species richness were influenced by the site factor (e.g., total abundance was greater at Moyadon than at Caramassaigne). The differences between sites may be due to environmental characteristics that were not considered in the study such as currents (influencing for example the settlement of juveniles) (Friedlander and Parrish, 1998). In fact, this was the purpose of incorporating the site factor: to integrate a set of environmental variables that can take into account heterogeneity and spatial variability relating to the natural environment (Anderson and Millar, 2004; Cheminée et al., 2017b).
Moreover, in our study, the species are considered to be associated with the characteristics of the transects. It is unlikely that all species will stay their entire lifespan in a single isolated habitat, and it is more rational to assume that they move from one habitat to another. Habitats close to the transects could have an influence on the studied assemblages (Schultz et al., 2012). Different spatial scales should then be examined to fully understand the interactions between different life stages and shallow rocky reef habitats, and the movement of species and their interactions (Cheminée, 2012; Kovalenko et al., 2012; Thiriet et al., 2014). For a smaller scale example, Friedlander and Parrish (1998) noted that hole variables can be powerful predictors in describing fish biomass and number of individuals.
Studies on habitat complexity are mainly tropical. The number of metrics characterizing the complexity of Mediterranean shallow rocky reefs is more limited than in tropical environments. For instance, in the literature, coral species are classified according to their structural type (bushy vs. massive) (McCormick, 1994; Bridge et al., 2014), which could hardly be done in temperate waters. New metrics are therefore necessary to quantify the complexity of habitat in this area. Additional studies are also crucial to identify the links between habitat structuration and teleost assemblages. To this end, a larger dataset involving a greater number of species, habitats and sites should be developed and processed.
Conclusion
To measure 3D complexity, several methods exist; we demonstrated that photogrammetry is the most efficient and rapid especially when compared to the chain-and-tape method. Using new technologies to characterize 3D complexity is a promising way to acquire data. Photogrammetry offers new perspectives to quantify the habitat’s three-dimensional structure (e.g., Urbina-Barreto, 2020), because of its capacity to provide precise and time-efficient measures.
Understanding how habitat complexity operates on species assemblage is essential for understanding key processes and therefore adapting conservation measures, notably in the context of global change. We saw in our study that our environmental variables had a real effect on communities. Specifically, increased rugosity appears to stimulate and promote the abundance and diversity of fish especially when known to provide shelter, food and facilitate interactions and reproduction, which can increase the chances of survival and explain the patterns encountered. Unsurprisingly, depth also had an impact on our biological variables, which has already been described in the literature. Yet, some of our data variability was omitted but described by the site factor. To go further, it could be interesting to consider new environmental descriptors such as currents or, on a smaller scale, hole variables.
Combined with biological data, the study of 3D complexity can be an exploration of the entire marine environment, quantifying horizontal zonation, where vertical zonation can be related to depth. Even though habitat complexity has a strong impact on teleost fish assemblage structure, it should be borne in mind that all habitats are important in maintaining regional fish diversity (Gratwicke and Speight, 2005). On the basis of this knowledge, it could be interesting to study on a larger spatial scale these aspects at the 3D level by means of photogrammetry.
Data Availability Statement
The raw data supporting the conclusions of this article will be made available by the authors, without undue reservation.
Ethics Statement
Ethical review and approval was not required for the animal study because the study was non-lethal. More precisely, we only used Underwater Visual Census (UVC) to count teleost individuals.
Author Contributions
AC, PD, and OB designed the experiments. AC and OB managed the funding acquisition. AP and OB performed the field work. TM and AC compiled and analyzed output data, and designed and wrote the first version of the manuscript. TM, AC, PD, and TT prepared the revised version of the manuscript. All authors discussed the results and implications and commented on the manuscript at all stages and contributed extensively to the work presented in this manuscript.
Funding
This work was part of TM’s Ph.D. thesis and was conducted within the scope of the THALIA Project. Part of the data was collected within the framework of the project “Contribution à la surveillance des biocénoses littorales selon l’approche paysagère” funded by the Agence de l’Eau Rhône Méditerranée Corse, Délégation PACA et Corse-AGAF. TM received a Ph.D. scholarship EJD n°2020_03366 funded by the Conseil Régional de la Région SUD-PACA.
Conflict of Interest
The authors declare that the research was conducted in the absence of any commercial or financial relationships that could be construed as a potential conflict of interest.
Acknowledgments
We wish to thank Pierre Thiriet for his scientific advises, Pierre Boissery from the Agence de l’Eau Rhône Méditerranée Corse, Renata Ferrari and Will F. Figueira for a preliminary discussion on the topic, Holly Monfort and Michael Paul for proofreading of the English text, and both reviewers for their advice.
Supplementary Material
The Supplementary Material for this article can be found online at: https://www.frontiersin.org/articles/10.3389/fmars.2021.639309/full#supplementary-material
Supplementary Figure 1 | Schematization of the sampling methods. (A) Calculation of linear rugosity of a rocky reef habitat using the chain-and-tape method as presented by Hill and Wilkinson (2004). (B) In situ data acquisition corresponding to the method comparison. (C) In situ data acquisition to measure on the one hand, the fish assemblage descriptors and on the other hand, the environmental variables (mean surface rugosity, surface rugosity variation and depth) corresponding to the second analysis to determine the relation between the habitat complexity and the Teleost assemblages.
Supplementary Figure 2 | Spatial organization of ichthyofauna in Mediterranean shallow rocky reef bottoms. The numbers refer to the spatial categories (see Table 1). In this study, no distinction was made between category 6.a and 6.b. Modified from Harmelin (1987).
Supplementary Figure 3 | Mean and standard error of each environmental variable [(A) surface rugosity mean, (B) surface rugosity variation and (C) depth] according to the site factor (6 sites: Boulegeade, Carama for Caramassaigne, Joseph, Moyadon, Nord Plane, Pouars).
Supplementary Figure 4 | Influence of the mean surface rugosity, the surface rugosity variation, depth, and the site factor on the specific abundances. More precisely, (A) Smoothed curves of residuals of Coris julis abundance once the effect of all variables expect surface rugosity variation was removed. (B) Boxplots of residuals of Diplodus vulgaris once the effect of all variables except the factor site was removed. (C) Boxplots and smoothed curves of residuals of Anthias anthias once the effect of all variables except mean surface rugosity, depth or the site factor were removed. Graphs show significant terms from tests (Supplementary Table 2). Sites abbreviations: B, Boulegeade; C, Caramassaigne; J, Josepth; M, Moyadon; N-P, Nord Plane; P, Pouars.
Supplementary Table 1 | Processing parameters used to create the 3D models with Agisoft Metashape. These parameters refer to the third quadrat model in Pouars site (Pouars 3) as for an example.
Supplementary Table 2 | PERMANOVA table of results for all response variables tested (corresponding to the Teleost assemblage, including the ones that are taxon specific); Variation source, degree of freedom (df), mean squares (MS), F statistic (Pseudo-F), P-value obtain by permutations [P(perm)] or using the Monte-Carlo test [P(MC)] and numbers of permutations (perms). Significance: ⋅P ≤ 0.1; ∗P ≤ 0.05; ∗∗ P ≤ 0.01; ∗∗∗ P ≤ 0,001. P-values were obtained using 999 residuals permutations under a reduced model.
References
Airoldi, L., Balata, D., and Beck, M. W. (2008). The gray zone: relationships between habitat loss and marine diversity and their applications in conservation. J. Exper. Mar. Biol. Ecol. 366, 8–15. doi: 10.1016/j.jembe.2008.07.034
Almany, G. R. (2004). Does increased habitat complexity reduce predation and competition in coral reef fish assemblages? Oikos 106, 275–284. doi: 10.1111/j.0030-1299.2004.13193.x
Anderson, M. J., Gorley, R. N., and Clarke, K. R. (2008). Plymouth: primer-E; 2008. PERMANOVA+ for PRIMER: Guide to software and statistical methods. 214.
Anderson, M. J., and Millar, R. B. (2004). Spatial variation and effects of habitat on temperate reef fish assemblages in northeastern New Zealand. J. Exper. Mar. Biol. Ecol. 305, 191–221. doi: 10.1016/j.jembe.2003.12.011
August, P. V. (1983). The role of habitat complexity and heterogeneity in structuring tropical mammal communities. Ecology 64, 1495–1507. doi: 10.2307/1937504
Beck, M. W. (2000). Separating the elements of habitat structure: independent effects of habitat complexity and structural components on rocky intertidal gastropods. J. Exper. Mar. Biol. Ecol. 249, 29–49. doi: 10.1016/S0022-0981(00)00171-4
Bell, J. D. (1983). Effects of depth and marine reserve fishing restrictions on the structure of a rocky reef fish assemblage in the north-western Mediterranean Sea. J. Appl. Ecol. 20, 357–369. doi: 10.2307/2403513
Bell, S. S., McCoy, E. D., and Mushinsky, H. R. (2012). Habitat structure: the physical arrangement of objects in space. Berlin: Springer Science & Business Media.
Bianchi, C. N., and Morri, C. (2000). Marine biodiversity of the Mediterranean Sea: situation, problems and prospects for future research. Mar. Pollut. Bull. 40, 367–376. doi: 10.1016/S0025-326X(00)00027-8
Bonin, M. C. (2012). Specializing on vulnerable habitat: Acropora selectivity among damselfish recruits and the risk of bleaching-induced habitat loss. Coral Reefs 31, 287–297. doi: 10.1007/s00338-011-0843-2
Bridge, T. C., Ferrari, R., Bryson, M., Hovey, R., Figueira, W. F., Williams, S. B., et al. (2014). Variable responses of benthic communities to anomalously warm sea temperatures on a high-latitude coral reef. PloS One 9:e113079. doi: 10.1371/journal.pone.0113079
Bryson, M., Ferrari, R., Figueira, W., Pizarro, O., Madin, J., Williams, S., et al. (2017). Characterization of measurement errors using structure-from-motion and photogrammetry to measure marine habitat structural complexity. Ecol. Evol. 7, 5669–5681. doi: 10.1002/ece3.3127
Burns, J. H. R., and Delparte, D. (2017). Comparison of commercial structure-from-motion photogrammety software used for underwater three-dimensional modeling of coral reef environments. Int. Arch. Photogramm. Remote Sens. Spatial Inf. Sci. 42, 127–131. doi: 10.5194/isprs-archives-XLII-2-W3-127-2017
Burns, J. H. R., Delparte, D., Gates, R. D., and Takabayashi, M. (2015). Integrating structure-from-motion photogrammetry with geospatial software as a novel technique for quantifying 3D ecological characteristics of coral reefs. PeerJ. 3:e1077. doi: 10.7717/peerj.1077
Byrne, L. B. (2007). Habitat structure: a fundamental concept and framework for urban soil ecology. Urban Ecosyst. 10, 255–274. doi: 10.1007/s11252-1007/s11252-007-0027-6
Calders, K., Phinn, S., Ferrari, R., Leon, J., Armston, J., Asner, G. P., et al. (2020). 3D imaging insights into forests and coral reefs. Trends Ecol. Evol. 35, 6–9. doi: 10.1016/j.tree.2019.10.004
Chacin, D. H., and Stallings, C. D. (2016). Disentangling fine-and broad-scale effects of habitat on predator–prey interactions. J. Exper. Mar. Biol. Ecol. 483, 10–19. doi: 10.1016/j.jembe.2016.05.008
Charton, J. G., and Ruzafa, A. P. (1998). Correlation between habitat structure and a rocky reef fish assemblage in the southwest Mediterranean. Mar. Ecol. 19, 111–128. doi: 10.1111/j.1439-0485.1998.tb00457.x
Cheminée, A. (2012). Ecological functions, transformations and management of infralittoral rocky habitats from the Northwestern Mediterranean: the case of fish (Teleostei) nursery habitats. France: Université Nice Sophia Antipolis.
Cheminée, A., Francour, P., and Harmelin-Vivien, M. (2011). Assessment of Diplodus spp.(Sparidae) nursery grounds along the rocky shore of Marseilles (France, NW Mediterranean). Sci. Mar. 75, 181–188. doi: 10.3989/scimar.2011.75n1181
Cheminée, A., Le Direach, L., Rouanet, E., Astruch, P., Goujard, A., Blanfuné, A., et al. (2020). Typology of fish nurseries in shallow Mediterranean coastal zones: all habitats matter. doi: 10.21203/rs.3.rs-118728/v1
Cheminée, A., Merigot, B., Vanderklift, M. A., and Francour, P. (2016). Does habitat complexity influence fish recruitment? Mediter. Mar. Sci. 17, 39–46. doi: 10.12681/mms.1231
Cheminée, A., Pastor, J., Bianchimani, O., Thiriet, P., Sala, E., Cottalorda, J.-M., et al. (2017a). Juvenile fish assemblages in temperate rocky reefs are shaped by the presence of macro-algae canopy and its three-dimensional structure. Sci. Rep. 7, 1–11. doi: 10.1038/s41598-017-15291-y
Cheminée, A., Rider, M., Lenfant, P., Zawadzki, A., Mercière, A., Crec’Hriou, R., et al. (2017b). Shallow rocky nursery habitat for fish: spatial variability of juvenile fishes among this poorly protected essential habitat. Mar. Pollut. Bull. 119, 245–254. doi: 10.1016/j.marpolbul.2017.03.051
Cheminée, A., Sala, E., Pastor, J., Bodilis, P., Thiriet, P., Mangialajo, L., et al. (2013). Nursery value of Cystoseira forests for Mediterranean rocky reef fishes. J. Exper. Mar. Biol. Ecol. 442, 70–79. doi: 10.1016/j.jembe.2013.02.003
Clarke, K. R., and Gorley, R. N. (2006). PRIMER v6: user manual/tutorial, Primer E: Plymouth. Plymouth, UK: Plymouth Marine Laboratory.
Clarke, K. R., Gorley, R. N., Somerfield, P. J., and Warwick, R. M. (2014). Change in marine communities: an approach to statistical analysis and interpretation. Alban: Primer-E Ltd.
CloudCompare (2018). Available Online at: http://cloudcompare.org/ (accessed April 12, 2021).
Coll, M., Piroddi, C., Albouy, C., Ben Rais Lasram, F., Cheung, W. W. L., Christensen, V., et al. (2012). The Mediterranean Sea under siege: spatial overlap between marine biodiversity, cumulative threats and marine reserves: The Mediterranean Sea under siege. Global Ecol. Biogeogr. 21, 465–480. doi: 10.1111/j.1466-8238.2011.00697.x
Cuadros, A., Basterretxea, G., Cardona, L., Cheminée, A., Hidalgo, M., and Moranta, J. (2018). Settlement and post-settlement survival rates of the white seabream (Diplodus sargus) in the western Mediterranean Sea. PloS One 13:e0190278. doi: 10.1371/journal.pone.0190278
Cuadros, A., Cheminée, A., Thiriet, P., Moranta, J., Vidal, E., Sintes, J., et al. (2017a). The three-dimensional structure of Cymodocea nodosa meadows shapes juvenile fish assemblages at Fornells Bay (Minorca Island). Regional Stud. Mar. Sci. 14, 93–101. doi: 10.1016/j.rsma.2017.05.011
Cuadros, A., Moranta, J., Cardona, L., Thiriet, P., Pastor, J., Arroyo, N. L., et al. (2017b). Seascape attributes, at different spatial scales, determine settlement and post-settlement of juvenile fish. Estuarine Coastal Shelf Sci. 185, 120–129. doi: 10.1016/j.ecss.2016.12.014
Cuadros, A., Moranta, J., Cardona, L., Thiriet, P., Francour, P., Vidal, E., et al. (2019). Juvenile fish in Cystoseira forests: influence of habitat complexity and depth on fish behaviour and assemblage composition. Mediter. Mar. Sci. 20, 380–392. doi: 10.12681/mms.18857
Cuttelod, A., García, N., Malak, D. A., Temple, H. J., and Katariya, V. (2009). “The Mediterranean: a biodiversity hotspot under threat,” in Wildlife in a Changing World–an analysis of the 2008 IUCN Red List of Threatened Species, eds J.-C. Vié, C. Hilton-Taylor, and S. N. Stuart (Gland, Switzerland: IUCN), 180.
Dahlgren, C. P., and Eggleston, D. B. (2000). Ecological processes underlying ontogenetic habitat shifts in a coral reef fish. Ecology 81, 2227–2240. doi: 10.1890/0012-9658(2000)081[2227:EPUOHS]2.0.CO;2
De La Morinière, E. C., Pollux, B. J. A., Nagelkerken, I., and Van der Velde, G. (2002). Post-settlement life cycle migration patterns and habitat preference of coral reef fish that use seagrass and mangrove habitats as nurseries. Estuarine Coastal Shelf Sci. 55, 309–321. doi: 10.1006/ecss.2001.0907
Drap, P., Merad, D., Hijazi, B., Gaoua, L., Nawaf, M. M., Saccone, M., et al. (2015). Underwater photogrammetry and object modeling: a case study of Xlendi Wreck in Malta. Sensors 15, 30351–30384. doi: 10.3390/s151229802
Drap, P., Merad, D., Mahiddine, A., Seinturier, J., Peloso, D., Boï, J.-M., et al. (2013). Underwater Photogrammetry for Archaeology. What will be the next step? Int. J. Herit. Digital Era 2, 375–394. doi: 10.1260/2047-4970.2.3.375
Ferrari, R. (2017). The hidden structure in coral reefs. Coral Reefs 36, 445–445. doi: 10.1007/s00338-017-1540-6
Ferrari, R., Bryson, M., Bridge, T., Hustache, J., Williams, S. B., Byrne, M., et al. (2016). Quantifying the response of structural complexity and community composition to environmental change in marine communities. Global Change Biol. 22, 1965–1975. doi: 10.1111/gcb.13197
Ferrari, R., Malcolm, H. A., Byrne, M., Friedman, A., Williams, S. B., Schultz, A., et al. (2018). Habitat structural complexity metrics improve predictions of fish abundance and distribution. Ecography 41, 1077–1091. doi: 10.1111/ecog.02580
Figueira, W., Ferrari, R., Weatherby, E., Porter, A., Hawes, S., and Byrne, M. (2015). Accuracy and precision of habitat structural complexity metrics derived from underwater photogrammetry. Remote Sens. 7, 16883–16900. doi: 10.3390/rs71215859
Friedlander, A. M., and DeMartini, E. E. (2002). Contrasts in density, size, and biomass of reef fishes between the northwestern and the main Hawaiian islands: the effects of fishing down apex predators. Mar. Ecol. Prog. Ser. 230, 253–264. doi: 10.3354/meps230253
Friedlander, A. M., and Parrish, J. D. (1998). Habitat characteristics affecting fish assemblages on a Hawaiian coral reef. J. Exper. Mar. Biol. Ecol. 224, 1–30. doi: 10.1016/S0022-0981(97)00164-0
Friedman, A., Pizarro, O., Williams, S. B., and Johnson-Roberson, M. (2012). Multi-scale measures of rugosity, slope and aspect from benthic stereo image reconstructions. PloS One 7:e50440. doi: 10.1371/journal.pone.0050440
Grabowski, J. H. (2004). Habitat complexity disrupts predator–prey interactions but not the trophic cascade on oyster reefs. Ecology 85, 995–1004. doi: 10.1890/03-0067
Grabowski, J. H., Hughes, A. R., and Kimbro, D. L. (2008). Habitat complexity influences cascading effects of multiple predators. Ecology 89, 3413–3422. doi: 10.1890/07-1057.1
Graham, N. A. J., and Nash, K. L. (2013). The importance of structural complexity in coral reef ecosystems. Coral Reefs 32, 315–326. doi: 10.1007/s00338-012-0984-y
Gratwicke, B., and Speight, M. R. (2005). The relationship between fish species richness, abundance and habitat complexity in a range of shallow tropical marine habitats. J. Fish Biol. 66, 650–667. doi: 10.1111/j.0022-1112.2005.00629.x
Harborne, A. R., Mumby, P. J., and Ferrari, R. (2012). The effectiveness of different meso-scale rugosity metrics for predicting intra-habitat variation in coral-reef fish assemblages. Environ. Biol. Fishes 94, 431–442. doi: 10.1007/s10641-011-9956-2
Harborne, A. R., Mumby, P. J., Kennedy, E. V., and Ferrari, R. (2011). Biotic and multi-scale abiotic controls of habitat quality: their effect on coral-reef fishes. Mar. Ecol. Prog. Ser. 437, 201–214. doi: 10.3354/meps09280
Harmelin, J.-G. (1987). Structure et variabilité de I’ichtyofaune d’une zone rocheuse protégée en Méditerranée (Pare national de Port-Cros, France) Structure and Variability of the Ichthyo-fauna in a Mediterranean Protected Rocky Area (National Park of Port-Cros, France). Mar. Ecol. 8, 263–284. doi: 10.1111/j.1439-0485.1987.tb00188.x
Harmelin-Vivien, M. L., Harmelin, J. G., Chauvet, C., Duval, C., Galzin, R., Lejeune, P., et al. (1985). Evaluation visuelle des peuplements et populations de poissons méthodes et problèmes. Rev. Ecol. 40, 1–72.
Hewitt, J. E., Thrush, S. F., Halliday, J., and Duffy, C. (2005). The importance of small-scale habitat structure for maintaining beta diversity. Ecology 86, 1619–1626. doi: 10.1890/04-1099
Hill, J. J., and Wilkinson, C. C. (2004). Methods for ecological monitoring of coral reefs: a resource for managers. Townsville, MC: Australian Institute of Marine Science.
Hinz, H., Reñones, O., Gouraguine, A., Johnson, A. F., and Moranta, J. (2019). Fish nursery value of algae habitats in temperate coastal reefs. PeerJ. 7:e6797. doi: 10.7717/peerj.6797
Hixon, M. A. (1991). “Predation as a process structuring coral reef fish communities,” in The ecology of fishes on coral reefs, ed. P. F. Sale (San Diego: Academic Press), 475–508. doi: 10.1016/B978-0-08-092551-6.50022-2
Johansen, J. L., Bellwood, D. R., and Fulton, C. J. (2008). Coral reef fishes exploit flow refuges in high-flow habitats. Mar. Ecol. Prog. Ser. 360, 219–226. doi: 10.3354/meps07482
Johnson, M. P., Frost, N. J., Mosley, M. W., Roberts, M. F., and Hawkins, S. J. (2003). The area-independent effects of habitat complexity on biodiversity vary between regions. Ecol. Lett. 6, 126–132. doi: 10.1046/j.1461-0248.2003.00404.x
Komyakova, V., Jones, G. P., and Munday, P. L. (2018). Strong effects of coral species on the diversity and structure of reef fish communities: A multi-scale analysis. PloS One 13:e0202206. doi: 10.1371/journal.pone.0202206
Komyakova, V., Munday, P. L., and Jones, G. P. (2013). Relative importance of coral cover, habitat complexity and diversity in determining the structure of reef fish communities. PloS One 8:e83178. doi: 10.1371/journal.pone.0083178
Kovalenko, K. E., Thomaz, S. M., and Warfe, D. M. (2012). Habitat complexity: approaches and future directions. Hydrobiologia 685, 1–17. doi: 10.1007/s10750-011-0974-z
Lejeune, P. (1987). The effect of local stock density on social behavior and sex change in the Mediterranean labrid Coris julis. Environ. Biol. Fish 18, 135–141. doi: 10.1007/BF00002601
Leon, J. X., Roelfsema, C. M., Saunders, M. I., and Phinn, S. R. (2015). Measuring coral reef terrain roughness using ‘Structure-from-Motion’close-range photogrammetry. Geomorphology 242, 21–28. doi: 10.1016/j.geomorph.2015.01.030
Letourneur, Y., Ruitton, S., and Sartoretto, S. (2003). Environmental and benthic habitat factors structuring the spatial distribution of a summer infralittoral fish assemblage in the north-western Mediterranean Sea. J. Mar. Biol. Assoc. UK. 83, 193–204. doi: 10.1017/S0025315403006970h
Louisy, P. (2002). Guide d’identification des poissons marins: Europe de l’ouest et Méditerranée. Paris: Editions Eugen Ulmer.
Luckhurst, B. E., and Luckhurst, K. (1978). Analysis of the influence of substrate variables on coral reef fish communities. Mar. Biol. 49, 317–323. doi: 10.1007/BF00455026
Malcolm, H. A., Jordan, A., and Smith, S. D. (2011). Testing a depth-based habitat classification system against reef fish assemblage patterns in a subtropical marine park. Aquatic Conserv. Mar. Freshwater Ecosyst. 21, 173–185. doi: 10.1002/aqc.1165
McCormick, M. I. (1994). Comparison of field methods for measuring surface topography and their associations with a tropical reef fish assemblage. Mar. Ecol. Prog. Ser. 112, 87–96. doi: 10.3354/meps112087
Meager, J. J., Schlacher, T. A., and Green, M. (2011). Topographic complexity and landscape temperature patterns create a dynamic habitat structure on a rocky intertidal shore. Mar. Ecol. Prog. Ser. 428, 1–12. doi: 10.3354/meps09124
Ménard, A., Turgeon, K., Roche, D. G., Binning, S. A., and Kramer, D. L. (2012). Shelters and their use by fishes on fringing coral reefs. PloS One 7:e38450. doi: 10.1371/journal.pone.0038450
Mercader, M., Blazy, C., Di Pane, J., Devissi, C., Mercière, A., Cheminée, A., et al. (2019). Is artificial habitat diversity a key to restoring nurseries for juvenile coastal fish? Ex situ experiments on habitat selection and survival of juvenile seabreams. Restor. Ecol. 27, 1155–1165. doi: 10.1111/rec.12948
Messmer, V., Jones, G. P., Munday, P. L., Holbrook, S. J., Schmitt, R. J., and Brooks, A. J. (2011). Habitat biodiversity as a determinant of fish community structure on coral reefs. Ecology 92, 2285–2298. doi: 10.1890/11-0037.1
Milazzo, M., Palmeri, A., Falcón, J. M., Badalamenti, F., Garcìa-Charton, J. A., Sinopoli, M., et al. (2011). Vertical distribution of two sympatric labrid fishes in the Western Mediterranean and Eastern Atlantic rocky subtidal: local shore topography does matter. Mar. Ecol. 32, 521–531. doi: 10.1111/j.1439-0485.2011.00447.x
Milazzo, M., Quattrocchi, F., Azzurro, E., Palmeri, A., Chemello, R., Di Franco, A., et al. (2016). Warming-related shifts in the distribution of two competing coastal wrasses. Mar. Environ. Res. 120, 55–67. doi: 10.1016/j.marenvres.2016.07.007
Neto, J. N. (2018). Facultative cleaner species in marine temperate waters: The ecological role of juvenile Diplodus sargus (Sparidae). Portugal: ISPA Instituto universitário.
R Core Team. (2017). R: A language and environment for statistical computing. Vienna, Austria. R Foundation for Statistical Computing. Available Online at: http://www.R-project.org/
Rees, M. J., Jordan, A., Price, O. F., Coleman, M. A., and Davis, A. R. (2014). Abiotic surrogates for temperate rocky reef biodiversity: implications for marine protected areas. Diver. Distrib. 20, 284–296. doi: 10.1111/ddi.12134
Rees, M. J., Knott, N. A., Neilson, J., Linklater, M., Osterloh, I., Jordan, A., et al. (2018). Accounting for habitat structural complexity improves the assessment of performance in no-take marine reserves. Biol. Conserv. 224, 100–110. doi: 10.1016/j.biocon.2018.04.040
Rilov, G., Figueira, W. F., Lyman, S. J., and Crowder, L. B. (2007). Complex habitats may not always benefit prey: linking visual field with reef fish behavior and distribution. Mar. Ecol. Prog. Ser. 329, 225–238. doi: 10.3354/meps329225
Risk, M. J. (1972). Fish diversity on a coral reef in the Virgin Islands. Atoll Res. Bull. 153, 1–4. doi: 10.5479/si.00775630.153.1
Rodrigues, D. D. (2010). Habitat associations and behaviour of wrasses of the genus Symphodus (Rafinesque, 1810) at the Arrábida Marine Park, Portugal. Lisbon, Portugal: Faculdade De Ciências Da Universidade De Lisboa.
Royer, J.-P., Nawaf, M. M., Merad, D., Saccone, M., Bianchimani, O., Garrabou, J., et al. (2018). Photogrammetric surveys and geometric processes to analyse and monitor red coral colonies. J. Mar. Sci. Eng. 6:42. doi: 10.3390/jmse6020042
Sala, E., Ballesteros, E., Dendrinos, P., Di Franco, A., Ferretti, F., Foley, D., et al. (2012). The structure of Mediterranean rocky reef ecosystems across environmental and human gradients, and conservation implications. PloS One 7:e32742. doi: 10.1371/journal.pone.0032742
Schultz, A. L., Malcolm, H. A., Bucher, D. J., Linklater, M., and Smith, S. D. (2014). Depth and medium-scale spatial processes influence fish assemblage structure of unconsolidated habitats in a subtropical marine park. PloS One 9:e96798. doi: 10.1371/journal.pone.0096798
Schultz, A. L., Malcolm, H. A., Bucher, D. J., and Smith, S. D. (2012). Effects of reef proximity on the structure of fish assemblages of unconsolidated substrata. PloS One 7:e49437. doi: 10.1371/journal.pone.0049437
Sinopoli, M., Cattano, C., Chemello, R., Timpanaro, A., Milisenda, G., and Gristina, M. (2018). Nest-mediated parental care in a marine fish: Are large-scale nesting habitats selected and do these habitats respond to small-scale requirements? Mediter. Mar. Sci. 19, 248–255. doi: 10.12681/mms.14993
Sinopoli, M., Cattano, C., Chemello, R., Timpanaro, A., Timpanaro, V., and Gristina, M. (2015). Nest building in a Mediterranean wrasse (S ymphodus ocellatus): are the algae used randomly chosen or actively selected? Mar. Ecol. 36, 942–949. doi: 10.1111/maec.12187
Sinopoli, M., Chemello, R., Vaccaro, A., and Milazzo, M. (2017). Food resource partitioning between two sympatric temperate wrasses. Mar. Freshwater Res. 68, 2324–2335. doi: 10.1071/MF16363
Storlazzi, C. D., Dartnell, P., Hatcher, G. A., and Gibbs, A. E. (2016). End of the chain? Rugosity and fine-scale bathymetry from existing underwater digital imagery using structure-from-motion (SfM) technology. Coral Reefs 35, 889–894. doi: 10.1007/s00338-016-1462-8
Thibaut, T., Blanfuné, A., Boudouresque, C. F., Personnic, S., Ruitton, S., Ballesteros, E., et al. (2017). An ecosystem-based approach to assess the status of Mediterranean algae-dominated shallow rocky reefs. Mar. Pollut. Bull. 117, 311–329. doi: 10.1016/j.marpolbul.2017.01.029
Thiriet, P., Cheminée, A., Mangialajo, L., and Francour, P. (2014). “How 3D complexity of macrophyte-formed habitats affect the processes structuring fish assemblages within coastal temperate seascapes?,” in Underwater Seascapes. Cham: Springer, 185–199. doi: 10.1007/978-3-319-03440-9_12
Thiriet, P. D., Di Franco, A., Cheminée, A., Guidetti, P., Bianchimani, O., Basthard-Bogain, S., et al. (2016). Abundance and diversity of crypto-and necto-benthic coastal fish are higher in marine forests than in structurally less complex macroalgal assemblages. PloS One 11:e0164121. doi: 10.1371/journal.pone.0164121
Troisi, S., Del Pizzo, S., Gaglione, S., Miccio, A., and Testa, R. L. (2015). 3D Models Comparison of Complex Shell in Underwater and Dry Environments. Int. Arch. Photogr. Remote Sens. Spatial Inform. Sci.An error in the conversion from LaTeX to XML has occurred here. XL, 215–222. doi: 10.5194/isprsarchives-XL-5-W5-215-2015
Urbina-Barreto, I. (2020). Nouveaux indices quantitatifs pour le suivi des récifs coralliens issus de modélisation 3D par photogrammétrie. Réunion: Université de La Réunion.
Ventura, D., Dubois, S. F., Bonifazi, A., Jona Lasinio, G., Seminara, M., Gravina, M. F., et al. (2020). Integration of close-range underwater photogrammetry with inspection and mesh processing software: a novel approach for quantifying ecological dynamics of temperate biogenic reefs. Remote Sens. Ecol. Conserv. 7, 169–186. doi: 10.1002/rse2.178
Verges, A., Vanderklift, M. A., Doropoulos, C., and Hyndes, G. A. (2011). Spatial patterns in herbivory on a coral reef are influenced by structural complexity but not by algal traits. PloS One 6:e17115. doi: 10.1371/journal.pone.0017115
Vigliola, L., Harmelin-Vivien, M. L., Biagi, F., Galzin, R., Garcia-Rubies, A., Harmelin, J.-G., et al. (1998). Spatial and temporal patterns of settlement among sparid fishes of the genus Diplodus in the northwestern Mediterranean. Mar. Ecol. Prog. Ser. 168, 45–56. doi: 10.3354/meps168045
Willis, S. C., Winemiller, K. O., and Lopez-Fernandez, H. (2005). Habitat structural complexity and morphological diversity of fish assemblages in a Neotropical floodplain river. Oecologia 142, 284–295. doi: 10.1007/s00442-004-1723-z
Keywords: habitat complexity, rugosity, metrics, photogrammetry, benthic fishes, efficiency, repeatability, Mediterranean Sea
Citation: Monfort T, Cheminée A, Bianchimani O, Drap P, Puzenat A and Thibaut T (2021) The Three-Dimensional Structure of Mediterranean Shallow Rocky Reefs: Use of Photogrammetry-Based Descriptors to Assess Its Influence on Associated Teleost Assemblages. Front. Mar. Sci. 8:639309. doi: 10.3389/fmars.2021.639309
Received: 08 December 2020; Accepted: 22 June 2021;
Published: 19 July 2021.
Edited by:
Will F. Figueira, The University of Sydney, AustraliaReviewed by:
Mauro Sinopoli, Stazione Zoologica Anton Dohrn Napoli, ItalyValeriya Komyakova, Norwegian Institute of Marine Research (IMR), Norway
Copyright © 2021 Monfort, Cheminée, Bianchimani, Drap, Puzenat and Thibaut. This is an open-access article distributed under the terms of the Creative Commons Attribution License (CC BY). The use, distribution or reproduction in other forums is permitted, provided the original author(s) and the copyright owner(s) are credited and that the original publication in this journal is cited, in accordance with accepted academic practice. No use, distribution or reproduction is permitted which does not comply with these terms.
*Correspondence: Adrien Cheminée, YWRyaWVuLmNoZW1pbmVlQHNlcHRlbnRyaW9uLWVudi5jb20=
†These authors have contributed equally to this work