 Stephanie M. Heyworth1
 James B. Bell2
 Christopher M. Wade3
 Geórgenes Cavalcante4,5
 Nicholas Robinson6
 Emma Young7
 James Glass8
 David A. Feary1*
- 1MRAG Ltd., London, United Kingdom
- 2Centre for Environment, Fisheries and Aquaculture Science, Lowestoft, United Kingdom
- 3School of Life Sciences, University of Nottingham, Nottingham, United Kingdom
- 4Department of Biology, Chemistry and Environmental Sciences, College of Arts and Sciences, American University of Sharjah, Sharjah, United Arab Emirates
- 5Institute of Atmospheric Sciences, Federal University of Alagoas, Maceió, Brazil
- 6Breeding and Genetics, Nofima, Norway and School of Biological Sciences, The University of Melbourne, Parkville, VIC, Australia
- 7British Antarctic Survey, Cambridge, United Kingdom
- 8Department of Fisheries, Tristan da Cunha, United Kingdom
Quantifying the level of population connectivity within and between geographically separated single-species deep-water fisheries stocks will be vital for designing effective management plans to preserve such populations. Despite this, stock structure in many fisheries is still poorly described and, at best, subject to precautionary management. Here we use rapidly evolving mitochondrial genes and microsatellite markers to investigate population connectivity patterns in commercially targeted Hyperoglyphe antarctica populations between four seamounts within the Tristan da Cunha Exclusive Economic Zone (EEZ). We find little evidence of population genetic structure between fished populations, with both mtDNA and microsatellite markers showing that there is low genetic population diversity (reflecting substantial gene flow) across the four seamounts. We also find little genetic differentiation between H. antarctica across the wider Southern Hemisphere. Such results support the role for coordinated management of all four populations across the seamounts, and potentially including stocks associated with Australia and New Zealand, with expansion of the fishery clearly having the potential to substantially impact the source of recruits and therefore wider population sustainability.
Introduction
The physical and biological processes intrinsic to seamount systems may serve to connect or isolate associated populations, stimulate or maintain genetic divergence, and structure local and regional species diversity (Shank, 2010). Increasing interest in understanding such processes has resulted in a range of studies examining the large variety of interconnected mechanisms that promote or impede genetic connectivity of seamount communities (Auscavitch et al., 2020; Liu et al., 2020). Despite this, the conclusions of these studies are largely inconsistent, reflecting differences in the ecological, oceanographic, and evolutionary context of individual seamount systems (Rowden et al., 2010; Zeng et al., 2020). However, quantifying the connectivity of seamount populations and their diverse ecosystems, which are potentially vulnerable to destructive fisheries and mining practices, will be vital for understanding the ecological structure of seamount communities (Shank, 2010). Such an understanding of connectivity is important to understand the function of these systems, enabling direct sustainable management (outcomes) to ensure the continuity of seamount biological diversity and the resources they encompass (Pitcher et al., 2007).
There is increasing evidence of anthropogenic-induced impacts to deep-sea populations (Armstrong et al., 2019; Da Ros et al., 2019). Most importantly, fishing has resulted in stock depletions of a range of species, with the reduction of mature individuals having potential indirect effects on the likelihood of population connectivity characterized by larval migration and movement of individuals between deep-sea habitats (Vieira et al., 2019). Such impacts on connectivity may reduce effective population size, genetic diversity and population resilience to further impacts associated with increasing climate changes. The wider role of such changes may then potentially result in local or regional population declines, while also impacting the long term recovery of exploited populations (Cowen et al., 2007). Despite this, we still understand little of the connectivity of deep-sea fisheries species, especially those associated with specific habitats (e.g., seamounts). As such resources are now being increasingly targeted, there is a dire need to quantify population structure and potential resilience to fishing effects.
Hyperoglyphe antarctica (Family Centrolophidae), commonly known as the bluenose warehou, is a commercially important temperate water species, with a widespread distribution throughout the southern hemisphere (McDowall, 1982). This species has been recorded throughout the waters of the majority of major landmasses within the Southern Ocean, with populations identified in South Africa, Southern Australia (including Tasmania), New Zealand and Tristan da Cunha (McDowall, 1982). This species is considered as a deep-water, semi-pelagic species (Horn, 2003). Juveniles will utilize surface waters, sheltering within jellyfish and flotsam (Haedrich, 1967; Horn, 1970; Horn and Massey, 1989), feeding on hydroids, salps, ctenophores, fish fry, small crustaceans, squids and a variety of pelagic molluscs (Horn and Massey, 1989; Horn, 2003). Juveniles undertake an extended period of oceanic dispersal, with strong potential for broad-scale dispersal and self-supply of recruits (Williams et al., 2017), recruiting into the rough, rocky ground of continental shelves, upper slope waters and seamounts at ~2 years old (35–50 cm total length) (McDowall, 1982; Horn and Massey, 1989; Duffy et al., 2000; Bell et al., 2021). Hyperoglyphe antarctica adults are benthopelagic, with individuals undertaking mid-water migration for feeding or reproduction at night (Horn and Massey, 1989; Horn, 2003). Although tagging of individuals has shown that such individuals are able to migrate large distances (Horn, 2003), recent work has found that adult stocks may show limited movement away from post-settlement habitat, and therefore the existence of discrete adult sub-populations (Williams et al., 2017).
The structure of regional H. antarctica stocks (predominantly within New Zealand and Australia) has been examined using both morphological and genetic methods. All work has found evidence for population panmixia and lack of stock structure (Horn and Massey, 1989; Bolch et al., 1993; Horn, 2003; Hindell et al., 2005; Robinson et al., 2008; Williams et al., 2017), likely associated with geographically distant populations showing high levels of population mixing due to high individual dispersal at the settlement stage. Despite this, within the Tristan da Cunha Exclusive Economic Zone (TdC EEZ), where a sporadic fishery for H. antarctica at four seamounts has occurred since 1997, there is no understanding of the genetic diversity inherent within fished populations. In managing this fishery, there is still little ability to quantify the likely impacts of activities on the resilience and long-term sustainability of populations (Bell et al., 2021). Quantifying the level of population connectivity between these geographically separated single-species fisheries stocks will therefore be vital in understanding the potential for ecologically divergent populations, and designing effective management plans to preserve such populations. In determining the genetic connectivity of H. antarctica stocks within Tristan da Cunha, in line with the likely high level of panmixia apparent in other geographically separated H. antarctica stocks (Horn, 2003; Robinson et al., 2008), we hypothesize that populations will show high levels of connectivity, and likely little population structure. We also examine the genetic connectivity of H. antarctica populations across the Southern Ocean, and hypothesize high levels of connectivity, and low levels of genetic diversity between populations.
Materials and Methods
Single dorsal muscle samples from 140 H. antarctica individuals across four seamounts [Crawford (CN) (n = 35), Yakhont (YK) (n = 33), R.S.A (RS) (n = 36), and McNish (MN) (n = 36)] were collected by Cefas and the Tristan da Cunha Fisheries Department within the TdC EEZ (Figure 1). Samples were frozen and transported to University of Nottingham laboratories.
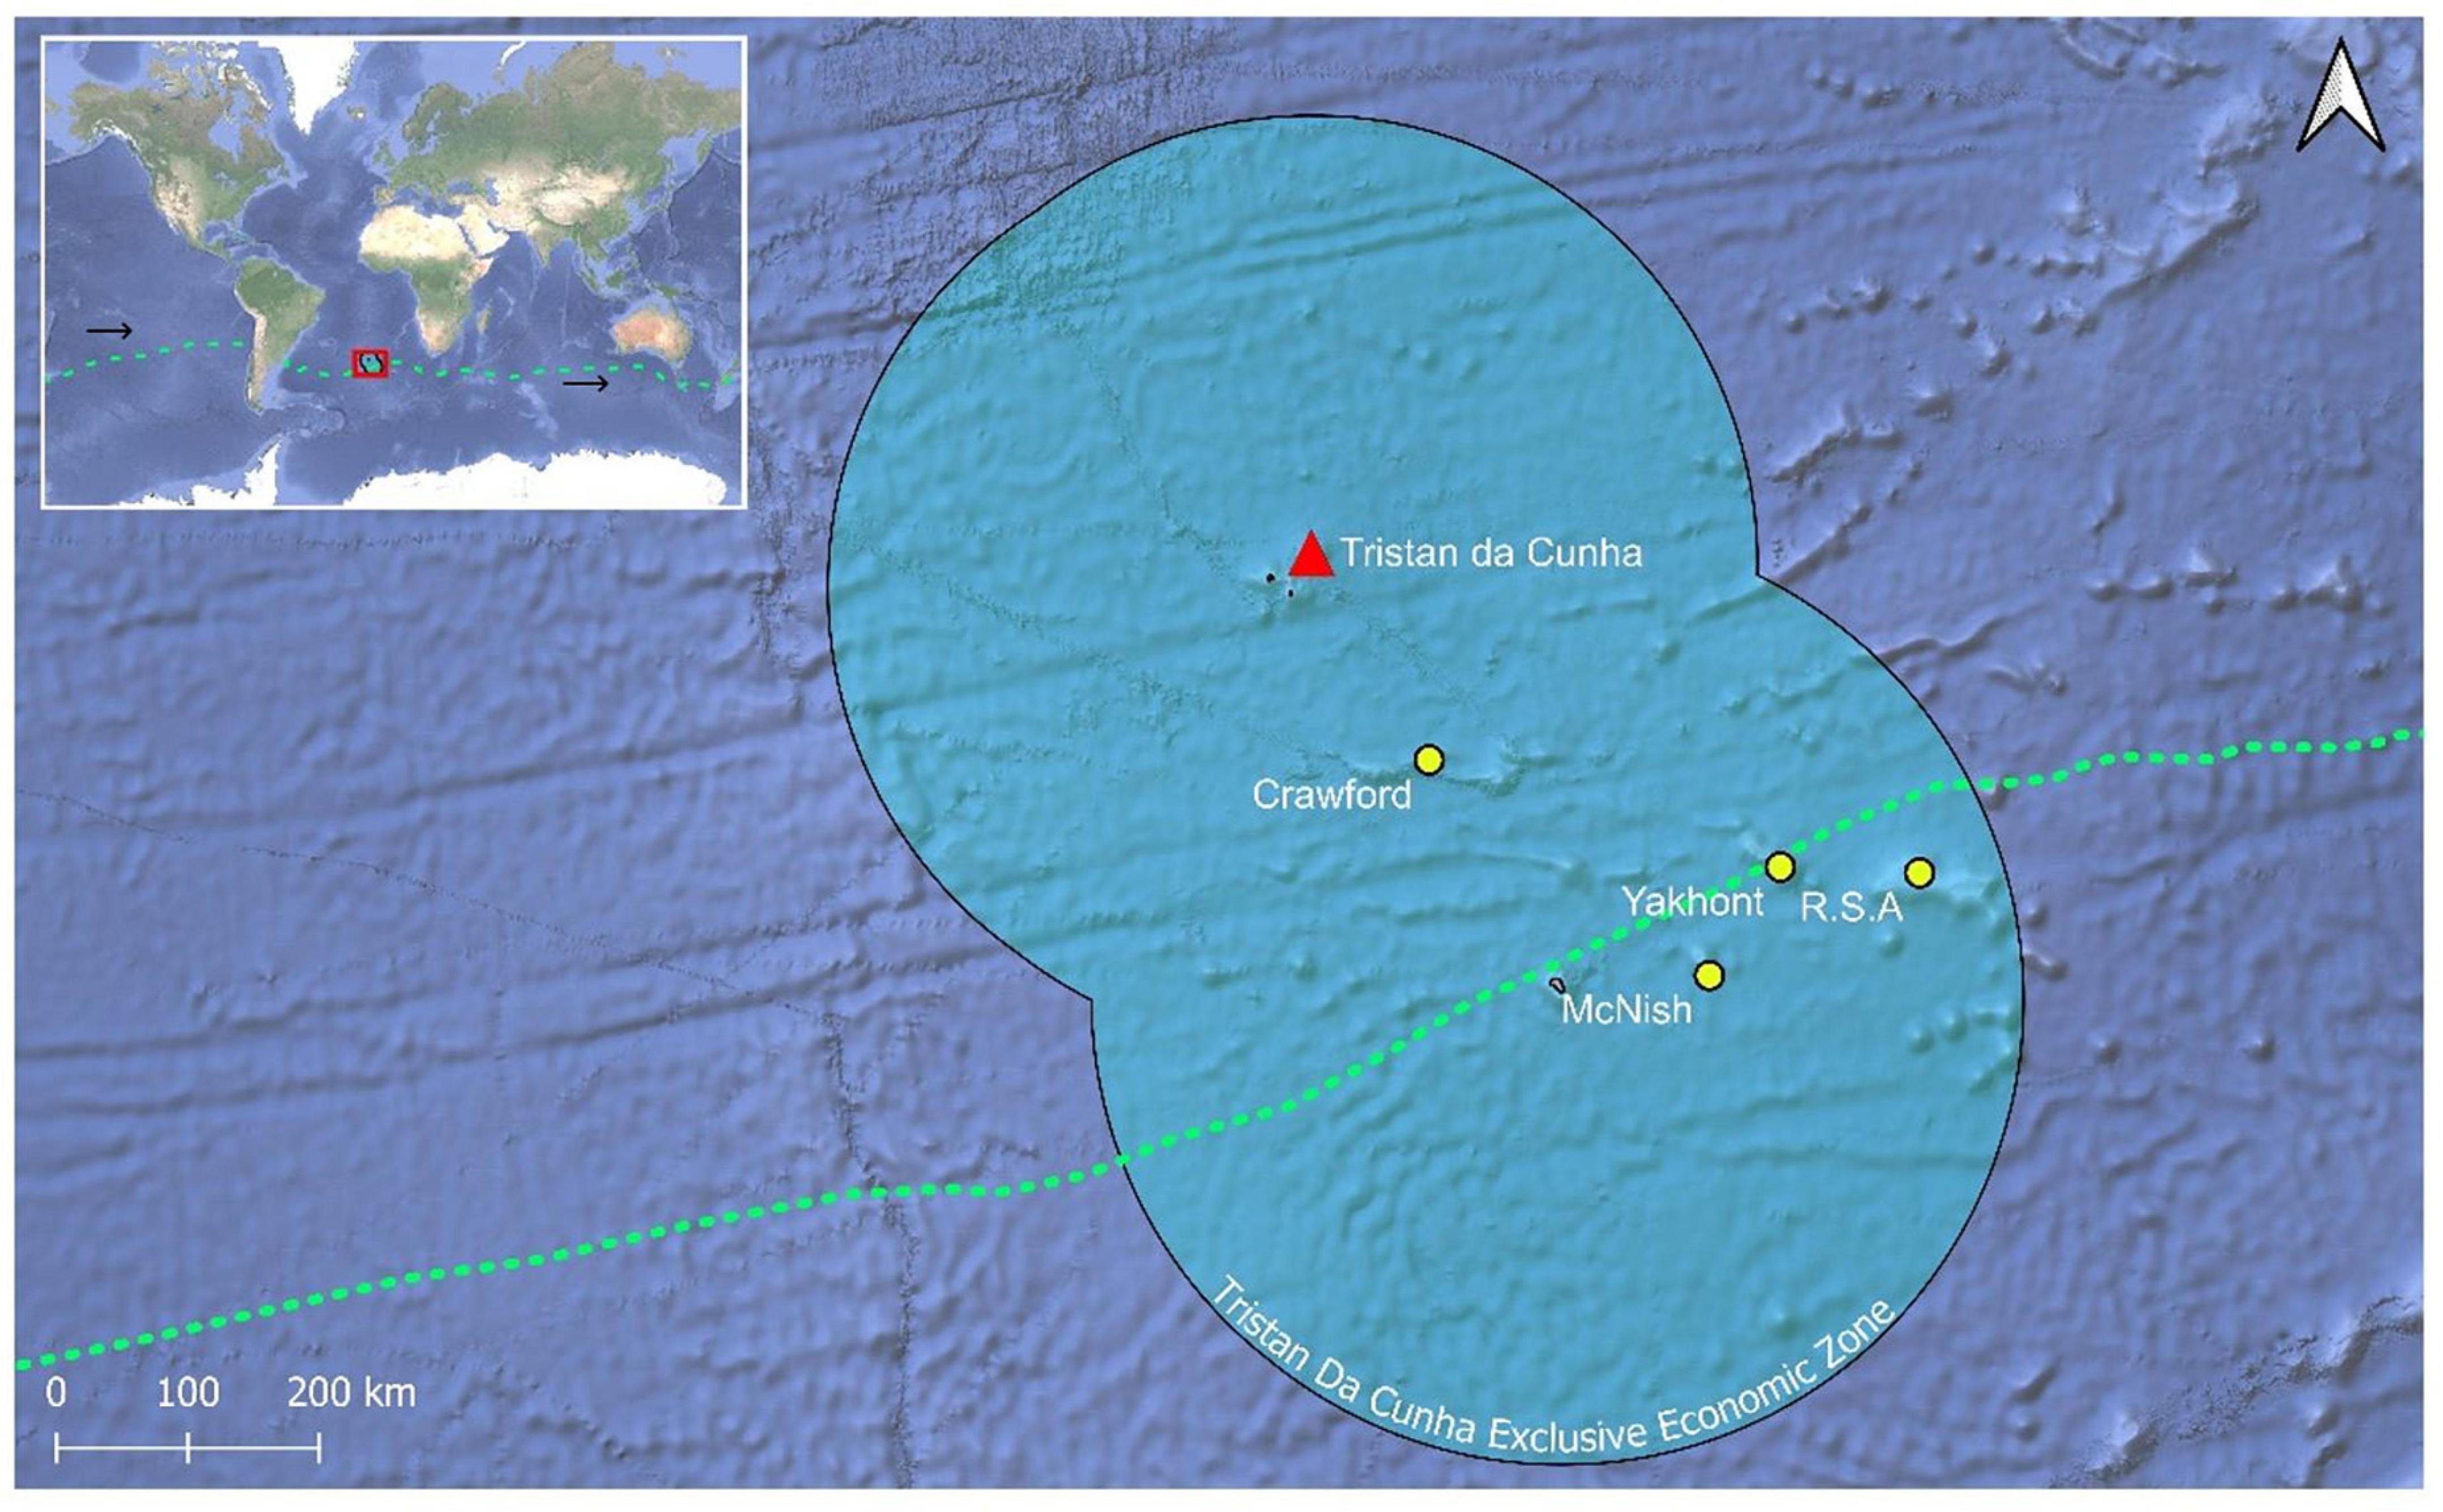
Figure 1. Map of sampled seamounts within the Tristan da Cunha EEZ. The green dashed line represents the approximate mean position of the southern subtropical front (SSTF) following Orsi et al. (1995); the latitude of the SSTF migrates seasonally by ∼2.5° in the Tristan da Cunha region. The black arrows demonstrate the direction of flow. The EEZ shapefile was obtained from Flanders Marine Institute (2019). The satellite map file was obtained from Google (n.d.).
Mitochondrial DNA Amplification and Population Assessment Within Tristan da Cunha
To determine the connectivity of the four sampled H. antarctica within TdC EEZ, DNA was extracted from each sample using QIAGEN DNeasy Blood and Tissue Kits (ID: 69504) following the standard protocol. To amplify mitochondrial DNA, polymerase chain reactions (PCRs) were conducted using Bioline MyTaqTM polymerase (BIO-21105) reaction mixtures in combination with primers FishF1/FishR1 (Ward et al., 2005) and CR-e/CR-a (Lee et al., 1995) to amplify cytochrome c oxidase subunit I [COI; 616 base pairs (bp)] and control region (CR; 361 bp), respectively. PCR conditions were an initial denaturation stage of 95°C (120 s) followed by 35 cycles of 94°C (30 s), 56°C (30 s), and 72°C (60 s), with a final elongation of 72°C (600 s). To identify potential contamination, a negative control containing only reaction mixture components was included alongside the samples in each amplification. PCR products were visualized on a 1.5% agarose gel and amplified samples were sent to Macrogen Europe for purification and Sanger sequencing using an Applied Biosystems 3730XL analyser. Sequences were aligned using Seaview version 4.7 (Gouy et al., 2010) and the CO1 and CR sequences were concatenated for 129 individuals. A maximum likelihood (ML) phylogenetic tree was constructed in PhyML version 3.1 (Guindon et al., 2010) using the concatenated COI and CR sequences and employing a general time reversible model of evolution incorporating gamma correction with 1,000 bootstrap replicates (Guindon et al., 2010). In addition, a median joining haplotype network was generated for the concatenated alignment using PopART (Leigh and Bryant, 2015).
Genetic diversity within the four sampled populations was estimated by computing haplotype diversity (h) and nucleotide diversity (π) in DnaSP6 (Rozas et al., 2017). Pairwise distances between individuals and the subsequent mean pairwise distances (p) within, and between populations were calculated using PAUP∗ (Swofford, 2003). The genetic difference between clusters was measured by the fixation index (Fst) using DnaSP (Rozas et al., 2017), with pairwise FST calculated in Arlequin version 3.5 (Excoffier and Lischer, 2010), p-values were corrected in R using the “p.adjust” function from the “stats” package; the Bonferroni method was selected (R Core Team, 2021). The nearest-neighbor statistic (Snn) was calculated between populations using DnaSP (Rozas et al., 2017). P-values were obtained by the permutation test with 10,000 replicates (p < 0.05 used).
Tajima’s D and Fu’s F analyses were conducted in Arlequin version 3.5 (Excoffier and Lischer, 2010) to assess historical demographic changes within the seamount and greater Tristan da Cunha populations. Following both a population expansion and spatial expansion model (Rogers and Harpending, 1992; Excoffier, 2004) Arlequin version 3.5 (Excoffier and Lischer, 2010) was used to conduct a mismatch distribution analysis to allow for demographic inference. Deviation from these models was tested using the sum of squared deviations and the Raggedness Index.
Microsatellite Development and Analysis
DNA extracted from five individuals was pooled to create a genomic library using the Roche KAPA HyperPrep kit (KK8500). The library was used for whole genome sequencing using paired-end reads of 150 base pairs (Illumina Hiseq 2500). Following sequencing, reads containing adapters, reads containing >5% bases that could not be determined, and reads with low quality (Qscore ≥ 10; over 20% of the total number of bases) were removed. Candidate microsatellite marker regions were then identified that had repeat units of 2–6 base pairs with ≥5 repeats (SSRHunter 1.3) (Li and Wan, 2005). Twelve primer pairs were successfully developed for the identified microsatellite marker regions (Supplementary Table 1). PCR using the Takara Bio Premix TaqTM Hot Start Version (R028A) was utilized. To amplify the microsatellite regions of 100 randomly selected H. antarctica samples, PCRs were conducted under optimized thermocycling conditions [1 cycle of 95∘C for 900 s, 30 cycles of (94∘C for 30 s, 56∘C for 30 s, 72∘C for 30 s) followed by 10 cycles of (94∘C for 30 s, 53∘C for 30 s, 72∘C for 30 s)] ending with a final, single cycle of 60°C for 1,800 s. Amplified products were assessed using agarose gel electrophoresis, with targeted bands then selected and detected using a 3730XL DNA analyzer. Traces were analyzed to identify the size of the alleles present at each marker on each chromosome from each individual. The size of the allele (in base pairs) was recorded and utilized for further analysis.
To investigate genetic diversity within each of the four sampled populations, the number of alleles (A) and allelic richness (Ar) at each microsatellite locus were calculated using the PopGenReport package (Adamack and Gruber, 2014; Gruber and Adamack, 2015; RStudio Team, 2015). As a measure of genetic variability within populations, we examined whether there was a significant deviation from the Hardy-Weinberg Equilibrium (HWE) in both observed (Ho) and expected (He) heterozygosity (PopGenReport package: Adamack and Gruber, 2014; Gruber and Adamack, 2015; RStudio Team, 2015), while the potential deficiency in heterozygotes [inbreeding coefficient (FIS)], and gene diversity [Nei’s genetic diversity (hs)] were analyzed within Fstat (Goudet, 2003).
To identify signatures of gene flow mechanisms (i.e., inbreeding) within the greater Tristan da Cunha population, Weir and Cockerham’s (1984) F-statistics (FIT, FST, and FIS) were calculated using the PopGen package in R, grouping all individuals as one population (Adamack and Gruber, 2014; Gruber and Adamack, 2015; RStudio Team, 2015). In addition, to examine differentiation in genetic structure between seamount populations, pairwise Wright’s F-statistics (FSTs) were calculated between each population using Arlequin. Within this analysis, 10,000 permutations and a significance level of p < 0.05 were utilized (Excoffier and Lischer, 2010). An Analysis of Molecular Variance (AMOVA) was conducted (Arlequin v3.5) to further confirm whether genetic differentiation was more likely associated with variation within or between seamount populations (Excoffier and Lischer, 2010). The statistical power of the microsatellite data set was assessed using POWSIM version 4.1 (Ryman and Palm, 2016). Power for a range of FST values was investigated by varying drift (t) from 2 to 51 whilst maintaining the value for population size (Ne) at 1,000. POWSIM settings were set to 1,000 dememorizations, 100 batches and 1,000 iterations per batch. As in Knutsen et al. (2015) the proportion of significant outcomes (p < 0.05) for the range of FSTs calculated were interpreted as the power of the tests for detecting the defined level of genetic divergence. In order to allow visualization of the inferred genetic relationships between individuals sampled, pairwise Nei’s standard genetic distances were calculated (using allele data in Genepop format), with a Neighbor Joining tree then constructed (with 1,000 bootstrap replicates) in Populations version 1.2.31 (Langella, 2002). Discriminant analysis of principal components (DAPC) was conducted in R using the adegenet package version 1.3-1 (Jombart and Ahmed, 2011) to further clarify the greater population structure and identify if individuals from the same seamounts clustered together.
Population Assessment of H. antarctica Across the Southern Ocean
To examine the wider connectivity of H. antarctica populations, 130 CR sequences from the present study were assessed against CR sequences from 400 H. antarctica individuals previously collected within New Zealand and Australian waters (encompassing the “Southern and Eastern Scalefish and Shark Fishery (SESSF),” see detail in Robinson et al., 2008). All 530 sequences were aligned in SeaView and cropped to allow analysis of overlapping regions (204 bp).
To allow for investigation of relationships between individuals of different populations, a ML tree with 1,000 bootstrap replicates was generated in PhyML version 3.1 (Guindon et al., 2010) using all CR sequences and employing a general time reversible model of evolution incorporating gamma correction. To allow generation of a median joining haplotype network, the original alignment was imported into DnaSP6 and used to generate a haplotype data file (Nexus format) (Rozas et al., 2017). This file was edited to add trait data (seamounts and GPS coordinates), and a Median Joining Network generated (Epsilon = 0) using PopART (Leigh and Bryant, 2015). To assess the genetic structure between populations, a haplotype data file was exported in Arlequin format and pairwise FST values calculated in Arlequin version 3.5 (Excoffier and Lischer, 2010).
Results
Population Structure Within the TdC EEZ
The concatenated mitochondrial sequences demonstrated there was no clear phylogeographic structure between the four fished populations of H. antarctica within the TdC EEZ. The unrooted ML tree highlighted the lack of phylogeographic structure, with the clustering of individuals from different seamount populations (Figure 2). Consistently low pairwise inter-individual distances (d), ranging between 0.000 and 0.012 were calculated, with a mean pairwise distance between all individuals of d = 0.00616 (±0.00310). Mean pairwise values between- and within- the assumed Tristan da Cunha seamount populations were consistently low, and similar, ranging from 0.00584 to 0.00649 and 0.00546 to 0.00652, respectively. The low genetic distances were emphasized by the short branch lengths on the unrooted ML tree, with low genetic distance between individuals both within and between the four populations and with extremely short branch lengths (all ≤ 0.0061).
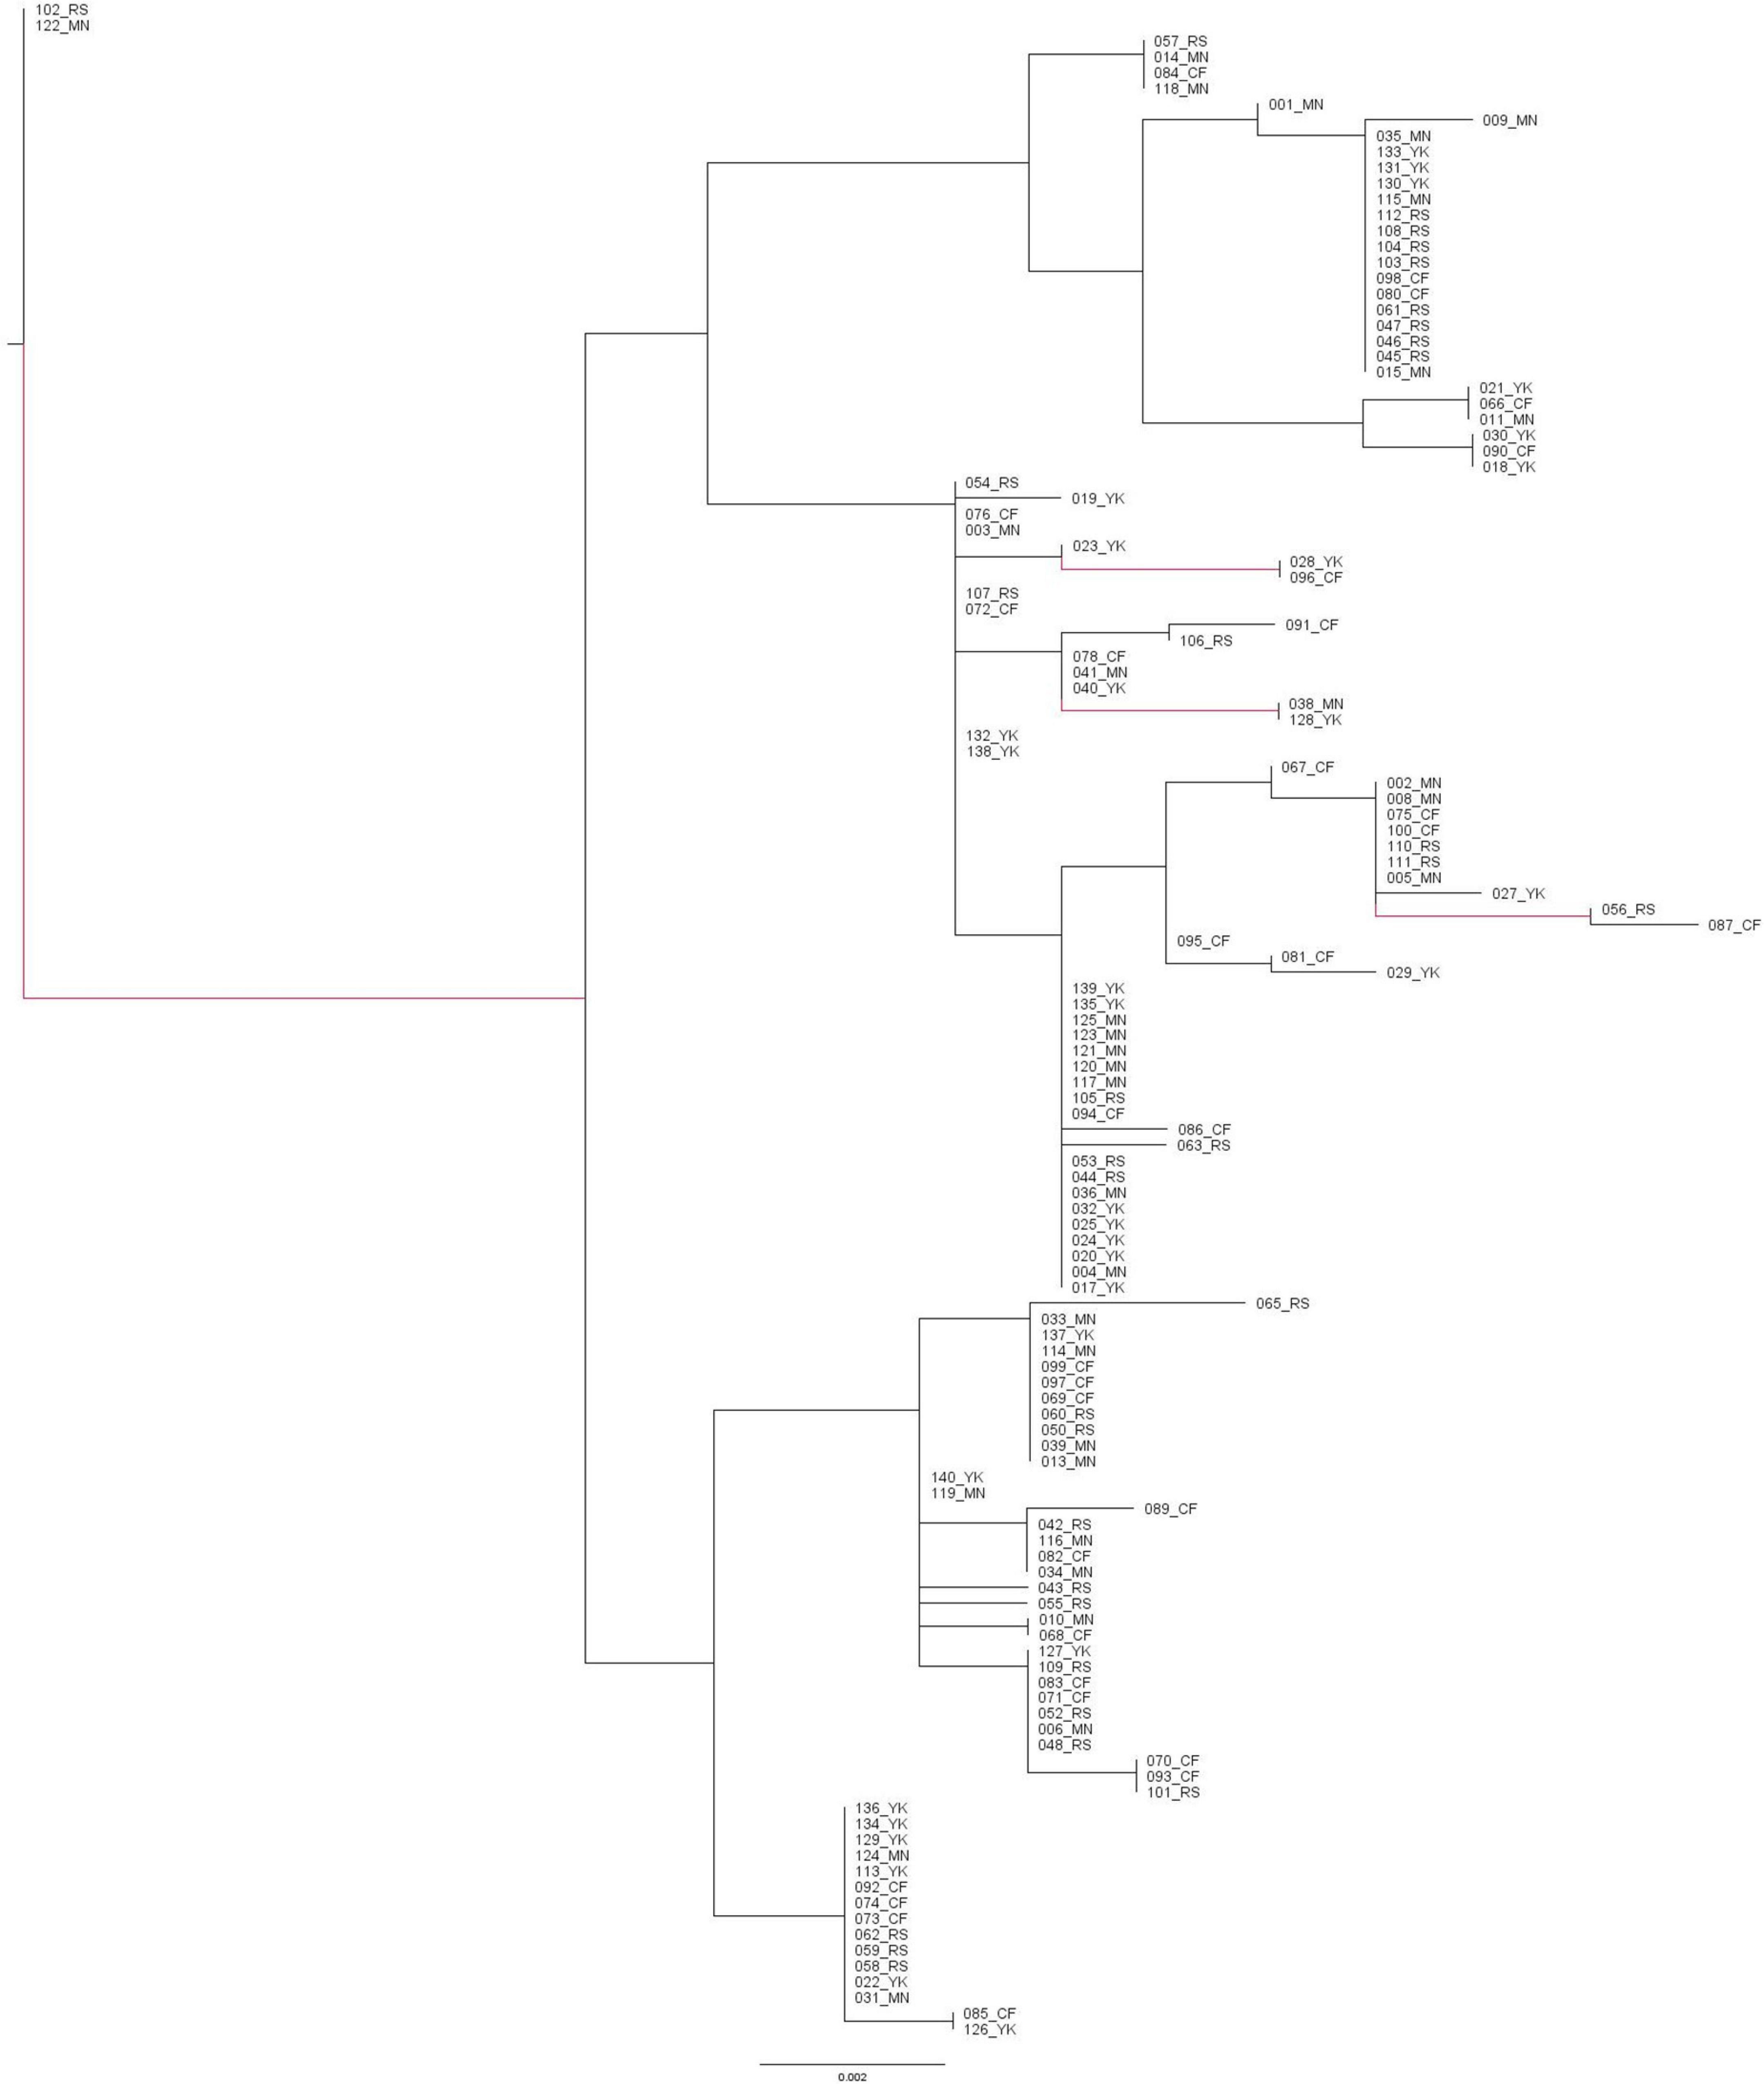
Figure 2. Unrooted Maximum Likelihood phylogenetic tree built from concatenated sequences of the mitochondrial COI and CR demonstrating the minimal genetic distances and clustering of individuals from different seamount populations within the Tristan da Cunha EEZ. The scale bar represents a genetic distance of 0.002. Branches in red are supported by >70% of bootstrap replicates. CF, Crawford; YK, Yakhont; RS, R.S.A.; MN, McNish.
Haplotypes predominantly differed by between one and two nucleotide changes, further demonstrating the low level of genetic variation within and between the populations of H. antarctica. In total 38 haplotypes were identified, though there was a substantial proportion of shared haplotypes between seamounts; over 50% of haplotypes were shared between at least 2 seamounts, and 6 out of 38 were identified to be present at every seamount. However, there were a number of unique haplotypes (n = 19), where a single haplotype was found in a single individual within a specific seamount (Figure 3). The seamount with the highest number of unique haplotypes was CN, with 7 out of the 38 haplotypes identified appearing only on that seamount, in 1 individual, while MN held the lowest number of unique haplotypes (two).
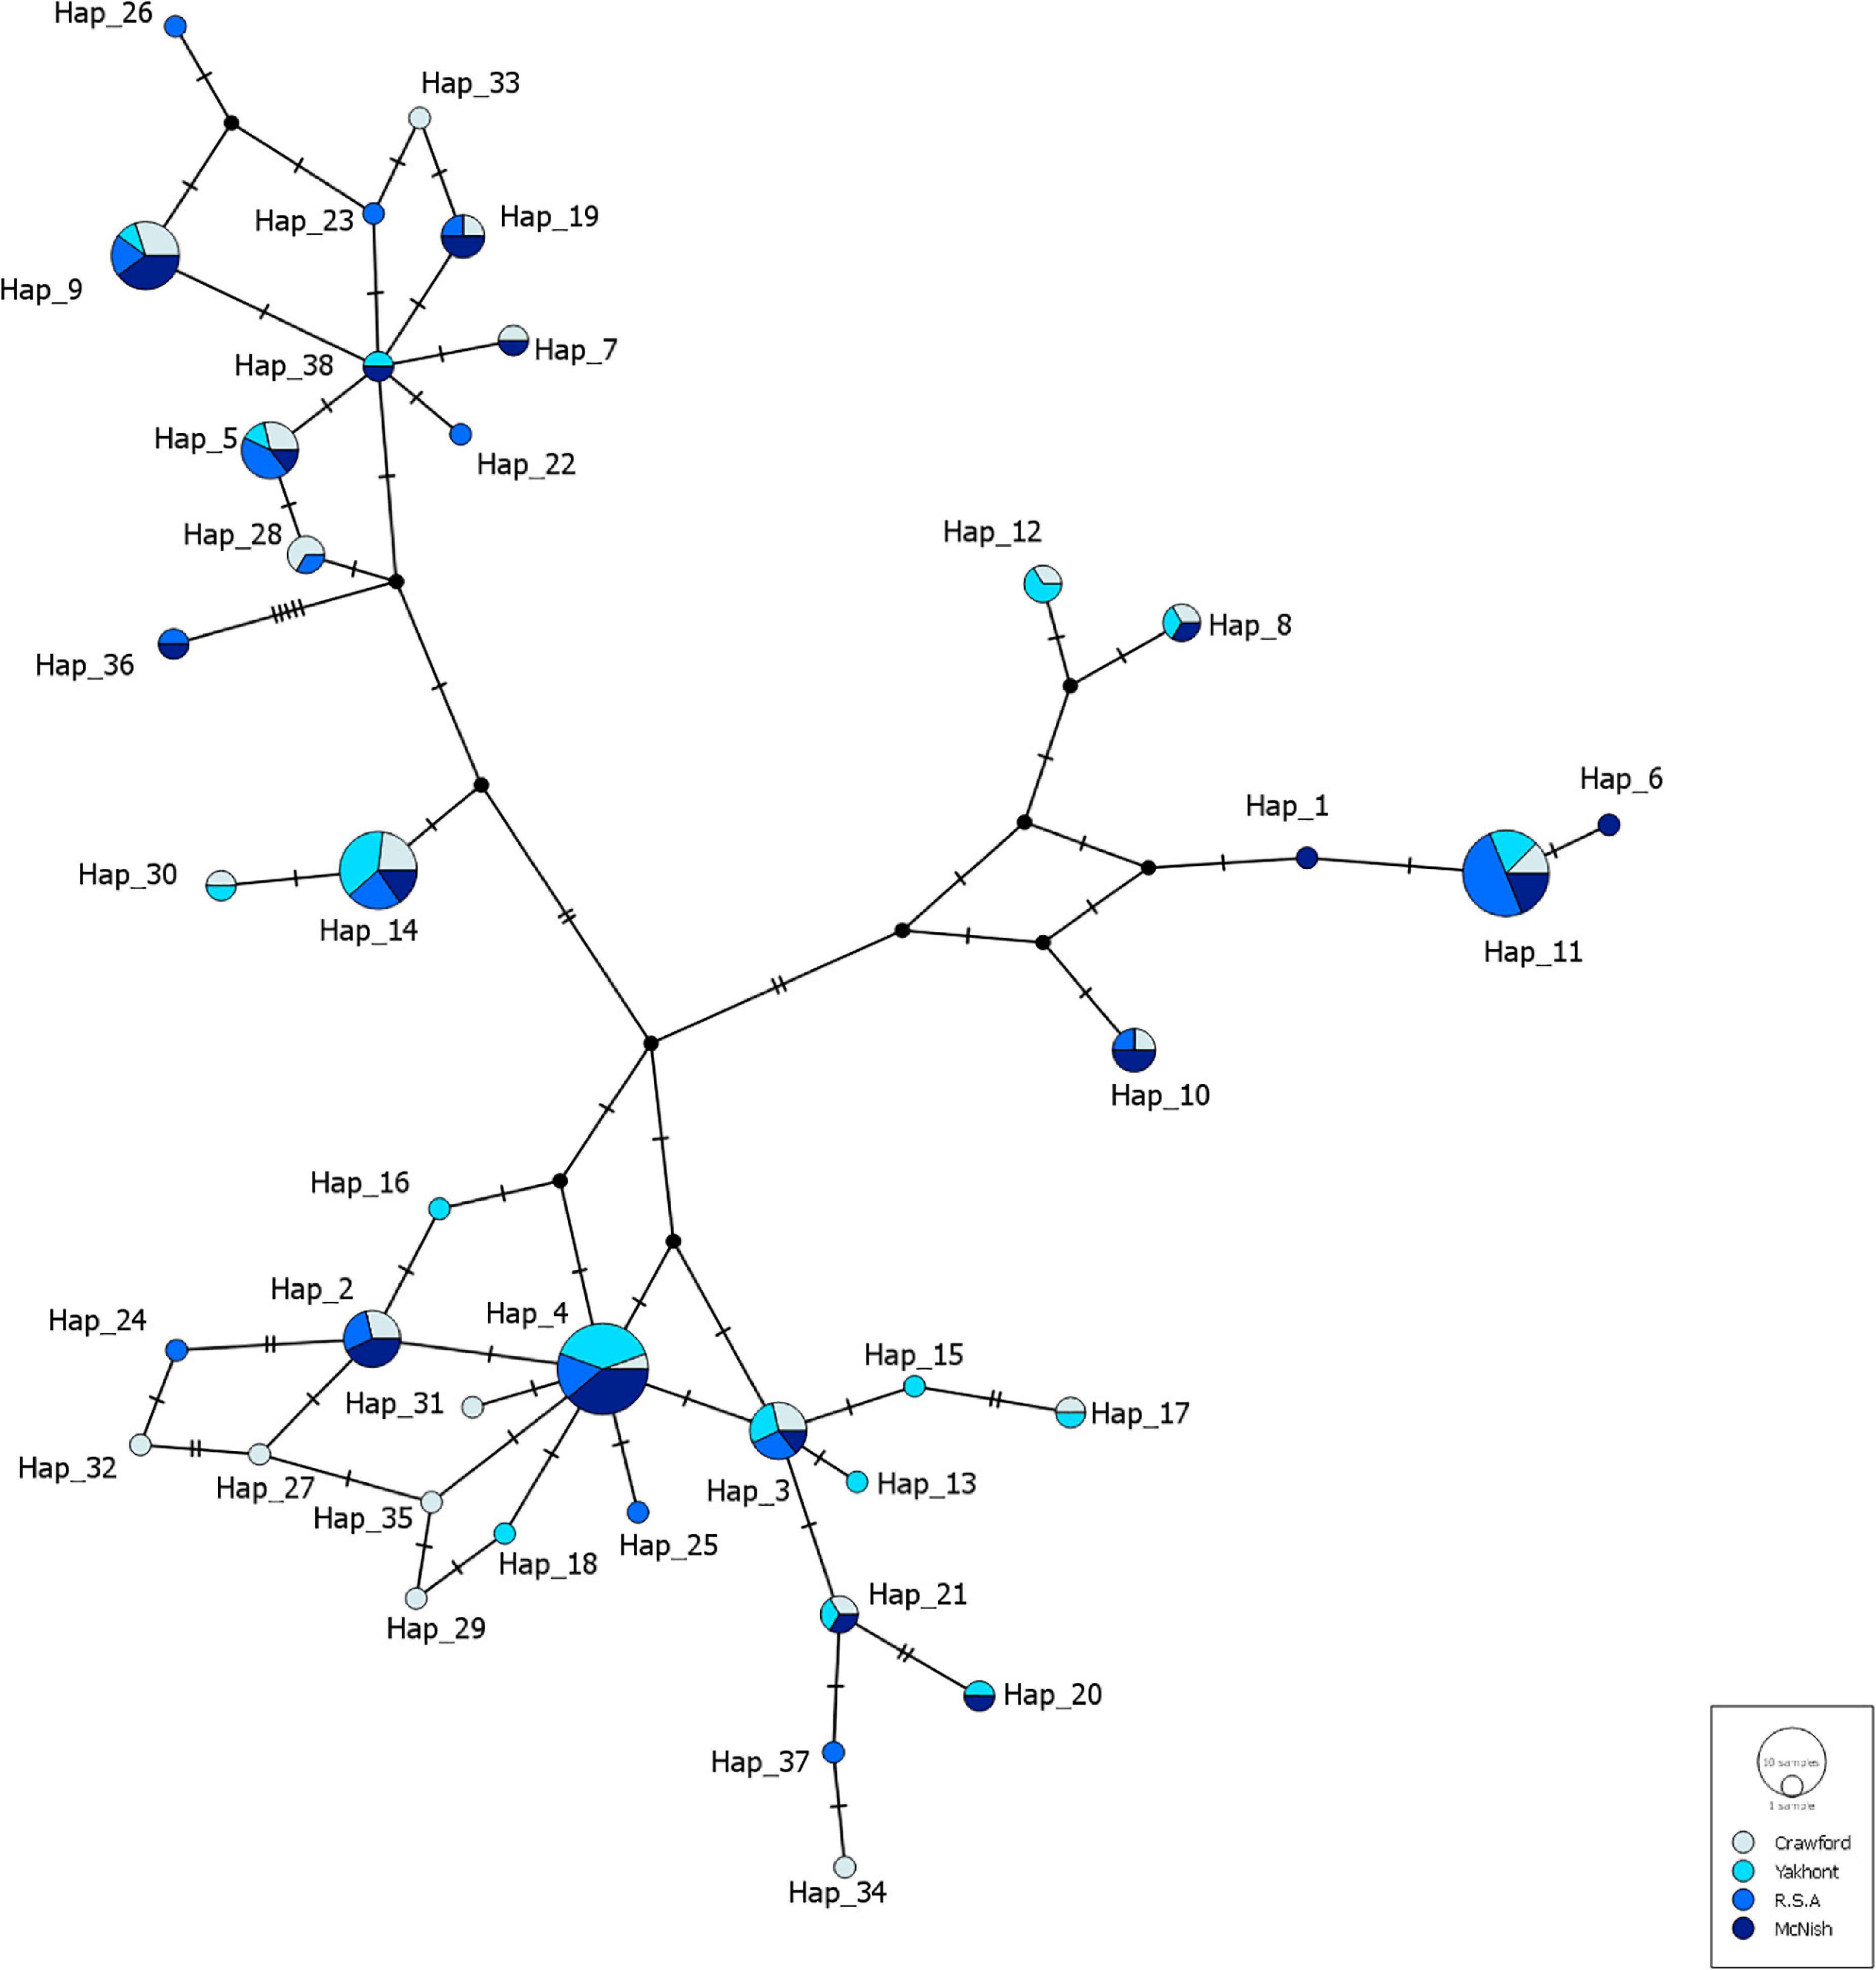
Figure 3. A median joining haplotype network generated using concatenated sequences from COI and CR from individuals of Hyperoglyphe antarctica collected from four seamounts within the Tristan da Cunha EEZ. Each small, perpendicular line on the branches between haplotypes in the network demonstrates one change in the nucleotide sequence. Small black nodes indicate hypothesized haplotypes, multi-color pie charts indicate shared haplotypes, while solid, colored circles indicate unique haplotypes.
Although multiple haplotypes of the concatenated, mitochondrial H. antarctica sequence studied were identified, the differences between the haplotypes were minimal (i.e., restricted to a few nucleotide sites). This suggests high sequence conservation and close relationships between different seamount populations. In parallel, the degree of haplotype diversity was high across all seamounts (h values ranging between 0.92 and 0.98). The greatest number of haplotypes (n = 23) and the highest levels of haplotype diversity (h = 0.98) were found at CN. By contrast, there was a low level of nucleotide diversity across all sequences (π = 0.00616), indicating that on average only 0.616% of nucleotides differ between nucleotide sites within all the samples. Intra-population nucleotide diversity levels ranged from π = 0.00546 (YK) to 0.00652 (R.S.A), while inter-population nucleotide diversity levels ranged between π = 0.00582 (between YK and MN) and π = 0.00648 (between CN and R.S.A).
Low FST values (Table 1) and the lack of significant differentiation (following the Bonferroni correction) between any population pairs further supported the concept of panmixia between populations.
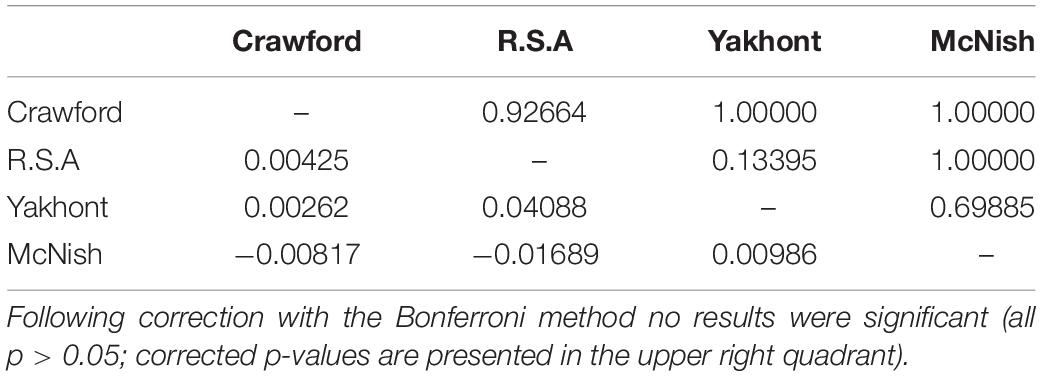
Table 1. FST results (lower left quadrant) and Bonferroni corrected p-values (upper right quadrant) for pairwise population comparisons (10,000 permutations) of concatenated sequences of the mitochondrial cytochrome c oxidase subunit I and control region.
AMOVA showed no significant differentiation between populations, with almost 100% of genetic variation deriving from intra-population differences (99.49%). In addition, the Snn value for differentiation between individuals was 0.19678 (p > 0.05), indicating no significant differentiation between populations. Furthermore, inter-population values ranged between 0.41702 and 0.52396, with no significant differentiation (p > 0.05).
No significant values were obtained for Tajima’s D (Table 2). Two significant, negative values for Fu’s F were obtained for the seamount populations at YK and CN. The mean Tajima’s D and Fu’s F results for the greater Tristan da Cunha population were both non-significant. The mismatch analysis’ model of demographic expansion was rejected for the seamount populations at MN and R.S.A (p < 0.05) (Table 2). The seamount population at R.S.A also demonstrated a significant value for Raggedness. No significant deviations from the spatial expansion model [for sum of square deviations (SSD), or Raggedness] were obtained for any of the seamount populations, or the greater Tristan da Cunha population (Table 2). Recent population expansion (within the last 0.05 million years) was evident in all four seamount populations as per the Extended Bayesian Skyline Analysis (Figure 4).
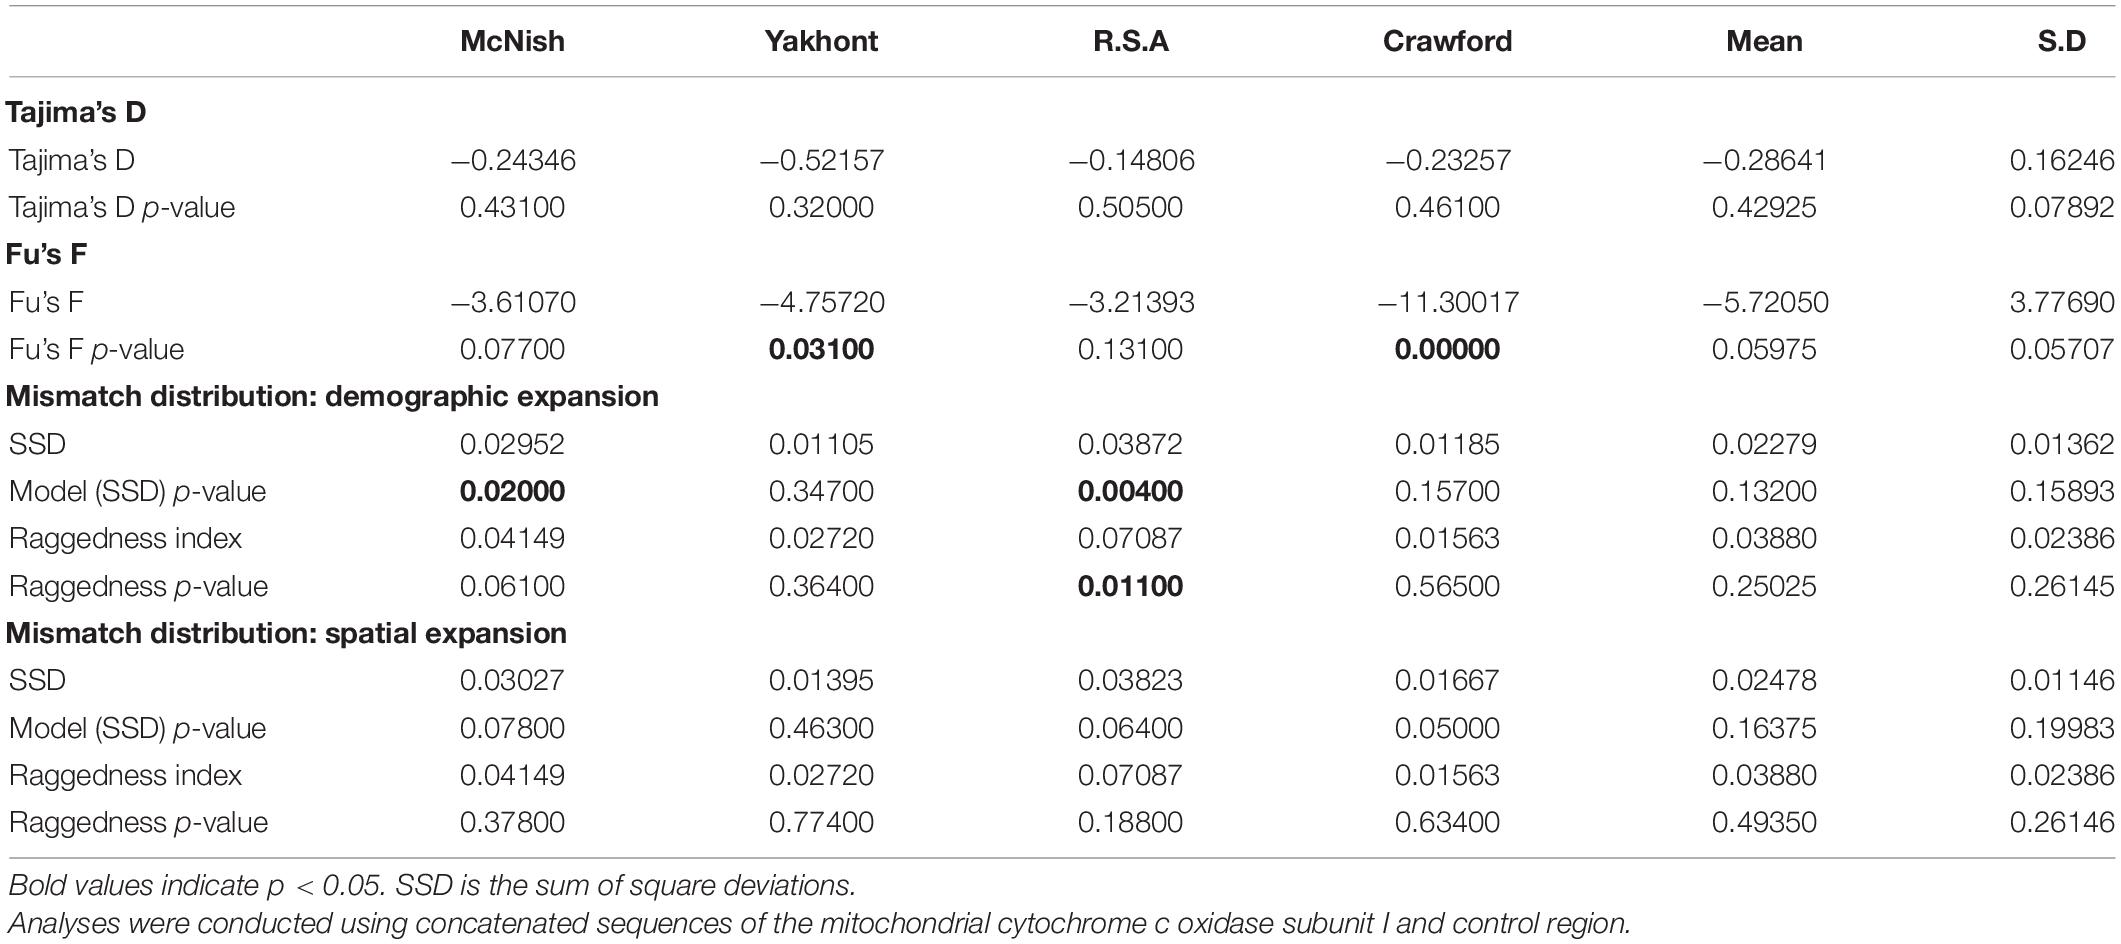
Table 2. Results of Tajima’s D, Fu’s F, and mismatch distribution analyses to investigate historical demographic changes within the seamount and greater (mean) populations around Tristan da Cunha.
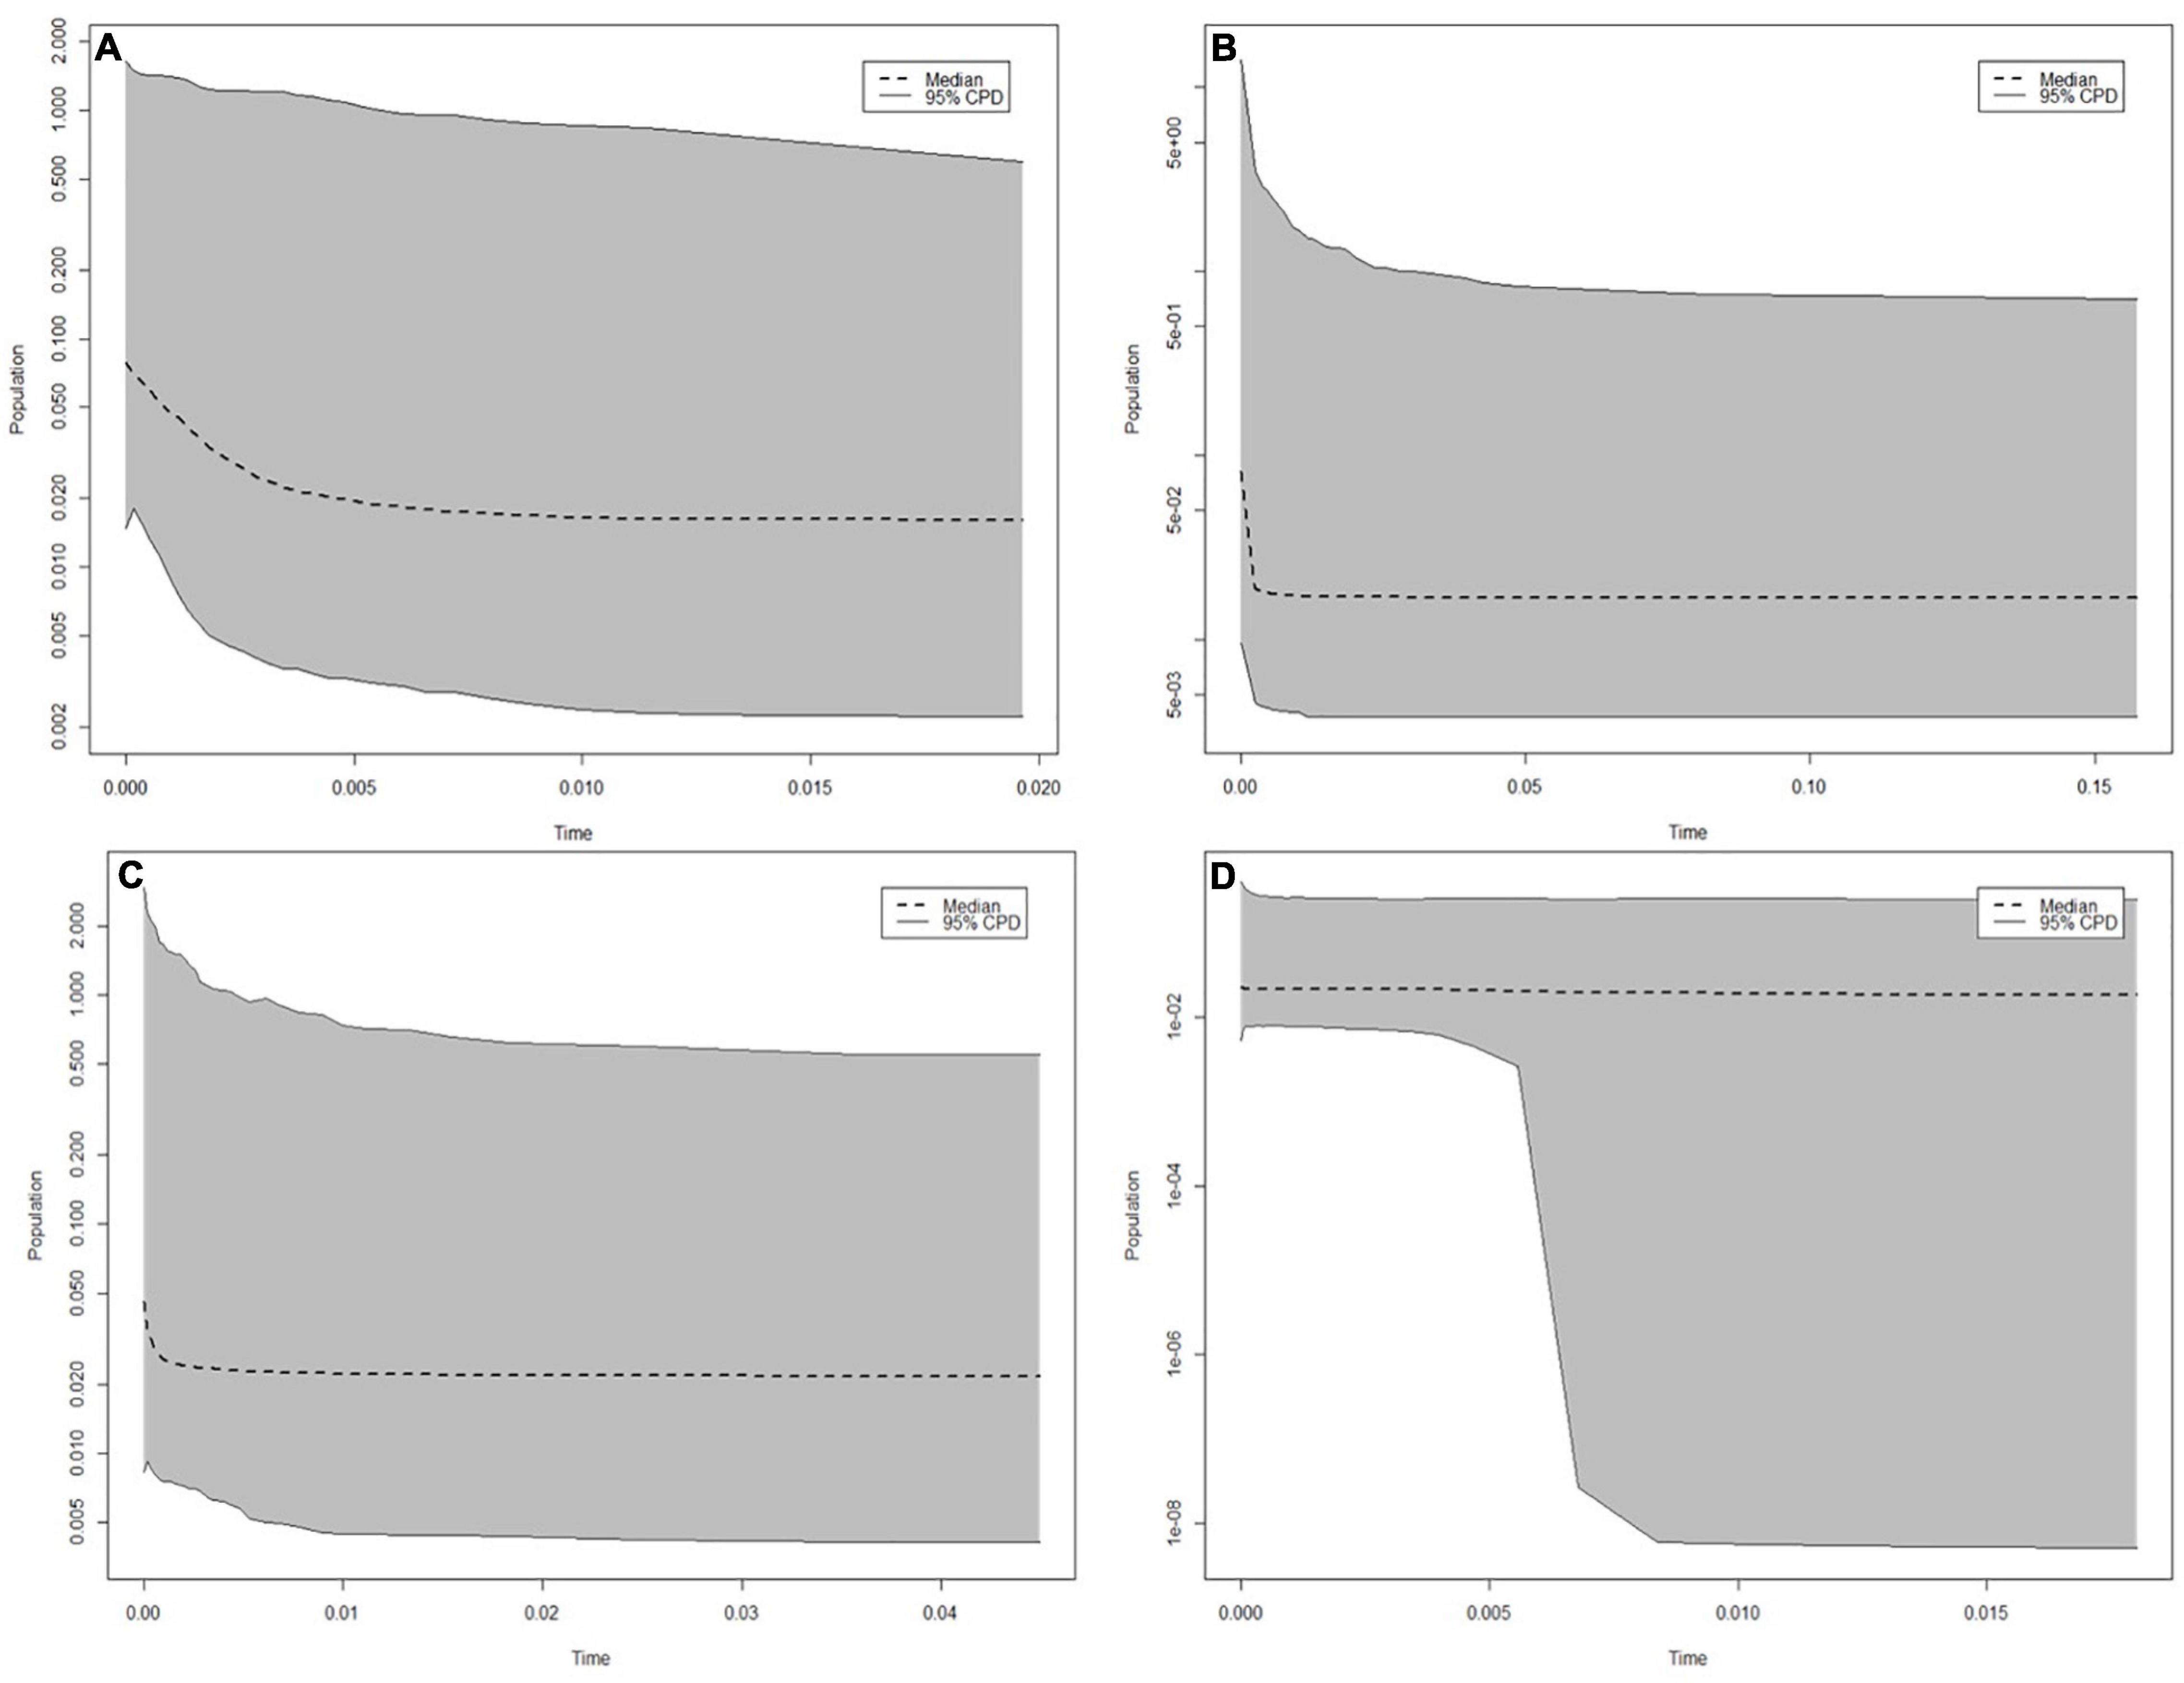
Figure 4. Extended Bayesian Skyline plots for the (A) Crawford, (B) Yakhont, (C) R.S.A, and (D) McNish seamounts. Time is in units of “million years.” Plots were generated based on concatenated sequences of the mitochondrial cytochrome c oxidase subunit I and control region.
Microsatellite Assessment of Population Genetic Diversity Within the TdC EEZ
In total, 12 polymorphic microsatellite markers were identified to assess genetic diversity and connectivity between populations within the TdC EEZ (Supplementary Table 1). The number of alleles identified at each microsatellite locus ranged from 3 to 14 showing Mendelian inheritance as required to identify familiar relationships. In total, the number of alleles found at each seamount ranged from 61 at R.S.A to 76 at MN.
The microsatellite results are indicative of a single genetic population within the TdC EEZ, with an overall lack of significant deviation from the expectations of the HWE test. This suggests no detection of null, or non-amplifying alleles within loci (Beacham et al., 2008). The mean locus-specific observed heterozygosity (Ho) for all loci was Ho = 0.46 and varied substantially between loci (Table 3). In addition, mean values for Nei’s genetic diversity (hs) ranged from medium to high across all loci, suggesting lack of selective pressures within populations, and instead substantial genetic exchange.
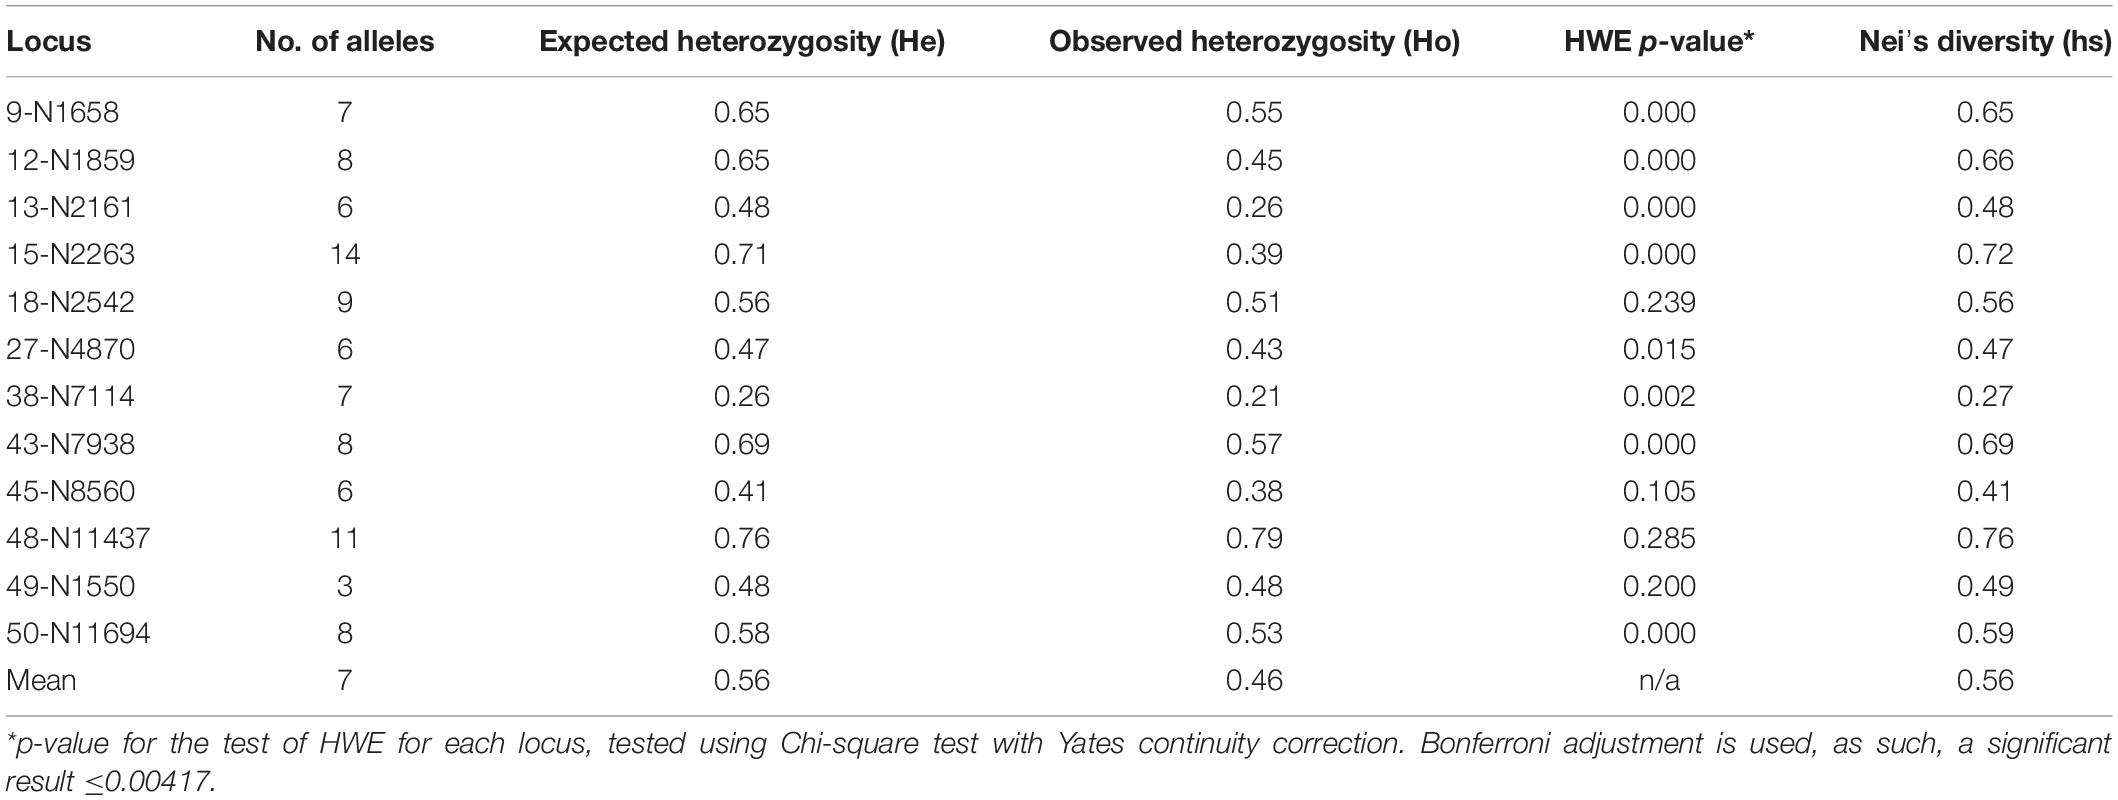
Table 3. Locus specific statistics for microsatellite data.
Allelic richness and genetic diversity did not vary greatly between populations, demonstrating genetic continuity between populations (Table 4). In addition, the lack of deviation from the HWE identified within seamount populations was reflective of random mating within these populations, with FIS ranging from −0.17 to 0.65.
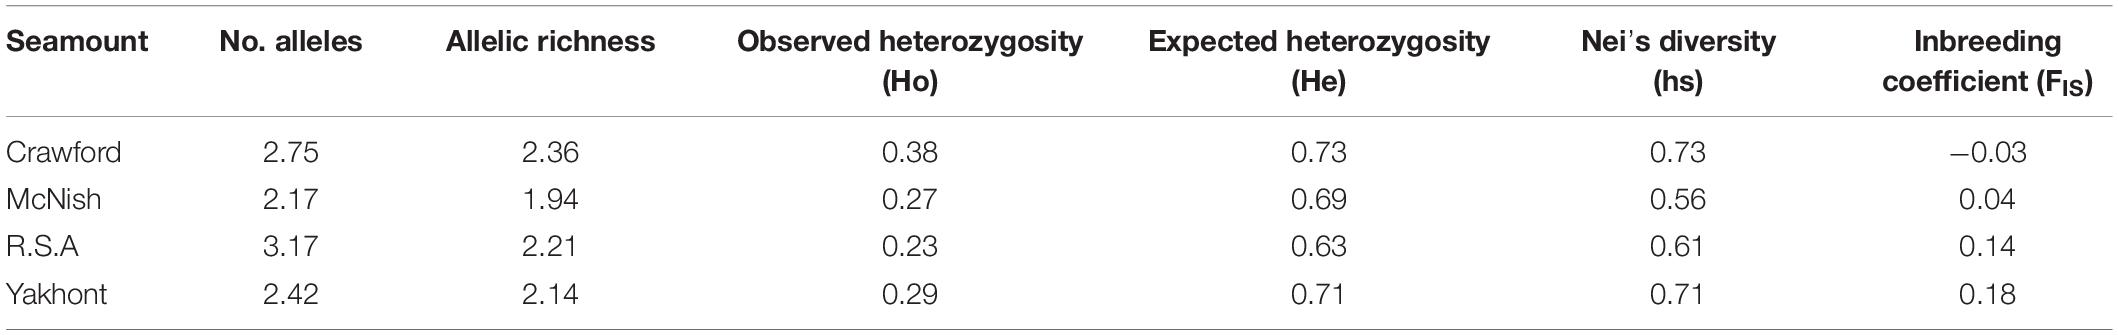
Table 4. Summary statistics for each seamount population based on microsatellite data.
Evidence for panmixia (genetic exchange across populations) rather than elevated inbreeding within seamount populations was shown by the low global heterozygosity deficit value (FIT) for the greater population of H. antarctica (0.1754) and the inbreeding coefficient of individuals (FIS = 0.1779). Finally, the fixation indices of subpopulations in relation to the total population (FST) were low for every locus (Supplementary Table 2) with a mean value of FST = 0.0029 for the greater population. This near zero Weir and Cockerham’s FST value demonstrated that none of the variation within the greater population has resulted from inter sub-population (seamount population) differences, indicating populations at different seamounts are not genetically distinct.
An overarching signature of genetic connectivity, or lack of differentiation, between seamounts was clear within the FST values, AMOVA results and Neighbor Joining Tree. Following correction with the Bonferroni method only one pairwise population FST value significantly differed from zero (p < 0.05); this was for the comparison of populations at the R.S.A and YK seamounts. Despite the significant result, the low FST value obtained indicated minimal differentiation between the populations. The near zero values of FST for the remaining seamount pairs [ranging from FST = 0.00254 to FST = 0.00808 (Table 5)], indicated almost complete panmixia and emphasized the high likelihood of genetic connectivity between populations. The statistical power for detecting structure was found to drop rapidly as FST dropped below 0.0075 (Figure 5). The power calculation estimated that for an FST of 0.0075 there would be an 89% chance that structure would be detected.
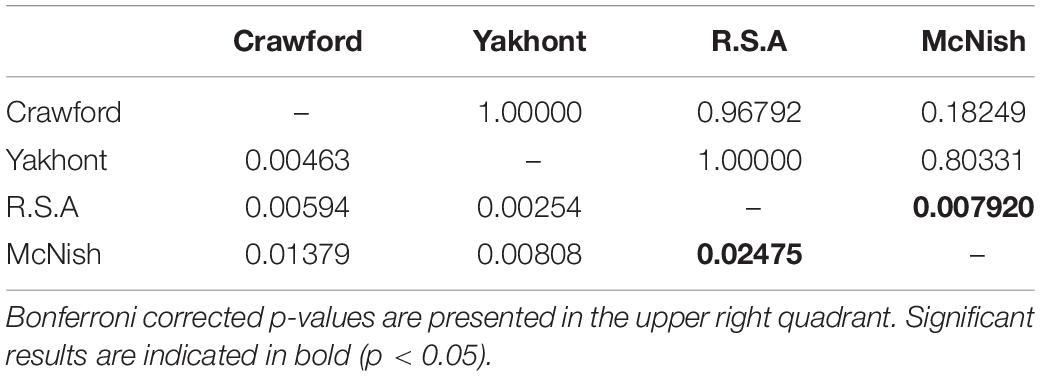
Table 5. FST values for pairwise population comparisons (lower left quadrant) calculated from microsatellite data.
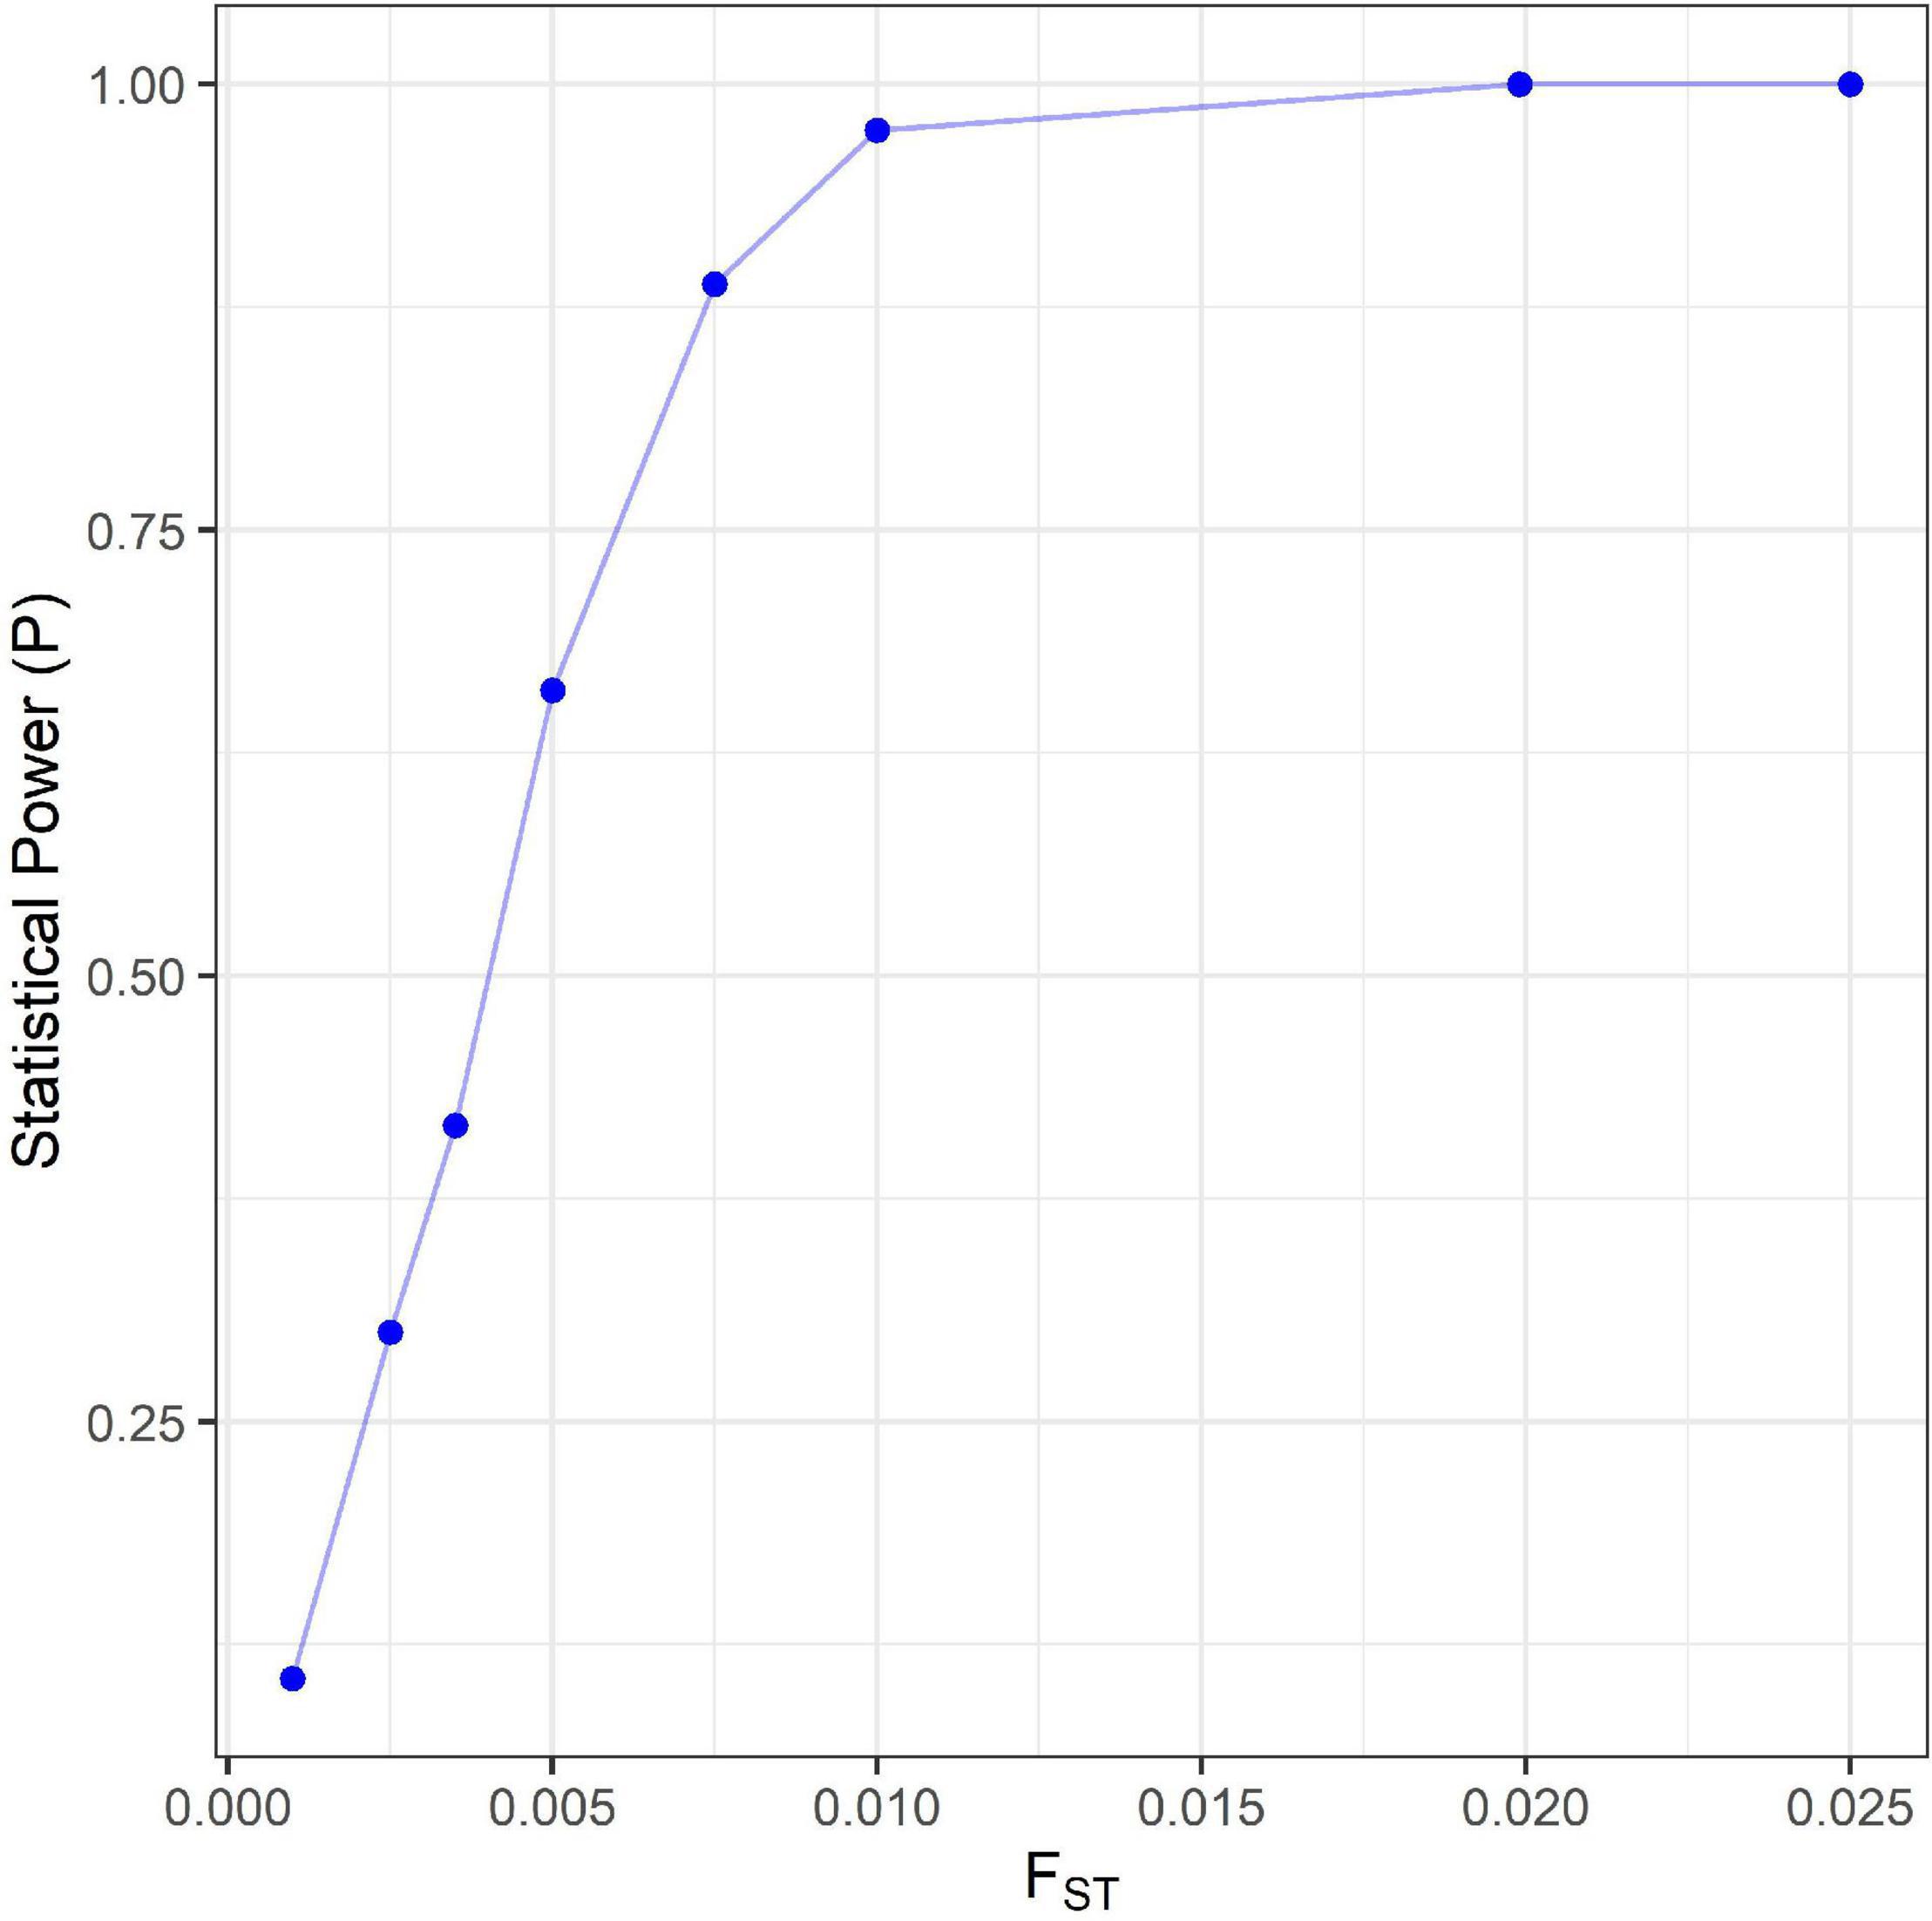
Figure 5. The statistical power estimated at various level of genetic differentiation for microsatellite analysis.
The standard AMOVA conducted confirmed that the main source of variation within the greater Tristan da Cunha population (almost 99%) was due to differences within seamount populations, rather than differences between seamount populations (approximately 80 and 20%, respectively). Visualization of the pairwise Nei’s genetic distances between individuals in the format of a Neighbor Joining tree demonstrated support for the lack of genetic structuring of individuals according to seamount (Figure 6). Both the DAPC analyses conducted reflected the lack of genetic segregation by seamount (Figure 7). Four key genetic clusters were presented when geographic grouping was not taken into account (Figure 7A), each consisting of individuals from all four different seamounts (Figure 7B). Inclusion of a geographic a priori (Figure 7C) within the DAPC analysis resulted in four overlapping seamount clusters, supporting the hypothesis of panmixia. The clusters for seamount populations CN, R.S.A, and YK appeared to show the greatest overlap, likely reflecting the spatial expansion observed within the mismatch distribution analysis.
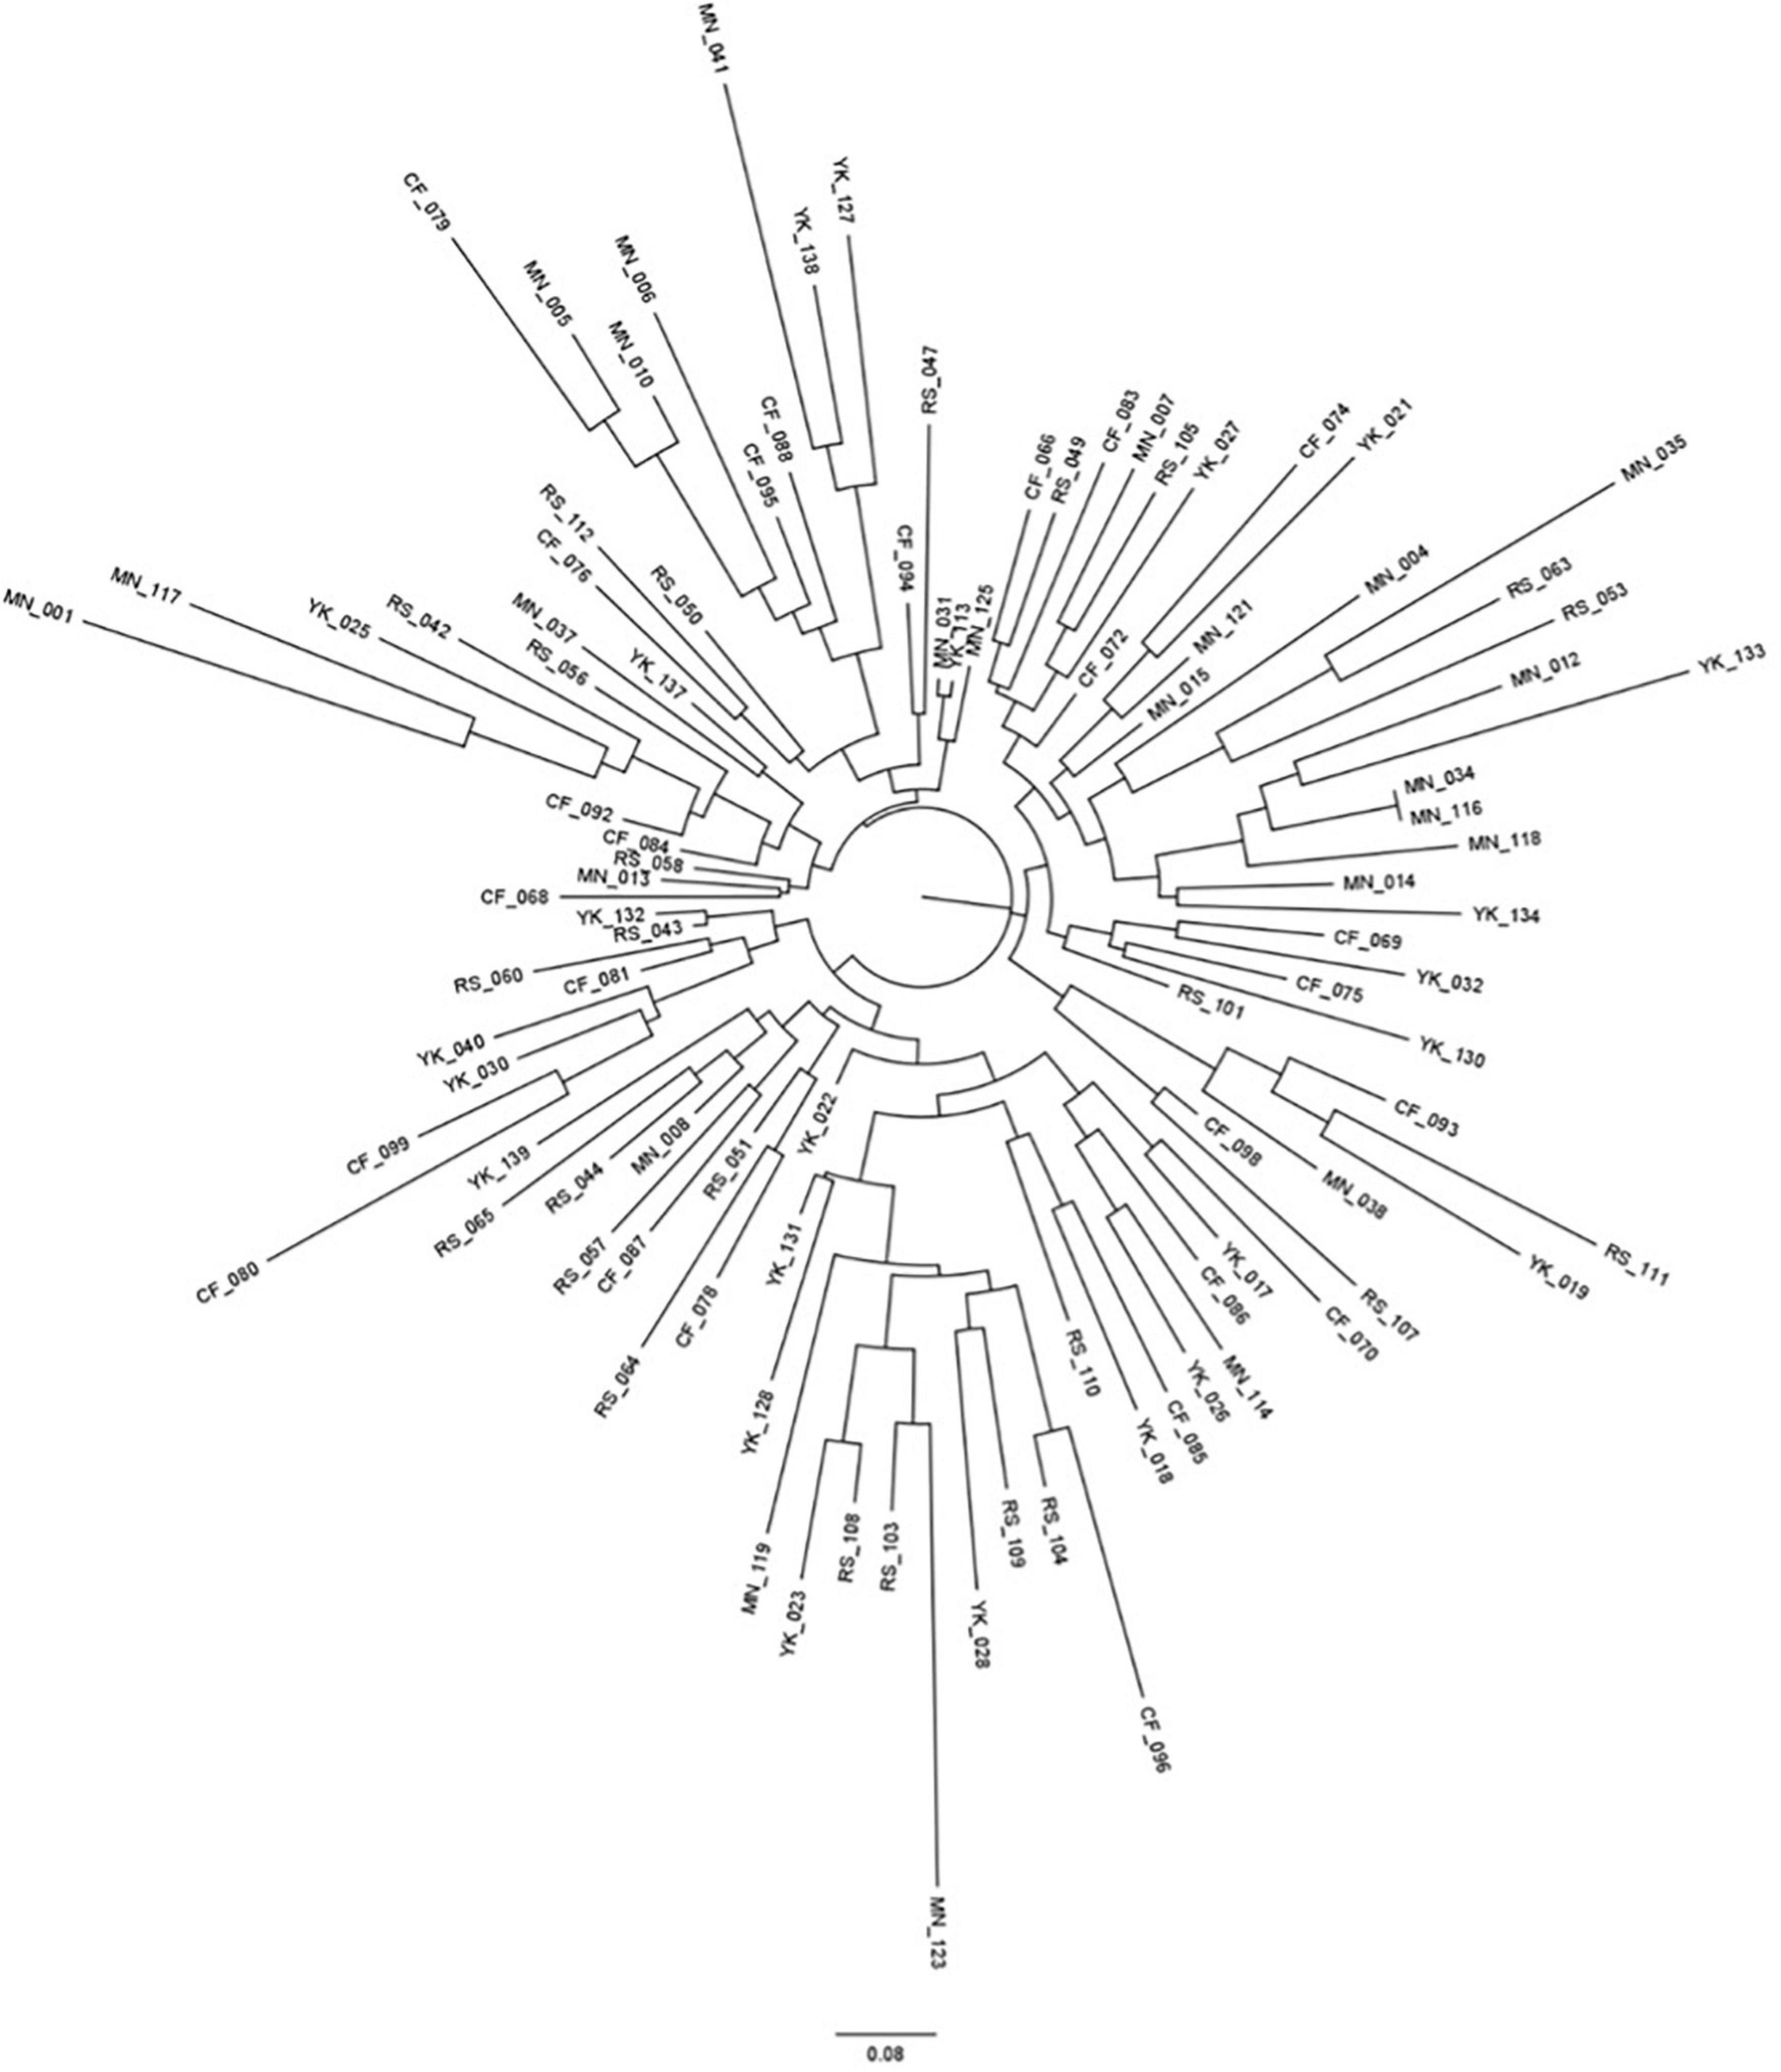
Figure 6. Circular neighbor-joining tree demonstrating the inferred genetic relationships between the 99 individuals sequenced for microsatellite analysis. Distance bar represents a Nei’s standard genetic distance of 0.08. The two letter code at the end of the tip labels reflects the seamount from which the samples were collected. CF, Crawford; YK, Yakhont; RS, R.S.A; MN, McNish. Please note that no branches had bootstrap support greater than 70%, no bootstrap values have been provided on the figure.
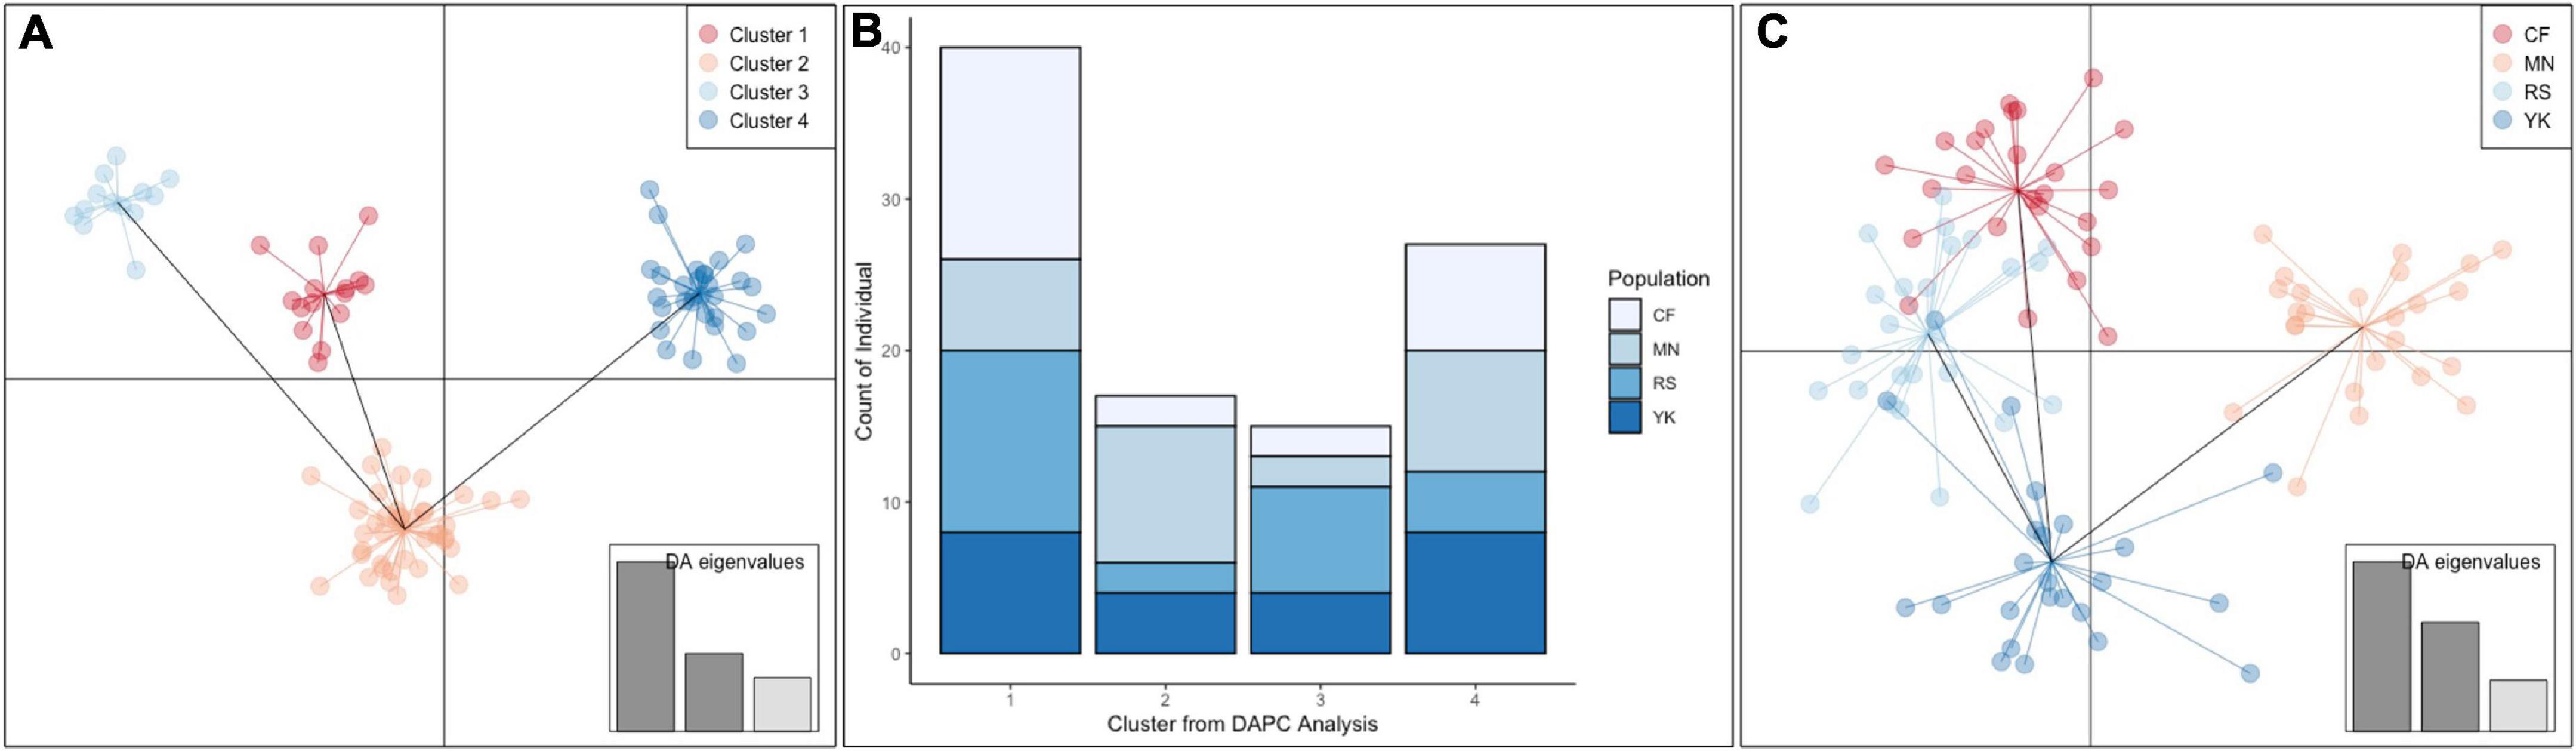
Figure 7. (A) Results of the Discriminant analysis of principal components (DAPC) demonstrating four key clusters within the greater Tristan da Cunha H. antarctica population. (B) The breakdown of the individuals from each sub-population within each cluster demonstrating no clear genetic structure associated with seamount. (C) DAPC conducted with a geographic a priori of seamount site. CF, Crawford; YK, Yakhont; RS, R.S.A; MN, McNish. DAPCs were conducted using microsatellite data.
Population Connectivity of H. antarctica Populations Across the Southern Hemisphere
There was high similarity in genetic diversity throughout populations at Tristan da Cunha, New Zealand, and within eastern and southern Australia, with no clear differentiation in haplotype diversity or haplotype dominance between populations. Such similarity resulted in clustering of individuals from different regions on the same branches (Figure 8).
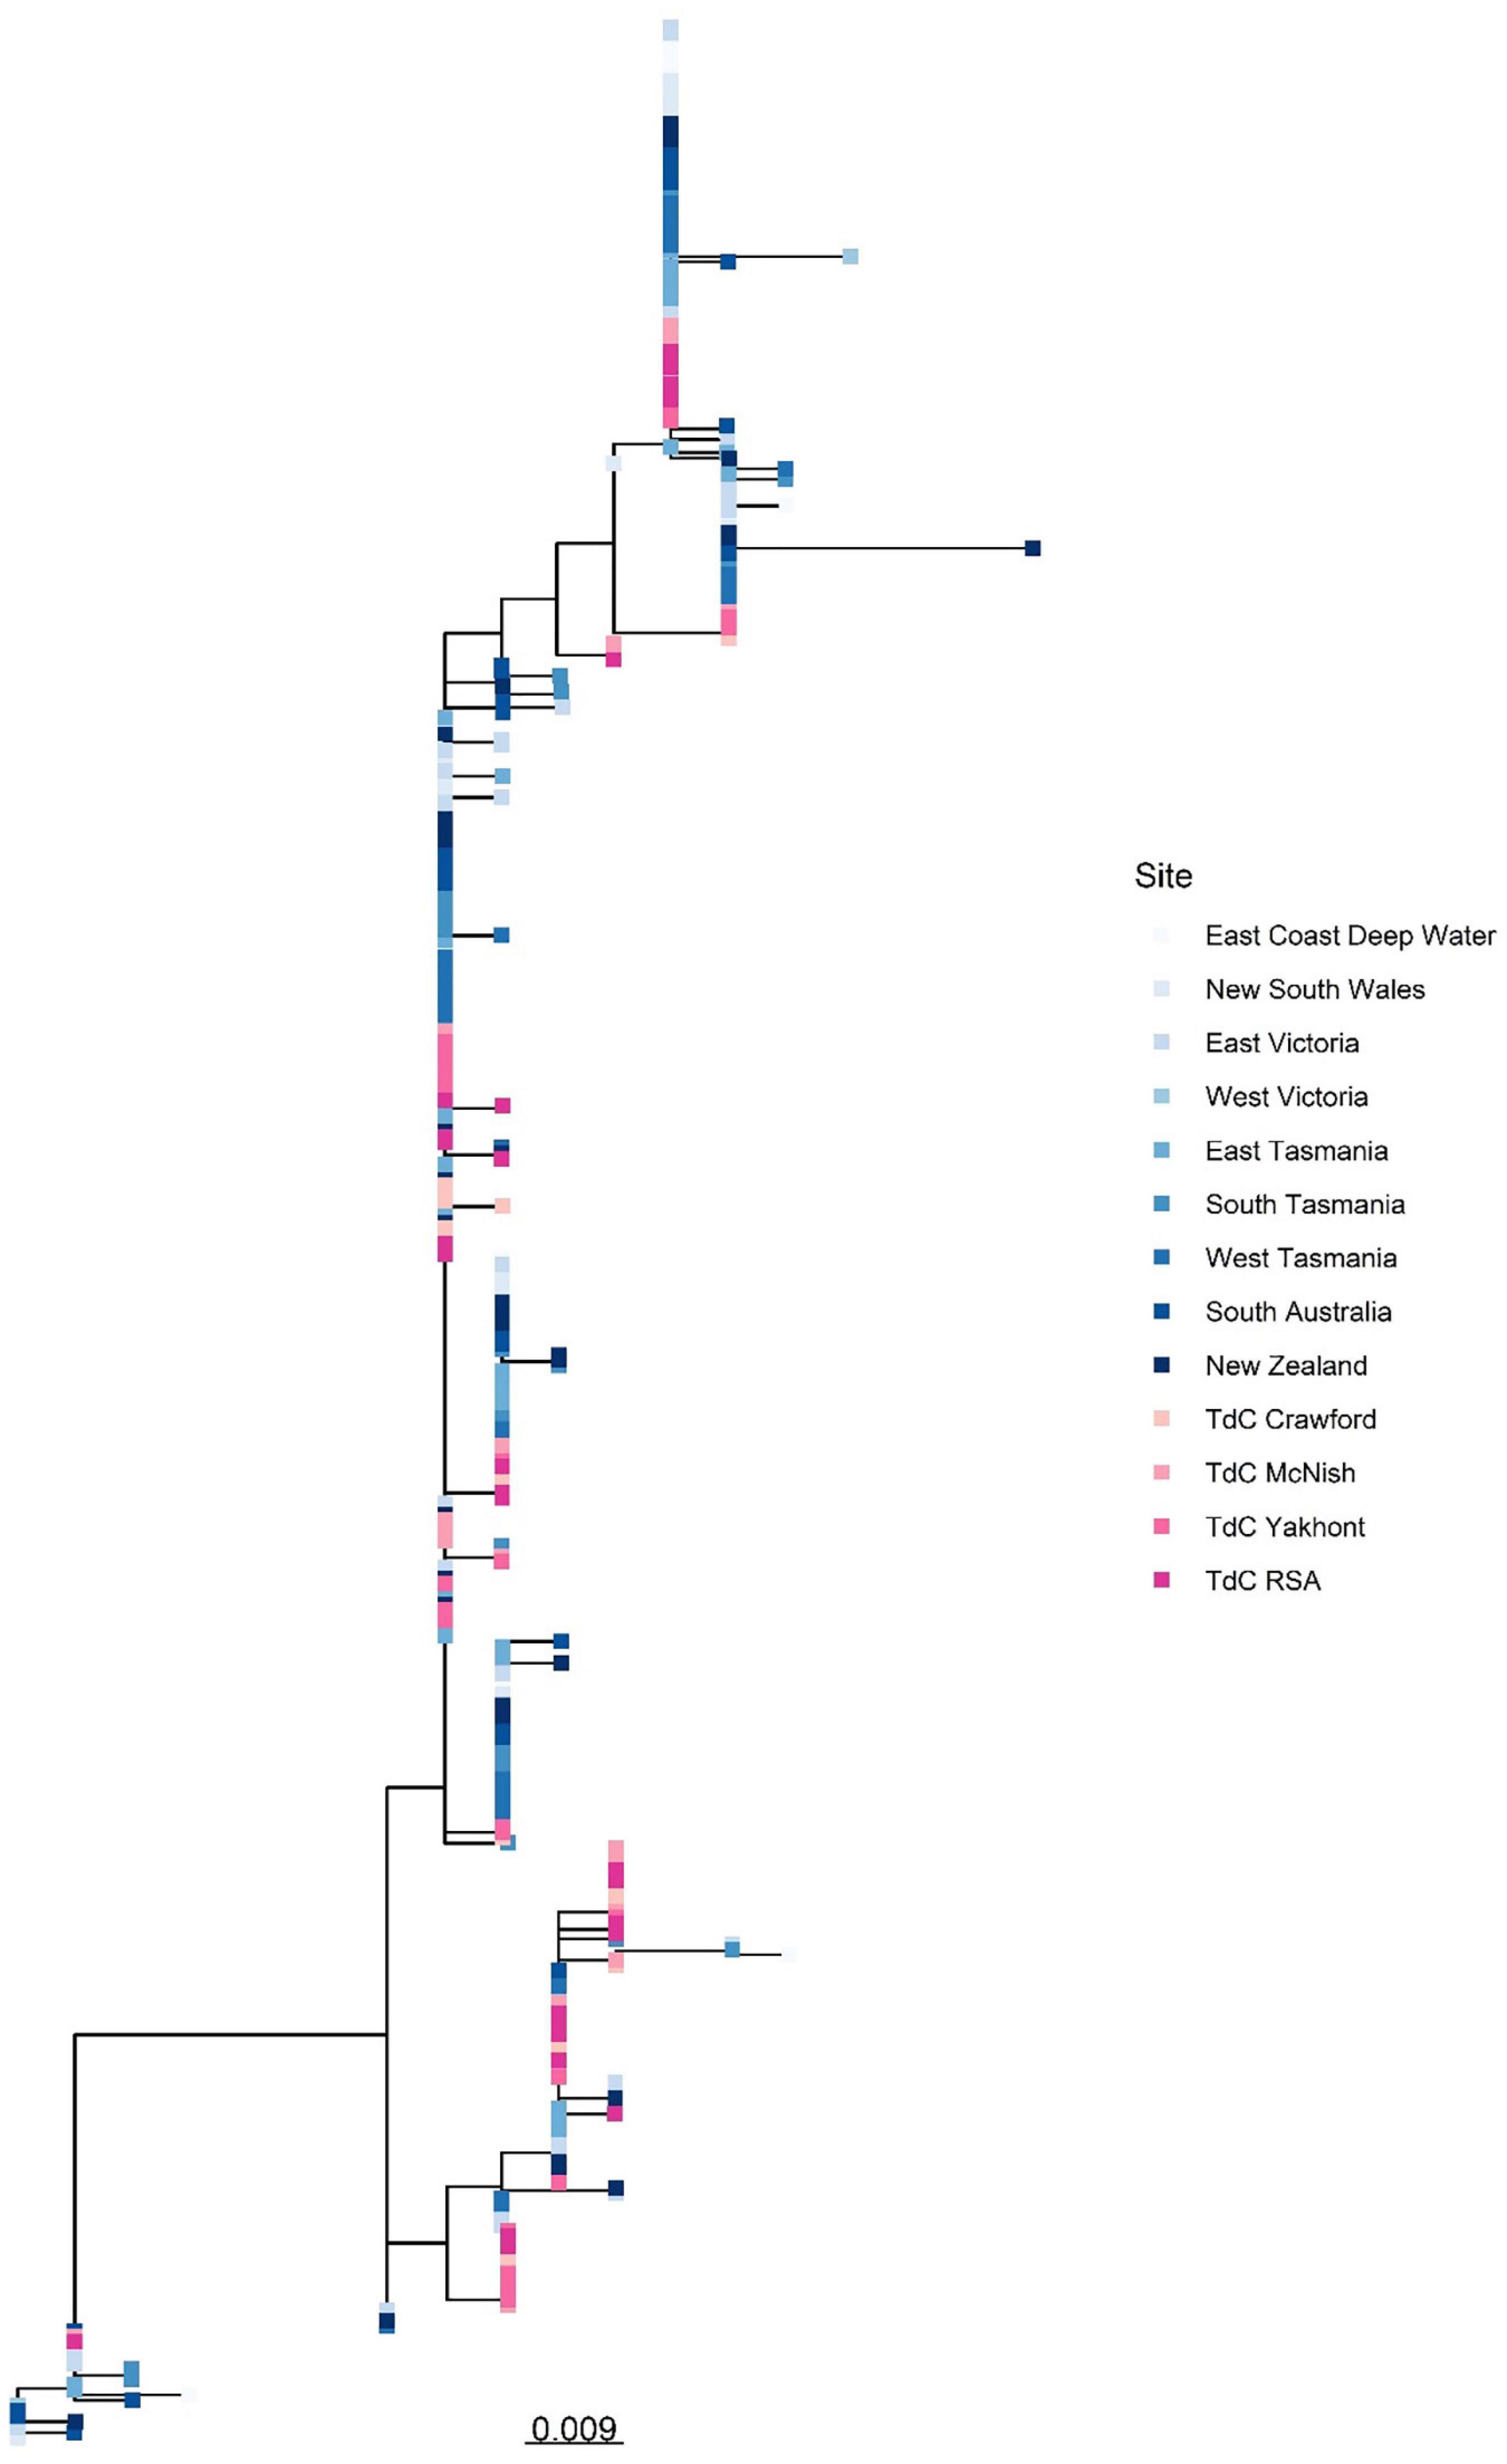
Figure 8. Unrooted Maximum Likelihood phylogenetic tree built from sequences of mitochondrial CR demonstrating high genetic clustering between individuals from Tristan da Cunha EEZ and wider Southern Ocean populations. The scale bar represents a genetic distance of 0.009. Please note, the East Coast Deep Water site was situated in Australia.
There was a continual reoccurrence of haplotypes across the populations sampled (Figure 9), highlighting the connectivity of H. antarctica populations across the southern hemisphere despite the distance between areas sampled (up to 11,000 km). The FST values calculated, although demonstrating a significant difference between a few isolated populations, were all very low (<0.15), suggesting only low to moderate levels of genetic differentiation (Figure 10 and Supplementary Table 3).
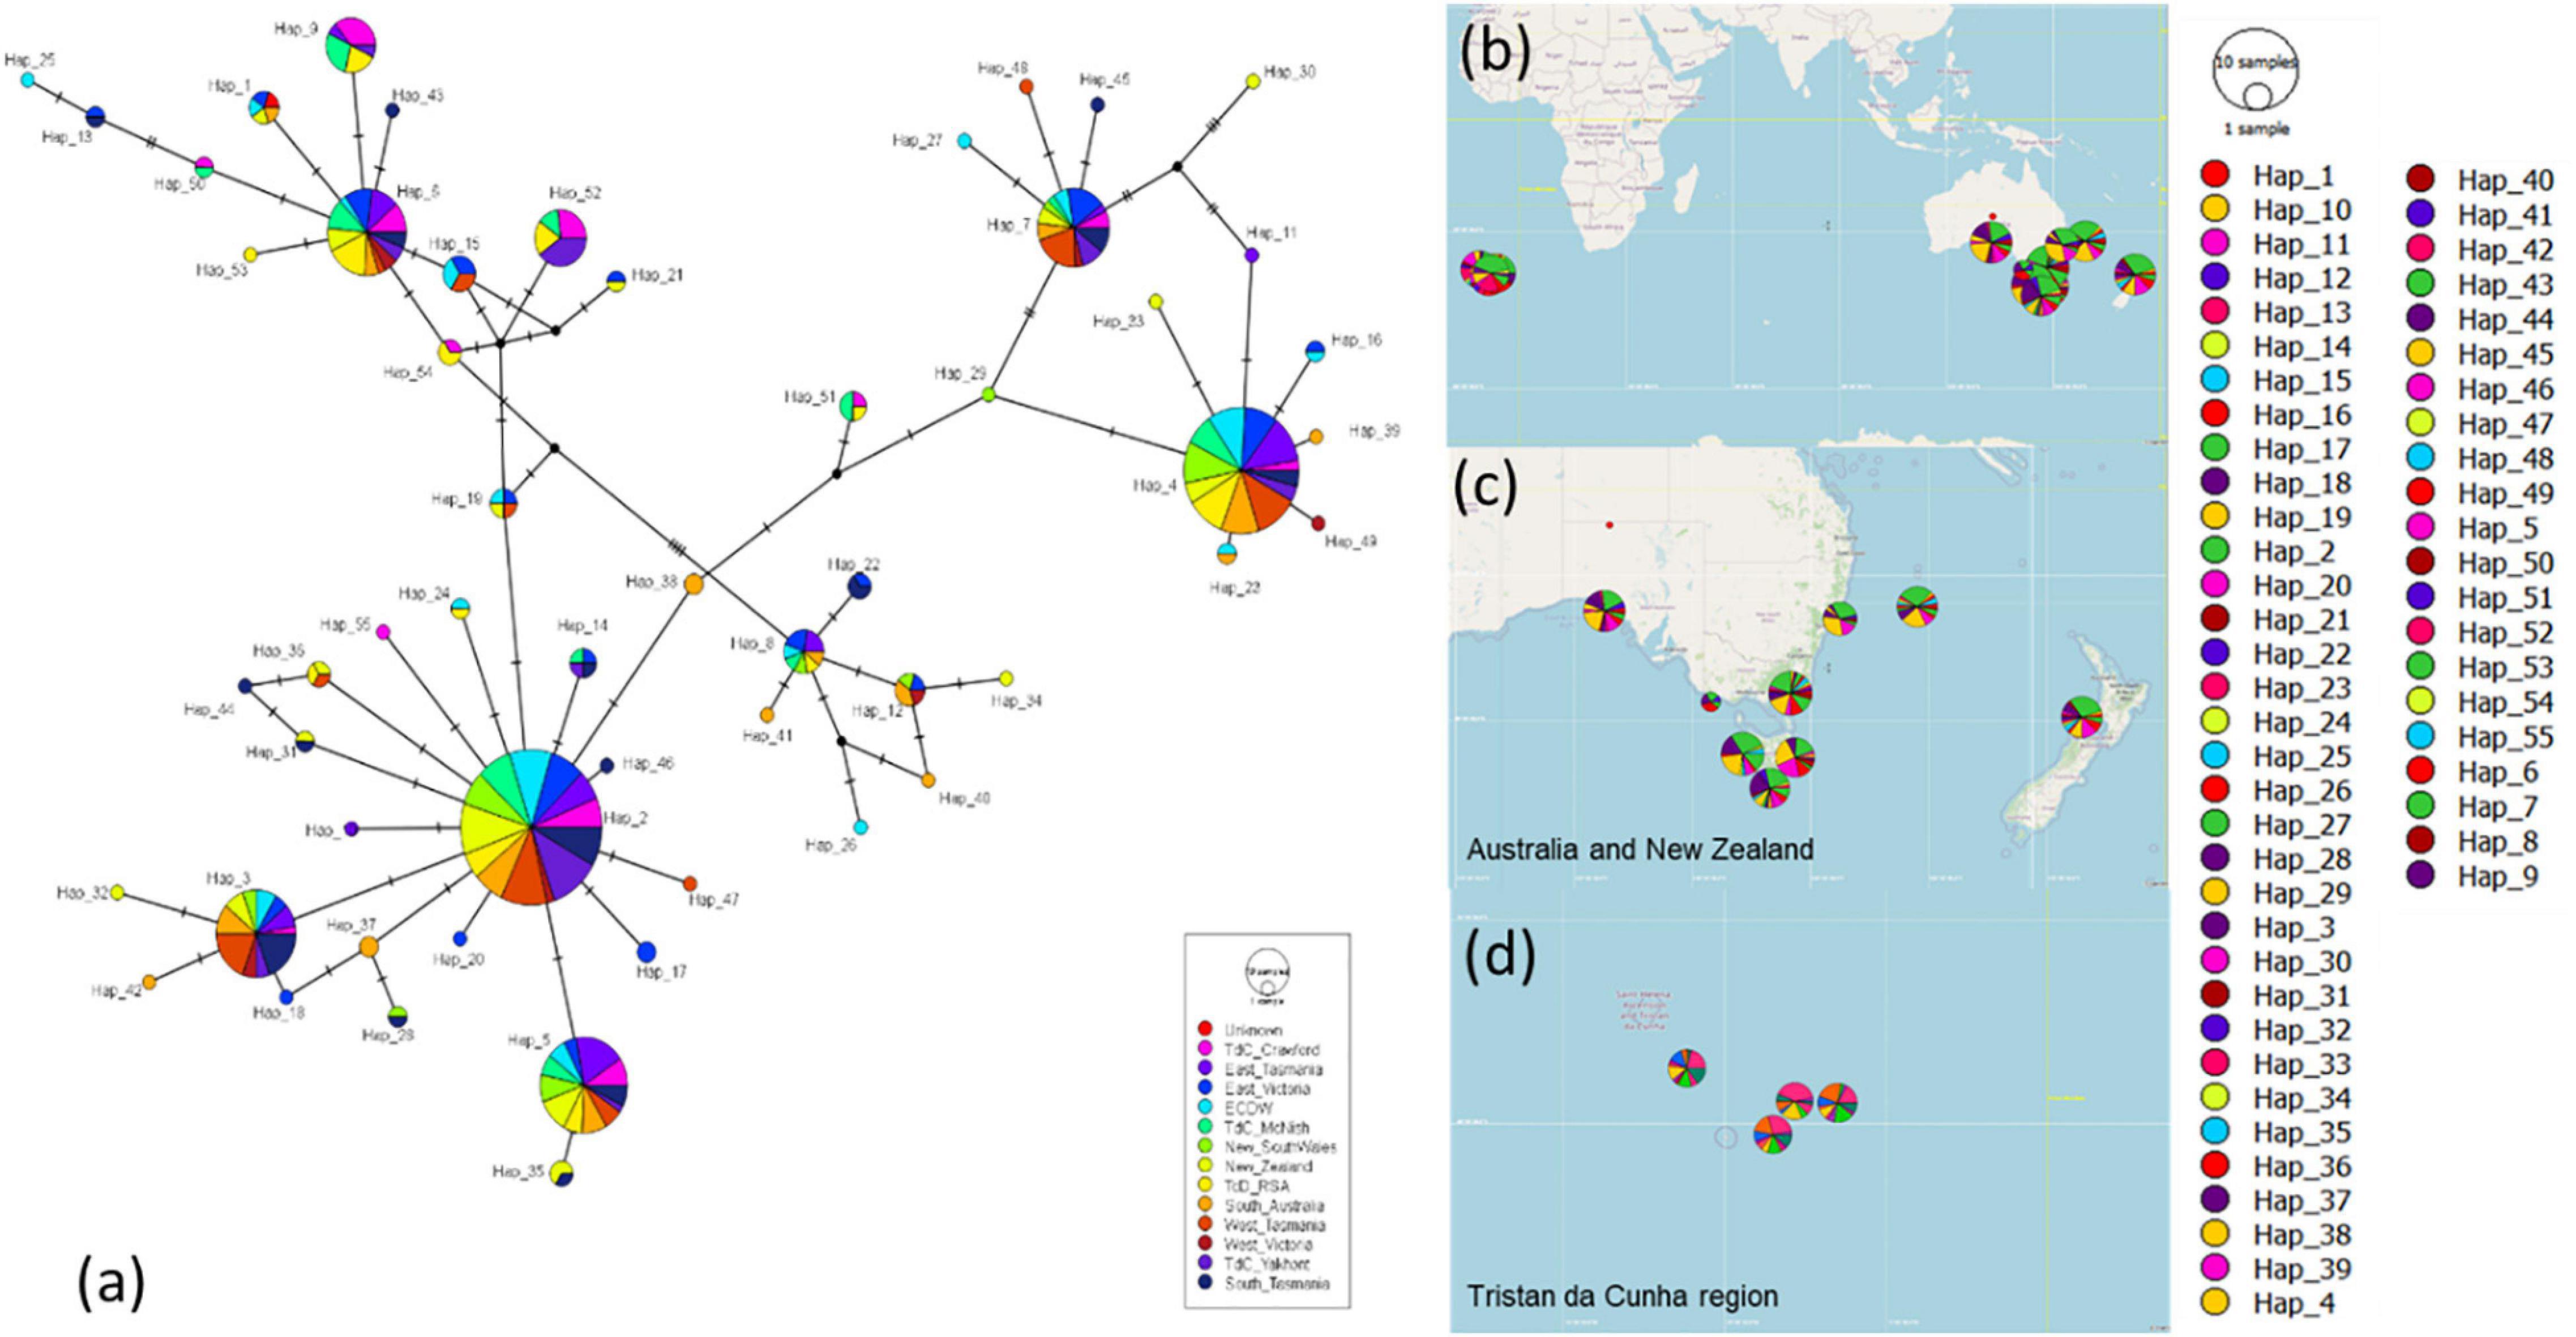
Figure 9. (a) Haplotype network for all CR samples between Tristan da Cunha and the Southern Ocean, (b) map of the full distribution of haplotypes across the southern Ocean, (c) haplotype distribution between Australia and New Zealand, (d) haplotype distribution within Tristan da Cunha.
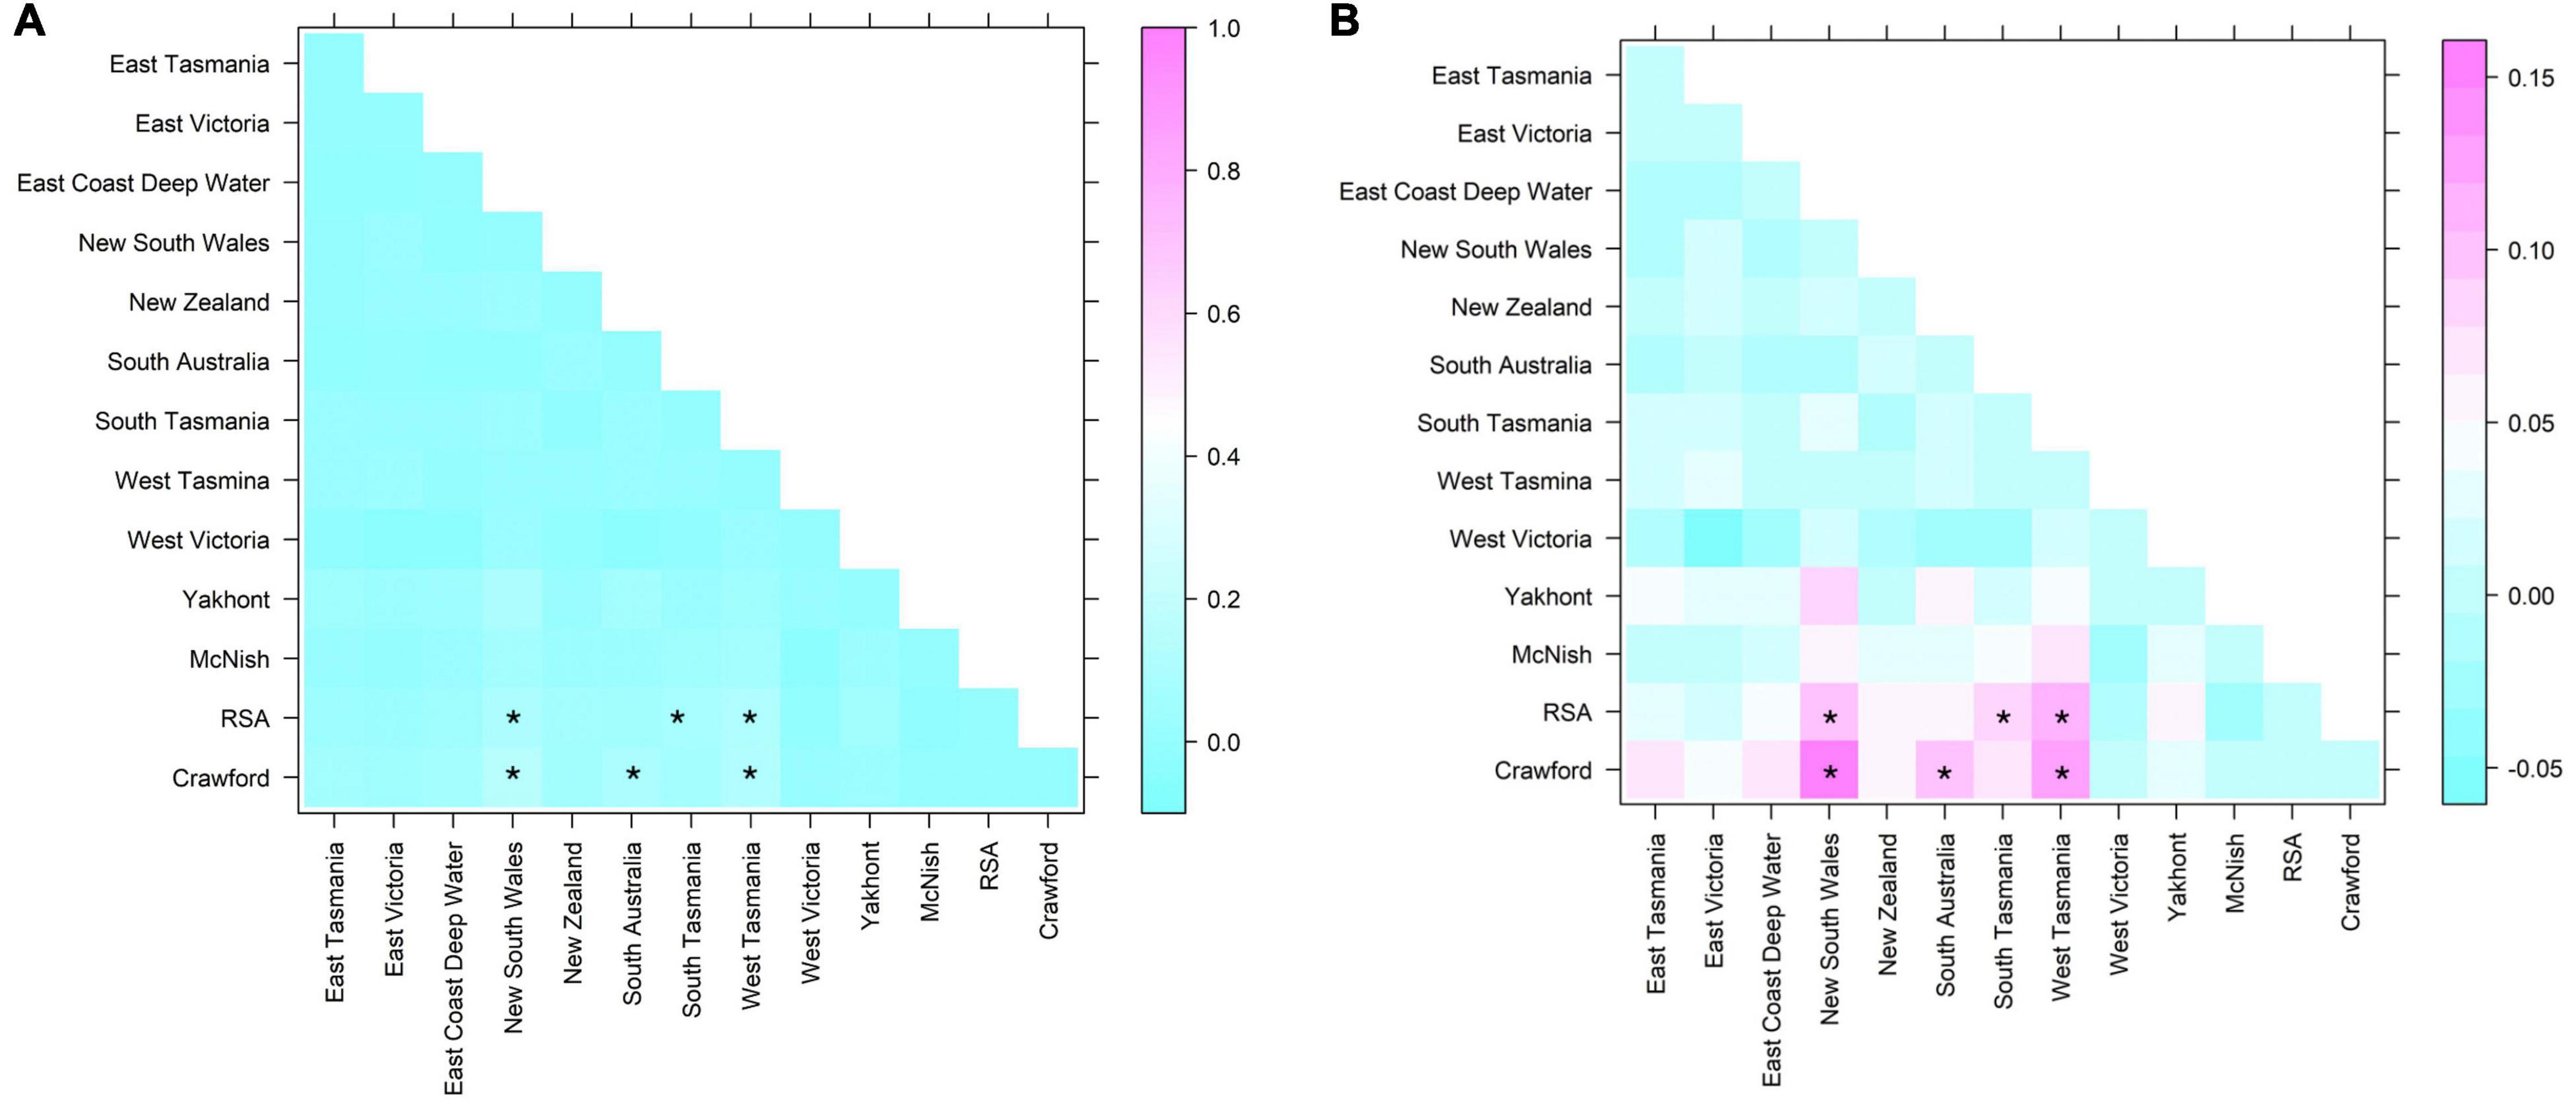
Figure 10. FST results for pairwise comparisons of sequences from the mitochondrial CR. Significant results (following Bonferroni correction are shown highlighted with an asterisk. (A) FST (out of max of 1, demonstrates low level of differentiation); (B) FST at range of result.
Discussion
Understanding the connectivity between contemporarily fished deep-water finfish populations is vital in understanding the likelihood of species overexploitation and the likely long term sustainability of populations, and if species are rare, the likelihood of local extinction. Here, we focused on understanding the population genetic connectivity of four seamount populations of H. antarctica sampled within the TdC EEZ. Therefore, to provide a baseline of understanding of how populations within the TdC EEZ are connected, we determined historical (mtDNA) and contemporary (microsatellite) population diversity throughout the populations. We found low genetic diversity, as well as an overall lack of phylogeographic (i.e., between seamount) population structure. Although variation in haplotype diversity and allelic richness between populations was high, the actual amount of difference between individuals (in terms of molecular DNA sequence) was low. All four seamount stocks showed high levels of genetic similarity, and should be classified as a single interbreeding population.
The high levels of panmixia (and inferred genetic connectivity) indicated by both the mitochondrial and microsatellite analyses conducted suggest that the four seamount populations form one greater genetic population; this is clear in the clustering presented in the DAPC analysis, wherein genetic clusters are formed of individuals from all seamounts without a geographic a priori, and the overlap of clusters when seamount is taken into account. Such results are in line with those reported for H. antarctica populations within Australia and New Zealand (Bolch et al., 1993; Hindell et al., 2005; Robinson et al., 2008). Importantly, genetic diversity was higher within than between populations, supporting panmixia and the identified lack of geographic population structure across the TdC EEZ populations. In addition, for both the greater TdC EEZ population, and individual seamount populations, the observed and expected heterozygosity values did not significantly differ from HWE proportions. As such, we can assume that genetic drift, and similar compounding factors that may increase inter-population diversity (e.g., inbreeding within seamount populations) are not occurring substantially. Such potential random mating of individuals across the four seamounts may then be partly associated with high juvenile movement between seamounts (as this species has around a 2-year pelagic phase), or post-settlement movement of sub-adult or adult individuals with feeding excursions or when aggregating for spawning.
Investigation of the demographic history of the seamount populations further support the hypothesis of panmixia, with a lack of evidence for selective pressures at any of the seamounts, or within the greater TdC population. The lack of significant Tajima’s D values indicates the populations are evolving as per the expected mutation-drift equilibrium. However, the significant, negative Fu’s F values obtained for YK and CN demonstrate an excess number of alleles at these sites, indicative of recent population expansion or genetic hitchhiking. These results perhaps represent the historical movement of individuals from different seamount populations into these regions, resulting in the observed panmixia. Interestingly, the lack of deviation from the model of spatial expansion obtained during the mismatch distribution analysis provides further evidence of panmixia, with high levels of similarity between all population’s indicative of connectivity through movement. Population expansion at all four seamounts is supported by the Extended Bayesian Skyline plots. The four, non-population specific clusters identified in the non-geographic DAPC may represent a historical genetic structure, formed of distinct sub-populations, prior to spatial expansion and integration of the seamount populations.
Here we provide genetic evidence that seamounts may act as stepping stones for dispersal of H. antarctica across ocean divides. H. antarctica populations show panmixia across the Southern Hemisphere, with evidence suggesting that there is a single panmictic population, at least between Australia/New Zealand and Tristan da Cunha (encompassing a distance of ∼13,000 km). The TdC EEZ lies within the Subtropical Frontal Zone (STFZ; Graham and De Boer, 2013). This region is characterized by enhanced sea surface temperature (SST) gradients and broadly east to north-eastward flows, but with a high degree of spatial and temporal variability in currents. To the south of the EEZ lies a stronger, more persistent eastward current aligned with the southern limit of the STFZ, frequently referred to as the southern subtropical front (SSTF: Graham et al., 2012). Together, the relatively weak and variable flows of the STFZ and northward meanders of the SSTF provide a mechanism for eastward transport of marine biota from the TdC EEZ. Such currents promote the movement of recruits and juveniles of H. antarctica across the Southern Hemisphere, in part due to their pelagic behavior. H. antarctica juveniles are known to associate with surface waters, and are often associated with flotsam, which likely provide shelter and food (Bigelow and Schroeder, 1953; Leim and Scott, 1966; Haedrich, 1967; Horn, 1970; Horn and Massey, 1989; Last et al., 1993; Duffy et al., 2000). Although still little understood, the use of drift algae for shelter by juvenile H. antarctica may potentially structure individual movement, and therefore contemporary population connectivity. In support of this, as this species does not recruit to demersal habitats until it is at least 2 years old, if the association between flotsam and juveniles is long-lived, oceanographic features responsible for the movement of drift algae may have a substantial influence on juvenile distribution (Duffy et al., 2000). For example, at the ocean basin scale, Hindell et al. (2005) argued for the possibility of juvenile H. antarctica associating with pelagic drifting algae that have moved between the east coast of Australia and the west coast of New Zealand, resulting in high connectivity between stocks.
This study provides critical input to the future management of H. antarctica at seamounts within the southern Atlantic. Our work has shown that a better understanding of the geographic and temporal scales of new settler input is needed to guide sustainable management of populations spread across a series of seamounts. Whilst the source of new recruits may be adjacent seamounts, they may also come from geographically distanced habitats, especially those in which large biomass of H. antarctica are apparent (i.e., New Zealand and Southern Australia). In this context, fisheries management measures will need to consider the different scales across which dispersal processes are operating, in order to achieve adequate protection or ensure the provision of networks of connectivity for this species. However, the lack of significant genetic differentiation detected between seamount populations does not necessarily imply that gene flow between populations is high. A small degree of gene flow would be sufficient to prevent genetic differentiation. However, if there is relatively little gene flow between populations then there will be low numbers of effective migrants between the populations, which would be expected to have substantial consequences for population recruitment and recovery following fishing activities (Williams et al., 2017).
Determining fishery stock boundaries is notoriously challenging, and few places more so than in remote deep-water areas. Although we show high levels of genetic connectivity of H. antarctica populations within the TdC EEZ, for management purposes each individual seamount is still recognized as a discrete stock in its own right. Recent work, focusing on Australian H. antarctica stocks, has shown that despite genetic connectivity, fished stocks may show strong similarities in a range of demographic parameters, likely indicating limited movement of adult fish following recruitment (Williams et al., 2017). Within the TdC, our argument for the precautionary approach to management recognizes that the distance between suitable habitats (between 80 and 200 km) with the TdC EEZ may pose little barrier to pre-settlement individuals, though a potentially considerable barrier to movement of post-settlement (adult) individuals. The life history of juvenile H. antarctica, though otherwise poorly known, means that they are able to spread over wide areas but, once they recruit to the adult habitat (bottom 50 m initially in areas <500 m deep), their movements become much more restricted (Williams et al., 2017). Additionally, within the TdC EEZ there are significant differences in H. antarctica life history parameters, and trajectories of catch-per-unit-effort between seamount populations, which is likely a product of differences in productivity between seamounts, and the different histories of fishing activity at each seamount (Bell et al., 2021). If populations are restricted to individual seamounts, localized serial depletion could occur if catches are not spread appropriately across the complete distribution of the fishery. In the TdC EEZ, use of a single management unit may result in higher catch limits but could substantially increase the risk of serial depletion at individual seamounts. Whilst either stock hypothesis remains scientifically plausible, the lack of consistency between different data sources in this case supports the need for a precautionary approach to management. This underlines the challenge of defining stock boundaries, and their relation to that of their respective populations, particularly for deep-water species where life history information is generally scarce.
Data Availability Statement
The datasets presented in this study can be found in online repositories. The names of the repository/repositories and accession number(s) can be found below: The mitochondrial sequences have been uploaded to GenBank under the Accession IDs of: Control region: MW588667–MW588801, COI: MW843035–MW843167.
Author Contributions
SH, JB, DF, and NR provided and analyzed the data. SH, JB, DF, NR, CW, GC, EY, and JG wrote and reviewed the manuscript. All authors contributed to the article and approved the submitted version.
Funding
This work was developed under MRAG Ltd., project GB2702, which was funded by the United Kingdom Foreign and Commonwealth Development Office “Blue Belt” programme. The participation of EY was funded by the Natural Environment Research Council through award NE/R000107/1.
Conflict of Interest
SH was employed by company MRAG Ltd.
The remaining authors declare that the research was conducted in the absence of any commercial or financial relationships that could be construed as a potential conflict of interest.
Publisher’s Note
All claims expressed in this article are solely those of the authors and do not necessarily represent those of their affiliated organizations, or those of the publisher, the editors and the reviewers. Any product that may be evaluated in this article, or claim that may be made by its manufacturer, is not guaranteed or endorsed by the publisher.
Supplementary Material
The Supplementary Material for this article can be found online at: https://www.frontiersin.org/articles/10.3389/fmars.2021.640504/full#supplementary-material
References
Adamack, A. T., and Gruber, B. (2014). Popgenreport: simplifying basic population genetic analyses in R. Methods Ecol. Evol. 5, 384–387. doi: 10.1111/2041-210X.12158
Armstrong, C. W., Vondolia, G. K., Foley, N. S., Henry, L., Needham, K., and Ressurreição, A. (2019). Expert assessment of risks posed by climate change and anthropogenic activities to ecosystem services in the deep North Atlantic. Front. Mar. Sci. 6:158. doi: 10.3389/fmars.2019.00158
Auscavitch, S. R., Deere, M. C., Keller, A. G., Rotjan, R. D., Shank, T. M., and Cordes, E. E. (2020). Oceanographic drivers of deep-sea coral species distribution and community assembly on seamounts, Islands, atolls, and reefs within the phoenix Islands protected Area. Front. Mar. Sci. 7:42. doi: 10.3389/fmars.2020.00042
Beacham, T. D., Schweigert, J. F., MacConnachie, C., Le, K. D., and Flostrand, L. (2008). Use of microsatellites to determine population structure and migration of pacific herring in British Columbia and adjacent regions. Trans. Am. Fish. Soc. 137, 1795–1811. doi: 10.1577/T08-033.1
Bell, J. B., Laptikhovsky, V., Barnes, D. K. A., Benedet, R., Bridges, A. E., Glass, J., et al. (2021). Life history and ecology of bluenose warehou (Hyperoglyphe antarctica, Centrolophidae) in the Southern Atlantic. Front. Mar. Sci. 8:610172. doi: 10.3389/fmars.2021.610172
Bolch, C. J. S., Elliot, N. G., and Ward, R. D. (1993). Enzyme variation in South-Eastern Australian samples of the Blue-Eye or Blue-Eye trevalla, Hyperoglyphe antarctica Carmichael 1818 (Teleostei: Stromateoidei). Aust. J. Mar. Freshw. Res. 44, 687–697. doi: 10.1071/MF9930687
Cowen, R. K., Gawarkiewicz, G., Pineda, J., Thorrold, S. R., and Werner, F. E. (2007). Population connectivity in marine systems. an overview. Oceanography 20, 14–21. doi: 10.5670/oceanog.2007.26
Da Ros, Z., Dell’Anno, A., Morato, T., Sweetman, A. K., Carreiro-Silva, M., Smith, C. J., et al. (2019). The deep sea: the new frontier for ecological restoration. Mar. Pol. 108:103642. doi: 10.1016/j.marpol.2019.103642
Duffy, C. A. J., Stewart, A. L., and Yarrall, R. (2000). First record of pre-settlement juvenile bluenose, Hyperoglyphe antarctica, from New Zealand. N.Z. J. Mar. Freshw. Res. 34, 353–358. doi: 10.1080/00288330.2000.9516937
Excoffier, L. (2004). Patterns of DNA sequence diversity and genetic structure after a range expansion: lessons from the infinite-island model. Mol. Ecol. 13, 853–864. doi: 10.1046/j.1365-294x.2003.02004.x
Excoffier, L., and Lischer, H. E. L. (2010). Arlequin suite Ver 3.5: a new series of programs to perform population genetics analyses under Linux and Windows. Mol. Ecol. Res. 10, 564–567. doi: 10.1111/j.1755-0998.2010.02847.x
Flanders Marine Institute (2019). Maritime Boundaries Geodatabase: Maritime Boundaries and Exclusive Economic Zones (200NM), Version 11. Available online at: https://www.marineregions.org/ (accessed August 11, 2021).
Goudet, J. (2003). Fstat (ver. 2.9.4), A Program to Estimate and Test Population Genetics Parameters. Available online at: https://www2.unil.ch/popgen/softwares/fstat.htm (accessed August 11, 2021).
Gouy, M., Guindon, S., and Gascuel, O. (2010). Seaview Version 4: a multiplatform graphical user interface for sequence alignment and phylogenetic tree building. Mol. Biol. Evol. 27, 221–224. doi: 10.1093/molbev/msp259
Graham, R. M., and De Boer, A. M. (2013). The dynamical subtropical front. J. Geophys. Res. Oceans 118, 5676–5685. doi: 10.1002/jgrc.20408
Graham, R. M., de Boer, A. M., Heywood, K. J., Chapman, M. R., and Stevens, D. P. (2012). Southern ocean fronts: controlled by wind or topography? J. Geophys. Res. Oceans 117:C08018. doi: 10.1029/2012JC007887
Gruber, B., and Adamack, A. T. (2015). Landgenreport: a new r function to simplify landscape genetic analysis using resistance surface layers. Mol. Ecol. Res. 15, 1172–1178. doi: 10.1111/1755-0998.12381
Guindon, S., Dufayard, J.-F., Lefort, V., Anisimova, M., Hordijk, W., and Gascuel, O. (2010). New algorithms and methods to estimate maximum-likelihood phylogenies: assessing the performance of Phyml 3.0. Syst. Biol. 59, 307–321. doi: 10.1093/sysbio/syq010
Haedrich, R. L. (1967). The stromateoid fishes: systematics and a classification. Bull. Mus. Comp. Zool. 135, 31–39.
Hindell, J., Hamer, P., McPartlan, H., and Robertson, S. (2005). Preliminary Assessment of the Utility of Otolith Microchemistry, Otolith Shape Analysis and Mitochondrial DNA Analyses in Stock Discrimination Of Blue-Eye Trevalla (Hyperoglyphe antarctica) from Australian Shelf Waters and Offshore Seamounts and New Zealand. Final report to Fisheries Research and Development Corporation. Project No. 2003/045. Queenscliff: Primary Industries Research Victoria, 108.
Horn, P. L. (2003). Stock structure of bluenose (Hyperoglyphe antarctica) off the North-East coast of New Zealand based on the results of a detachable hook tagging programme. N.Z. J. Mar. Freshw. Res. 37, 623–631. doi: 10.1080/00288330.2003.9517193
Horn, P. L., and Massey, B. R. (1989). Biology and Abundance of Alfonsino and Bluenose off the Lower East Coast North Island, New Zealand. New Zealand fish Technical Report No. 15. Wellington: MAF Fisheries, 31.
Jombart, T., and Ahmed, I. (2011). adegenet 1.3-1: new tools for the analysis of genome-wide SNP data. Bioinformatics 27, 3070–3071. doi: 10.1093/bioinformatics/btr521
Knutsen, H., Jorde, P. E., Gonzalez, E. B., Eigaard, O. R., Pereyra, R. T., Sannæs, H., et al. (2015). Does population genetic structure support present management regulations of the northern shrimp (Pandalus Borealis) in Skagerrak and the North Sea? ICES J. Mar. Sci. 72, 863–871. doi: 10.1093/icesjms/fsu204
Langella, O. (2002). Populations 1.2.31. (Downloaded September 2020). Available online at: http://www.bioinformatics.org/~tryphon/populations/ (accessed August 11, 2021).
Lee, W., Conroy, J., Howell, W. H., and Kocher, T. D. (1995). Structure and evolution of teleost mitochondrial control regions. J. Mol. Evol. 41, 58–66. doi: 10.1007/BF00174041
Leigh, J. W., and Bryant, D. (2015). POPART: full-feature software for haplotype network construction. Meth. Ecol. Evol. 6, 1110–1116. doi: 10.1111/2041-210X.12410
Leim, A. H., and Scott, W. B. (1966). Fishes of the Atlantic coast of Canada. Bull. Fish. Res. Board Canada 155, 330–372.
Li, Q., and Wan, J.-M. (2005). SSRHunter: development of a local searching software for SSR sites. Hereditas 27, 808–810.
Liu, S.-Y. V., Hsin, Y.-C., and Cheng, Y.-R. (2020). Using particle tracking and genetic approaches to infer population connectivity in the deep-sea Scleractinian coral Deltocyathus Magnificus in the South China sea. Deep Sea Res. Part I Oceanogr. Res. Pap. 161:103297. doi: 10.1016/j.dsr.2020.103297
McDowall, R. M. (1982). The centrolophid fishes of new Zealand (Pisces: Stromateodei). J. Roy. Soc. N.Z. 12, 103–142. doi: 10.1080/03036758.1982.10419436
Orsi, A. H., Whitworth, T. III, and Nowlin, W. D. Jr. (1995). On the meridional extent and fronts of the Antarctic circumpolar current. Deep Sea Res. Part I Oceanogr. Res. Pap. 42, 641–673. doi: 10.1016/0967-0637(95)00021-W
Pitcher, T. J., Morato, T., Hart, P. J. B., Clark, M. R., Haggan, N., and Santos, R. S. (eds) (2007). Seamounts: Ecology, Fisheries and Conservation. Hoboken, NJ: Wiley-Blackwell, 552.
R Core Team (2021). R: A Language and Environment for Statistical Computing. Vienna: R Foundation for Statistical Computing.
Robinson, N. A., Skinner, A., Sethuraman, L., McPartlan, H., Murray, N. D., Knuckey, I., et al. (2008). Genetic stock structure of blue-eye trevalla (Hyperoglyphe antarctica) and warehous (Seriolella brama and Seriolella punctata) in south-eastern Australian waters. Mar. Freshw. Res. 59, 502–514. doi: 10.1071/MF07175
Rogers, A. R., and Harpending, H. (1992). Population growth makes waves in the distribution of pairwise genetic differences. Mol. Biol. Evol. 9, 552–569. doi: 10.1093/oxfordjournals.molbev.a040727
Rowden, A. A., Dower, J. F., Schlacher, T. A., Consalvey, M., and Clark, M. R. (2010). Paradigms in seamount ecology: fact, fiction and future. Mar. Ecol. 31:s1. doi: 10.1111/j.1439-0485.2010.00400.x
Rozas, J., Ferrer-Mata, A., Sánchez-Del Barrio, J. C., Guirao-Rico, S., Librado, P., Ramos-Onsins, S. E., et al. (2017). Dnasp 6: DNA sequence polymorphism analysis of large data sets. Mol. Biol. Evol. 34, 3299–3302. doi: 10.1093/molbev/msx248
Ryman, N., and Palm, S. (2016). POWSIM: a computer program for assessing statistical power when testing for genetic differentiation. Mol. Ecol. Notes 6, 600–602. doi: 10.1111/j.1471-8286.2006.01378.x
Shank, T. (2010). Seamounts: deep-ocean laboratories of faunal connectivity, evolution, and endemism. Oceanography 23, 108–122. doi: 10.5670/oceanog.2010.65
Swofford, D. L. (2003). PAUP∗. Phylogenetic Analysis Using Parsimony (∗ and Other Methods). Version 4. Sunderland: Sinauer Associates.
Vieira, R. P., Trueman, C. N., Readdy, L., Kenny, A., and Pinnegar, J. K. (2019). Deep-water fisheries along the British isles continental slopes: status, ecosystem effects and future perspectives. J. Fish Biol. 94, 1–12. doi: 10.1111/jfb.13927
Ward, R. D., Zemlak, T. S., Innes, B. H., Last, P. R., and Hebert, P. D. (2005). DNA barcoding Australia’s fish species. Philos. Trans.R. Soc. Lond. Ser. B Biol. Sci. 360, 1847–1857.
Weir, B. S., and Cockerham, C. C. (1984). Estimating F-statistics for the analysis of population structure. Evolution 38, 1358–1370. doi: 10.2307/2408641
Williams, A., Hamer, P., Haddon, M., Robertson, S., and Althaus, F. (2017). Determining Blue-Eye Trevalla Stock Structure and Improving Methods for Stock Assessment. Fisheries Research and Development Corporation Report 2013/05. Hobart: Fisheries Research and Development Corporation, 140.
Keywords: seamount, connectivity, fisheries, blue belt programme, bluenose warehou
Citation: Heyworth SM, Bell JB, Wade CM, Cavalcante G, Robinson N, Young E, Glass J and Feary DA (2021) Genetic Connectivity of Seamount Populations of Bluenose Warehou (Hyperoglyphe antarctica). Front. Mar. Sci. 8:640504. doi: 10.3389/fmars.2021.640504
Received: 11 December 2020; Accepted: 27 July 2021;
Published: 09 September 2021.
Edited by:
Lorenzo Zane, University of Padua, ItalyReviewed by:
Elisa Boscari, University of Padua, ItalyJilda Alicia Caccavo, Alfred Wegener Institute Helmholtz Centre for Polar and Marine Research (AWI), Germany
Copyright © 2021 Heyworth, Bell, Wade, Cavalcante, Robinson, Young, Glass and Feary. This is an open-access article distributed under the terms of the Creative Commons Attribution License (CC BY). The use, distribution or reproduction in other forums is permitted, provided the original author(s) and the copyright owner(s) are credited and that the original publication in this journal is cited, in accordance with accepted academic practice. No use, distribution or reproduction is permitted which does not comply with these terms.
*Correspondence: David A. Feary, ZC5mZWFyeUBtcmFnLmNvLnVr