 Karin J. van der Reijden1*
 Leo Koop2
 Sebastiaan Mestdagh3
 Mirjam Snellen2,4
 Peter M. J. Herman5,6
 Han Olff1
 Laura L. Govers1,7
- 1Conservation Ecology Group, Groningen Institute for Evolutionary Life Sciences, University of Groningen, Groningen, Netherlands
- 2Acoustics Group, Faculty of Aerospace Engineering, Delft University of Technology, Delft, Netherlands
- 3Department of Estuarine and Delta Systems, NIOZ Royal Netherlands Institute for Sea Research, Yerseke, Netherlands
- 4Department of Applied Geology and Geophysics, Deltares, Utrecht, Netherlands
- 5Marine and Coastal Systems, Deltares, Delft, Netherlands
- 6Department of Hydraulic Engineering, Faculty of Civil Engineering and Geosciences, Delft University of Technology, Delft, Netherlands
- 7Department of Coastal Systems, NIOZ Royal Netherlands Institute for Sea Research, Den Burg, Netherlands
Biogenic reefs form biodiversity hotspots and are key components of marine ecosystems, making them priority habitats for nature conservation. However, the conservation status of biogenic reefs generally depends on their size and stability. Dynamic, patchy reefs may therefore be excluded from protection. Here, we studied epibenthos and epifauna density, richness, and community composition of patchy, dynamic Sabellaria spinulosa (ross worm) reefs in the North Sea. This study was conducted by comparing boxcore (endobenthos) and video transect (epifauna) data from two research campaigns in 2017 and 2019 to the Brown Bank area on the Dutch Continental Shelf, where S. spinulosa reefs were first discovered in 2017. The Brown Bank area is characterized by dynamic, migratory bedforms at multiple scales which potentially affect biogenic reef stability. We showed that S. spinulosa habitats had a patchy distribution and alternated with habitats comprised of plain sand. Average S. spinulosa habitat patch size was 5.57 ± 0.99 m and 3.94 ± 0.22 m in 2017 and 2019, respectively (mean ± SE), which especially in 2019 closely resembled the small-scale megaripple bedforms. Contrary to the endobenthos communities that were unaffected by S. spinulosa, epifauna density and species richness were at least two times higher in S. spinulosa habitats compared to sandy habitats, resulting in different community compositions between the two habitat types. We showed that S. spinulosa persisted in the area for almost 2 years. Although the stability of individual patches remained unclear, we demonstrated that even patchy biogenic reefs may promote density and local biodiversity of mobile, epibenthic species, very likely as a result of increased habitat heterogeneity provided by reef habitat patches. This indicates that patchy biogenic reefs that occur in dynamic environments may also have high ecological value and their conservation status should be (re)considered to ensure their protection.
Introduction
Biogenic reefs are physical benthic structures formed by ecosystem engineering species. Key examples are coral reefs (Roberts et al., 2002; Plaisance et al., 2011; Ferrario et al., 2014) and oyster beds (Lenihan, 1999; van der Zee et al., 2012; Donadi et al., 2013). By their physical presence, biogenic reefs modify their surroundings to such an extent that resource availability for other species is positively altered (Jones et al., 1994). They engineer a new habitat that can provide suitable settlement substrate (Coolen et al., 2015), increase refuge possibilities (Ryer et al., 2004) and food sources (van der Zee et al., 2012) for associated species, and decrease turbidity due to attenuation of waves and currents (Lenihan, 1999; van der Heide et al., 2011). Such effects of biogenic reefs can stretch well beyond the actual physical extent of these organisms (van der Zee et al., 2012; Donadi et al., 2013). As a result, biogenic reefs often form biodiversity hotspots and can be considered key components of marine ecosystems (Roberts et al., 2002; Christianen et al., 2016; van der Zee et al., 2016). Unfortunately, biogenic reefs are generally assumed to be vulnerable to (external) physical disturbances, due to their emergent structures (Collie et al., 2000; Sciberras et al., 2018) and the time required for these reef structures to recover (Hiddink et al., 2019). Biogenic reefs are therefore prioritized in nature conservation. Various legislative bodies exist to protect biogenic reefs, for instance by the designation of protected areas that locally restrict anthropogenic use and thus prevent any anthropogenic disturbance (Costello and Ballantine, 2015; Boonzaier and Pauly, 2016; Fariñas-Franco et al., 2018). However, there is no real consensus as to what characteristics are required for biogenic reefs in order to become protected. Within the European Habitats Directive (European Commission, 1992), for instance, these characteristics are limited to the general statement that reefs (1) arise from the seafloor and (2) support a zonation of benthic communities (European Commission, 2013). As a result, the more stable reefs with persistent associated communities are generally favored for conservation (Hendrick and Foster-Smith, 2006).
The ross worm (Sabellaria spinulosa) is a biogenic reef builder in soft-sediment environments (OSPAR Commission, 2013; Fariñas-Franco et al., 2014). This polychete builds strong, cohesive tubes by cementing sand particles, which can form biogenic reefs when they aggregate in high densities (Hendrick and Foster-Smith, 2006; Lisco et al., 2017). S. spinulosa has a widespread distribution, with observations in the northeast Atlantic, the greater North Sea including the Skagerrak, Kattegat and English Channel, the Mediterranean, and the Indian Ocean (Pearce, 2014; Gravina et al., 2018). Reef structures are dominantly formed in areas with a continuous supply of suspended sand particles and nutrients (Lisco et al., 2017). In the North Sea, most reefs are located near the British coast (Fariñas-Franco et al., 2014; Gibb et al., 2014; Pearce, 2014). They are often encountered on rocky substrates (Pearce, 2014), but are also observed on sandy bottoms (Pearce et al., 2014; Jenkins et al., 2018). The worms excrete fecal matter that may increase local food availability (Pearce, 2014), while the reefs increase habitat complexity and provide refugia and settlement substrate (Hendrick and Foster-Smith, 2006; Pearce et al., 2013; van der Reijden et al., 2019). The long-clawed porcelain crab (Pisidia longicornis), for instance, is well-known to hide between the individual tubes of S. spinulosa reefs (Fariñas-Franco et al., 2014; Pearce, 2014; van der Reijden et al., 2019). The reefs form biodiversity hotspots (Gravina et al., 2018), with locally distinct endobenthos and epifauna communities (Fariñas-Franco et al., 2014). As such, S. spinulosa reefs are included as priority habitats under both the Habitats Directive (European Commission, 1992) and the OSPAR convention (OSPAR Commission, 2013). Hendrick and Foster-Smith (2006) introduced a scoring system to evaluate the “reefiness” of S. spinulosa reefs under the Habitats Directive. They propose to assess a reef on physical, biological and temporal characteristics, such as elevation, biodiversity, and stability, respectively, on a continuous scale from low to high. In addition, they state that some threshold values could be set in place for specific characteristics, like a minimal total extent. However, multiple characteristics are difficult to assess as they require detailed information over a longer time period, resulting in the need for multiple surveys with advanced sampling techniques. Whereas several advanced methods have been developed to study intertidal or shallow subtidal reefs at the required spatiotemporal scales (Collin et al., 2019; Ventura et al., 2020), the application of these methods is less suitable in deep or turbid waters.
In 2017, S. spinulosa reefs were discovered for the first time on the Dutch Continental Shelf, in the Brown Bank area (van der Reijden et al., 2019). This area is characterized by large-scale (5–10 km) tidal ridges, superimposed with dynamic, migrating bedforms at smaller scales: sand waves with wavelengths of ∼200 m, and megaripples with wavelengths of ∼10 m (Knaapen, 2009; van Dijk et al., 2012; Koop et al., 2019). In addition, the area is fished at least once a year by demersal fisheries (van der Reijden et al., 2018, 2019). The multi-scale seafloor morphology potentially offers S. spinulosa small-scale safe sites to these fisheries, allowing them to persist and form reef patches in this area (van der Reijden et al., 2019). At the same time, the highly dynamic environment is likely to limit reef stability and therewith promote patchy reef formation. As a result, the protection status of these reefs may also be limited.
In this study, we aimed to determine the ecological relevance of these patchy, dynamic S. spinulosa reefs and the implications for the conservation of such reefs. During two research campaigns in autumn 2017 and May 2019, we investigated S. spinulosa reef patches in the dynamic Brown Bank area on the Dutch Continental Shelf. By means of acoustic, videographic and boxcore data, we assessed their spatial extent and associated endobenthic and epifaunal assemblages. We subsequently discuss the implications of our observations for reef conservation policy.
Materials and Methods
Study Area
This study focused on the Brown Bank area within the Dutch sector of the North Sea (52°36′09.461″ N, 3°18′54.884″ E; Figure 1A). This region is characterized by stable north-south oriented tidal ridges, with amplitudes ranging from 7.5 to 29 m for the Brown Bank tidal ridge (Knaapen, 2009; van Dijk et al., 2012). Sand waves are superimposed on these ridges, with average wave lengths of ∼200 m, amplitudes of several meters and orientated in a northwest to southeast direction. Smaller scaled megaripples are found superimposed on the sand waves. These megaripples have wavelengths of ∼10 m, amplitudes of ∼0.5 m, and an east-west orientation (Koop et al., 2019). Both sand waves and megaripples are known to migrate. Sand waves migrate several meters a year (Knaapen, 2005; Knaapen et al., 2005), whereas the migration speed of megaripples is not entirely clear but assumed to be site-specific with speeds up to 1 m h–1 reported for megaripples in the Dover Straits (Idier et al., 2002).
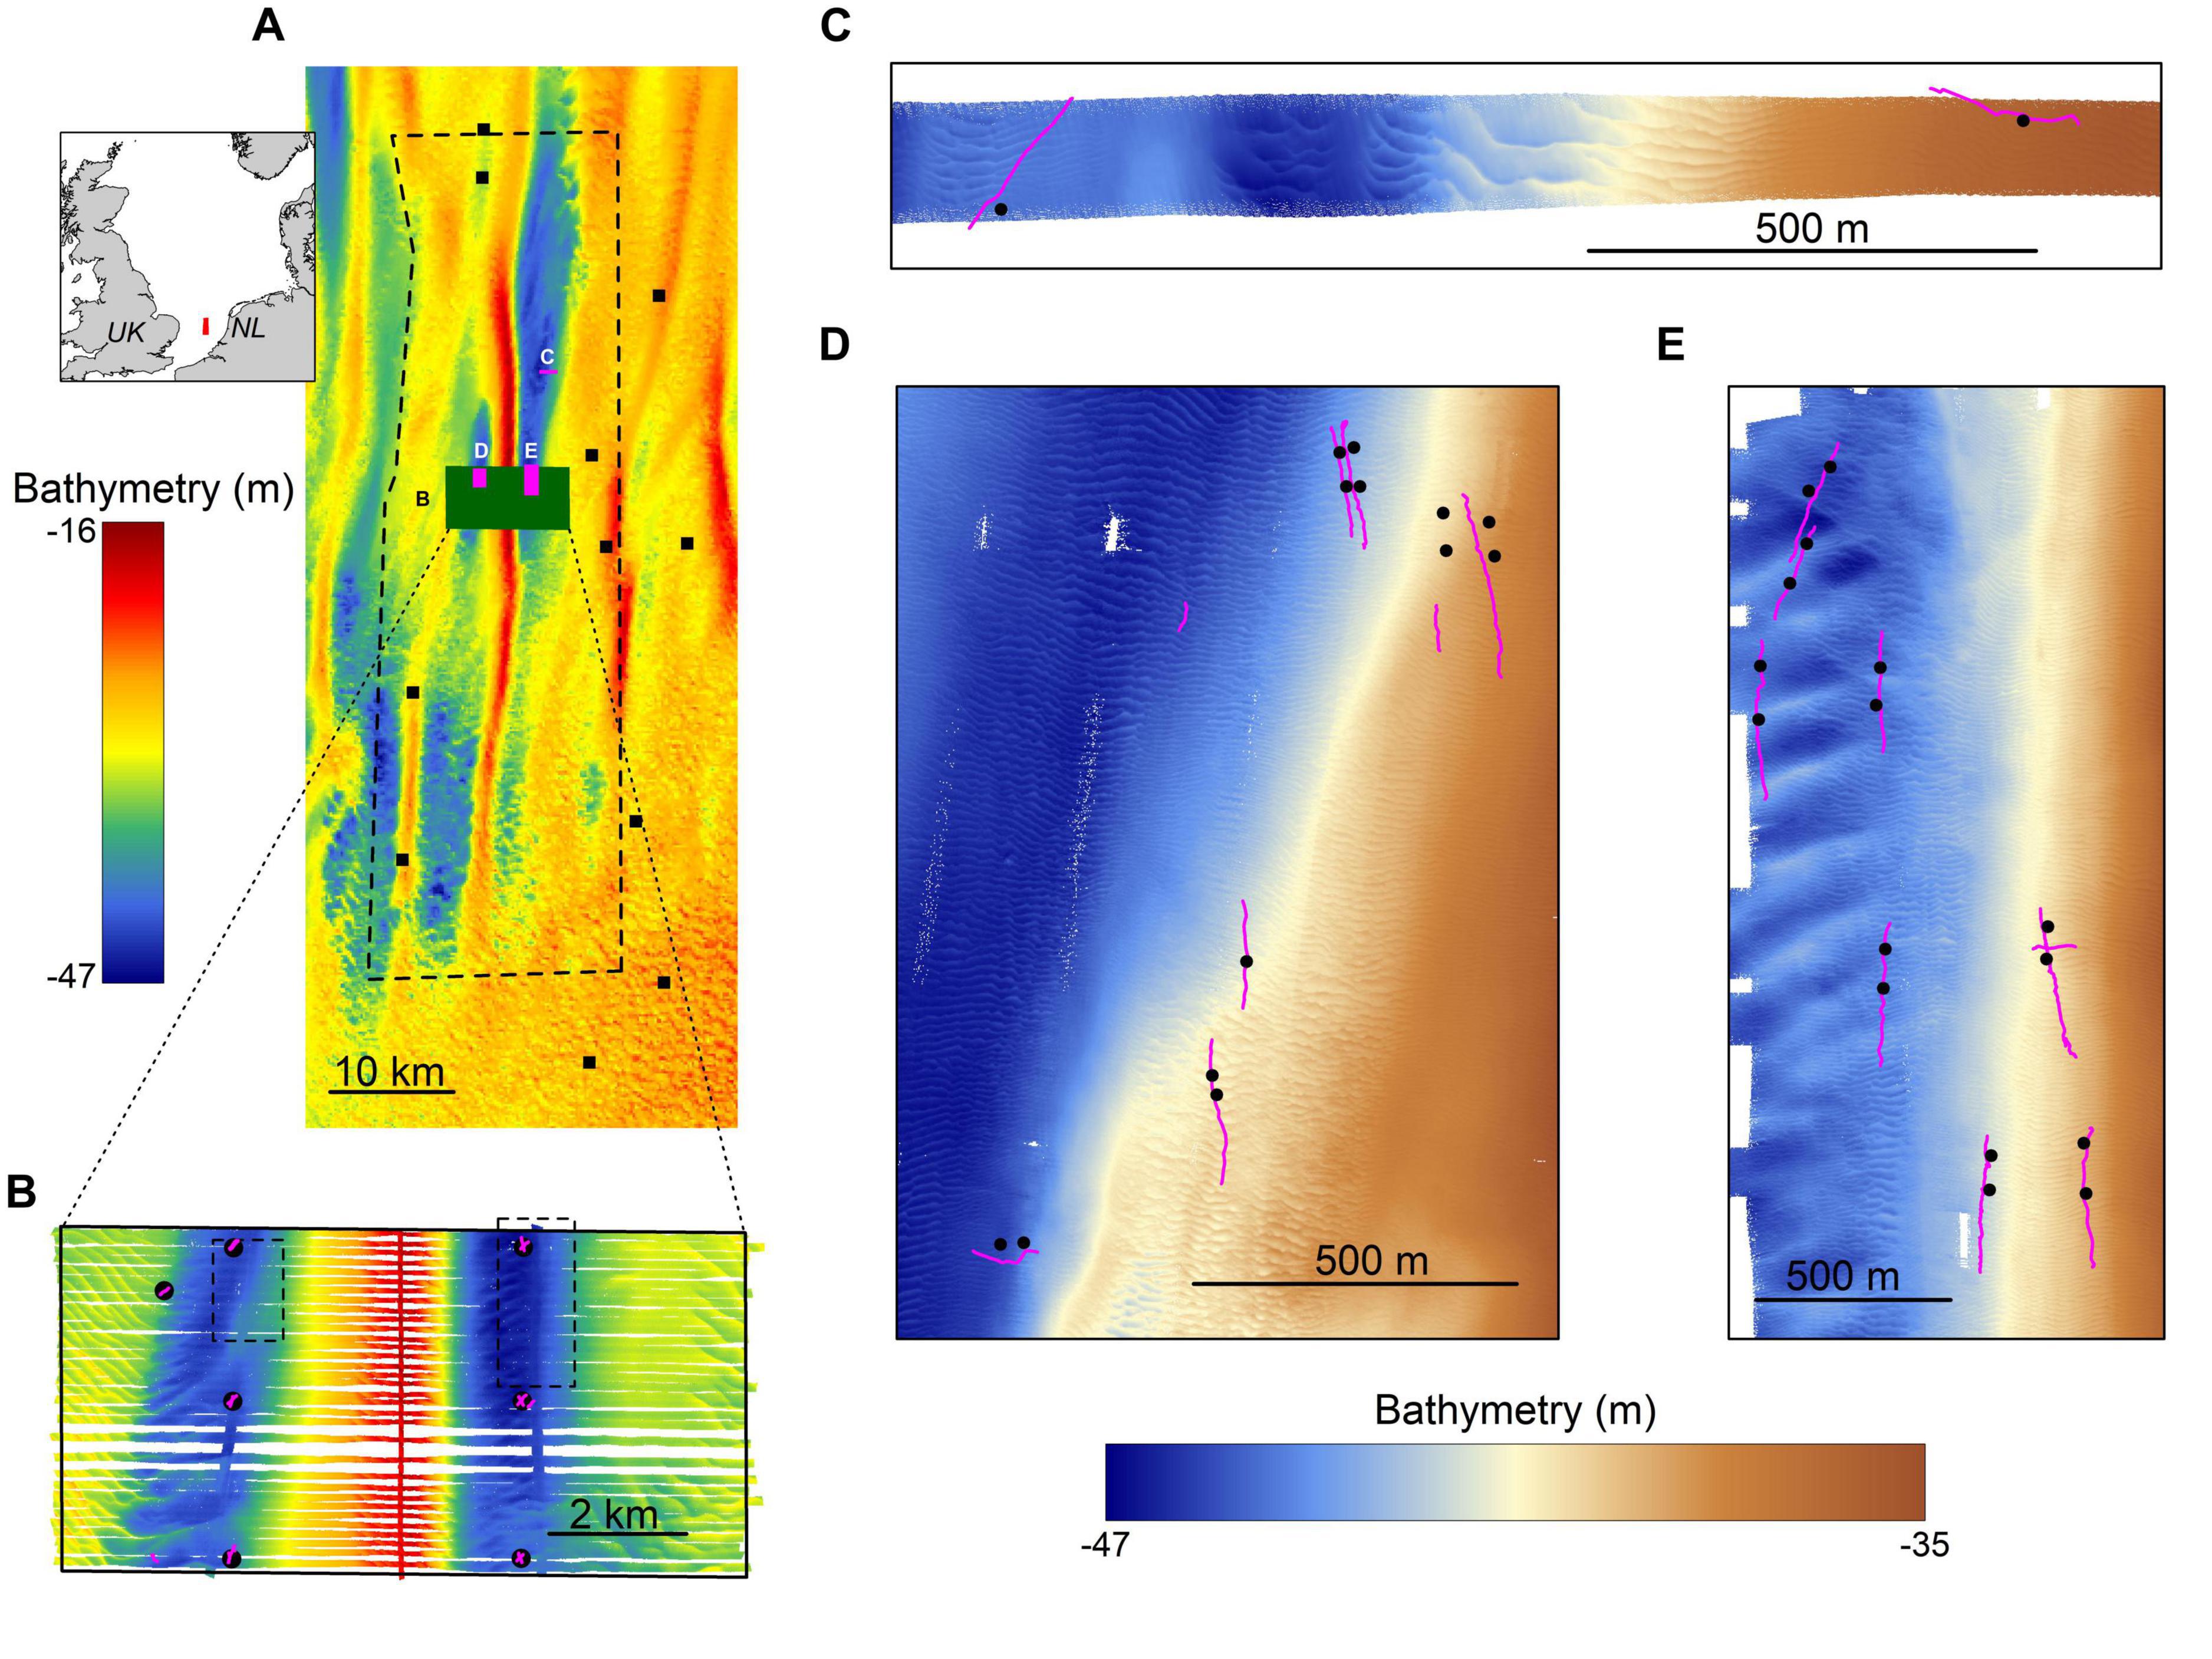
Figure 1. The study area. (A) an overview of the Brown Bank area including bathymetry, sampling locations for the MWTL- survey (squares) and the locations of more intensively studied areas displayed in other panels. Inset shows the location of the study area within the North Sea. (B) an overview of data gathered in the research campaign of 2017, showing bathymetry data (background), boxcores (black circles) and video transect locations (pink lines) and the locations of panels (C,D) (dotted lines). (C–E) close-up of the three survey areas in the 2019 campaign, showing bathymetry data, boxcore and video transect locations. Note the differences in bathymetry color scales used for panels (A,B) and (C–E).
Research Campaigns
For this study, two research campaigns were conducted on board of the RV Pelagia; one in October-November 2017 and one in May 2019. The 2017 campaign aimed to study the spatial effects of the large-scale tidal ridge on benthic communities. It covered a study area of 5 × 10 km with sampling positions determined by the structure of the tidal ridge (Figure 1B). Only the stations located in the troughs have been included for this particular study, as the S. spinulosa reefs have been observed in the troughs exclusively (Mestdagh et al., 2020). The 2019 campaign was a dedicated survey aimed to study the ecological relevance of the S. spinulosa reefs discovered in 2017. For this, three smaller, separate survey areas were selected, in which the locations of videographic and boxcore samples were determined based on a preliminary analysis of freshly acquired acoustic data (Figures 1C–E). In addition, the sampling design was furthermore focused to have minimal impact on the reefs, by minimizing the number of boxcores and using a drop camera that hovered above the seafloor. To summarize, acoustic, videographic and boxcore data were gathered during both campaigns, but with slightly different methods. These will therefore be described separately for both years.
Acoustics
Data Collection
During both campaigns acoustic data were gathered with a hull-mounted Kongsberg EM 302 multibeam echosounder (MBES), which was operated at 30 kHz. In the 2019 campaign, acoustic data was also collected using the multi-spectral R2Sonic MBES, operating at 90, 200, and 400 kHz. This second MBES was mounted on a pole on the vessels’ portside. Because the R2Sonic was newly installed, a patch test was performed prior to survey operations, using a shipwreck as a ground object. This patch test validated that the MBES was correctly installed by acquiring validation data while sailing a standard set of survey lines designed for such a test (R2Sonic LLC, 2017). Location data was provided by a Kongsberg Seapath 360 global positioning system and motion reference unit. The 2017 acoustic data was cleaned and processed as described in Koop et al. (2019), while more details on cleaning and processing of the R2Sonic data can be found in Koop et al. (2020).
Data Processing
The acoustic surveys yielded nearly 60 km2 of surveyed seabed (2017: 41.18 km2; 2019: 17.23 km2), with a resolution of ∼1 × 1 m for 2017 and 0.75 × 0.75 m in 2019. Small-scale (10 m) Bathymetric Position Indices (BPIs) were then derived from the bathymetry, using the Benthic Terrain Modeler toolbox add-in for ArcGIS1 (ESRI, 2018; Walbridge et al., 2018). These BPIs represent the local depth relative to the average depth of the surroundings and is therefore a suitable method to identify the positioning of morphological structures. We classified our BPI in 3 classes that represented the crests, slopes and troughs of megaripples, by applying visually verified cut-off values of −10 and 10 cm. This means that all pixels ≥10 cm below the average surrounding depth were classified as a trough and all pixels ≥10 cm above were defined as a crest. Pixels between these values are considered to be on a slope. To determine BPI-habitat patch sizes along the video transects, we computed straight line segments at the video locations. These line segments were determined by performing a linear regression on the camera coordinates, with a similar direction as applied in the video transect. Cross-sections of BPI-habitats along these straight video lines were then made, which enabled the calculation of the observed patch sizes.
Videographic Data
Video transects were conducted on both campaigns. During the video transects, vessel speed was kept at ∼0.1 m s–1 with respect to the seabed. The towed camera frames were attached to the starboard side winch, which was located centrally on the vessel. Both systems comprised of a full HD-camera, a set of scaled lasers, and underwater lights attached to a frame. Main differences between the video devices were caused by the differences in the positioning of the camera and the construction of towing cables (Figure 2).
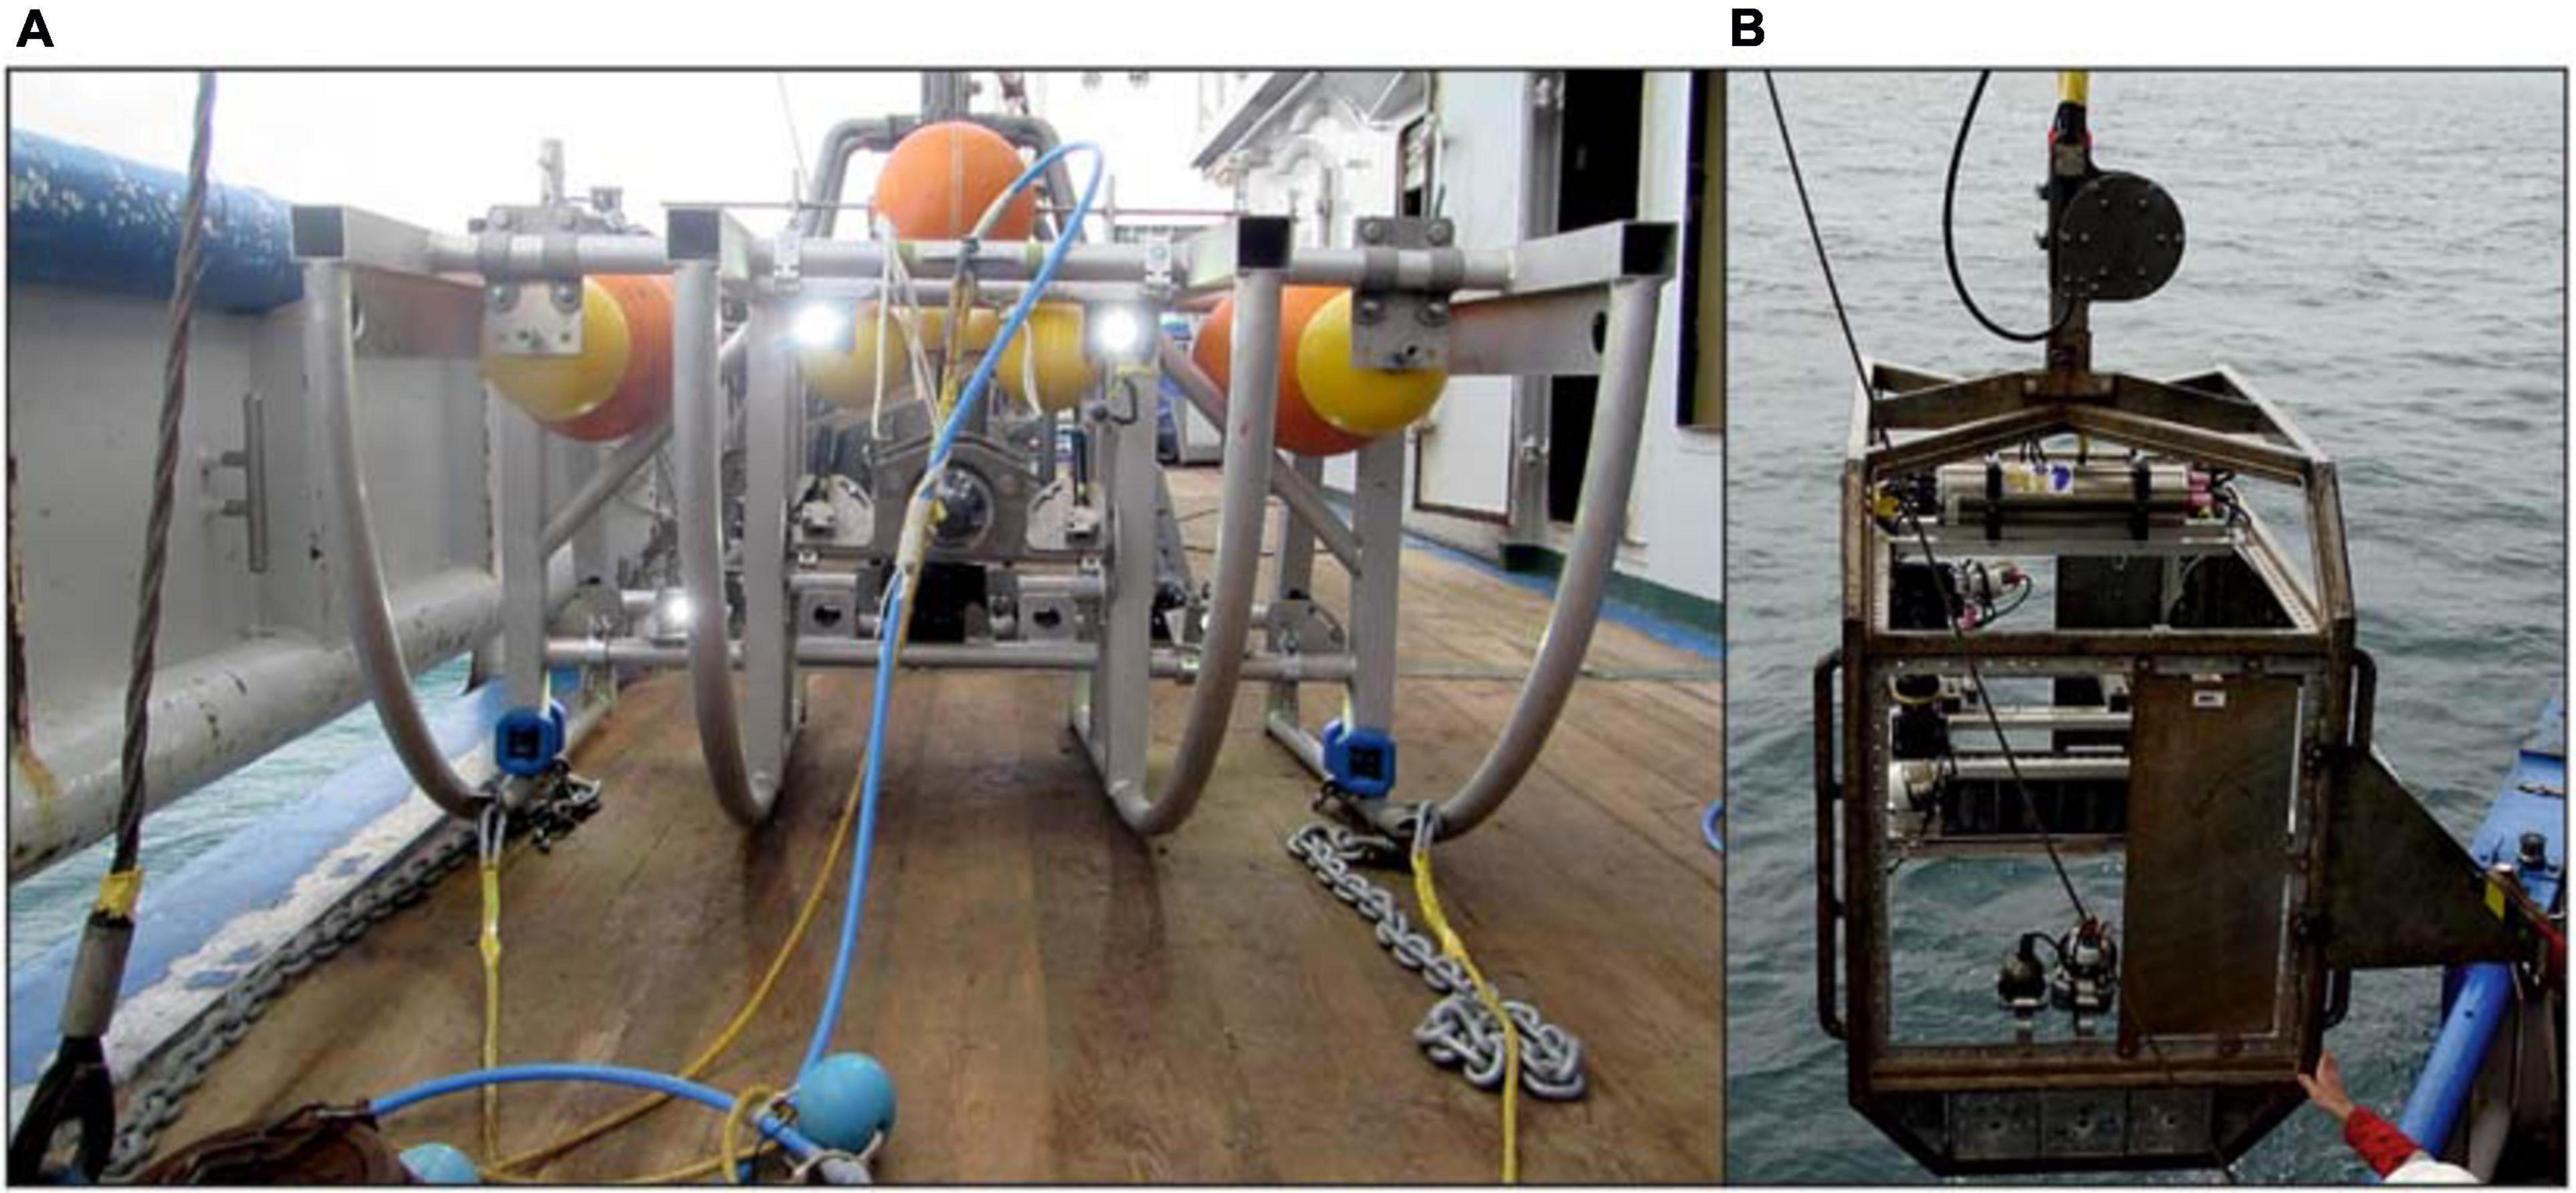
Figure 2. The different camera frames used in this study, showing the towed video frame (A) and the drop camera (B). Note the differences in towing construction and camera set-up. The towed video frame (A) has three (yellow) towing cables on the front of the frame, and a forward-facing camera. For the drop camera (B), the towing cable is attached to the top of the frame, and has a downward-facing camera. Photo credits to Danielle Prins-de Jonge (A) and Jip Vrooman (B).
2017 Campaign
A video sledge was used in the 2017 campaign. The frame was designed to float in the water, at a stable height above the seafloor. This was achieved as a result of two specific construction aspects (Barker et al., 1999; Sheehan et al., 2010). Firstly, three towing cables were attached to the front of the frame at the left and right side of the bottom, and in the middle on top (Figure 2A). After 6.5 m, these were combined into one towing cable, which was connected to the winch. At the conjunction point, a drop weight (55 kg) was added to ensure the horizontal position of the three towing cables. A live-view enabled manual adjustments of the towing cable length if needed. Secondly, the camera frame itself had a slightly positive buoyancy which was neutralized by two drag chains attached to both sides of the frame. The ends of these drag chains touched the seafloor, and stabilized the frame at a specific height. The video sledge is described in more detail in Koop et al. (2019) and Mestdagh et al. (2020). During the ∼200 m long video transects, the video sledge hovered around 0.5–1 m above the seafloor, with the camera set to view an area of ∼0.25 m2 just in front of the frame. At both the eastern and western trough, two replicate video transects were performed at three different latitudes (Figure 1B. Top: 52°37′22.897″ N, middle: 52°36′11.210″ N, bottom: 52°34′55.329″ N). In addition to these 6 stations, three extra stations were picked based on observations within the acoustic data, at which a total of four video transects were conducted.
2019 Campaign
In the 2019 campaign, a hopper camera was used to perform the video transects. A Kevlar cable was centrally attached on top of the frame, which resulted in a vertical drop of the camera from the winch (Figure 2B). Height above the seabed was manually controlled based on a live-view, and was estimated to be around 1.5–2 m. The downward facing camera recorded an area of ∼1 m2. More details on the camera specifics can be found in Damveld et al. (2018). A total of 19 video transects was conducted. The location of each transect was chosen based on a preliminary analysis of acoustic data.
Data Processing
All footage with unclear visibility of the seabed was classified as invalid. Analysis of all valid footage comprised the recording of observed organisms and prevailing habitats. Specimens were identified to the lowest taxonomic level possible. Habitats were defined by their sediment features, resulting in three different habitats: (1) Sand, (2) Rubble, and (3) Sabellaria (Figure 3). Sand habitats classified all seafloors that were comprised of plain sand without any deviating features apart from some small shell fragments. Rubble and Sabellaria habitats were comprised of seafloor habitats that both contained a sandy seafloor, with coarser material like small stones and/or many shell fragments (Rubble) or Sabellaria reef fragments (Sabellaria). As a consequence, Sabellaria habitats do not necessarily have a 100% coverage of S. spinulosa reefs. For both research campaigns, an example screenshot of each habitat is shown in Figure 3.
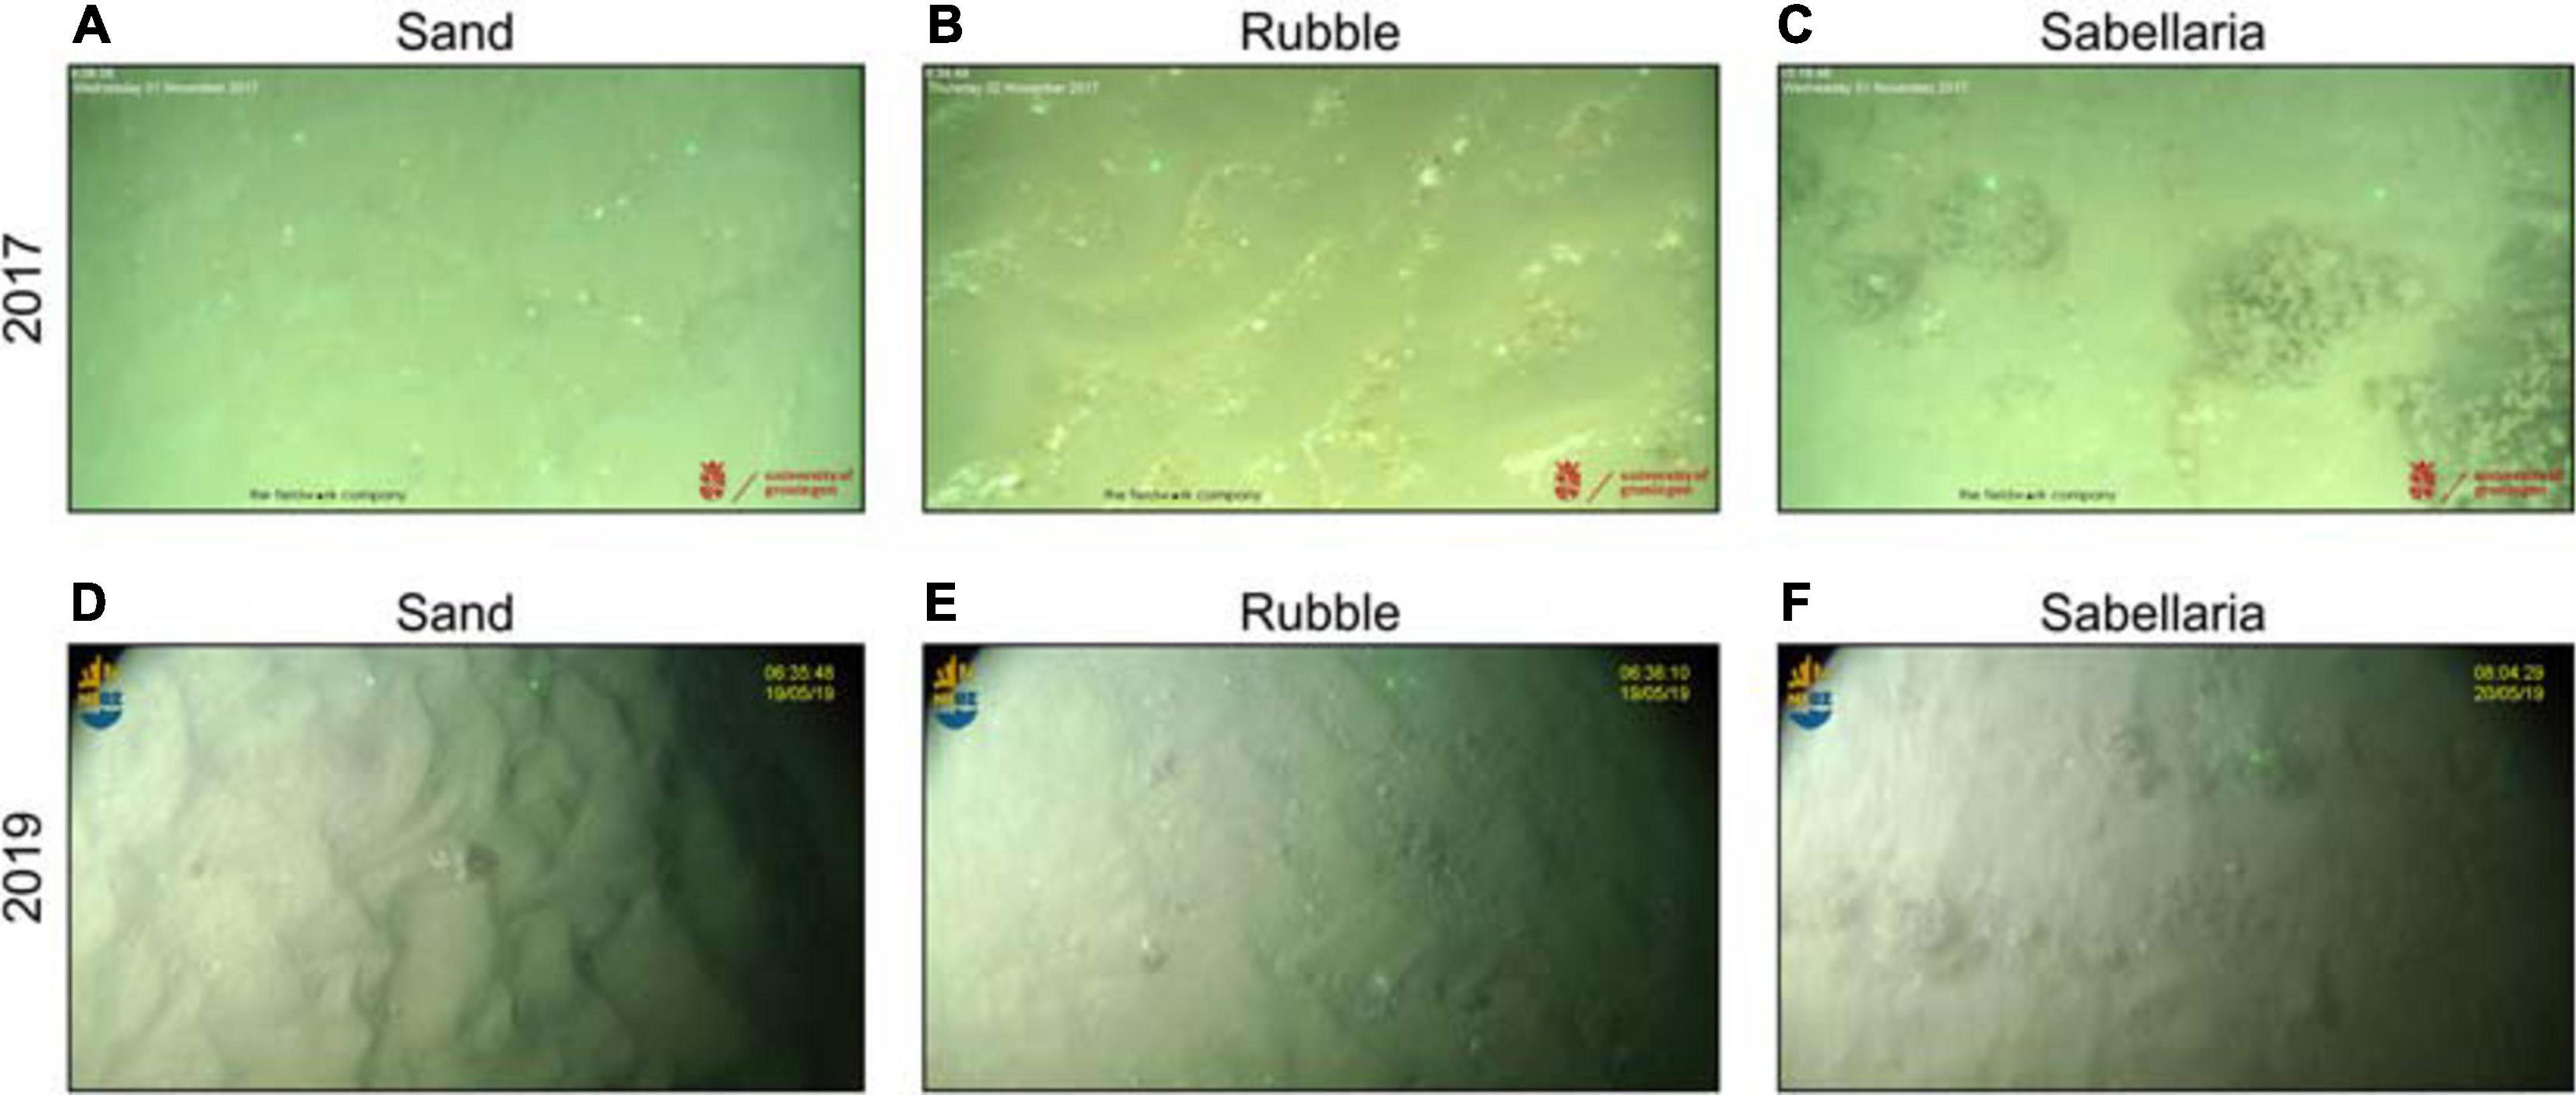
Figure 3. Habitat types observed in video transects. (A) sand habitat in 2017. (B) rubble habitat in 2017. (C) sabellaria habitat in 2017, with several S. spinulosa reef fragments, two starfish (Asterias rubens) and a dragonet (Callionymidae). (D) sand habitat in 2019, showing a hermit crab (Pagurus bernhardus). (E) rubble habitat in 2019. (F) sabellaria habitat in 2019, showing several S. spinulosa reef fragments, and three starfish (A. rubens). Green dots are lasers, set to a distance of 35 cm and 30 cm for 2017 (A–C) and 2019 (D–F), respectively.
The camera location was derived from the vessels’ GPS logging system, which registered the vessels’ location every 30 s. These locations were linearly interpolated to obtain a GPS position for every second. The interpolated vessel positions were then time-matched to camera locations. Depending on the prevailing depth, currents and waves, the distance between the camera and the vessel varied, causing for a positioning error of the camera. Because both cameras were deployed approximately in the middle of the vessel, not far from the GPS receivers, and with as little towing cable as possible, we expect this positioning error to be >10 m and <100 m. Moreover, we assume this error to be larger in 2017 compared to 2019 (but still within the given range), due to the horizontal component of the towed camera sledge used in 2017 that the drop camera does not have.
We determined the surveyed area by matching all camera positions to a grid. The grid resolution was 0.5 × 0.5 m in 2017, and 1 × 1 m in 2019, corresponding to the average area observed by the camera. We then summed the number of unique grid cells per habitat type per transect, and calculated the total observed area per habitat type. Habitat patch size was determined as the physical distance between the camera location at the first and last recording of each habitat patch. Large interruptions (>10 s) of the video transects, due to invalidity of footage, were included as patch boundaries.
Boxcores
Data Collection
Endobenthos samples were collected with a boxcorer (30 cm diameter) during both cruises. During the 2017 campaign, triplicate samples were taken at seven sampling stations. In 2019, 31 single boxcores were taken. All samples were sieved over a 0.5 mm sieve in 2017 and a 1 mm sieve in 2019, after which the organisms were stored in 4–6% formaldehyde. Subsequently, organisms were counted and identified to the lowest taxonomic level possible in the laboratory.
We additionally used boxcore data collected by the Directorate General for Public Works and Water Management of the Dutch Ministry of Infrastructure and Water Management for their MWTL-program (“Monitoring Waterstaatkundige Toestand des Lands”). This monitoring program samples endobenthos over the entire Dutch Continental Shelf with a similar methodology as applied in the 2019 research campaign. For this study, we selected the stations within 15 km of the Brown Bank Area, sampled in the summer of 2018. This yielded 11 stations (Figure 1A). Endobenthos densities (N m–2) and species richness (N m–2) were determined and compared to the data gathered at the 2019 research campaign.
Data Processing
Boxcore stations for the 2017 and 2019 research campaigns were spatially linked to video observations. For this, boxcore areas were created by extending the station location with a radius of 50 m. All valid video footage within these boxcore areas were then assigned to that specific boxcore station. Stations without any assigned video observations were removed from the dataset. Remaining boxcores were classified as “Sabellaria” or “no-Sabellaria,” depending on whether any Sabellaria habitat was assigned to that station.
Species nomenclature was checked against the World Register of Marine Species (WoRMS) to ensure validity and similarity of taxonomic names (Holstein, 2018). Then, a taxonomic leveling exercise was performed to increase similarity of species’ taxonomic levels. With this leveling, we specifically wanted to (1) exclude single observations at higher taxonomic levels while the majority of similar specimens was identified to lower taxonomic levels, and to (2) account for the higher taxonomic precision of only a small subset of related observations. An example of the first event is the recording of two amphipods at order level, while all other amphipods were identified to species or genus level. The leveling removed the two registrations at the order level. The second event comprised, for example, the merging of Ensis ensis recordings with the recordings of Ensis sp. as the majority of the observations were made on a genus level. For this leveling exercise, we determined the number of observations for all species, genera, families and orders observed. We then calculated the percentage of observations at each lower taxonomic level with respect to the total number of observations at the corresponding higher taxonomic levels. Within this taxonomic ranking, lower taxonomic levels were merged with a higher taxonomic level if that higher level contributed to more than 50% of the observations. Higher taxonomic records were removed if they contributed to less than 15% of the total observations within the associated ranking. After this species leveling, species richness (N m–2) was determined for all stations, in which the triplicates of 2017 were merged and divided by the total sampled area.
Data Analysis
All data processing and analysis was performed in R, version 3.6.2 (R Development Core Team, 2014).
Epifauna
The video analysis yielded registrations of organism observations and their associated habitat type. For each transect separately, we determined both the habitat-specific epifauna densities (N m–2) and the overall density (N m–2). Epifauna densities represent the observed species densities, determined by the total number of observations for each species within a certain habitat, divided by the total observed surface of that habitat. Overall density represents the total number of organisms per square meter of observed habitat. This resulted in two datasets that represent the epifauna and overall density for each combination of habitat type and transect. A non-Metric Multi-Dimensional Scaling (nMDS) was applied in order to visually determine differences in community composition between habitats separately for both research campaigns. Bray-Curtis dissimilarities were determined based on the epifauna densities and were used as input for this nMDS.
Differences in overall density between habitats were tested for with linear mixed models (LMM) from the lme4-package (Bates et al., 2015), taking the transects as separate sampling locations. These models included “habitat type” as fixed effects, and one of either random factors “station” (2017) and “survey area” (2019) to limit spatial autocorrelation. Pairwise comparisons between habitat types were determined using an a post hoc Tukey test from the emmeans-package (Lenth, 2020). Model assumptions of homogeneity of variance and normality were visually checked by plotting the model residuals.
We also determined differences in species richness between habitats. However, the three habitat types differed in their total observed area, and their ratios were also unequally distributed over the transects. We had to correct for this in our calculations of species richness. Hence, we determined the number of species and the observed area (m2) for each individual habitat patch encountered in the video transects. We then modeled species-area curves using the specaccum-function in the vegan package (Oksanen et al., 2019). These curves represent the total number of species observed over an increasing sampling effort. The presented species-area curves are based on 1,000 permutations comprising random resampling of the different patches, in which each patch was weighted for their sampled surface.
Endobenthos
Both research campaigns were analyzed separately, because the different methods used impacted the results. Community composition was compared between the MWTL survey and the 2019 campaign, for which similar sampling methods were used. For this, Bray-Curtis dissimilarities were determined on fourth root transformed endobenthos densities at the stations sampled in both the MTWL-survey and the 2019 campaign (Reiss et al., 2010). A nMDS was subsequently applied in order to assess distinctions between the MWTL-stations and the Sabellaria and no-Sabellaria stations of the 2019 campaign. A similar analysis was performed for the 2017 campaign. A pairwise PERMANOVA, based on Bray-Curtis dissimilarities, was used to test for significant differences in community composition between stations. Both the nMDS and the PERMANOVA used the vegan-package (Oksanen et al., 2019).
In addition, total species richness was compared between habitat types. Differences in richness were tested with an ANOVA and a subsequent post hoc Tukey test. Model assumptions were visually checked.
Results
Habitat Patchiness
The 35 video transects covered a total area of 6295.75 m2 (2017: 1050.75 m2; 2019: 5,245 m2), with three types of habitat: Sand (4674.25 m2), Rubble (767 m2), and Sabellaria (854.50 m2). For 2017, 73% was comprised of Sand habitat, with the remaining area being ascribed to 9% Sabellaria (95.50 m2) and 18% Rubble (190 m2) habitat. In 2019, a similar percentage of Sand habitat was observed (75%), but slightly more Sabellaria habitat was observed, with 14% (759 m2) and 11% (577 m2) for Sabellaria and Rubble habitat, respectively.
Video transects revealed a patchy distribution of the different habitats, with alternating patterns. In 2017, Sand habitats often alternated with Rubble habitats (Figure 4A). The limited Sabellaria habitat observed in 2017 (24 patches) showed a similar alternating pattern with Sand habitat, but consisted generally of larger patches than the Rubble habitat (Figure 4B). Habitat patches were 5.57 ± 0.99 m (mean ± SE) for Sabellaria, 4.13 ± 0.35 m for Rubble, and 9.13 ± 0.81 m for Sand habitat. In 2019, a similar alternating habitat pattern was observed (Figures 4D,E). Patch sizes of the Sabellaria and Rubble habitats, however, were smaller than in 2017 (Sabellaria: 3.94 ± 0.22 m, Rubble: 3.58 ± 0.29 m, Sand:11.12 ± 1.10 m).
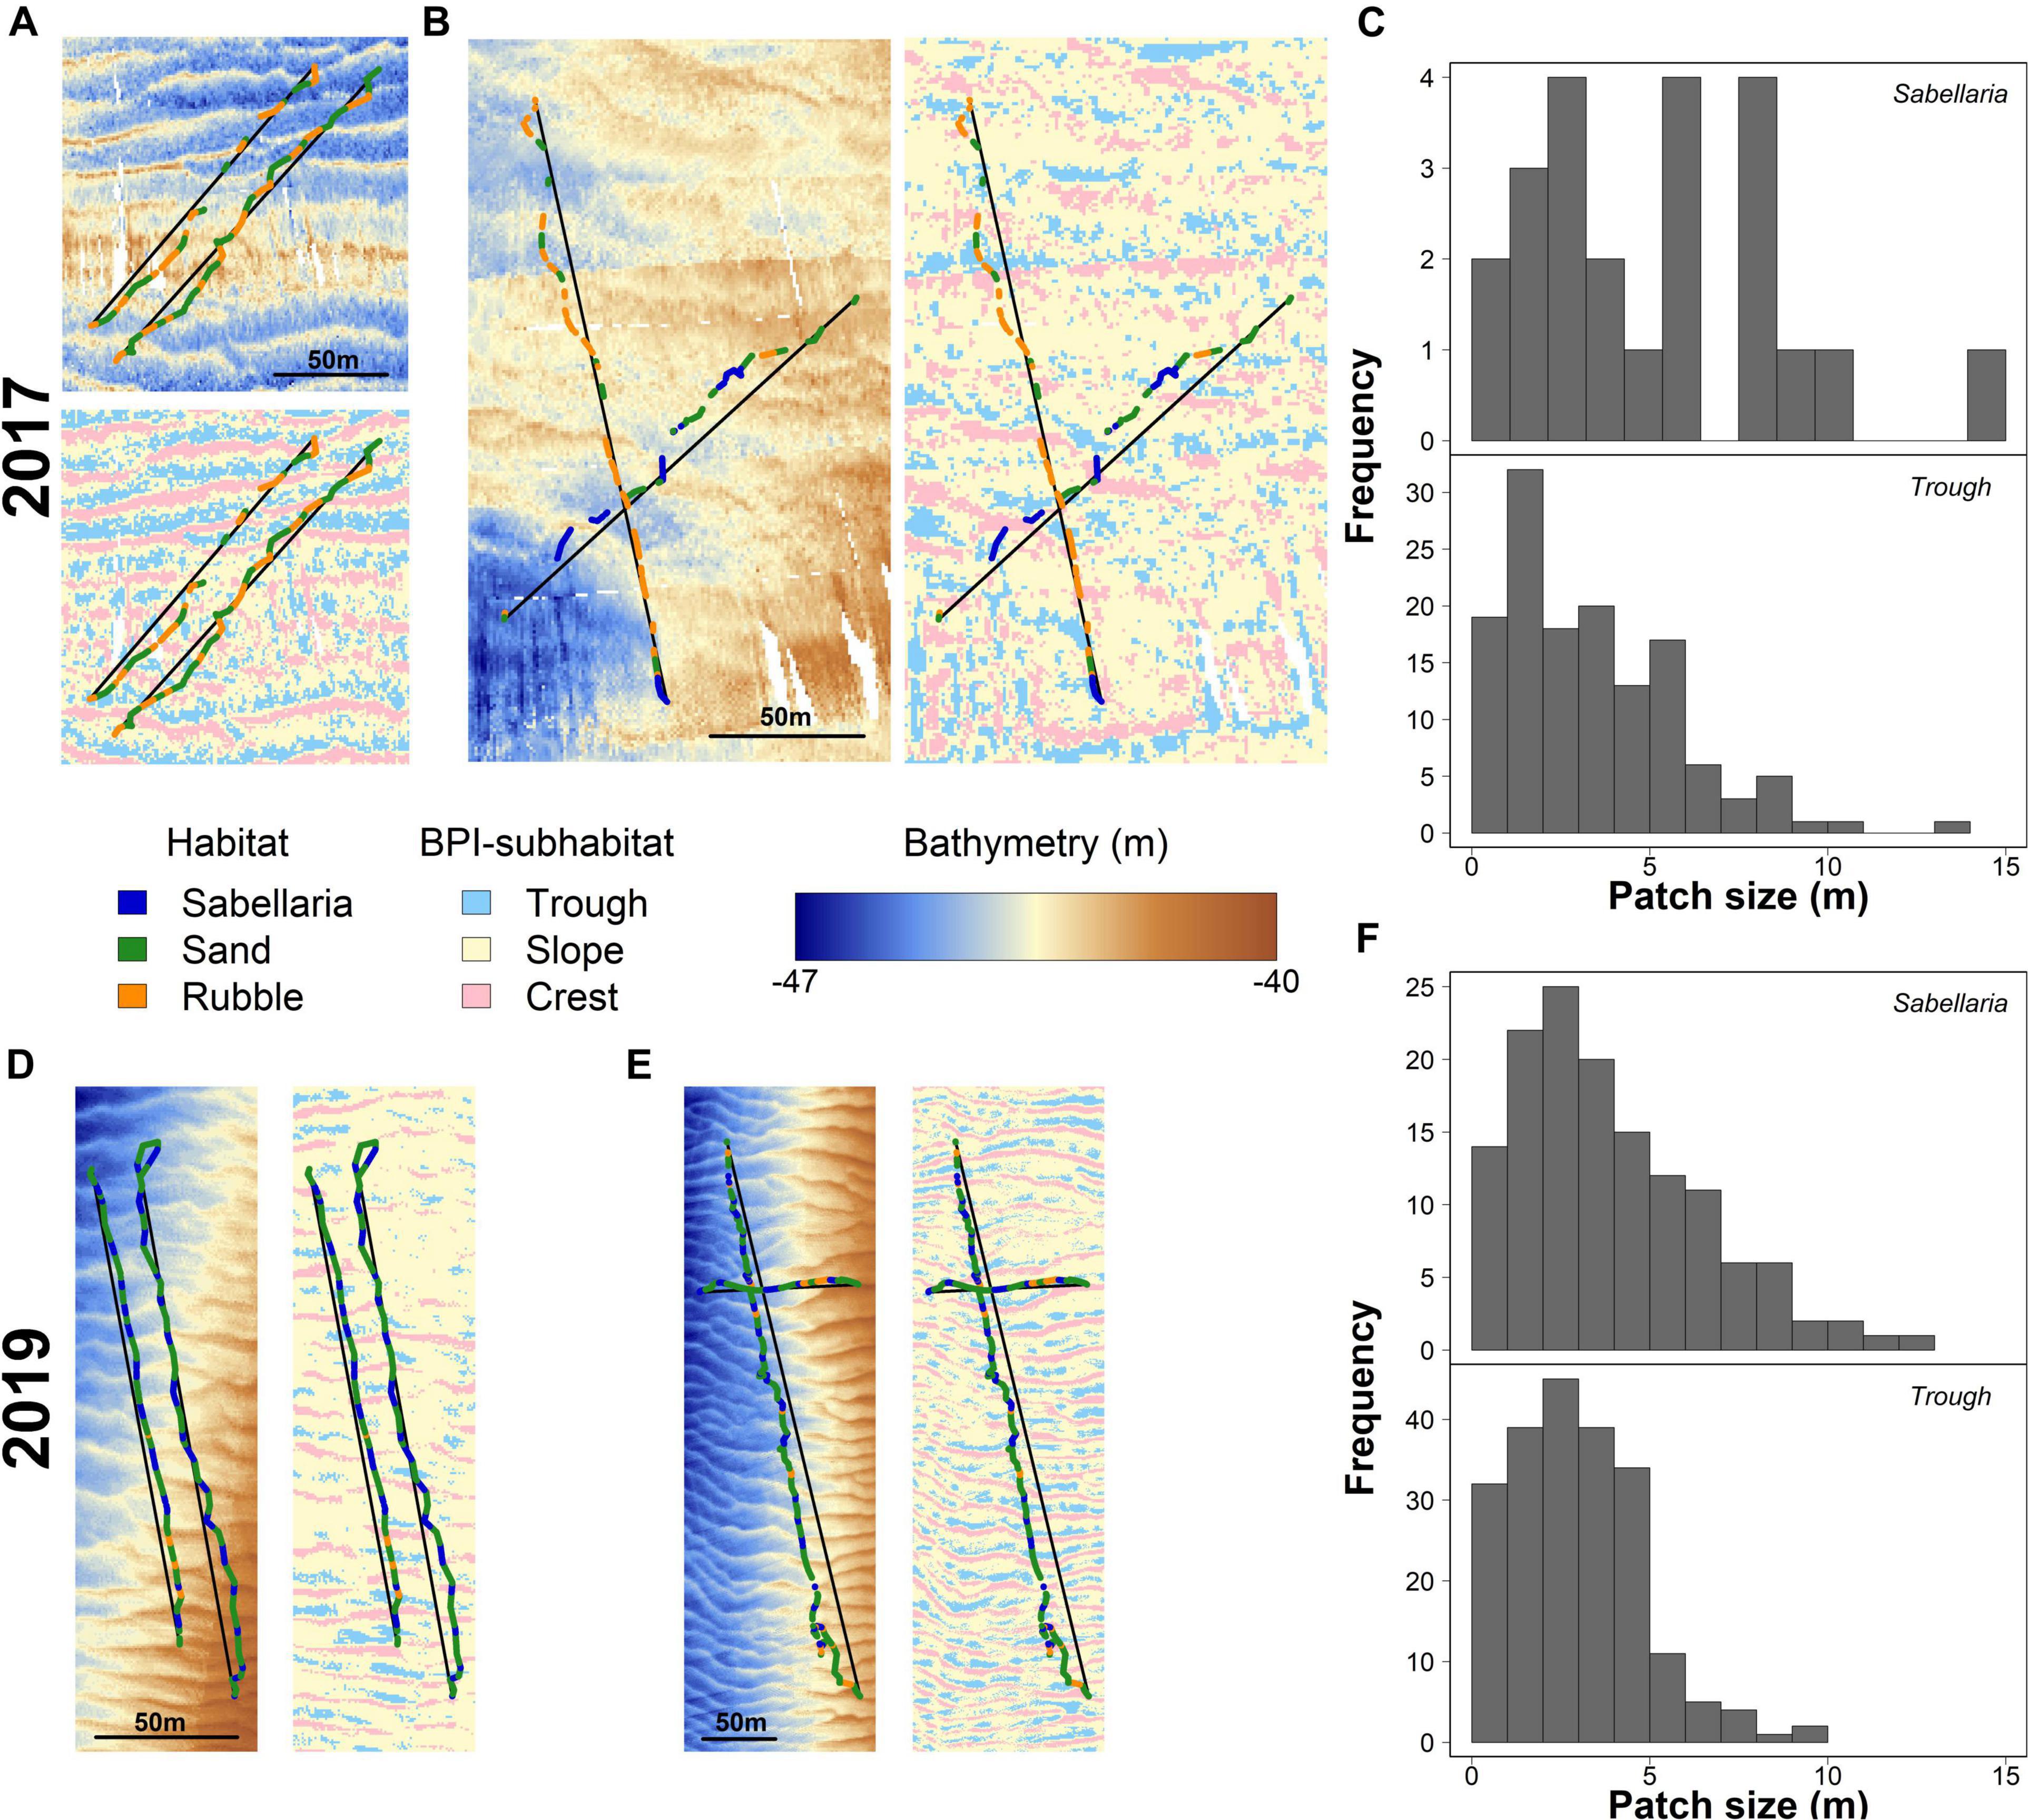
Figure 4. Habitat patch distributions and their link to seafloor morphology for 2017 (A–C) and 2019 (D–F). (A) detailed maps showing the bathymetry and BPI-subhabitats surrounding the video-observed habitat patches (Sabellaria in blue, Sand in green, and Rubble in Orange) for two representative video transects gathered in 2017 in the western trough. Black lines represent the line segments used to determine BPI-subhabitat sizes. Similar maps of bathymetry and BPI-subhabitat overlayed with video-observed habitats are shown for (B) 2017, eastern trough, (D) 2019, western trough, and (E) 2019, eastern trough. Histograms show the absolute frequency of the sizes for the video-observed Sabellaria habitat patches and BPI-subhabitats “trough” for 2017 (C) and 2019 (F).
The seabed was shown to have multiple morphological structures, at various scales (Figure 1). The seafloor structure, created by the small-scale megaripples, closely resembled the observed alternating habitat pattern (Figures 4A,B,D,E). The troughs of these megaripples had a mean size of 3.69 ± 0.33 m and 2.98 ± 0.12 m in 2017 and 2019, respectively. The histograms in Figures 4C,F show a strong similarity in Sabellaria patch sizes and megaripple trough sizes. For 2017, this pattern showed less similarities, probably as a result of the low number of Sabellaria habitat patches encountered, their slightly larger sizes (2017: 5.57 ± 0.99 m; 2019: 3.94 ± 0.22 m), and the lower resolution of the bathymetry data (Figure 4C). A similar size comparison could also be made for Sabellaria habitat patches and megaripple crests, as the latter had a comparable mean size (2017: 3.76 ± 0.21 m; 2019: 2.75 ± 0.10 m). However, at multiple occasions during the video analysis, we observed that the seafloor dropped directly before a Sabellaria habitat patch started, indicating S. spinulosa reef presence in the troughs rather than on crests.
Endobenthos
A total of 105 and 121 species were observed in the 2017 and 2019 research campaigns, respectively, which amounted to the observation of 176 species in total. In contrast, only 50 species were observed in the MWTL- survey, of which 10 were exclusively observed in this dataset. Most abundant species in all three datasets were ribbon worms (Nemertea), sand-dwelling amphipods (Bathyporeia elegans, Bathyporeia guiliamsoniana, and Nototropis swammerdamei), the white catworm (Nephthys cirrosa), and a bristleworm (Ophelia borealis) (Supplementary Table 1). The endobenthos community composition did not differ significantly between boxcores classified as Sabellaria and no-Sabellaria for 2019 (Figure 5A). In 2017, the limited number of samples prohibit any firm conclusion on community composition differences (Figure 5B). However, there was a difference in community composition at the landscape-scale (Figure 5A). Community compositions of the small survey areas of the 2019 campaign were shown to deviate from the community composition found in the MWTL survey, representing the wider surrounding area of the Brown Bank (PERMANOVA, p = 0.041). The subsequent pairwise PERMANOVA demonstrated a significant difference between the MWTL survey and the boxcores in the south eastern trough (pair-wise PERMANOVA, p = 0.024).
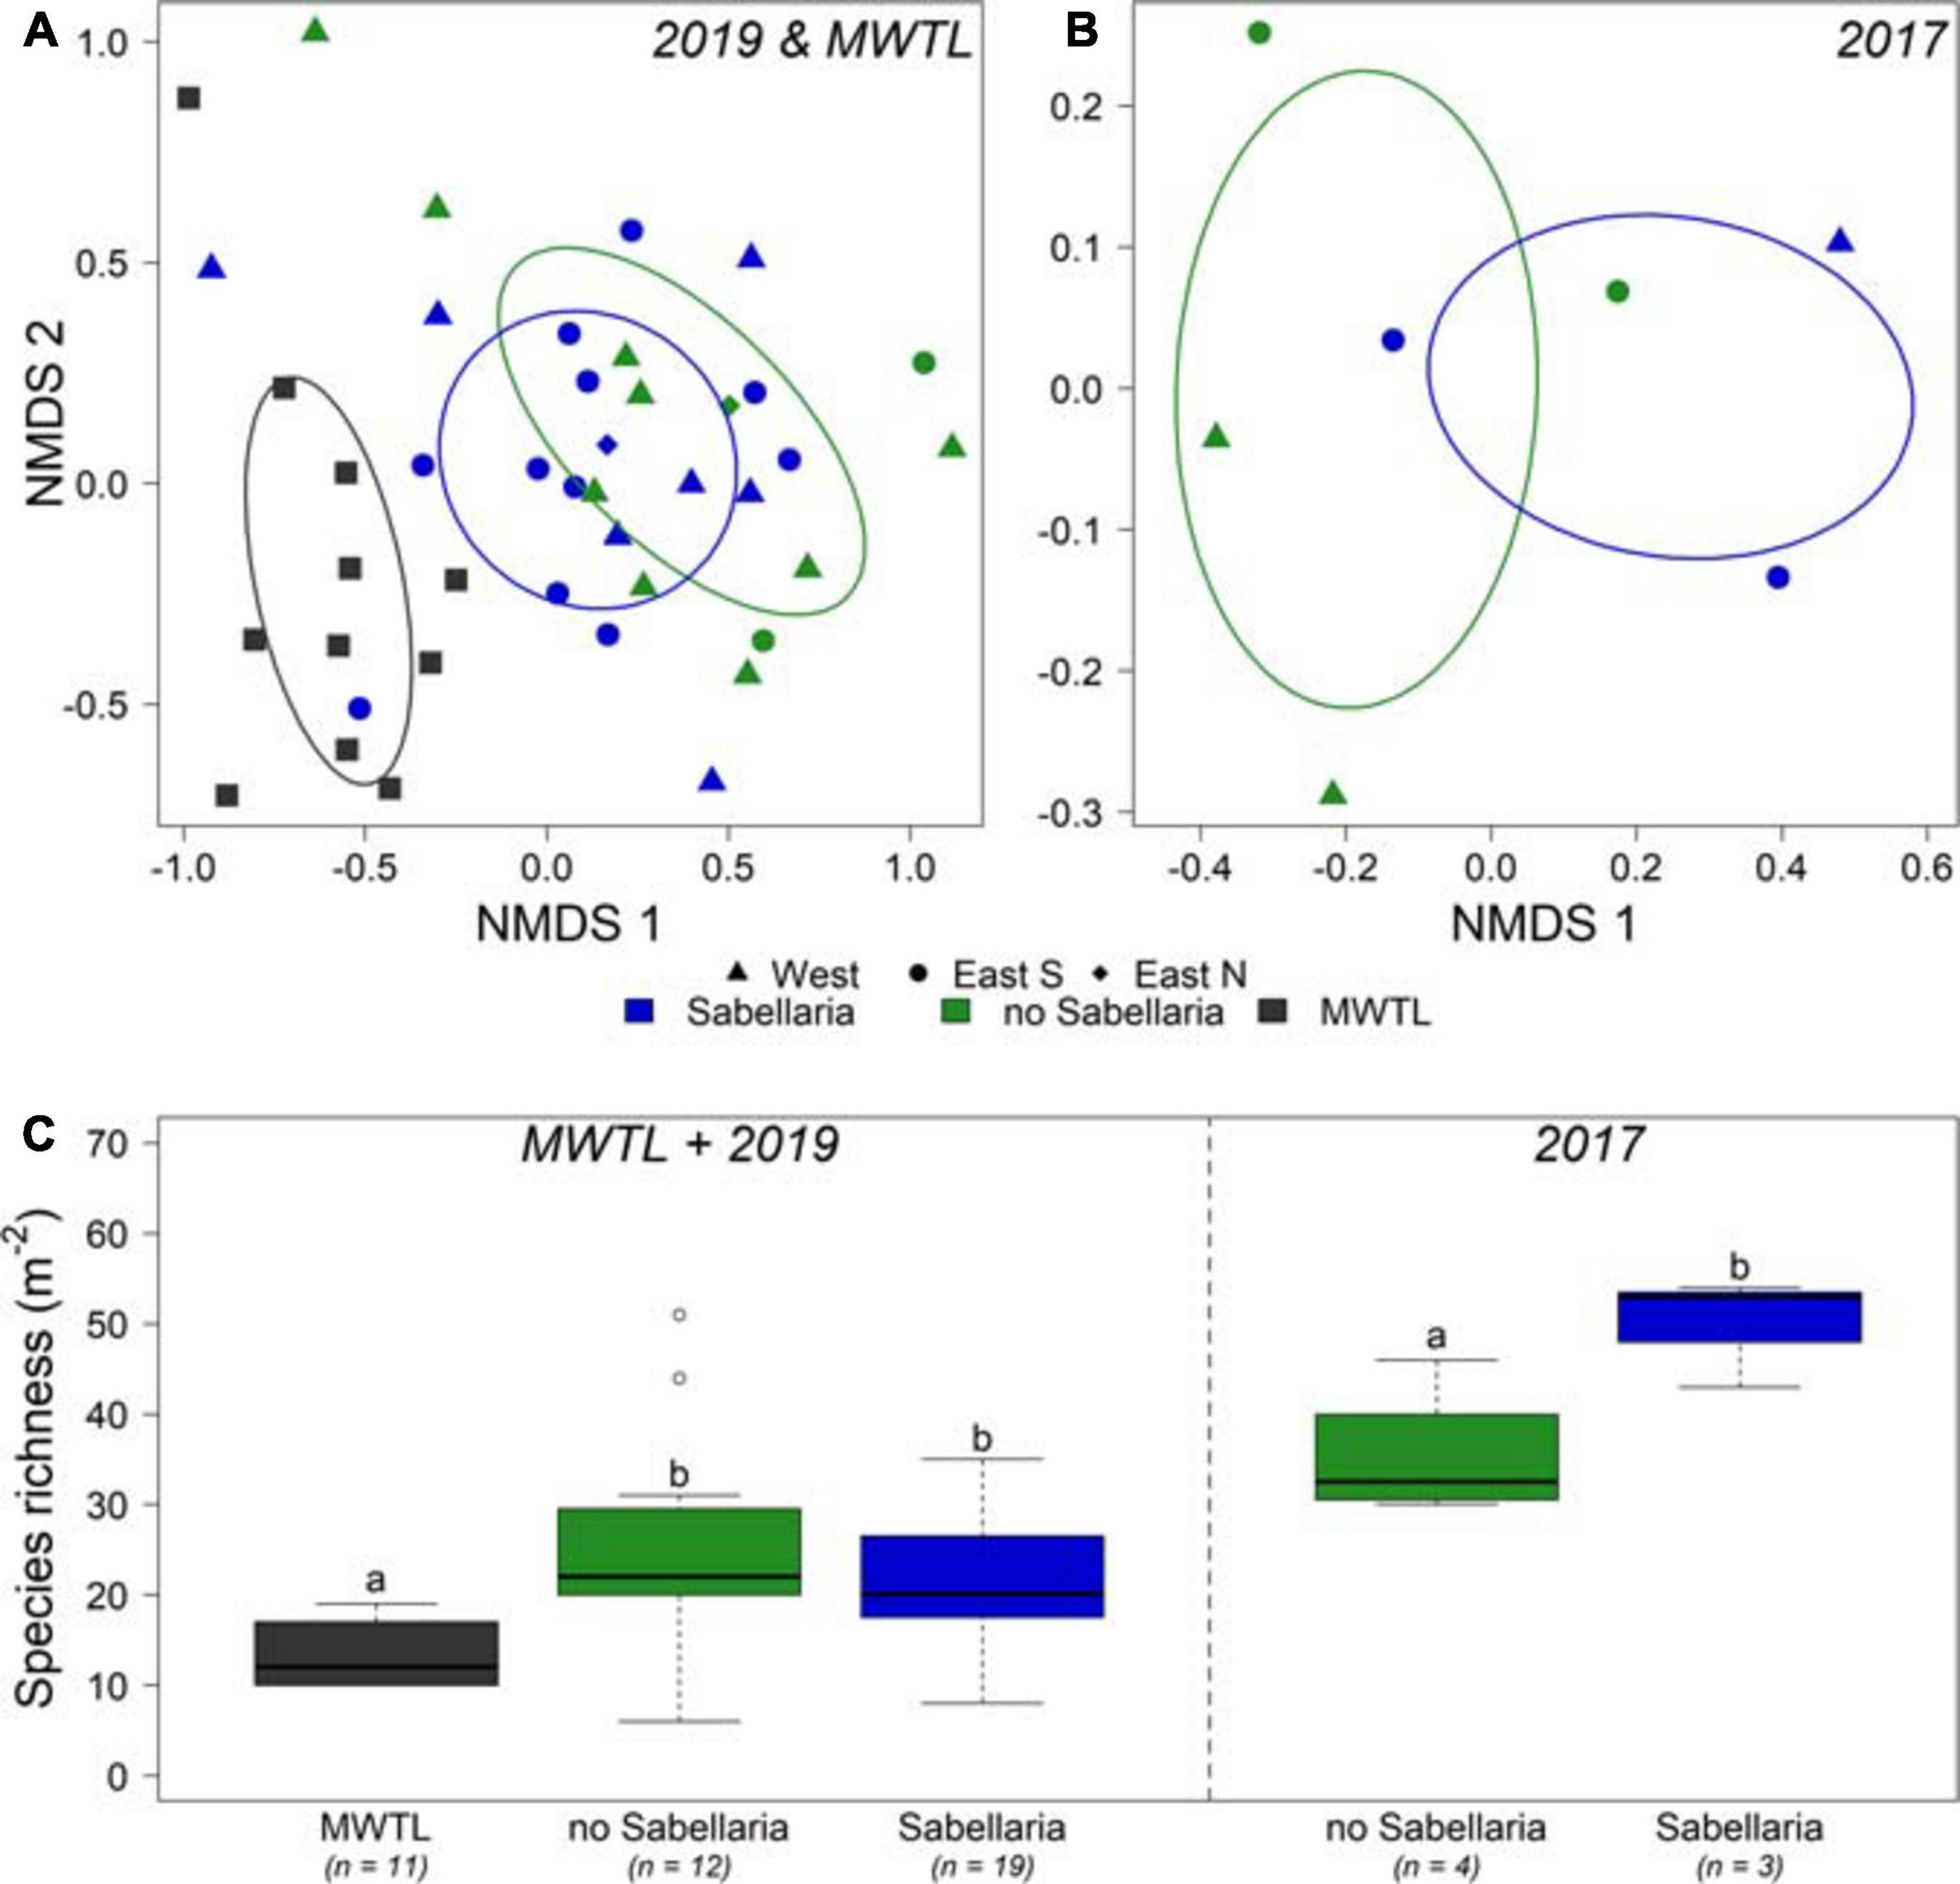
Figure 5. Comparison of endobenthos data between both research campaigns and the MWTL survey. (A) NMDS of endobenthos data gathered in the joint MWTL survey and the 2019 campaign, and for (B) the 2017 campaign. Samples with video-based observed Sabellaria habitat within a 50 m distance are blue; samples without Sabellaria habitat are green. Circles show the western trough, triangles the eastern trough south, and diamonds the eastern trough north. (C) species richness (Nm− 2) is shown per habitat for the MWTL survey and 2019 campaign combined, and separately for the 2017 campaign. n represents the number of boxcores included. Significant differences are represented by different letters. Note that the 2017 campaign data are analyzed separately from the MWTL survey and 2019 campaign data.
In addition, some interesting observations could be made with regard to species richness of the samples (Figure 5C). For 2017, a significant higher species richness was observed in Sabellaria, compared to no-Sabellaria (Sabellaria: 50 ± 3.5; no-Sabellaria: 30 ± 3.7; ANOVA: p = 0.038). Such a significant difference was not observed for the 2019 campaign (Sabellaria: 20.9 ± 1.9; no-Sabellaria: 25.5 ± 2.4: Tukey emmeans: p = 0.305). A significant twofold of species richness compared to the MWTL survey was observed for no-Sabellaria in 2019 (Tukey emmeans: p = 0.004), while a trend toward higher species richness was observed for Sabellaria (Tukey emmeans: p = 0.065). Species richness in 2017 should not be compared to species richness of 2019 and MWTL samples, as different methods were used (smaller sieve and larger sampled surface).
Epifauna
A total of 4,947 epibenthic organisms were observed, comprising 21 species. Dominant species was the common star fish (Asterias rubens). The hermit crab (Pagurus bernhardus) and several demersal fish species were also frequently observed (Supplementary Table 2). Different community compositions were observed between Sand and Sabellaria habitat types (Figures 6A,B). Moreover, overall density was at least twice as high within the Sabellaria habitat compared to the Sand habitat (Figure 6C. LMM 2017 & 2019: p < 0.0001). In 2019, Sabellaria and Rubble habitats had a similar community composition (Figure 6A) and overall density (Figure 6C). An opposite pattern was observed in 2017. Then, Sabellaria and Rubble habitats differed in community composition (Figure 6B). Rubble habitat strongly resembled Sand habitat, with lower overall densities than in the Sabellaria habitat (Figure 6C). The species-area curves of both campaigns show that species richness of the Sabellaria habitat was higher than the Sand and Rubble habitats (Figure 6D).
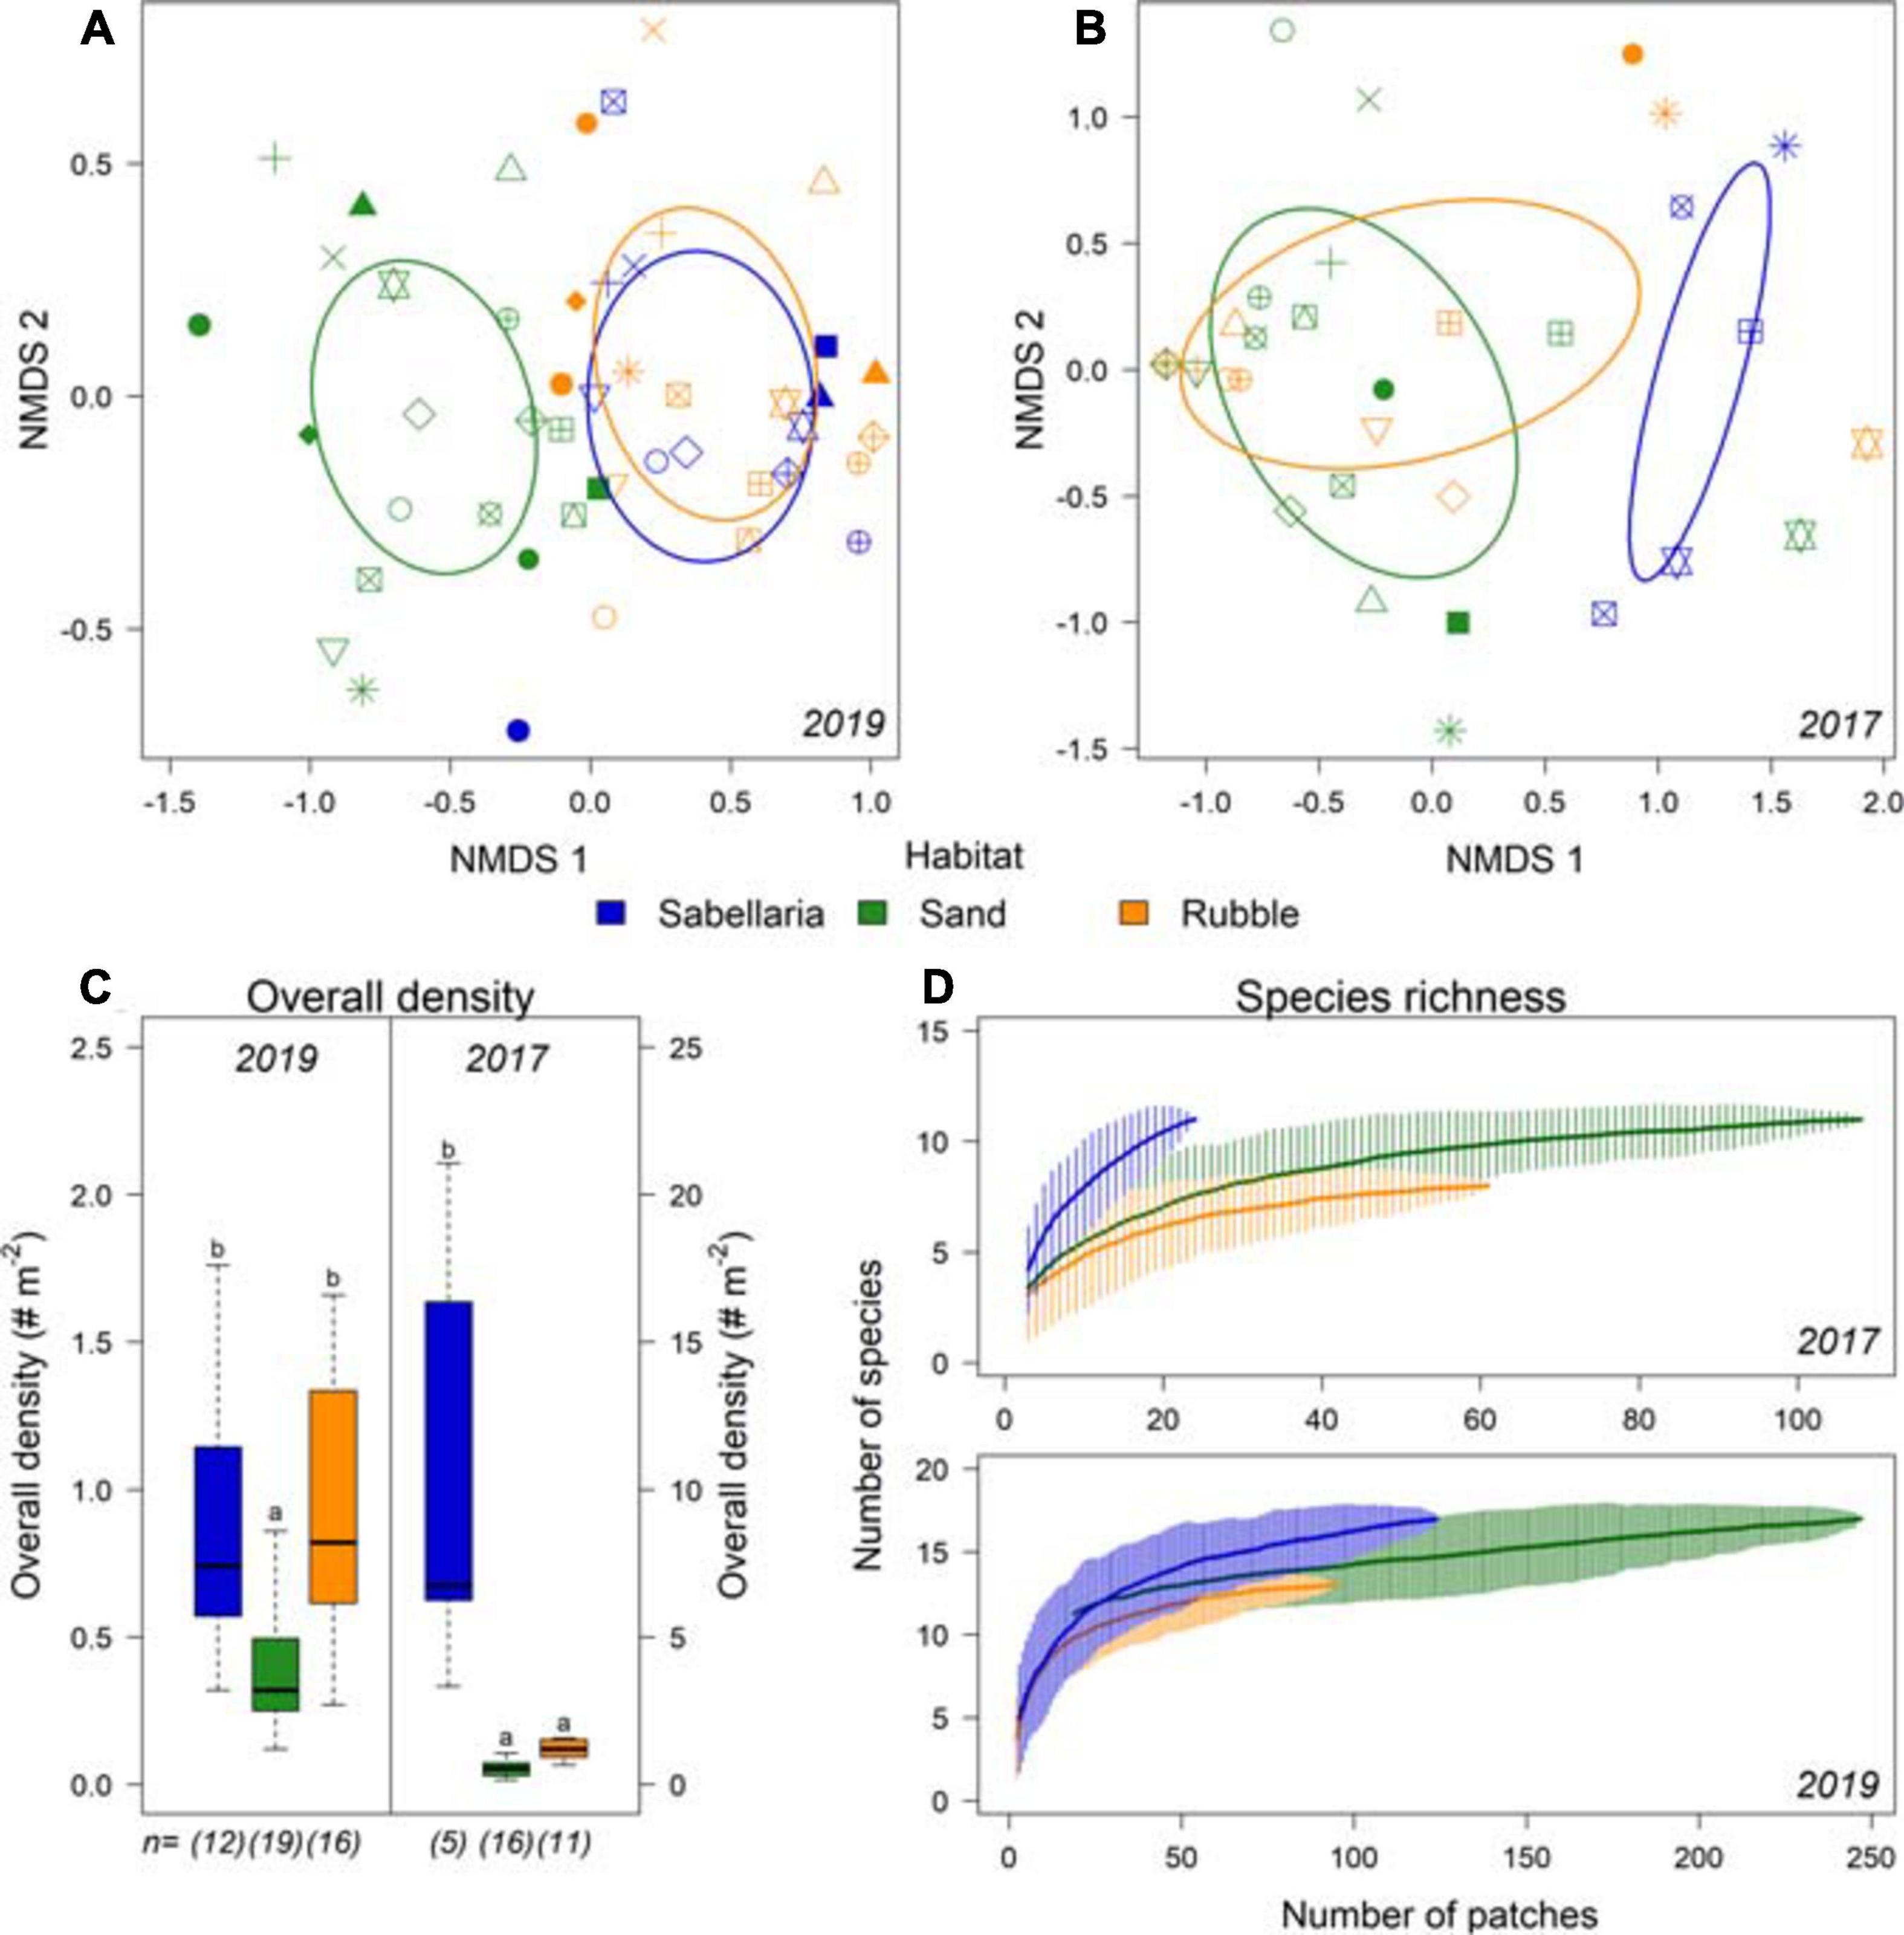
Figure 6. Differences in community composition between the different habitat types Sabellaria (blue), Sand (green), and Rubble (orange). (A) NMDS of epifauna data gathered in the 2019 campaign and (B) in the 2017 campaign. Each habitat type observed within a transect is displayed separately, with the different symbols representing the video transects. (C) overall density (# Nm− 2) and species richness (Nm− 2) per habitat type for 2019 and (D) for 2017. n represents the number of different transects with this habitat type. Significant differences are represented by different letters.
Discussion
We here studied the effects of S. spinulosa habitat patches on associated endo- and epibenthic communities in the dynamic Brown Bank area in the North Sea. We showed that within this area, S. spinulosa reef habitats have a highly patchy distribution that may be linked to seafloor megaripple morphology. These migratory bedforms are commonly abundant in dynamic sand-bottom environments (Knaapen, 2009; Koop et al., 2019). The patchy Sabellaria habitats had similar endobenthic community compositions compared to surrounding habitats and showed slightly higher species richness in 2017, but not in 2019. In contrast, species richness and overall density of mobile epifauna was higher near S. spinulosa reefs, suggesting that especially the mobile, epifauna community is positively affected by the presence of S. spinulosa reef patches. Our study demonstrates that patchy biogenic reefs have a relevant positive impact on benthic biodiversity even in morphologically dynamic sandy-bottom environments.
Compared with the surrounding Sand habitat, Sabellaria habitat patches showed 2 and 12 times higher epifauna densities for 2019 and 2017, respectively. Moreover, species richness of mobile, epifaunal organisms was higher. Similar patterns have been observed in S. spinulosa reefs elsewhere, showing higher local species densities than in surrounding habitats (Pearce et al., 2013; Fariñas-Franco et al., 2014; Pearce, 2014). We did not observe clear effects of the S. spinulosa patches on endobenthic organisms, contrary to observations described in literature. They show that biogenic reefs can locally exclude soft-sediment endobenthic species due to their physical structure, and promote higher endobenthic densities in their direct surroundings as a consequence of altered hydrodynamics or fecal output (Rees et al., 2008; van der Zee et al., 2012; Donadi et al., 2013). Potentially, the investigated S. spinulosa patches were too small to produce such effects. It may, however, also demonstrate the methodological challenge to adequately sample a patchy reef feature. Contrary to our intentions, no boxcore samples were taken within S. spinulosa reef patches themselves, but in their surroundings. This underlines that –when small-scale habitat heterogeneity is expected– more precise sampling methods should be deployed, such as scuba-diving or ROV-directed sampling (Parry et al., 2003; Rees et al., 2008; Coolen et al., 2015). The results also demonstrated that it is necessary to apply multiple sampling methods that target different ecological components and different spatial scales. Only the combination of these techniques provides a comprehensive overview of, in this case, the ecological relevance of S. spinulosa reefs (Tiano et al., 2020). In addition, our multi-scale design of acoustics, video transects, and boxcores enabled the integration of prevailing habitat heterogeneity in the interpretation of local observations.
The importance of this small-scale habitat heterogeneity was further investigated at a landscape-scale. Slightly different endobenthos communities were observed between boxcore samples taken in the wider surroundings and boxcores gathered in the 2019 campaign. These differences could have resulted from the large-scale morphological seabed structure alone (van Dijk et al., 2012; Mestdagh et al., 2020). However, it is very likely that the S. spinulosa reef patches contributed to this difference in endobenthos communities. The reef patches produce a high level of small-scale habitat heterogeneity, which has proven important for overall biodiversity (Hewitt et al., 2005; Sanderson et al., 2008). We demonstrated that S. spinulosa patch size is very likely related to small-scale heterogeneity created by dynamic, morphological bedforms, as the mean patch size of Sabellaria habitats matches the average size of megaripple throughs (Knaapen et al., 2005; Koop et al., 2019; van der Reijden et al., 2019). Similarly, in Dorset (SW England), a S. spinulosa reef appeared to be constrained by mobile sand waves, which periodically overwhelmed the reef (Collins, 2003). Most likely, sand wave migration has limited effect on our S. spinulosa reefs, as sand waves were almost absent in the tidal sand bank throughs (Knaapen, 2005; Koop et al., 2019). Megaripple migration, however, could considerably affect S. spinulosa reef patchiness and stability. Migration patterns are thought to be site-specific (Knaapen et al., 2005) and affected by morphological bedforms at larger scales (Leenders et al., 2021). Intertidal megaripples with similar amplitude and wavelength as encountered in the Brown Bank area were shown to migrate around 1 m week–1 (van der Wal et al., 2017). Together with the high burial tolerance of S. spinulosa (Hendrick et al., 2016), this migration speed might pose a tolerable stress for the reefs. However, it does not explain the observed patchy distribution of Sabellaria habitats. Another possibility is that megaripple migration opposingly is altered by reef presence since biogenic reefs are known for their sediment stabilization effects (Rabaut et al., 2009; Paul et al., 2012). Modeling studies show that artificial tubes mimicking the sand mason worm (Lanice conchilega) affect near-bed flow velocities, which result in sediment trapping (Borsje et al., 2014) and affect sand wave morphology (Damveld et al., 2019, 2020). A preliminary model run showed that the presence of tube-worm patches can decrease sand wave migration speed (Damveld, 2020). Hence, S. spinulosa reef patches might be able to reduce megaripple dynamics to levels they can cope with, enabling them to persist. To test these hypotheses, detailed studies on the mechanistic link between S. spinulosa reefs and megaripples should be conducted. Such a study would also provide insights in the stability of the studied S. spinulosa reef patches.
Our observations, however, pose an interesting case with respect to marine habitat conservation. Despite the patchiness and dynamics of the observed S. spinulosa reefs, their persistence in the area has been demonstrated over a time period of almost 2 years. The preference of S. spinulosa larvae to settle on conspecifics (Wilson, 1970; Fariñas-Franco et al., 2014), especially in combination with the hypothesized small-scale refugia created by the megaripples (van der Reijden et al., 2019), can potentially explain this persistence. The reef patches increased both local diversity and density of mobile epifauna. We therefore argue that the observed S. spinulosa reef patches definitely have conservation value. Many other biogenic reefs are characterized by patchy distributions or small-scale variation of sub-habitats as well. Aggregations of the sand mason worm (Lanice conchilega) for example, form patchy mounts that are elevated from the seabed (van Hoey et al., 2008; Rabaut et al., 2009). Similarly, horse mussels (Modiolus modiolus) can form distinct beds that are typified by ridges of mussels with muddy patches in between (Rees et al., 2008). The positive impact on biodiversity and ecosystem functioning has been demonstrated for both examples of patchy biogenic reefs (Sanderson et al., 2008; van Hoey et al., 2008; Cook et al., 2013; Coolen et al., 2015). Together with our observations, we therefore argue that conservation status of patchy, dynamic reefs should be reconsidered to ensure their protection.
The assessment of biogenic reef habitats, for instance under the European Habitats Directive, should hence include dynamic and patchy reefs that currently have low conservation status. Often, it is stated that communities in dynamic environments are less vulnerable to anthropogenic disturbances, like demersal fisheries, than those in stable environments (Collie et al., 2000; Hiddink et al., 2006; van Denderen et al., 2015). However, migrating bedforms and high hydrodynamics pose a different stress on the reef fragments than the physical disturbance of demersal fishing gears. For S. spinulosa, multiple studies indicate that demersal fisheries pose a threat to the reefs, which could result in reef damage, fragmentation, and ultimately disappearance (Fariñas-Franco et al., 2014; Gibb et al., 2014; van der Reijden et al., 2019). In addition, a sliding scale is introduced when anthropogenic activities cause reef fragmentation, which in turn results in patchy reef habitats with little conservation status (Cook et al., 2013). Assessments of reef conservation value should therefore focusing dominantly on the contribution of reef structures to ecosystem functioning in addition to the physical dimensions of these structures (Hendrick and Foster-Smith, 2006; Sheehan et al., 2013). Moreover, the physical dimensions assessed should be considered at the right scale and with respect to the entire landscape. For a patchy reef like the one described here, dimensions of individual reef fragments or habitat patches contain little information. It is the extent of the area in which the reef habitat patches are found that is of importance for the ecosystem, including the non-reef habitats (Sheehan et al., 2013). The subsequent conservation of such patchy, dynamic reef habitats should allow a continuity of natural dynamic processes, without anthropogenic disturbances at the seafloor, at scales relevant to the dynamics of both reef patches and morphological bedforms.
Data Availability Statement
The original contributions presented in this study are available at https://doi.org/10.34894/TNXNX2.
Ethics Statement
Ethical review and approval were not required for the animal study because field sampling was limited to box coring and video transects to estimate abundance of any species present. As such, no animal experiments were performed.
Author Contributions
KR: conceptualization, methodology, validation, formal analysis, investigation, data curation, writing – original draft, and visualization. LK: conceptualization, methodology, investigation, data curation, writing, review, and editing. SM: writing, review, and editing. MS: supervision, project administration, funding acquisition, writing, review, and editing. PH: methodology, resources, writing, review, and editing. HO: conceptualization, methodology, project administration, funding acquisition, writing, review, and editing. LG: conceptualization, methodology, writing, review, editing, and supervision. All authors contributed to the article and approved the submitted version.
Funding
This work was funded by the Gieskes-Strijbis Fonds, Netherlands. LG was funded by NWO grant 016.Veni.181.087. The funders had no involvement in the execution of the study.
Conflict of Interest
The authors declare that the research was conducted in the absence of any commercial or financial relationships that could be construed as a potential conflict of interest.
Acknowledgments
We would like to thank the crew of RV Pelagia for their assistance during the fieldwork campaigns, and Rob Witbaard and Jip Vrooman for their role as cruise leaders. Joël Cuperus of the Directorate General for Public Works and Water Management of the Dutch Ministry of Infrastructure and Water Management was so kind to share the MWTL- survey dataset. We further thank Loran Kleine Schaars and his colleagues from the NIOZ benthos laboratory for the processing of endobenthos samples of the 2019 campaign, and Matthew Parsons and Maria Bacelar Martinez for processing the endobenthos samples from the 2017 campaign. We also would like to thank two reviewers that substantially improved the manuscript with their comments.
Supplementary Material
The Supplementary Material for this article can be found online at: https://www.frontiersin.org/articles/10.3389/fmars.2021.642659/full#supplementary-material
Footnotes
- ^ ArcGIS, Version 10.5.1
References
Barker, B. A. J., Helmond, I., Bax, N. J., Williams, A., Davenport, S., and Wadley, V. A. (1999). A vessel-towed camera platform for surveying seafloor habitats of the Continental Shelf. Cont. Shelf Res. 19, 1161–1170. doi: 10.1016/S0278-4343(99)00017-5
Bates, D., Mächler, M., Bolker, B. M., and Walker, S. C. (2015). Fitting linear mixed-effects models using lme4. J. Stat. Softw. 67, 1–48. doi: 10.18637/jss.v067.i01
Boonzaier, L., and Pauly, D. (2016). Marine protection targets: an updated assessment of global progress. Oryx 50, 27–35. doi: 10.1017/S0030605315000848
Borsje, B. W., Bouma, T. J., Rabaut, M., Herman, P. M. J., and Hulscher, S. J. M. H. (2014). Formation and erosion of biogeomorphological structures: a model study on the tube-building polychaete Lanice conchilega. Limnol. Oceanogr. 59, 1297–1309. doi: 10.4319/lo.2014.59.4.1297
Christianen, M. J. A., van der Heide, T., Holthuijsen, S. J., van der Reijden, K. J., Borst, A. C. W., and Olff, H. (2016). Biodiversity and food web indicators of community recovery in intertidal shellfish reefs. Biol. Conserv. 213, 317–324. doi: 10.1016/j.biocon.2016.09.028
Collie, J. S., Hall, S. J., Kaiser, M. J., and Poiner, I. A. N. R. (2000). A quantitative analysis of fishing impacts on shelf-sea benthos. J. Anim. Ecol. 69, 785–798. doi: 10.1046/j.1365-2656.2000.00434.x
Collin, A., Dubois, S., James, D., and Houet, T. (2019). Improving intertidal reef mapping using UAV surface, red edge, and near-infrared data. Drones 3:67. doi: 10.3390/drones3030067
Collins, K. (2003). Dorset Marine Habitat Surveys: Maerl, Worm Reefs, Bream Nests, Sea Fans and Brittlestars. 2003 survey results. Report to Dorset Wildlife Trust and English Nature from the School of Ocean and Earth Science. Southampton: University of Southampton.
Cook, R., Fariñas-Franco, J. M., Gell, F. R., Holt, R. H. F., Holt, T., Lindenbaum, C., et al. (2013). The substantial first impact of bottom fishing on rare biodiversity hotspots: a dilemma for evidence-based conservation. PLoS One 8:e69904. doi: 10.1371/journal.pone.0069904
Coolen, J. W. P., Bos, O. G., Glorius, S., Lengkeek, W., Cuperus, J., van der Weide, B., et al. (2015). Reefs, sand and reef-like sand: a comparison of the benthic biodiversity of habitats in the Dutch Borkum Reef Grounds. J. Sea Res. 103, 84–92. doi: 10.1016/j.seares.2015.06.010
Costello, M. J., and Ballantine, B. (2015). Biodiversity conservation should focus on no-take Marine Reserves: 94% of marine protected areas allow fishing. Trends Ecol. Evol. 30, 507–509. doi: 10.1016/j.tree.2015.06.011
Damveld, J. H. (2020). The Feedbacks Among Tidal Sand Waves, benthic Organisms and Sediment Sorting Processes. Enschede: University of Twente. doi: 10.3990/1.9789036550000
Damveld, J. H., Borsje, B. W., Roos, P. C., and Hulscher, S. J. M. H. (2020). Biogeomorphology in the marine landscape: modelling the feedbacks between patches of the polychaete worm Lanice conchilega and tidal sand waves. Earth Surf. Process. Landforms 45, 2572–2587. doi: 10.1002/esp.4914
Damveld, J. H., van der Reijden, K. J., Cheng, C., Koop, L., Haaksma, L. R., et al. (2018). Video transects reveal that tidal sand waves affect the spatial distribution of benthic organisms and sand ripples. Geophys. Res. Lett. 45, 11837–11846. doi: 10.1029/2018GL079858
Damveld, J. H., Roos, P. C., Borsje, B. W., and Hulscher, S. J. M. H. (2019). Modelling the two-way coupling of tidal sand waves and benthic organisms: a linear stability approach. Environ. Fluid Mech. 19, 1073–1103. doi: 10.1007/s10652-019-09673-1
Donadi, S., van der Heide, T., van der Zee, E. M., Eklöf, J. S., van de Koppel, J., Weerman, E. J., et al. (2013). Cross-habitat interactions among bivalve species control community structure on intertidal flats. Ecology 94, 489–498. doi: 10.1890/12-0048.1
European Commission (1992). Council Directive 92/43/ECC on the Conservation of Natural Habitats and of Wild Fauna and Flora. Brussels: European Commission.
European Commission (2013). Interpretation Manual of European Union Habitats. EU28. Available online at: http://scholar.google.com/scholar?hl=en&btnG=Search&q=intitle:INTERPRETATION+MANUAL+OF+EUROPEAN+UNION+HABITATS#0 (accessed September 14, 2020).
Fariñas-Franco, J. M., Allcock, A. L., and Roberts, D. (2018). Protection alone may not promote natural recovery of biogenic habitats of high biodiversity damaged by mobile fishing gears. Mar. Environ. Res. 135, 18–28. doi: 10.1016/j.marenvres.2018.01.009
Fariñas-Franco, J. M., Pearce, B., Porter, J., Harries, D., Mair, J. M., Woolmer, A. S., et al. (2014). Marine Strategy Framework Directive Indicators for Biogenic Reefs formed by Modiolus modiolus, Mytilus edulis and Sabellaria spinulosa. Part 1: Defining and Validating the Indicators. Peterborough: JNCC.
Ferrario, F., Beck, M. W., Storlazzi, C. D., Micheli, F., Shepard, C. C., and Airoldi, L. (2014). The effectiveness of coral reefs for coastal hazard risk reduction and adaptation. Nat. Commun. 5:3794. doi: 10.1038/ncomms4794
Gibb, N., Tillin, H., Pearce, B., and Tyler-Walters, H. (2014). Assessing the Sensitivity of Sabellaria spinulosa Reef Biotopes to Pressures Associated with Marine Activities. Peterborough: JNCC.
Gravina, M. F., Cardone, F., Bonifazi, A., Bertrandino, M. S., Chimienti, G., Longo, C., et al. (2018). Sabellaria spinulosa (Polychaeta, Annelida) reefs in the Mediterranean Sea: habitat mapping, dynamics and associated fauna for conservation management. Estuar. Coast. Shelf Sci. 200, 248–257. doi: 10.1016/j.ecss.2017.11.017
Hendrick, V. J., and Foster-Smith, R. L. (2006). Sabellaria spinulosa reef: a scoring system for evaluating ‘reefiness’ in the context of the Habitats Directive. J. Mar. Biol. Assoc. U.K. 86, 665–677. doi: 10.1017/S0025315406013555
Hendrick, V. J., Hutchison, Z. L., and Last, K. S. (2016). Sediment burial intolerance of marine macroinvertebrates. PLoS One 11:e0149114. doi: 10.1371/journal.pone.0149114
Hewitt, J. E., Thrush, S. F., Halliday, J., and Duffy, C. (2005). The importance of small-scale habitat structure for maintaining beta diversity. Ecology 86, 1619–1626. doi: 10.1890/04-1099
Hiddink, J. G., Jennings, S., Kaiser, M. J., Queirós, A. M., Duplisea, D. E., and Piet, G. J. (2006). Cumulative impacts of seabed trawl disturbance on benthic biomass, production, and species richness in different habitats. Can. J. Fish. Aquat. Sci. 63, 721–736. doi: 10.1139/F05-266
Hiddink, J. G., Jennings, S., Sciberras, M., Bolam, S. G., Cambiè, G., McConnaughey, R. A., et al. (2019). Assessing bottom trawling impacts based on the longevity of benthic invertebrates. J. Appl. Ecol. 56, 1075–1084. doi: 10.1111/1365-2664.13278
Holstein, J. (2018). Worms: Retriving Aphia Information from World Register of Marine Species. R package version 0.2.2. Available online at: https://cran.r-project.org/package=worms (accessed September 14, 2020).
Idier, D., Ehrhold, A., and Garlan, T. (2002). Morphodynamique d’une dune sous-marine du détroit du pas de Calais. Comptes Rendus Geosci. 334, 1079–1085. doi: 10.1016/s1631-0713(02)01852-7
Jenkins, C., Eggleton, J., Barry, J., and O’Connor, J. (2018). Advances in assessing Sabellaria spinulosa reefs for ongoing monitoring. Ecol. Evol. 8, 7673–7687. doi: 10.1002/ece3.4292
Jones, C. G., Lawton, J. H., and Shachak, M. (1994). Organisms as ecosystem engineers. Oikos 69, 373–386. doi: 10.2307/3545850
Knaapen, M. A., van Bergen Henegouw, C. N., and Hu, Y. Y. (2005). Quantifying bedform migration using multi-beam sonar. Geo Mar. Lett. 25, 306–314. doi: 10.1007/s00367-005-0005-z
Knaapen, M. A. F. (2005). Sandwave migration predictor based on shape information. J. Geophys. Res. Earth Surf. 110, 1–9. doi: 10.1029/2004JF000195
Knaapen, M. A. F. (2009). Sandbank occurrence on the Dutch continental shelf in the North Sea. Geo Mar. Lett. 29, 17–24. doi: 10.1007/s00367-008-0105-7
Koop, L., Amiri-Simkooei, A., van der Reijden, K. J., O’Flynn, S., Snellen, M., and Simons, D. G. (2019). Seafloor classification in a sand wave environment on the Dutch continental shelf using multibeam echosounder backscatter data. Geosciences 9:142. doi: 10.3390/geosciences9030142
Koop, L., van der Reijden, K. J., Mestdagh, S., Ysebaert, T., Laura, L., Olff, H., et al. (2020). Measuring centimeter scale sand ripples using multibeam echosounder backscatter data on the Brown Bank of the Dutch Continental Shelf. Geosciences 10:495. doi: 10.3390/geosciences10120495
Leenders, S., Damveld, J. H., Schouten, J., Hoekstra, R., Roetert, T. J., and Borsje, B. W. (2021). Numerical modelling of the migration direction of tidal sand waves over sand banks. Coast. Eng. 163:103790. doi: 10.1016/j.coastaleng.2020.103790
Lenihan, H. S. (1999). Physical-biological coupling on oyster reefs: How habitat structure influences individual performance. Ecol. Monogr. 69, 251–275. doi: 10.2307/2657157
Lenth, R. (2020). Emmeans: Estimated Marginal Means, aka Least-Squares Means. R package version 1.5.2-1. Available online at: https://cran.r-project.org/package=emmeans (accessed September 14, 2020).
Lisco, S., Moretti, M., Moretti, V., Cardone, F., Corriero, G., and Longo, C. (2017). Sedimentological features of Sabellaria spinulosa biocontructions. Mar. Pet. Geol. 87, 203–212. doi: 10.1016/j.marpetgeo.2017.06.013
Mestdagh, S., Amiri-Simkooei, A., van der Reijden, K. J., Koop, L., O’Flynn, S., Snellen, M., et al. (2020). Linking the morphology and ecology of subtidal soft-bottom marine benthic habitats: a novel multiscale approach. Estuar. Coast. Shelf Sci. 238:106687. doi: 10.1016/j.ecss.2020.106687
Oksanen, J., Blanchet, F. G., Friendly, M., Kindt, R., Legendre, P., McGlinn, D., et al. (2019). Vegan: Community Ecology package. R package version 2.5-6. Available online at: https://cran.r-project.org/package=vegan (accessed September 14, 2020).
OSPAR Commission (2013). Background Document on Sabellaria spinulosa Reefs. Available online at: http://www.ospar.org/documents?v=7342 (accessed September 14, 2020).
Parry, D. M., Kendall, M. A., Pilgrim, D. A., and Jones, M. B. (2003). Identification of patch structure within marine benthic landscapes using a remotely operated vehicle. J. Exp. Mar. Bio. Ecol. 285–286, 497–511. doi: 10.1016/S0022-0981(02)00546-4
Paul, M., Bouma, T. J., and Amos, C. L. (2012). Wave attenuation by submerged vegetation: combining the effect of organism traits and tidal current. Mar. Ecol. Prog. Ser. 444, 31–41. doi: 10.3354/meps09489
Pearce, B. (2014). The Ecology of Sabellaria Spinulosa Reefs. Available online at: https://pearl.plymouth.ac.uk/bitstream/handle/10026.1/10098/2017Pearce736123phd.pdf?sequence=1 (accessed September 14, 2020).
Pearce, B., Fariñas-franco, J. M., Wilson, C., Pitts, J., and Somer, P. J. (2014). Repeated mapping of reefs constructed by Sabellaria spinulosa Leuckart 1849 at an offshore wind farm site. Cont. Shelf Res. 83, 3–13. doi: 10.1016/j.csr.2014.02.003
Pearce, B., Hill, J. M., Wilson, C., Griffin, R., Earnshaw, S., and Pitts, J. (2013). Sabellaria spinulosa Reef Ecology and Ecosystem Services. London: The Crown Estate. doi: 10.13140/2.1.4856.0644
Plaisance, L., Caley, M. J., Brainard, R. E., and Knowlton, N. (2011). The diversity of coral reefs: What are we missing? PLoS One 6:e0025026. doi: 10.1371/journal.pone.0025026
R Development Core Team (2014). R: A Language and Environment for Statistical Computing. Available online at: https://www.r-project.org/ (accessed September 14, 2020).
Rabaut, M., Vincx, M., and Degraer, S. (2009). Do Lanice conchilega (sandmason) aggregations classify as reefs? Quantifying habitat modifying effects. Helgol. Mar. Res. 63, 37–46. doi: 10.1007/s10152-008-0137-4
Rees, E. I. S., Sanderson, W. G., Mackie, A. S. Y., and Holt, R. H. F. (2008). Small-scale variation within a Modiolus modiolus (Mollusca: Bivalvia) reef in the Irish Sea: III. Crevice, sediment infauna and epifauna from targeted cores. J. Mar. Biol. Assoc. U.K. 88, 151–156. doi: 10.1017/S0025315408000374
Reiss, H., Degraer, S., Duineveld, G. C. A., Kröncke, I., Aldridge, J., Craeymeersch, J. A., et al. (2010). Spatial patterns of infauna, epifauna, and demersal fish communities in the North Sea. ICES J. Mar. Sci. 67, 278–293. doi: 10.1093/icesjms/fsp253
Roberts, C. M., McClean, C. J., Veron, J. E. N., Hawkins, J. P., Allen, G. R., McAllister, D. E., et al. (2002). Marine biodiversity hotspots and conservation priorities for tropical reefs. Science 295, 1280–1284. doi: 10.1126/science.1067728
Ryer, C. H., Stoner, A. W., and Titgen, R. H. (2004). Behavioral mechanisms underlying the refuge value of benthic habitat structure for two flatfishes with differing anti-predator strategies. Mar. Ecol. Prog. Ser. 268, 231–243. doi: 10.3354/meps268231
Sanderson, W. G., Holt, R. H. F., Kay, L., Ramsay, K., Perrins, J., Mcmath, A. J., et al. (2008). Small-scale variation within a Modiolus modiolus (Mollusca: Bivalvia) reef in the Irish Sea. II. Epifauna recorded by divers and cameras. J. Mar. Biol. Assoc. U.K. 88, 143–149. doi: 10.1017/S0025315408000040
Sciberras, M., Hiddink, J. G., Jennings, S., Szostek, C. L., Hughes, K. M., Kneafsey, B., et al. (2018). Response of benthic fauna to experimental bottom fishing: a global meta-analysis. Fish Fish. 19, 698–715. doi: 10.1111/faf.12283
Sheehan, E. V., Cousens, S. L., Nancollas, S. J., Stauss, C., Royle, J., and Attrill, M. J. (2013). Drawing lines at the sand: evidence for functional vs. visual reef boundaries in temperate Marine Protected Areas. Mar. Pollut. Bull. 76, 194–202. doi: 10.1016/j.marpolbul.2013.09.004
Sheehan, E. V., Stevens, T. F., and Attrill, M. J. (2010). A quantitative, non-destructive methodology for habitat characterisation and benthic monitoring at offshore renewable energy developments. PLoS One 5:e14461. doi: 10.1371/journal.pone.0014461
Tiano, J. C., van der Reijden, K. J., O’Flynn, S., Beauchard, O., van der Ree, S., van der Wees, J., et al. (2020). Experimental bottom trawling finds resilience in large-bodied infauna but vulnerability for epifauna and juveniles in the Frisian Front. Mar. Environ. Res. 159:104964. doi: 10.1016/j.marenvres.2020.104964
van Denderen, P. D., Bolam, S. G., Hiddink, J. G., Jennings, S., Kenny, A., Rijnsdorp, A. D., et al. (2015). Similar effects of bottom trawling and natural disturbance on composition and function of benthic communities across habitats. Mar. Ecol. Prog. Ser. 541, 31–43. doi: 10.3354/meps11550
van der Heide, T., van Nes, E. H., van Katwijk, M. M., Olff, H., and Smolders, A. J. P. (2011). Positive feedbacks in seagrass ecosystems - Evidence from large-scale empirical data. PLoS One 6:e16504. doi: 10.1371/journal.pone.0016504
van der Reijden, K. J., Hintzen, N. T., Govers, L. L., Rijnsdorp, A. D., and Olff, H. (2018). North Sea demersal fisheries prefer specific benthic habitats. PLoS One 13:e0208338. doi: 10.1371/journal.pone.0208338
van der Reijden, K. J., Koop, L., O’Flynn, S., Garcia, S., Bos, O., Sluis, C., et al. (2019). Discovery of Sabellaria spinulosa reefs in an intensively fished area of the Dutch Continental Shelf, North Sea. J. Sea Res. 144, 85–94. doi: 10.1016/j.seares.2018.11.008
van der Wal, D., Ysebaert, T., and Herman, P. M. J. (2017). Response of intertidal benthic macrofauna to migrating megaripples and hydrodynamics. Mar. Ecol. Prog. Ser. 585, 17–30. doi: 10.3354/meps12374
van der Zee, E. M., Angelini, C., Govers, L. L., Christianen, M. J. A., Altieri, A. H., van der Reijden, K. J., et al. (2016). How habitat-modifying organisms structure the food web of two coastal ecosystems. Proc. R. Soc. B. 283:20152326. doi: 10.1098/rspb.2015.2326
van der Zee, E. M., van der Heide, T., Donadi, S., Eklöf, J. S., Eriksson, B. K., Olff, H., et al. (2012). Spatially extended habitat modification by intertidal reef-building bivalves has implications for consumer-resource interactions. Ecosystems 15, 664–673. doi: 10.1007/s10021-012-9538-y
van Dijk, T. A., van Dalfsen, J. A., van Lancker, V., van Overmeeren, R. A., van Heteren, S., and Doornenbal, P. J. (2012). “Benthic habitat variations over tidal ridges, North Sea, The Netherlands,” in Seafloor Geomorphology as Benthic Habitat, eds P. T. Harris and E. K. Baker (London: Elsevier Inc), 241–249. doi: 10.1016/b978-0-12-385140-6.00013-x
van Hoey, G., Guilini, K., Rabaut, M., Vincx, M., and Degraer, S. (2008). Ecological implications of the presence of the tube-building polychaete Lanice conchilega on soft-bottom benthic ecosystems. Mar. Biol. 154, 1009–1019. doi: 10.1007/s00227-008-0992-1
Ventura, D., Dubois, S. F., Bonifazi, A., Jona Lasinio, G., Seminara, M., Gravina, M. F., et al. (2020). Integration of close-range underwater photogrammetry with inspection and mesh processing software: a novel approach for quantifying ecological dynamics of temperate biogenic reefs. Remote Sens. Ecol. Conserv 2:178. doi: 10.1002/rse2.178
Walbridge, S., Slocum, N., Pobuda, M., and Wright, D. J. (2018). Unified geomorphological analysis workflows with Benthic Terrain Modeler. Geosciences 8:94. doi: 10.3390/geosciences8030094
Keywords: biogenic reefs, patchiness, habitat heterogeneity, marine management, ecosystem engineering, megaripples, ross worm, North Sea
Citation: van der Reijden KJ, Koop L, Mestdagh S, Snellen M, Herman PMJ, Olff H and Govers LL (2021) Conservation Implications of Sabellaria spinulosa Reef Patches in a Dynamic Sandy-Bottom Environment. Front. Mar. Sci. 8:642659. doi: 10.3389/fmars.2021.642659
Received: 16 December 2020; Accepted: 22 March 2021;
Published: 13 April 2021.
Edited by:
Puri Veiga, University of Porto, PortugalReviewed by:
Daniele Ventura, Sapienza University of Rome, ItalyMaria Flavia Gravina, University of Rome “Tor Vergata”, Italy
Copyright © 2021 van der Reijden, Koop, Mestdagh, Snellen, Herman, Olff and Govers. This is an open-access article distributed under the terms of the Creative Commons Attribution License (CC BY). The use, distribution or reproduction in other forums is permitted, provided the original author(s) and the copyright owner(s) are credited and that the original publication in this journal is cited, in accordance with accepted academic practice. No use, distribution or reproduction is permitted which does not comply with these terms.
*Correspondence: Karin J. van der Reijden, ay5qLnZhbi5kZXIucmVpamRlbkBydWcubmw=; a2FyaW52ZHJlaWpkZW5AaG90bWFpbC5jb20=