 Rachel L. Shaw1
 Tobey H. Curtis2
 Gregory Metzger3Michael P. McCallister1Alisa Newton4G. Christopher Fischer5
 Matthew J. Ajemian1*
- 1Fisheries Ecology and Conservation Laboratory, Harbor Branch Oceanographic Institute, Florida Atlantic University, Fort Pierce, FL, United States
- 2Atlantic Highly Migratory Species Management Division, National Oceanic and Atmospheric Administration (NOAA) National Marine Fisheries Service, Gloucester, MA, United States
- 3South Fork Natural History Museum, Bridgehampton, NY, United States
- 4Wildlife Conservation Society, Bronx, NY, United States
- 5OCEARCH, Park City, UT, United States
As highly mobile predators with extensive home ranges, some shark species often utilize a continuum of habitats across the continental shelf ranging from the surf zone to the open ocean. For many species, these cross-shelf distributions can change depending on ontogeny or seasonal conditions. Recent research has confirmed a white shark (Carcharodon carcharias) summer nursery off Long Island, New York; however, habitat characterization of this nursery has not yet been conducted nor has fine-scale analysis of vertical behavior. Between 2016 and 2019, 21 young-of-the-year and juvenile white sharks were fitted with satellite and acoustic tags to examine distribution and selection for a suite of oceanographic variables during their late summertime (i.e., August to October) residence in the New York Bight. Horizontal position estimates were used to extract a suite of environmental measurements via remote sensing platforms and were linked with vertical profiles to produce three-dimensional movements for a subset of individuals also fitted with pop-up satellite archival tags (n = 7). Sharks exhibited horizontal movements parallel to Long Island’s southern shoreline and coastal New Jersey, with distances from 0.1 to 131.5 km from shore. Log-likelihood chi-square analyses determined selection for waters with underlying bathymetry of 20–30 m, sea surface temperatures between 20.0 and 22.0°C, sea surface salinities between 31.0 and 32.0 ppt, and chlorophyll-a concentrations between 2.0 and 8.0 mg⋅m–3. Multiple individuals also traversed the mid- to outer shelf region after leaving the Montauk tagging area. Vertical depth profiles illustrated oscillations between the surface and 199 m of water, with an average swimming depth of 9.2 ± 8.9 m. Water column temperatures during these oscillations ranged between 7.9 and 26.2°C (mean = 19.5 ± 2.0°C) with several individuals traversing highly stratified regions presumably associated with a mid-shelf cold pool adjacent to the Hudson Shelf Valley. These results suggest young white sharks exhibit connectivity between the immediate shoreline and mid-continental shelf region, where they play important ecological roles as predators on a variety of species. Our study improves characterization of essential fish habitat for young white sharks and provides new insights into their reliance on this productive continental shelf ecosystem.
Introduction
Shark nursery habitats are areas that can disproportionately contribute to the productivity of a population (Beck et al., 2001; Heupel et al., 2007). These areas typically provide an appropriate food supply (both quality and quantity), ideal physical conditions (temperature, salinity, etc.), and reduced biological interactions (predation, competition, etc.) for immature individuals thereby increasing survival rates compared to other habitats (Heupel et al., 2007; Parsons et al., 2008). Coastal shark nursery habitats may include habitat types such as mud flats, coral reefs, mangrove forests, and seagrass beds that are found in enclosed embayments or nearshore areas (Heupel et al., 2018). These habitats perform a nursery role as they limit entry of large predators (as a result of the shallow depth), and offer abundant food resources critical to rapid growth during early life stages (Heupel et al., 2018). However, the current definition is somewhat biased due to a historical focus on tropical and subtropical regions where nurseries are primarily located within semi-enclosed estuaries and lagoons (Heupel et al., 2018). There is considerably less information on coastal and offshore nursery areas (Knip et al., 2010; Heupel et al., 2018).
Temperate continental shelves are among some of the most dynamic and productive marine ecosystems in the world, particularly during spring and summertime when primary and secondary production is at its highest (Friedland et al., 2015). For example, the mid-Atlantic Bight, located within the NE shelf large marine ecosystem of the US, seasonally supports large mobile predators such as sea turtles (Murray and Orphanides, 2013; Dodge et al., 2014), marine mammals (Stepanuk et al., 2018), and sharks (Simpfendorfer et al., 2002; Kohler and Turner, 2019; Latour and Gartland, 2020). While the importance of these areas to sharks has been known for some time, the finer-scale use of shelf systems by these animals has been limited, and impacts our understanding of potential shark “hotspots” within these large ecosystems (Bangley et al., 2020a). The mid-Atlantic Bight has characteristic habitat heterogeneity and dynamic features that arise from the immediate shoreline out to the shelf-edge. These include Gulf Stream eddies (Churchill et al., 1993), bathymetric breaks, valleys, and canyons (Knebel, 1979), as well as major riverine discharges (Hossler and Bauer, 2013). Should sharks exhibit preferences for or aggregate in any of these ephemeral or spatially restricted habitats, these can increase their vulnerability to overexploitation or other anthropogenic disturbances in these regions. As such, understanding the use of these shelf ecosystems by predators is important for species conservation and identifying potential threats to sustainability. This is particularly relevant in the mid-Atlantic Bight where numerous shark species are exposed to commercial and recreational fisheries (Kohler and Turner, 2019; NMFS, 2020), expanding offshore wind energy infrastructure (Methratta, 2020), and climate change (Saba et al., 2016). This region is among the most rapidly warming large marine ecosystems in the world (Saba et al., 2016), with variable consequences likely for species that rely on its habitats including potential distribution shifts and declines in productivity (Hare et al., 2016; Kleisner et al., 2016).
Habitat use and movement dynamics of sharks along and across shelf habitats has been historically challenging to study, although research on young shark movements is growing in such areas (Curtis et al., 2018; White et al., 2019; Bangley et al., 2020a; Logan et al., 2020). This is particularly true for most pelagic shark species, which remain offshore for much of their life history and rarely captured in fishery-independent surveys. These characteristics have limited horizontal and vertical habitat data for these widely ranging species. Fortunately, such information can be revealed using individual-based biotelemetry (i.e., electronic tagging) techniques. For example, through the use of active acoustic tracking along with depth-sensing transmitters, Klimley et al. (2002) and Cartamil et al. (2010) characterized both horizontal and vertical movement patterns of young shortfin mako (Isurus oxyrinchus), blue (Prionace glauca), white (Carcharodon carcharias), and common thresher sharks (Alopias vulpinus) in the southern California Bight. However, due to the limitations of acoustic tracking, which requires being within the detection range of the receiver, tracks only lasted maximally 3.1 days and thus were both temporally and spatially restricted. While passive acoustic receiver networks can facilitate extended tracking of movements (Bangley et al., 2020b), these aren’t always feasible in exploratory studies of offshore animal movement and behavior around short-lived features. More recently, researchers have begun combining archival and satellite-transmitting tag technologies to support horizontal and vertical tracking of free-ranging individuals and the dynamic habitats they experience. Combined with other remote sensing environmental observations, this approach has been recently utilized to explore how temperate shark species such as basking sharks (Cetorhinus maximus), adult white sharks, and blue sharks use ephemeral features such as primary production hotspots along the continental shelf and mesoscale eddies in the open ocean (Curtis et al., 2014; Gaube et al., 2018; Braun et al., 2019). Such coupled information permits analyses of how individual sharks interact with oceanography, transfer nutrients across ecosystem gradients, and advance our understanding of the overall movement dynamics of these highly mobile species.
Here, we utilize a similar three-dimensional approach to examine young-of-the-year (YOY) and young juvenile (age 1–2) white shark habitat use and cross-shelf connectivity in the New York Bight, an established white shark nursery (Curtis et al., 2018). The summer distribution of large juvenile and adult white sharks in the northwest Atlantic generally ranges from New Jersey to Nova Scotia, with aggregations occurring adjacent to burgeoning pinniped colonies (Casey and Pratt, 1985; Curtis et al., 2014; Skomal et al., 2017), but there is still little data on the movements and habitat of YOY and small juvenile sharks (Curtis et al., 2018). All life stages migrate out of northern latitudes during the fall and overwinter off the southeastern U.S. (Curtis et al., 2014, 2018; Skomal et al., 2017). While the northwest Atlantic white shark population appears to be recovering from historical overfishing (Curtis et al., 2014), there remains considerable uncertainty in their population dynamics, seasonal habitat preferences, ecological roles, and exposure to anthropogenic impacts (Skomal et al., 2017; Curtis et al., 2018; Bastien et al., 2020; Bowlby and Gibson, 2020). Improved understanding of habitat selection within the only known northwest Atlantic nursery area will inform ongoing conservation strategies for this vulnerable white shark population.
Materials and Methods
Study Location, Animal Collection, and Tagging
This study was conducted in the New York Bight between 2016 and 2019. The New York Bight is the coastal region between Montauk, New York and Cape May, New Jersey. Sharks were collected, sampled, tagged, and released following methods described by Curtis et al. (2018). Briefly, sharks were caught via hook and line using live baitfish. In 2016 and 2017, sharks were tagged using a boatlift platform on the 42 m long M/V OCEARCH, whereas in 2018 and 2019, sharks were tagged in the water while being secured alongside a 7 m fishing vessel.
Sharks were fitted with either a FastGPS Argos transmitter (Sirtrack F6F) alone, or a combination of a Smart Position or Temperature transmitting (SPOT) tag (Wildlife Computers SPOT-258A) and an acoustic transmitter (Vemco V16-6H). The SPOT tags started uplinks after being dry for <0.25 s and sent 10 uplinks per message. Minimum uplink interval was 45 s with a maximum of 160 transmissions per day. The tags were fitted onto the first dorsal fin using nylon bolts and transmitted when the fin was above the sea surface as described by Curtis et al. (2018).
FastGPS Argos transmitters were fitted using the same procedure as the SPOT tags. These tags are designed to transmit to the Argos Satellite System similarly to SPOT tags, but with additional capabilities to also receive radio signals from a GPS satellite when the tag is above the surface for a sufficient period of time. After the transmitter retrieved the signal from the GPS satellite, it then transmitted the retrieved location to the Argos Satellite System. In general, FastGPS tags are capable of producing positions with a lower estimated error (<100 m) than SPOT tags (Dujon et al., 2014). For the first 28 days of deployment, FastGPS transmitters were programmed to transmit to the Argos Satellite System every 45 s, with a GPS fix interval every 120 min. After 28 days, the transmitters were then programmed to continue transmitting to the Argos Satellite System every 45 s, but to increase the GPS fix interval to 180 min to balance battery life throughout the duration of the study. With these settings, tags were expected to receive an average of 35 messages per day and have an expected battery life of 472 days. For both SPOT and FastGPS tags, all Argos position estimates classified as Class Z were removed from the analysis due to the large estimated error associated with that location class (Boyd and Brightsmith, 2013).
Acoustic transmitters (Vemco V16-6H) were cold sterilized with benzalkonium chloride (Benz-all), and surgically placed into the coelomic cavity of each shark and the 4 cm incision was closed in a simple interrupted pattern with 2-O polydioxinone suture (Ethicon PDS II). The implanted acoustic transmitters randomly transmitted a unique signal every 60–90 s, and had a battery life of approximately 10 years. These tags were detected by Vemco acoustic receivers from collaborative acoustic monitoring arrays distributed across the Atlantic coast prior to this study (refer to Bangley et al., 2020b for an explanation of receiver coverage). Given the uncertainty in reporting across the collaborative networks, all acoustic telemetry-based position estimates were considered presence-only data (no absences).
During 2017–2019, a subset of white sharks were also fitted with high-rate pop-up satellite archival tags (Model PSAT LIFE, Lotek Wireless, Inc.). These tags archived light level, temperature, and pressure measurements at 10 s intervals for up to 28 days post-release after which they detached from the shark, floated to the surface, and transmitted data to the Argos satellite system. The transmitted data were aggregated into 5 min bins, with the full 10 s resolution data available only if the tag was physically recovered. Temperature-depth time-series were generated for each tag and summary statistics were compiled.
Movements and Habitat Selection
Horizontal movements were analyzed by downsampling the position estimates from the satellite tags (location classes A, B, 0, 1, 2, and 3) and acoustic transmitters to find daily mean position estimates for each of the 20 individuals with SPOT/FastGPS tags. No horizontal positions were estimated from PSAT data. Following Curtis et al. (2018), gaps between days were linearly estimated and these daily position estimates were then plotted in ArcGIS (version 10.3) and movements faster than 10 km⋅h–1 were filtered out using Movement Ecology Tools for ArcGIS (ArcMET version 10.2.2 v3; Wall, 2014). Any position estimates found on land were also removed.
Environmental data (sea surface temperature, sea surface salinity, chlorophyll a) located at the horizontal position estimates were extracted from NOAA’s ERDDAP server using the Xtractomatic and rerddapXtracto packages in R (version 3.6.0) to characterize habitat use. The resolution of the environmental data was coarser than the expected accuracy of most tag positions (<5 km), so horizontal positions were only matched to a single underlying environmental grid cell. Sea surface temperature (SST) was gathered from the GHRSST Level 4 MUR Global Foundation Sea Surface Temperature Analysis dataset (v4.1), which provided daily SSTs with a resolution of 0.1°. The Sea Surface Salinity, Near Real Time, Soil Moisture Active Passive (SMAP) Daily Composite dataset was used to compile daily sea surface salinity with a resolution of 0.25°. Chlorophyll a was used as a proxy for productivity, or areas with high amounts of phytoplankton (Trujillo and Thurman, 2016), as satellites are able to calculate the color of the water to determine relative amounts of phytoplankton on the surface of the ocean (National Aeronautics and Space Administration (NASA), 2019). Daily chlorophyll-a amounts were collected from the Chlorophyll-a Aqua MODIS dataset (0.05° resolution).
A gridded bathymetric dataset (global 30 arc-s interval grid) from the General Bathymetric Chart of the Oceans (GEBCO) was used to analyze the bottom depth and features of the benthos below horizontal position estimates [General Bathymetric Chart of the Oceans (GEBCO), 2019]. Additionally, a 1 km by 1 km grid was calculated in ArcGIS. The corresponding latitudes and longitudes were imported into R Studio in order to identify the available environmental variables throughout the entire New York Bight (coastal waters bound between 41.367°N, 70.296°W and 37.902°N, 75.327°W). The Xtractomatic and rerddapXtracto packages were used to find available environmental data located at the 1 km by 1 km intervals for the entire New York Bight. Environmental data that coincided with the time frame of each individual’s track was collected.
A log-likelihood chi-squared test was then conducted to assess habitat preferences of tagged individuals. A log-likelihood chi-squared test compares the goodness-of-fit of the hypothesized model against the observed model and can be used to compute a p-value. For this exercise we assumed all habitat data extracted from the continental shelf of the New York Bight were “available” to sharks. Following Rogers and White (2007), three log-likelihood chi-square statistics were calculated. The first chi-square statistic was used to determine if the sharks were using the various habitats in a similar fashion. The null hypothesis states that all sampled individuals are using the habitats in the same proportions as each other. The following bin widths (i.e., categories) were created for each parameter based on the distribution of the data and to facilitate interpretation: 10 m (bathymetry), 2°C (temperature), 2 mg⋅m–3 (chlorophyll a), and 1 ppt (salinity). A p < 0.05 indicates evidence for heterogeneity, signifying individuals were using the various habitats in different proportions. A second chi-square statistic was calculated to examine if selection was occurring for individual habitat types (i.e., particular ranges) by some of the sharks. The null hypothesis states selection is not occurring in at least some of the sharks. The final chi-square statistic was calculated by taking the difference between the first two. This statistic describes whether, on average, sharks were using the various habitat types in proportion to their availability, regardless of which ones were selected. A p < 0.05 indicates strong selection for certain habitat types.
In order to determine if there was a preference for specific habitats or environmental variable ranges, selection ratios were calculated. A selection ratio greater than one indicates preference for that habitat, with a selection ratio less than one indicating avoidance for that particular habitat. All statistical tests were conducted in R Studio (version 1.1.453). Selection ratios were plotted for all four parameters to assess which had mean and confidence intervals that were clearly above or below one, indicating habitat selection or avoidance, respectively.
Vertical Activity and Three-Dimensional Movement
For double-tagged sharks (i.e., SPOT/FastGPS + PSAT), the PSAT temperature and depth logs were chronologically integrated with the geopositional data from the SPOT/FastGPS and acoustic transmitters. The horizontal position estimates were then filtered to meet the PSAT time frame of approximately 28 days. With the aim of matching the horizontal position estimates to the vertical log provided by the PSAT, the horizontal position estimates were linearly interpolated to match the interval of the PSAT log at 5 min or 10 s intervals, depending on whether or not the individual’s PSAT had been physically recovered. The resulting three-dimensional tracks were plotted in ArcScene 10.3 and overlaid onto bathymetry for visualization of movements with respect to bottom features, and reflect the best possible tracks given the availability of horizontal positions.
Results
Horizontal Movements and Habitat Selection
Movement data from 21 white sharks (11 males, 10 females) were collected between 2016 and 2019. A total of 880 positions were received from SPOT/FastGPS transmitters and 4,478 detections were received from 49 unique ACT acoustic receivers, which were subsequently downsampled to daily positions. Individual sizes ranged from 138.0 to 166.4 cm total length (TL; Table 1). Horizontal position estimates from the satellite tags and acoustic detections demonstrated movement parallel to Long Island’s southern shoreline and along the New Jersey coastline (Figure 1). During this time frame, individuals traveled 0.1 to 131.5 km away from shore, with an average (±1 SD) distance from shore of 12.7 ± 0.2 km. Total track distances between 57.4 and 2,089.0 km were observed, with an average of 616.1 ± 126.7 km. Individual track durations during the study period ranged from 8 to 170 days, with an average track duration of 58 ± 10 days. All daily position estimates were located along the continental shelf except one; WS-11 had one daily position estimate on the continental slope.
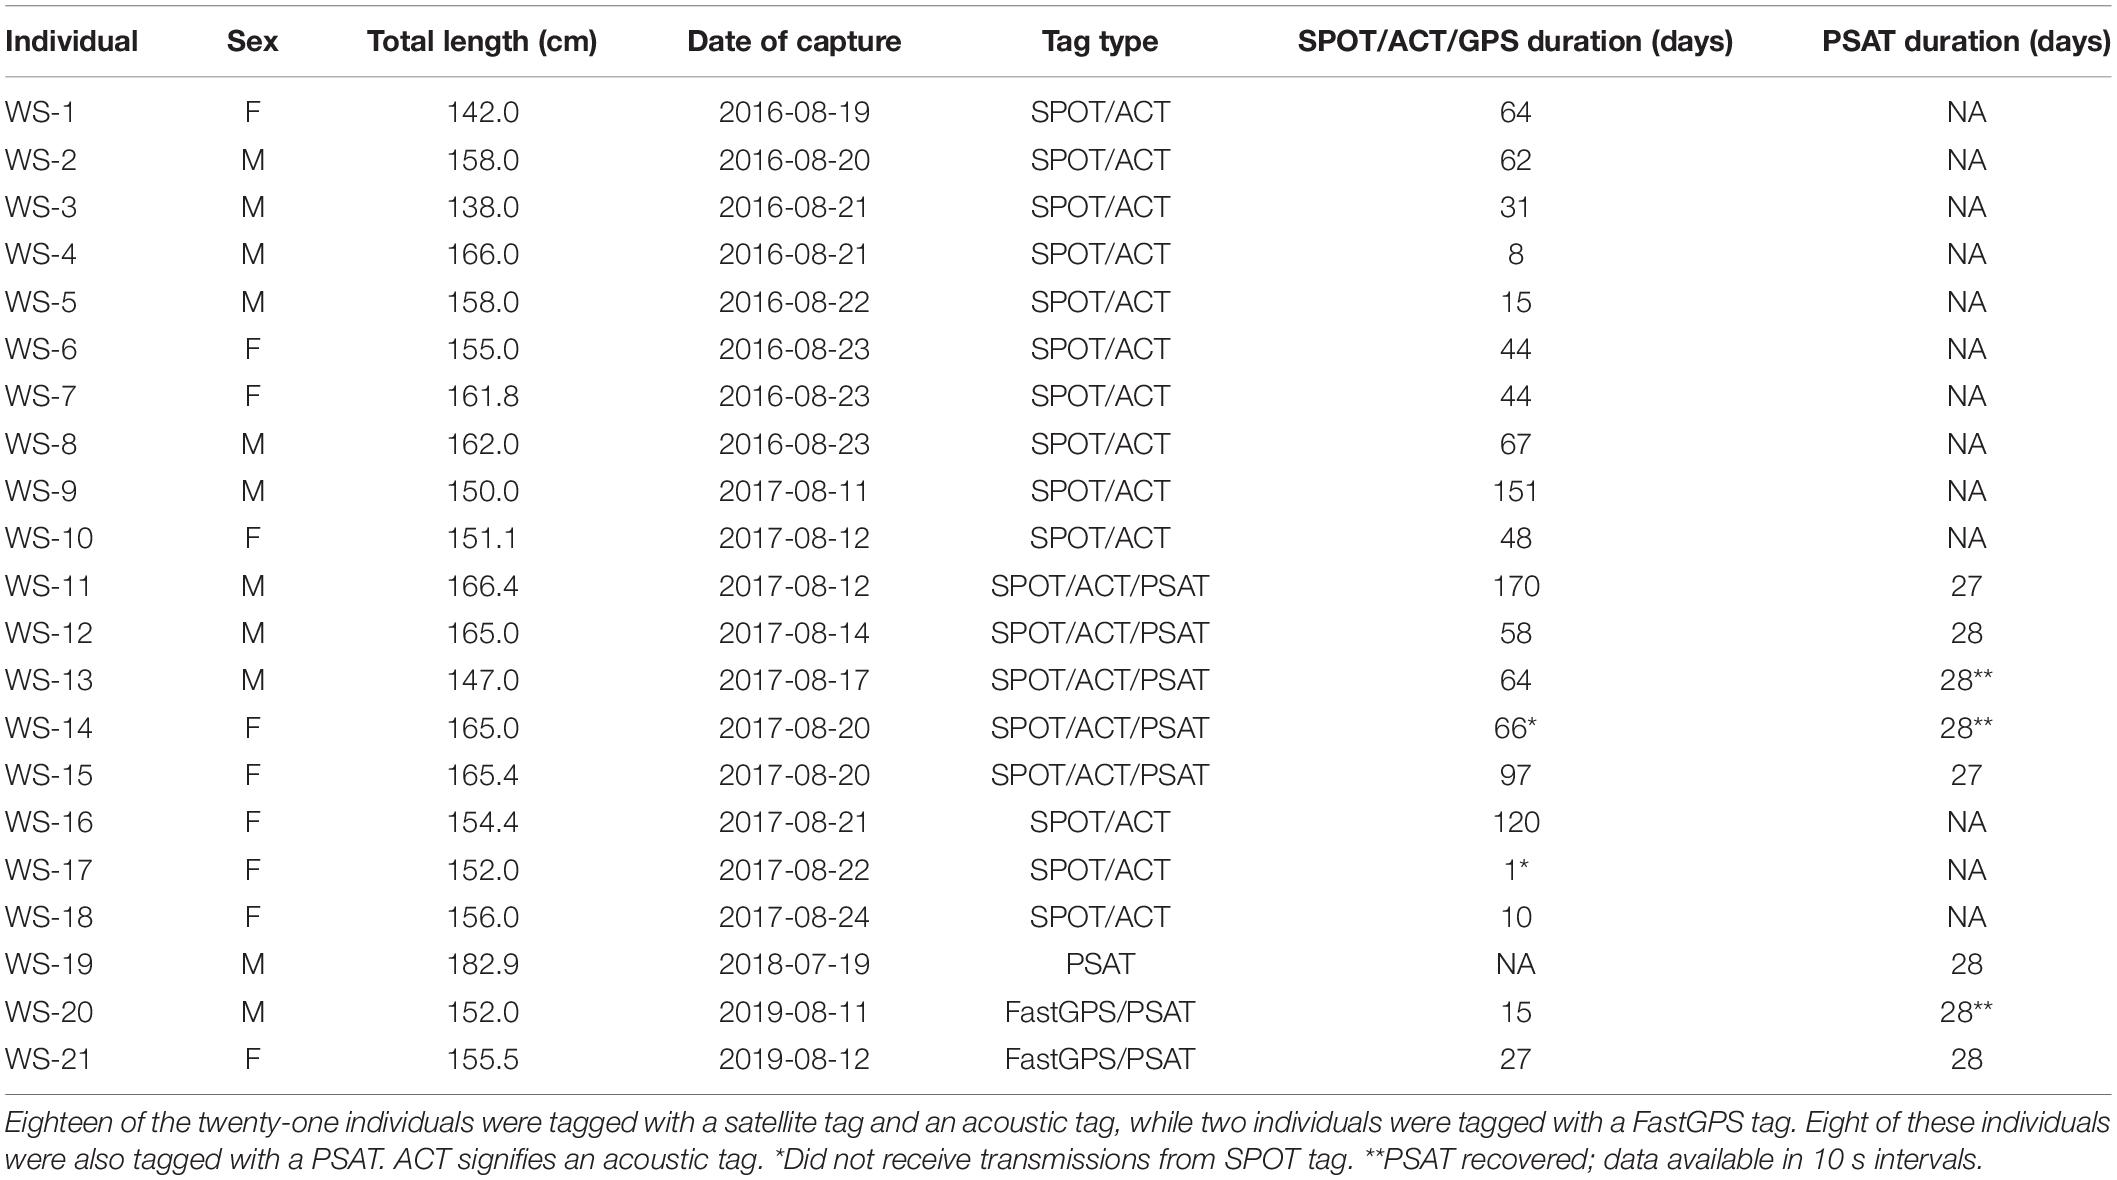
Table 1. Biological information of tagged sharks in the study.
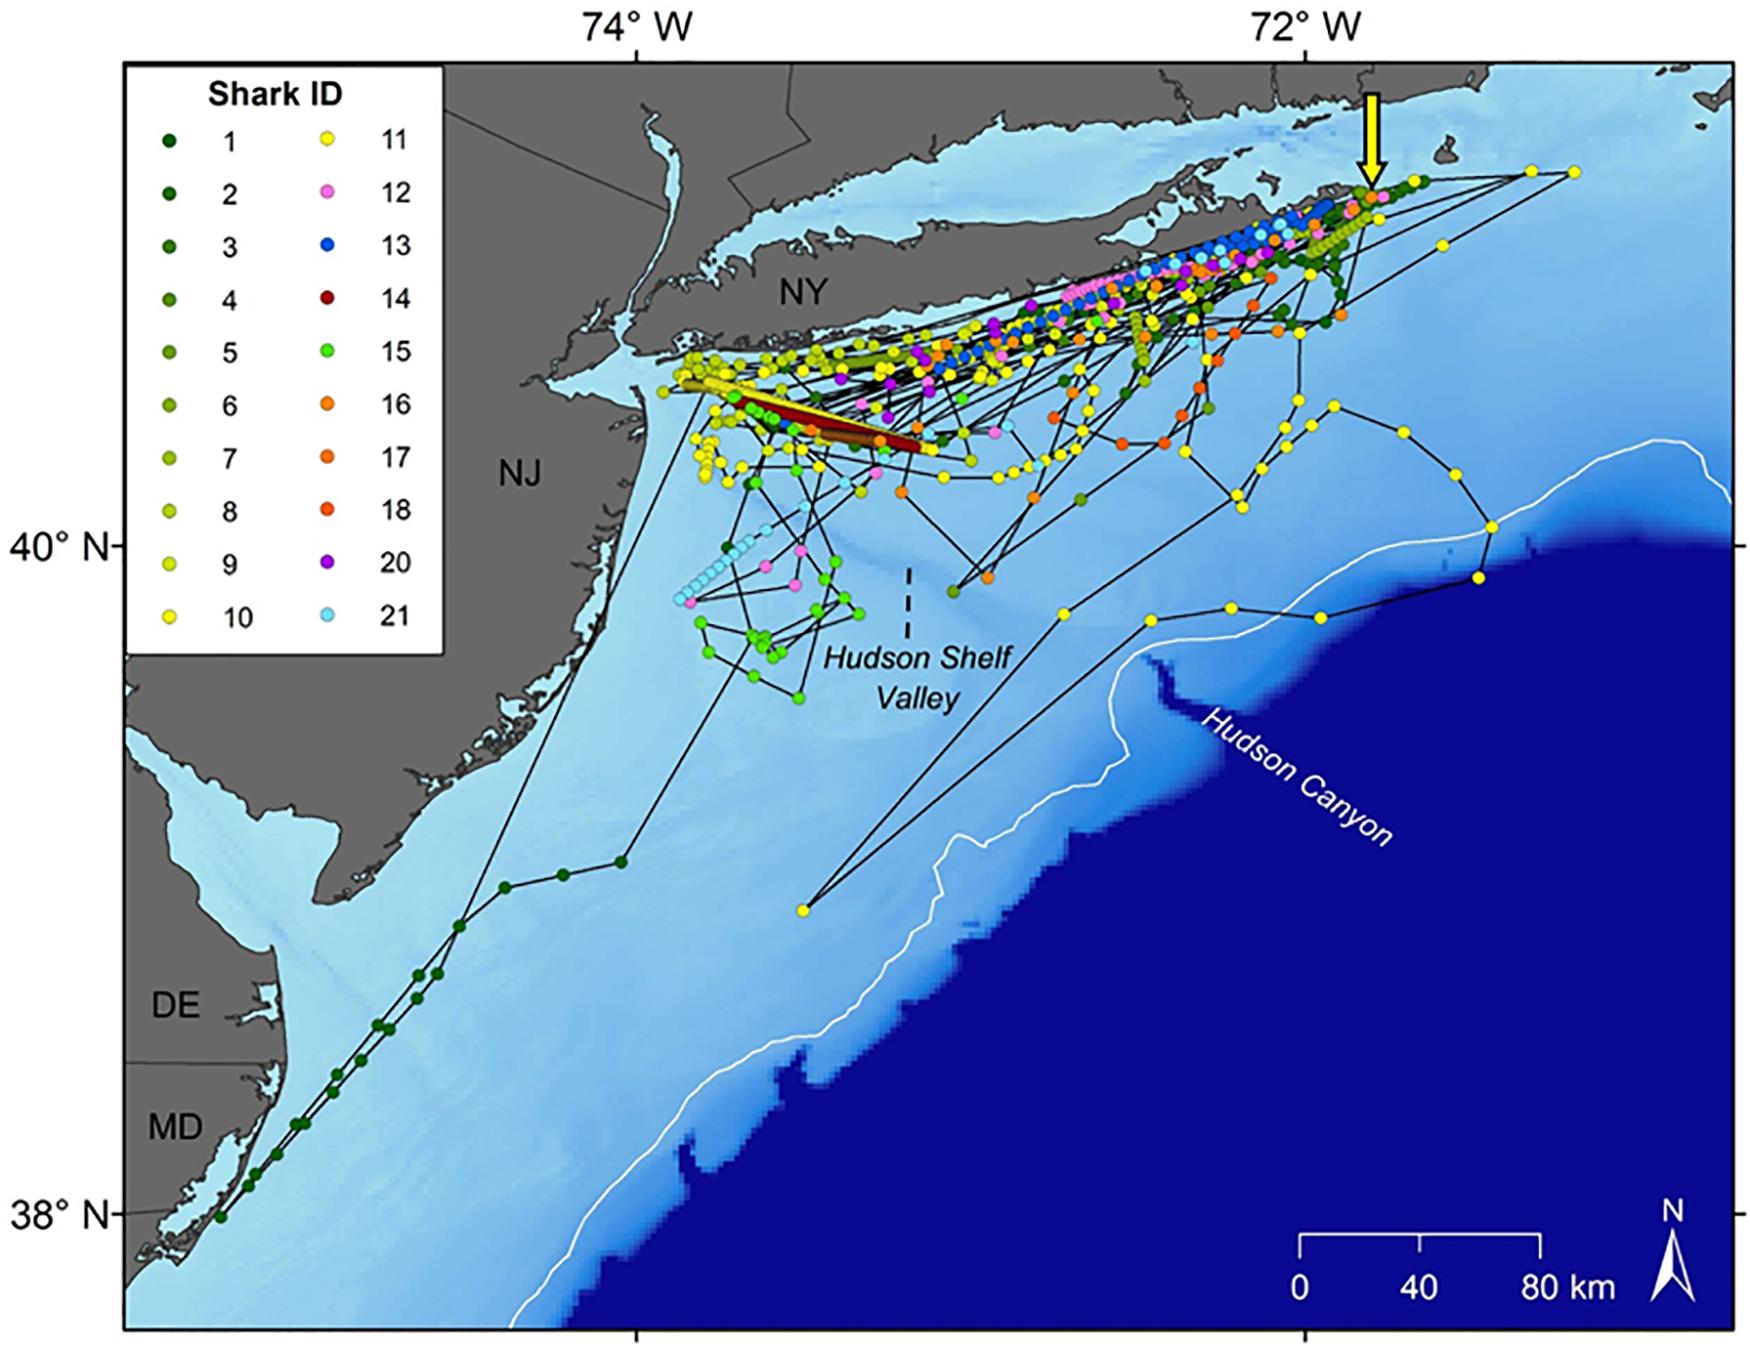
Figure 1. Horizontal tracks of the 21 white sharks tagged in the study. Yellow arrow depicts capture and release site off Montauk, NY. Dots represent daily locations via downsampling of Smart Position or Temperature (SPOT) transmitting tags, FastGPS, and/or acoustic detections.
Bathymetry
The average available bathymetry in the New York Bight was 52.1 ± 33.3 m, with a maximum depth of 294.3 m. The average underlying bathymetry (i.e., depths that tagged individuals swam over) was 27.7 ± 13.4 m, with a maximum depth of 338.2 m, and a minimum depth of 7.2 m. While the most commonly available bathymetry bin in the New York Bight was 30–40 m (available in 15% of the area), individuals were most frequently observed in shallower areas, between 20 and 30 m (48% of the time). Individuals only swam over depths between 30.0 and 40.0 m 27% of the time. Chi-square statistical results confirmed heterogeneity in underlying bathymetry use among sampled sharks (χL12 = 852.1356, df = 551, P = 0.00001; Table 2), and that some individuals were selective in underlying bathymetry (χL22 = 2,743.34, df = 580, P = 0.00001). On average, individuals were not using the bathymetry in proportion to its availability, regardless of which depths were selected (χL22 – χL12 = 1,891.201, df = 29, P = 0.00001). Selection ratio results showed a preference for underlying depths between 20 and 30 m, avoidance of depths shallower than 10 m and deeper than 40 m (Figure 2A). Mean selection ratios were above 1 for the 10–20 and 30–40 m intervals; however, confidence intervals were below the threshold value. As such, these habitats were considered to be neither selected nor avoided.
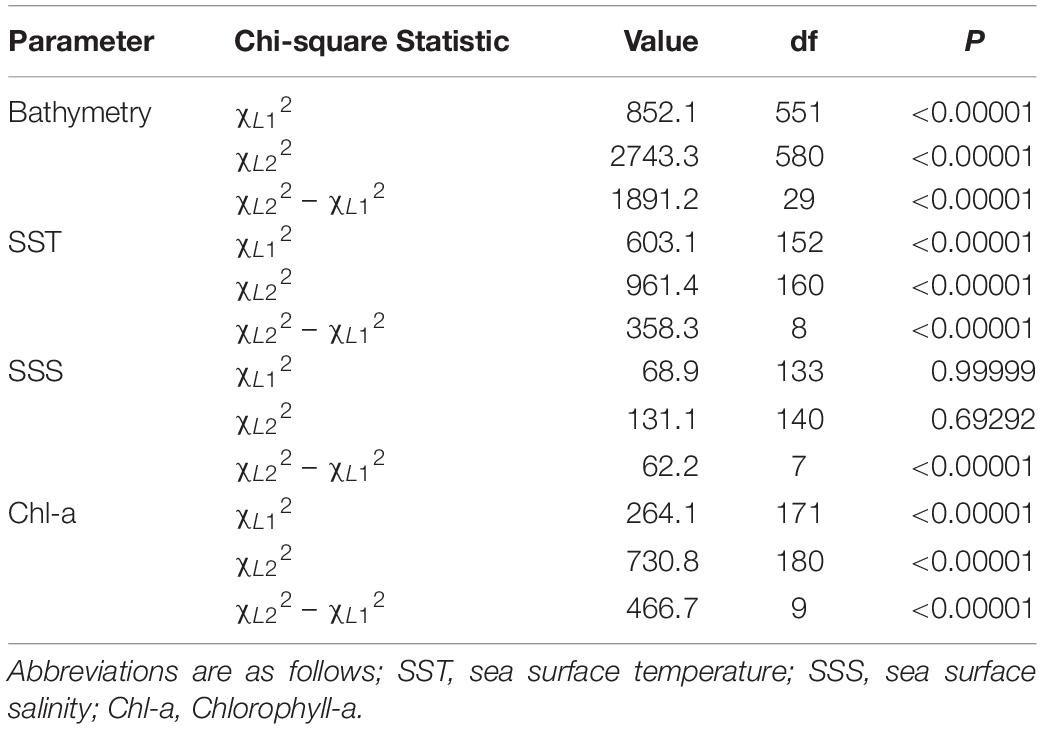
Table 2. Table of chi-square test statistics and associated values for each of the parameters analyzed in with respect to habitat preferences.
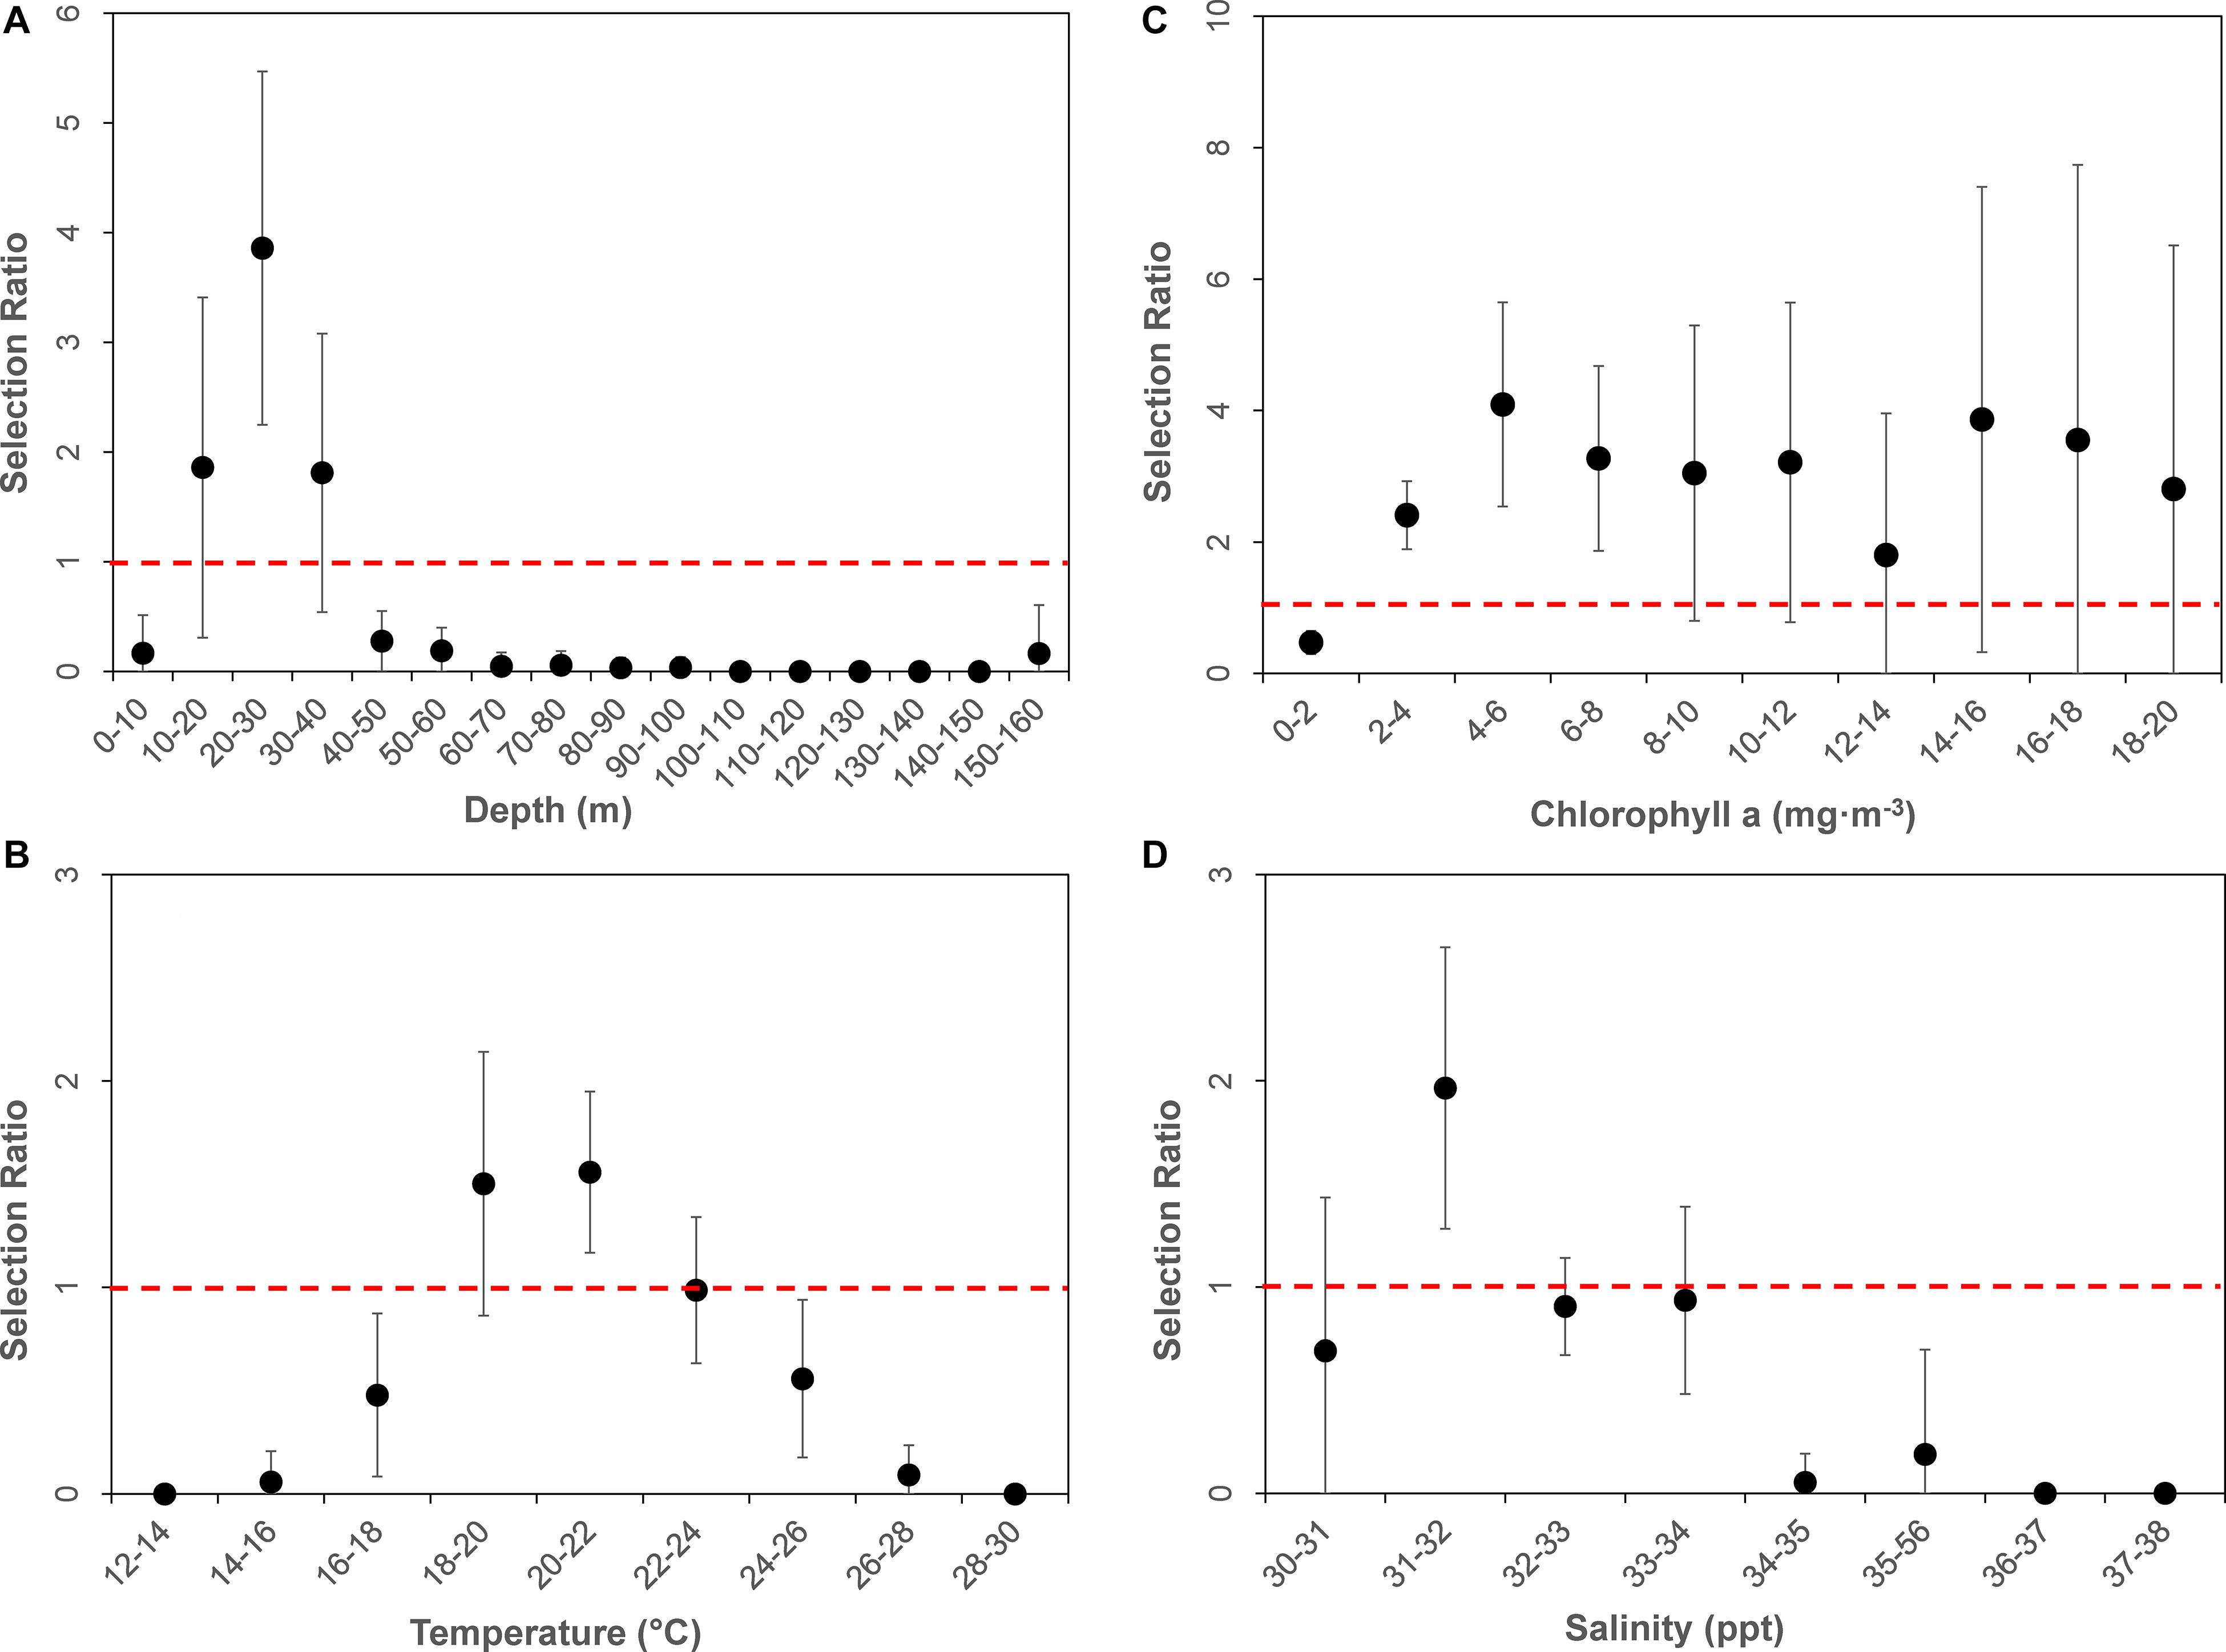
Figure 2. Dot plot of mean selection ratios (and confidence intervals) for various environmental parameters by bins: (A) Bathymetry, (B) Sea Surface Temperature, (C) Chlorophyll-a, and (D) Sea Surface Salinity. All environmental data were derived from remote sensing at daily horizontal position estimates of tagged animals. Dashed horizontal red line represents selection ratio of 1, above which values are “selected” for, and below which are considered “avoided.”
Sea Surface Temperature
Throughout the study period SST in the New York Bight ranged from 12.4 to 29.4°C (mean = 21.9 ± 2.8°C). Individuals swam in mean SSTs of 21.3 ± 2.0°C, with a maximum SST of 26.4°C, and a minimum SST of 15.7°C. All three chi-square statistics for SST analysis were found to be significant (P < 0.0001; Table 2), suggesting tagged individuals were using the SSTs differently and selecting for specific ranges of temperature. Chi-square results show sampled sharks exhibited heterogeneous use of available SSTs (χL12 = 603.08, df = 152, P < 0.0001), and individuals were demonstrating selection (χL22 = 961.379, df = 160, P < 0.0001). Additionally, there was evidence that the average selection was not in proportion to the availability of resources (χL22 – χL12 = 358.299, df = 8, P < 0.0001). Selection ratios results suggested a preference for SST between 20.0 and 22.0°C, and potentially between 18.0 and 20.0°C; confidence intervals extended slightly below the selection ratio threshold, so preference at the latter range was unclear (Figure 2B). Results also showed an avoidance of SSTs below 18.0°C and above 24.0°C, with no evidence of selection or avoidance for the 22.0–24.0°C temperature bin.
Chlorophyll-a
The mean chlorophyll-a concentration in the New York Bight ranged from 0.1 to 20.0 mg⋅m–3 (mean = 1.7 ± 2.3 mg⋅m–3). Individuals swam in an average of 3.6 mg⋅m–3 (±3.2 mg⋅m–3), with a maximum of 19.6 mg⋅m–3, and a minimum of 0.3 mg⋅m–3. Chlorophyll-a was used heterogeneously (χL12 = 264.0624, df = 170, P = < 0.00001; Table 2). At least some of the sharks were selective in the chlorophyll-a concentrations that were swam in compared to that chlorophyll-a concentration’s availability (χL22 = 730.8104, df = 180, P = 0.00001). On average, the sampled sharks were not using chlorophyll-a concentrations in proportion to their availability, regardless of which concentrations that were being selected for (χL22 – χL12 = 466.748, df = 9, P = 0.00001). Selection ratio results found avoidance for lower concentrations of chlorophyll a between 0.0 and 2.0 mg⋅m–3, and preference for concentrations between 2.0 and 8.0 mg⋅m–3 (Figure 2C). There was also potential for preference above concentrations of 8.0 mg⋅m–3; however, confidence intervals extended below the selection ratio threshold. Due to this, a preference for concentrations greater than 8.0 mg⋅m–3 was unresolved.
Sea Surface Salinity
The average available sea surface salinity in the New York Bight was 32.8 ± 1.2 ppt, with a maximum of 37.5 ppt, and a minimum of 30.0 ppt. The average sea surface salinity that individuals swam in was 32.3 ppt (±0.9), with a maximum of 35.7 ppt, and a minimum of 30.5 ppt. The first chi-square statistic was not significant (χL12 = 68.897, df = 133, P = 0.99), which suggests all sampled sharks were using sea surface salinities in the same proportions as the other sampled sharks (Table 2). Selection was not occurring in at least some of the sharks; some of the sharks were using the sea surface salinities in proportion to their availability (χL22 = 131.0885, df = 140, P = 0.69). On average, there was strong selection for certain sea surface salinities (χL22 – χL12 = 62.19167, df = 7, P = 0.00001), as was demonstrated on an individual basis. For example, WS-3, WS-10, and WS-12 had a strong selection for sea surface salinities between 31.0 and 32.0 ppt, while WS-7 selected for 32.0–33.0 ppt, and WS-21 had a strong selection for 30.0–32.0 ppt. Overall, selection ratio results illustrated a preference for sea surface salinities between 31.0 and 32.0 ppt, with neutral responses to salinity ranges of 30.0–31.0 and 32.0–34.0 and avoidance for anything >34.0 (Figure 2D).
Vertical Movements
White shark depth ranges from the 8 individuals fitted with PSAT tags spanned the surface to 199 m, with individual means between 6.6 and 11.7 m (Table 3). These mean depths were positioned at roughly half of the available water column based on underlying bathymetry estimated from horizontal positions. Temperatures recorded by PSAT tags ranged from 7.9 to 26.2°C with individual means from 19.2 to 20.7°C (Table 3). Mean temperatures recorded by PSAT tags approximated those extracted from remote sensing of SSTs (i.e., within 1°C) based on horizontal positions, although the latter recorded warmer temperatures. The smallest individual tagged with a PSAT (WS-13) exhibited the shallowest max depth (24.3 m) and warmest minimum temperature (17.3°C), as well as the narrowest depth and temperature ranges (Table 3).
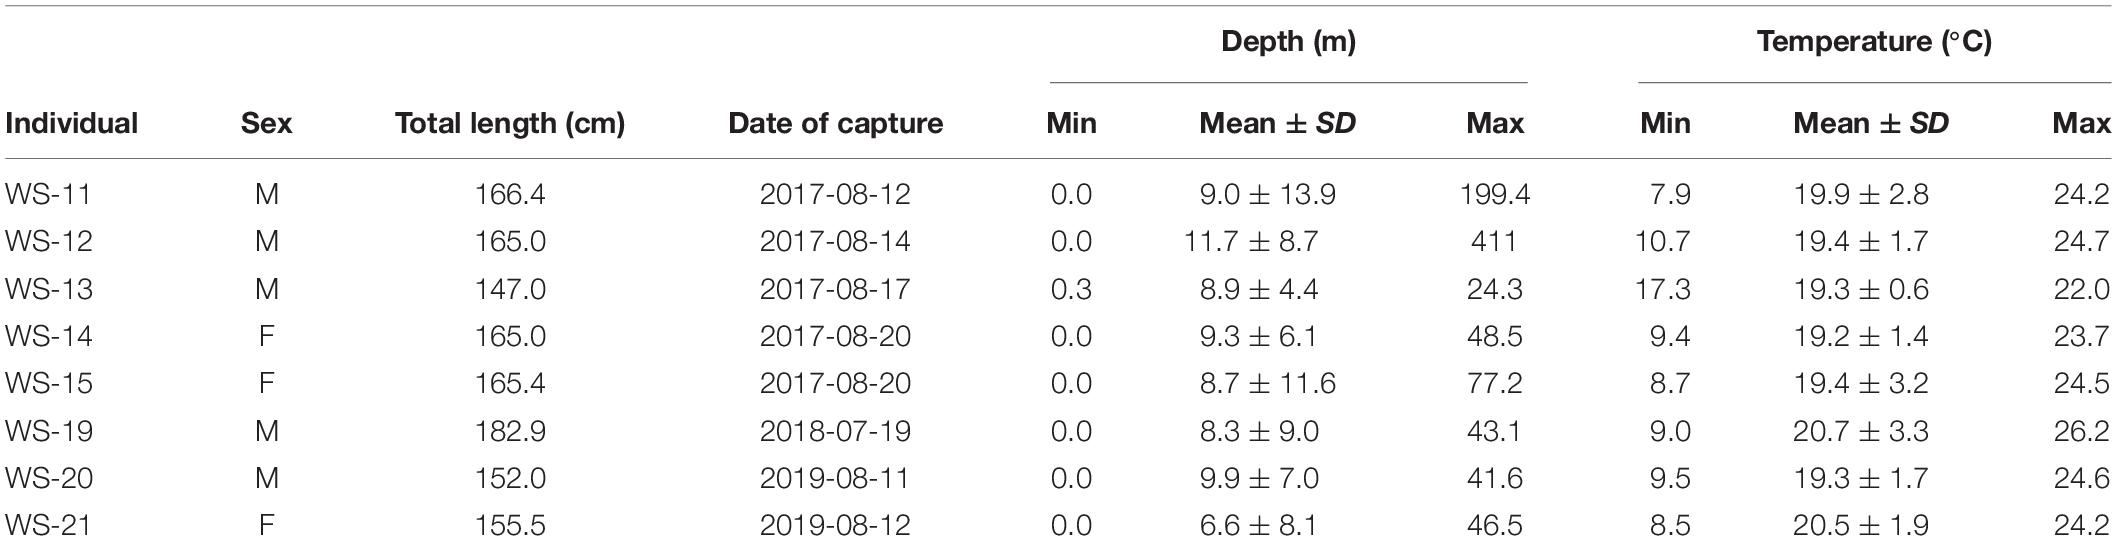
Table 3. Descriptive statistics for temperature and depth from the eight individuals fitted with pop-off satellite archival tags.
Three-dimensional interpolation of vertical and horizontal positions was possible for 7 individuals. Analyses of these data found that individuals swam over benthos between 4 and 424 m deep, mainly on the continental shelf, with one dive recorded off the continental slope (Figures 3, 4). There were multiple instances of sharks traversing and presumably interacting with large bathymetric and/or oceanographic features as they moved across the continental shelf, although this varied across individuals (Supplementary Figures 1–7). For example, several individuals (WS-11, WS-12, WS-15, and WS-21) crossed the Hudson Shelf Valley during southward movements across the New York Bight (Figure 4A; S1, S2, S5, S7). One individual, WS-15, also appeared to interact with relatively cold water (<10°C) when traversing the Hudson Shelf Valley (S5), which was apparent from 20 to 80 m depth and in stark contrast with surface water that approached 25°C during this period in late August 2017 (Figures 3F, 4B). Other instances of considerable thermal stratification (i.e., 10°C difference between surface water and deepest dives) were evident in dive profiles of WS-14 (Figure 3D), WS-19 (Figure 3G), WS-20 (Figure 3H), and WS-21 (Figure 3I). Unfortunately, WS-14 had limited horizontal position estimates due to a lack of transmissions from its SPOT tag (S4). However, the depth profiles from this recovered tag showed extensive oscillations between the surface and depth (i.e., 30–50 m) (Figure 3E). Other portions of temperature-depth profiles for these individuals were more homogeneous, with temperatures around 20°C and more limited depths <30 m. For example, WS-13 stayed close to Montauk, NY (Figure 4A; S3) and did not travel as far south as the other tagged sharks during the 28 days period.
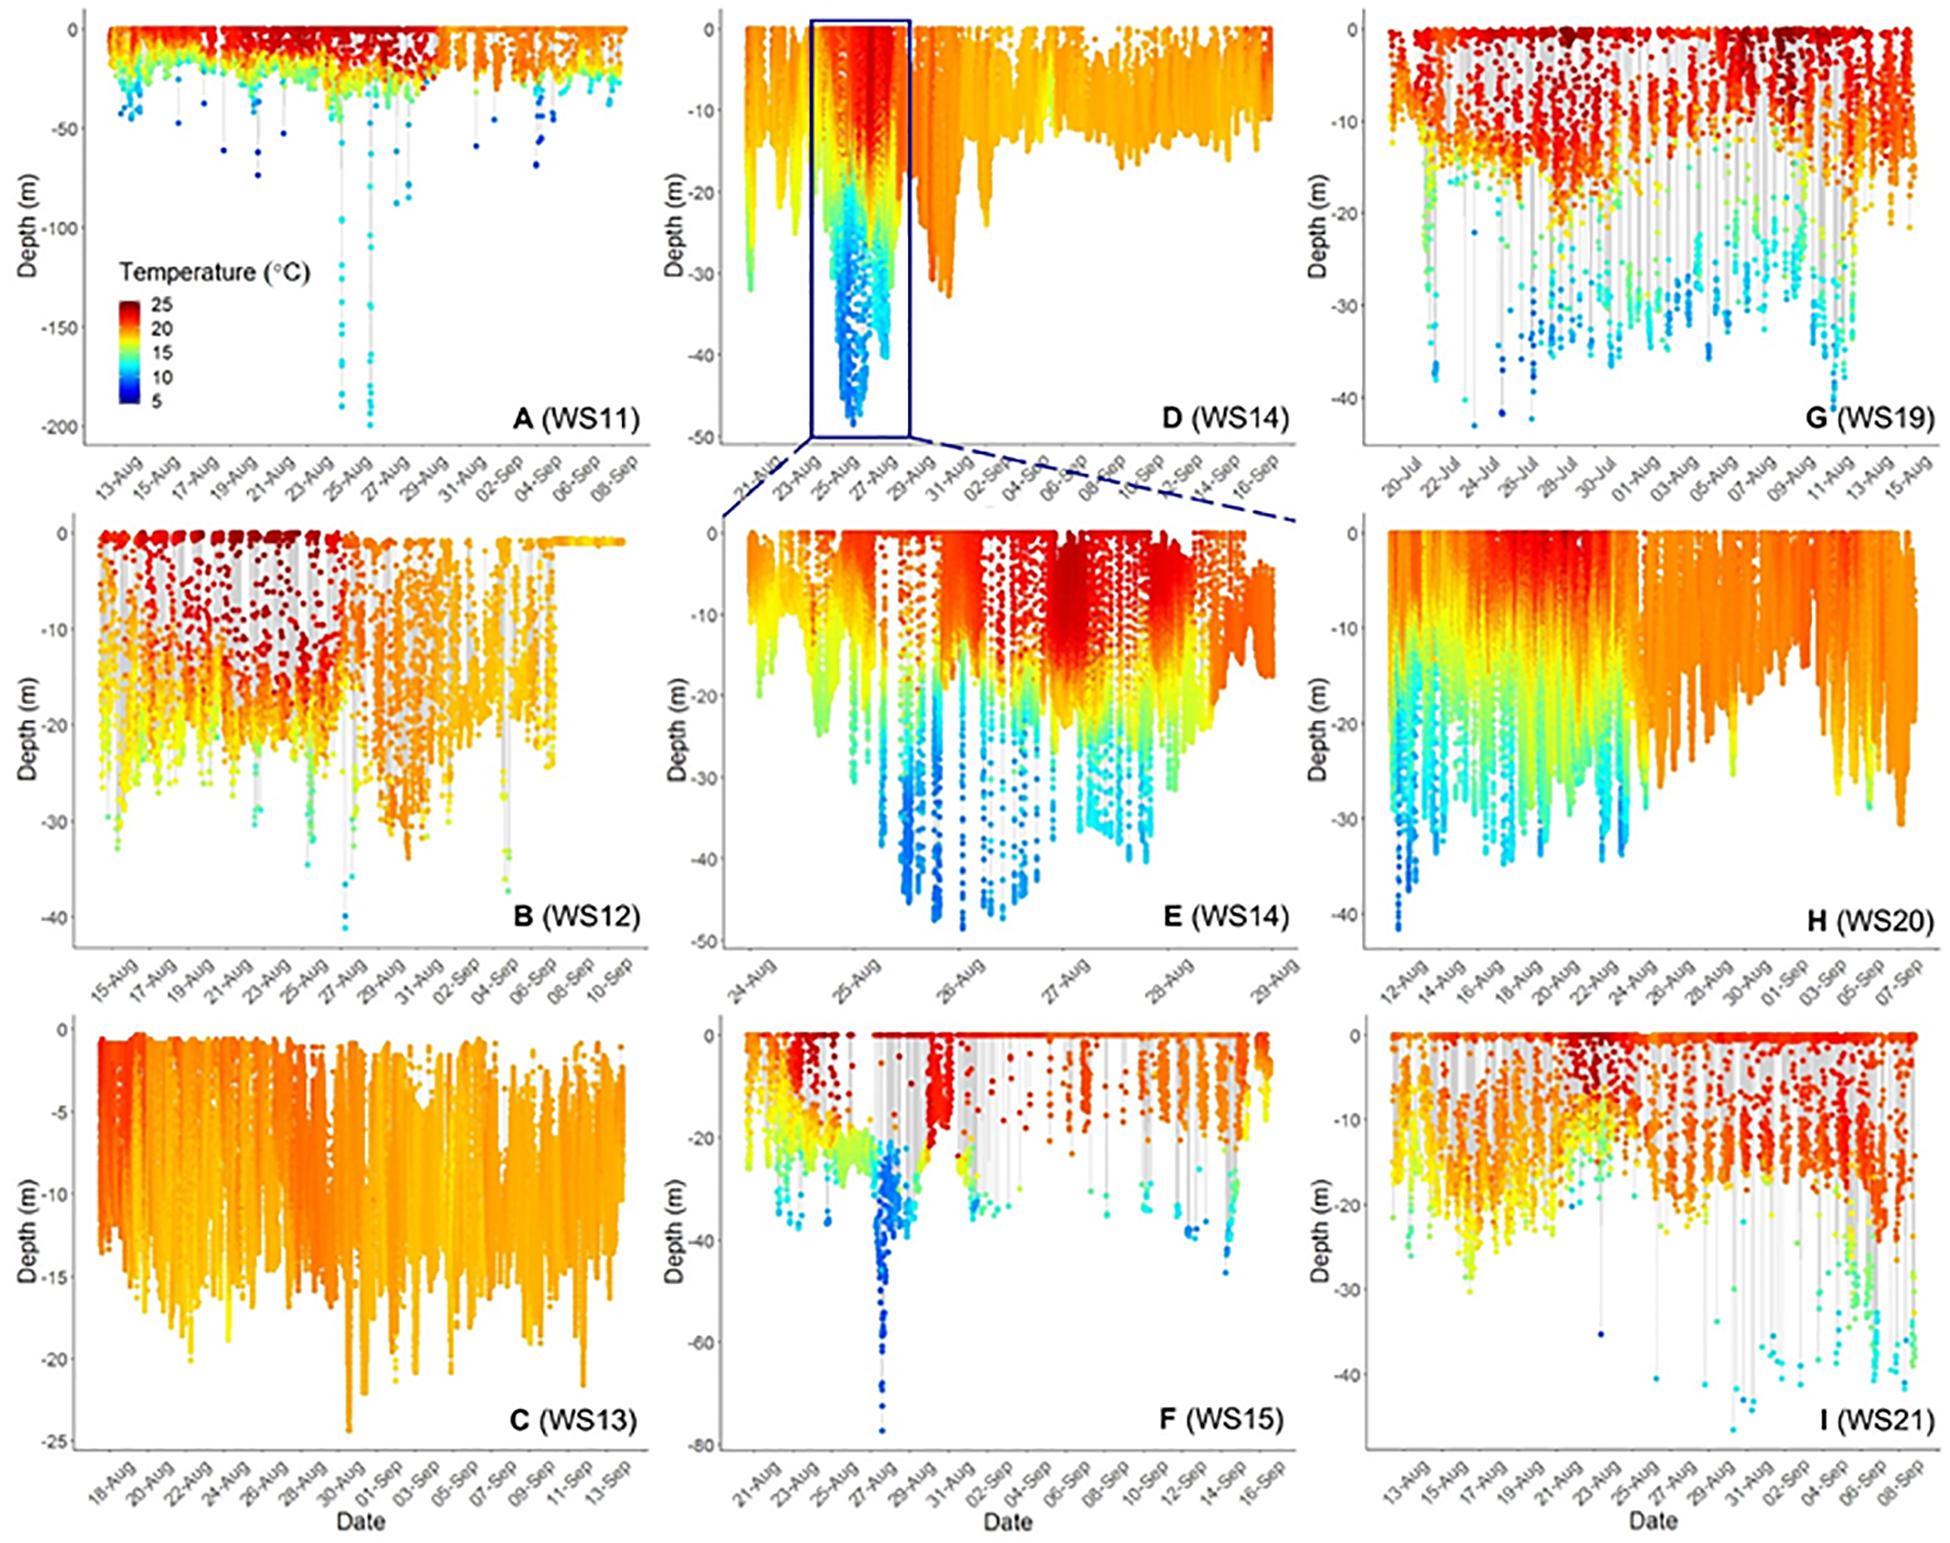
Figure 3. Time-series scatterplots of vertical depth and temperature profiles (color bar on bottom left of first plot) for 8. White Sharks 11–15 (A–F) were tagged in 2017, whereas 19 was tagged in 2018 (G) and 20 and 21 (H,I) are from 2019. (E) Represents an expansion of the blue box in (D) to demonstrate diel patterns in depth and temperature use. (C,D,H) Represent complete dive profiles from recovered PSAT tags.
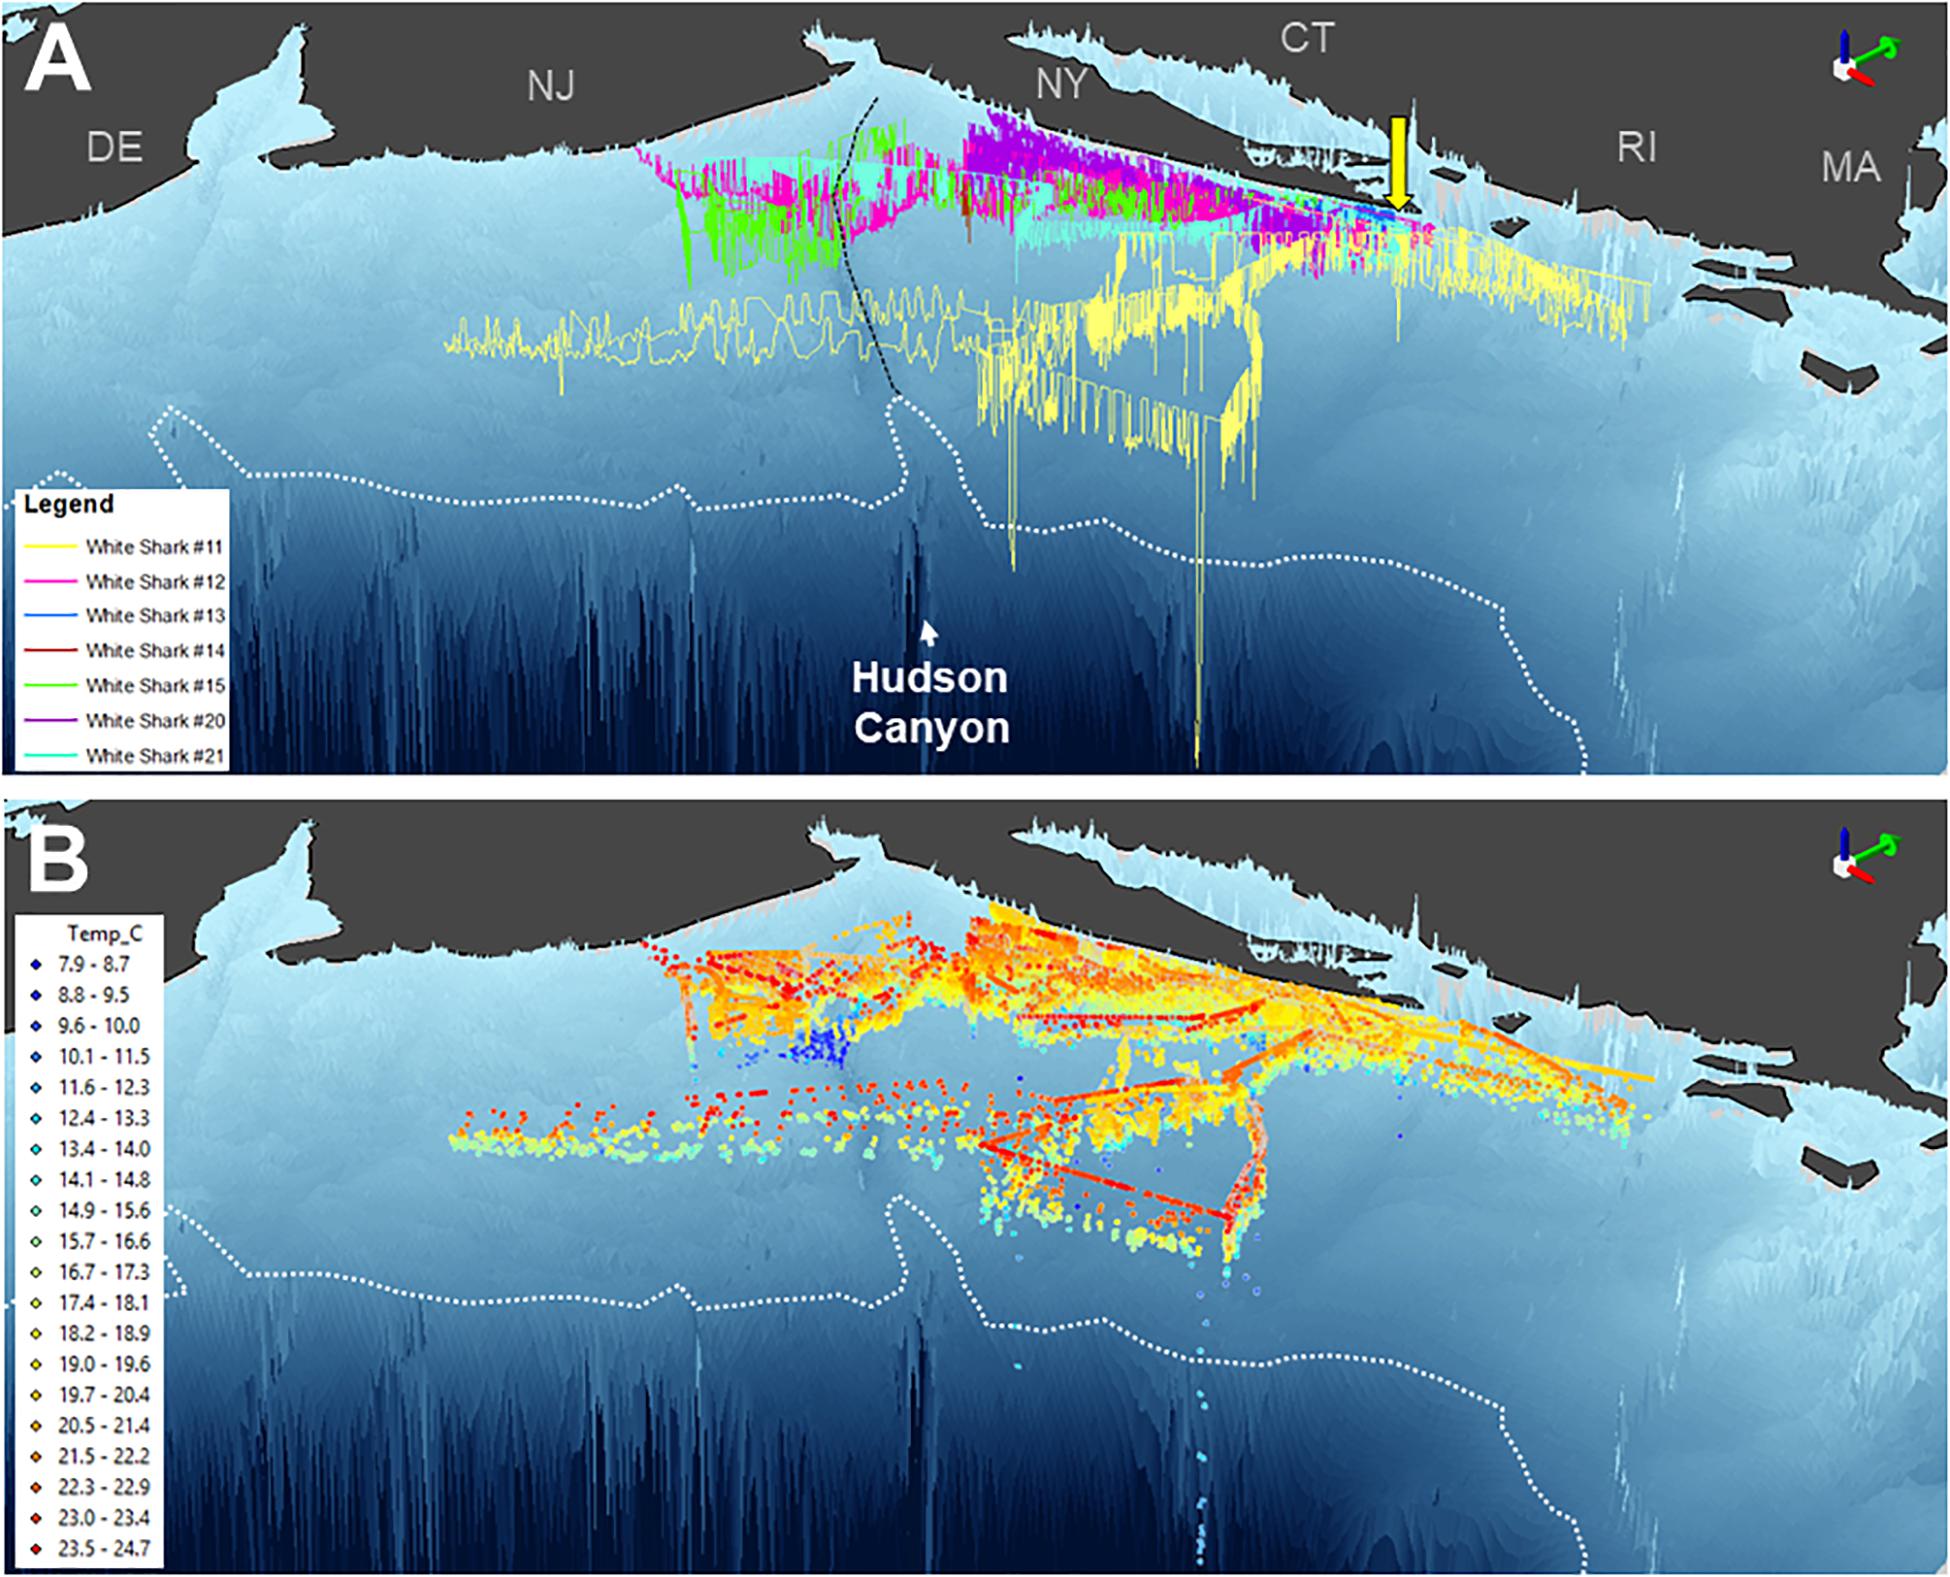
Figure 4. Three-dimensional position estimates for 7 double or triple-tagged sharks in the New York Bight region. Positions are colored by individual shark in (A) (as per Figure 1) and temperature in (B). Bathymetry is presented based on GEBCO data, with the continental shelf break (i.e., 200 m isobath) indicated by a white dotted line and the Hudson Shelf Valley identified by black dashed line. Green 3D arrows (top right of panels) point north. Yellow arrow depicts capture and release site off Montauk, NY.
Discussion
This study significantly expands our understanding of fine-scale vertical movement patterns and habitat selection of YOY and small juvenile white sharks in the New York Bight, the only confirmed nursery area for the northwest Atlantic white shark population (Curtis et al., 2018). Furthermore, it contributes to the growing body of information on the general life history and ecology of white sharks in this comparatively under-studied region (Curtis et al., 2014, 2018; Skomal et al., 2017; Huveneers et al., 2018; Bastien et al., 2020). The residency and consistent selection of continental shelf habitat in the New York Bight by young white sharks results in a striking size-based segregation of the population during summer and autumn months (July through November) when larger white sharks (>2.5 m) mainly occupy more northern waters from Massachusetts to Newfoundland, Canada (Casey and Pratt, 1985; Curtis et al., 2014; Skomal et al., 2017; Bastien et al., 2020). The relative scarcity of large white sharks in the nursery area during this period provides young sharks a refuge from natural mortality and risk effects associated with predation, and permits them to play a role as apex predators in the system. Thus, their habitat selection patterns can result in important direct and indirect effects on ecosystem structure and nutrient pathways from the coastal zone to offshore habitats.
Habitat Selection
Across the multiple years examined in this study, tagged individuals consistently displayed horizontal movements parallel to Long Island’s southern shoreline and the New Jersey coast. Consistent with the preliminary observations of Curtis et al. (2018), horizontal movements ranged from the surf zone to over 130 km from shore; however, over 90% of the horizontal movements were within 20 km of Long Island’s southern shoreline. Juvenile white sharks in the Southern California Bight were also found to stay close to shore, with an average distance of 7.2 ± 5.7 km (White et al., 2019). White et al. (2019) attempted to model suitable juvenile white shark habitat along the U.S. Atlantic coast using observations from the U.S. Pacific coast, including distance from shore as a key variable. Our results suggest that distance from shore may not be as important as bathymetry, given the sharks in the present study occupied waters further from shore than predicted by White et al. (2019), and tended to select waters >10 km from shore overlying bottom depths from 20 to 30 m. This is likely due to significant differences in the width of the continental shelf in southern California compared to the New York Bight (<10 vs. >100 km, respectively). The reasons for the apparent avoidance of nearshore shallow waters (<10 m deep) by young white sharks tracked in this study requires further exploration, but could be due to lower prey availability, higher wave energy and related higher turbidity, and/or competition from other co-occurring predators (e.g., sand tiger shark Carcharias taurus, sandbar shark Carcharhinus plumbeus, or dusky shark C. obscurus). Based on the available observations globally, YOY and juvenile white sharks appear to be primarily coastal and shelf-oriented, consistently occurring over depths of less than 200 m, but utilizing habitats across the breadth of the shelf (Weng et al., 2007; Bruce and Bradford, 2012; White et al., 2019; Spaet et al., 2020). Occasional forays beyond the shelf edge, particularly in the northeastern Pacific where the continental shelf is very narrow, results in juvenile white sharks displaying epipelagic behaviors (Dewar et al., 2004; Weng et al., 2007, 2012). Selection of focal areas within shelf ecosystems are likely influenced by other environmental conditions including temperature, productivity, and prey availability.
The sharks in this study selected waters with SSTs between 18.0 and 22.0°C. Juvenile white sharks in the northeastern Pacific Ocean were found in similar temperatures between 14.0 and 24.0°C (White et al., 2019). The highest catch rates of juveniles in eastern Australia occurred in SSTs between 17.0 and 18.0°C (Bruce et al., 2019). White sharks exhibit regional endothermy, and as such, are able to tolerate a wider range of temperatures than most ectothermic fish providing a variety of predatory advantages (Carey et al., 1982; Watanabe et al., 2019). Summer-autumn water temperatures in the New York Bight may span the optimal physiological temperatures for young white sharks, making the region ideal from a thermal perspective. However, YOY and juvenile white sharks appear to occupy a narrower range of temperatures than larger individuals (Curtis et al., 2014; Skomal et al., 2017), and the most restricted temperature range recorded from PSATs was from the smallest individual tagged in the study. These ontogenetic differences could be due to the smaller body mass, less developed heat exchange mechanisms (i.e., less red muscle, smaller retia), and higher surface area to volume ratios of young sharks, making it more physiologically costly to defend an elevated core temperature over as wide a range of temperatures as adults. This has important implications for the future of young white shark habitats given the effects of climate change and variability, especially in the mid-Atlantic Bight which is warming at a much faster rate than most of the global ocean (Saba et al., 2016; Huveneers et al., 2018).
Young white sharks in the New York Bight also selected areas with relatively high levels of productivity (i.e., mesotrophic waters) as reflected by salinity and chlorophyll-a concentration. Tagged individuals selected sea surface salinities between 31.0 and 32.0 ppt (i.e., slightly less saline than oceanic waters), and chlorophyll-a concentrations >2.0 mg m–3. White sharks are not considered euryhaline, although they do occasionally occur within estuarine water bodies (Harasti et al., 2017). Sea surface salinity preferences have not been studied previously for white sharks, but are commonly used in habitat suitability models for other species. Shallow areas close to land tend to have lower salinities due to proximity to coastal runoff and freshwater flow, and may contribute to a decreased predation risk to young sharks as larger individuals avoid these areas (Simpfendorfer et al., 2005; Wetherbee et al., 2007; Knip et al., 2011; Trujillo and Thurman, 2016). Freshwater inputs and longshore currents also contribute to increased primary productivity and phytoplankton blooms nearshore, as indicated by the shoreward increase in chlorophyll-a concentrations in this region (Xu et al., 2011). Phytoplankton make up the base of the food web, and as such, high concentrations in an area can support an abundance of life, including higher-order predators like sharks (Trujillo and Thurman, 2016). Due to upwelling (the flow of deep nutrient rich water to the surface), coastal areas are generally high in nutrients and phytoplankton (Trujillo and Thurman, 2016). Similarly, phytoplankton concentrations along Long Island’s southern shoreline are affected by groundwater upwelling, which is the occurrence of groundwater high in nutrients seeping through sediment on the seafloor (Gobler and Sañudo-Wilhelmy, 2001). Additionally, this area is home to several rivers, including the Hudson River, and as such, nutrient runoff may cause an increase of primary productivity. Thus, it is not unexpected that YOY and juvenile white sharks select areas with high productivity to be used as a foraging ground where they prey on a variety of fishes and invertebrates (Casey and Pratt, 1985). Our results differ from those found in the northeastern Pacific Ocean as White et al. (2019) noted chlorophyll-a was found to not be a significant variable in habitat selection for juvenile white sharks in the Southern California Bight. However, in the Mediterranean Sea, studies have suggested high productivity in the Adriatic Sea and the Sicilian Channel may be the reason behind the higher occurrence of white sharks in the area (Coll et al., 2007; Boldrocchi et al., 2017). In nursery areas off eastern Australia, seasonal upwelling and therefore, nutrient enrichment, are believed to coincide with suitable prey aggregations of various teleosts, providing the nurseries with an abundance of prey for immature white sharks (Bruce and Bradford, 2012).
Three-Dimensional Movements
Few studies have explored vertical behavior of YOY or juvenile white sharks (Klimley et al., 2002; Dewar et al., 2004; Weng et al., 2007, 2012), and this is the first such study in the Atlantic Ocean basin. Vertical behavior of the PSAT-tagged sharks varied between individuals and locations within the New York Bight. The drivers of shark vertical behavior have long been a subject of inquiry, with a variety of physical and biological variables suggested to hold influence (e.g., Carey et al., 1990; Klimley et al., 2002; Gaube et al., 2018). While SSTs ranging between 15.7 and 26.4°C were found at the locations of the tagged individuals, further research is needed to determine if vertical behavior is influenced by SST (e.g., Andrzejaczek et al., 2018).
The vertical diving behavior and accompanying measurements of temperature identified several areas across the shelf with thermally stratified water column structure. This was most evident around the Hudson Shelf Valley region where some of the coldest temperatures were recorded (<10°C) during the summertime tracking period from WS-14 and WS-15. Interestingly, these 50–80 m waters were colder than those recorded during the deepest dives of WS-11 to 200 m, which occurred seaward of this region off the continental shelf. Previous physical measurements in the mid-Atlantic Bight have shown that a “cold pool” of water commonly develops along the bottom of the mid-shelf region through the summertime (Houghton et al., 1982; Falkowski et al., 1983; Rona et al., 2015). Although primary production decreases at the surface of this region relative to the coastline, chlorophyll-a levels at depth (i.e., 20–40 m) approximate those measured nearshore (Falkowski et al., 1983). The presence of multiple white sharks in these areas for several days suggests that the edge of the mid-Atlantic Cold Pool may provide suitable subsurface habitat for these predators, as has been recently suggested for juvenile dusky sharks (Bangley et al., 2020a). Indeed, the waters surrounding the Hudson Shelf Valley as well as shelf-edge waters of the mid-Atlantic Bight are targeted by several fisheries (Rona et al., 2015), and have high levels of habitat and biological diversity (Pierdomenico et al., 2015, 2017). Young white sharks may therefore be exploiting more abundant food resources that accompany this unique subsurface feature, which apparently facilitates oceanographic conditions that support high levels of prey productivity. Additional tagging, including high-resolution biologging, accelerometry, and animal-borne video systems, to observe young white shark behavior is needed from this area. Further, what drives these individuals to move offshore from protected and productive waters along Long Island’s southern shorelines is still uncertain and should be explored.
Prey availability also likely influences young white shark vertical activity. Juvenile white sharks are documented to feed mainly on smaller demersal elasmobranchs (Hypanus spp., Myliobatis spp., Leucoraja spp., Mustelus canis), and teleosts such as searobins (Prionotus spp.), hakes (Urophycis spp.), and flounders (Pleuronectidae and Paralichthyidae), which may influence bottom-oriented behavior (Casey and Pratt, 1985; Santana-Morales et al., 2012; Onate-Gonzalez et al., 2017). Likewise, locally abundant pelagic prey species including squids (Illex spp. and Doryteuthis spp.), mackerel (Scomber spp.), and menhaden (Brevoortia tyrannus) may drive surface-oriented or diel vertical migration behaviors in certain locations. In the New York Bight, demersal species increase in abundance from the continental shelf edge shoreward (National Oceanic and Atmospheric Administration (NOAA), 2018), and the highly productive nearshore waters are vastly diverse and home to over 300 species of fish (Briggs and Waldman, 2002). However, pelagic prey may also become locally aggregated, particularly in thermally stratified waters where we observed extensive diving in upper layers (Gaube et al., 2018).
Undoubtedly, our work shows that young white sharks traverse variable oceanographic features across the continental shelf in the New York Bight, and these may be influenced by the underlying bathymetry. Further efforts to integrate multiple complementary tag technologies on each tagged individual will provide more complete characterizations of movements and the drivers of habitat selection in an inherently three-dimensional environment.
Implications for Management
There is growing recognition of the importance of nursery areas to the overall sustainability of shark populations (Heupel et al., 2007, 2018). In order to inform conservation and management efforts in these areas, however, they must first be accurately characterized with an understanding of where, when, and how a given species uses the habitat. The study of juvenile white shark habitats and potential anthropogenic impacts on those areas was recently considered to be a high research priority amongst white shark scientists around the world (Huveneers et al., 2018). As the New York Bight, a relatively small and discrete region, remains the only confirmed white shark nursery area in the entire North Atlantic Ocean, it may be of critical importance to the long-term maintenance of the regional white shark population. The results from this study may help improve the characterization of Essential Fish Habitat (EFH) for YOY and juvenile white sharks for NOAA National Marine Fisheries Service (NMFS) fishery management plans (e.g., National Oceanic and Atmospheric Administration (NOAA), 2017a). NMFS has considered designating a Habitat Area of Particular Concern (HAPC) in the northern mid-Atlantic Bight and the shoreline off southern New England for YOY and juvenile white sharks; however, the agency determined that an insufficient amount of data was available at the time to support this (National Oceanic and Atmospheric Administration (NOAA), 2017a,b). The improvement of EFH characterization and the potential designation of HAPCs for young white sharks using the data presented herein could benefit the ongoing assessment and mitigation of habitat impacts from fisheries, offshore energy development, habitat degradation, and other human activities.
Fisheries bycatch remains a primary threat to white sharks in the northwest Atlantic (Curtis et al., 2014; Huveneers et al., 2018; Bowlby and Gibson, 2020) and tracking data from the present study can also be used to assess bycatch susceptibility and potentially inform spatial management by NMFS (Lyons et al., 2013; Queiroz et al., 2019). Finally, understanding species-habitat relationships are critical for predicting the potential impacts of long-term environmental changes including climate change (e.g., Kleisner et al., 2017; Crear et al., 2020). White shark coastal nursery areas may be comparatively vulnerable to the effects of global warming (Huveneers et al., 2018) and given the importance of water temperature in habitat selection and seasonal movements of young white sharks (Weng et al., 2007; Curtis et al., 2018; this study), climate change impacts on the mid-Atlantic continental shelf ecosystem (Saba et al., 2016) could pose viable threats to the survival of juveniles, negatively affecting sustained recruitment to the adult population. Telemetry and biologging tools continue to provide the information necessary to simultaneously address numerous questions on the ecology, behavior, and conservation of highly mobile marine species that have traditionally been challenging to explore.
Data Availability Statement
The raw data supporting the conclusions of this article will be made available by the authors, without undue reservation.
Ethics Statement
The animal study was reviewed and approved by Florida Atlantic University. All individuals collected in this animal study were collected and tagged using university-approved animal use protocols (FAU AUP# 16-07, 19-19). All activities were undertaken with permits or letters of acknowledgment from both state (New York State Department of Environmental Conservation LPSCI-1634) and federal (NMFS SHK-EFP-16-04, SHKLOA-17-02, SHK-LOA-18-11, SHK-LOA-19-06) agencies. All efforts were made to minimize animal pain and suffering during capture and handling procedures. All surgeries were overseen by a licensed veterinarian specializing in aquatic veterinary medicine.
Author Contributions
RS, TC, and MA designed the study. TC, GM, GF, and MA secured funding for the project. RS led the data analysis with assistance from TC and MA and led the writing of manuscript with assistance from all authors. All authors participated in fieldwork.
Funding
Funding and support was provided by the OCEARCH, Harbor Branch Oceanographic Institute Foundation, Florida Atlantic University Foundation, South Fork Natural History Museum, Andrew F. Sabin Family Foundation, NMFS Atlantic Highly Migratory Species Management Division, Southampton Public Schools, and a number of private donors.
Conflict of Interest
The authors declare that the research was conducted in the absence of any commercial or financial relationships that could be construed as a potential conflict of interest.
Acknowledgments
We are grateful to all of the organizations and individuals that contributed to the field work and data collection associated with this study including OCEARCH, South Fork Natural History Museum, Reel Science Charters, Harbor Branch Oceanographic Institute, Wildlife Conservation Society, and the New York Aquarium, with special thanks to B. McBride, B. Eyre, D. J. Lettieri, T. Goggins, A. Meite, R. Hueter, L. Winn, J. Quinlan, M. Hyatt, H. Walters, J. Labelle, M. Camhi, C. Eddy, M. Drymon, G. Roskar, L. Hoopes, F. Quevedo, C. Paparo, W. Zublionis, J. Metzger, and M. Berkhout. We thank M. Frisk and his lab at Stony Brook University, Wildlife Conservation Society, and other members of the ACT Network for providing acoustic tag detections in the New York Bight. For analytical assistance we also thank C. Bangley, B. Galuardi, D. Crear, B. DeGroot, and L. Brewster. The views or opinions expressed herein are those of the authors and do not necessarily reflect those of NOAA, the Department of Commerce, or any other institution.
Supplementary Material
The Supplementary Material for this article can be found online at: https://www.frontiersin.org/articles/10.3389/fmars.2021.643831/full#supplementary-material
Supplementary Figure 1 | Three-dimensional position estimates for WS-11 in the New York Bight region. Positions are colored by individual shark in (A) (as per Figure 1) and temperature in (B). Bathymetry is presented based on GEBCO data, with the continental shelf break (i.e., 200 m isobath) indicated by a white dotted line and the Hudson Shelf Valley identified by black dashed line. Green 3D arrows (top right of panels) point north. Yellow arrow depicts capture and release site off Montauk, NY.
Supplementary Figure 2 | Three-dimensional position estimates for WS-12 in the New York Bight region. Positions are colored by individual shark in (A) (as per Figure 1) and temperature in (B). Bathymetry is presented based on GEBCO data, with the continental shelf break (i.e., 200 m isobath) indicated by a white dotted line and the Hudson Shelf Valley identified by black dashed line. Green 3D arrows (top right of panels) point north. Yellow arrow depicts capture and release site off Montauk, NY.
Supplementary Figure 3 | Three-dimensional position estimates for WS-13 in the New York Bight region. Positions are colored by individual shark in (A) (as per Figure 1) and temperature in (B). Bathymetry is presented based on GEBCO data, with the continental shelf break (i.e., 200 m isobath) indicated by a white dotted line and the Hudson Shelf Valley identified by black dashed line. Green 3D arrows (top right of panels) point north. Yellow arrow depicts capture and release site off Montauk, NY.
Supplementary Figure 4 | Three-dimensional position estimates for WS-14 in the New York Bight region. Positions are colored by individual shark in (A) (as per Figure 1) and temperature in (B). Bathymetry is presented based on GEBCO data, with the continental shelf break (i.e., 200 m isobath) indicated by a white dotted line and the Hudson Shelf Valley identified by black dashed line. Green 3D arrows (top right of panels) point north. Yellow arrow depicts capture and release site off Montauk, NY.
Supplementary Figure 5 | Three-dimensional position estimates for WS-15 in the New York Bight region. Positions are colored by individual shark in (A) (as per Figure 1) and temperature in (B). Bathymetry is presented based on GEBCO data, with the continental shelf break (i.e., 200 m isobath) indicated by a white dotted line and the Hudson Shelf Valley identified by black dashed line. Green 3D arrows (top right of panels) point north. Yellow arrow depicts capture and release site off Montauk, NY.
Supplementary Figure 6 | Three-dimensional position estimates for WS-20 in the New York Bight region. Positions are colored by individual shark in (A) (as per Figure 1) and temperature in (B). Bathymetry is presented based on GEBCO data, with the continental shelf break (i.e., 200 m isobath) indicated by a white dotted line and the Hudson Shelf Valley identified by black dashed line. Green 3D arrows (top right of panels) point north. Yellow arrow depicts capture and release site off Montauk, NY.
Supplementary Figure 7 | Three-dimensional position estimates for WS-21 in the New York Bight region. Positions are colored by individual shark in (A) (as per Figure 1) and temperature in (B). Bathymetry is presented based on GEBCO data, with the continental shelf break (i.e., 200 m isobath) indicated by a white dotted line and the Hudson Shelf Valley identified by black dashed line. Green 3D arrows (top right of panels) point north. Yellow arrow depicts capture and release site off Montauk, NY.
References
Andrzejaczek, S., Gleiss, A. C., Jordan, L. K. B., Pattiaratchi, C. B., Howey, L. A., Brooks, E. J., et al. (2018). Temperature and the vertical movements of oceanic whitetip sharks, Carcharhinus longimanus. Sci. Rep. 8:8351. doi: 10.1038/s41598-018-26485-3
Bangley, C. W., Curtis, T. H., Secor, D. H., Latour, R. J., and Ogburn, M. B. (2020a). Identifying important juvenile Dusky Shark habitat in the northwest Atlantic Ocean using acoustic telemetry and spatial modeling. Mar. Coast. Fish. 12, 348–363. doi: 10.1002/mcf2.10120
Bangley, C. W., Whoriskey, F. G., Young, J. M., and Ogburn, M. B. (2020b). Networked animal telemetry in the Northwest Atlantic and Caribbean Waters. Mar. Coast. Fish. 12, 339–347. doi: 10.1002/mcf2.10128
Bastien, G., Barkley, A., Chappus, J., Heath, V., Popov, S., Smith, R., et al. (2020). Inconspicuous, recovering, or northward shift: status and management of the white shark (Carcharodon carcharias) in Atlantic Canada. Can. J. Fish. Aquat. Sci. 77, 1666–1677. doi: 10.1139/cjfas-2020-0055
Beck, M. W., Heck, K. L., Able, K. W., Childers, D. L., Eggleston, D. B., Gillanders, B. M., et al. (2001). The identification, conservation, and management of estuarine and marine nurseries for fish and invertebrates: a better understanding of the habitats that serve as nurseries for marine species and the factors that create site-specific variability in nursery quality will improve conservation and management of these areas. Bioscience 51, 633–641. doi: 10.1641/0006-3568(2001)051[0633:ticamo]2.0.co;2
Boldrocchi, G., Kiszka, J., Purkis, S., Storai, T., Zinzula, L., and Burkholder, D. (2017). Distribution, ecology, and status of the white shark, Carcharodon carcharias, in the Mediterranean Sea. Rev. Fish Biol. Fish. 27, 515–534. doi: 10.1007/s11160-017-9470-5
Bowlby, H. D., and Gibson, A. J. F. (2020). Implications of life history uncertainty when evaluating status in the Northwest Atlantic population of white shark (Carcharodon carcharias). Ecol. Evol. 10, 4990–5000. doi: 10.1002/ece3.6252
Boyd, J. D., and Brightsmith, D. J. (2013). Error properties of Argos satellite telemetry locations using least squares and Kalman filtering. PLoS One 8:e63051. doi: 10.1371/journal.pone.0063051
Braun, C. D., Gaube, P., Sinclair-Taylor, T. H., Skomal, G. B., and Thorrold, S. R. (2019). Mesoscale eddies release pelagic sharks from thermal constraints to foraging in the ocean twilight zone. Proc. Natl. Acad. Sci. 116, 17187–17192. doi: 10.1073/pnas.1903067116
Briggs, P. T., and Waldman, J. R. (2002). Annotated list of fishes reported from the marine waters of New York. Northeastern Nat. 9:35.
Bruce, B., Harasti, D., Lee, K., Gallen, C., and Bradford, R. (2019). Broad-scale movements of juvenile white sharks Carcharodon carcharias in eastern Australia from acoustic and satellite telemetry. Mar. Ecol. Prog. Ser. 619, 1–15. doi: 10.3354/meps12969
Bruce, B. D., and Bradford, R. W. (2012). “Habitat use and spatial dynamics of juvenile white sharks, Carcharodon carcharias, in eastern Australia,” in Global Perspectives on the Biology and life History of the White Shark, ed. M. L. Domeier, (Boca Raton, FL: CRC Press), 225–254.
Carey, F. G., Kanwisher, J. W., Brazier, O., Gabrielson, G., Casey, J. G., and Pratt, H. L. Jr. (1982). Temperature and activities of a white shark. Carcharodon carcharias. Copeia 2, 254–260. doi: 10.2307/1444603
Carey, F. G., Scharold, J. V., and Kalmijn, Ad. J (1990). Movements of blue sharks (Prionace glauca) in depth and course. Mar. Biol. 106, 329–342. doi: 10.1007/BF01344309
Cartamil, D., Wegner, N. C., Aalbers, S., Sepulveda, C. A., Baquero, A., and Graham, J. B. (2010). Diel movement patterns and habitat preferences of the common thresher shark (Alopias vulpinus) in the Southern California Bight. Mar. Freshw. Res. 61:596. doi: 10.1071/MF09153
Casey, J. G., and Pratt, H. P. (1985). Distribution of the white shark, Carcharodon carcharias, in the Western North Atlantic. Mem. South. Calif. Acad. Sci. 9, 2–14.
Churchill, J. H., Levine, E. R., Connors, D. N., and Cornillon, P. C. (1993). Mixing of shelf, slope and Gulf Stream water over the continental slope of the Middle Atlantic Bight. Deep Sea Res. I Oceanogr. Res. Pap. 40, 1063–1085. doi: 10.1016/0967-0637(93)90090-p
Coll, M., Santojanni, A., Palomera, I., Tudela, S., and Arneri, E. (2007). An ecosystem model of the Northern and Central Adriatic Sea: analysis of ecosystem structure and fishing impacts. J. Mar. Syst. 67, 119–154. doi: 10.1016/j.jmarsys.2006.10.002
Crear, D. P., Latour, R. J., Friedrichs, M. A., St-Laurent, P., and Weng, K. C. (2020). Sensitivity of a shark nursery habitat to a changing climate. Mar. Ecol. Prog. Ser. 652, 123–136. doi: 10.3354/meps13483
Curtis, T. H., McCandless, C. T., Carlson, J. K., Skomal, G. B., Kohler, N. E., Natanson, L. J., et al. (2014). Seasonal distribution and historic trends in abundance of white sharks, Carcharodon carcharias, in the western North Atlantic Ocean. PLoS One 9:e99240. doi: 10.1371/journal.pone.0099240
Curtis, T. H., Metzger, G., Fischer, C., McBride, B., McCallister, M., Winn, L. J., et al. (2018). First insights into the movements of young-of-the-year white sharks (Carcharodon carcharias) in the western North Atlantic Ocean. Sci. Rep. 8:10794.
Dewar, H., Domeier, M., and Nasby-Lucas, N. (2004). Insights into young of the year white shark, Carcharodon carcharias, behavior in the Southern California Bight. Environ. Biol. Fish. 70, 133–143. doi: 10.1023/b:ebfi.0000029343.54027.6a
Dodge, K. L., Galuardi, B., Miller, T. J., and Lutcavage, M. E. (2014). Leatherback turtle movements, dive behavior, and habitat characteristics in ecoregions of the Northwest Atlantic Ocean. PLoS One 9:e91726. doi: 10.1371/journal.pone.0091726
Dujon, A. M., Lindstrom, R. T., and Hays, G. C. (2014). The accuracy of Fastloc-GPS locations and implications for animal tracking. Methods Ecol. Evol. 5, 1162–1169. doi: 10.1111/2041-210x.12286
Falkowski, P. G., Vidal, J., Hopkins, T. S., Rowe, G. T., Whitledge, T. E., and Harrison, W. G. (1983). Summer nutrient dynamics in the Middle Atlantic Bight: primary production and utilization of phytoplankton carbon. J. Plankton Res. 5, 515–537.
Friedland, K. D., Leaf, R. T., Kane, J., Tommasi, D., Asch, R. G., Rebuck, N., et al. (2015). Spring bloom dynamics and zooplankton biomass response on the US Northeast Continental Shelf. Cont. Shelf Res. 102, 47–61. doi: 10.1016/j.csr.2015.04.005
Gaube, P., Braun, C. D., Lawson, G. L., McGillicuddy, D. J., Della Penna, A., Skomal, G. B., et al. (2018). Mesoscale eddies influence the movements of mature female white sharks in the Gulf Stream and Sargasso Sea. Sci. Rep. 8, 1–8. doi: 10.1016/j.dsr.2017.02.006
General Bathymetric Chart of the Oceans (GEBCO), (2019). Global Ocean & Land Terrain Models. Available online at: https://www.gebco.net/data_and_products/gridded_bathymetry_data/#a1 (accessed December 1, 2020).
Gobler, C., and Sañudo-Wilhelmy, S. (2001). Temporal variability of groundwater seepage and brown tide blooms in a Long Island embayment. Mar. Ecol. Prog. Ser. 217, 299–309. doi: 10.3354/meps217299
Harasti, D., Lee, K., Bruce, B., Gallen, C., and Bradford, R. (2017). Juvenile white sharks Carcharodon carcharias use estuarine environments in south-eastern Australia. Mar. Biol. 164:58.
Hare, J. A., Morrison, W. E., Nelson, M. W., Stachura, M. M., Teeters, E. J., Griffis, R. B., et al. (2016). A vulnerability assessment of fish and invertebrates to climate change on the Northeast US Continental Shelf. PLoS One 11:e0146756. doi: 10.1371/journal.pone.0146756
Heupel, M. R., Carlson, J. K., and Simpiendorfer, C. A. (2007). Shark nursery areas: concepts, definition, characterization and assumptions. Mar. Ecol. Prog. Ser. 337, 287–297. doi: 10.3354/meps337287
Heupel, M. R., Kanno, S., Martins, A. P. B., and Simpfendorfer, C. A. (2018). Advances in understanding the roles and benefits of nursery areas for elasmobranch populations. Mar. Freshw. Res. 70, 897–907. doi: 10.1071/MF18081
Hossler, K., and Bauer, J. E. (2013). Amounts, isotopic character, and ages of organic and inorganic carbon exported from rivers to ocean margins: 1. Estimates of terrestrial losses and inputs to the Middle Atlantic Bight. Glob. Biogeochem. Cycles 27, 331–346. doi: 10.1002/gbc.20033
Houghton, R. W., Schlitz, R., Beardsley, R. C., Butman, B., and Chamberlin, J. L. (1982). The Middle Atlantic Bight cold pool: evolution of the temperature structure during summer 1979. J. Phys. Oceanogr. 12, 1019–1029. doi: 10.1175/1520-0485(1982)012<1019:tmabcp>2.0.co;2
Huveneers, C., Apps, K., Becerril-García, E. E., Bruce, B., Butcher, P. A., Carlisle, A. B., et al. (2018). Future research directions on the “Elusive” White Shark. Front. Mar. Sci. 5:455. doi: 10.3389/fmars.2018.00455
Kleisner, K. M., Fogarty, M. J., McGee, S., Barnett, A., Fratantoni, P., Greene, J., et al. (2016). The effects of sub-regional climate velocity on the distribution and spatial extent of marine species assemblages. PLoS one 11:e0149220. doi: 10.1371/journal.pone.0149220
Kleisner, K. M., Fogarty, M. J., McGee, S., Hare, J. A., Moret, S., Perretti, C. T., et al. (2017). Marine species distribution shifts on the US Northeast Continental Shelf under continued ocean warming. Prog. Oceanogr. 153, 24–36. doi: 10.1016/j.pocean.2017.04.001
Klimley, A. P., Beavers, S. C., Curtis, T. H., and Jorgensen, S. J. (2002). Movements and swimming behavior of three species of sharks in La Jolla Canyon, California. Environ. Biol. Fish. 63, 117–135. doi: 10.1023/a:1014200301213
Knebel, H. J. (1979). Anomalous topography on the continental shelf around Hudson Canyon. Mar. Geol. 33, 67–75. doi: 10.1016/0025-3227(79)90074-4
Knip, D. M., Heupel, M. R., and Simpfendorfer, C. A. (2010). Sharks in nearshore environments: models, importance, and consequences. Mar. Ecology Prog. Ser. 402, 1–11. doi: 10.3354/meps08498
Knip, D. M., Heupel, M. R., Simpfendorfer, C. A., Tobin, A. J., and Moloney, J. (2011). Ontogenetic shifts in movement and habitat use of juvenile pigeye sharks Carcharhinus amboinensis in a tropical nearshore region. Mar. Ecology Prog. Ser. 425, 233–246. doi: 10.3354/meps09006
Kohler, N. E., and Turner, P. A. (2019). Distributions and movements of atlantic shark species: A 52-year retrospective atlas of mark and recapture data. Mar. Fish. Rev. 81, 1–94. doi: 10.7755/mfr.81.2.1
Latour, R. J., and Gartland, J. (2020). Dynamics of the shark community in the Mid-Atlantic Bight. Mar. Biol. 16:100.
Logan, R. K., Vaudo, J. J., Sousa, L. L., Sampson, M., Wetherbee, B. M., and Shivji, M. S. (2020). Seasonal movements and habitat use of juvenile smooth hammerhead sharks in the western North Atlantic Ocean and significance for management. Front. Mar. Sci. 7:731. doi: 10.3389/fmars.2020.566364
Lyons, K., Jarvis, E. T., Jorgensen, S. J., Weng, K., O’Sullivan, J., Winkler, C., et al. (2013). The degree and result of gillnet fishery interactions with juvenile white sharks in southern California assessed by fisheries-independent and -dependent methods. Fish. Res. 147, 370–380. doi: 10.1016/j.fishres.2013.07.009
Methratta, E. T. (2020). Monitoring fisheries resources at offshore wind farms: BACI vs. BAG designs. ICES J. Mar. Sci. 77, 890–900. doi: 10.1093/icesjms/fsaa026
Murray, K. T., and Orphanides, C. D. (2013). Estimating the risk of loggerhead turtle Caretta caretta bycatch in the US mid-Atlantic using fishery-independent and-dependent data. Mar. Ecol. Prog. Ser. 477, 259–270. doi: 10.3354/meps10173
National Aeronautics and Space Administration (NASA), (2019). Chlorophyll. Available online at: https://earthobservatory.nasa.gov/global-maps/MY1DMM_CHLORA (accessed December 1, 2020).
National Oceanic and Atmospheric Administration (NOAA), (2017a). Atlantic Highly Migratory Species; Essential Fish Habitat. Available online at: https://www.federalregister.gov/documents/2017/09/07/2017-18961/atlantic-highly-migratory-species-essential-fish-habitat (accessed December 1, 2020).
National Oceanic and Atmospheric Administration (NOAA), (2017b). Final Amendment 10 to the 2006 Consolidated Atlantic Highly Migratory Species Fishery Management Plan: Essential Fish Habitat and Environmental Assessment. Available online at: https://www.habitat.noaa.gov/application/efhinventory/docs/a10_hms_efh.pdf#page=419 (accessed December 1, 2020).
National Oceanic and Atmospheric Administration (NOAA), (2018). Ecology of the Northeast US Continental Shelf. Available online at: https://www.nefsc.noaa.gov/ecosys/ecosystem-ecology/fish-squid.html (accessed December 1, 2020).
Onate-Gonzalez, E. C., Sosa-Nishizaki, O., Herska, S. Z., Lowe, C. G., Lyons, K., Santana-Morales, O., et al. (2017). Importance of Bahia Sebastian Vizcaino of a nursery area for white sharks (Carcharodon carcharias) in the Northeastern Pacific: a fishery dependent analysis. Fish. Res. 188, 125–137. doi: 10.1016/j.fishres.2016.12.014
Parsons, G. R., Hoffmayer, E. R., Frank, J., and Bet-Sayed, W. (2008). “A review of shark reproductive ecology: life history and evolutionary implications,” in Fish Reproduction, Edn. 1 Edn, eds M. J. Rocha, A. Aruke, and B. G. Kapoor, (Abingdon: Taylor and Francis), 435–469.
Pierdomenico, M., Gori, A., Guida, V. G., and Gili, J. M. (2017). Megabenthic assemblages at the Hudson Canyon head (NW Atlantic margin): Habitat-faunal relationships. Prog. Oceanogr. 157, 12–26. doi: 10.1016/j.pocean.2017.08.001
Pierdomenico, M., Guida, V. G., Macelloni, L., Chiocci, F. L., Rona, P. A., Scranton, M. I., et al. (2015). Sedimentary facies, geomorphic features and habitat distribution at the Hudson Canyon head from AUV multibeam data. Deep Sea Res. II Top. Stud. Oceanogr. 121, 112–125. doi: 10.1016/j.dsr2.2015.04.016
Queiroz, N., Humphries, N. E., Couto, A., Vedor, M., da Costa, I., Sequeira, A. M. M., et al. (2019). Global spatial risk assessment of sharks under the footprint of fisheries. Nature 572, 461–466. doi: 10.1038/s41586-019-1444-4
Rogers, K. B., and White, G. C. (2007). “Analysis of movement and habitat use from telemetry data,” in Analysis and Interpretation of Freshwater Fisheries Data, eds C. S. Guy and M. L. Brown, (Bethesda, MA: American Fisheries Society), 625–676.
Rona, P., Guida, V., Scranton, M., Gong, D., Macelloni, L., Pierdomenico, M., et al. (2015). Hudson submarine canyon head offshore New York and New Jersey: a physical and geochemical investigation. Deep Sea Res. II Top. Stud. Oceanogr. 121, 213–232. doi: 10.1016/j.dsr2.2015.07.019
Saba, V. S., Griffies, S. M., Winton, M., Anderson, W., Alexander, M. A., Hare, J. A., et al. (2016). Enhanced warming of the US Northeast Continental Shelf under climate change: implications for fisheries. AGUOS 2016: PC14B–2067.
Santana-Morales, O., Sosa-Nishizaki, O., Escobedo-Olvera, M. A., Onate-González, E. C., O’Sullivan, J. B., and Cartamil, D. (2012). “Incidental catch and ecological observations of juvenile white sharks, Carcharodon carcharias, in western Baja California, Mexico. Conservation implications,” in Global Perspectives on the Biology and Life History of the White Shark, ed. M. L. Domeier, (New York, NY: CRC Press), 187–198.
Simpfendorfer, C. A., Freitas, G. G., Wiley, T. R., and Heupel, M. R. (2005). Distribution and habitat partitioning of immature bull sharks (Carcharhinus leucas) in a southwest Florida estuary. Estuaries 28, 78–85. doi: 10.1007/bf02732755
Simpfendorfer, C. A., Hueter, R. E., Bergman, U., and Connett, S. M. (2002). Results of a fishery-independent survey for pelagic sharks in the western North Atlantic, 1977–1994. Fish. Res. 55, 175–192. doi: 10.1016/s0165-7836(01)00288-0
Skomal, G. B., Braun, C. D., Chisholm, J. H., and Thorrold, S. R. (2017). Movement of the white shark Carcharodon carcharias in the North Atlantic Ocean. Mar. Ecol. Prog. Ser. 580, 1–16. doi: 10.3354/meps12306
Spaet, J. L., Patterson, T. A., Bradford, R. W., and Butcher, P. A. (2020). Spatiotemporal distribution patterns of immature Australasian white sharks (Carcharodon carcharias). Sci. Rep. 10, 1–13.
Stepanuk, J. E., Read, A. J., Baird, R. W., Webster, D. L., and Thorne, L. H. (2018). Spatiotemporal patterns of overlap between short-finned pilot whales and the US pelagic longline fishery in the Mid-Atlantic Bight: An assessment to inform the management of fisheries bycatch. Fish. Res. 208, 309–320. doi: 10.1016/j.fishres.2018.07.008
Trujillo, A. P., and Thurman, H. V. (2016). “Biological productivity and energy transfer,” in Essentials of Oceanography: Twelfth Edition, (Boston, MA: Pearson), 403–441.
Wall, J. (2014). Movement Ecology Tools for ArcGIS (ArcMET). Available online at: http://www.movementecology.net/arcmet_manual.html (accessed December 1, 2020).
Watanabe, Y. Y., Payne, N. L., Semmens, J. M., Fox, A., and Huveneers, C. (2019). Swimming strategies and energetics of endothermic white sharks during foraging. J. Exp. Biol. 222:jeb185603. doi: 10.1242/jeb.185603
Weng, K. C., O’Sullivan, J. B., Lowe, C. G., Winker, C. E., Blasius, M. E., Loke-Smith, K. A., et al. (2012). “Back to the Wild: release of juvenile white sharks from the Monterey Bay Aquarium,” in Global Perspectives on the Biology and Life History of the White Shark, ed. M. L. Domeier, (Boca Raton, FL: CRC Press), 419–446.
Weng, K. C., O’Sullivan, J. B., Lowe, C. G., Winkler, C. E., Dewar, H., and Block, B. A. (2007). Movements, behavior and habitat preferences of juvenile white sharks Carcharodon carcharias in the eastern Pacific. Mar. Ecol. Prog. Ser. 338, 211–224. doi: 10.3354/meps338211
Wetherbee, B., Gruber, S., and Rosa, R. (2007). Movement patterns of juvenile lemon sharks Negaprion brevirostris within Atol das Rocas, Brazil: a nursery characterized by tidal extremes. Mar. Ecol. Prog. Ser. 343, 283–293. doi: 10.3354/meps06920
White, C. F., Lyons, K., Jorgensen, S. J., O’Sullivan, J., Winkler, C., Weng, K. C., et al. (2019). Quantifying habitat selection and variability in habitat suitability for juvenile white sharks. PLoS One 14:e0214642. doi: 10.1371/journal.pone
Keywords: white shark (Carcharodon carcharias), Atlantic Ocean (North), New York Bight, telemetry, habitat use, diving behavior
Citation: Shaw RL, Curtis TH, Metzger G, McCallister MP, Newton A, Fischer GC and Ajemian MJ (2021) Three-Dimensional Movements and Habitat Selection of Young White Sharks (Carcharodon carcharias) Across a Temperate Continental Shelf Ecosystem. Front. Mar. Sci. 8:643831. doi: 10.3389/fmars.2021.643831
Received: 18 December 2020; Accepted: 05 February 2021;
Published: 22 March 2021.
Edited by:
David Wells, Texas A&M University at Galveston, United StatesReviewed by:
Daniel M. Coffey, Texas A&M University Corpus Christi, United StatesSamantha Andrzejaczek, Stanford University, United States
Copyright © 2021 Shaw, Curtis, Metzger, McCallister, Newton, Fischer and Ajemian. This is an open-access article distributed under the terms of the Creative Commons Attribution License (CC BY). The use, distribution or reproduction in other forums is permitted, provided the original author(s) and the copyright owner(s) are credited and that the original publication in this journal is cited, in accordance with accepted academic practice. No use, distribution or reproduction is permitted which does not comply with these terms.
*Correspondence: Matthew J. Ajemian, bWFqZW1pYW5AZmF1LmVkdQ==