 James M. Anderson1*
 Echelle S. Burns2,3,4
 Emily N. Meese5
 Thomas J. Farrugia1,6
 Brian S. Stirling1
 Connor F. White7
 Ryan K. Logan8John O’Sullivan9
 Chuck Winkler10
 Christopher G. Lowe1
- 1Department of Biological Sciences, California State University, Long Beach, CA, United States
- 2Marine Science Institute, University of California, Santa Barbara, Santa Barbara, CA, United States
- 3Bren School of Environmental Science & Management, University of California, Santa Barbara, Santa Barbara CA, United States
- 4Environmental Market Solutions Lab, University of California, Santa Barbara, Santa Barbara, CA, United States
- 5Department of Marine Biology, Texas A&M University at Galveston, Galveston, TX, United States
- 6Alaska Ocean Observing System, Anchorage, AK, United States
- 7Department of Organismic and Evolutionary Biology, Harvard University, Cambridge, MA, United States
- 8Guy Harvey Research Institute, Nova Southeastern University, Dania Beach, FL, United States
- 9Monterey Bay Aquarium, Monterey, CA, United States
- 10Aquatic Research Consultants, San Pedro, CA, United States
Young-of-the-year (YOY) and juvenile-stage white sharks may use southern California nearshore beach habitats more extensively than previously known, within meters of some of the most heavily used beaches in the world. Such knowledge forms a critical component of species management and conservation plans, in addition to public safety and risk mitigation planning. We used data derived from a combination of satellite tag locations (13 animals over 3 years) and passive acoustic monitoring (34 animals over 8 years) to examine the occurrence, relative abundance, and residency patterns of YOY white sharks in southern California waters. Our results suggest that southern California contains spatiotemporally dynamic centers of primary nursery habitat. Tagged YOY white sharks formed loose aggregations at “hotspot” locations that were interannually variable, where individuals exhibited temporal fidelity, higher levels of residency, and spatially restricted movements, with multiple YOY individuals simultaneously displaying this behavior. While models of biotic and abiotic variables suggested relative abundance of tagged sharks may be predicted by sea surface temperature, salinity and productivity (chlorophyll-A), these predictors were not consistent across all years of the study. Thus, novel approaches that incorporate technologies to derive high resolution environmental data, paired with more comprehensive telemetry datasets are therefore required to better understand the extrinsic factors that drive habitat selection and residency patterns in juvenile white sharks.
Introduction
Many coastal shark species are known to select nearshore habitats (e.g., bays, lagoons, and estuaries) during early life stages with neonates and young-of-the-year (YOY) exhibiting reduced space use within these areas (Heupel et al., 2004, 2007; Hueter et al., 2005; Speed et al., 2010; Oh et al., 2017). In some cases, pregnant females give birth in these habitats, while other species may give birth elsewhere and YOY individuals find their way into these areas (Chapman et al., 2015). These protected, shallow, nearshore habitats are thought to offer protection from predation, enhanced prey availability, and typically warm temperatures to allow for faster growth and higher survivorship (Heupel et al., 2004; Hueter et al., 2005; Speed et al., 2012). For most temperate and subtropical species, parturition is seasonal, usually associated with periods of increased temperature, daylength, and primary productivity. Some oceanic species [e.g., shortfin mako (Isurus oxyrinchus), salmon sharks (Lamna ditropis), and blue sharks (Prionace glauca)] are known to use less discrete areas as nursery habitats in open water, that are selected for their warmer conditions and higher productivity (Bustamante and Bennett, 2013; Carlisle et al., 2015; Logan et al., 2020). Neonates and YOYs of oceanic species are considered to be more wide ranging, and their distributions may be more vertically limited compared to adults (Afonso and Hazin, 2015; Carlisle et al., 2015; Hoyos-Padilla et al., 2016; Vandeperre et al., 2016; Coffey et al., 2017). However, while white sharks exhibit an offshore, oceanic phase as adults, YOY individuals [<175 cm total length (TL)] are predominantly found in coastal habitats, which suggests that although birthing in white sharks has not been observed and parturition habitats are unknown, parturition may occur proximally to the nearshore environment (Dewar et al., 2004; Weng et al., 2007a,b; Jorgensen et al., 2012; Domeier and Nasby-Lucas, 2013; Lyons et al., 2013; Harasti et al., 2017; Curtis et al., 2018; Logan et al., 2018; Bruce et al., 2019; White et al., 2019; Bradford et al., 2020; Spaet et al., 2020b).
The Southern California Bight (SCB) extends from Point Conception, CA, United States (34.4° N) to Cabo Banda, Baja California, MX, United States (31.7° N) (Schiff et al., 2016), encompassing a coastline that stretches approximately 560 km. Fisheries catch records of juvenile white sharks (123–300 cm TL) in the SCB suggest this area (Klimley, 1985; Domeier, 2012; Lowe et al., 2012) and Baja, Mexico (Santana-Morales et al., 2012; Oñate-González et al., 2017) serves as a nursery for the Northeast Pacific population. Catch locations of juvenile white sharks in southern California typically occurred less than 20 km from shore and in water depths less than 100 m, and seem to be aggregated at particular locations along the coastline (Lowe et al., 2012; Lyons et al., 2013). While capture locations were fishery dependent, most individuals were captured as bycatch in fisheries targeting nearshore fishes such as California halibut (Paralichthys californicus) and white seabass (Atractoscion nobilis), species typically associated with sand substratum or ecotone to rocky reefs. YOY white sharks previously fitted with satellite transmitters in southern California have been shown to remain in southern California waters during summer months, but exhibit southerly migrations to the coastal waters of Baja, Mexico during winter months (Weng et al., 2012; White et al., 2019). Estimated daily positions and tracks from juvenile white sharks tagged with pop-up archival tags (PAT tags) indicate individuals spent substantial time in offshore areas (Weng et al., 2007b). This apparent westward distribution of sharks from the coast is likely attributed to the poor spatial resolution of this technology (Dewar et al., 2004; Weng et al., 2012). Conversely, Smart Position Or Temperature Transmitter (SPOT) tagged YOY and juvenile white sharks have consistently displayed nearshore habitat use (Lyons et al., 2013; Weng et al., 2007b; White et al., 2019; Spaet et al., 2020b).
In addition to historic fishery catch location data and SPOT tag geo-position data, there has been considerable anecdotal visual observations of YOY and juvenile white sharks using beach habitat (<200 m from the shoreline) throughout southern California (Lowe et al., unpublished data). These observations are in contrast to the resolution of SPOT tags, which showed tagged individuals displaying surface-oriented behaviors within approximately 7 km of the shore (White et al., 2019) and suggest juvenile and YOY white sharks may use nearshore beach habitats (<200 m from the shoreline) more extensively than previously documented. Such actualities are likely to be an important consideration in management and conservation initiatives for the species, at both the state and federal level. For example, while white shark capture is prohibited in California fisheries, YOY white shark mortality may be increased via bycatch in shore-based recreational fisheries (Benson et al., 2018), potentially inhibiting recovery for this protected species. Additionally, contaminant exposure may be increased for this important age class of white sharks if they are spending considerable time in waters with high amounts of runoff from the densely populated southern California coastline (Lyons and Wynne-Edwards, 2021), with potential long-term ramifications to the population. To address the question of nearshore habitat use, we employed a large, nearshore passive acoustic receiver array, spanning the southern California coastline and offshore islands to quantify interannual distribution and shifts in nearshore beach habitat use of YOY white sharks fitted with coded acoustic transmitters, and examined the extent of pelagic and non-acoustically monitored habitat via YOY white sharks fitted with SPOT tags.
Materials and Methods
Study Location and Monitoring Area
The area acoustically monitored spanned from Santa Barbara County to San Diego County, with additional acoustic receivers around the northern Channel Islands and Santa Catalina Island (Figure 1). For the purposes of these analyses, the southern California coastline was considered as the area between Point Conception (34.442° N, 120.453° W) and San Diego (32.751° N, 117.161° W). Acoustic receiver coverage increased in southern California over the study period (2010–2018; Table 1).
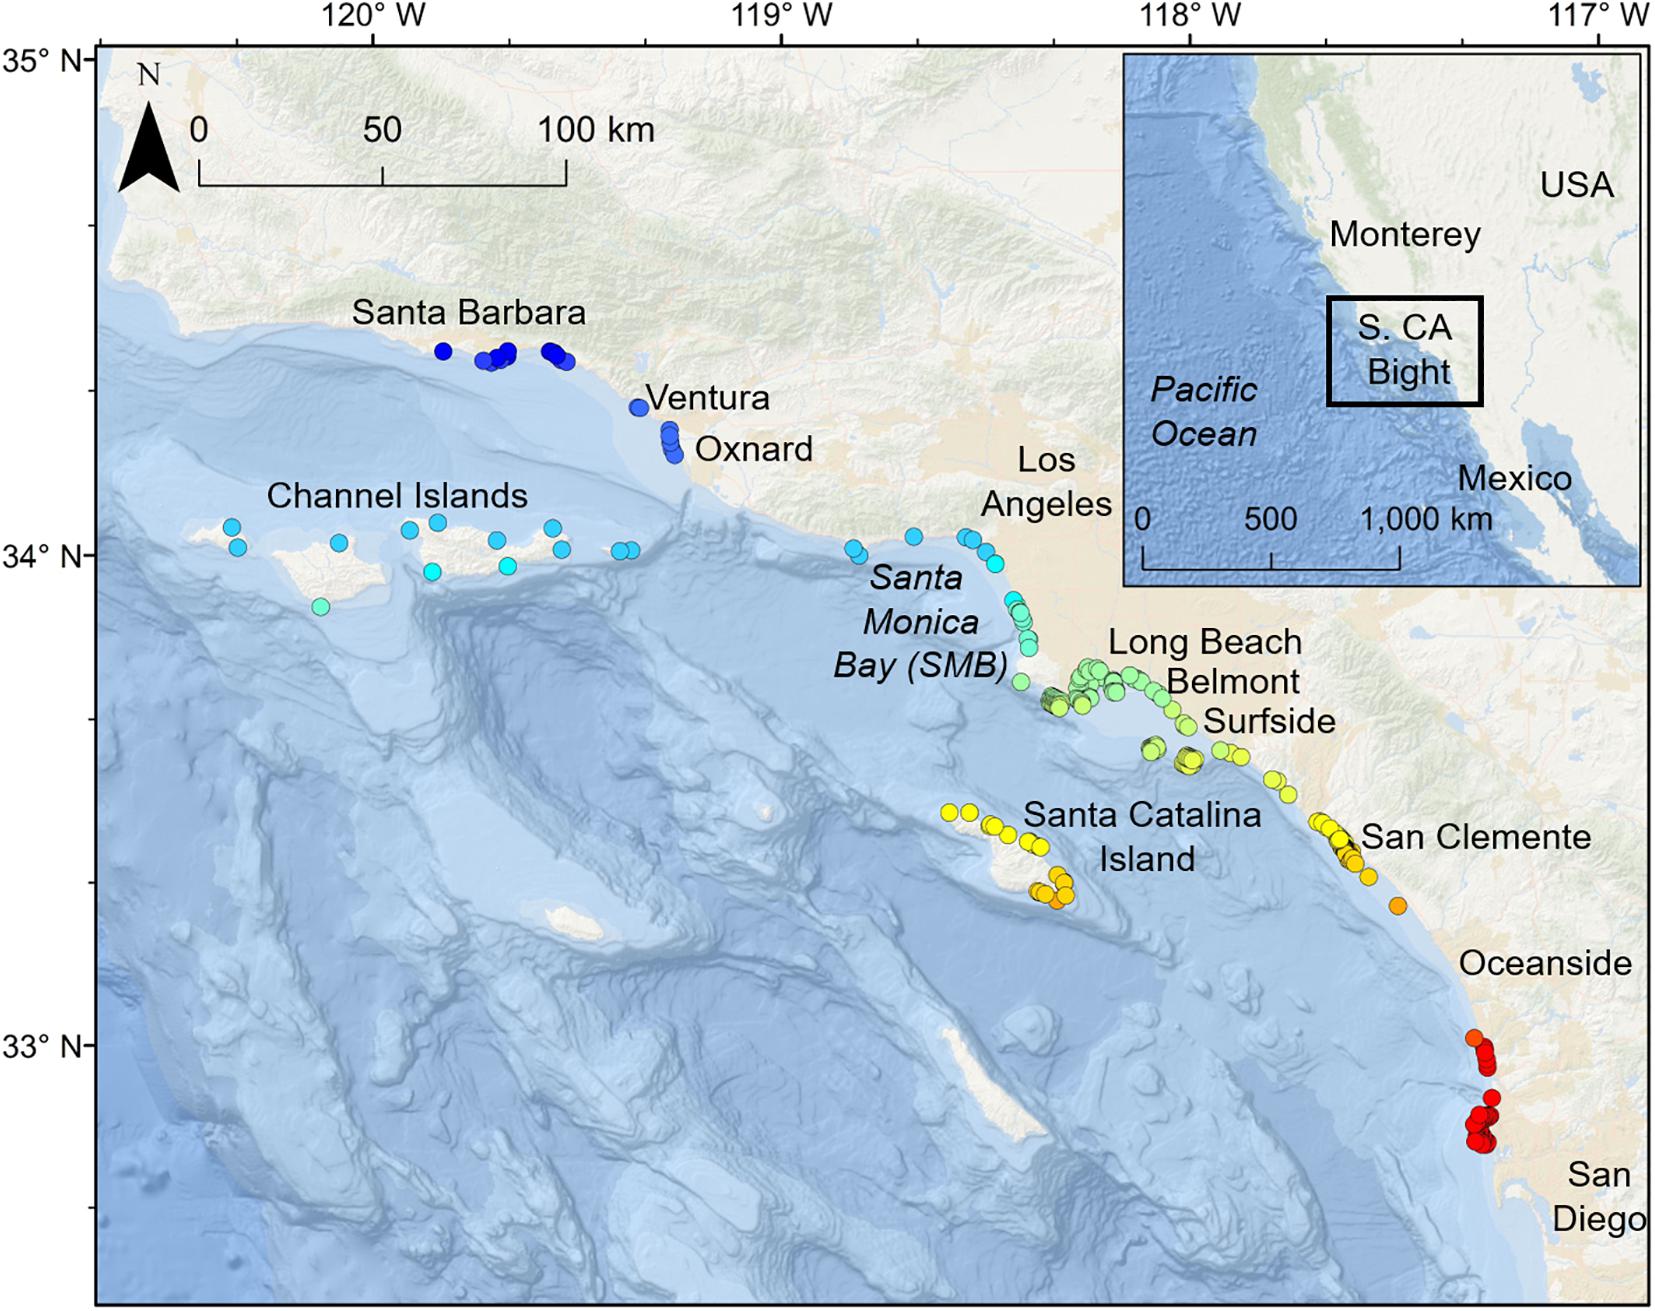
Figure 1. Study area and locations of all receivers used in the study (2014–2018). Receiver locations are color coded according to latitude.
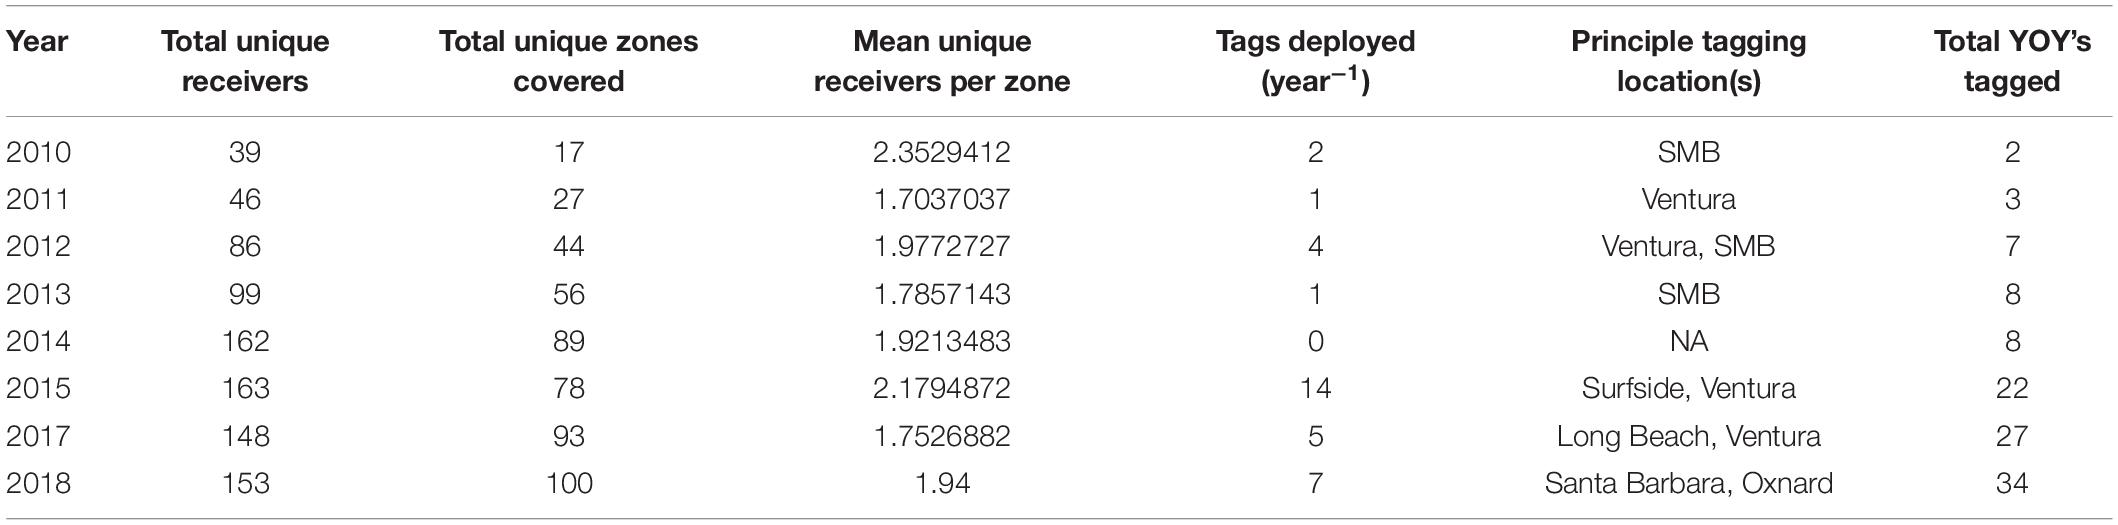
Table 1. Receiver and tag deployment details across all years included in the study.
Tag Models and Procedures
Acoustic Tags
A total of 44 YOY white sharks were tagged with coded acoustic transmitters between January 2010 and December 2018. Sharks were tagged with Vemco V16 or V13 coded acoustic transmitters (Vemco|Innovasea, NS, Canada; transmitter family V13-1x-069k, V13-2x-069k, V16-4x-069k, V16-5x-069k, and V16-6x-069k) via one of three ways.
(i) Incidental catch: In collaboration with local commercial gillnet fishers, incidentally captured YOY white sharks were brought to the nearest port in a large fish tote (1.2 × 1.2 × 1.2 m) with flowing seawater. Researchers met fishers to physically assess, measure, and surgically implant a plasma-sterilized V16 transmitter into the shark into the abdominal cavity of the shark through a small incision (5 cm). The wound was closed with 2–3 interrupted sutures. Tagged YOY white sharks were then transported approximately 2 km offshore and released. Approximate elapsed times from researchers taking possession of the shark to offshore release were <30 min.
(ii) Targeted catch: YOY white sharks were caught in shallow inshore waters either via a purse-seine, or via targeted quick-extraction with a gillnet. Once restrained by the net, YOY sharks were transferred to a custom-made staging tank and ventilated, before being sexed, sized, and outfitted with a surgically implanted V16 transmitter as described in (i). Approximate handling times in all instances were <20 min.
(iii) Dart tagging: YOY white sharks swimming close to, or at the surface (at least 2 m visibility) were approached by either a small boat or jet-ski from behind, with the aim of minimizing stress and flight response from the targeted animal. When possible, sex of individual was determined using a pole-mounted dip camera. As physical measurement of animals was not possible via this tagging method, shark size (TL, cm) was estimated by comparison to an object of known size (the watercraft) from orthogonal aerial drone footage. Comparative methods such these have been shown to produce valid estimates of size (May et al., 2019). YOY sharks were tagged with either a V13 or V16 using a 3 m long pole, or with a modified pole-spear fitted with a tag applicator. Tags were inserted into the dorsal musculature at the base of the first dorsal fin using a titanium dart tethered to the tag. Approximate time from first sighting of an animal to tag deployment was <5 min. Minimum expected tag-retention for transmitters deployed in this manner was 1 year (Lowe et al., unpublished data).
Satellite Tags
Thirteen YOY white sharks caught via incidental or targeted efforts (see above), tagged between 2006 and 2009, were outfitted with SPOT tags (position only), mounted to the dorsal fin (mini SPOT 5AM-S182C and AM-S183E; Wildlife Computers, WA, United States) to allow real-time monitoring of tagged sharks’ geographic position whenever the tag was able to transmit a signal to the ARGOS satellite network. These data were included to facilitate analysis of YOY movement and habitat use patterns when not in acoustically monitored locations.
All capture and tagging procedures were carried out in accordance with State and Federal permits. All experimental protocols were approved under CSULB IACUC protocol #364.
Data Analysis
To spatially examine tagged shark occurrence, relative abundance and residency patterns at monitored locations, a fishnet shapefile with a grid size of 0.01 by 0.01 degrees (generating grid cells approximately 1.2 km2 in area), including all monitored nearshore and offshore locations in southern California was generated in ArcMap (version 10.5.1). Each grid cell was assigned a zone ID (hereby “zone”) value which allowed for the direct comparison of shark presence both within and across monitored areas due to heterogeneous distribution and density of receivers throughout the study area.
Satellite Data
A total of 997 ARGOS locations were obtained from the 13 deployed SPOT tags. To minimize uncertainty in the location estimates, ARGOS locations were filtered to include only location quality classes 1, 2, and 3, which have estimated errors of less than 1500 m (Costa et al., 2010). As we were only interested in the geographic location of position estimates derived from SPOT tags, and the proximity of these location estimates to nearshore habitat, as well as acoustically monitored zones, we did not attempt to interpolate movement paths (tracks) of SPOT tagged YOY white sharks (e.g., through Hidden Markov or State-Space models). SPOT locations were also limited (filtered) to southern California, and locations from the same shark that were less than 1 min apart were removed, resulting in 337 high quality locations. Bathymetric maps from NOAA were used to extract underlying depth at each SPOT location using the “marmap” package in R (Pante et al., 2019). A shapefile of shore types from the California Department of Fish and Wildlife was used to determine the distance from shore and the nearest shore habitat type (beach, hardened shore, or rocky shore) associated with each location using the “rgeos” package in R. Additionally, SPOT locations were aggregated by grid cell zones described above. All analyses of the satellite tag data were carried out in R (version 3.6.0).
Acoustic Monitoring
We determined seasonal and annual occurrence, relative abundance, and residency patterns of tagged YOY white sharks in nearshore southern California waters and associated offshore islands using passive acoustic telemetry for all tagged sharks detected between January 1, 2010 and December 31, 2018. Acoustic detection data were acquired from a wide-spread acoustic receiver array (up to 75 receivers) comprised of Vemco VR2 and VR2W receivers, deployed between Goleta/Santa Barbara and San Diego, spanning a linear distance of 450 km (Figure 1), but also included offshore island monitoring sites. From north to south, these included locations proximal to the following locations/landmarks: Santa Barbara, Ventura, and Offshore Islands [San Miguel, Santa Rosa, Santa Cruz, Anacapa (collectively referred to as CINMS hereafter), and Santa Catalina Island), Santa Monica Bay (SMB), Long Beach – Huntington Beach (LB-HB), Newport Beach – Laguna (NBL), Dana Point – San Clemente (DP-SC), Oceanside, and San Diego (Figure 1). Receivers were largely installed and maintained by CSULB, but also included receivers of collaborators [University of California San Diego (UCSD), Channel Islands National Marine Sanctuary (CINMS)].
Acoustic receivers were deployed in shallow (∼ 3–40 m depth) coastal waters within 1000 m of the shoreline (50% within 400 m), across a range of environments, including calm protected habitats (e.g., embayments and harbors), exposed high energy sand substrata (beach habitat), and both rocky reef and kelp forest habitats. Receiver detection range varied by site and habitat. Based on the acoustic transmitter and types used, and empirical testing of receiver performance (Stirling et al., unpublished data), a nominal detection range of 500 m was estimated for all receivers in the array.
As receivers used in this study were deployed for other projects (e.g., Wolfe and Lowe, 2015; Logan and Lowe, 2018; Burns et al., 2019; Clevenstine and Lowe, 2021) and there was increased effort in tagging effort over time, receiver deployments varied by location and number over the course of this study, with a general increase in the total number deployed over the study period (Table 1).
Acoustic Data Acquisition and Processing
For tagged shark relative abundance and residency, raw receiver data were filtered to include only individuals that were detected more than two times per day, per zone. While it was not possible to precisely determine the age of tagged sharks, we were only interested in the presence or absence of YOY (<175 cm TL) sharks. Thus, detection data were filtered to only include detections of YOY sharks within 365 days of individual tagging dates (i.e., sharks detected >365 days from tagging were no longer YOYs).
Tagged Shark Relative Abundance
To standardize shark relative abundance metrics, relative abundance (shark density) was calculated as the number of unique tagged sharks that were detected in each zone each day, and receiver density was calculated as the number of receivers deployed in a particular zone each day.
From this dataset, several Generalized Additive Models (GAMs) were run using the “mgcv” package (Wood, 2011) in R to examine the relationship of shark relative abundance patterns to biotic and abiotic variables. Information pertaining to acquisition of environmental data used is supplied as Supplementary Material. Models were run separately for each year, as opposed to running a single large model with year interactions, to ensure that the models had a reasonable number of predictors to achieve most accurate interpretation of model results. All models were run using a Poisson family distribution and a log-link function.
For each model, tagged shark relative abundance was the response variable. Predictor variables included zone (categorical), receiver density (numeric), season (categorical; where December to February were considered Winter, March to May were considered Spring, June to August were considered Summer, and September to November were considered Fall), sea surface temperature (smoothed, numeric in °C), depth gradient (numeric in meters), sea surface salinity (smoothed, numeric in psu), and chlorophyll-A (smoothed, numeric in mg/m3). Sea surface temperature, sea surface salinity and chlorophyll-A were allowed to vary nonlinearly within the GAMs (with 10 maximum nodes to prevent overfitting), due to the seasonality of each predictor. A total of five models were run per year:
(1) Relative abundance ∼ zone + receiver density + season + s(temperature) + depth gradient + s(sea surface salinity) + s(chlorophyll-A)
(2) Relative abundance ∼ zone + receiver density + season + s(temperature)
(3) Relative abundance ∼ zone + receiver density + season + depth gradient
(4) Relative abundance ∼ zone + receiver density + season + s(sea surface salinity)
(5) Relative abundance ∼ zone + receiver density + season + s(chlorophyll-A).
Variables were assessed for covariance and models 2–5 were run to ensure that no single environmental predictor was driving significant results. After models were run, results were checked using gam.check() to ensure that the models met the assumptions required of GAMs, and that models did not overfit or underfit the data. Visual assessment of the GAM results was also used to ensure overfitting did not occur.
Shark Residency
A Residency Index (RI) with values ranging from 0 (no residency) to 1 (high residency), was used to examine individual shark presence within each zone following the method from Kessel et al. (2014):
Where, RI, Residence Index; S, distinct number of days detected in the zone; T, distinct number of days detected in any zone, within 365 days from individual tagging date.
Following Kessel et al. (2014) animals with less than 20 residence events (residence event considered to be any day a shark was present in a zone) across the entire array in any given year were excluded from the analyses. This approach allows for a degree of standardization where detection days (days where a shark can feasibly be detected) and monitoring days (days a transmitter can be “listened” for) are variable across a study population and array, respectively. Following Oh et al. (2017), individual sharks with RI values <6% were considered non-resident in that zone, while individual sharks with RI values >6% were considered to display resident behaviors within that zone.
Generalized Linear Mixed Models (GLMMs) were used [“lme4” package in R (Bates et al., 2011)] to examine drivers of YOY white shark resident behaviors. GLMMs were chosen because a nonlinear relationship was not expected, and to include both fixed and random factors under a Gaussian distribution. RI values of individual sharks at each zone were modeled as the response variable, and AICc was used to assess the best fitting model. Fixed effects included mean zone depth (calculated using the “marmap” package in R), total length (categorical), the distance from tagging site to the zone, and region. Random effects included tagging year, and shark ID. p-Values of fixed effects were obtained using the Anova function in the “car” package in R, with Type II Wald Chi-square tests (Kuznetsova et al., 2017; Fox and Weisberg, 2019). To calculate the deviance explained for each random effect, we used the following equation: [(variation of random effect)/(variation of random effect + total residual variation of the model)] (Bates et al., 2014).
Activity Space Estimation at Residency Hot Spots
Due to the linear expanse over which the receiver array was spread (linear distance ∼ 450 km), the variability of receiver coverage across zones, and the variability in receiver distribution and density, common approaches to analyzing space use (such as Minimum Convex Polygons and Kernel Utilization Distribution models) are likely to yield over-estimated areas of core space use (Silva et al., 2018).
To estimate core activity space of sharks at nearshore residency hotspots, we used receiver detection data to calculate centers of activity (COA) (Simpfendorfer et al., 2002), via the COA function from the Animal Tracking Toolbox (ATT) in the “VTrack” package (Udyawer et al., 2018) in R for all tagged sharks that were resident in a zone, for each individual year of the study. Position estimates weighted by the number of detections within the residency hotspot location within a 12-h time frame were calculated for each individual shark. Sharks with less than 5 relocations (COA locations) were not included in the analyses.
Core (50%) activity spaces for YOY white sharks were calculated within VTrack (both individually and pooled) using Brownian Bridge Kernel Utilization Distributions (BBKUD). COA estimation prior to kernel probability distribution allows spatial biases that are inherent in passive acoustic telemetry derived from fixed receiver stations to be accounted for Udyawer et al. (2018). BBKUD estimation was used as it incorporates estimated rates of movement of tagged animals (analogous to the smoother sig1 in the “ADEHabitat” R package). Thus, variation in movement patterns and behavior within an array are accounted for with a flexible, rather than fixed approach, ultimately aimed at reducing Type I and Type II errors. Imprecision of locations (h) was set at 200 m as a conservative estimate of potential COA location error.
Results
Satellite Data
Smart Position Or Temperature Transmitter tag track durations ranged from 10 to 142 days (median = 48 days, mean = 65 days, SD = 48 days), with SPOT tags providing locations on 2–47 of those days (median = 13, mean = 18 days, SD = 16 days). YOY white sharks fitted with SPOT tags yielded ARGOS locations in 287 individual zones. Forty-three zones had two or more ARGOS locations, 27 of which were locations for the same sharks, and 16 of which had locations from two sharks. Broadly, SPOT tag locations showed similar spatial distributions to that seen from the acoustic data, such as a high density of locations surrounding SMB and nearshore areas in southern California. Additionally, SPOT tag locations were also recorded in nearshore areas not monitored by the acoustic receiver array, as well as areas further from the shore (Figure 2).
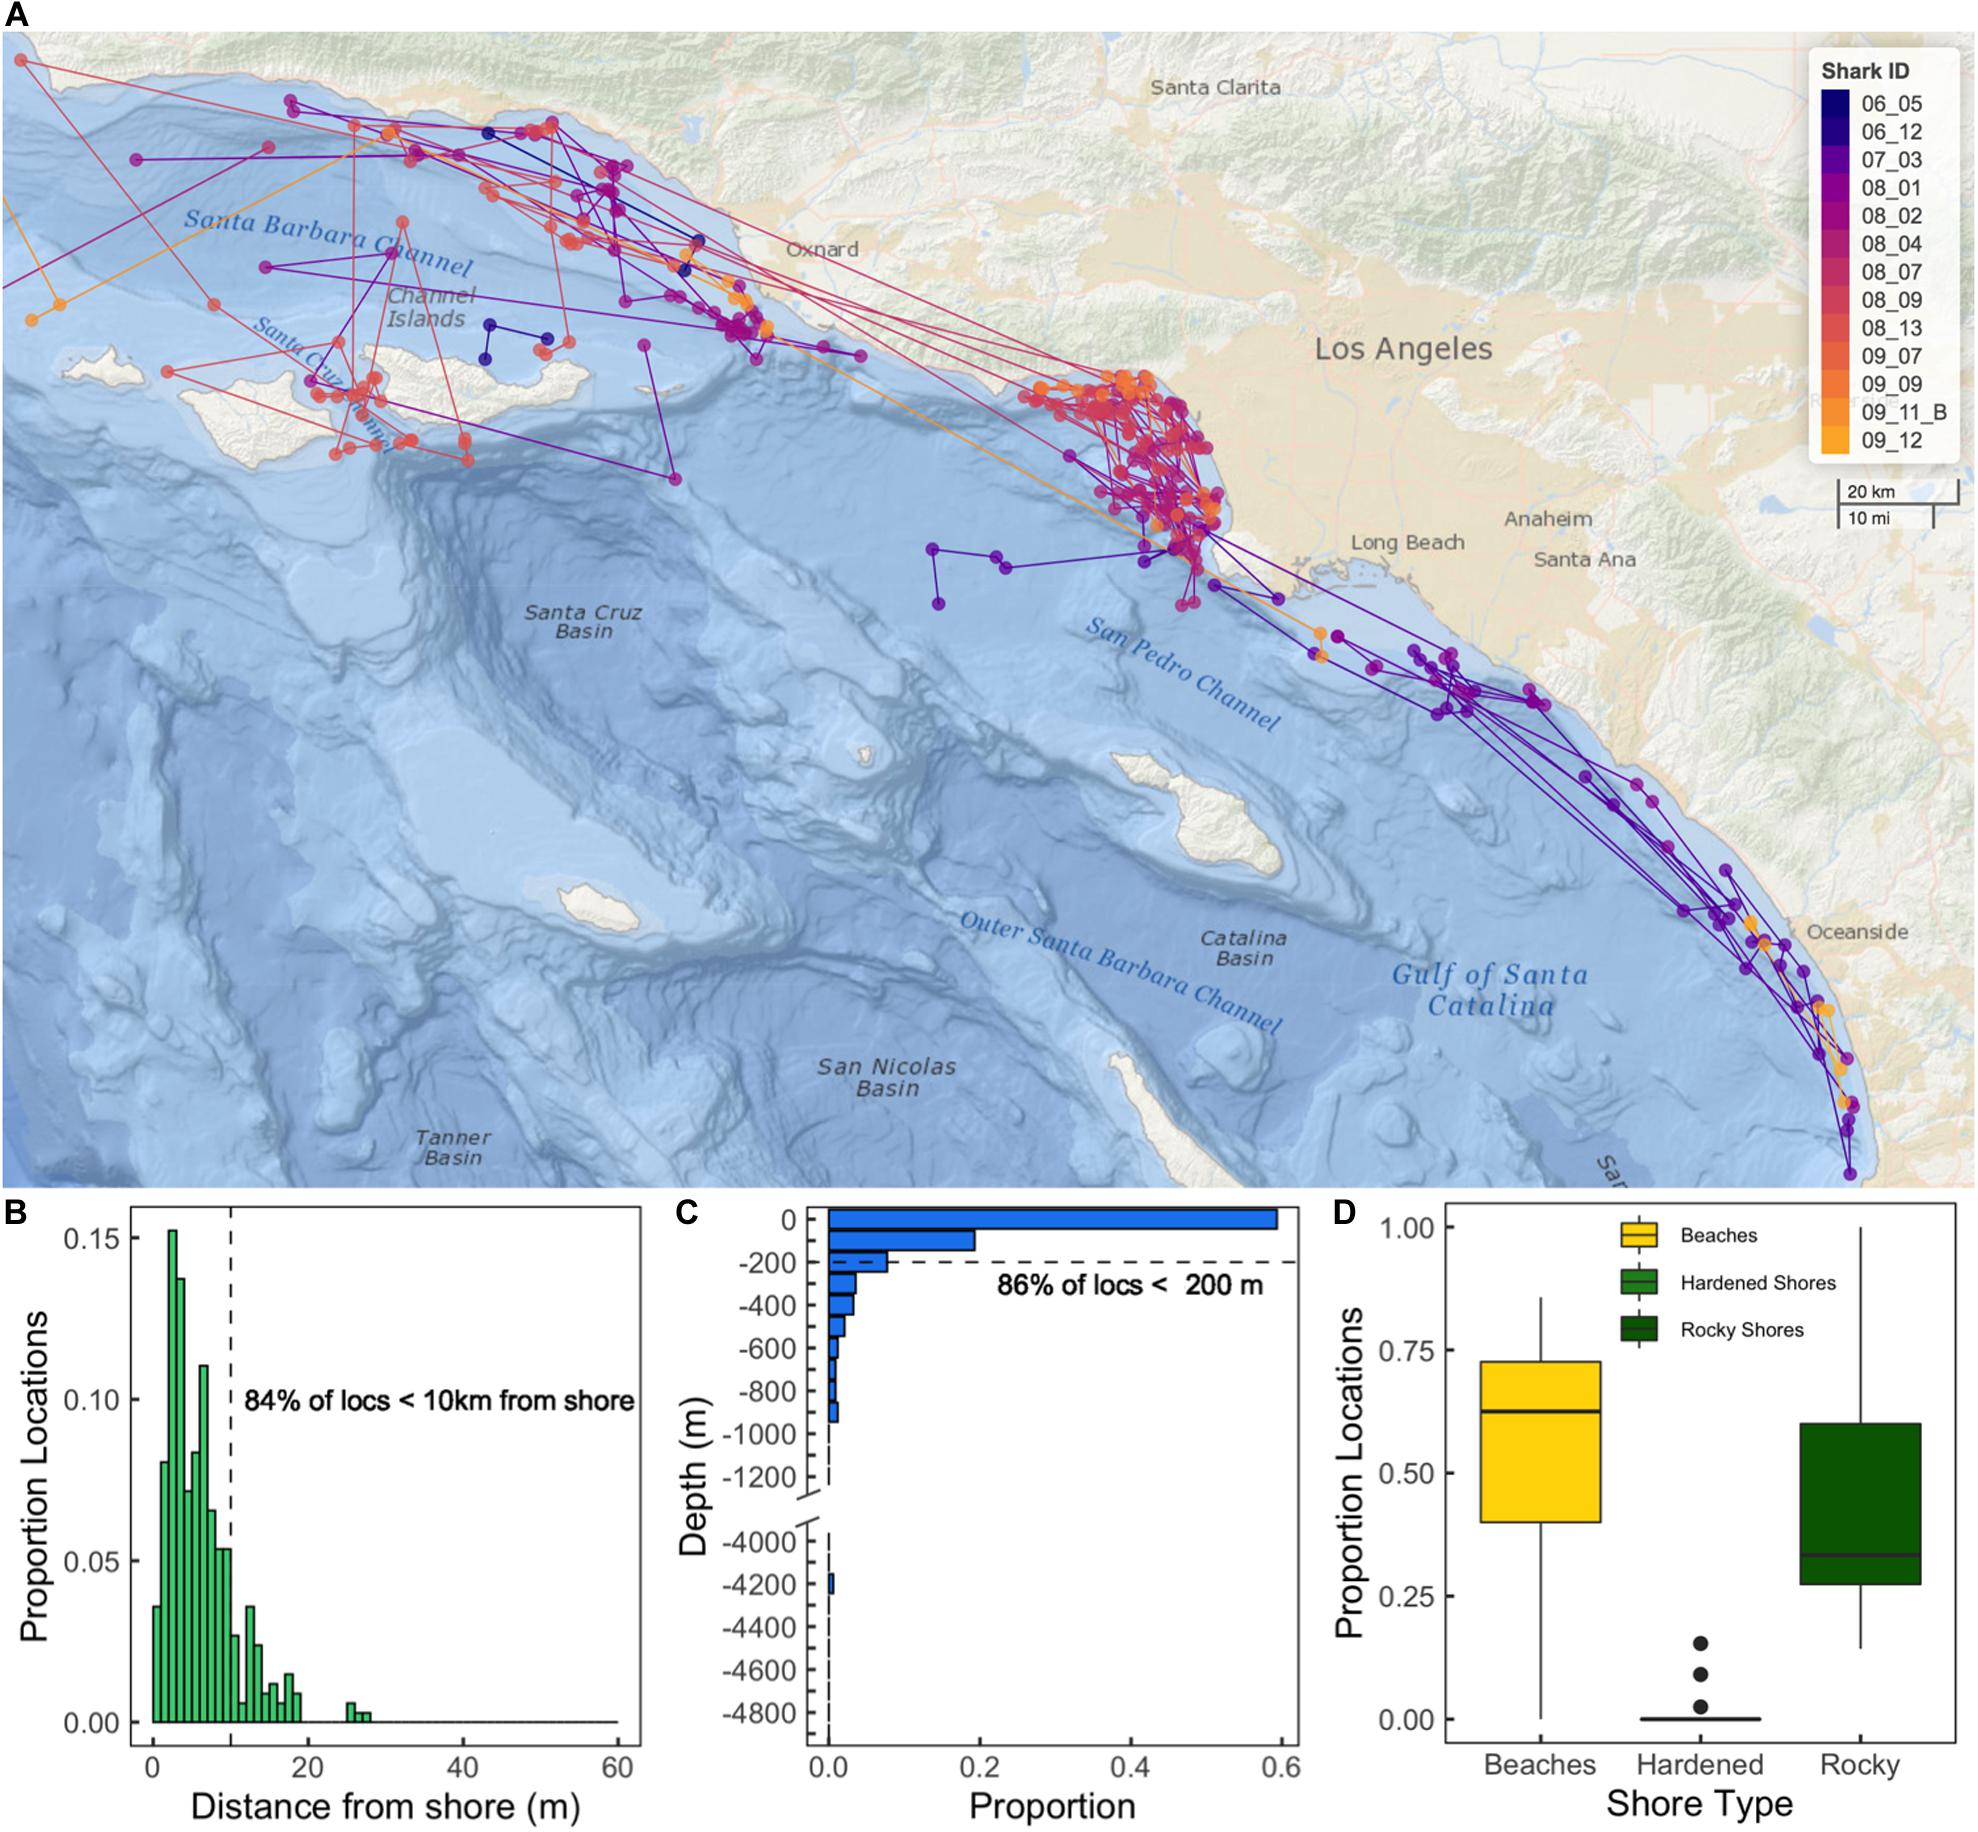
Figure 2. (A) Map of SPOT tag (ARGOS) locations colored by the individual shark ID. Lines represent the shortest path between subsequent locations for an individual shark. (B) Histogram showing proportion of ARGOS locations with respect to distance from shore. (C) Histogram of proportion of ARGOS locations with respect to underlying water column depth. N.b. the break in the y-axis after 1200 m, as there were no locations with associated depth between 1500 and 4000 m. (D) Box plot showing proportion of ARGOS locations with respect to shore habitat type. Box extents show interquartile range of proportions. Solid lines show median values.
Smart Position Or Temperature Transmitter tag data indicated that tagged sharks used shallow, nearshore environments often. SPOT tag location distribution peaked ∼ 2–3 km from shore, with >85% of SPOT tag locations occurring in waters <200 m deep, and 64% in waters less than 100 m deep. Analysis of shoreline habitat type indicated that across the study area (including offshore islands), available habitat was comprised of coastal marsh (33%), hardened shores (14%), beaches (31%), and rocky shores (22%). Sixty three percent of SPOT tag locations were associated with sandy beach habitats. There was evidence of site fidelity, as 18 zones contained multiple locations (where the same shark was detected more than once on the same day) from individual sharks. Time elapsed between such ARGOS positions ranged between 2 and 100 min. Of these 18 zones, 11 were in SMB, and all were within 10 km of shore. We also observed spatial overlap among individuals, as multiple zones contained detections from multiple sharks. Sixteen zones were used by more than one shark and five zones were visited by three different sharks (Shark IDs: 08_02, 08_04, and 08_09, see Supplementary Table 1). While no zones had SPOT tag locations from more than one transmitter on the same day, we did see evidence of spatiotemporal overlap between individuals’ area use (Figure 2). Six zones had SPOT tag locations from two different animals within the same year, with one zone having SPOT tag locations from two different animals within the same month.
Acoustic Data
Acoustically tagged sharks ranged from 128 to 175 cm TL (Supplementary Table 2).
Sharks were detected in monitored zones from San Diego County (32° N) to Santa Barbara County (34° N), as well as in monitored zones at offshore islands (CINMS, Santa Catalina) (Figure 3). Thirty-four (77%) of the 44 YOY white sharks outfitted with acoustic transmitters were considered in our analyses (10 tagged sharks were not detected twice on any receiver within a 24-h period). Of these sharks 50% were caught (netted) and outfitted with internal transmitters, while 50% were outfitted with an external (darted) transmitter. Four YOY white sharks were detected on a single day, while 13 were detected across fewer than 20 days in the calendar year from their respective date of tagging (Supplementary Table 1).
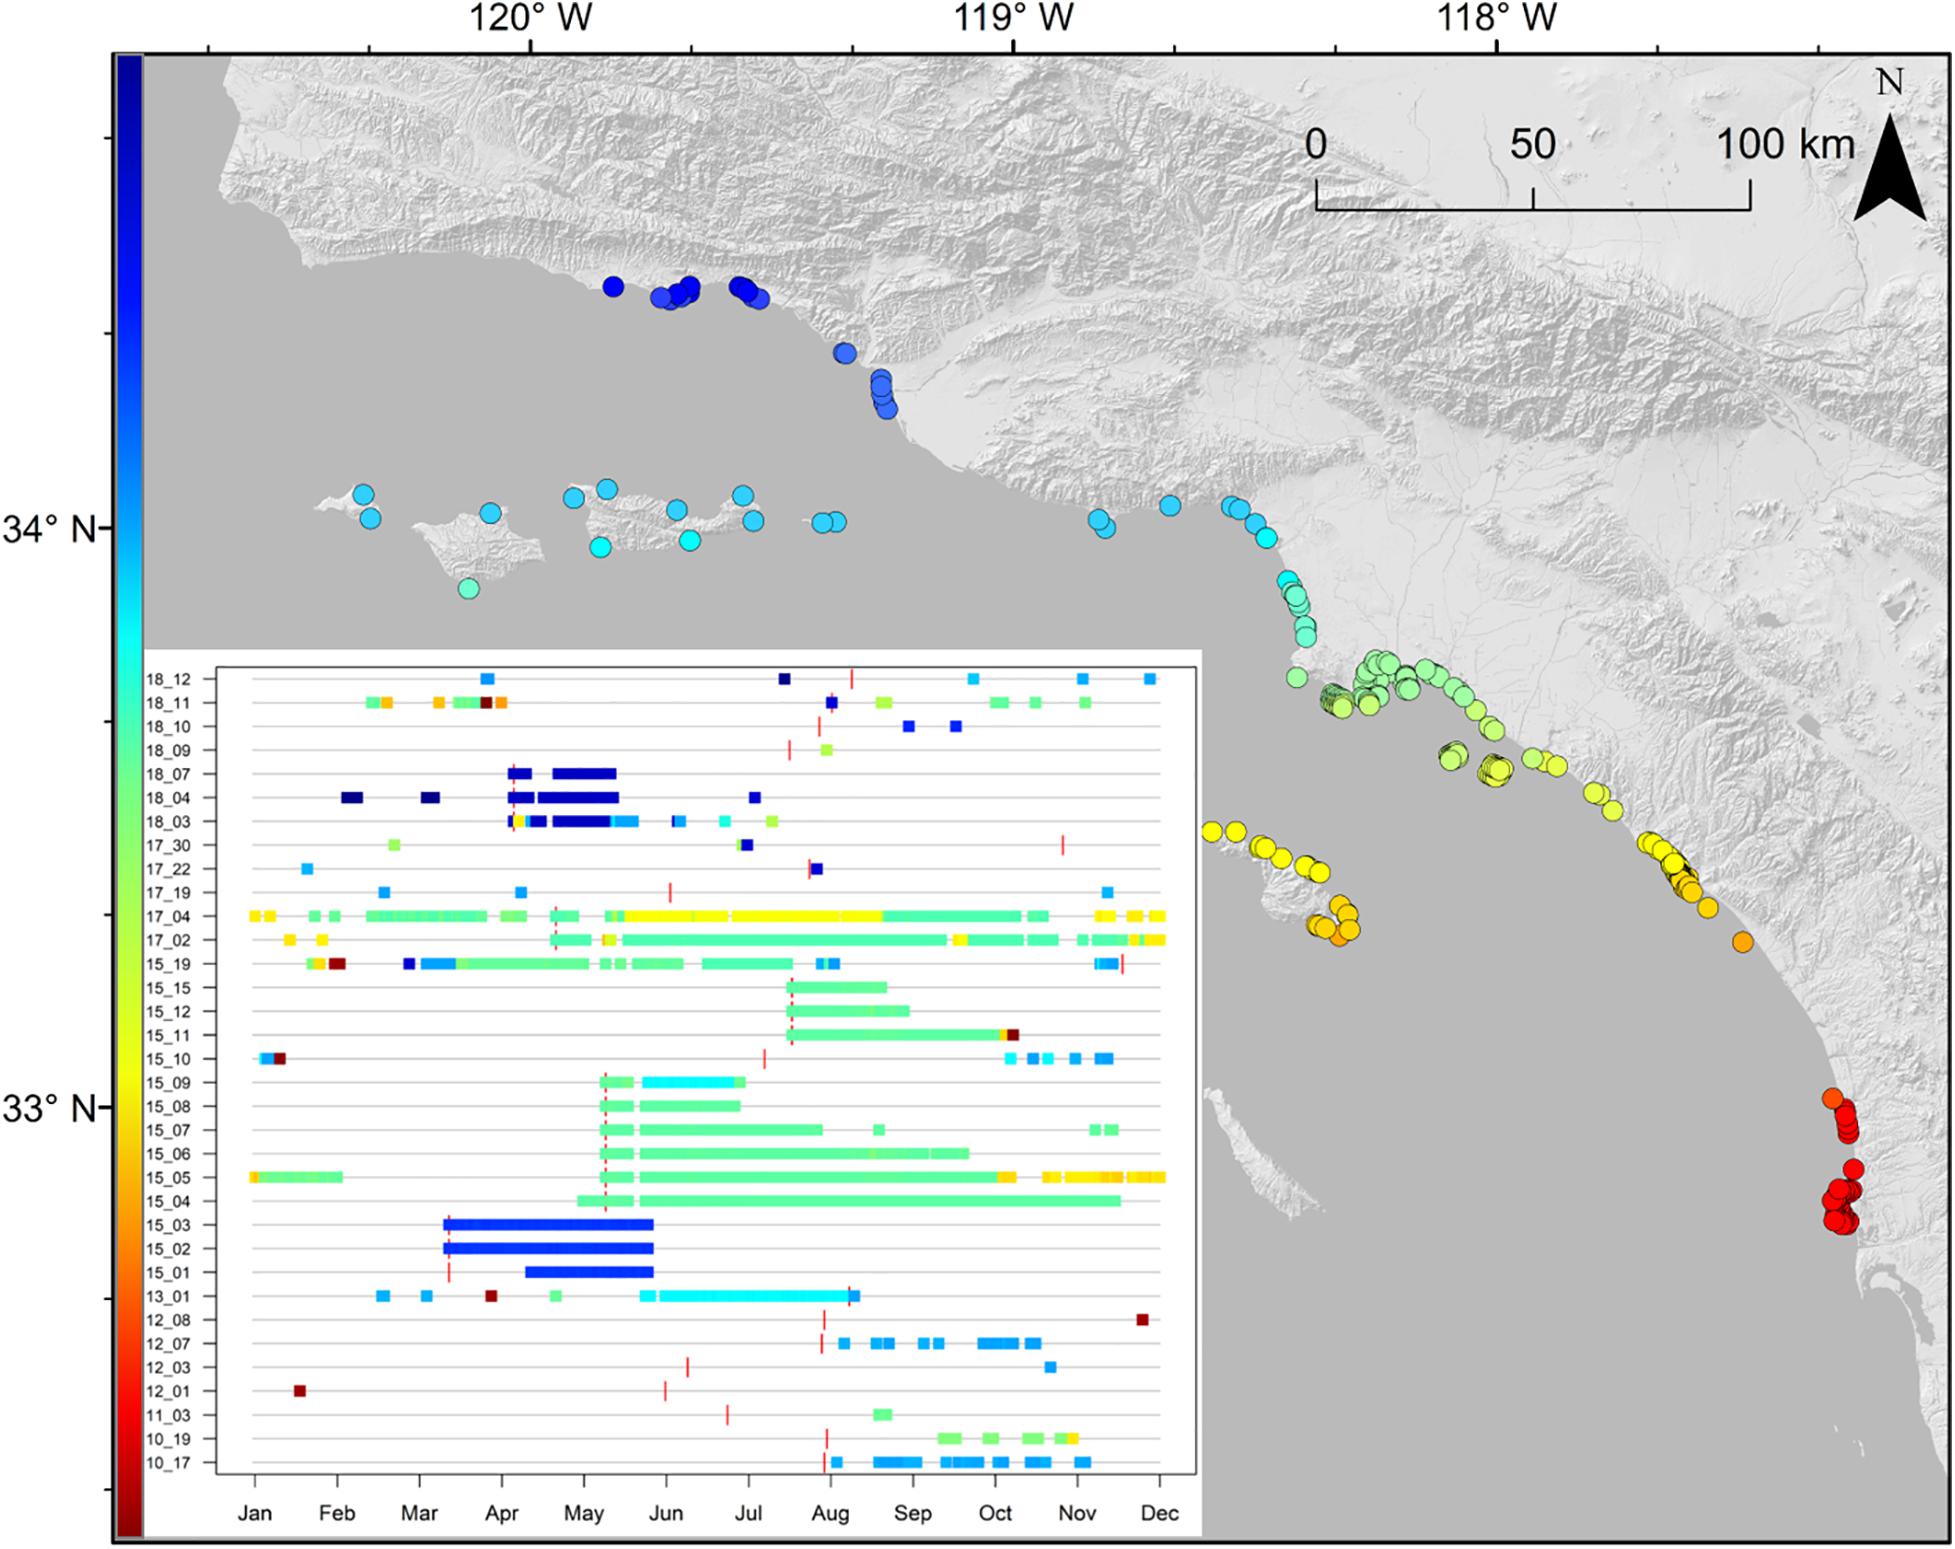
Figure 3. Map of receiver station locations in southern California, with presence-absence plot inset of YOY white sharks acoustically detected during the study period, where each individual is centered on a generic year, and the vertical red bar denotes tagging date of that year, rather than chronologically (2010–2018). Shading indicates latitude of receiver(s) a shark was detected on. The first two digits for each individual in this inset plot indicate tagging year (e.g., 10_17 and 18_12 indicate these two individuals were tagged in 2010 and 2018, respectively).
The majority (99%) of acoustic detections from 2010 to 2018 were along southern California beaches (as opposed to offshore islands), with the bulk of detections (85%) between Long Beach and Huntington Beach (LB-HB). Acoustic detection patterns of individuals varied widely with the number of zones visited ranging between 1 and 26 (mean ± SD = 6 ± 6 zones). The number of days a shark was detected within a year from tagging was highly variable among individuals (median: 35 days, range: 1–219 days). Mean number of days detected for all tagged sharks was 50.9 ± 56.8 days. Across all receivers, YOY white sharks were detected in monitored nearshore beach habitat ∼ 9.5–14% of monitored days in each year of the study. Positive relationships were seen between the number of days an animal was detected and total detections of that animal (r2 = 0.49), as well as between the number of days an animal was detected and the number of zones it visited (r2 = 0.53; Supplementary Figure 1). Ninety-four percent of detections were from YOY sharks outfitted with external transmitters (n = 17) (Supplementary Figure 1C).
Shark Relative Abundance
Shark relative abundance was variable across each year of the study (Figure 4), and was strongly correlated with the number of YOY sharks tagged that year (r2 = 0.794: Pearson’s product-moment correlation; t = 5.196, p = 0.0013: Supplementary Figure 2). The best fitting GAM (in terms of AIC score) varied across years, but the all-inclusive model (model 1) was most consistent, with showing the lowest AIC score across 4 of the 9 years for which models were run [years: 2011, 2015, 2016, and 2018 (Supplementary Table 3)]. In addition, all models run for a particular year showed similar trends in terms of the statistical significance of the parameters modeled. Therefore, to increase interpretability and consistency, we report the results from the all-inclusive model only (refer to Supplementary Table 4 for all models run). Generally, tagged YOY relative abundance patterns were not explained consistently by any predictor variable included across all years (Supplementary Figures 3–6 and Supplementary Table 4). Significant effects of environmental variables upon YOY shark density were largely observed in concert with limited sample sizes and large confidence intervals, further impacting interpretability of the influence of environmental conditions.
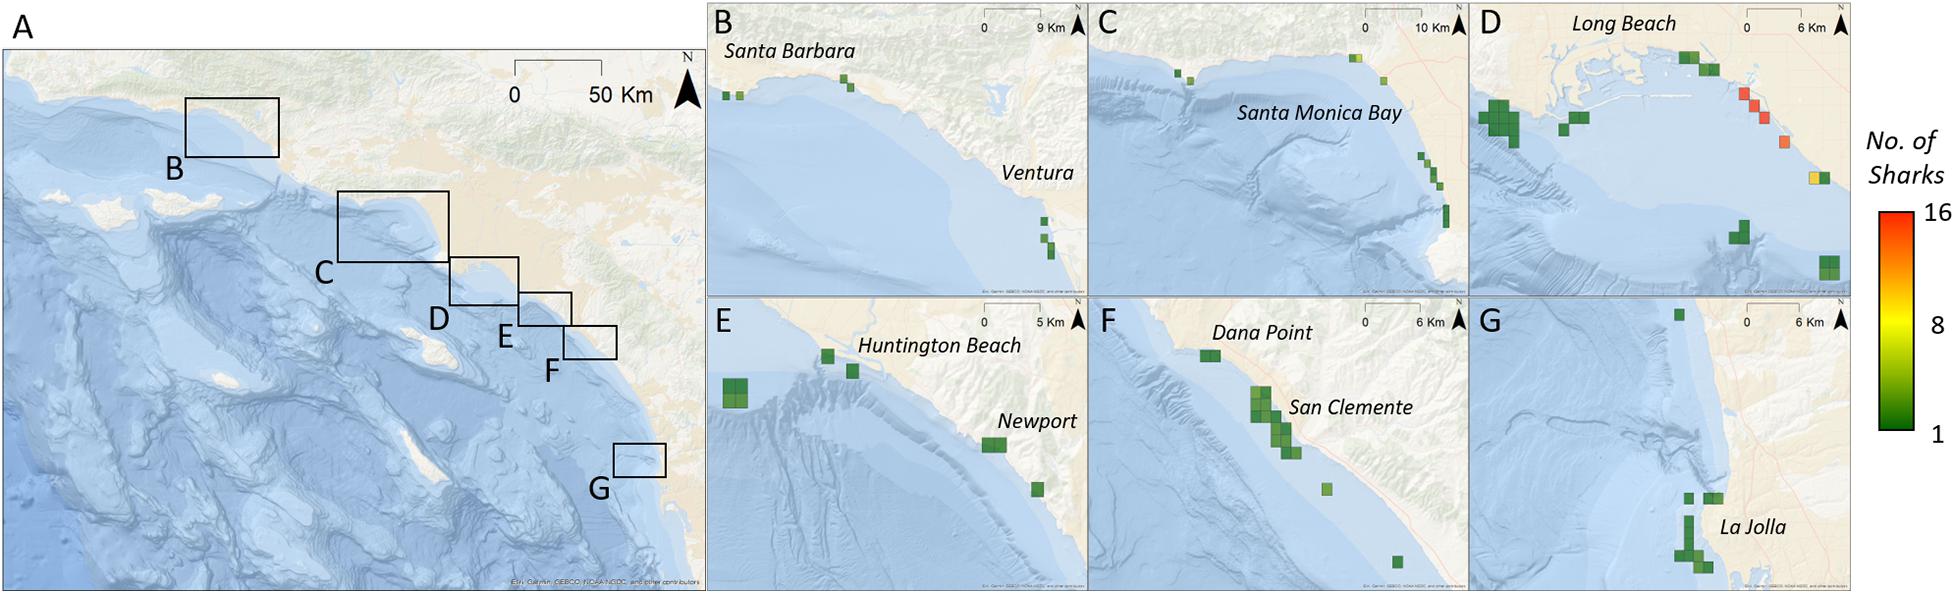
Figure 4. Relative abundance of tagged YOY white sharks (calculated as the total number of sharks per zone per day) across southern California. Regions of importance have been enlarged to view detail. Grid cells are approximately 1.2 km2 (all years – by location). (A) Base-map of broader study area. Black boxes indicate spatially distinct areas where YOY sharks were detected. (B–G) Indicate location of zones where YOY sharks were detected. Zones are colored according to cumulative relative abundance.
Season was found to have a significant effect upon shark relative abundance in 5 of the 9 years of data included in the study. 2011, 2013, 2014, and 2016 were years where season was not a significant predictor of shark relative abundance, but no clear trend between season and shark relative abundance was present.
Temperature had a significant effect on YOY density in four different years (2011, 2015, 2016, and 2018). Shark relative abundance tended to be lower in relation to broader temperature extremes (below 12–15°C and above 20–23°C). Notably, in 2015, shark relative abundance was greatest above 25°C (Supplementary Figure 3).
Receiver density varied across years and was highest during years where VPS (Vemco Positioning System) arrays were deployed in specific locations, for example, in 2011 and 2016 (see methods for applicable references). However, no consistent relationship between probability of occurrence and receiver density was evident from year to year. In 2018, receiver density appeared to have a positive effect upon shark relative abundance at receiver densities of one and two receiver per zone.
Depth gradient displayed a negative relationship with shark relative abundance in two different years (2014 and 2016; p = 0.019 and 0.009, respectively), and, shark relative abundance appeared higher when depth gradient was between 0.0025 m/depth gradient grid cell (0.017° resolution) and <0.01 m/depth gradient grid cell (0.017° resolution).
Chlorophyll a (Chla) was included as a predictor variable as a proxy for local environmental productivity. Chla appeared to be a significant predictor of shark relative abundance in only 2015 (p = 0.005), and shark relative abundance appeared to decrease with higher Chla levels (Supplementary Figure 5).
Residency Analyses
Young-of-the-year white sharks exhibited resident events at a total of 99 (out of 156) monitored zones across all years of the study. Zones with greatest residency were variable from year to year (Figure 5) and in general, reflect the geographic areas with the greatest acoustic detections. Maximum RI for a zone in an individual year (all sharks for that year combined) ranged from 0.23 to 0.44 (Figure 5). Mean (±SE) zone RI, across all zones and across all years, was 0.01 ± 0.004 (median = 0.0005, mode = 0.0001). Within the LB-HB region, Sunset, Surfside, and Bolsa Chica beach areas (latitude = ∼ 33.5° N; Figure 5G) had the highest mean overall residency across the study period (RI’s = 0.28, 0.23, and 0.09, respectively). Overall RI’s for all other zones, averaged across all years, were ≤0.05. While habitat in these areas supported resident YOY sharks across multiple years (Figures 5D–F), the high overall RI values for these zones is also likely influenced by comparatively strong resident behaviors seen in 2015, which were in the order of three times greater than any other year in the study (Supplementary Figure 7).
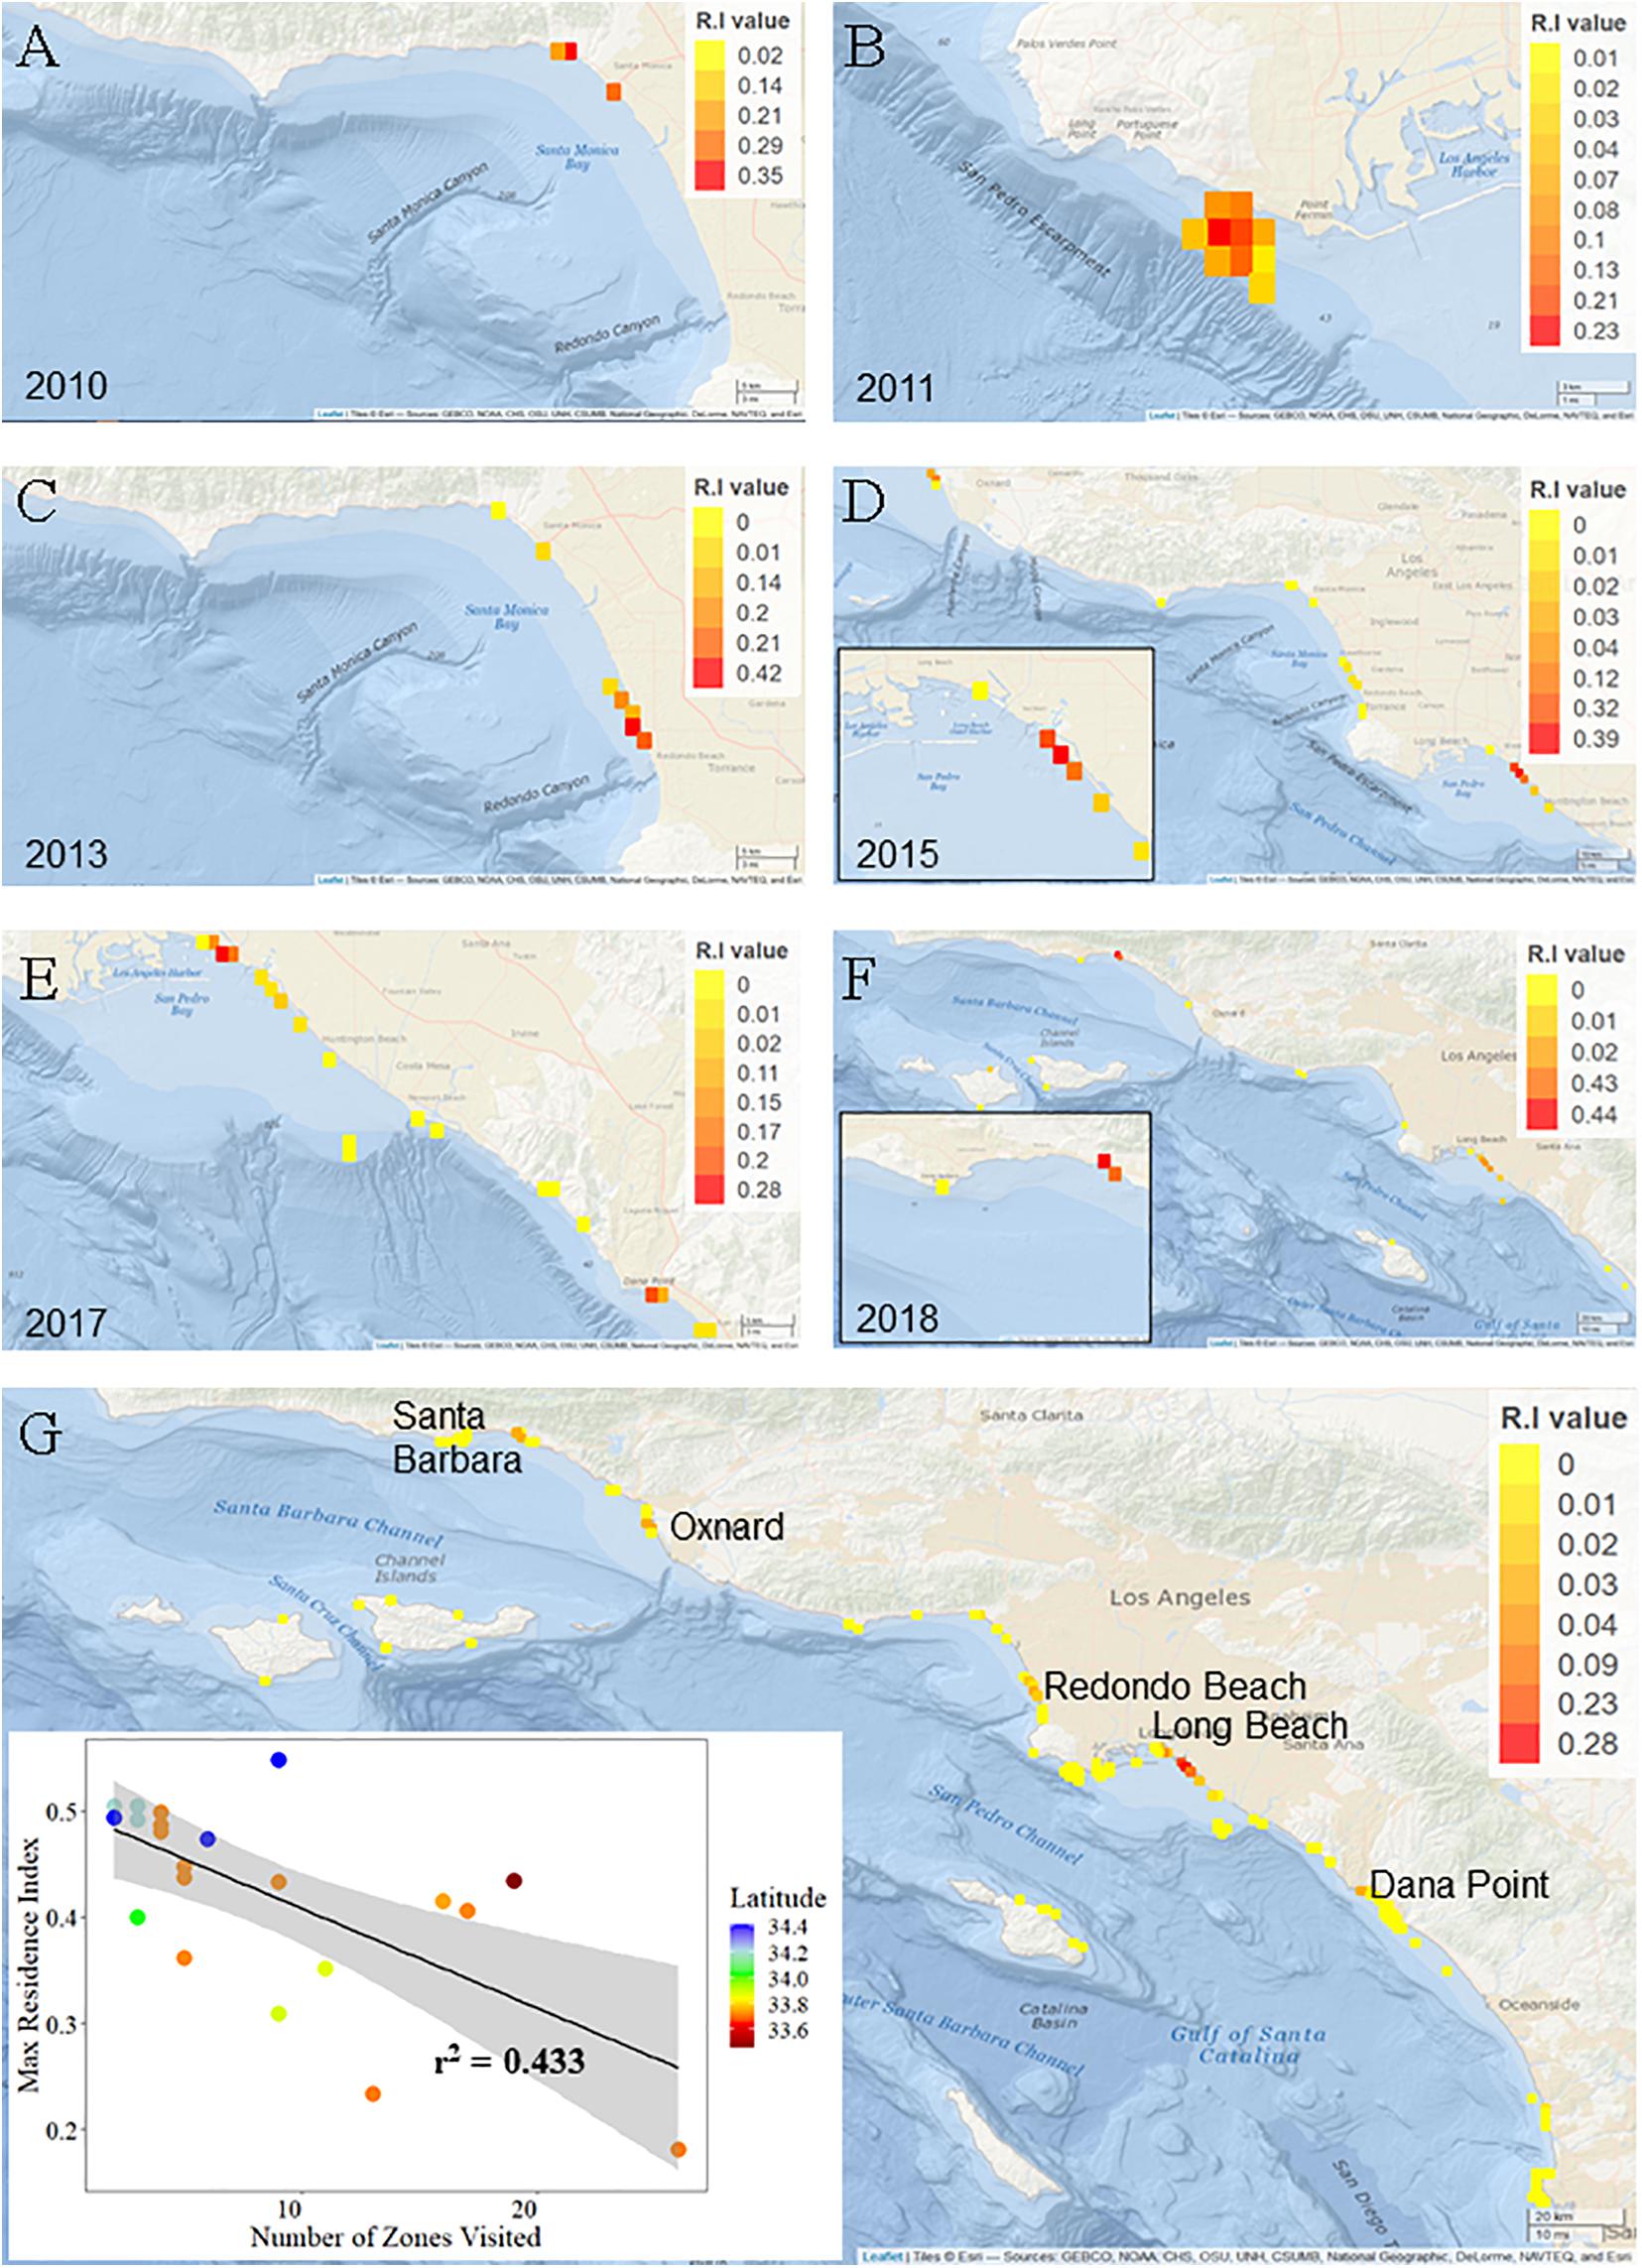
Figure 5. Residency indices for young of the year white sharks in southern California. Grid cells are approximately 1.2 km2. Note the scale bar for residency values changes across years. (A–F) Indicate location of zones of highest YOY white shark residency for each year of the study, colored by RI value. (G) Base-map showing cumulative residency values for all zones across all years. Inset scatter plot shows approximate latitude of the zone of highest residency for each YOY white shark included in residency analyses.
Twenty-one animals were considered in residency analyses, of which only four were outfitted with internal transmitters. Maximum RI value (highest residency within a given zone) for an individual shark ranged from 0.55 (37 days detected) to 0.18 (118 days detected) (Supplementary Table 2). For all animals combined, overall RI values and number of days detected were weakly related (r2 = 0.0321). By comparison, overall RI and the number of zones visited showed a stronger relationship (r2 = 0.433), indicating that affinity to specific areas (from observed residency values) are unlikely an artifact of the number of days detected (Figure 5). Mean RI for individual sharks across all zones visited ranged from 0.5 (±0.014) to 0.04 (±0.009). Ten YOYs (45%) exhibited mean RI’s > 0.2.
Residency events were seasonally variable across study years with peak resident days in the late summer through the fall in 2010–2013 (August – late October), while peak resident days occur in early to mid-summer in 2015–2018 (May – July) (Supplementary Figure 7).
Total resident events (summed number of resident days recorded in each zone) within the array for sharks with mean RI > 0.2 ranged from 128 (shark ID 15_06) to 38 (shark ID 18_04) (Figure 6). Greatest mean RI (0.5) was attributed to a 2015 (externally) tagged shark (shark ID 15_01) with 103 resident events within the array. Lowest mean RI (0.04) was attributed to a 2015 (internally) tagged shark (shark ID 15_19) with 118 resident events within the array.
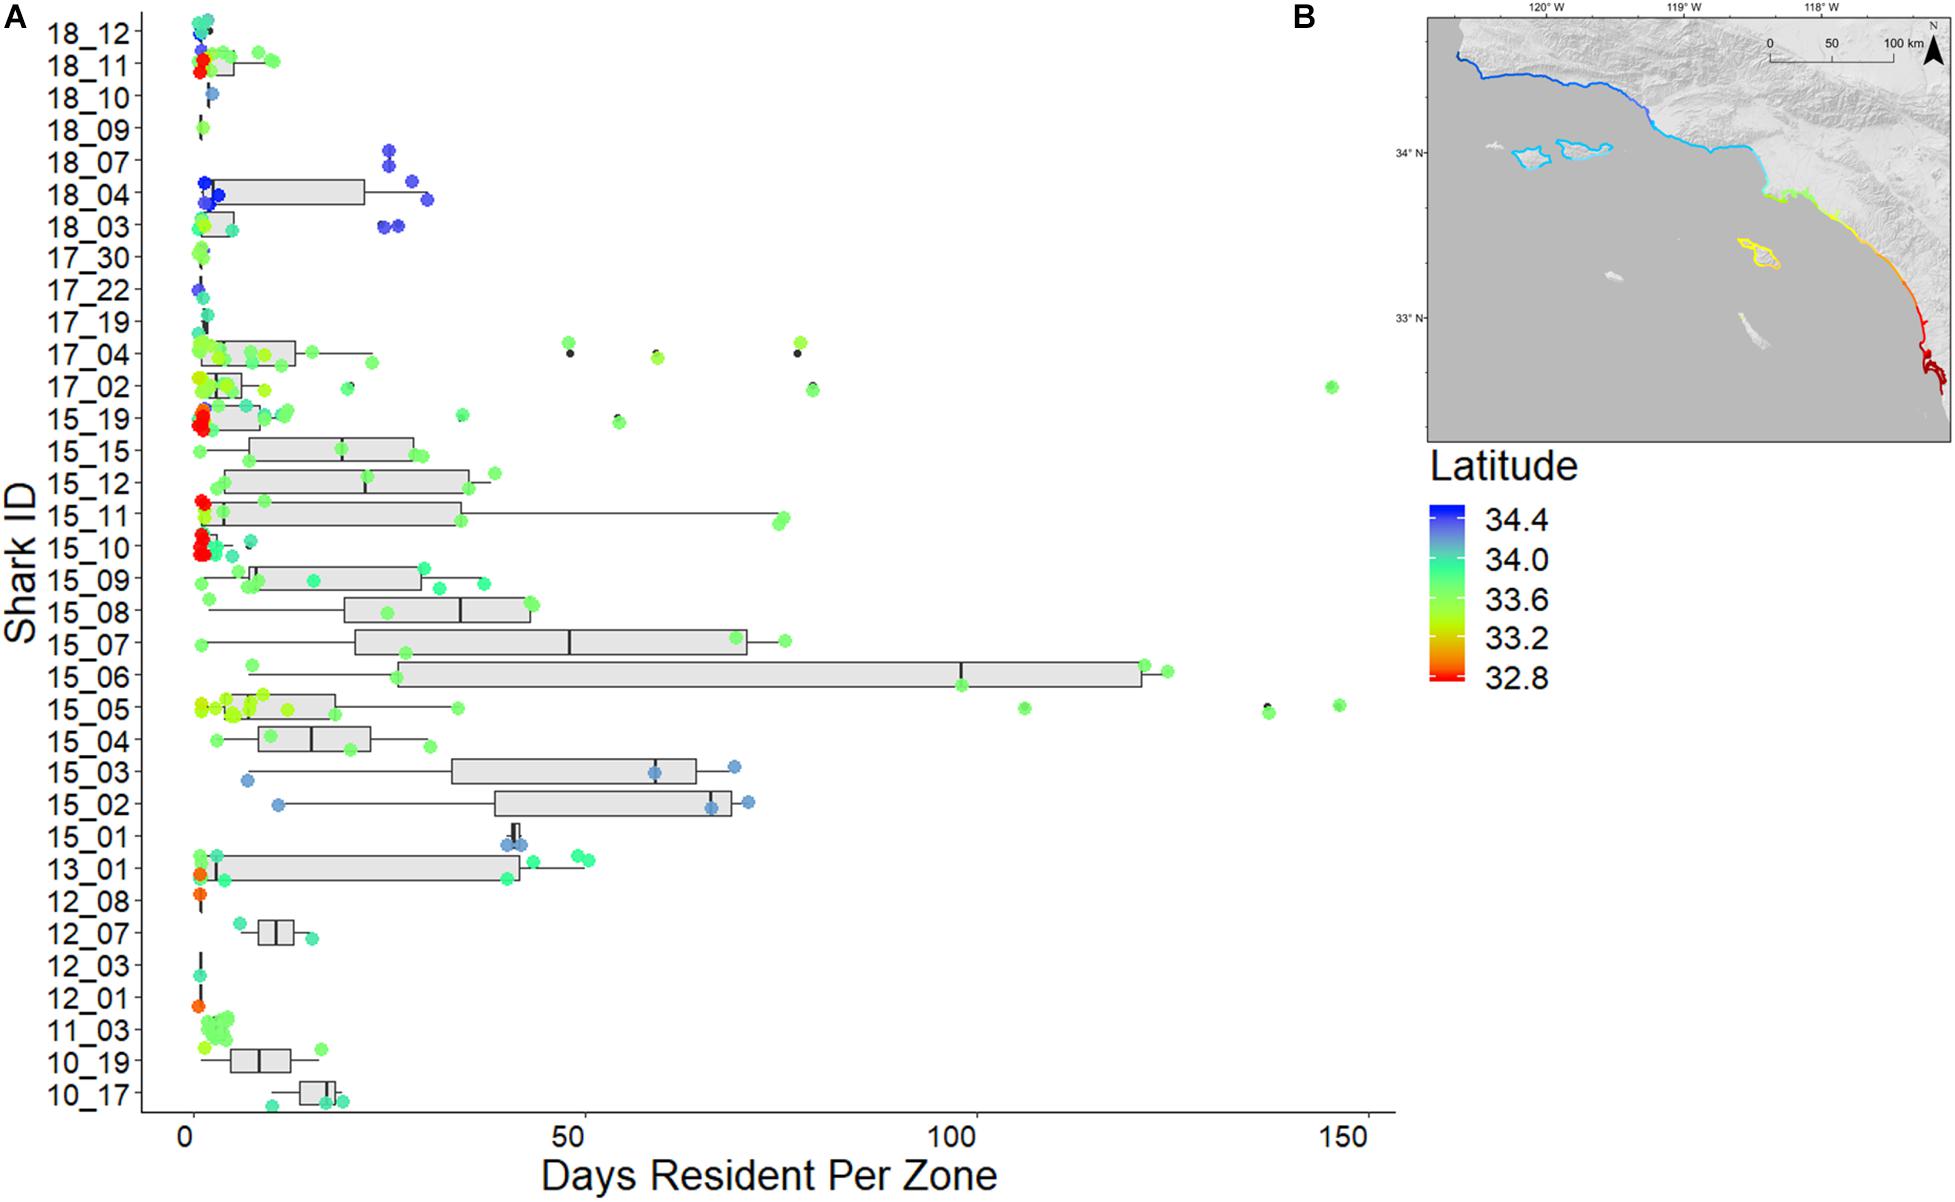
Figure 6. (A) Resident days per zone per individual shark. Boxes indicate interquartile range of residency values of individual sharks, box lines indicate medians, whiskers indicate minimum, and maximum residency values (excluding outliers). Colored circles represent latitude for each zone resident by a shark, referenced by inset map (B).
The best fitting GLMM according to AICc retained all fixed and random factors in the model. As a result, water temperature significantly increased residency time within a zone [X2 = 17.33, p < 0.001 (Supplementary Figure 8)]. Prior to 2015, the fall and winter months (September – December) significantly increased residency time within a zone, whereas after 2015 residency times began to increase earlier in the year (February – April) (X2 = 83.46, p < 0.001). Additionally, both random effects (SharkID and Year), accounted for approximately 46.5 and 42.7% of the overall model variability, respectively (Supplementary Figure 8).
Activity Space Estimates
Activity space estimates were calculated for a total of 23 sharks (Table 2). Sharks with less than five relocations were not included in these analyses. Two of these 23 sharks were not sharks included in the residency analyses, as they were resident for less than 20 days in their respective years (Table 2). The number of resident days for animals included in activity space estimates ranged from 3 to 209 days (median = 46). For all sharks across all years, mean (±SE) estimated 50% core activity space was 30.79 ± 19.32 km2. This estimate is likely increased by the influence of two individuals that exhibited markedly larger activity spaces (Table 2). Notably, these two individuals (shark ID’s 15_10 and 18_11) were bycaught sharks, outfitted with internal tags. Resident YOY white sharks were largely found to exhibit relatively small core activity spaces in nearshore beach environments, as calculated using BBKUDs (Figure 7 and Table 2). Combined core activity spaces generally aligned with the areas of peak residency within a given year (Figure 7). Individual truncated core activity space (space-use estimates adjusted for terrestrial overlap) ranged from 401.4 to 0.7 km2. COA position estimates were on average less than 100 m apart. Tight clustering of COA’s suggests strongly resident behaviors, concentrated in relatively small areas, with limited dispersal. Core activity space within residency regions was found to vary by individual, as well as by year (Table 2).
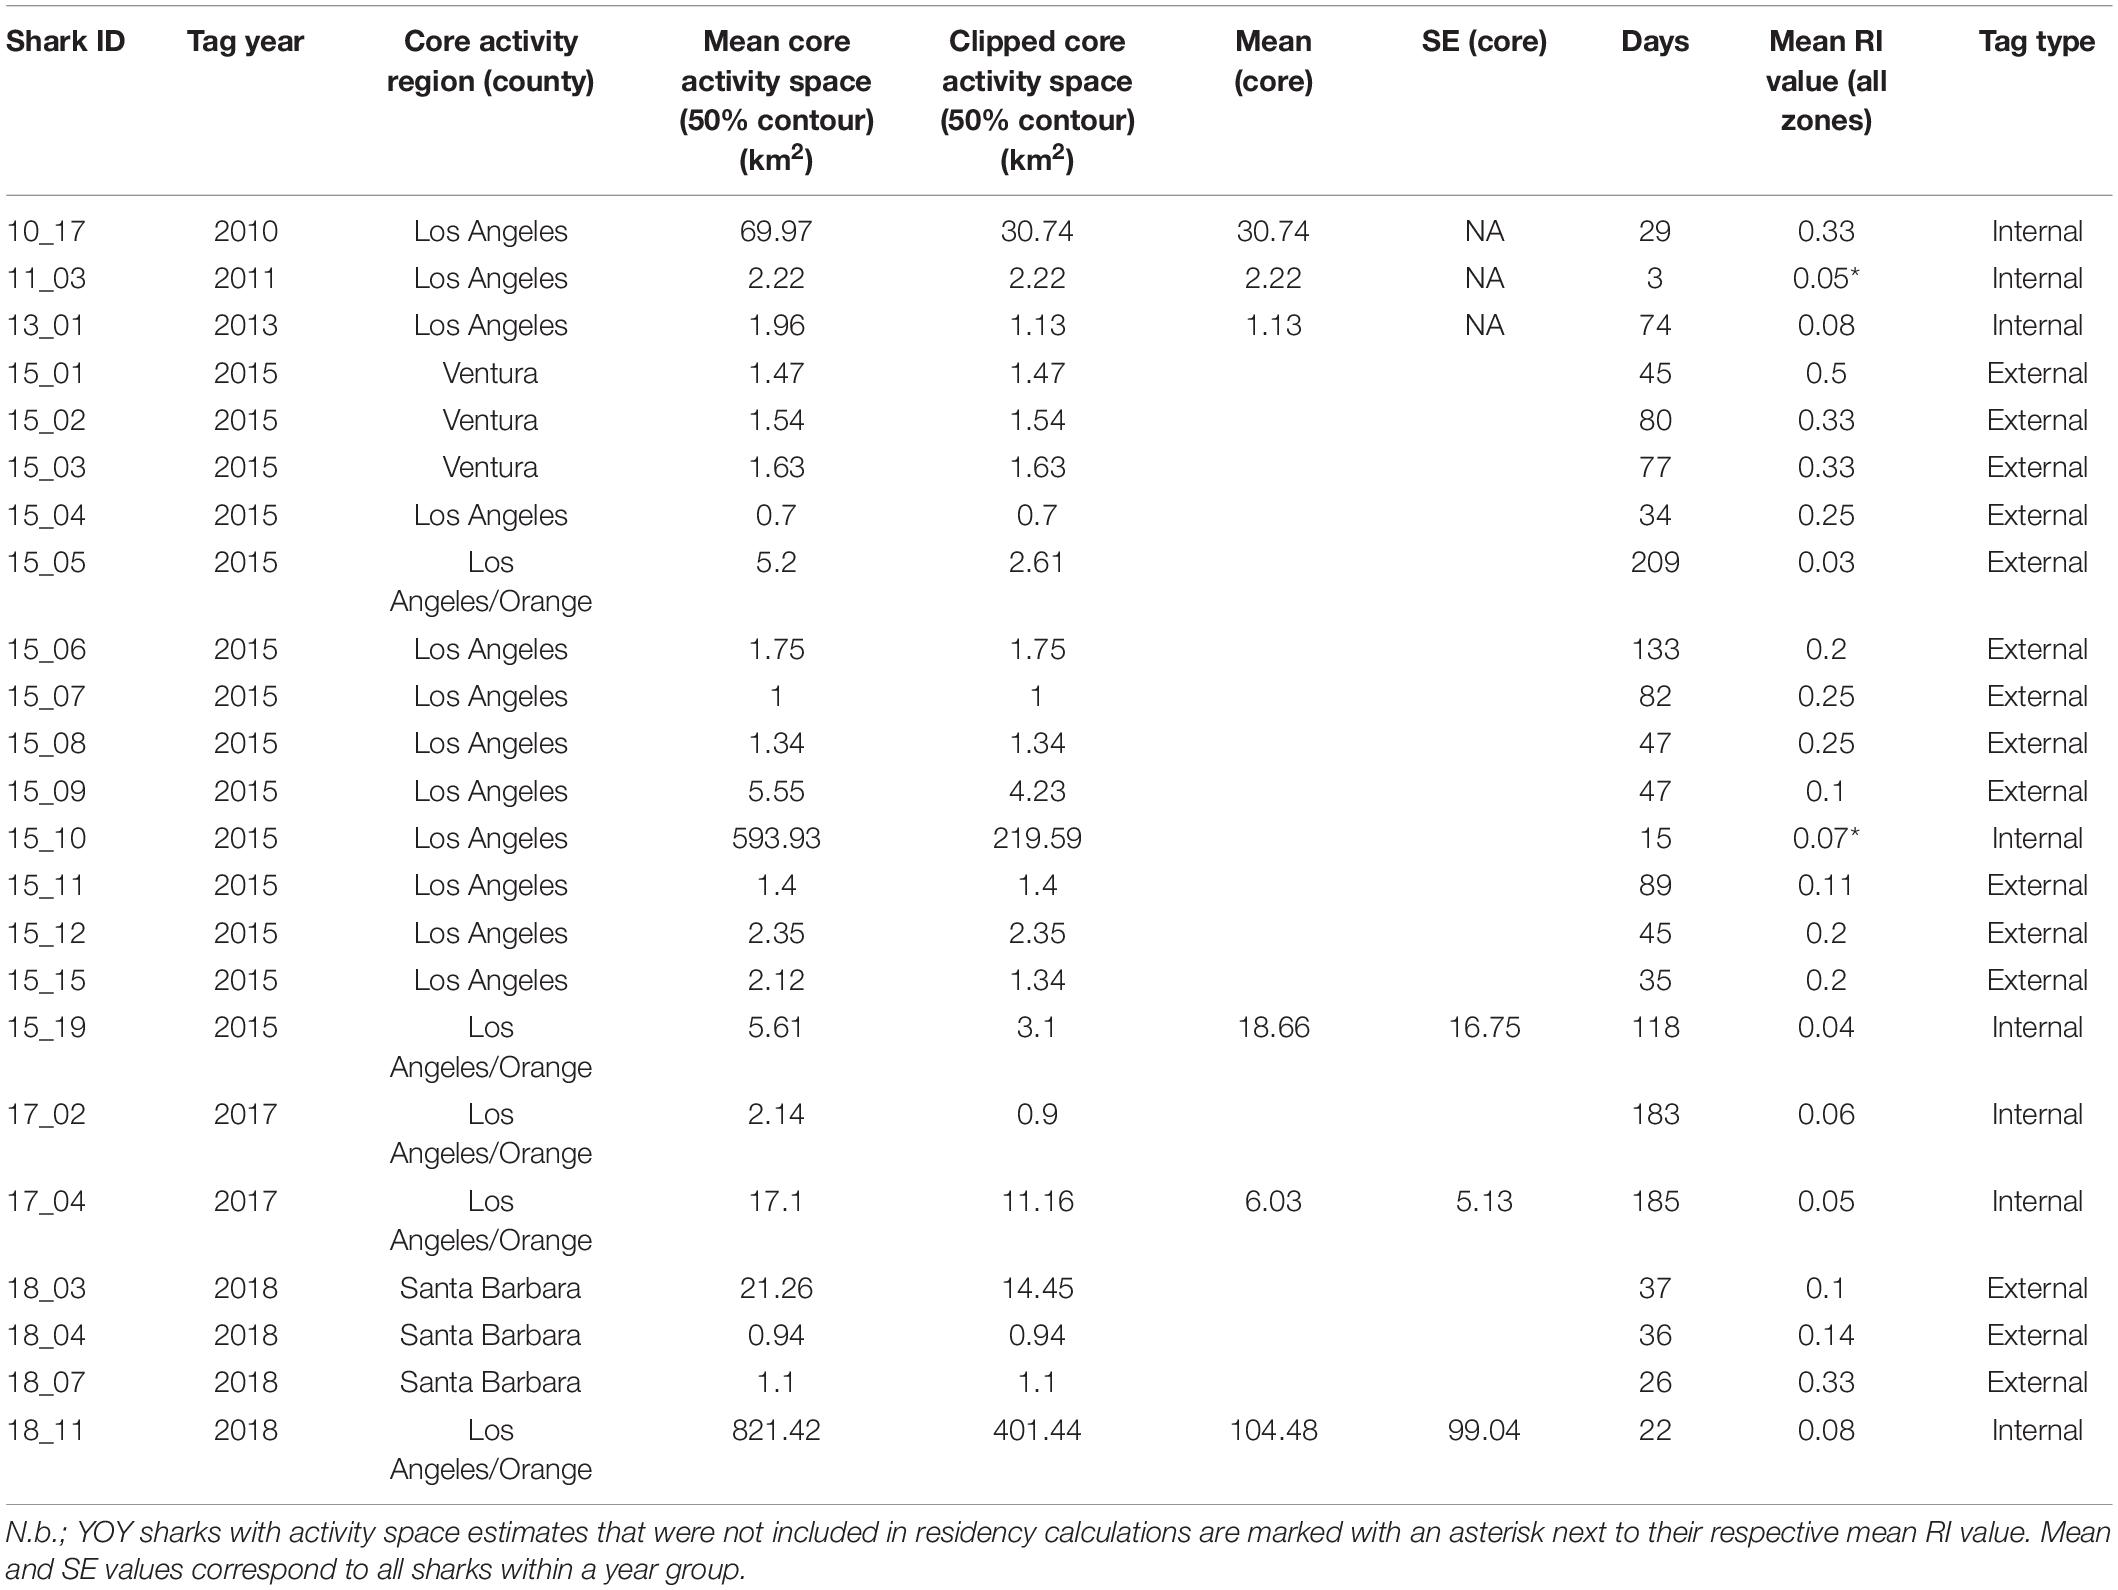
Table 2. Individual core activity space estimates derived from Brownian Bridge Kernel Utilization Densities and clipped (adjusted for terrestrial overlap) estimates.
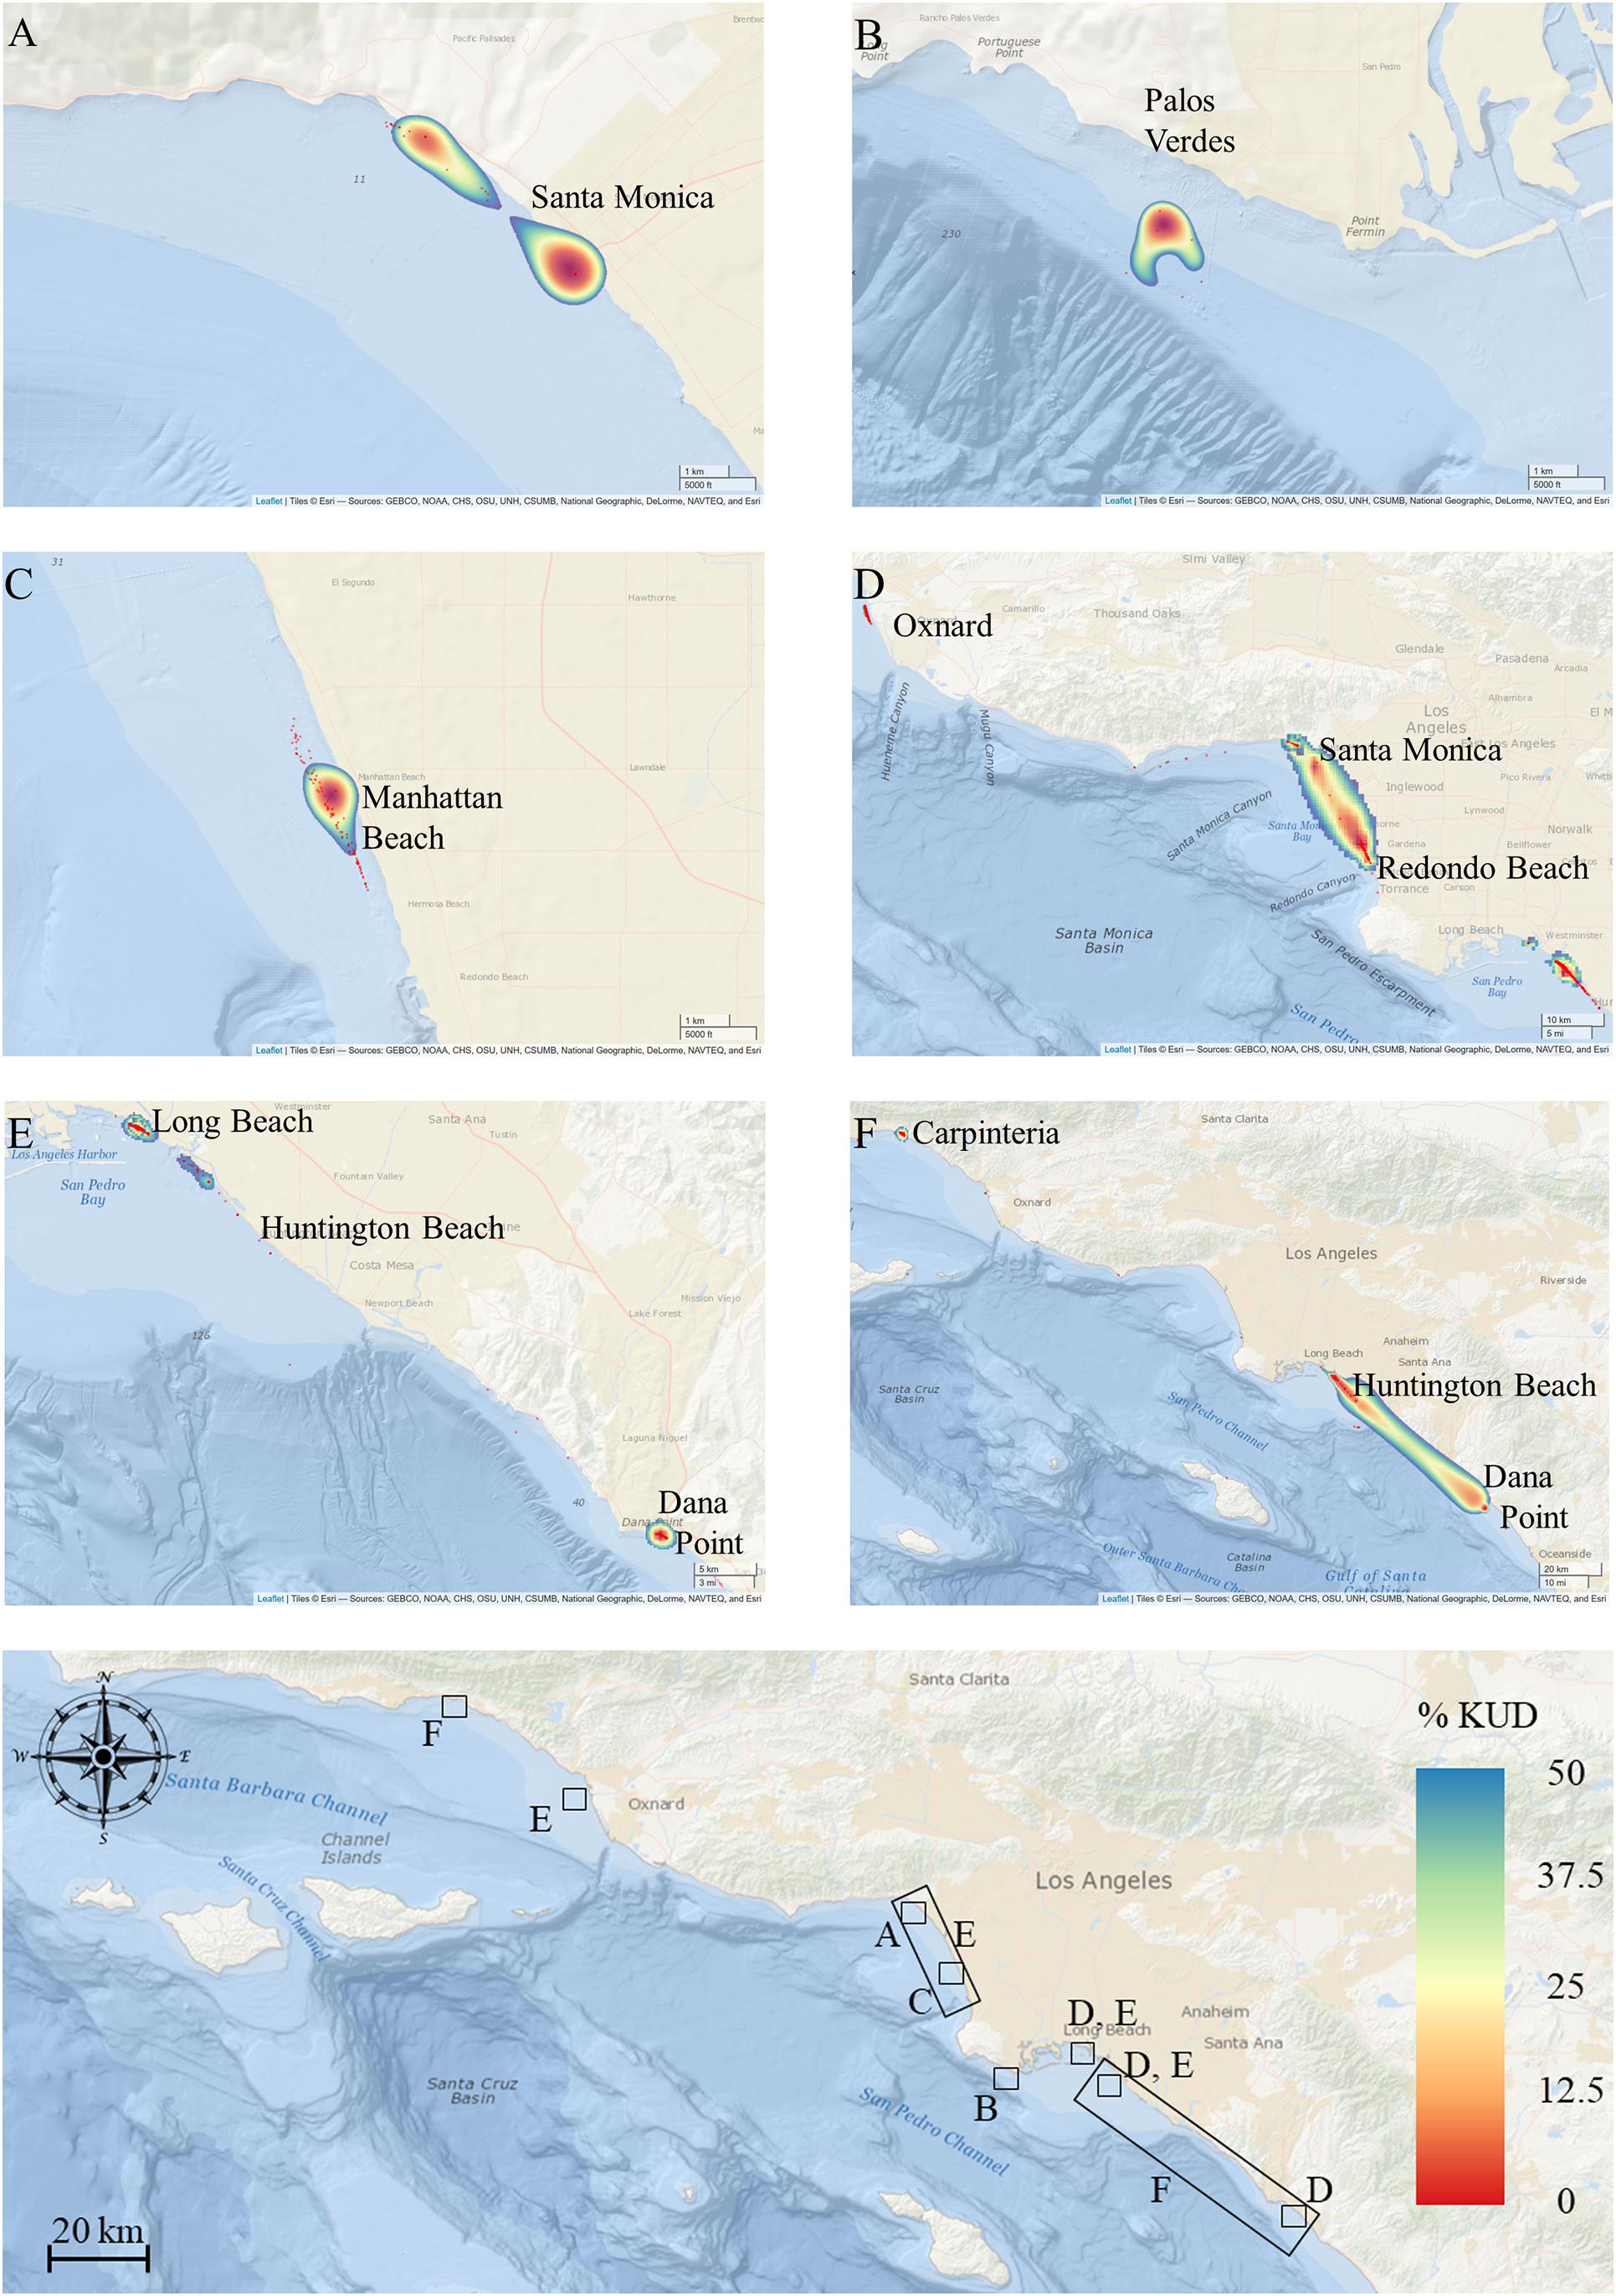
Figure 7. Activity space estimates for animals, overlaid for each year [(A) 2010, (B) 2011, (C) 2013, (D) 2015, (E) 2017, (F) 2018]. Base map shows the locations of BBKUD plots for each panel with reference to the southern California coastline and wider study area. Geographic locations of core activity in each year reflect areas of peak shark density and residency.
Discussion
This study presents the first quantification of interannual residency patterns of YOY white sharks from this Northeast Pacific population, in southern California waters. More specifically, this study is the first to qualify and quantify habitat use preferences, and patterns of space use of YOY white sharks while resident in southern California. The present study utilizes comparatively high resolution spatial and temporal analyses derived from 10 years of acoustic monitoring, as well as satellite telemetry, to characterize YOY white shark habitat use and its possible drivers across southern California. Our results indicate that the relationship between shark presence and ocean temperatures may not be as static or as simple as previously hypothesized.
Previous studies that have addressed YOY white sharks from this Northeast Pacific population have identified the SCB as an important resource that provides nursery habitat for these sharks, and that habitat selection is driven by temperature, depth, and distance to shore (Klimley, 1985; Dewar et al., 2004; Weng et al., 2007b; Lowe et al., 2012; Lyons et al., 2013; White et al., 2019). However, the geographic range of YOYs and juveniles of this population extends to at least the southern tip of Baja California ∼1200 km (Weng et al., 2012), with specific nursery habitat identified toward the southern extent of the latitudinal range of this population, in Bahía de Sebastián Vizcaíno, Mexico (Oñate-González et al., 2017; Tamburin et al., 2019; García-Rodríguez and Sosa-Nishizaki, 2020). These studies, based upon data derived from satellite telemetry, remote sensing, and fisheries interactions, have been restricted to broad-scale observations of environmental drivers of habitat use and selection.
Our analyses of broad-scale movements using satellite telemetry data, and shark relative abundance and residency patterns from acoustic data, showed that YOY white sharks use shallow, nearshore habitats (within <500 m of the shoreline) at numerous locations across southern California. Often, these locations were beach environments, situated alongside some of the most densely populated and heavily urbanized areas on the United States Pacific west coast (Figures 2, 4, 5). Although our acoustic array was deployed across a variety of environments that included beach habitat, calm protected habitats, exposed high energy habitats, and both rocky reef and kelp forest habitats (Figure 1), >90% of monitored locations were associated with beach habitat, despite the fact that these habitats comprised only 31% of the available shoreline (including offshore islands) throughout the study area. Thus, a caveat of acoustic data is that it is limited to presence (or absence) of tagged animals at monitored locations, as associated habitat use patterns can only reflect observations within the extent of monitored habitat. Even with an acoustic array distributed across a large geographic area, acoustic analyses alone have the potential to under-represent movement patterns and habitats selected. Thus, we incorporated satellite (SPOT tag) telemetered data into our analyses to account for this potential bias, and examine the extent to which SPOT tag-derived ARGOS locations occurred within nearshore vs offshore environments, as well as habitat type associated with ARGOS locations.
The mean duration of SPOT tag transmissions (65 days) was notably short. While we can only speculate as to why this may be, one possibility is that damage to small, thin dorsal fins of YOY white sharks caused by SPOT tag attachments may have inhibited tag performance and transmission capability (Jewell et al., 2011). One SPOT tagged shark was recaptured approximately 1 year after tagging, and its dorsal fin was severely deformed from the weight of the SPOT tag, with the tag bent at a 95° angle from upright.
ARGOS locations (classes 1–3) revealed that although there was some utilization of habitat at offshore islands (CINMS) and some utilization of offshore waters, tagged YOY white sharks were largely observed in relatively shallow coastal locations (largest proportion of locations ∼ 2–3 km from shore, 64% of locations in waters less than 100 m deep) associated with expanses of insular shelf (Figure 2). Of all ARGOS locations, 63% were also associated with beach habitat shorelines (Figure 2D and Supplementary Figure 9). A previous study using SPOT tag data in juvenile white sharks (including YOYs) established that the likelihood of an ARGOS location (i.e., surface swimming behavior) from a tagged shark is not influenced by the local depth of the water column (Lyons et al., 2013). Thus, apparent YOY white shark propensity toward shallow coastal habitat, and in particular beach habitat, as indicated by SPOT tag ARGOS locations, is not explained by an increased likelihood for surface swimming in such environments.
YOY Relative Abundance
Tagged shark relative abundance (number of tagged sharks detected in a given zone) was interannually variable (range: 0–9 sharks per receiver per zone; Supplementary Figure 6). Across all years, relative abundance of tagged sharks correlated with the number of sharks tagged in each respective year. Similarly, the observed annual locations of zones displaying peak relative abundance largely reflected geographic concentration of tagging effort that year, where YOY white sharks formed loose aggregations. Tagging effort was in-turn largely concentrated in areas where juvenile white sharks had been sighted, and throughout the study, many of the sharks tagged within a given year were tagged within the same general vicinity, over a period of a few days to a few weeks. Thus, the geographic location of zones with peak densities showed broad, spatial interannual variability (see Figures 4, 8 and Supplementary Figure 6).
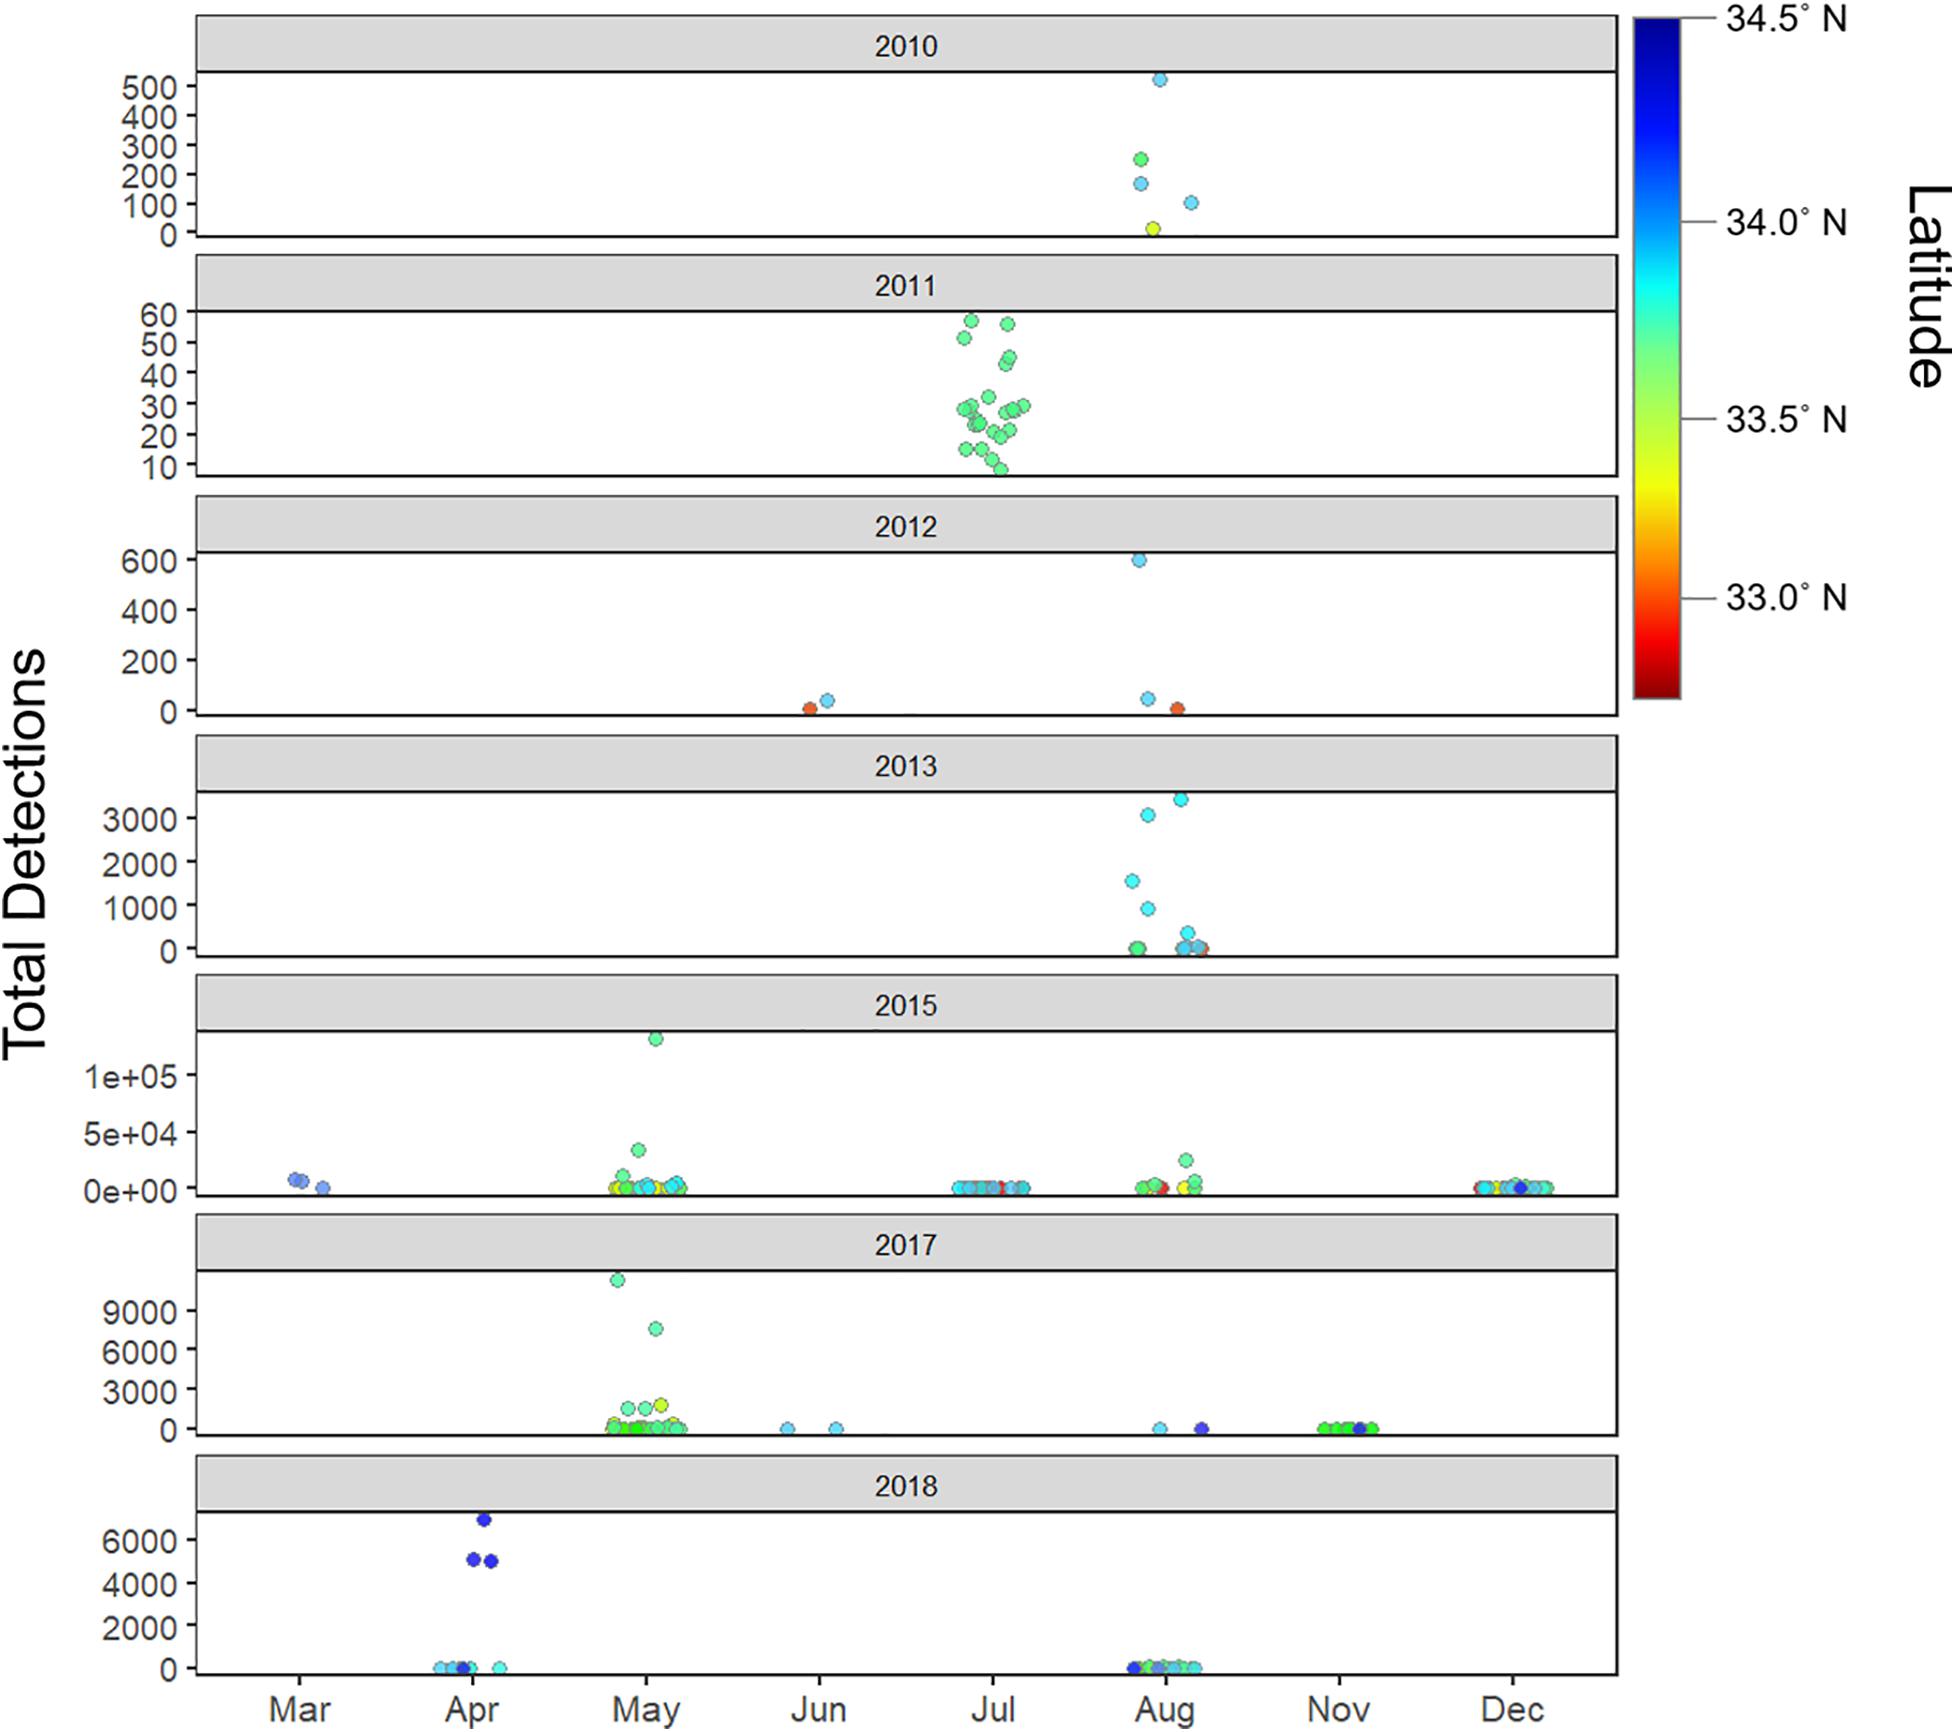
Figure 8. Total detections by year, latitude and month (seasons) – detection patterns show seasonality, and interannual latitudinal variability, with August serving as the month with peak overall detections across all years combined.
Peak relative abundance locations did not display the same temporal and spatial stability as has been described for primary nursery habitat elsewhere in this species’ range. Juvenile white sharks (n.b. not YOY) from the east Australia population have been documented to use two geographically separated areas in Port Stephens, New South Wales, and Corner Inlet, Victoria (∼852 km linear distance separation) as primary nursery habitat, with a possible third location further north in Queensland (Bruce and Bradford, 2012; Werry et al., 2012; Bruce et al., 2019). This, in itself, bears a resemblance to the broad patterns already described for the Northeast Pacific YOY and juvenile white shark population, with the highlighted importance of the SCB, and the identified specific nursery habitat in Bahía de Sebastián Vizcaíno separated by a similar linear distance. The locations of the Australia white shark primary nursery habitat were found to be temporally stable (showed interannual consistency), with juvenile white sharks utilizing the New South Wales habitat from September to January (spring to mid-summer), and the Victoria habitat from January to May (summer through the fall). A more recent analysis (although only one of the included animals was a YOY) further supported the finding that these same two geographic areas functioned as nursery habitat (Spaet et al., 2020b). However, Spaet et al. (2020b) found the geographic extent of each nursery area to be considerably larger, and the seasonality of habitat use in each location showed a shift from December to March, and November to February, respectively. This difference may be explained by sample size in the two studies (n = 22 vs n = 103) and size-class included [175–260 cm (median = 215 cm) vs 147–350 cm (median = 220 cm)], as well as interannual differences (biotic and abiotic) in each of the nursery areas.
YOY Residency
By definition (Heupel et al., 2007), neonate or YOY sharks utilizing nursery habitat display above average residency (site fidelity) to a specific area or location. The geographic extent of such an area may be species or population specific. In concert with YOY relative abundance, residency patterns were spatiotemporally variable at an annual level, with resident days peaking in the summer (May to August), but often with animals continuing to display residency throughout the fall. This temporal pattern differs to that previously reported in YOY white sharks (Weng et al., 2007b), in that peak residency shifted to earlier in the year in the second half of our study period. The seasonal timing of peak residency is likely influenced by plasticity of extrinsic variables [e.g., temperature, prey availability, atmospheric anomalies such as El Niño Southern Oscillations (ENSOs)], as well as the individual intrinsic factors that determine when an individual may arrive at a location (White et al., 2019). From 2010 through 2018 we observed zones of high residency in eight different broad geographic locations in southern California, with multiple YOY sharks displaying concurrent, comparatively high residency at these locations. In general (with exception of 2010, where receiver coverage was limited) RI values in zones of peak residency were an order of magnitude greater than the mean RI value for the respective year, and several orders of magnitude greater than the modal RI value (0.0002). This seasonal YOY residency in nearshore habitats, is not unique, rather it falls in line with descriptions of juvenile white sharks from elsewhere in the species range, including Australia, South Africa, as well as the northwest Atlantic (Bruce and Bradford, 2012; Werry et al., 2012; Dicken and Booth, 2013; Skomal et al., 2017; Curtis et al., 2018; Spaet et al., 2020b).
Peak Residency Locations and Space Use
What is perhaps more novel, and of importance from this study, is the proximity of many of these high YOY white shark residency zones to some of the most (human) frequented and densely populated beach areas within the species’ geographical range, and in the world (Tobler et al., 1995). While the two primary nursery habitat areas described in eastern Australia are also in close proximity to towns and cities (Bruce and Bradford, 2012; Werry et al., 2012), the extent of urbanization and the population density of these towns and cities compared to the southern California urban conurbation are strongly divergent. For example, 2010 census data for Redondo Beach, California (administrative area 16.09 km2), which was the approximate location for peak density and residency in 2012, reported a population density of 4156 people per km2 (United States Census Bureau, 2012). In contrast, Port Stephens (administrative area 979 km2) has a population density of 72 people per km2 (Australian Bureau of Statistics, 2016).
Fifty-two percent of calculated COA’s were situated within 200 m of the shoreline, and 82% within 300 m. With a (conservative) COA positional error 200 m used in core activity space estimations, our data show that when utilizing nearshore habitat, tagged YOY white sharks spend extended periods time in waters anywhere from the shore-break to 500 m offshore (Figure 7) and reflects spatially restricted residency in most individuals (range = 0.7–401.44 km2, mode = 1.34 km2). The comparatively high mean (±SE) activity space estimates for all animals combined (30.8 ± 19.3 km2) was likely driven by two more widely ranging individuals, that showed limited residency across more than one geographically separate area (Table 2). These two YOYs were sharks caught in gillnet fisheries (>5.5 km offshore), as opposed to being targeted and tagged (whether internally or externally) at an inshore location. Both were resident within monitored zones less than the median number of days for all animals included in activity space estimate analyses (43 days). The large activity space estimates of these two individuals are reflected in the large kernel utilization density plots (see Figures 7D,F), and are most likely representative of animals exhibiting transient or partial migratory behaviors, rather than resident, site affiliated behaviors generally displayed by YOY sharks tagged at inshore locations. Nonetheless, mean core activity space for all sharks combined is markedly smaller than that reported in western North Atlantic YOYs (Curtis et al., 2018). This disparity may reflect the availability and distribution of shallower shelf habitat. If YOY white sharks seek and select for such habitat type, there are simply more suitable habitat possibilities within the range of the North Atlantic YOYs, compared to that available in Northeast Pacific YOYs in southern California waters.
Environmental Drivers of YOY Relative Abundance and Residency
Juvenile white shark presence and residency has been shown to be significantly influenced by a range of biotic and abiotic variables across the species’ range, including temperature, depth, barometric pressure, and season (Weng et al., 2007b; Bruce and Bradford, 2012; Dicken and Booth, 2013; Skomal et al., 2017; Curtis et al., 2018; White et al., 2019; Spaet et al., 2020b). However, a recent analysis determined environmental factors to be poor predictors of juvenile white shark presence in eastern Australian beach habitat (Spaet et al., 2020a).
In the present study, none of the abiotic variables examined were found to have a consistent relationship with YOY relative abundance across years. However, of the variables examined, temperature and sea surface salinity were the most consistently identified drivers of shark presence, though the direction (positive or negative) and magnitude of the relationships varied. In the case of temperature, YOY densities were generally lower in conjunction with temperature extremes, with the exception of 2015 (an El Niño year – see Supplementary Figure 3). The resolution of remote sensing derived SST and salinity data do not show large temporal variation (i.e., monthly and seasonally) across southern California at a geographic meso-scale (for example across the expanse of SMB, or the LB-HB region; for reference see Figures 1, 7). It follows therefore that no discernable change could be observed at an individual zone level. Finer, micro-scale changes in temperature may be an important factor in the selection of specific habitat where sharks show residency, as YOY white sharks display limited endothermic capability, and may be sensitive to fractional changes in °C across the body (Domeier, 2012; White et al., 2019; Anderson et al., 2021). Our model results show that even with our inclusion of higher resolution point temperature data (where available), there are likely aspects of temperature that we were unable to quantify in our analyses.
Perhaps unsurprisingly, our models of environmental drivers of residency pointed to both temperature and month (ergo season) significantly influencing residence event duration. Our results are consistent with reported seasonal fishery captures in southern California (Lowe et al., 2012; Lyons et al., 2013), but also suggest that residence event duration was greatly subject to interannual variability, as well as intrinsic plasticity in individual animals.
Conclusion
A 2018 review of research priorities for white sharks highlighted the identification of critical habitats for the species and their changes across ontogeny as being of high importance (Huveneers et al., 2018). Our results demonstrate that unlike the spatiotemporally stable primary nursery habitat described for other populations globally, southern California presents a broader habitat resource that supports spatiotemporally dynamic primary nursery habitat. It is unknown where parturition occurs in the Northeast Pacific white shark population, but it is generally regarded to likely take place offshore or in deeper water, after which neonates make their way to more sheltered inshore environments (Klimley, 1985; Domeier, 2012). The data presented here demonstrate that in each year, YOY white sharks arrive at these nearshore (beach) locations, remaining within them for extensive periods (days to months), and that these locations can vary, or may be used repeatedly across years. Thus, they are not areas of temporary residency outside of primary habitat areas (Werry et al., 2012), but are in-fact dynamic primary nursery habitat in their own right. This dynamism appears to be a feature unique to Northeast Pacific YOY and juvenile white sharks utilizing the broader southern California nearshore habitats, as it has yet to be described elsewhere.
As with other stages of ontogeny, YOY white sharks likely exhibit behavioral patterns of temporary residency and traveling (Bruce and Bradford, 2008), moving between and stopping at discrete resource patches. It is likely these discrete patches form aggregation and residency “hotspots” for juvenile white sharks, including YOY sharks. Ninety-five percent of tagged YOY sharks exhibiting resident behavior were animals tagged as part of loose aggregations at inshore locations, while only 4 of the 14 fisheries-bycaught animals (29%) were included in our residency analyses. Sharks caught in offshore fisheries were likely in a transient or migratory behavioral state, at the time of capture, which appeared to largely continue post-release. While fisheries-caught sharks were detected in monitored zones, they largely did not display the site-fidelity and restricted activity spaces of YOY sharks tagged at inshore locations.
Standard approaches to discerning the resource qualities that drive nursery habitat selection can only arrive at broad scale parameters, that inadequately address these questions. It is clear that broad, meso-scale approaches to analyzing the environmental correlates of shark occurrence are insufficient. This conclusion is supported by recent analyses that found environmental conditions to be poor predictors of juvenile white shark occurrence in eastern Australia (Spaet et al., 2020a). Thus, novel approaches that incorporate technologies to derive high resolution environmental data (Lowe et al., 2018), paired with more comprehensive telemetry datasets (acoustic and satellite) are therefore required to facilitate accurate predictive modeling of white shark occurrence. Such data are vital for informing both conservation and management policy, at all administrative levels.
Data Availability Statement
The raw data supporting the conclusions of this article will be made available by the authors, without undue reservation.
Ethics Statement
The animal study was reviewed and approved by the CSU Long Beach Institutional Animal Care and Use Committee #364.
Author Contributions
CL, JA, and EB conceived the study. CL, EB, EM, TF, CW, RL, and CW tagged the sharks, collected the satellite and acoustic data. JA, EB, BS, EM, and TF organized and analyzed the data. JA, EB, EM, RL, TF, and CW created the main figures. JA drafted the manuscript. All authors contributed equally to manuscript revisions.
Funding
Funding for tagging and acoustic monitoring was provided by Monterey Bay Aquarium and AltaSea. Funding for data maintenance and analysis was provided by State of California. In kind support for tagging and monitoring was provided by Los Angeles and Orange County Lifeguards, Cities of Huntington Beach, Seal Beach, Ventura, Santa Barbara, Newport Beach, Laguna, Long Beach, and San Clemente. The authors declare that this study received funding from Alta Sea. The funder was not involved in the study design, collection, analysis, interpretation of data, the writing of this article or the decision to submit it for publication.
Conflict of Interest
CW was the Principal of the company Aquatic Research Consultants.
The remaining authors declare that the research was conducted in the absence of any commercial or financial relationships that could be construed as a potential conflict of interest.
Supplementary Material
The Supplementary Material for this article can be found online at: https://www.frontiersin.org/articles/10.3389/fmars.2021.645142/full#supplementary-material
References
Afonso, A. S., and Hazin, F. H. V. (2015). Vertical movement patterns and ontogenetic niche expansion in the tiger shark, Galeocerdo cuvier. PLoS One 10:e0116720. doi: 10.1371/journal.pone.0116720
Anderson, J. M., Spurgeon, E. A., Stirling, B. S., May, J. I., Rex, P. T., Hyla, B., et al. (2021). High resolution acoustic telemetry reveals swim speeds and inferred field metabolic rates in juvenile white sharks (Carcharadon carcharias). Commun. Biol. (in review).
Australian Bureau of Statistics (2016). 2016 Census Quick Stats. 2016 Census. Available online at: https://quickstats.censusdata.abs.gov.au/census_services/getproduct/census/2016/quickstat/LGA16400?opendocument (accessed October 30, 2020).
Bates, D., Mächler, M., Bolker, B., and Walker, S. (2011). lme4: Linear Mixed-Effects Models Using Eigen and S4. R Package Version 1.1–7.
Benson, J. F., Jorgensen, S. J., O’Sullivan, J. B., Winkler, C., White, C. F., Garcia−Rodriguez, E., et al. (2018). Juvenile survival, competing risks, and spatial variation in mortality risk of a marine apex predator. J. Appl. Ecol. 55, 2888–2897. doi: 10.1111/1365-2664.13158
Bradford, R., Patterson, T. A., Rogers, P. J., McAuley, R., Mountford, S., Huveneers, C., et al. (2020). Evidence of diverse movement strategies and habitat use by white sharks, Carcharodon carcharias, off southern Australia. Mar. Biol. 167, 96. doi: 10.1007/s00227-020-03712-y
Bruce, B. D., and Bradford, R. W. (2008). Spatial Dynamics and Habitat Preferences of Juvenile White Sharks – Identifying Critical Habitat and Options for Monitoring Recruitment. Final Report to the Department of the Environment, Water, Heritage and the Arts. Hobart, TAS: CSIRO Marine and Atmospheric Research.
Bruce, B. D., and Bradford, R. W. (2012). “Habitat use & spatial dynamics of juvenile white sharks, carcharadon carcharias, Eastern Australia,” in Global Perspectives on the Biology and Life History of the White Shark, ed. M. L. Domeier (New York, NY: CRC Press), 225–254.
Bruce, B. D., Harasti, D., Lee, K., Gallen, C., and Bradford, R. (2019). Broad-scale movements of juvenile white sharks Carcharodon carcharias in eastern Australia from acoustic and satellite telemetry. Mar. Ecol. Prog. Ser. 619, 1–15. doi: 10.3354/meps12969
Burns, E. S., Armstrong, J., Tang, D., Sakamoto, K., and Lowe, C. G. (2019). The residency, movement patterns and habitat association of several demersal fish species to the Orange County Sanitation District wastewater outfall. Mar. Pollut. Bull. 149:110638.
Bustamante, C., and Bennett, M. B. (2013). Insights into the reproductive biology and fisheries of two commercially exploited species, shortfin mako (Isurus oxyrinchus) and blue shark (Prionace glauca), in the south-east Pacific Ocean. Fish. Res. 143, 174–183.
Carlisle, A., Litvin, S., Hazen, E., Madigan, D., Goldman, K., Lea, R., et al. (2015). Reconstructing habitat use by juvenile salmon sharks links upwelling to strandings in the California Current. Mar. Ecol. Prog. Ser. 525, 217–228. doi: 10.3354/meps11183
Chapman, D. D., Feldheim, K. A., Papastamatiou, Y. P., and Hueter, R. E. (2015). There and Back Again: a review of residency and return migrations in sharks, with implications for population structure and management. Ann. Rev. Mar. Sci. 7, 547–570. doi: 10.1146/annurev-marine-010814-015730
Clevenstine, A. J., and Lowe, C. G. (2021). Aggregation site fidelity and movement patterns of the protected marine predator giant sea bass (Stereolepis gigas). Environ. Biol. Fishes (in press). doi: 10.1007/s10641-021-01057-z
Coffey, D. M., Carlisle, A. B., Hazen, E. L., and Block, B. A. (2017). Oceanographic drivers of the vertical distribution of a highly migratory, endothermic shark. Sci. Rep. 7:10434. doi: 10.1038/s41598-017-11059-6
Costa, D. P., Robinson, P. W., Arnould, J. P. Y., Harrison, A.-L., Simmons, S. E., Hassrick, J. L., et al. (2010). Accuracy of ARGOS locations of pinnipeds at-sea estimated using fastloc GPS. PLoS One 5:e8677. doi: 10.1371/journal.pone.0008677
Curtis, T. H., Metzger, G., Fischer, C., McBride, B., McCallister, M., Winn, L. J., et al. (2018). First insights into the movements of young-of-the-year white sharks (Carcharodon carcharias) in the western North Atlantic Ocean. Sci. Rep. 8:10794. doi: 10.1038/s41598-018-29180-5
Dewar, H., Domeier, M., and Nasby-Lucas, N. (2004). Insights into young of the year white shark, carcharodon carcharias, behavior in the southern california bight. Environ. Biol. Fishes 70, 133–143. doi: 10.1023/B:EBFI.0000029343.54027.6a
Dicken, M. L., and Booth, A. J. (2013). Surveys of white sharks (Carcharodon carcharias) off bathing beaches in Algoa Bay, South Africa. Mar. Freshw. Res. 64:530. doi: 10.1071/MF12336
Domeier, M. (2012). ““A new Life-History Hypothesis for White Sharks, Carcharodon carcharias, in the Northeastern Pacific,” in Global Perspectives on the Biology and Life History of the White Shark, ed. M. L. Domeier (Boca Raton, FL: CRC Press), 199–224. doi: 10.1201/b11532-19
Domeier, M. L., and Nasby-Lucas, N. (2013). Two-year migration of adult female white sharks (Carcharodon carcharias) reveals widely separated nursery areas and conservation concerns. Anim. Biotelem. 1:2. doi: 10.1186/2050-3385-1-2
Fox, J., and Weisberg, S. (2019). An R Companion to Applied Regression, 3rd edn, Thousand Oaks, CA: Sage Publications.
García-Rodríguez, E., and Sosa-Nishizaki, O. (2020). Artisanal fishing activities and their documented interactions with juvenile white sharks inside a nursery area. Aquat. Conserv. Mar. Freshw. Ecosyst. 2:aqc.3300. doi: 10.1002/aqc.3300
Harasti, D., Lee, K., Bruce, B., Gallen, C., and Bradford, R. (2017). Juvenile white sharks Carcharodon carcharias use estuarine environments in south-eastern Australia. Mar. Biol. 164:58. doi: 10.1007/s00227-017-3087-z
Heupel, M. R., Carlson, J. K., and Simpfendorfer, C. A. (2007). Shark nursery areas: Concepts, definition, characterization and assumptions. Mar. Ecol. Prog. Ser. 337, 287–297. doi: 10.3354/meps337287
Heupel, M. R., Simpfendorfer, C. A., and Hueter, R. E. (2004). Estimation of shark home ranges using passive monitoring techniques. Environ. Biol. Fishes 71, 135–142.
Hoyos-Padilla, E. M., Klimley, A. P., Galván-Magaña, F., and Antoniou, A. (2016). Contrasts in the movements and habitat use of juvenile and adult white sharks (Carcharodon carcharias) at Guadalupe Island, Mexico. Anim. Biotelem. 4:14. doi: 10.1186/s40317-016-0106-7
Hueter, R. E., Heupel, M. R., Heist, E. J., and Keeney, D. B. (2005). Evidence of philopatry in sharks and implications for the management of shark fisheries. J. Northwest Atl. Fish. Sci. 35, 239–247. doi: 10.2960/j.v35.m493
Huveneers, C., Apps, K., Becceri−Garcia, E. E., Bruce, B., Butcher, P. A., Carlisle, A., et al. (2018). Future research directions on the ‘elusive’ white shark. Front. Mar. Sci. 5:455. doi: 10.3389/fmars.2018.00455
Jewell, O. J. D., Wcisel, M. A., Gennari, E., Towner, A. V., Bester, M. N., Johnson, R. L., et al. (2011). Effects of smart position only (SPOT) tag deployment on white sharks carcharodon carcharias in south Africa. PLoS One 6:e27242. doi: 10.1371/journal.pone.0027242
Jorgensen, S., Chapple, T., Anderson, S., Hoyos, M., Reeb, C., and Block, B. (2012). “Connectivity among White shark coastal aggregation areas in the Northeastern pacific,” in Global Perspectives on the Biology and Life History of the White Shark, ed. M. Domeier (Boca Raton, FL: CRC Press), 159–167.
Kessel, S., Chapman, D., Franks, B., Gedamke, T., Gruber, S., Newman, J., et al. (2014). Predictable temperature-regulated residency, movement and migration in a large, highly mobile marine predator (Negaprion brevirostris). Mar. Ecol. Prog. Ser. 514, 175–190. doi: 10.3354/meps10966
Klimley, P. (1985). The aerial distribution and autoecology of the white shark, Carcharodon carcharias, off the west coast of North America. Mem. Calif. Acad. Sci. 9, 15–40.
Kuznetsova, A., Brockhoff, P. B., and Christensen, R. H. B. (2017). lmerTest Package: tests in linear mixed effects models. J. Stat. Softw. 82, 1–26. doi: 10.18637/jss.v082.i13
Logan, R., and Lowe, C. (2018). Residency and inter-reef connectivity of three gamefishes between natural reefs and a large mitigation artificial reef. Mar. Ecol. Prog. Ser. 593, 111–126. doi: 10.3354/meps12527
Logan, R. K., Vaudo, J. J., Sousa, L. L., Sampson, M., Wetherbee, B. M., and Shivji, M. S. (2020). Seasonal movements and habitat use of juvenile smooth hammerhead sharks in the western north atlantic ocean and significance for management. Front. Mar. Sci. 7:566364. doi: 10.3389/fmars.2020.566364
Logan, R. K., White, C. F., Winkler, C., Jorgensen, S. J., O’Sullivan, J. B., Lowe, C. G., et al. (2018). An evaluation of body condition and morphometric relationships within southern California juvenile white sharks Carcharodon carcharias. J. Fish Biol. 93, 842–849. doi: 10.1111/jfb.13785
Lowe, C., Blasius, M., Jarvis, E., Mason, T., Goodmanlowe, G., and O’Sullivan, J. (2012). “Historic Fishery interactions with white sharks in the southern california bight,” in Global Perspectives on the Biology and Life History of the White Shark, ed. M. Domeier (Boca Raton, FL: CRC Press), 169–186. doi: 10.1201/b11532-17
Lowe, C., White, C., and Clark, C. (2018). “Use of autonomous vehicles for tracking and surveying of acoustically tagged elasmobranchs,” in Shark Research. Emerging Technologies and Applications for the Field and Laboratory, eds J. Carrier, M. Heithaus, and C. Simpfendorfer (Boca Raton, FL: CRC Press).
Lyons, K., Jarvis, E. T., Jorgensen, S. J., Weng, K., O’sullivan, J., Winkler, C., et al. (2013). The degree and result of gillnet fishery interactions with juvenile white sharks in southern California assessed by fishery-independent and-dependent methods. Fish. Res. 147, 370–380. doi: 10.1016/j.fishres.2013.07.009
Lyons, K., and Wynne-Edwards, K. E. (2021). Sublethal, sex-specific, osmotic, and metabolic impairments in embryonic and adult round stingrays from a location exposed to environmental contamination in southern California, USA. Environ. Sci. Pollut. Res. doi: 10.1007/s11356-021-12546-0 [Epub ahead of print].
May, C., Meyer, L., Whitmarsh, S., and Huveneers, C. (2019). Eyes on the size: accuracy of visual length estimates of white sharks, Carcharodon carcharias. R. Soc. Open. Sci. 6:190456. doi: 10.1098/rsos.190456
Oh, B. Z. L., Thums, M., Babcock, R. C., Meeuwig, J. J., Pillans, R. D., Speed, C., et al. (2017). Contrasting patterns of residency and space use of coastal sharks within a communal shark nursery. Mar. Freshw. Res. 68:1501. doi: 10.1071/MF16131
Oñate-González, E. C., Sosa-Nishizaki, O., Herzka, S. Z., Lowe, C. G., Lyons, K., Santana-Morales, O., et al. (2017). Importance of bahia sebastian vizcaino as a nursery area for white sharks (Carcharodon carcharias) in the northeastern pacific: a fishery dependent analysis. Fish. Res. 188, 125–137. doi: 10.1016/j.fishres.2016.12.014
Pante, E., Benoit, S., and Irisson, J. (2019). marmap: Import, Plot and Analyze Bathymetric and Topographic Data.
Santana-Morales, O., Sosa−Nishizaki, O., Escobedo-Olvera, M., Onate-Gonzalez, E. C., O’Sullivan, J. B., and Cartamil, D. P. (2012). “Incidental catch and ecological observations of juvenile white sharks, carcharodon carcharias in Western Baja California, Mexico. Conservation implications,” inGlobal Perspectives on the Biology and Life History of the Great White Shark Research (Carcharodon carcharias), ed. M. L. Domeier (Boca Raton, FL: CRC Press), 187–198.
Schiff, K., Greenstein, D., Dodder, N., and Gillett, D. J. (2016). Southern California bight regional monitoring. Reg. Stud. Mar. Sci. 4, 34–46. doi: 10.1016/j.rsma.2015.09.003
Silva, I., Crane, M., Suwanwaree, P., Strine, C., and Goode, M. (2018). Using dynamic Brownian bridge movement models to identify home range size and movement patterns in king cobras. PLoS One 13:e0203449. doi: 10.1371/journal.pone.0203449
Simpfendorfer, C. A., Heupel, M. R., and Hueter, R. E. (2002). Estimation of short-term centers of activity from an array of omnidirectional hydrophones and its use in studying animal movements. Can. J. Fish. Aquat. Sci. 59, 23–32. doi: 10.1139/f01-191
Skomal, G., Braun, C., Chisholm, J., and Thorrold, S. (2017). Movements of the white shark Carcharodon carcharias in the North Atlantic Ocean. Mar. Ecol. Prog. Ser. 580, 1–16. doi: 10.3354/meps12306
Spaet, J. L. Y., Manica, A., Brand, C., Gallen, C., and Butcher, P. (2020a). Environmental conditions are poor predictors of immature white shark Carcharodon carcharias occurrences on coastal beaches of eastern Australia. Mar. Ecol. Prog. Ser. 653, 167–179. doi: 10.3354/meps13488
Spaet, J. L. Y., Patterson, T. A., Bradford, R. W., and Butcher, P. A. (2020b). Spatiotemporal distribution patterns of immature Australasian white sharks (Carcharodon carcharias). Sci. Rep. 10, 1–13. doi: 10.1038/s41598-020-66876-z
Speed, C., Field, I., Meekan, M., and Bradshaw, C. (2010). Complexities of coastal shark movements and their implications for management. Mar. Ecol. Prog. Ser. 408, 275–293. doi: 10.3354/meps08581
Speed, C. W., Meekan, M. G., and McMahon, C. R. (2012). Heat-seeking sharks: support for behaviouralthermoregulation in reef sharks. Mar. Ecol. Prog. Ser. 463, 231–245. doi: 10.3354/meps09864
Tamburin, E., Hoyos-Padilla, M., Sánchez-González, A., Hernández-Herrera, A., Elorriaga-Verplancken, F. R., and Galván-Magaña, F. (2019). New nursery area for white sharks (Carcharodon carcharias) in the Eastern Pacific Ocean. Turkish J. Fish. Aquat. Sci. 20, 325–329. doi: 10.4194/1303-2712-v20_4_08
Tobler, W., Deichmann, U., Gottsegen, J., and Maloy, K. (1995). The Global Demography Project (Natl. Center for Geographic Information and Analysis, Univ. California, Santa Barbara). Technical Report: 95-96.
Udyawer, V., Dwyer, R. G., Hoenner, X., Babcock, R. C., Brodie, S., Campbell, H. A., et al. (2018). A standardised framework for analysing animal detections from automated tracking arrays. Anim. Biotelem. 6:17. doi: 10.1186/s40317-018-0162-2
United States Census Bureau (2012). 2010 Census of Population & Housing. Redon. Beach (city), Calif. Available online at: http://quickfacts.census.gov/qfd/states/06/0660018.html (accessed October 30, 2020).
Vandeperre, F., Aires-da-Silva, A., Lennert-Cody, C., Serrão Santos, R., and Afonso, P. (2016). Essential pelagic habitat of juvenile blue shark (Prionace glauca) inferred from telemetry data. Limnol. Oceanogr. 61, 1605–1625. doi: 10.1002/lno.10321
Weng, K., O’Sullivan, J., Lowe, C., Winkler, C., Blasius, M., Loke-Smith, K., et al. (2012). “Back to the wild,” in Global Perspectives on the Biology and Life History of the White Shark, ed. M. Domeier (Boca Raton, FL: CRC Press), 419–446. doi: 10.1201/b11532-32
Weng, K. C., Boustany, A. M., Pyle, P., Anderson, S. D., Brown, A., and Block, B. A. (2007a). Migration and habitat of white sharks (Carcharodon carcharias) in the eastern Pacific Ocean. Mar. Biol. 152, 877–894. doi: 10.1007/s00227-007-0739-4
Weng, K. C., O’Sullivan, J. B., Lowe, C. G., Dewar, H., Winkler, C., and Block, B. A. (2007b). Movements, behavior and habitat preferences of juvenile white sharks Carcharodon carcharias in the eastern Pacific. Mar. Ecol. Prog. Ser. 338, 211–224. doi: 10.3354/meps338211
Werry, J., Bruce, B., Sumpton, W., Reid, D., and Mayer, D. (2012). “Beach areas used by juvenile white shark, carcharodon carcharias, in Eastern Australia,” in Global Perspectives on the Biology and Life History of the White Shark, ed. M. L. Domeier (Boca Raton, FL: CRC Press), 271–286. doi: 10.1201/b11532-22
White, C. F., Lyons, K., Jorgensen, S. J., O’Sullivan, J., Winkler, C., Weng, K. C., et al. (2019). Quantifying habitat selection and variability in habitat suitability for juvenile white sharks. PLoS One 14:e0214642. doi: 10.1371/journal.pone.0214642
Wolfe, B. W., and Lowe, C. G. (2015). Movement patterns, habitat use and site fidelity of the white croaker (Genyonemus lineatus) in the Palos Verdes Superfund Site, Los Angeles, California. Mar. Environ. Res. 109, 69–80. doi: 10.1016/j.marenvres.2015.06.002
Keywords: Carcharodon carcharias, nursery habitat dynamics, residency, young-of-the-year, space use
Citation: Anderson JM, Burns ES, Meese EN, Farrugia TJ, Stirling BS, White CF, Logan RK, O’Sullivan J, Winkler C and Lowe CG (2021) Interannual Nearshore Habitat Use of Young of the Year White Sharks Off Southern California. Front. Mar. Sci. 8:645142. doi: 10.3389/fmars.2021.645142
Received: 22 December 2020; Accepted: 23 February 2021;
Published: 16 March 2021.
Edited by:
J. Marcus Drymon, Mississippi State University, United StatesReviewed by:
Matthew Ajemian, Florida Atlantic University, United StatesCharlie Huveneers, Flinders University, Australia
Copyright © 2021 Anderson, Burns, Meese, Farrugia, Stirling, White, Logan, O’Sullivan, Winkler and Lowe. This is an open-access article distributed under the terms of the Creative Commons Attribution License (CC BY). The use, distribution or reproduction in other forums is permitted, provided the original author(s) and the copyright owner(s) are credited and that the original publication in this journal is cited, in accordance with accepted academic practice. No use, distribution or reproduction is permitted which does not comply with these terms.
*Correspondence: James M. Anderson, amFtZXMuYW5kZXJzb25AY3N1bGIuZWR1