 Guoqing Han
 Changming Dong
 Jingsong Yang3
 Joel Sommeria
 Rui M. A. Caldeira
- 1School of Marine Sciences, Nanjing University of Information Science and Technology, Nanjing, China
- 2Southern Marine Science and Engineering Guangdong Laboratory (Zhuhai), Zhuhai, China
- 3State Key Laboratory of Satellite Ocean Environment Dynamics, Second Institute of Oceanography, Ministry of Natural Resources, Hangzhou, China
- 4Laboratoire des Ecoulements Géophysiques et Industriels (LEGI), Université Grenoble Alpes, CNRS, Grenoble, France
- 5Laboratoire de Metéorologie Dynamique, École Polytechnique, Palaiseau Cedex, France
- 6Agência Regional para o Desenvolvimento da Investigação Tecnologia e Inovação, Observatório Oceânico da Madeira (OOM), Funchal, Portugal
Using the 13 m diameter LEGI-Coriolis rotating platform, the evolution processes of a generated anticyclonic eddy throughout its lifecycle are analyzed. Experimental results have shown that the eddy lasted for approximately 3T0, where T0 is the rotating period of 90 s. After T = 0.3T0, the eddy enters its mature phase, whereby following this event, eddy intensity slowly decreases from its maximum rotation speed. By T = 2.6T0, the eddy enters a stage of rapid weakening. In its decay period, two underlying mechanisms for this decay have been identified as inertial instability and eddy–eddy interactions.
Introduction
The presence of islands significantly affects the surrounding hydrological environment, especially with regards to the physical processes occurring in the lee of the island (Coutis and Middleton, 2002; Doglioli et al., 2004; Neill and Elliott, 2004; Caldeira et al., 2005; Dong et al., 2007, 2018; Han et al., 2019). Island wake eddies are one of the most common dynamic processes in the island wake region. Island wakes can be further differentiated into two types based on their vorticity generation mechanisms: deep-water and shallow-water island wakes (Tomczak, 1988; Dong et al., 2007, 2018). The difference between shallow-water and deep-water island wakes (with/without the shelf-slope) is the source of vorticity (i.e., lateral horizontal gradients, bottom stress irregularity, and tilting of the baroclinic flow). If the primary vorticity source comes from the lateral stress gradient, the island wake is considered deep-water; when the bottom stress irregularity is dominant, the wake is shallow-water, where the horizontal vorticity can be tilted into the vertical component through baroclinic processes.
Previous studies show that the shedding of eddies tends to be inhibited by increasing rotation rate (e.g., Boyer and Davies, 1982; Page, 1985; Heywood et al., 1996). At different background rotation frequencies (i.e., β≠ 0), the wake can develop a standing Rossby wave structure (McCartney, 1975), and the flow separation and eddy formation are affected by the direction of the incident current with respect to the wave propagation (e.g., Johnson and Page, 1993; Tansley and Marshall, 2001). The proposed mechanisms of eddy decaying include damping by ocean bottom drag (Sen et al., 2008; Arbic et al., 2009) and sea surface wind stresses (Duhaut and Straub, 2006; Hughes and Wilson, 2008), generating lee-waves over small-scale bottom topography (Marshall and Garabato, 2008; Sheen et al., 2014), radiating near-inertial waves through loss of balance (Molemaker et al., 2005; Alford et al., 2013), and instability processes in eddies (Lazar et al.,2013a,b).
Following eddy generation in an island’s lee, the eddy could experience instability. Eddy inertial instability is due to a centrifugal instability mechanism as originally proposed by Rayleigh (1916) where in the presence of the Coriolis force when there is an imbanlance between the centrifugal and Coriolis forces, in addition to the radial pressure gradient. As previously highlighted by Dong et al. (2007); Kloosterziel et al. (2007) and Lazar et al. (2013a, b), inertial instability plays a crucial role in the decaying process of eddies in island wakes. For a steady, cylindrical, inviscid rotating fluid, the rotation rate V(r) is unstable when the absolute angular momentum (L = V⋅r) decreases with the increase of radius r in some parts of the fluid.
In addition to inertial instability processes, eddy–eddy interactions also play a crucial role in eddy evolution, especially in decaying processes. Fang and Morrow (2003) investigate the characteristics of eddies in the Leeuwin Current, finding that eddy interaction with topography can induce splitting or merging which further affects eddy decay. Eddies generated from different processes may coalesce and form a single eddy due to complicated eddy–eddy interactions (Dritschel and Waugh, 1992; Nan et al., 2011; Cui et al., 2019). Zhai et al. (2010) model a random sea of westward-propagating eddies and in that simulation, it is demonstrated that eddies interact with one another and cascade to larger scales through the merging of eddies of the same parity and finally dissipate near the western boundary. de Marez et al. (2020) present an analysis of merging events in the global ocean that are influenced by the β-effect and the presence of neighboring eddies.
According to the literature review, one can see that the eddy decaying process is very complicated and requires further investigation. To further our understanding of the decaying processes of anticyclonic eddies, we conduct a series of laboratory experiments to investigate the roles of both inertial instability and eddy–eddy interaction in the eddy dissipation. Using the 13-m diameter (world’s largest) LEGI-Coriolis rotating platform, we conducted a series of island wake simulation experiments. In a strongly stratified experiment, the evolution processes of a generated anticyclonic eddy are analyzed throughout its lifecycle. The decaying period of this anticyclonic eddy can be divided into two parts: slow decay period and rapid decaying period. This study reveals the influence of inertial instability and eddy–eddy interaction on the anticyclonic’s cycle evolution from the perspective of laboratory observation.
The rest of the paper is organized as follows: section “Experimental Settings and Method” describes the experimental settings and the eddy detection method. In section “Results,” the statistical characteristics and decaying mechanism of an identified anticyclonic are analyzed. Section “Conclusion and Discussion” is the conclusion and discussion.
Experimental Settings and Method
Experimental Settings
We conduct a series of laboratory experiments on island wakes in the currently world’s largest rotating tank, the LEGI-Coriolis rotating tank that possess a diameter of 13 m and a depth of 1.2 m. Parts of the laboratory experimental results have been analyzed and led to publications (Lazar et al.,2013a,b). We conducted many island wake simulation experiments in the LEGI-Coriolis platform, and only a few experiments have found the eddy–eddy interaction phenomena.
To mimic the oceanic density stratification we used salt stratification. We first filled the tank with a deep (∼50 cm) salty layer, ρbottom=1,040 gl−1. Due to the slow Ekman recirculation, it took 1 day for this thick layer to reach a solid body rotation. We then used the double bucket technique (Oster, 1965) to create a thin surface layer with linear stratification. To avoid residual motions it was then necessary to wait at least one to 2 h between consecutive experiments. The configuration of the laboratory experiments is shown in Figures 1A,B. We used a conductivity and temperature profiler (125MicroScale)1 to accurately measure the vertical density profile Figure 1C. In the present study, an anticyclonic eddy (A0) is identified from the series of laboratory experiments and used for the investigation of the underlying mechanisms for the eddy decaying processes.
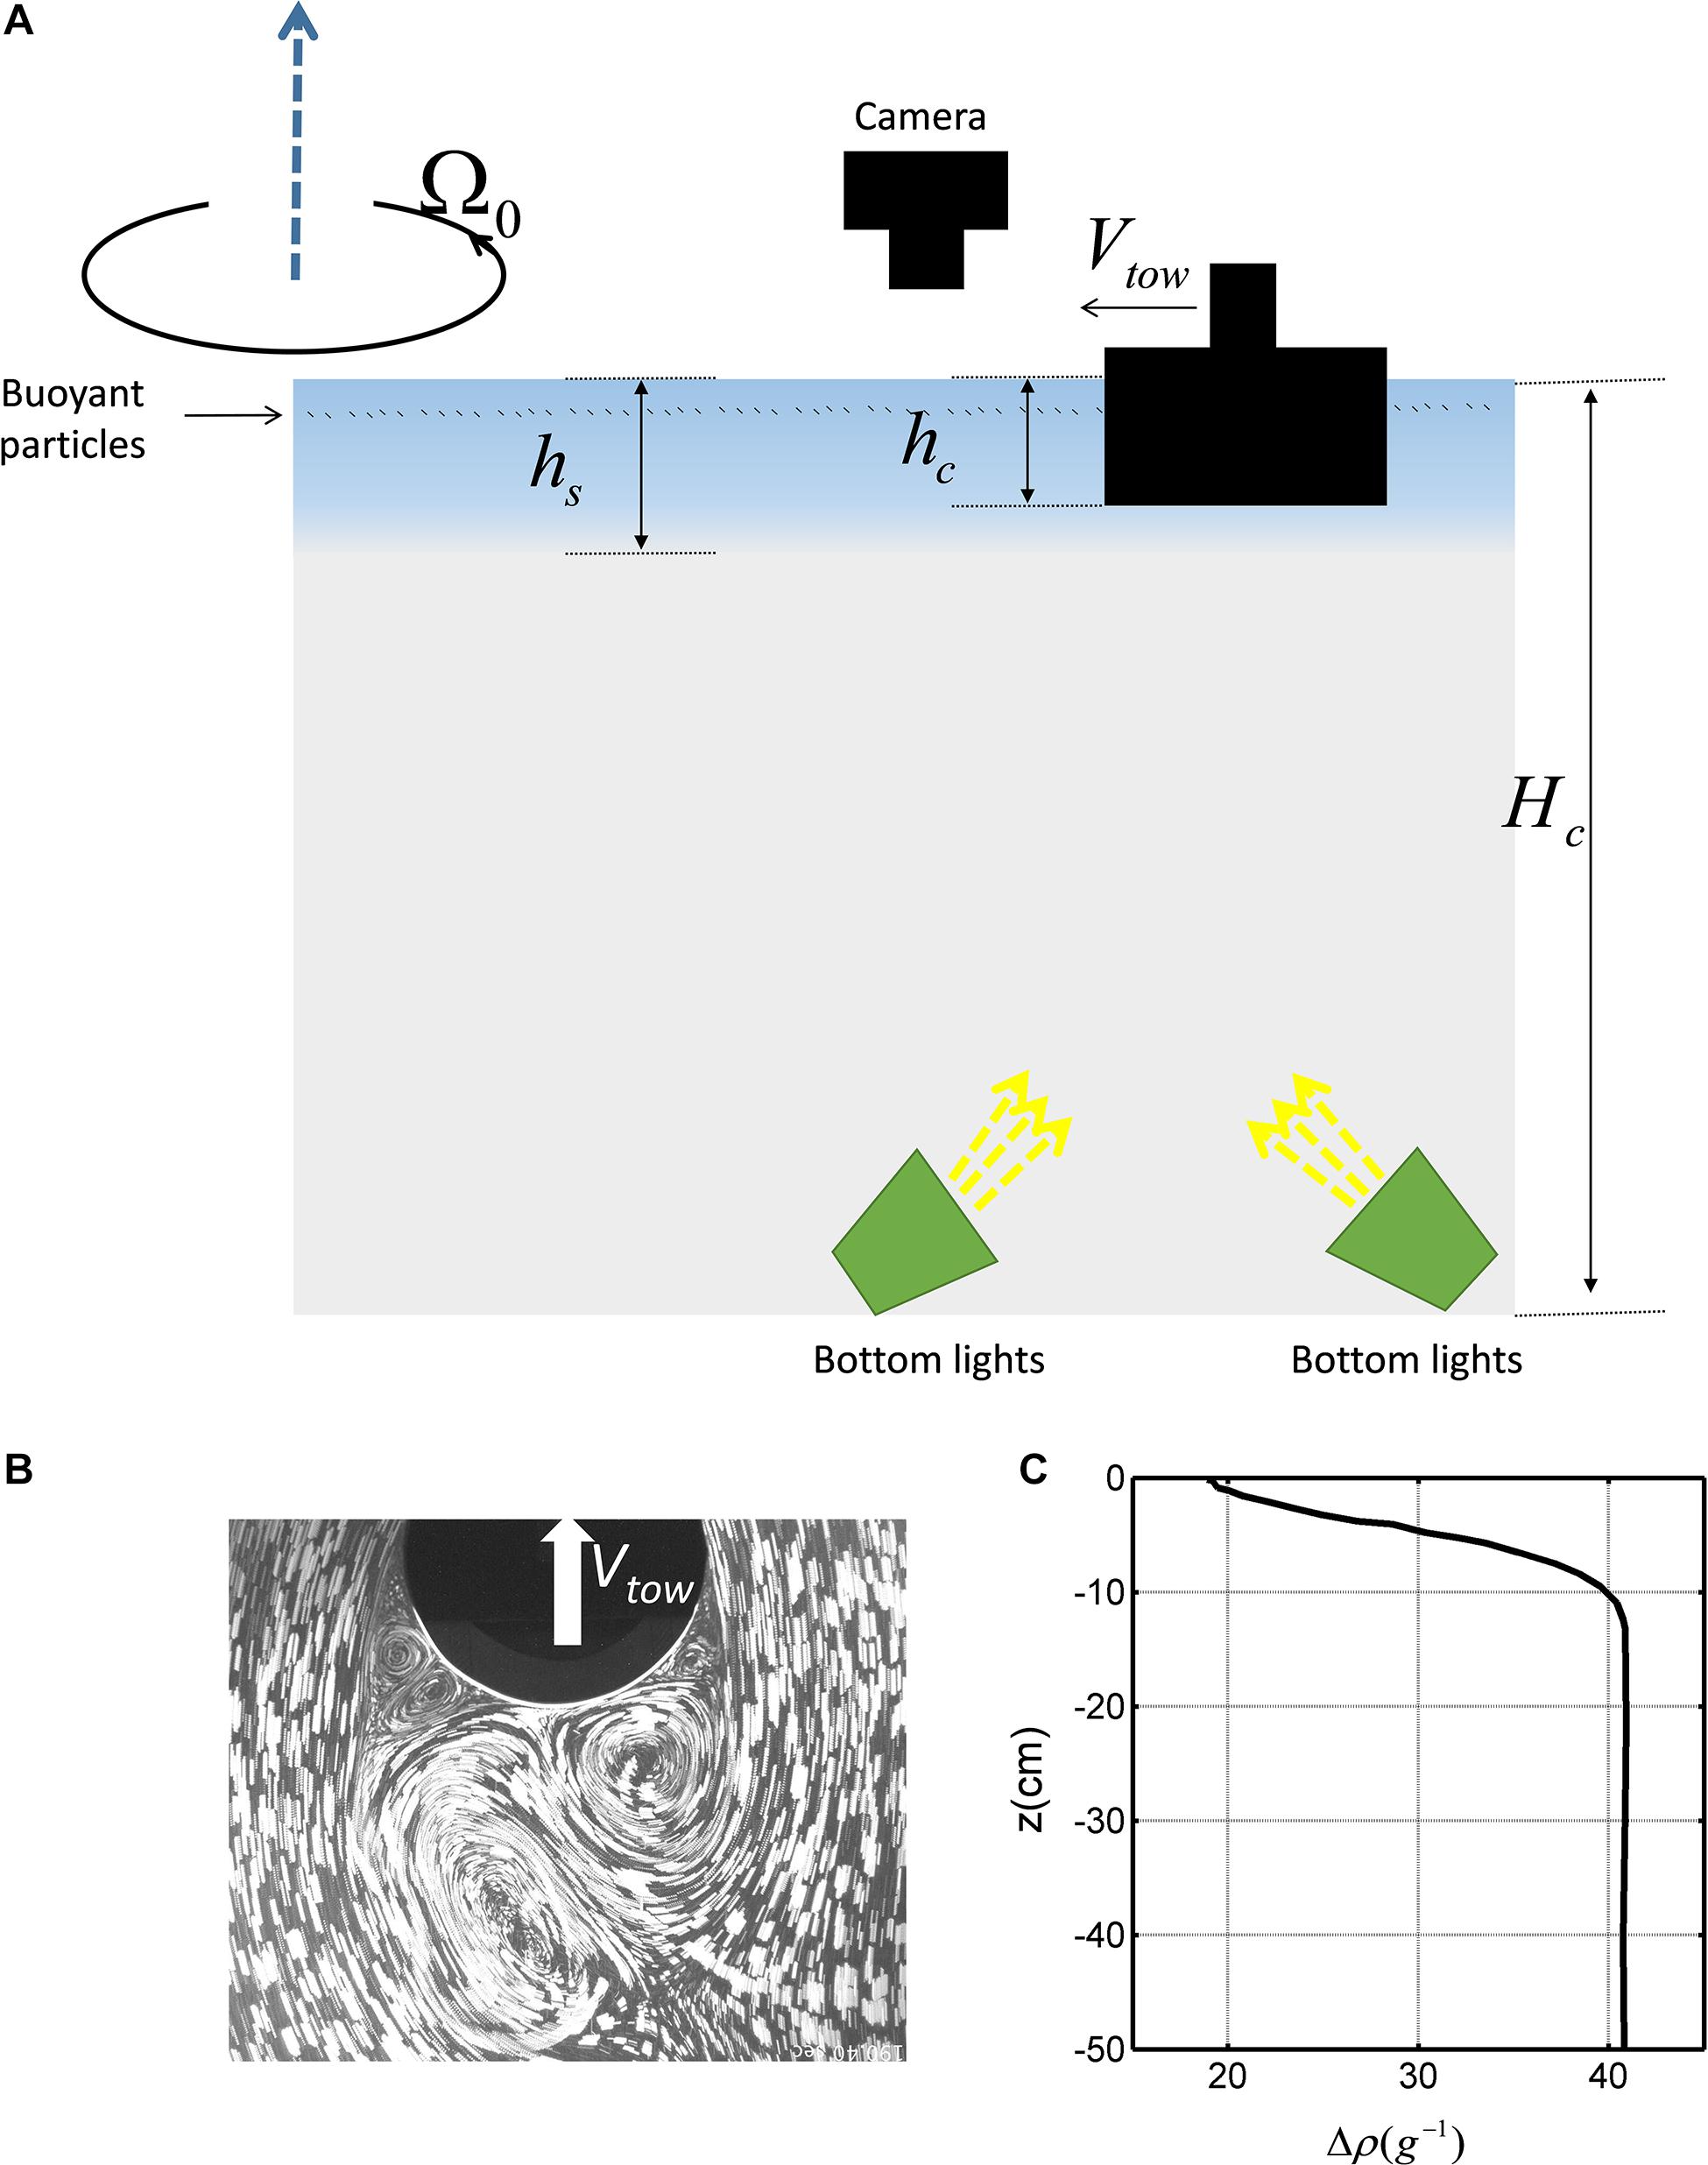
Figure 1. (A) Side view of the experimental setup, (B) top view of the particle visualization of the surface wake, and (C) a typical density anomaly induced by salinity stratification.
The rotating platform rotates counter-clockwise, and the corresponding Coriolis parameter is:
where f is the Coriolis parameter, T0 is the rotating period (T0 = 90 s), ω is the angular velocity. We used a cylinder with a diameter of 25 cm and a towing speed of 4 cm/s to mimic ocean circulation interacting with a cylindrical island. In this experiment, we produce intense eddies in a shallow strongly stratified (N/f = 10) layer at high Reynolds numbers (Re = 10,000) (avoiding excessive dissipation). Generally, for high Reynolds number eddies, the nonlinear evolution of three-dimensional inertial perturbations induces a redistribution of the angular momentum (Kloosterziel et al., 2007; Carnevale et al., 2011). However, for a strong stratification, the redistribution of angular momentum is weak and barely affects the velocity profile (Kloosterziel et al., 2007; Lazar et al., 2013b).
The surface stratification layer (hs) is 6.7 cm. The height of the cylinder (hc) is slightly smaller than hs. We assume that the cylinder (i.e., island) mainly transfers momentum in the upper stratified layer, Hence, the dynamic state is mainly the first baroclinic mode (thus, the barotropic mode can be ignored). This is true in the case of hs≈hc << Hc (Hc represent the depth of the flow) as demonstrated by Perret et al. (2006) and Teinturier et al. (2010). The deformation radius of the first baroclinic mode is defined as and the value of Rd = 68 cm is larger than the eddies’ radius. The Burger number () is 28.88 and the Rossby number () is 2.29. Rd is larger than A0’s radii, and much smaller than the barotropic radius (, Hc∼1 m in our experiment, g is the gravity). Therefore, the barotropic mode is ignored in our study. Perret et al. (2006); Lazar et al. (2013b), and Stegner (2014) showed, for baroclinic island wake laboratory experiments, that the isopycnal displacement is inversely proportional to the Burger number, which is quite large, and directly proportional to the Rossby number, which in our experiments is moderate. Therefore, the displacement of the isopycnal interface between the thin stratified layer and the deep barotropic layer is expected to be small or moderate. The main parameters of this experiment are listed below in Table 1.
Table 1. Experimental settings.
In our experiment, the effective measuring area is 2 m⋅2 m. To perform quantitative velocity measurements we used several powerful waterproof lamps to illuminate small plastic particles of a buoyancy corresponding to 5–10 mm below the surface. To enhance the contrast, the bottom of the platform was painted black. We used two 1,024 × 1,024 pixels CCD cameras to record the particle motions. The surface velocities were analyzed using uvmat software (a PIV software used in the LEGI-Coriolis platform)2. The spatial resolution of velocities is 1 cm, which is enough to use for our study (the generated eddy is nearly equal to the Risland, Risland = 12.5 cm).
Angular Momentum Eddy Detection and Tracking Algorithm
In the present study, we apply an eddy detection tracking algorithm (Angular Momentum Eddy Detection and Tracking Algorithm, AMEDA), developed by Le Vu et al. (2018). AMEDA improves upon a hybrid algorithm originally proposed by Mkhinini et al. (2014), and combines a physical parameter, the local normalized angular momentum (LNAM), with the geometric characteristics of streamlines to determine the center and dynamic characteristics of eddies. LNAM will be maximized at the center of the eddy, that is, the center of swirling motion G_i. For each grid point G_i, the LNAM value can be calculated according to the following equation:
where Xj and Vj are the position and velocity vector, on a grid point neighbor of Gi.
The selected vortex center is the extremum of the region where [|LNAM|(LOW < 0)]≥K = 0.7, where K is a selected threshold and LOW is the local Okubo-Weiss (OW) parameter. In addition, only when there is a closed streamline outside the selected extreme value can it be left as the center of the vortex.
For each closed streamline around the center of the vortex, the radius corresponding to the circle is equal to the square root of the area corresponding to the closed streamline:
The average velocity can be calculated by the integral along the closed streamline:
where Lp is the circumference of the closed streamline. Through this method, the maximum average velocityVmax = max(⟨V⟩) can be obtained and corresponds to the radius Rmax, that is to say⟨V⟩(r = Rmax) = Vmax. The closed streamline corresponding to Vmax serves as the boundary of the eddy.
In this study, we also use the OW parameter to detect the eddies. The OW parameter evaluates the relative amplitude between the local deformation and local rotation. The eddy center is dominated by vorticity and the negative values of the OW parameter are expected in the core of the eddy. However, the OW parameter is quite sensitive to the threshold value used to identify and characterize the eddy boundary when quantifying eddy intensity. On the one hand, weak eddies could be excluded, while on the other hand, intense eddies could lead to multiple contours. Moreover, the geometry of the OW contours could strongly differ from the geometry of the velocity vector field. In our case, when T > 2.93T0, we cannot find A0’s closed streamline. As AMEDA can only be used in eddy detection when closed streamlines are present, the algorithm can no longer be used and thus instead, we used the OW parameter to define the position and shapes of the eddy to examine the eddy–eddy interaction in the end stage of A0.
Results
Evolution of an Anticyclonic Eddy
We conducted a series of island wake experiments in the LEGI-Coriolis platform, and only a few experiments yielded the eddy–eddy interaction phenomena. In the present study, the anticyclonic eddy A0 is the only one whose whole lifetime was observed in the experiments. In this laboratory experiment, when the cylinder (the ideal island) is towed azimuthally through the water surface layer, cyclonic-anticyclonic eddy pairs are generated on the leeward side of the island (Figure 1B). Three pairs of cyclonic and anticyclonic eddies are detected, shown in Figure 2f. To better show the results, we do not show all three pairs in other panels of Figure 2. In Figure 2f, C1 and A1 represent a pair of cyclonic and anticyclonic eddies generated before A0 and C0 are generated, respectively, C2 and A2 are another pair of cyclonic and anticyclonic eddies, respectively, after A0 and C0 are generated. In the present study, we focus on the anticyclonic eddy A0 because the experiment encapsulates the complete eddy lifecycle.
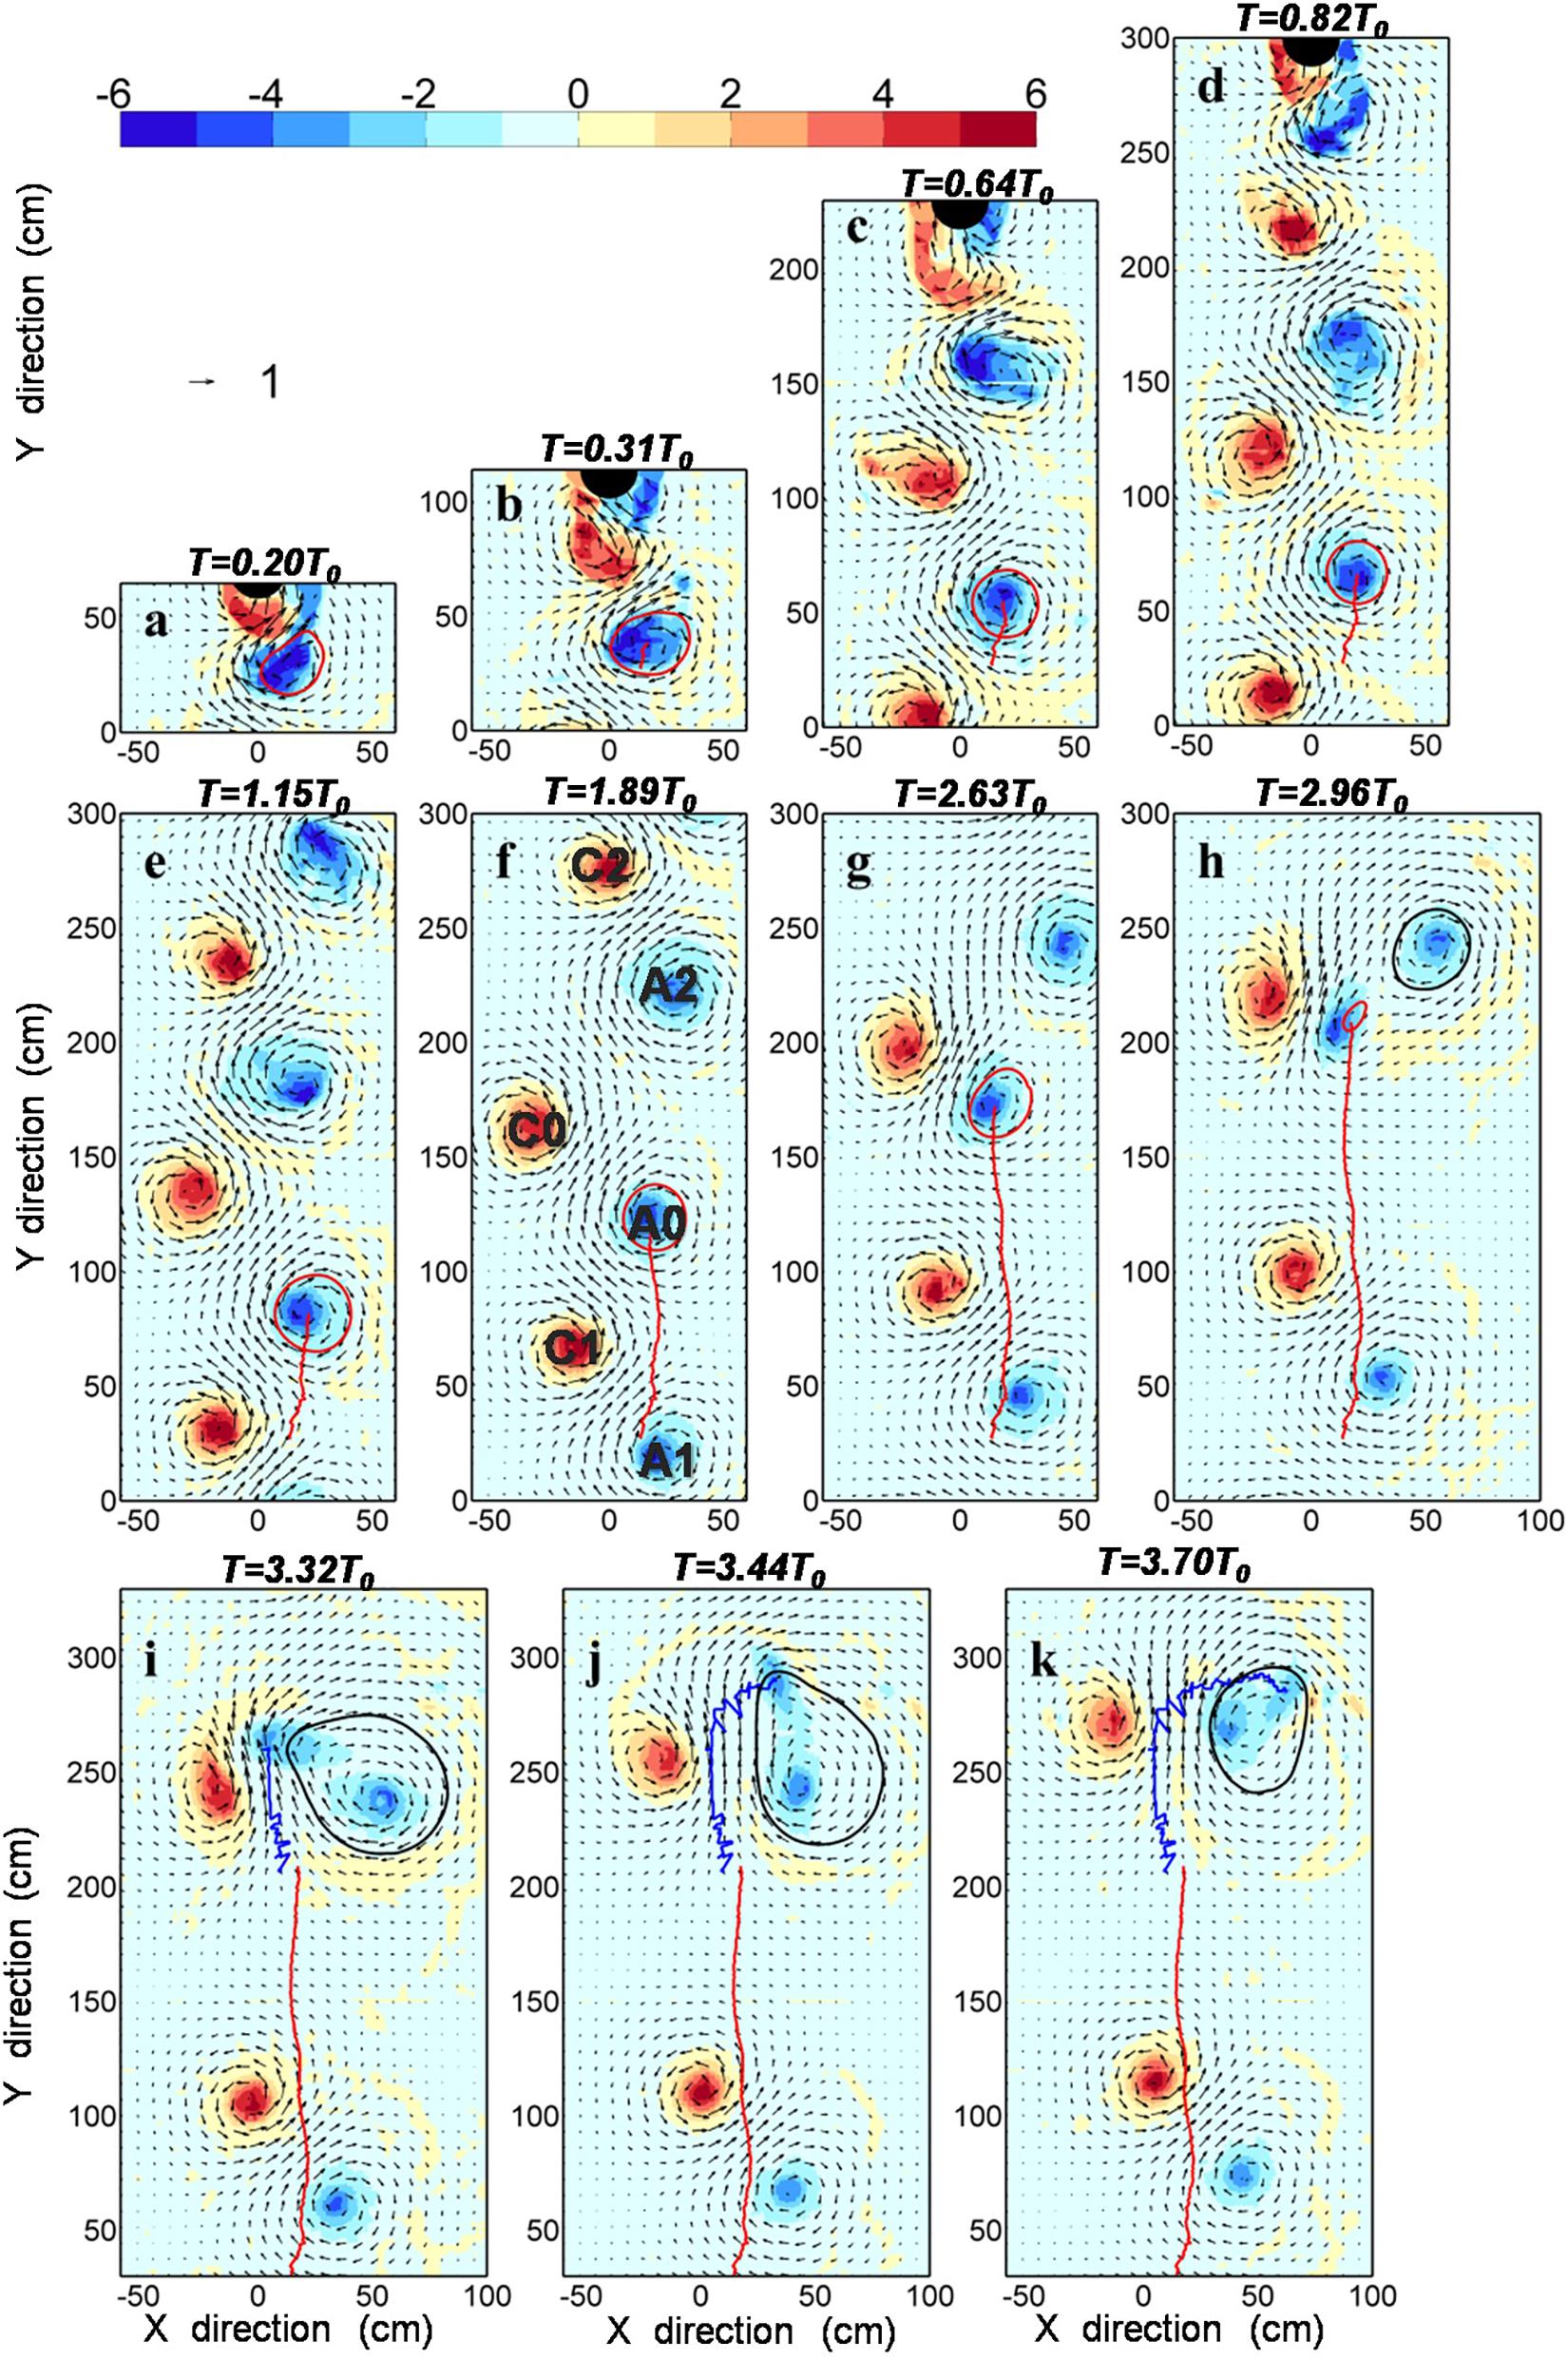
Figure 2. Time evolution of the anticyclonic eddy A0. Shading represents relative vorticity and vectors represent relative velocity. Panels (a–k) correspond to different times. Red circles (a–h) represent the shapes of anticyclonic eddy A0. The red solid line indicates the tracks of A0. Black circles (h–k) represent the shapes of anticyclonic eddy A2. The blue solid lines (i–k) indicate the moving path of the maximum negative vorticity value after A0 disappears.
Figure 2 shows a complete life evolution process of an anticyclonic eddy, denoted as A0. The vectors in Figure 2 represent the normalized velocity (Vn) which is the water particles velocity (V) relative to the cylinder moving velocity (Vtow), and normalized by Vtow: Vn = V/Vtow. The color in Figure 2 represents the relative vorticity ζn (ζn = ζ/f, ζ = ∂xv−∂yu, u and v are the x-direction and y-direction components of Vn, respectively.).
The red circles denote the boundaries of the anticyclonic eddy A0, and the red solid lines are the tracks of A0. When the cylinder is towed through y = 0, the time is recorded as T = 0. During the early stage of the formation of A0 (Figures 2a–b), its elliptical shape becomes unstable. As time progresses, the form of A0 develops into a regular circle and moves to the positive y-direction (Figures 2c–g).
The size of A0 does not noticeably change, but its vorticity decreases gradually (inertial instability to be discussed later). However, in the late stage of A0 (Figure 2h), after being affected by the C0 cyclonic eddy (i.e., eddy–eddy interaction), its size rapidly decreases, inducing significant eddy-core deformation. Moreover, its translation speed in the y-direction accelerates, approaching C0 (Figure 2f–h). Thereafter, the anticyclonic eddy, A0, is severely deformed. In a later stage, the A0 anticyclonic eddy is strongly affected by another anticyclonic eddy (A2), causing further deformation. Although there is still negative vorticity at its core, no closed streamlines can be drawn and thus no significant vorticity can be measured for A0.
As shown in Figures 2i–k, A0 is wrapped around A2 in a clockwise manner, as can be observed in the vorticity field. From the closed streamline drawn in Figures 2i–k, it can be seen that A0 and A2 tend to merge to form another anticyclonic, significantly increasing A2’s size.
Under the influence of C0, the combined eddy A2 (merged with A0) is irregular in shape and stretches significantly in the direction of C0. At the time T = 3.70 T0, the last record for the A0, the A0 is almost completely merged into A2.
To better understand the life evolution process of the anticyclonic eddy A0, the azimuthal averaged relative velocity and relative vorticity profiles of A0 at four-time steps (T = 0.31T0, 1.15T0, 1.89T0, and 2.78T0) are presented in Figure 3. Figure 3A shows that at T = 0.31T0, Vn reaches a maximum value of 0.89 during its whole lifetime. The radius corresponding to the maximum speed is 1.25, which is normalized by the radius of the cylinder (12.5 cm). The eddy radius is defined as the distance between the location of the maximum speed and eddy center, as shown in section “Angular Momentum Eddy Detection and Tracking Algorithm.” It is observed that A0’s speed and its radius both decrease with time. The vorticity normalized by f near the center of A0 can reach −5.3 at T = 0.3T0, accompanied by a sharp vorticity gradient (Figure 3B). As time progress, the relative vorticity decreases, and the vorticity profiles of A0’s asymptote to a maximum value.
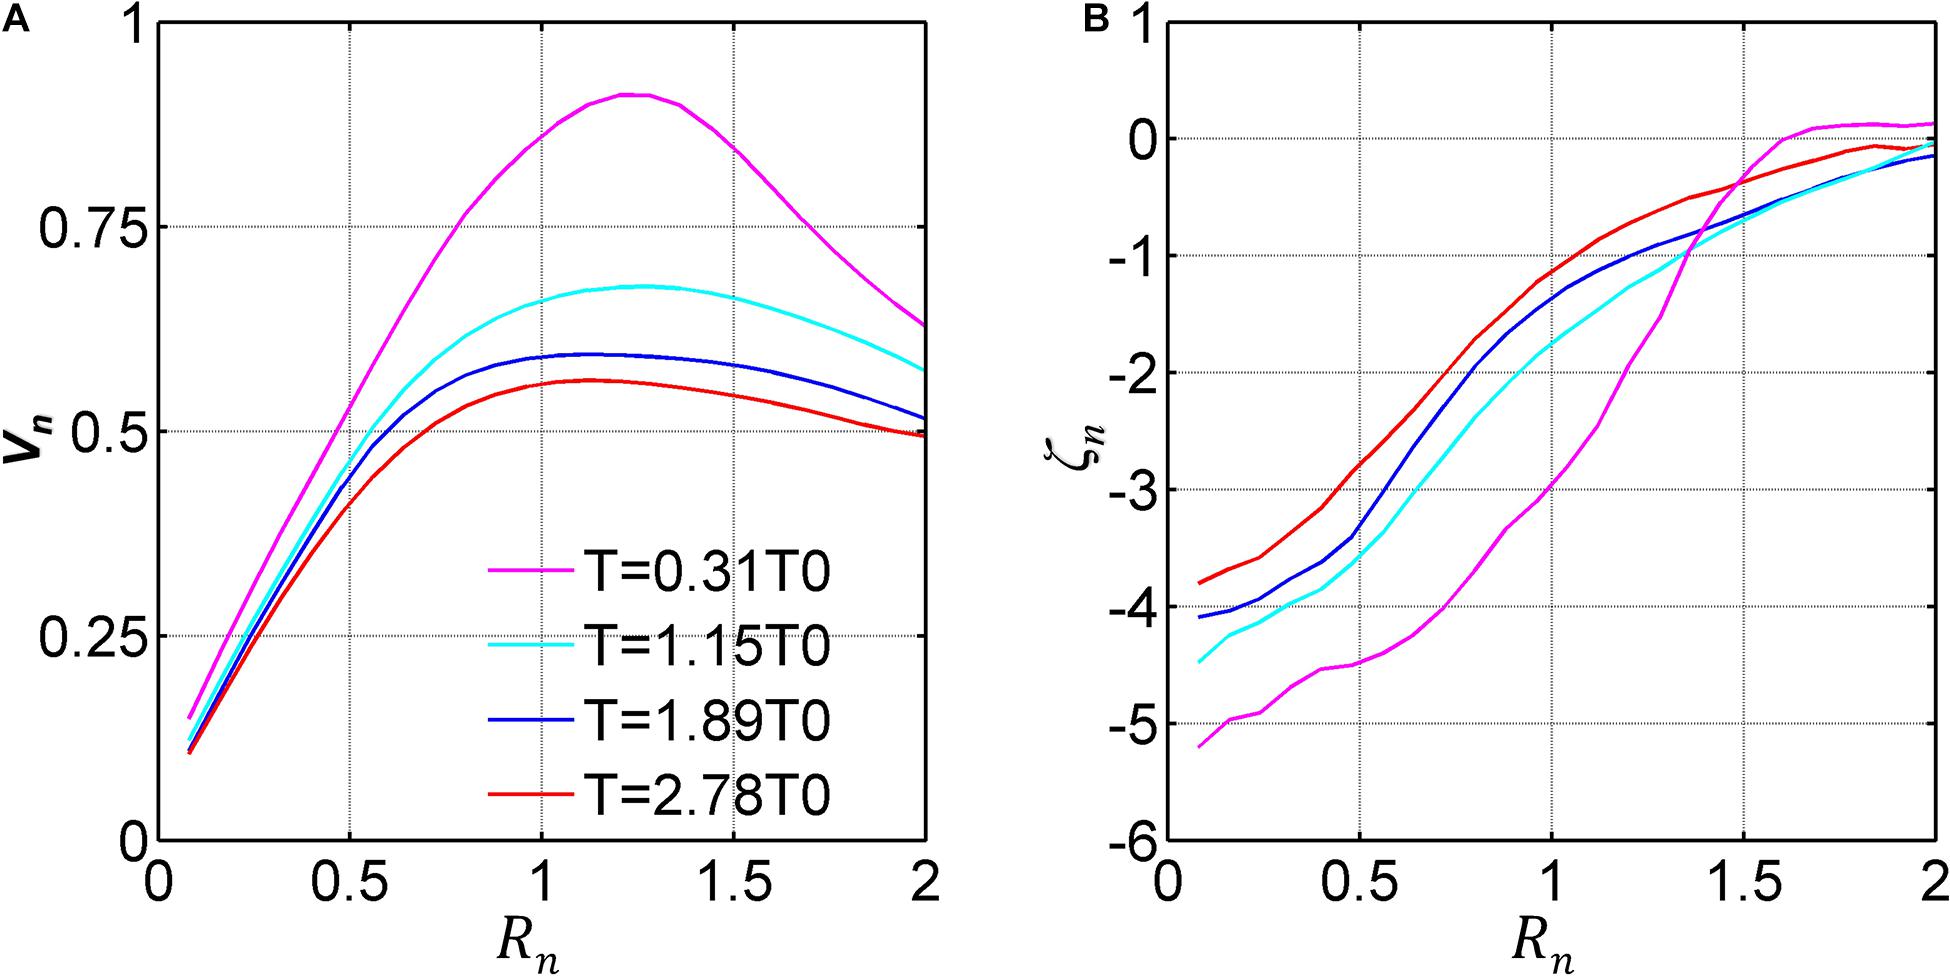
Figure 3. Circle averaged of (A) relative velocity (Vn) and (B) relative vorticity (ζn) for A0 at different intervals.
To show the temporal evolution of A0 in more details, we use the AMEDA eddy detection method (as detailed in section “Angular Momentum Eddy Detection and Tracking Algorithm”) to obtain time series of four physical parameters about A0: (i) the maximum normalized velocity Vnmax; (ii) the maximum relative radius Rnmax (Rnmax = Rmax/Risland); (iii) the area-averaged normalized kinetic energy [, (i is the grid point inside A0)]; and (iv) the ellipticity (E, , where a and b are the semi-major and semi-minor axes of A0, respectively).
In Figure 4a one can see that the Vnmax reaches the maximum value of 0.89 in the early stages of its formation, i.e., at T = 0.3T0. Thereafter, between T > 0.3T0 and T ≤ 2.6T0, Vnmax gradually decreases. After T = 2.6 T0, Vnmax enters a rapidly decaying period. All the four-time series in Figure 4 show that the lifetime of A0 can be divided into three periods: (1) the early turbulence stage (0–0.3T0), in which the unstable processed is dominated; (2) the slow decaying period (0.3–2.6T0), which is controlled by inertial instability, to be discussed in section “Internal Factor: Inertial Instability for the Slow Decaying Period”; (3) the rapid decaying period (T > 2.6T0), which is controlled by eddy–eddy interaction, to be discussed in section “External Factor: Eddy–Eddy Interactions for the Rapid Decaying Period.”
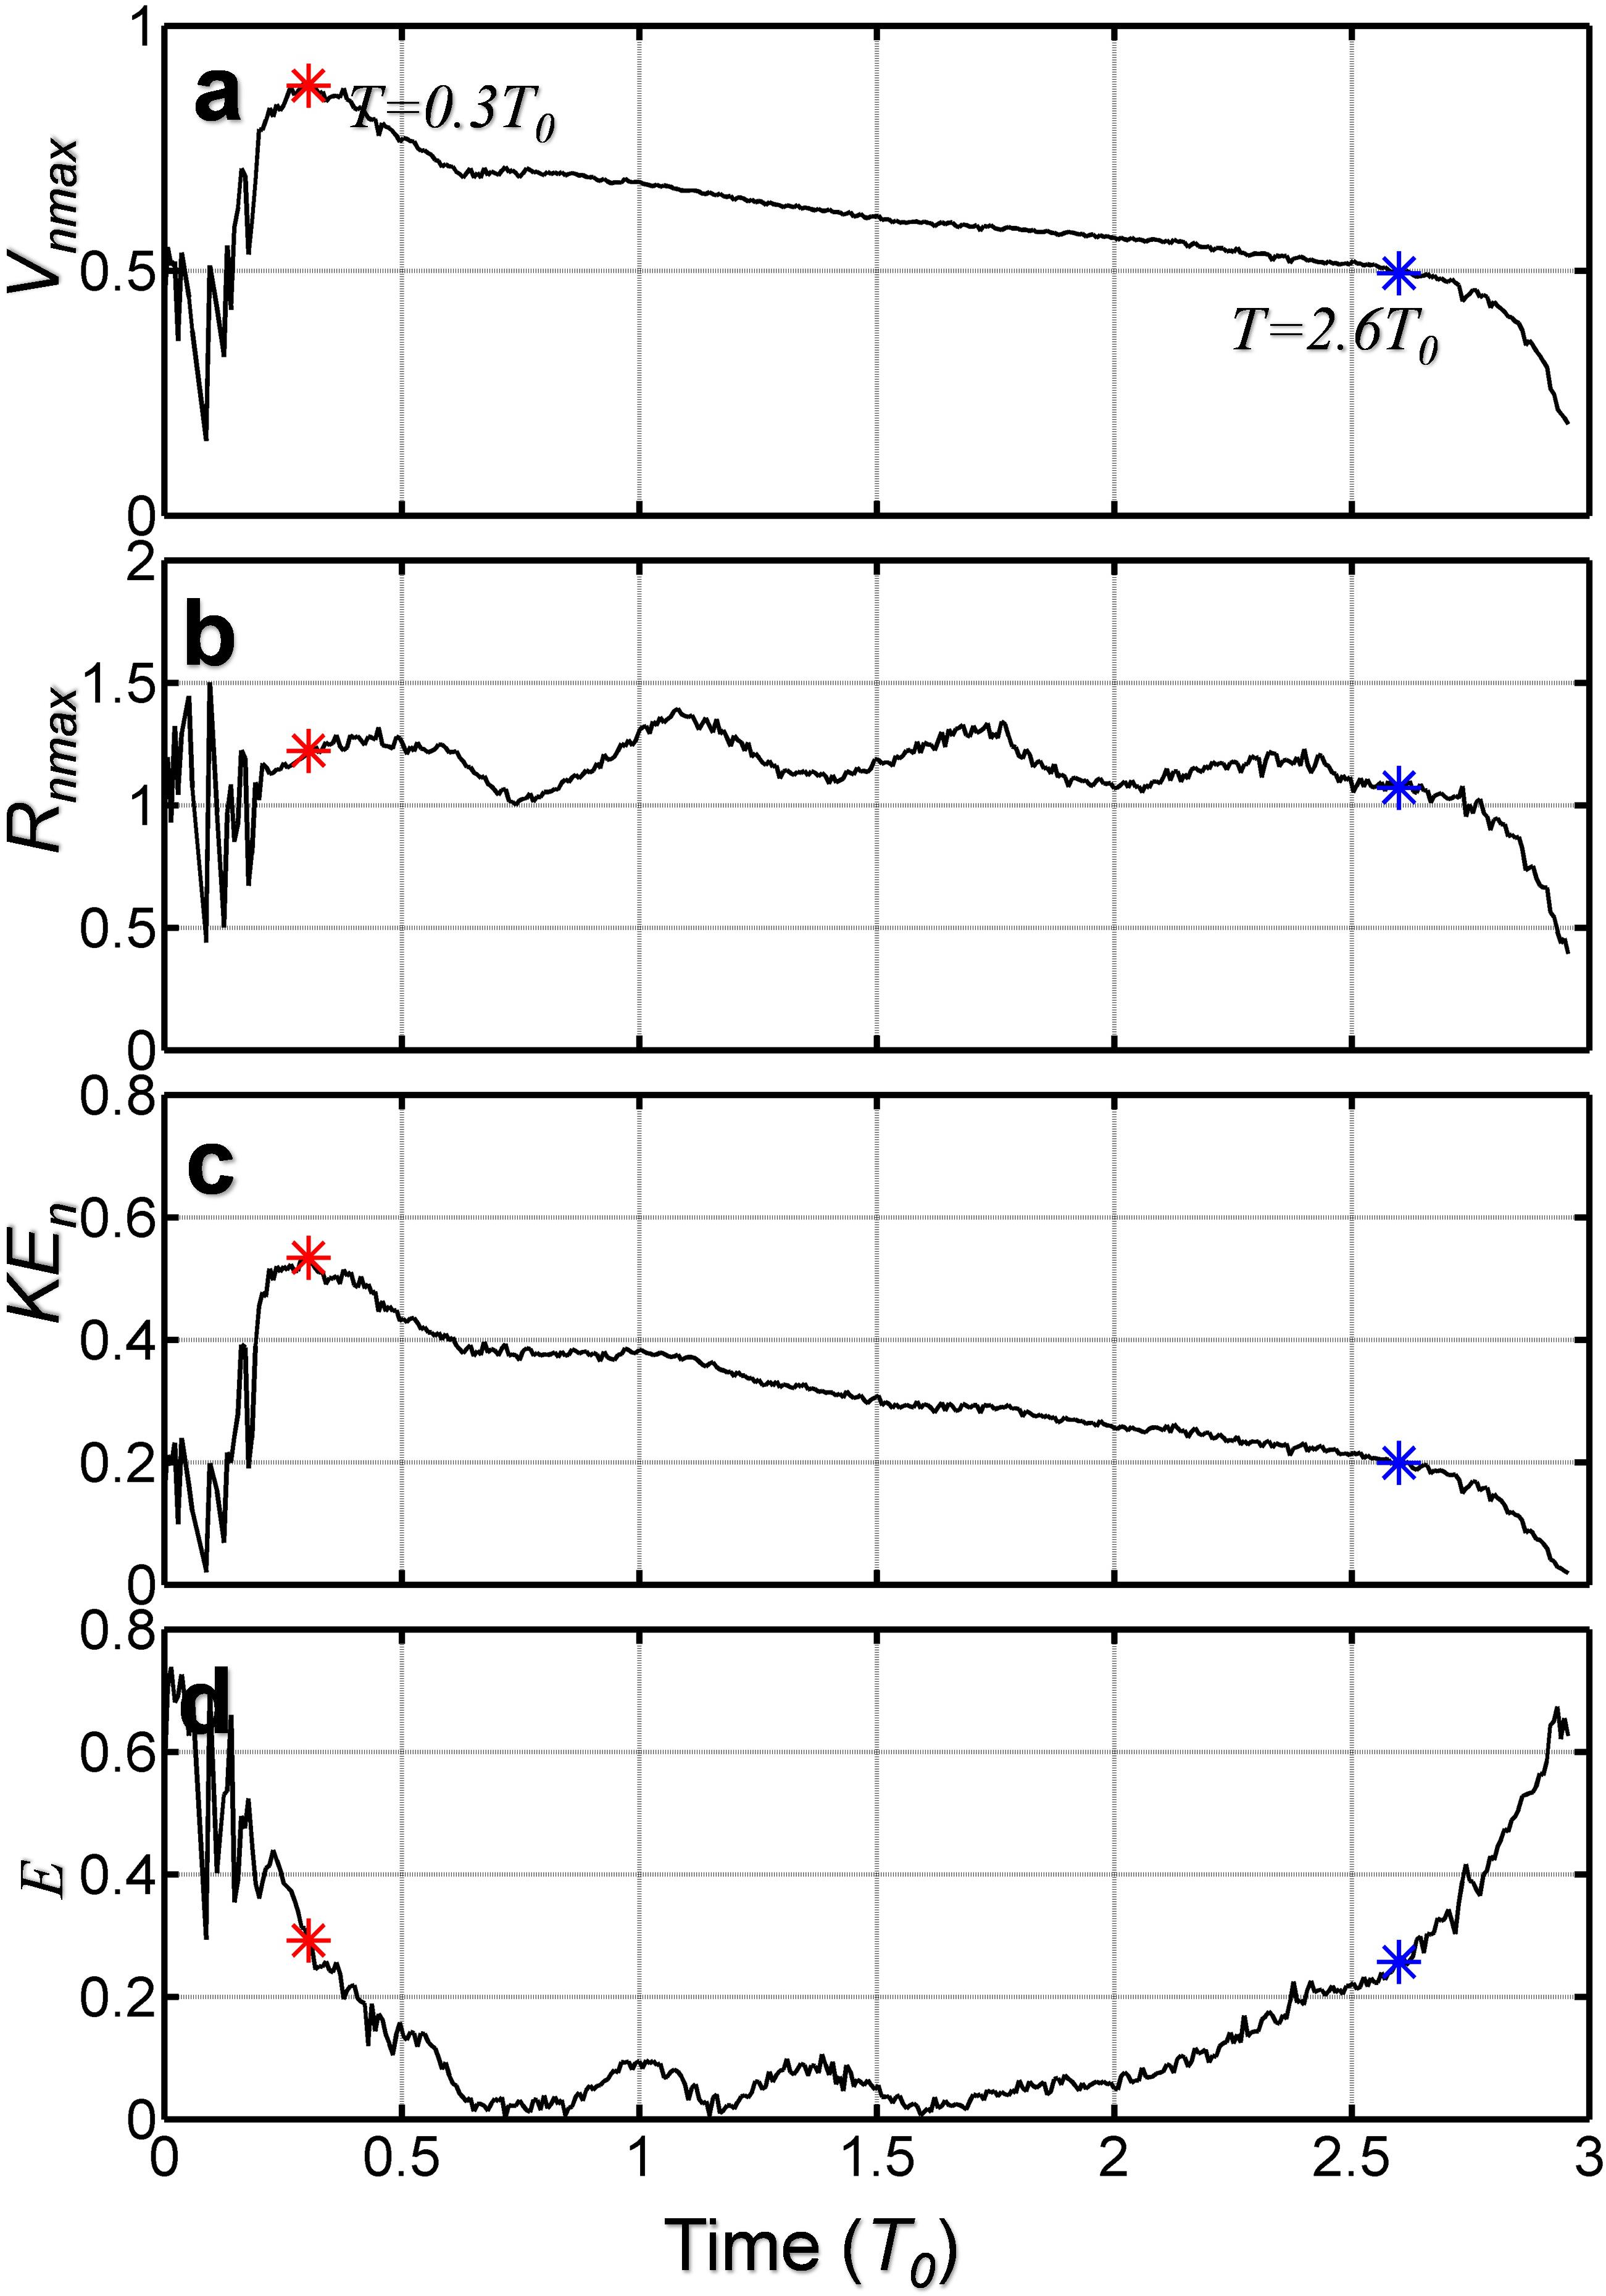
Figure 4. Time evolution of (a) maximum relative velocity Vnmax, (b) maximum relative radius Rnmax, (c) local mean relative KEn, and (d) local mean ellipticity E for A0, respectively. The red asterisk and the blue asterisk indicate the beginning of A0 slow and rapid weakening, respectively.
Figure 4b shows that Rnmax of A0 fluctuates around Rnmax = 1.2 during the slow decaying period (0.3T0 < T ≤ 2.6T0). During the slow decaying period, the maximum Rnmax is 1.4, and the minimum Rnmax is 1, which is approximately equal to the radius of the cylinder used in the experiment. In the period of rapid decaying, the maximum velocity of the eddy decays with its radius.
From Figure 4c, it can be shown that the maximum value of KEn of A0 can reach the value of 0.5. It should be noted that, as discussed above, the KEn is calculated using normalized velocity, which is normalized by towing speed. The maximum value of KEn can reach 0.5, that is to say, the area-averaged kinetic energy of A0 could reach half of the background current.
During the early stages of the eddy formation, the eddy velocity is slow and highly unstable, concurrent with a strong variability of its form (“elliptical pumping”). The island boundary layer strongly interacts with the eddy during its formation. After shedding from the island, the eddy vorticity holds its elliptical for a while. After A0 starts decaying slowly (0.3T0 < T ≤ 2.6T0), the eddy elliptical shape (E) is small (Figure 4d), whereas during its last stages (T > 2.6T0), the ellipticity increases rapidly, suggesting that the anticyclone becomes severely deformed. Nevertheless, the main difference between the early and last stages of the eddy formation is that during its turbulent birth, pumping might occur inducing strong vertical motions before shedding takes place, whereas at the end of its life, the “eddy pumping” no longer occurs (Casella et al., 2014; Meunier et al., 2018; Perfect et al., 2018).
In the following two sections, we examine the potential mechanisms causing the eddy decaying: inertial instability and eddy–eddy interaction.
Internal Factor: Inertial Instability for the Slow Decaying Period
The Rayleigh criterion is used to determine whether or not inertial instability occurs (Rayleigh, 1916; Kloosterziel and Van Heijst, 1991; Mutabazi et al., 1992). The Rayleigh criterion is a sufficient condition for the inertial instability for an eddy, which can be expressed as:
where V(r) is the azimuth velocity V(r) is negative (positive) for the clockwise (counter-clockwise) flow, r is the radius of the eddy. The inertial instability can induce three-dimensional turbulence in the edge of anticyclonic eddies (Kloosterziel et al., 2007), which can weaken the intensity of the anticyclones (Dong et al., 2007). However, the Rayleigh criterion does not takes into account the stratification and the dissipation. The stratification induces a low wavenumber cutoff (confining the instability to wavelengths below a threshold) for the inertial instability of jets (Plougonven and Zeitlin, 2009) or circular eddies (Billant and Gallaire, 2005; Kloosterziel et al., 2007; Lazar et al., 2013a). Short vertical wavelength perturbations are also damped by the vertical dissipation, reducing their growth rate. Hence, new marginal stability criterions, taking into account the dissipation, were proposed recently (Lazar et al., 2013a; Yim et al., 2019). Moreover, stability analysis have investigated the impact of the baroclinic structure on the inertial instability of vortices (Lahaye and Zeitlin, 2015; Mahdinia et al., 2017; Yim et al., 2019). Nevertheless, the results of Yim et al. (2019) reveal that the growth rates and the marginal stability limit of the centrifugal modes are close to those calculated for an equivalent barotropic columnar eddy.
To examine the mechanism of A0’s slow decay, we plot profiles of the angular average of the relative velocity Vn, relative vorticity ζn and the normalized Rayleigh criterion χn = χ/f2 in Figure 5. In Figures 5a,b, it can be seen that the normalized azimuth velocity decreases, with the maximum velocity appearing at roughly Rn = 1.2. The magnitude of the normalized relative vorticity also decreases with time while its initial value reaches about −5.0. From Figure 5c, one can clearly see that the χn is negative between 1 and 2.5 Rn from the beginning to the end, which suggests that inertial instability occurs and causes the slow decaying of A0. After T = 2.6T0, the value of χn is close to zero, and other processes starts to replace the inertial instability to cause the eddy decaying, which is the eddy–eddy interaction (discussed in section “External Factor: Eddy–Eddy Interactions for the Rapid Decaying Period”).
Figure 5. Time evolution of the circular averages of (a) relative velocity (Vn), (b) relative vorticity (ζn), and (c) normalized Rayleigh criteria (χn) for A0, respectively.
Due to the availability of the data from laboratory experiments, the effects of the stratification and baroclinic instability are not applied to the dynamic analysis in the present study. However, from the data analysis based on Rayleigh criteria, inertial instability occurs because of the large magnitude of the relative vertical vorticity. Therefore, it can be concluded that inertial instability plays a key role in the eddy decay in its first phase of instability, and baroclinic instability might play an indirect role, which needs more data of the stratification to justify the argument.
External Factor: Eddy–Eddy Interactions for the Rapid Decaying Period
Phenomenon: A0 Is Severely Deformed
In the late stage of A0 evolution (after T = 2.6T0), when A0 feels the influence from the C0 (Figure 2h), the size of A0 rapidly decreases and its shape changes significantly. Moreover, its moving speed in the y-direction accelerates when it approaches C0. After T = 2.96T0, A0 is severely deformed and the AMEDA method cannot detect its closed streamline. It is visible only in the relative vorticity field.
The strong deformation to the shape of the eddy is evident in the time series of the strain rate. The strain rate is an effective parameter to characterize the eddy shape, which can be expressed as follows:
where u and v are the x-direction and y-direction components of V, the first part () is the stretching of the flow field and the second part () is the contribution to the strain from flow shearing. The ratio of the two parts represents the stretching direction. The stretching direction can be calculated using the following:
Figure 6 shows the time series of the spatial distribution of the normalized strain rate (Sr/f) filed and its direction. In Figures 6A–E, one can see that before T = 2.6T0 (before it is affected by C0), the strain rates near the center of A0 are small, and their stretching directions are not consistent. By contrast, it can be seen from Figures 6F–I that: after T = 2.6T0 (it starts to be affected by C0), strain rates near the center of A0 show a rapid increase and the stretching directions are consistent. Since the strain rate direction is equivalent to the stretching direction, A0 extends along the strain rate’s direction (Figures 6F–I).
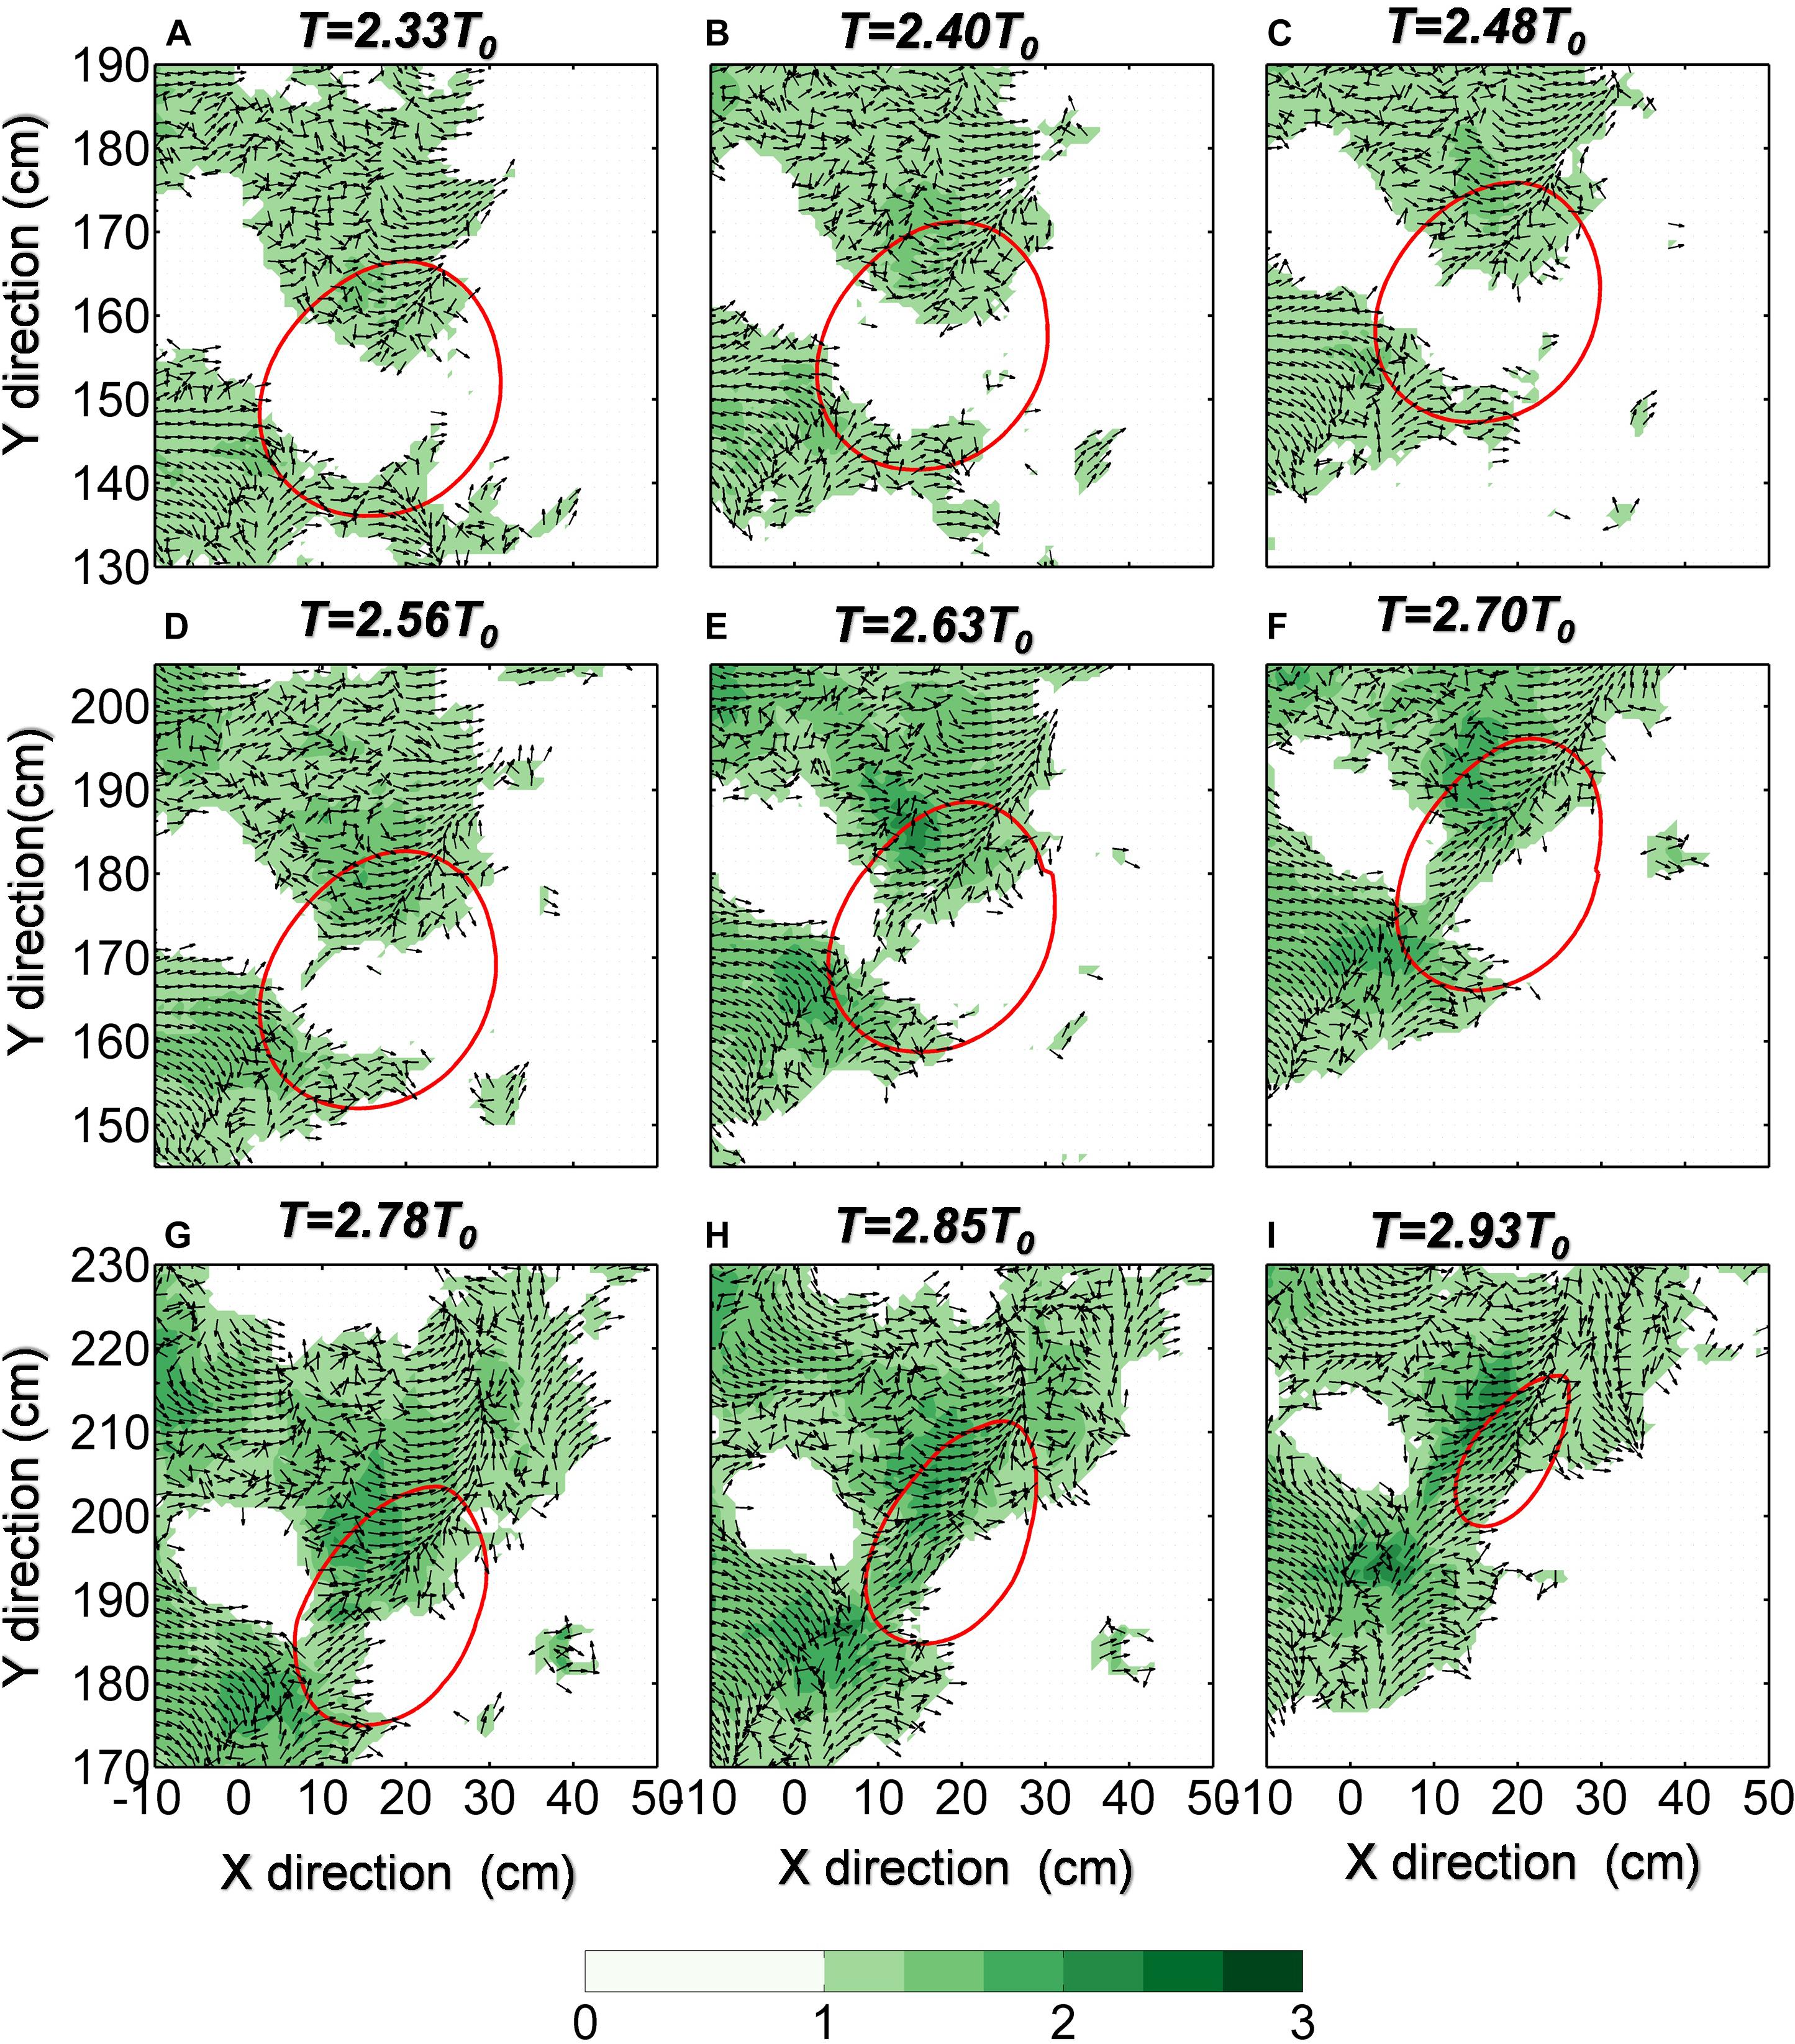
Figure 6. The normalized strain rate field (values less than 1 are not displayed) at different times (Panels A–I correspond to T = 2.33T0, 2.40T0, 2.48T0, 2.56T0, 2.63T0, 2.70T0, 2.78T0, 2.85T0, 2.93T0) near A0. Shading represent the magnitudes and vectors represent directions. Red circles represent the shapes of the anticyclonic eddy A0.
The development of A0 can also be illustrated by its evolution of the strain rate and ellipticity. Figure 7 shows the time evolution of the strain rate and the ellipticity of A0, both of which can depict the temporal variation of A0’s deformation (their correlation is 0.83). They are in disordered states during A0’s formation stage (before T = 0.3T0). During the slow decaying period, the strain rate and ellipticity values are small, which imply that the A0 is in a steady state and A0’s shapes is close to circular. During the rapid decaying period, both variables increases rapidly, implying A0 is severely deformed, see Figures 2g–h. From the discussion below (section “Mechanism: Eddy–Eddy Interaction Between A0 and C0”), the strong deformation of A0 is caused by the interaction between A0 and C0.
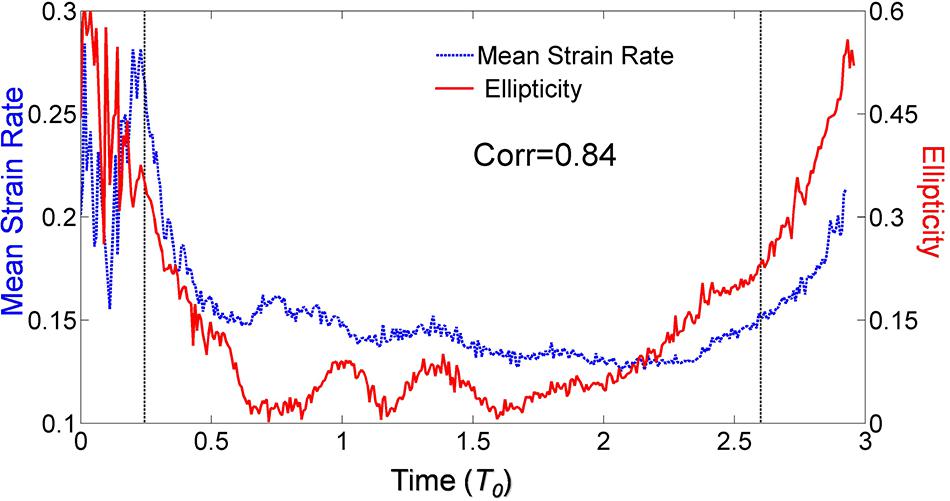
Figure 7. Time evolution of the local mean strain rate (blue dotted line) and ellipticity (red solid line, also shown in Figure 4d) for A0. Two black dotted lines represent the beginnings of slowly weakening and rapidly weakening for A0, respectively.
Mechanism: Eddy–Eddy Interaction Between A0 and C0
To explore the reason for the strong deformation of the A0’s shape, the eddy–eddy interaction between A0 and C0 is examined. In Figure 8, the velocity between the centers of C0 and A0 at different time intervals are plotted. It can be seen that A0 is dragged toward C0 and simultaneously stretched severely by C0, and there is a strong velocity shear between them.
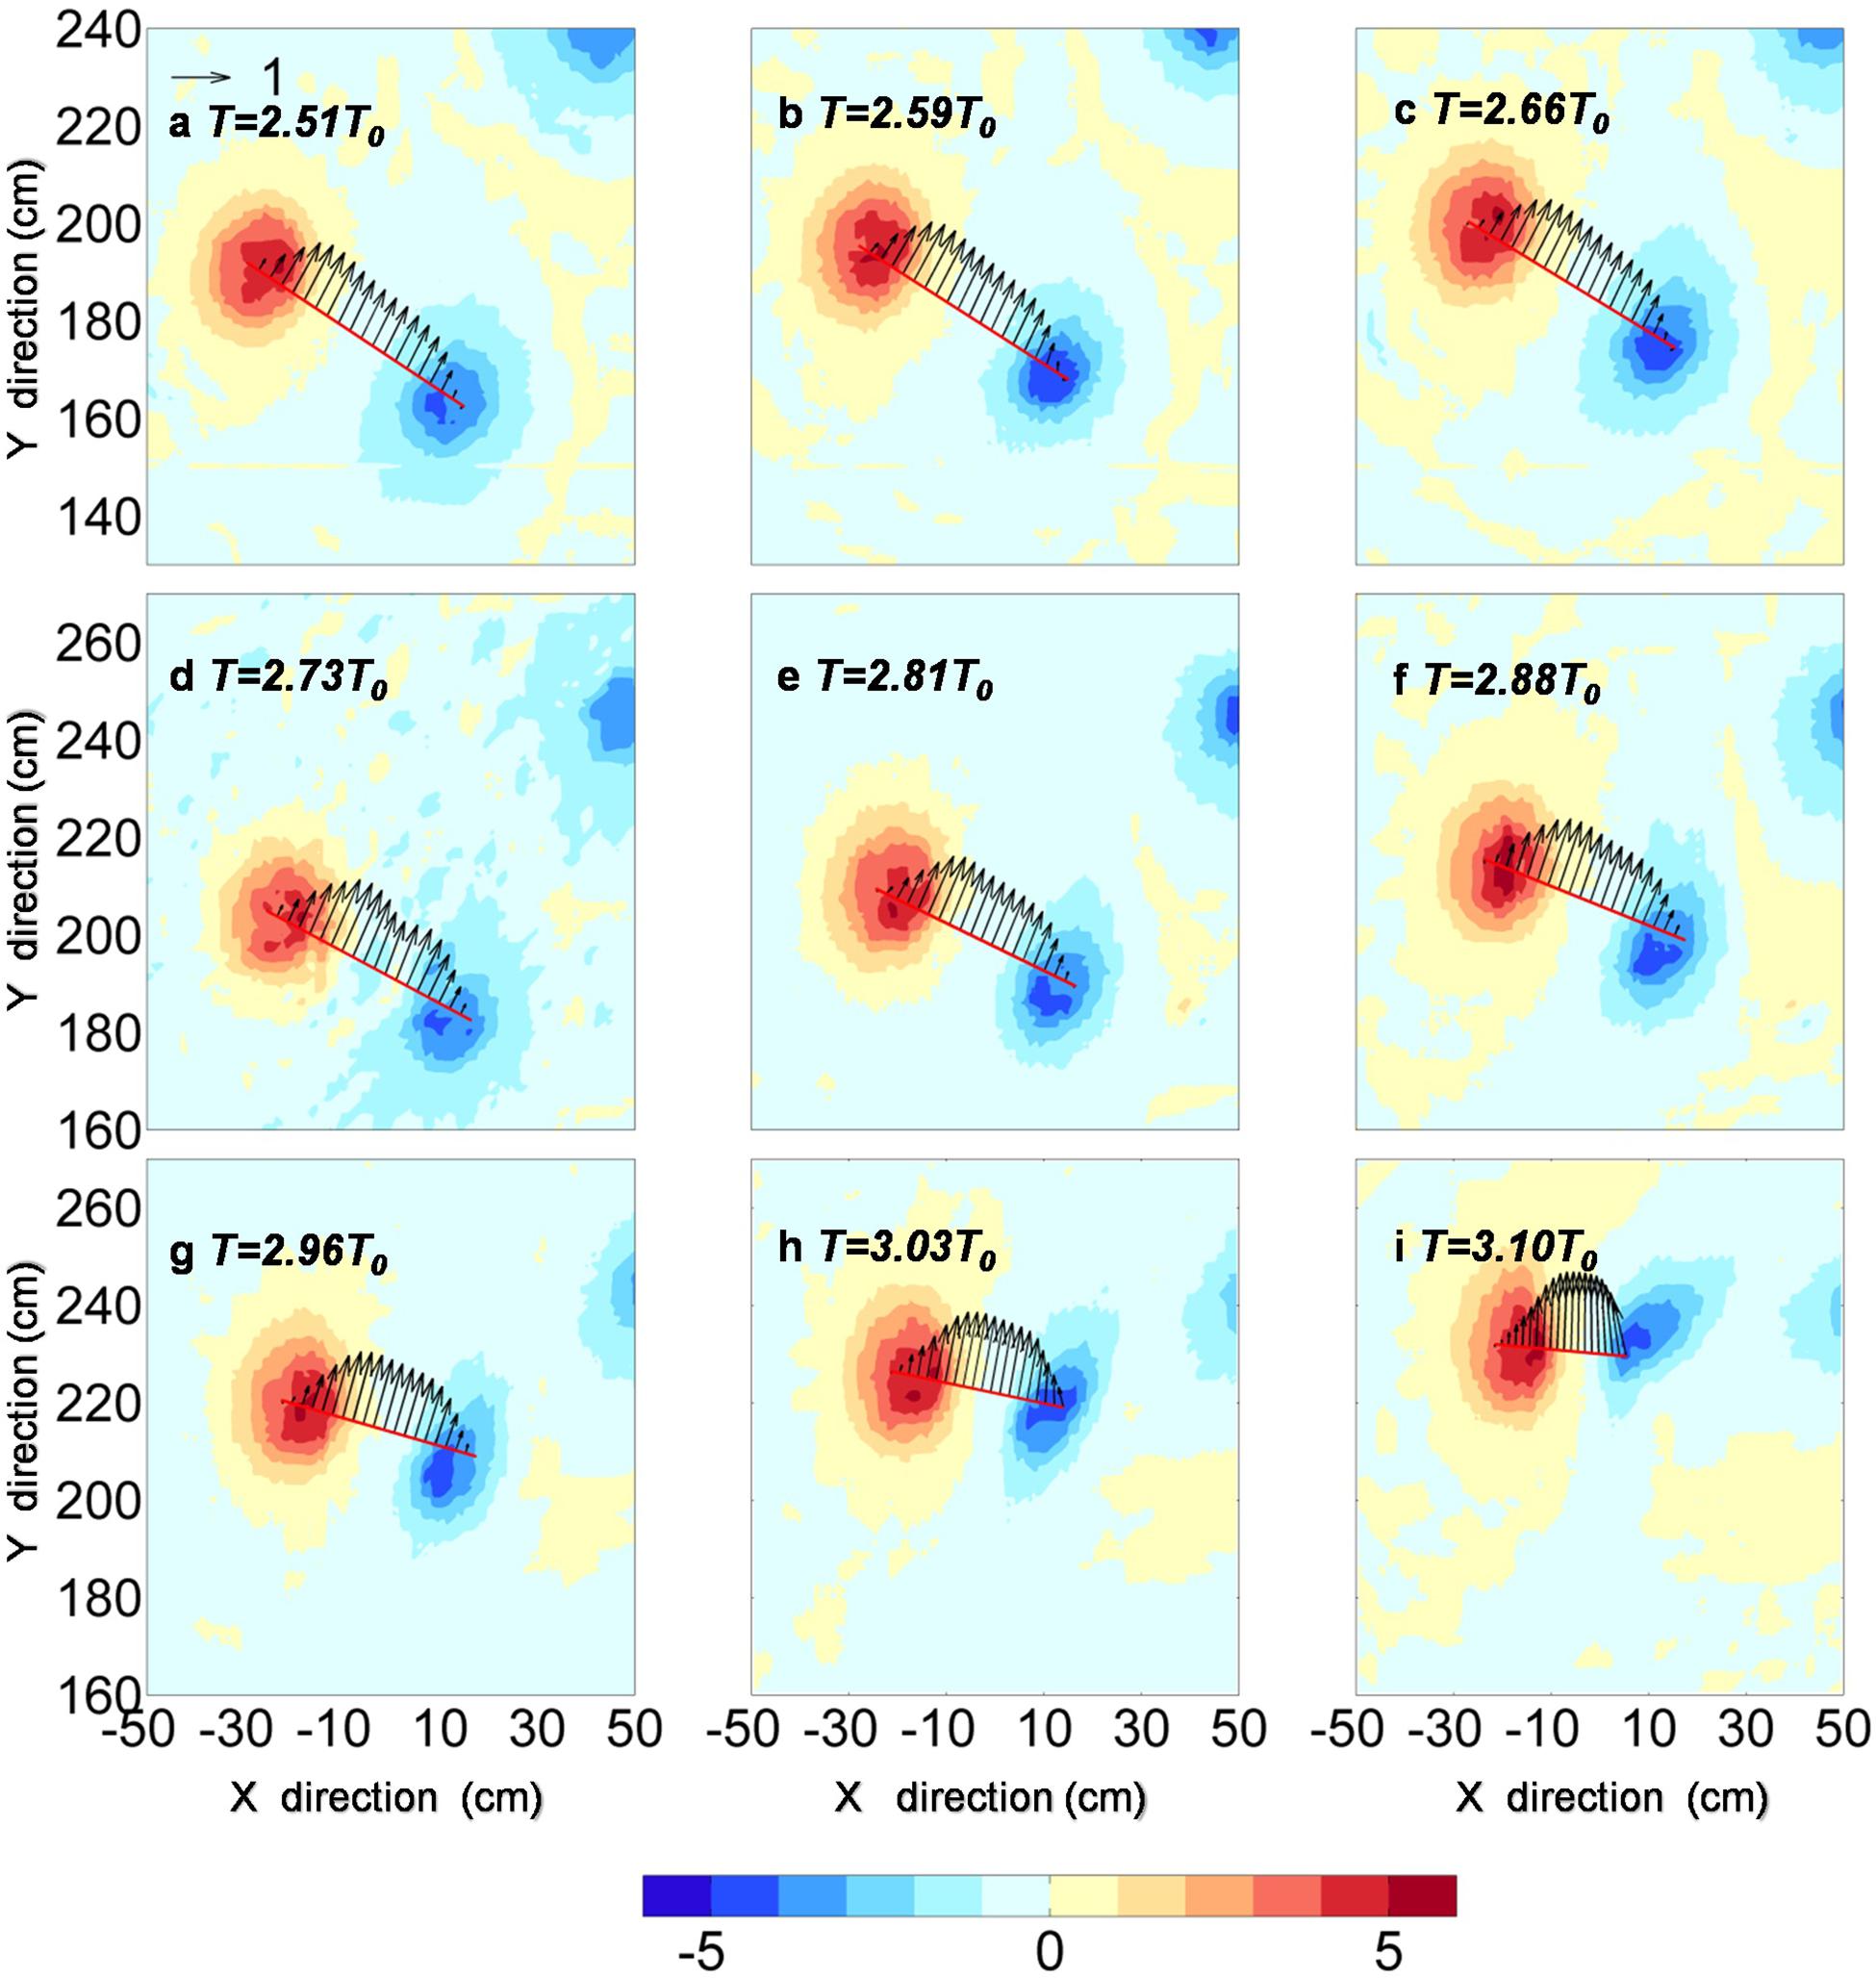
Figure 8. The velocity field between the centers of C2 and A0 at different times (Panels a–i correspond to T = 2.51T0, 2.59T0, 2.66T0, 2.73T0, 2.81T0, 2.88T0, 2.96T0, 3.03T0, and 3.10T0). Shading represents relative vorticity, and vectors represents relative velocity.
When T > 2.93T0, we cannot find A0’s closed streamline. As AMEDA can only be used in eddy detection when closed streamlines are present, the algorithm can no longer be used and thus instead, we used the OW parameter to define the position and shapes of the eddy to examine the eddy–eddy interaction in the end stage of A0. The normalized OW parameter (McWilliams, 1984; Weiss, 1991; Hua and Klein, 1998) is defined as:
where Sr is the strain rate.
Figure 9 shows the evolution of distribution of Qn. The isolines (Qn = 2) are selected as eddy boundaries. The geometry of the stream function field (deduced from the horizontal motions) involves elliptical (or circular) and hyperbolic flow structures. When the strain rate exceeds the vorticity, the fluid is in a hyperbolic mode of motion. When the vorticity exceeds the strain, the fluid is in an elliptical mode of motion that advects the vorticity smoothly (Weiss, 1991). Qn is larger than 0 between A0 and C0, which means that strain dominates the region with respect to the hyperbolic structures.
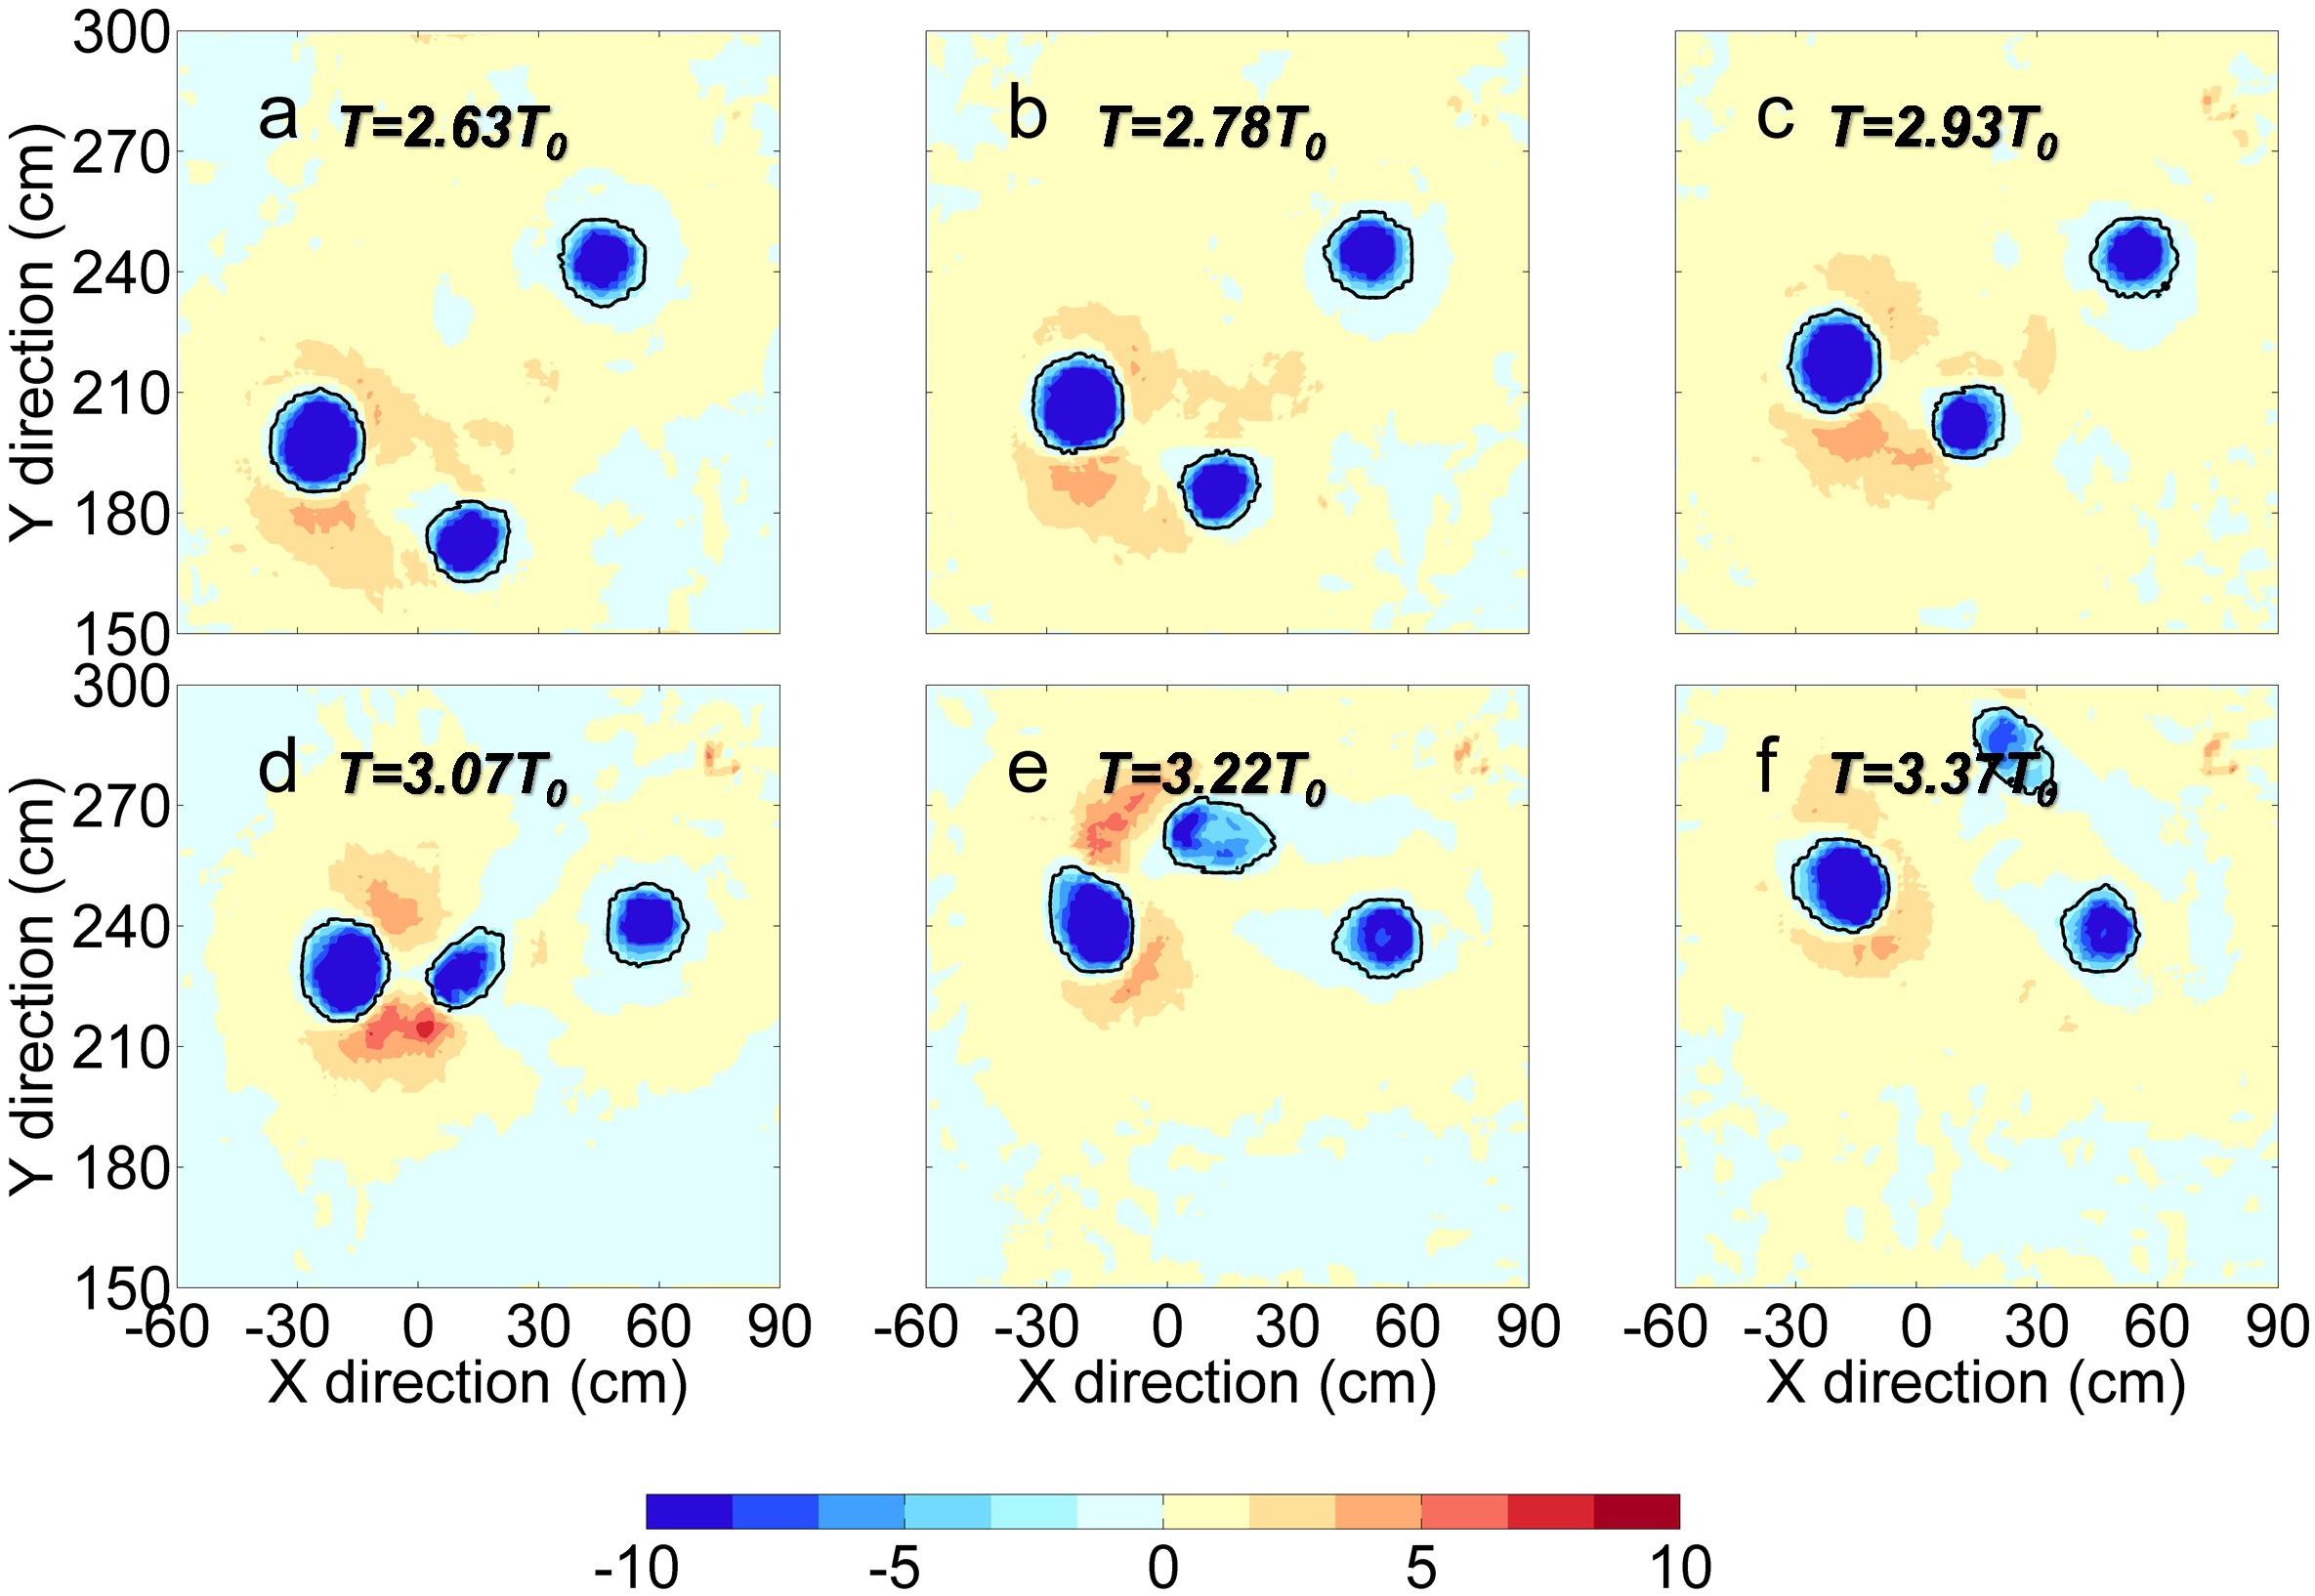
Figure 9. The Okubo-Weiss parameter (Q_n) near A0 at different times (Panels a–f correspond to T = 2.63T0, 2.78T0, 2.93T0, 3.07T0, 3.22T0, 3.37T0). The black lines represent the isolines (Qn = 2) which demarcate eddy boundaries.
Using the OW parameter, we determine the size and shape of eddies. We then calculate the time evolution of OW parameter and its two parts: the strain energy (Sr2) and the enstrophy (ζ2), and the total kinetic energy inside A0, C0, A2 and the left area (X: −60 to 90 cm, Y: 150–300 cm, which shown in Figure 9). As can be seen from Figure 10A, the OW parameter in the eddy region is negative and approaches 0, while the value in the left area is positive and also close to 0, because both the strain rate and the enstrophy are decreasing. During 3T0 < T < 3.4T0, the OW parameter of A0, C0 and left area have large perturbations. This signal can also be clearly seen in Figures 10B,C, which corresponding to the period of strongest interaction between A0 and C0. In Figure 10D, it can be seen that the total kinetic energy in the study area is gradually decreasing, which is mainly affected by friction. However, during 3T0 < T < 3.4T0, the kinetic energy of A0 first increases rapidly and then decreases rapidly. This is because A0 enters the strong current region between A0 and C0 (where the flow is uniform) and leaves quickly. The rapid increase of A0’s kinetic energy corresponds to the rapid decrease of A0 strain rate. When the strain rate of A0 decreases, the strain rate of C0 increases rapidly, which indicates that the shape of C0 has changed, and the kinetic energy of C0 begins to decay. In the left area, the kinetic energy during 3T0 < T < 3.4 T0 increases slightly. The enhanced kinetic energy in the left area may be the kinetic energy lost by C0. At the end of the experiment, when T > 3.4T0, the energy of C0 and A0 gradually decreased, while the energy of A2 increased, which is due to the effect of A0 and A2 merging.
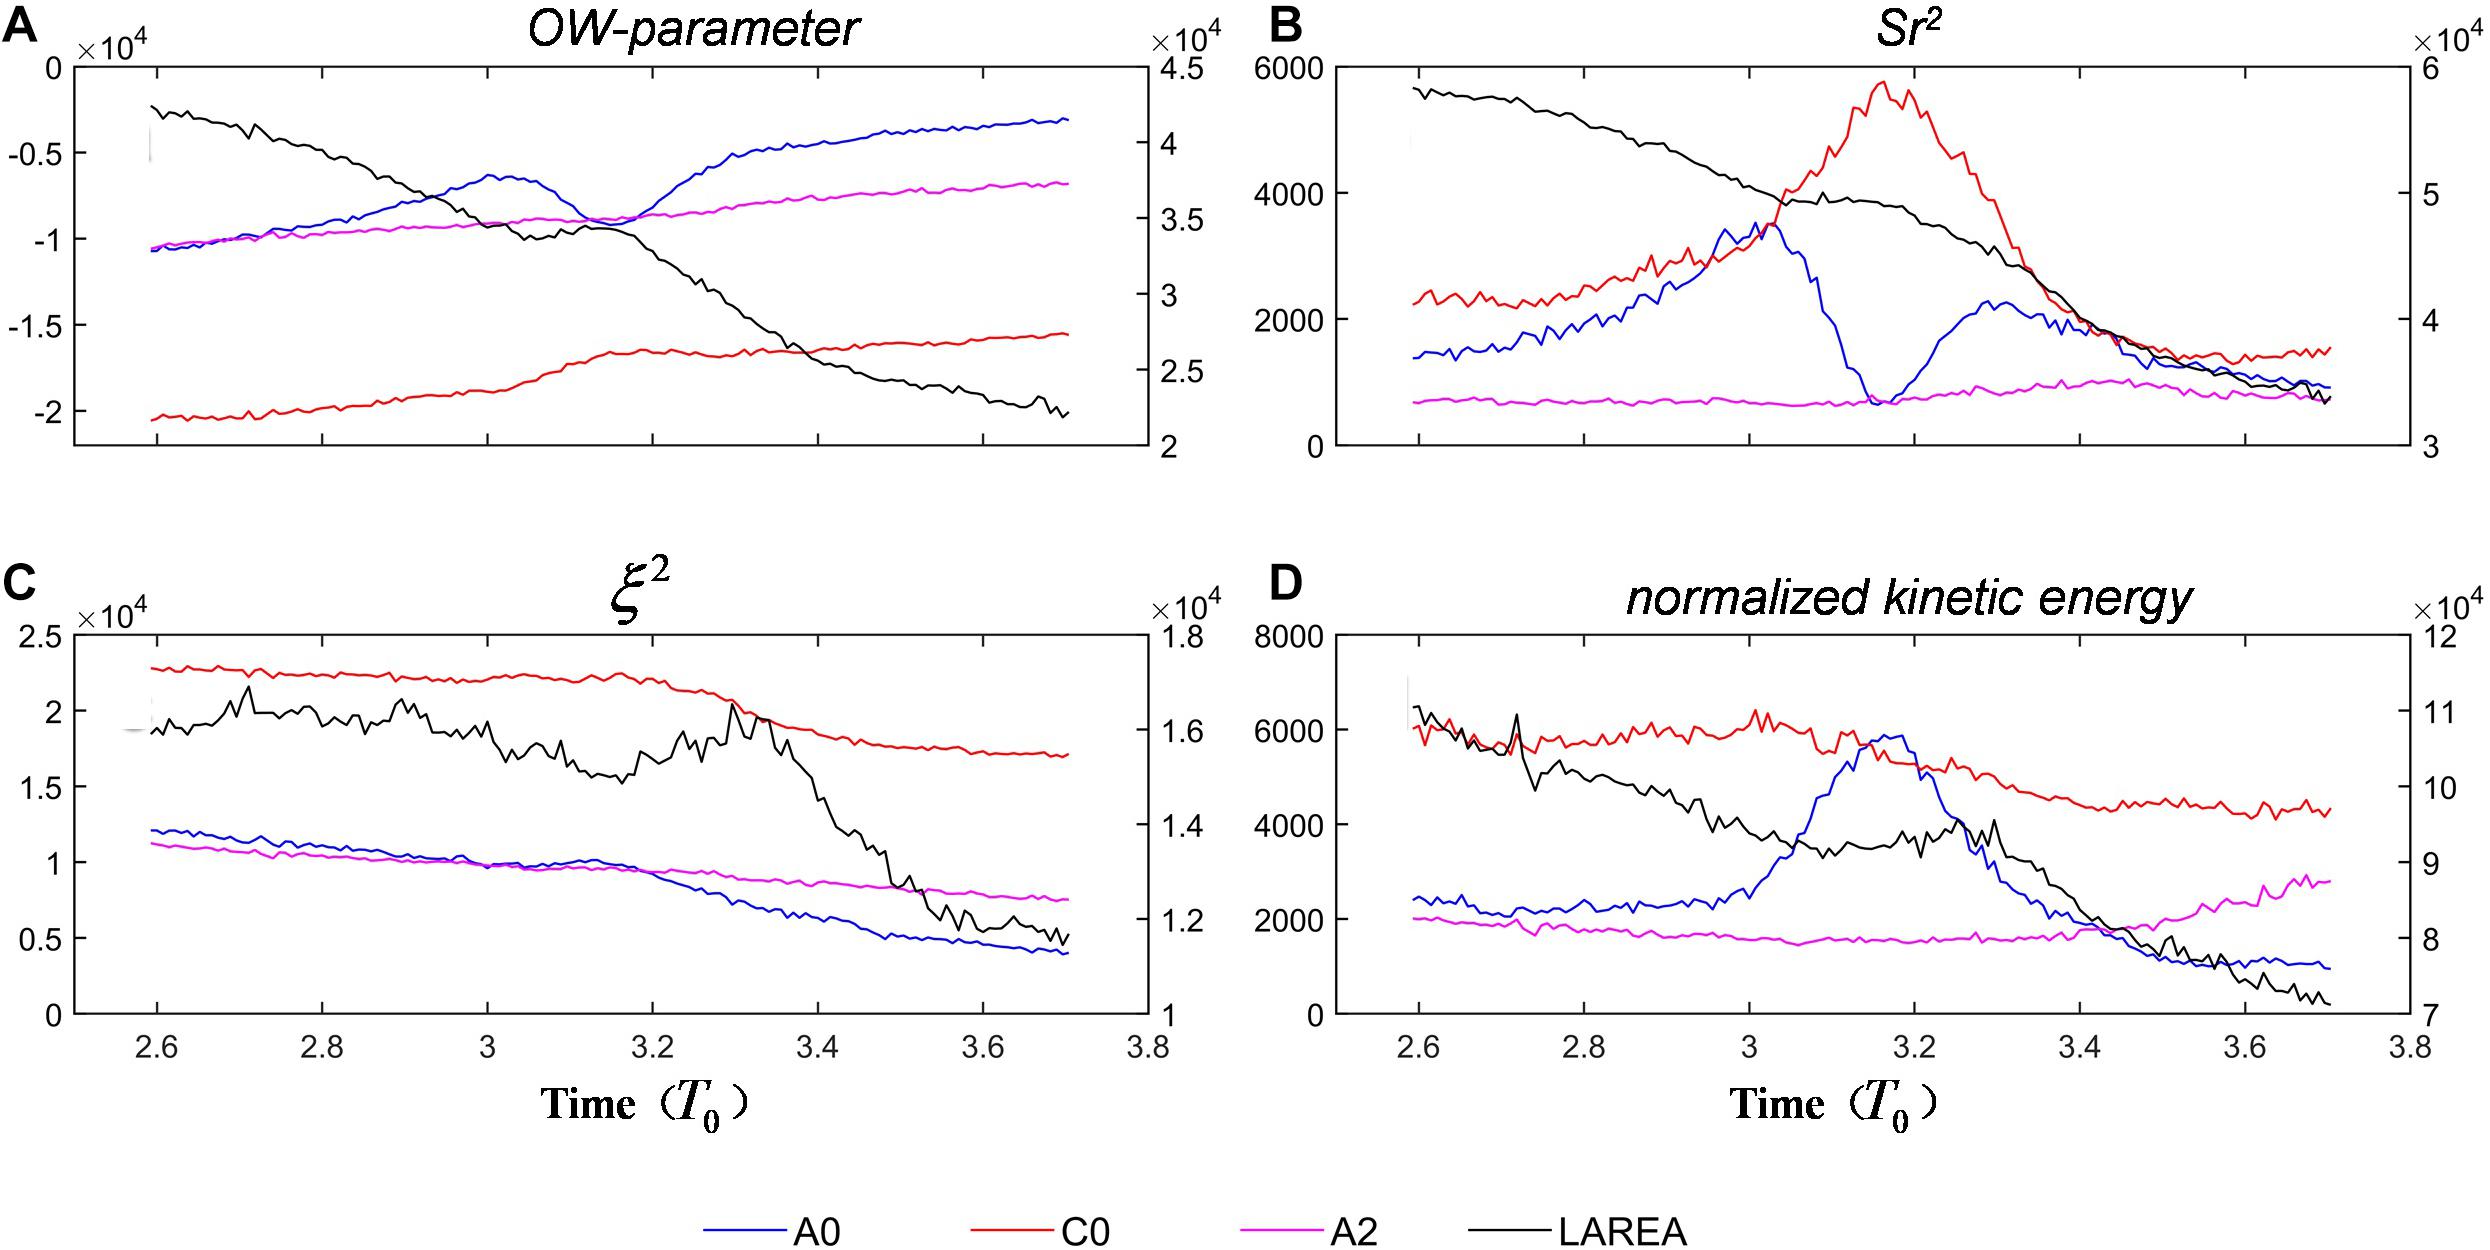
Figure 10. (A) Time evolution of the Okubo-Weiss parameter. The blue, red, and pink lines give the inner eddy local means of A0, C0, and A2, respectively. The black line gives the local mean of area enclosed by X: –60 to 90 cm, Y: 150–300 cm, with the contribution of the A0, C0, and A2 eddies removed. (B) The same with panel (A) but for Sr2. (C) The same with panel (A) but for enstrophy (ζ2). (D) The same with panel (A) but for normalized kinetic energy.
Here, an interesting question can be raised: why is the anticyclonic eddy A0 affected by C0? This can be answered through usage of the flow governing equation (for an incompressible inviscid two-dimensional fluid):
wherein we can calculate each term contribute to the pressure gradient force (Figure 11). In our laboratory experiments, the time variation terms () make the least contributions to the pressure gradient. Both anticyclonic eddies and cyclonic eddies show a similar pattern in the nonlinear terms (), and the Lamb vector terms () play a more vital role in the pressure gradient than the kinetic energy gradient terms (). Under in influence of the Coriolis and nonlinear terms, the signals of the anticyclonic eddies are weakened and the signals of the cyclonic eddies are strengthened. Using eq.10, we can estimate the relative pressure field (Figure 12a). The cyclonic eddies and the anticyclonic eddies show an asymmetric pattern (Gallet et al., 2014; Liu and Andutta, 2020; Yang et al., 2020). The distance between C0 and A0 decreases (Figure 12b) resulting in the pressure gradient between them increases (Figure 12c). And although C1 plays an equally important role in A0 compared to C0, the pressure gradient decrease between C1 and A0 in A0’s rapid decaying period (T > 2.6T0).
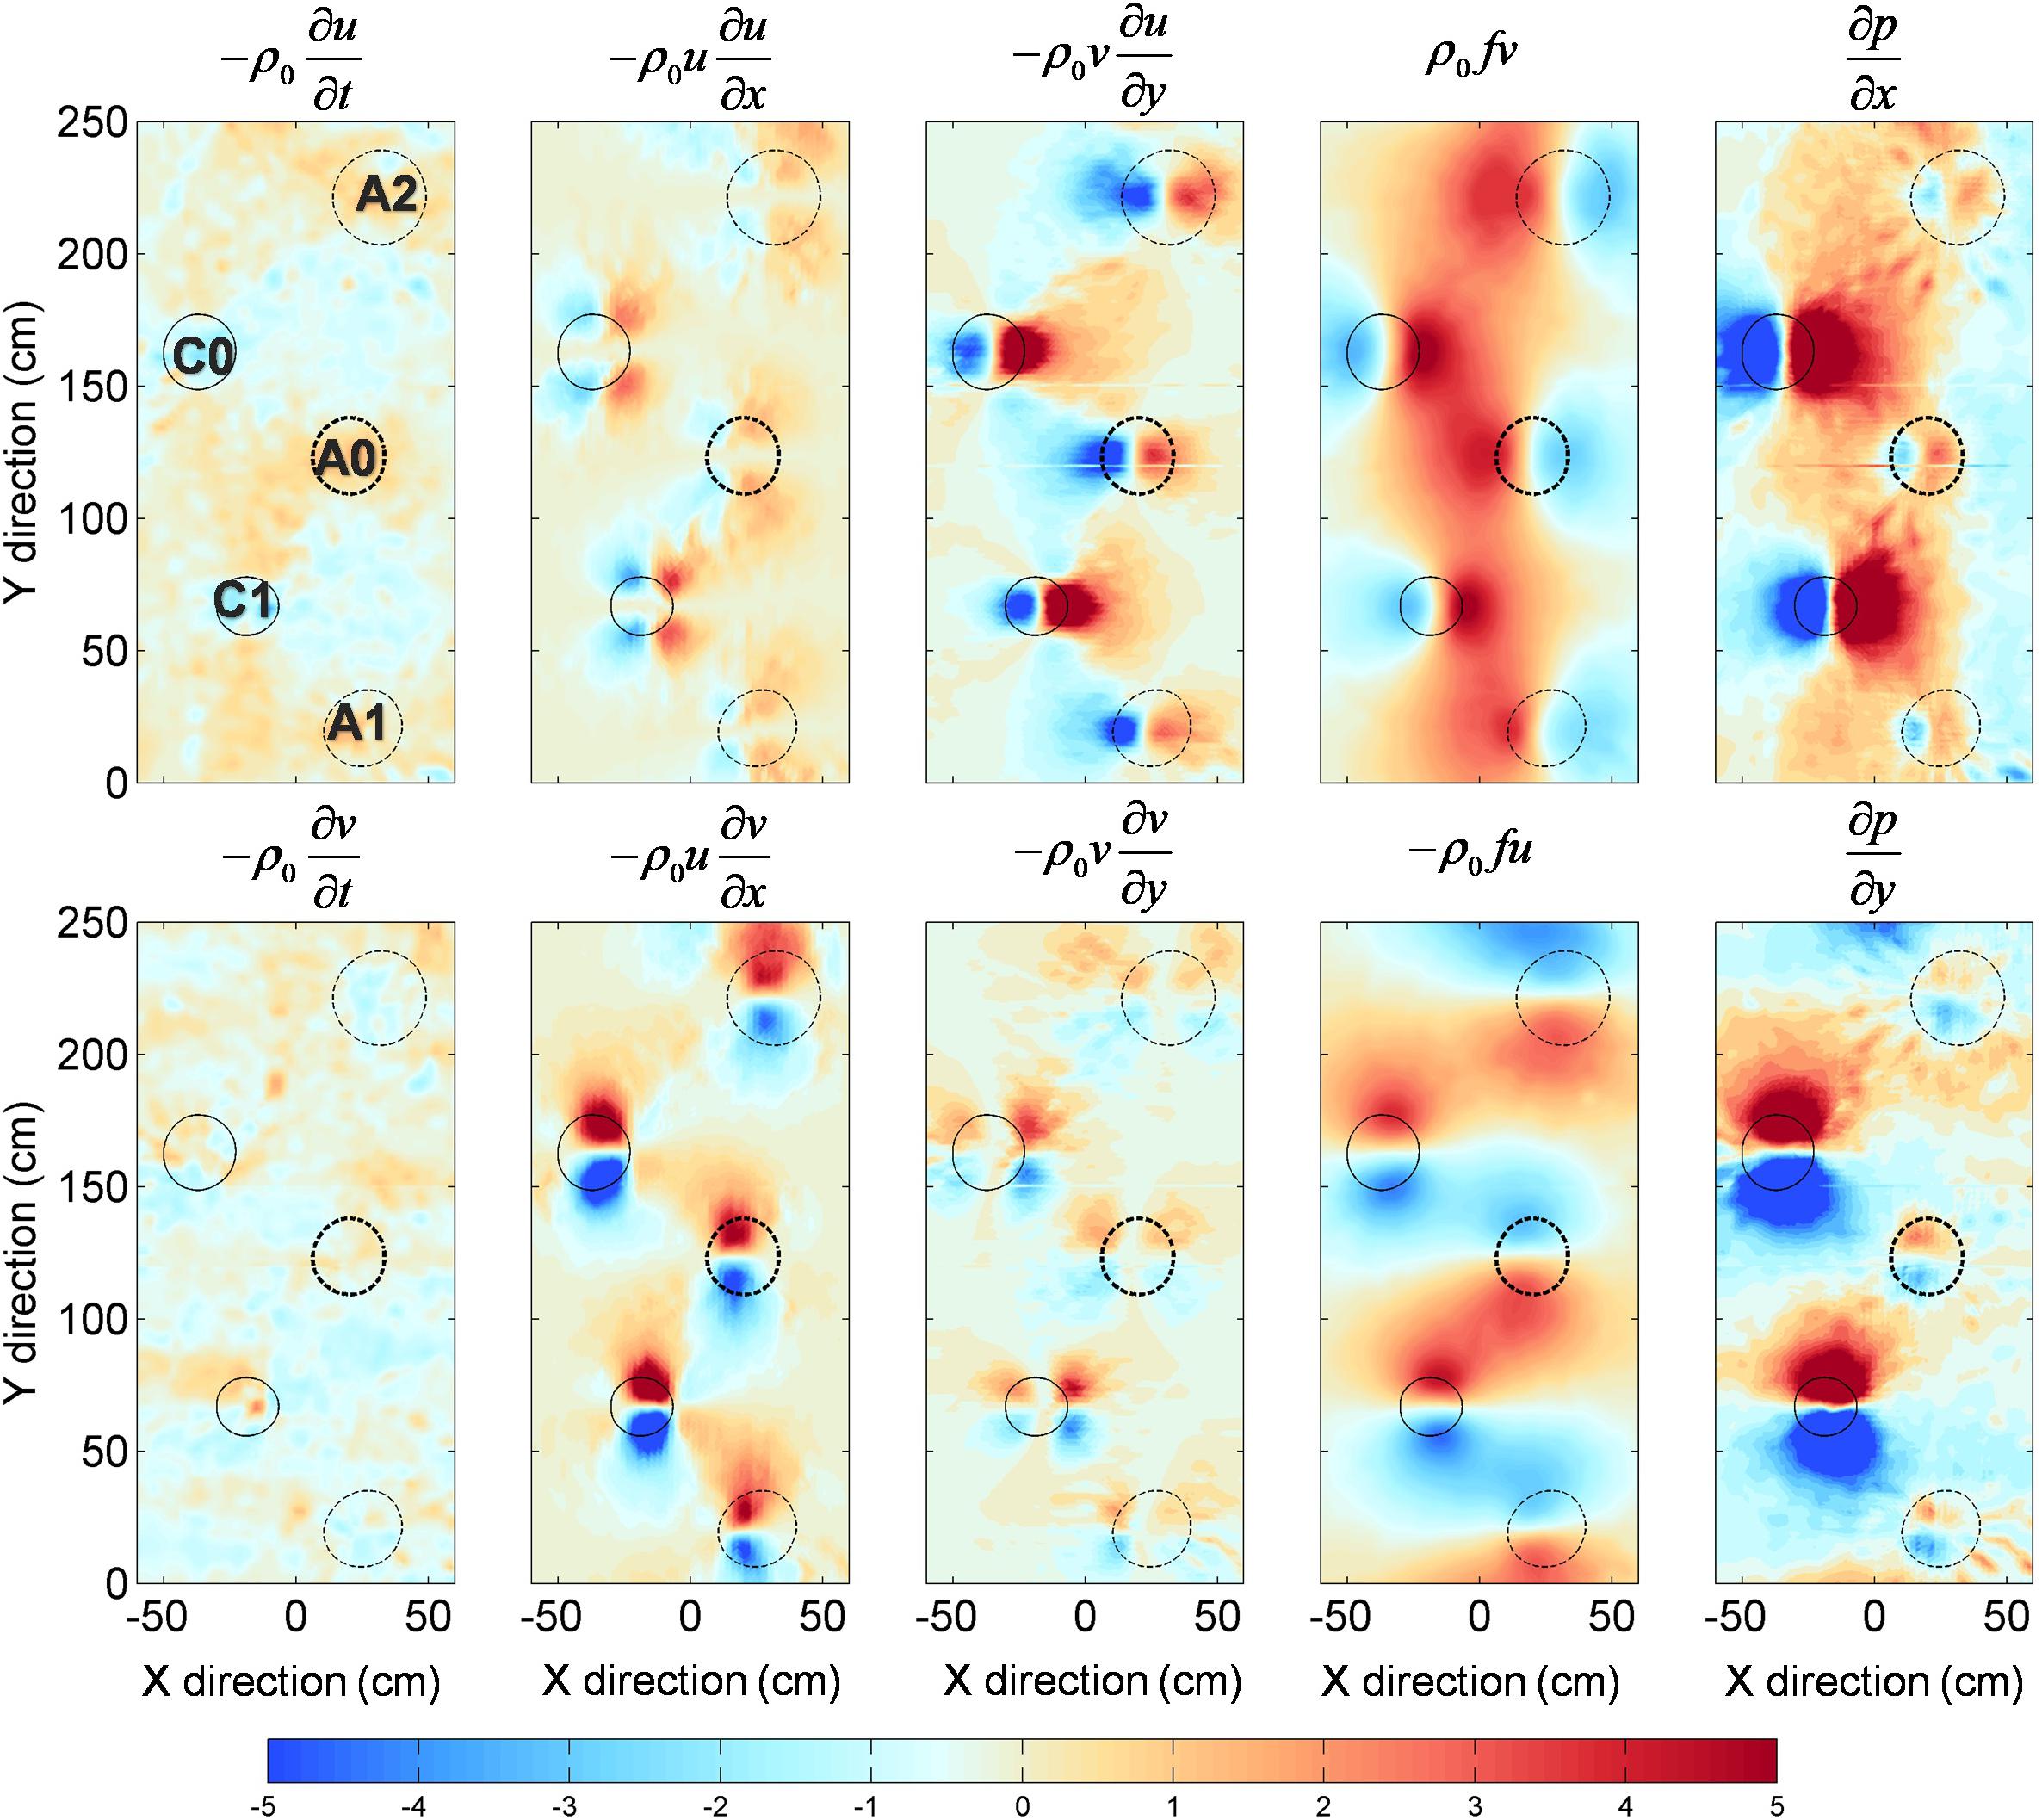
Figure 11. The contributions of different terms in the flow governing equation to the pressure gradient for A0 at T = 1.52 T0.
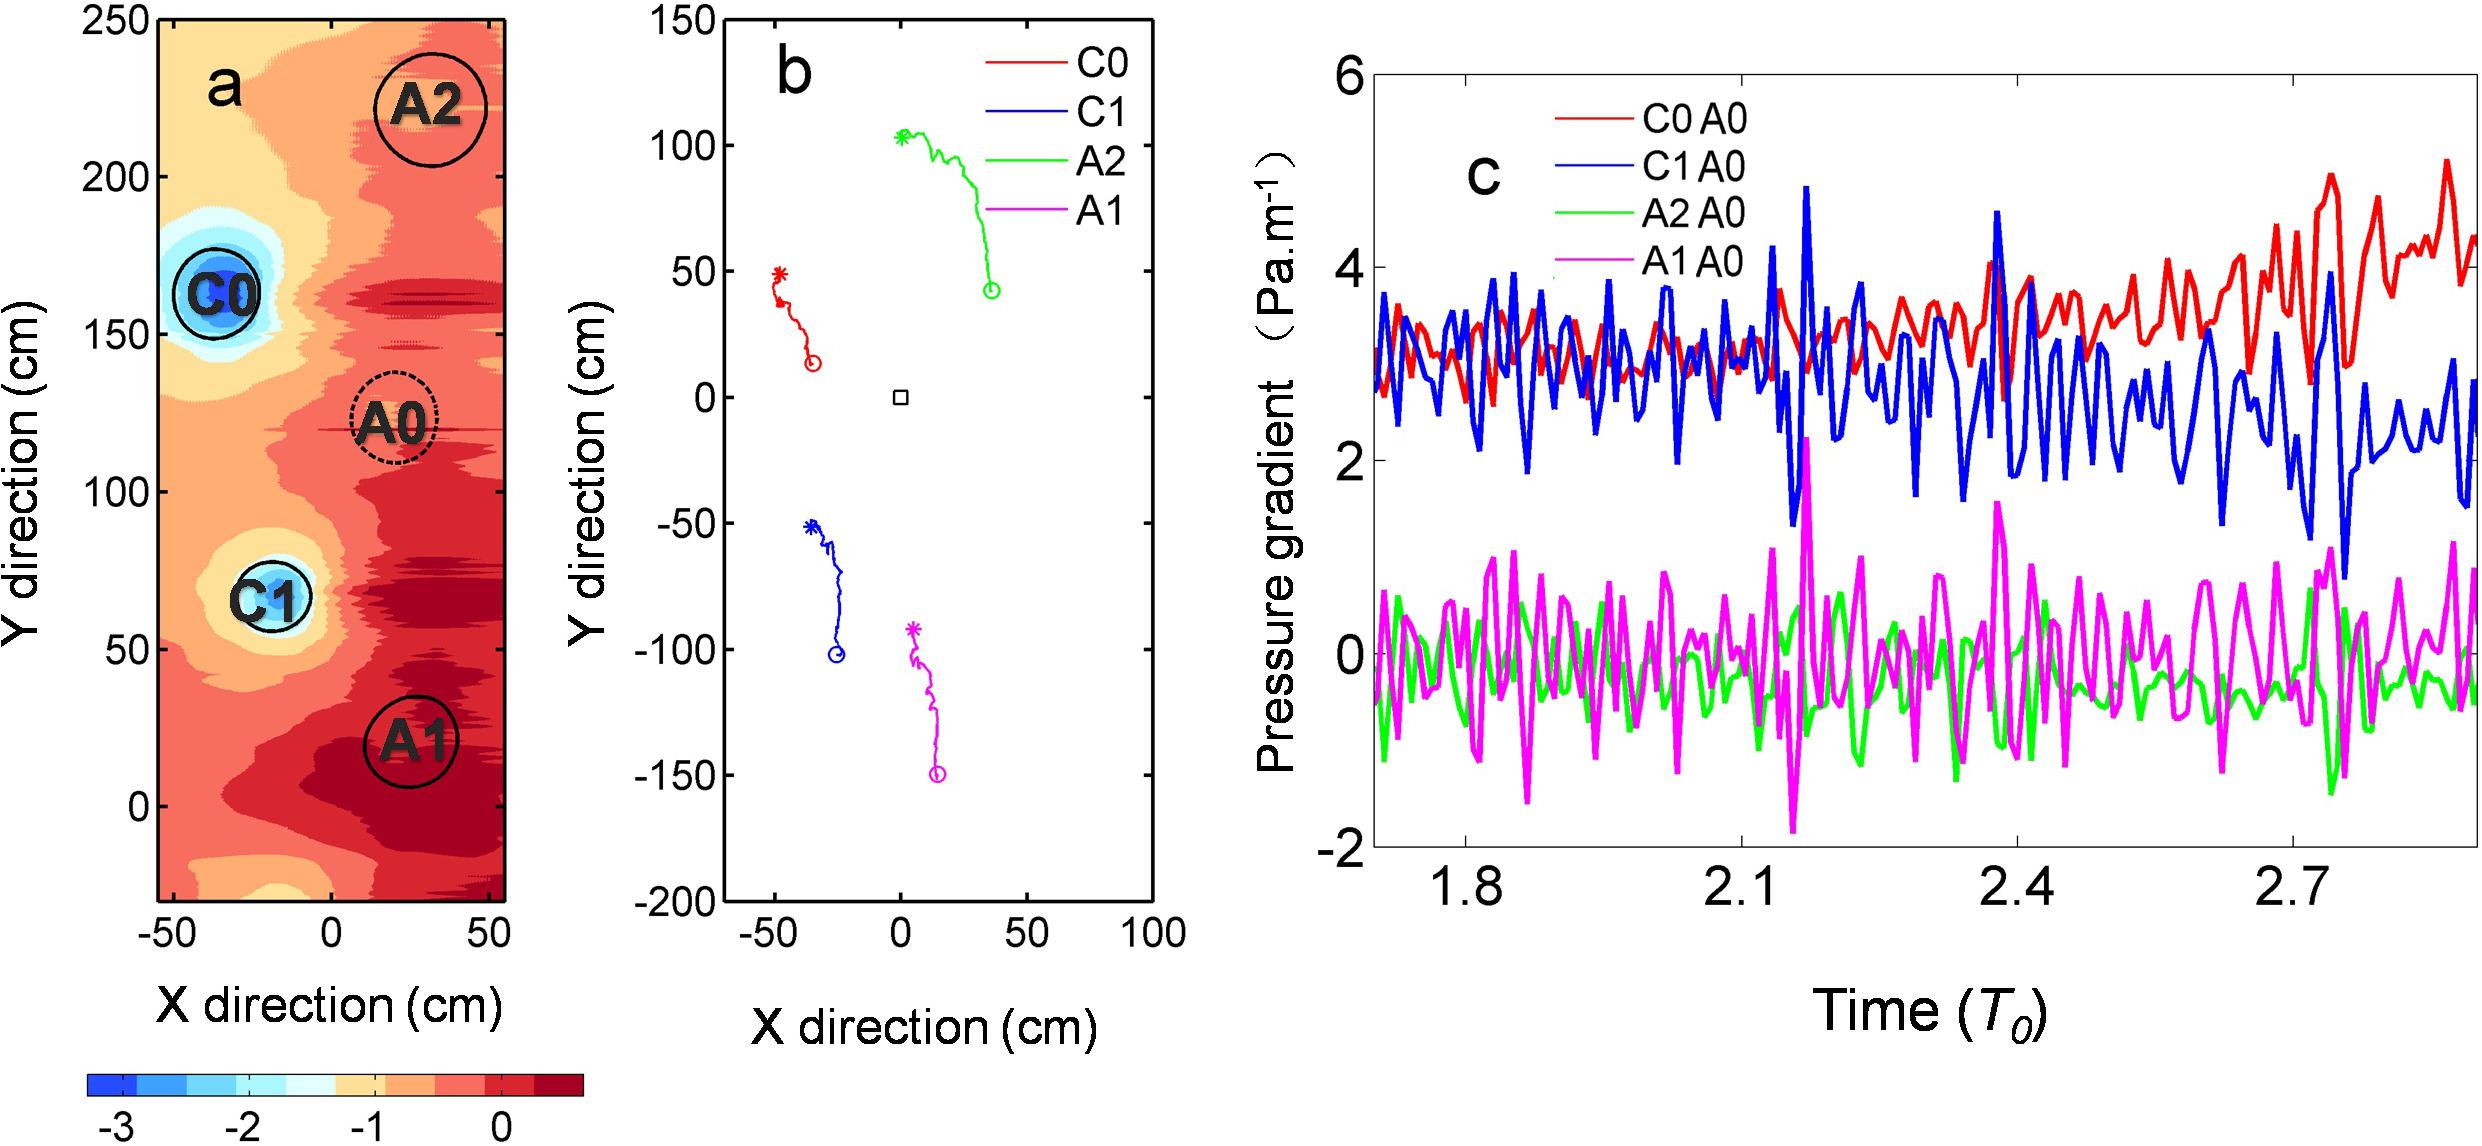
Figure 12. (a) The pressure field estimated using the flow governing equation at T = 1.52 T0. (b) The relative positions of C0, C1, A2, and A1 with respect to A0. (c) The time evolution of the pressure gradient between C1 and A0, C0 and A0, A2 and A0, A1 and A0. The color of the lines is corresponding to panel (b).
Conclusion and Discussion
Through a laboratory experiment carried out on the LEGI-Coriolis rotating platform, the evolutionary lifecycle of an anticyclonic eddy is studied. Observations have suggested that in the early stage of the eddy’s formation, turbulence is the main factor affecting the fluid and its shape, though generally elliptical, is not stable. As time passed, the eddy developed a more regular shape and moved to the positive Y-direction. Although the eddy’s size did not noticeably change, its vorticity however gradually decreased. Later, the anticyclonic eddy interacted with a cyclonic eddy, leading to a rapid decay of the anticyclonic eddy’s size in addition to significant shape deformation. An increase in the y-direction lead to the A0 anticyclonic eddy to approach the cyclonic eddy, which then resulted in the disappearance of the A0 eddy. Although negative vorticity continued to persist, we cannot detect closed streamlines. Moreover, the A0 and A2 merged to form a large anticyclonic eddy.
Further analyses have uncovered that there are two factors that affect the weakening of the A0 anticyclonic eddy. In the early stage, the eddy’s own inertial instability contributed to slow weakening but after T = 2.6T0, inertial instability itself weakened, but paradoxically, the pace of A0’s decay quickened. In later stages, A0’s rapid decay began to be affected by other eddies. Through a calculation of the strain rate, it is found that in the A0’s later stages, the eddy is becoming increasingly affected by. This led to the strain rate of the A0 eddy gradually increasing, leading to the destruction of the eddy’s circulation structure and hence, leading to A0’s rapid decay.
Through laboratory experiments, the present study finds that eddy interaction can cause a change in the eddy’s strain rate, which results in an eddy decay. We derive the pressure gradient field from the experiments which did not measure the relative pressure fields. The pressure gradient is used to discuss the dynamic cause of eddy motion. This study reveals the influence of inertial instability and eddy–eddy interaction on the anticyclonic eddy’s life evolution from the perspective of laboratory observation and contributes to our better understanding of eddy–eddy interaction and mechanisms of eddy decay.
It should be noted that the conclusions are reached based on the analysis of one single experiment. The sensitivity of the conclusions to physical paraments cannot be tested: such as the cylinder size, rotating speed, towering speed, and so on. Without the sensitivity experiments, the generalization of the conclusions is limited. Moreover, such sensitivity is important for one to better understand the physical mechanisms involved in the process. We will continue the study in the future by conducting more lab experiments about the subject.
Data Availability Statement
The original contributions presented in the study are included in the article/supplementary material, further inquiries can be directed to the corresponding author.
Author Contributions
GH and CD did literature search, collected the data, processed the data, and wrote the manuscript. JY, JS, AS, RC, and CD contributed to the revision of the manuscript. JS, AS, and RC participated in the data processing. All authors contributed to the article and approved the submitted version.
Funding
This work was supported by the National Key Research and Development Program of China (Nos. 2017YFA0604100, 2016YFA0601803, and 2016YFC1401407), the National Natural Science Foundation of China (Nos. 41476022, 41490643, and 41706008), the National Program on Global Change and AirSea Interaction (Nos. GASI-IPOVAI-02 and GASI-03-IPOVAI-05), and the China Ocean Mineral Resources R&D Association (Nos. DY135-E2-2-02 and DY135-E2-3-01). The authors are also grateful to 6th European Commission (EC) framework program – HYDRALAB, for the funding provided.
Conflict of Interest
The authors declare that the research was conducted in the absence of any commercial or financial relationships that could be construed as a potential conflict of interest.
Acknowledgments
These successful experiments took place on the Grenoble LEGI-Coriolis Laboratory, thanks to the expertise of Samuel Viboud and Henri Didelle on rotating experiments.
Footnotes
References
Alford, M. H., Shcherbina, A. Y., and Gregg, M. C. (2013). Observations of near-inertial internal gravity waves radiating from a frontal jet. J. Phys. Oceanogr. 43, 1225–1239. doi: 10.1175/jpo-d-12-0146.1
Arbic, B. K., Shriver, J. F., Hogan, P. J., and Hurlburt, H. E. (2009). Estimates of bottom flows and bottom boundary layer dissipation of the oceanic general circulation from global high-resolution models. J. Geophys. Res. Atmos. 114:C02024.
Billant, P., and Gallaire, F. (2005). Generalized Rayleigh criterion for non-axisymmetric centrifugal instabilities. J. Fluid Mech. 542, 365–379. doi: 10.1017/s0022112005006464
Boyer, D. L., and Davies, P. (1982). Flow past a cylinder on a beta plane. Philos. Trans. Roy. Soc. London. 306A, 33–56.
Caldeira, R. M. A., Marchesiello, P., Nezlin, N. P., Digiacomo, P. M., and McWilliams, J. C. (2005). Island wakes in the southern California Bight. J. Geophys. Res. Oceans 110:C11012.
Carnevale, G. F., Kloosterziel, R. C., Orlandi, P., and van Sommeren, D. D. J. A. (2011). Predicting the aftermath of vortex breakup in rotating flow. J. Fluid Mech. 669, 90–119. doi: 10.1017/s0022112010004945
Casella, E., Tepsich, P., Couvelard, X., Caldeira, R. M. A., and Schroeder, K. (2014). Ecosystem dynamics in the Liguro-Provençal Basin: the role of eddies in the biological production. Mediterr. Mar. Sci. 15, 274–286. doi: 10.12681/mms.520
Coutis, P. F., and Middleton, J. H. (2002). The physical and biological impact of a small island wake in the deep ocean. Deep-Sea Res. Oceanogr. Res. Pap. 49, 1341–1361. doi: 10.1016/s0967-0637(02)00029-8
Cui, W., Wang, W., Zhang, J., and Yang, J. (2019). Multicore structures and the splitting and merging of eddies in global oceans from satellite altimeter data. Ocean Sci. 15, 413–430. doi: 10.5194/os-15-413-2019
de Marez, C., Xavier, C., L’Hégaret, P., Meunier, T., Stegner, A., Morvan, M., et al. (2020). Oceanic vortex mergers are not isolated but influenced by the β-effect and surrounding eddies. Sci. Rep. 10:2897.
Doglioli, A. M., Griffa, A., and Magaldi, M. G. (2004). Numerical study of a coastal current on a steep slope in presence of a cape: the case of the Promontorio di Portofino. J. Geophys. Res. 109:C12033. doi: 10.1029/2004JC002422
Dong, C., Cao, Y., and McWilliams, J. C. (2018). Island wakes in shallow water. Atmos.-Ocean 56, 96–103. doi: 10.1080/07055900.2018.1448750
Dong, C., McWilliams, J. C., and Shchepetkin, A. F. (2007). Island wakes in deep water. J. Phys. Oceanogr. 37, 962–981. doi: 10.1175/jpo3047.1
Dritschel, D. G., and Waugh, D. W. (1992). Quantification of the inelastic interaction of unequal vortices in two-dimensional vortex dynamics. Phys Fluids A 4, 1737–1744. doi: 10.1063/1.858394
Duhaut, T., and Straub, D. N. (2006). Wind stress dependence on ocean surface velocity: implications for mechanical energy input to ocean circulation. J. Phys. Oceanogr. 36, 202–211. doi: 10.1175/jpo2842.1
Fang, F., and Morrow, R. (2003). Evolution, movement and decay of warm-core Leeuwin Current eddies. Deep Sea Res. 2 Top. Stud. Oceanogr. 50, 2245–2261. doi: 10.1016/s0967-0645(03)00055-9
Gallet, B., Campagne, A., Cortet, P. P., and Moisy, F. (2014). Scale-dependent cyclone-anticyclone asymmetry in a forced rotating turbulence experiment. Phys. Fluids 26:035108. doi: 10.1063/1.4867914
Han, G., Dong, C., Junde, L., and Yang, J. (2019). SST anomalies in the mozambique channel using remote sensing and numerical modeling data. Remote Sens. 11:1112. doi: 10.3390/rs11091112
Heywood, K. J., Stevens, D. P., and Bigg, G. R. (1996). Eddy formation behind the tropical island of Aldabra. Deep-Sea Res. I 43, 555–578.
Hua, B. L., and Klein, P. (1998). An exact criterion for the stirring properties of nearly two-dimensional turbulence. Physica D 113, 98–110. doi: 10.1016/s0167-2789(97)00143-7
Hughes, C. W., and Wilson, C. (2008). Wind work on the geostrophic ocean circulation: an observational study of the effect of small scales in the wind stress. J. Geophys. Res. 113:C02016.
Johnson, E. H., and Page, M. (1993). Flow past a circular cylinder on a beta-plane. J. Fluid Mech. 257, 603–626.
Kloosterziel, R. C., Carnevale, G. F., and Orlandi, P. (2007). Inertial instability in rotating and stratified fluids: barotropic vortices. J. Fluid Mech. 583, 379–412. doi: 10.1017/s0022112007006325
Kloosterziel, R. C., and Van Heijst, G. J. F. (1991). An experimental study of unstable barotropic vortices in a rotating fluid. J. Fluid Mech. 223, 1–24. doi: 10.1017/s0022112091001301
Lahaye, N., and Zeitlin, V. (2015). Centrifugal, barotropic and baroclinic instabilities of isolated ageostrophic anticyclones in the two-layer rotating shallow water model and their nonlinear saturation. J. Fluid Mech. 762, 5–34. doi: 10.1017/jfm.2014.631
Lazar, A., Stegner, A., Caldeira, R., Dong, C., Didelle, H., and Vuiboud, S. (2013a). Inertial instability of intense stratified anticyclones. part 2. laboratory experiments. J. Fluid Mech. 732, 485–509. doi: 10.1017/jfm.2013.413
Lazar, A., Stegner, A., and Heifetz, E. (2013b). Inertial instability of intense stratified anticyclones. part 1. generalized stability criterion. J. Fluid Mech. 732, 457–484. doi: 10.1017/jfm.2013.412
Le Vu, B., Stegner, A., and Arsouze, T. (2018). Angular momentum eddy detection and tracking algorithm (AMEDA) and its application to coastal eddy formation. J. Atmos. Ocean. Technol. 35, 739–762. doi: 10.1175/jtech-d-17-0010.1
Liu, Z., and Andutta, F. P. (2020). A Study on an anticyclonic-cyclonic eddy pair off Fraser Island, Australia. Front. Marine Sci. 7:594358. doi: 10.3389/fmars.2020.594358
Mahdinia, M., Hassanzadeh, P., Marcus, P. S., and Jiang, C. H. (2017). Stability of three-dimensional gaussian vortices in an unbounded, rotating, vertically stratified, boussinesq flow: linear analysis. J. Fluid Mech. 824, 97–134. doi: 10.1017/jfm.2017.303
Marshall, D. P., and Garabato, A. N. (2008). A conjecture on the role of bottom-enhanced diapycnal mixing in the parameterization of geostrophic eddies. J. Phys. Oceanogr. 38, 1607–1613. doi: 10.1175/2007jpo3619.1
McWilliams, J. C. (1984). The emergence of isolated coherent vortices in turbulent flow. J. Fluid Mech. 146, 21–43. doi: 10.1017/s0022112084001750
Meunier, T., Pallás-Sanz, E., Tenreiro, M., Portela, E., Ochoa-de-la-Torre, J. L., Ruiz-Angulo, A., et al. (2018). The vertical structure of a Loop Current Eddy. J. Geophys. Res. Oceans 123, 6070–6090. doi: 10.1029/2018jc013801
Mkhinini, N., Coimbra, A. L. S., Stegner, A., and Arsouze, T. (2014). Long-lived mesoscale eddies in the eastern Mediterranean Sea: analysis of 20 years of AVISO geostrophic velocities. J. Geophys. Res. Oceans 119, 8603–8626. doi: 10.1002/2014jc010176
Molemaker, M. J., Mcwilliams, J. C., and Yavneh, I. (2005). Baroclinic instability and loss of balance. J. Phys. Oceanogr. 35, 1505–1517. doi: 10.1175/jpo2770.1
Mutabazi, I., Normand, C., and Wesfreid, J. E. (1992). Gap size effects on centrifugally and .rotationally driven instabilities. Phys. Fluids A 4, 1199–1205. doi: 10.1063/1.858238
Nan, F., He, Z., Zhou, H., and Wang, D. (2011). Three long-lived anticyclonic eddies in the northern South China sea. J. Geophys. Res. Oceans 116:C05002.
Neill, S. P., and Elliott, A. J. (2004). Observations and simulations of an unsteady island wake in the Firth of Forth, Scotland. Ocean Dyn. 54, 324–332.
Page, M. A. (1985). On the low Rossby number of a rotating fluid past a circular cylinder. J. Fluid Mech. 156, 205–221.
Perfect, B., Kumar, N., and Riley, J. J. (2018). Vortex structures in the wake of an idealized seamount in rotating, stratified flow. Geophys. Res. Lett. 45, 9098–9105. doi: 10.1029/2018gl078703
Perret, G., Stegner, A., Farge, M., and Pichon, T. (2006). Cyclone-anticyclone asymmetry of large-scale wakes in the laboratory. Phys. Fluids 18:036603. doi: 10.1063/1.2179387
Plougonven, R., and Zeitlin, V. (2009). Nonlinear development of inertial instability in a barotropic shear. Phys. Fluids 21, 1004–1013.
Rayleigh, L. (1916). On the dynamics of revolving fluids. Proc. R Soc. Lond. A Math. Phys. Sci. 93, 148–154. doi: 10.1098/rspa.1917.0010
Sen, A., Scott, R., and Arbic, B. (2008). Global energy dissipation rate of deep-ocean low-frequency flows by quadratic bottom boundary layer drag: computations from current-meter data. Geophys. Res. Lett. 35:L09606.
Sheen, K. L., Naveira Garabato, A. C., Brearley, J. A., Meredith, M. P., Polzin, K. L., Smeed, D., et al. (2014). Eddy-induced variability in Southern Ocean abyssal mixing on climatic timescales. Nature Geosci. 7, 577–582. doi: 10.1038/ngeo2200
Stegner, A. (2014). “Chapter 14 in modeling atmospheric and oceanic fluid flow: insights from laboratory experiments and numerical simulations, geophysical monograph 205,” in Oceanic Island Wake Flow in Laboratory, 1st ed., eds T. von Larcher and P. D. Williams (American Geophysical Union, John Wiley and Sons, Inc.)
Tansley, C., and Marshall, D. (2001). Flow past a cylinder on a beta-plane with application to Gulf Stream separation and the Antarctic Circumpolar Current. J. Phys. Oceanogr. 31, 3274–3283.
Teinturier, S., Stegner, A., Didelle, H., and Viboud, S. (2010). Small-scale instabilities of an island wake flow in a rotating shallow-water layer. Dyn. Atmos. oceans 49, 1–24. doi: 10.1016/j.dynatmoce.2008.10.006
Tomczak, M. (1988). Island wakes in deep and shallow water. J. Geophys. Res. Oceans 93, 5153–5154. doi: 10.1029/jc093ic05p05153
Weiss, J. (1991). The dynamics of enstrophy transfer in two-dimensional hydrodynamics. Physica D 48, 273–294. doi: 10.1016/0167-2789(91)90088-q
Yang, Q., Liu, H., and Lin, P. (2020). The effect of oceanic mesoscale eddies on the looping path of the Kuroshio intrusion in the Luzon Strait. Sci. Rep. 10:636.
Yim, E., Stegner, A., and Billant, P. (2019). Stability criterion for the centrifugal instability of surface intensified anticyclones. J. Phys. Oceanogr. 49, 827–849. doi: 10.1175/jpo-d-18-0088.1
Keywords: laboratory experiment, inertial instability, eddy–eddy interaction, anticyclonic eddy, island wakes
Citation: Han G, Dong C, Yang J, Sommeria J, Stegner A and Caldeira RMA (2021) Strain Evolution and Instability of an Anticyclonic Eddy From a Laboratory Experiment. Front. Mar. Sci. 8:645531. doi: 10.3389/fmars.2021.645531
Received: 18 January 2021; Accepted: 14 May 2021;
Published: 11 June 2021.
Edited by:
Frédéric Cyr, Fisheries and Oceans Canada, CanadaReviewed by:
Nicolas Grisouard, University of Toronto, CanadaStefania Espa, Sapienza University of Rome, Italy
Copyright © 2021 Han, Dong, Yang, Sommeria, Stegner and Caldeira. This is an open-access article distributed under the terms of the Creative Commons Attribution License (CC BY). The use, distribution or reproduction in other forums is permitted, provided the original author(s) and the copyright owner(s) are credited and that the original publication in this journal is cited, in accordance with accepted academic practice. No use, distribution or reproduction is permitted which does not comply with these terms.
*Correspondence: Changming Dong, Y21kb25nQG51aXN0LmVkdS5jbg==