 R. Cotton Rockwood
 Jeffrey D. Adams
 Sean Hastings
 Jessica Morten
 Jaime Jahncke1
- 1Point Blue Conservation Science, Petaluma, CA, United States
- 2Office of Protected Resources, National Marine Fisheries Service, Silver Spring, MD, United States
- 3Channel Islands National Marine Sanctuary, National Oceanic and Atmospheric Administration, Santa Barbara, CA, United States
- 4Greater Farallones Association, San Francisco, CA, United States
Vessel strikes have been documented around the world and frequently figure as a top human cause of large whale mortality. The shipping lanes in the Santa Barbara Channel, California and nearby waters have some of the highest predicted whale mortality from vessel strikes in the United States waters of the eastern Pacific. Beginning in 2007, National Oceanographic and Atmospheric Administration requested voluntary vessel speed reductions (VSRs) for vessels greater than 300 GT traveling in the Santa Barbara Channel shipping routes to decrease whale mortality from ship strikes. We employed a ship strike model using whale density data and automatic identification system (AIS) vessel data to estimate mortality under several management scenarios. To assess the effect of the VSR on strike mortality, we bootstrapped speeds from vessels greater than 19 m long that transited when no VSR was in place. Finally, we calculated the predicted mortality for hypothetical cooperation scenarios by artificially adding speed caps post-hoc to real vessel transits. For 2012–2018, we estimated that in our study area on average during summer/fall (June–November) 8.9 blue, 4.6 humpback, and 9.7 fin whales were killed from ship strikes each year (13–26% greater than previously estimated). We evaluated winter/spring (January–April) humpback mortality for the first time, resulting in an estimate of 5.7 deaths on average per year. Poor cooperation with the VSR led to low (5% maximum) to no reductions in the estimated number of strike mortalities. Evaluating potential scenarios showed that if 95% cooperation occurred in the lanes, whale deaths there would decrease by 22–26%. Adding VSRs with similar cooperation levels at the northern end of the Santa Barbara Channel and south of Channel Islands National Marine Sanctuary could decrease estimated strike mortalities in those areas by 30%. If VSRs were added and cooperation reached 95% there and in the lanes, we estimate a 21–29% decrease in vessel strike mortalities could be attained relative to estimated mortality in the entire study area. To decrease the vessel strike related whale mortalities in this region, we recommend expanding the VSR areas and increasing cooperation voluntarily, or considering mandatory speed limits if desired cooperation levels cannot otherwise be met.
Introduction
Shipping is a primary means for moving goods and, with an increasingly global economy, marine vessel density grew by four times between the early 1990s and 2012 (Tournadre, 2014). Increases in vessel density lead to increases in ocean noise, pollution, and disturbance of wildlife (Laist et al., 2001). Impacts to large marine species from increased vessel density have included direct mortality from vessel strikes (Pirotta et al., 2019). Where vessels transit and overlap with whale populations around the world, whales experience injury and death from collisions (vessel strikes). Strike mortality is difficult to quantify accurately, but based on documented minimum occurrences, vessel strikes are considered one of the top two human threats to large whales (Clapham et al., 1999; Peel et al., 2018; Schoeman et al., 2020).
A limited number of management tools have been proven to decrease strike mortality (Silber et al., 2012b, 2016). Where possible, it is ideal to move vessel traffic away from high-density whale areas by establishing or modifying official shipping lanes (also known as traffic separation schemes, TSSs) or defining areas-to-be-avoided (ATBA) by vessel traffic. Where vessel traffic and whales necessarily overlap in time and space, adding mandatory speed restrictions to decrease vessel speeds in high-risk areas has been successful at lowering deaths (van der Hoop et al., 2015). However, vessel types, densities and speeds, and whale distribution and behavior vary widely in different settings. These location-specific differences can significantly alter the success of conservation programs (McKenna et al., 2012; Nichol et al., 2017; Rockwood et al., 2017). This has led to calls for a more holistic approach to vessel strike management that includes critical evaluation of cost-effectiveness, the necessity of actions to achieve population management goals and trade-offs with shipping (Sèbe et al., 2019). For this reason, we have developed a method to (1) evaluate the effectiveness of previous speed reductions using control periods and (2) simulate how many vessel-strike related whale deaths could be avoided with higher vessel speed reduction (VSR) participation. Results from our analysis can help managers evaluate speed limit program success and how increasing cooperation or expanding speed reduction areas may change mortality from vessel strikes. We focus here on a key region for United States west coast populations of blue, humpback, and fin whales in waters off Southern California (Figure 1), where high overlap of whales and intense shipping has resulted in many recorded and estimated vessel-strike related whale mortalities that may be inhibiting the recovery of these endangered populations.
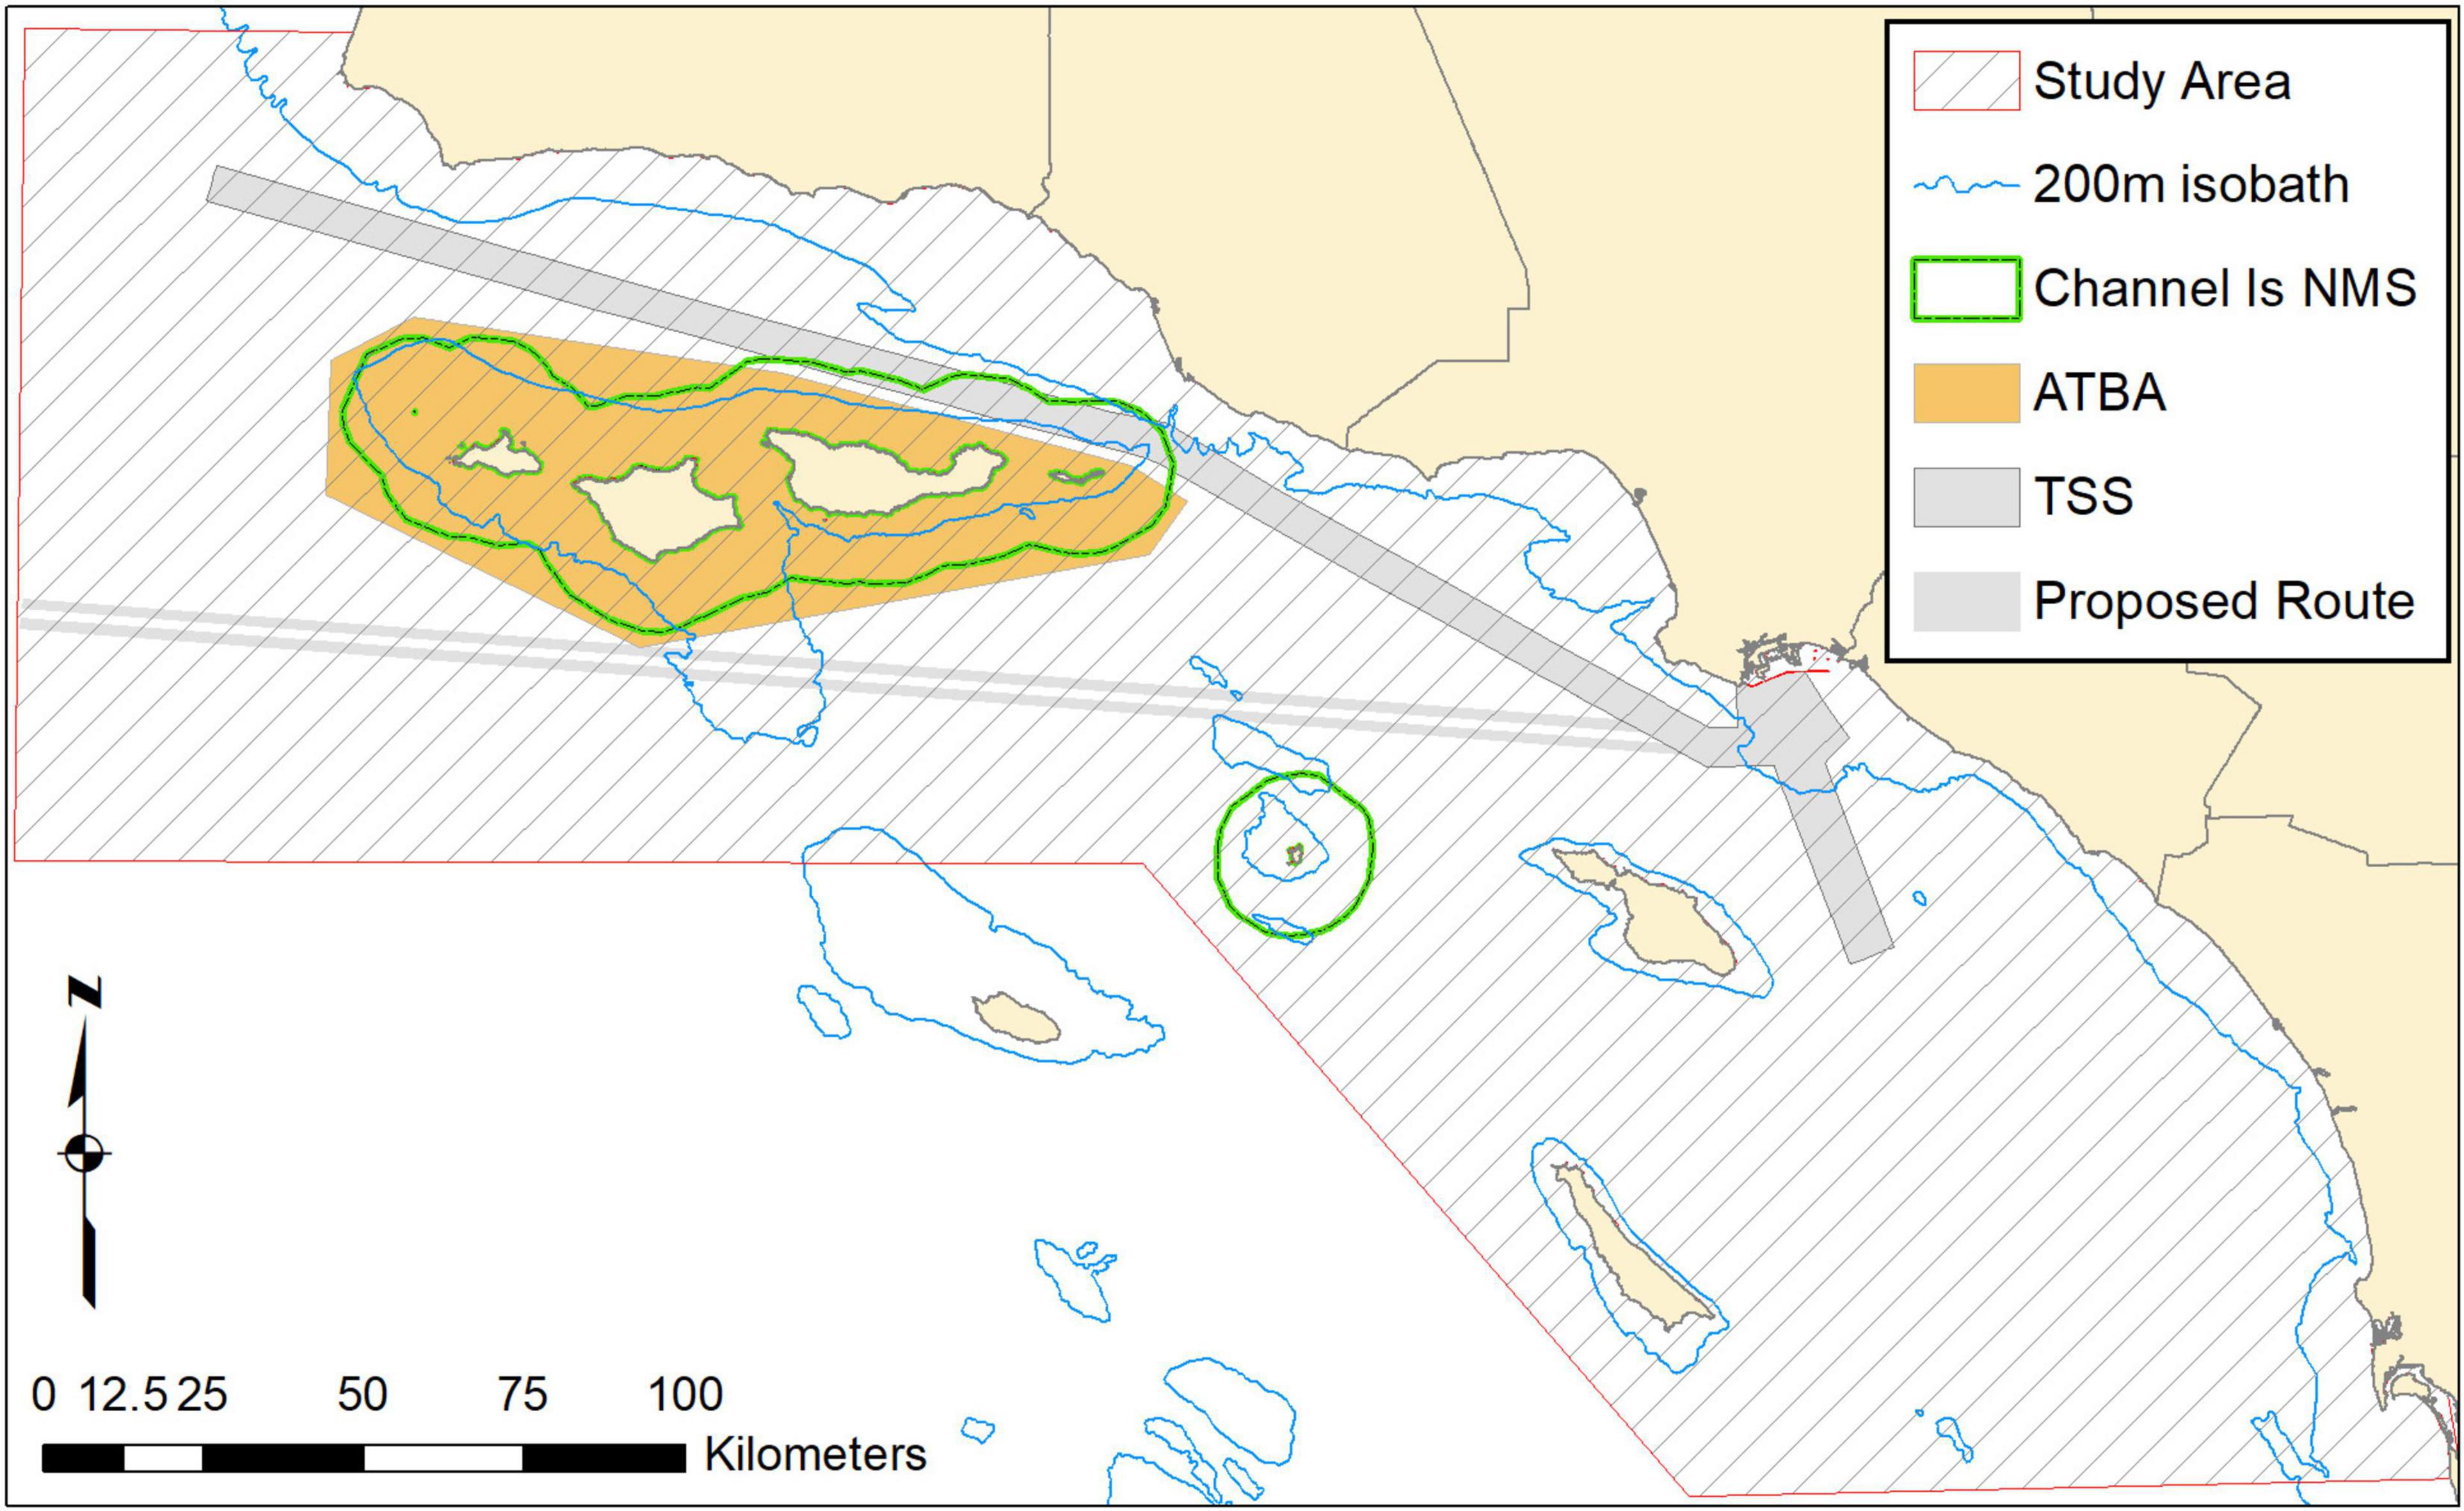
Figure 1. Study area including shipping approaches (TSS) to Los Angeles and Long Beach ports, area to be avoided (ATBA), the proposed western route, 200-m depth contour, and sanctuary boundary (Channel Is NMS).
Mandatory VSRs as a method to decrease vessel strike mortality were initially deployed to address unsustainable levels of mortality experienced by the North Atlantic right whale (Eubalaena glacialis) (Laist et al., 2014). This important effort led to research that established increases in collision risk as vessel speeds increase (Conn and Silber, 2013). Higher vessel speeds also increase the probability of death when a collision occurs (Vanderlaan and Taggart, 2009; van der Hoop et al., 2012; Conn and Silber, 2013) though a recent biophysical model suggests that even low-speed impacts can result in death (Kelley et al., 2021). Analysis of regional data has shown that VSR programs were at least somewhat successful, with lower strike incidence and an increasing population of right whales in the years following regulatory action (Laist et al., 2014; van der Hoop et al., 2015). However, in recent years, the north Atlantic right whale population has been in decline and vessel strikes remain a serious threat to the species (Pace et al., 2017). To date, while some voluntary programs have shown signs of increasing cooperation (e.g., Constantine et al., 2015), most other voluntary VSRs have been ineffective (McKenna et al., 2012; Laist et al., 2014; Freedman et al., 2017). As one of the few tools to decrease vessel strike deaths, speed reductions, both mandated and voluntary, have now been used around the world from New Zealand to Panama to the Mediterranean to the Pacific coast of North America (Louzao et al., 2009; Constantine et al., 2015; Freedman et al., 2017; Guzman et al., 2020; Rockwood et al., 2020b).
On the United States west coast, blue (Balaenoptera musculus), humpback (Megaptera novaeangliae), and fin (Balaenoptera physalus) whale populations continue to experience an increasing number of vessel strike mortalities. Based on stranded carcass necropsies, vessel collisions rank among the top sources of human-caused mortality for Pacific stocks of blue, humpback, and fin whales (Carretta et al., 2020). Reliance on stranded whale carcasses to quantify vessel strike deaths leads to large underestimates of actual mortality because most dead whales sink (Reisdorf et al., 2012; Moore et al., 2020; Pace et al., 2021). To improve upon minimum estimates from necropsies, Rockwood et al. (2017) applied a modeling approach to the United States exclusive economic zone (EEZ) off California, Oregon, and Washington. The authors estimated that 18 blue, 22 humpback, and 43 fin whales were killed on average per year during periods of peak seasonal whale abundance from July to December, using mean whale distribution predictions from data collected during 1998–2009. Rockwood et al. (2017) predicted the Santa Barbara Channel (hereafter, Channel) shipping lanes and surrounding waters of the Southern California Bight to be some of the highest risk strike areas for blue, humpback, and fin whales.
The eastern Pacific populations of all three species are listed under the Endangered Species Act: blue whales – Endangered, humpback whales – one Threatened distinct population segment (DPS), one Endangered DPS, and fin whales – Endangered. The National Oceanographic and Atmospheric Administration (NOAA) is charged with marine mammal protection and for each stock, calculates the Potential Biological Removal (PBR), which is the maximum number of human-caused deaths that may occur while allowing the stock to reach or maintain its optimum sustainable population. PBR is a precautionary metric calculated from a population’s minimum abundance estimate, maximum net productivity rate, and a recovery factor (Wade, 1998), and is an important benchmark for conservation and management of whales. The yearly PBR in west coast United States waters is 1.23 for blue, 16.7 for humpback, and 81 for fin whales (Carretta et al., 2020). The predicted high risk in the northwest Southern California Bight comes, in part, because the region comprises one of the most important feeding areas for blue, humpback, and fin whales during summer and fall (Calambokidis et al., 2015). The Eastern N. Pacific stock of blue whales migrates as far as the Gulf of Alaska during summer and returns to waters offshore of southern California and Central America in winter (Irvine et al., 2014; Abrahms et al., 2019). Humpback whales in this region comprise the California/Oregon/Washington stock which includes the endangered Central American DPS, and the threatened Mexico DPS (Wade, 2017; Carretta et al., 2020). Humpback whales in the eastern Pacific also migrate north during summer and return to warmer tropical and subtropical waters in the winter. The California/Oregon/Washington stock of fin whales is larger than stocks of either blue or humpback whales but their seasonal movement patterns remain largely unknown (Mizroch et al., 2009; Oleson et al., 2014; Irvine et al., 2019).
In 2007, NOAA recognized an unusual mortality event (UME) after four blue whales were confirmed killed by vessel collisions in the Southern California Bight. This event elevated vessel strikes as a significant issue of concern for whale populations along the United States west coast. Subsequently, researchers recognized the ecological importance of waters adjacent to the ports of Long Beach/Los Angeles and the approaching vessel traffic lanes for whales (Irvine et al., 2014; Calambokidis et al., 2015), in part explaining the deaths that occurred in 2007. During the UME, a vessel strike subcommittee (2007–2008) and later a working group (2015–2016) of NOAA’s Channel Islands National Marine Sanctuary (CINMS) explored and recommended conservation efforts to decrease vessel strike mortality (Channel Islands National Marine Sanctuary Advisory Council Marine Shipping Working Group, 2016). The first actions taken were to establish a seasonally based voluntary VSR program (2007-present) (Freedman et al., 2017), extensively engage the shipping industry on ship strikes and voluntary VSR, support whale monitoring and research and narrow the Channel TSS through an IMO process (implemented in 2013). This latter effort was specifically recommended to the IMO as a measure to reduce the overlap between large vessels and whales in and near the Channel.
National Oceanographic and Atmospheric Administration’s CINMS (hereafter, Sanctuary) and the National Marine Fisheries Service (NMFS) have implemented seasonal voluntary VSR from 2007 to present for vessels 300 gross registered tons and larger (Freedman et al., 2017; Figure 2). In some years (2007, 2010–2012, and 2015-present), the VSR included specific requests to travel at 10-kn or below. In 2013–2014, the notice only requested that vessels reduce speed. From 2007 to 2017, the agencies dynamically adjusted the seasonal timing and locations of VSR zones (Figure 2) based on confirmed visual sightings of blue, humpback, and/or fin whales. From 2018 to the present, the VSR zone has covered the same area and had a base duration from May to November subject to extension if elevated whale sightings continue beyond November. The VSR timeframe coincides with the average arrival and departure times of whales in the region. In all years, the VSR program has been broadcast via the United States Coast Guard’s weekly Local Notice to Mariners, communicated to mariners through industry liaisons, NOAA weather radio broadcasts and direct outreach to carrier companies. Beginning in 2014, to increase VSR cooperation and lower air pollution, the Sanctuary partnered with the Santa Barbara and Ventura County Air Pollution Control Districts to offer modest monetary incentives and positive press to container and car carrier shipping companies for adhering to 12-kn VSRs, and beginning in 2018, 10-kn VSRs. Participating and cooperating ship transits in this incentive VSR program have increased through the years but remain a moderate proportion of total large vessel traffic through this area (Freedman et al., 2017). While there has been limited cooperation with voluntary VSRs in this region (Table 6) and elsewhere, incentivized programs and mandatory regulations have been shown to garner high vessel compliance (McKenna et al., 2012; Silber et al., 2014; Freedman et al., 2017).
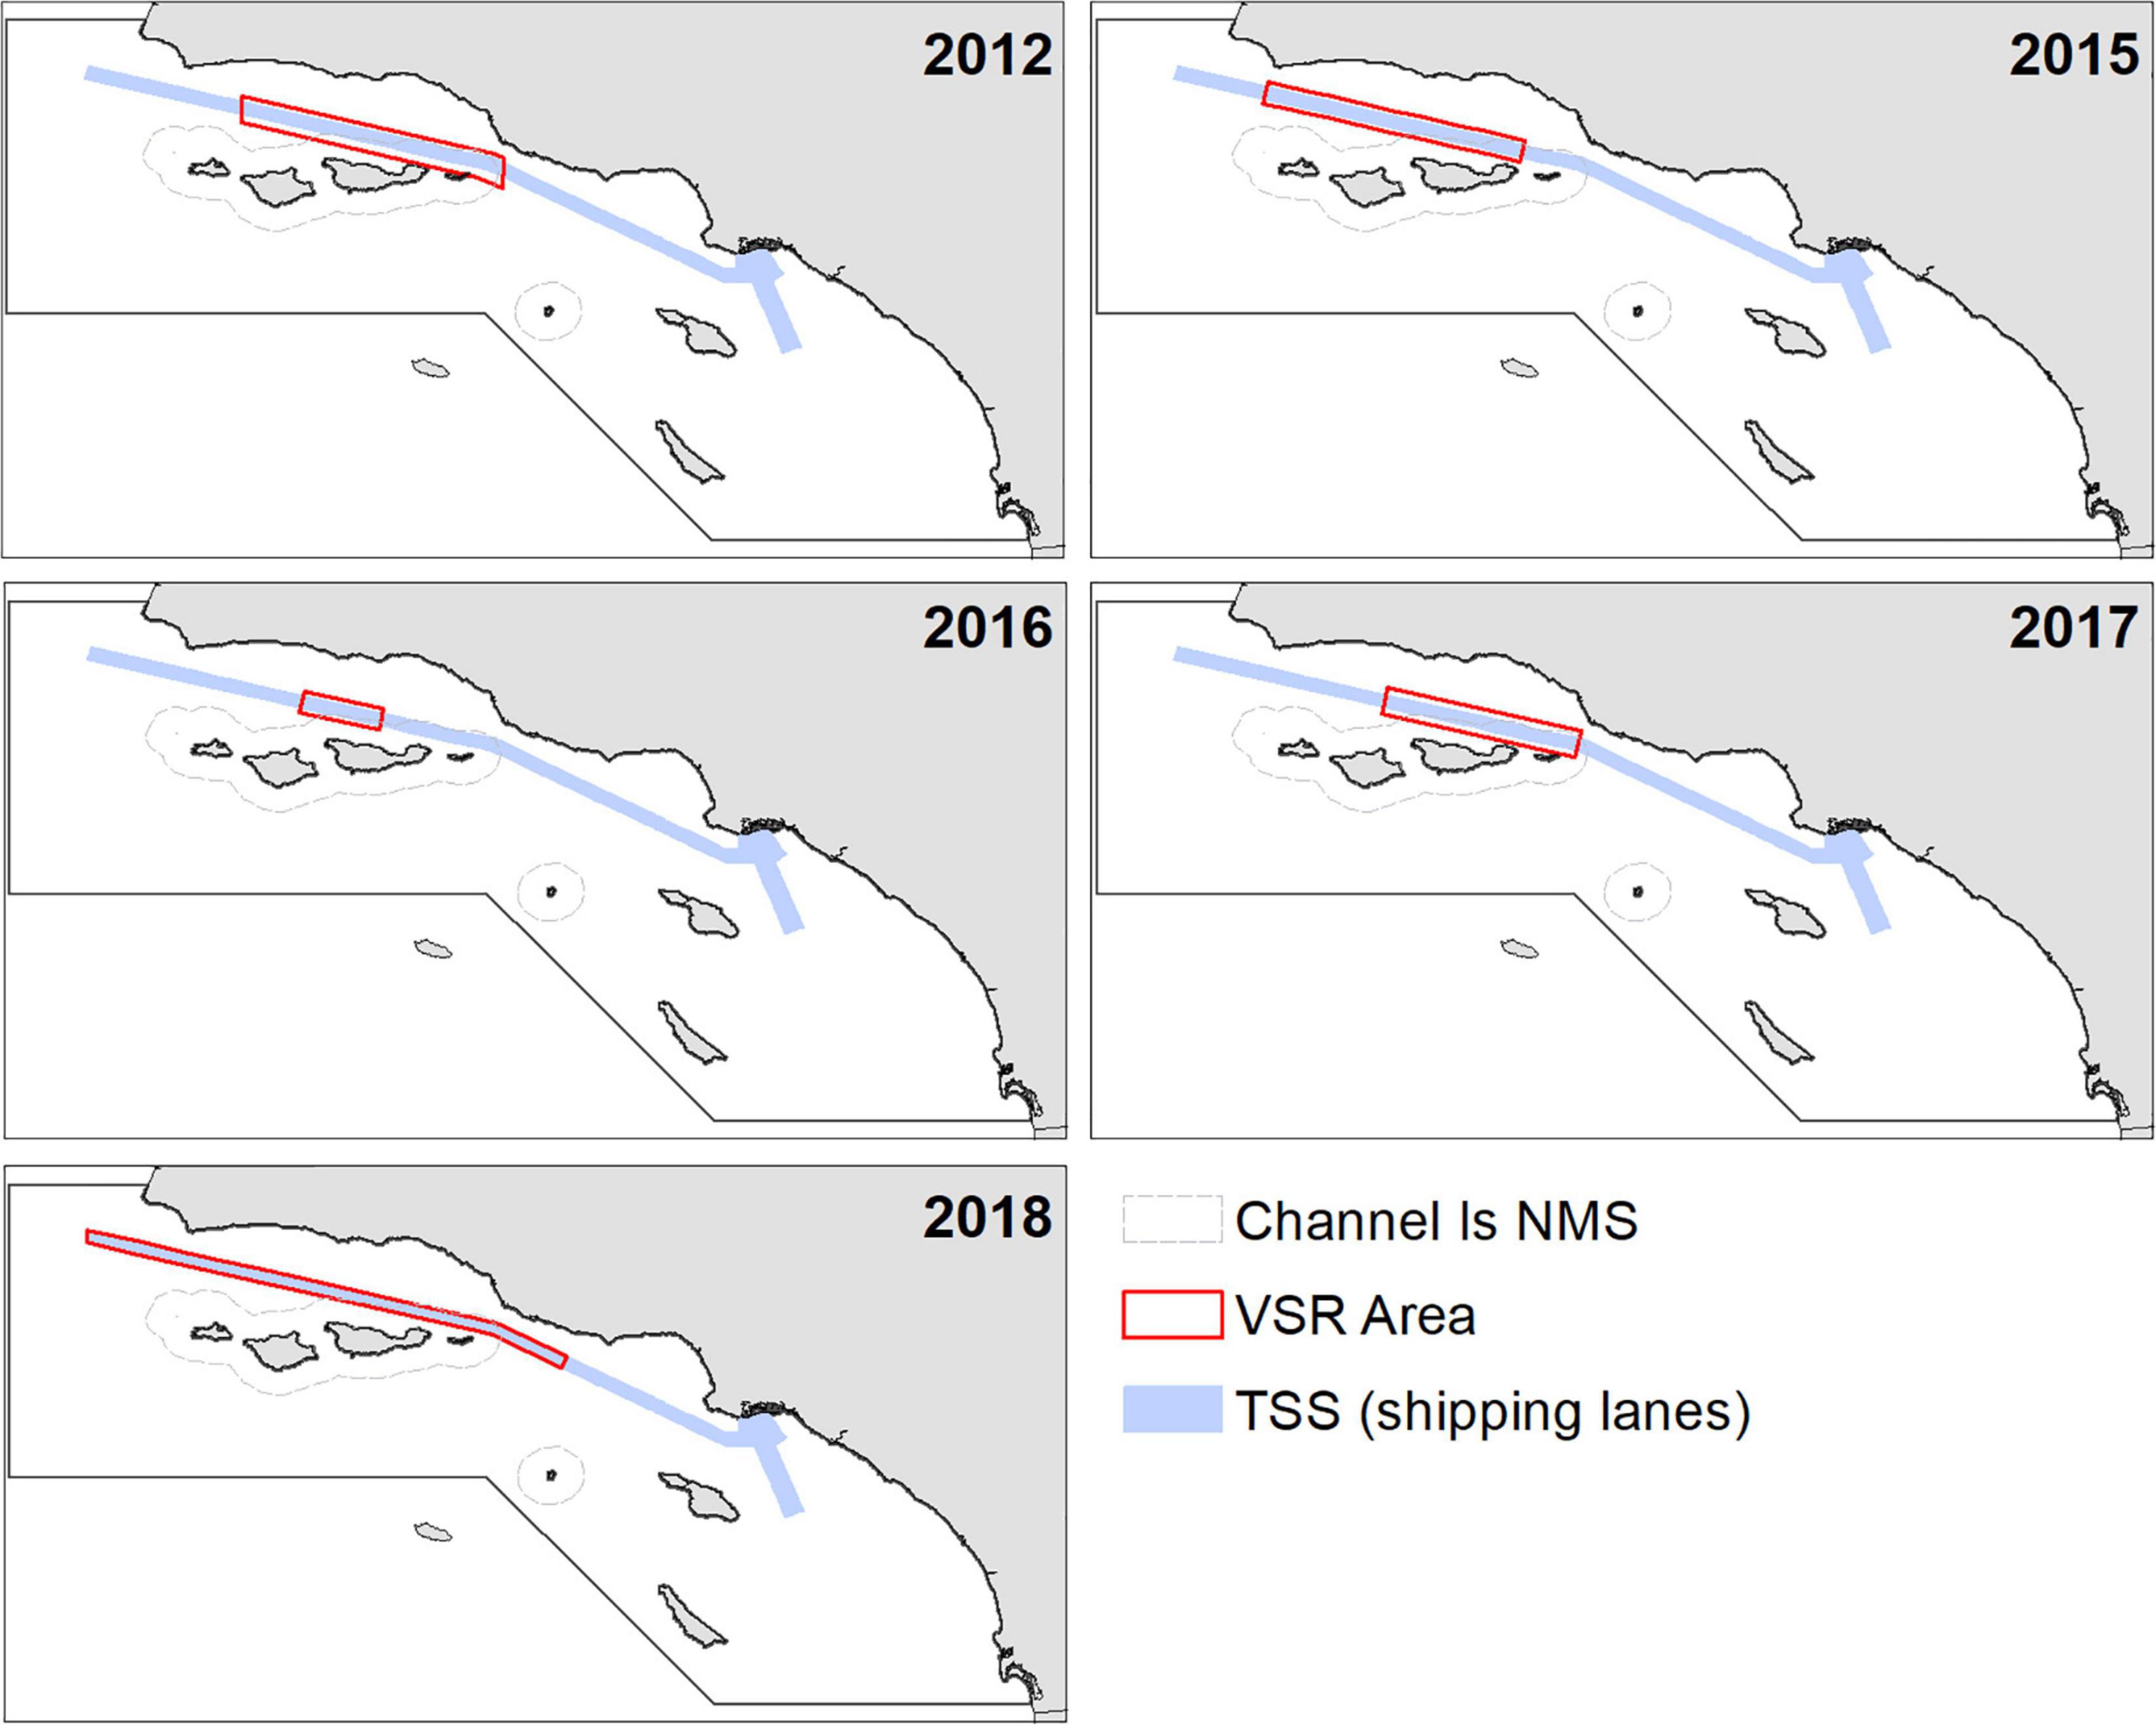
Figure 2. Areas of the official annual National Oceanographic and Atmospheric Administration (NOAA) notices requesting speed reductions (VSRs). Specific 10-kn VSRs were requested in these defined areas in 2012 and 2015–2018.
Concurrent with this history and these conservation actions, there has also been a 12-kn VSR port incentive program (to reduce emissions) within a radius of 40 nm around the ports of Los Angeles and Long Beach since 2001 (Figure 3). These different and concurrent programs complicate ship speed analyses and estimation of attributed benefits. In addition, more stringent air pollution regulations in state vs. international waters led to more mariners choosing to travel farther offshore by way of a western approach (similar to the proposed western lane in Figure 1) during 2009–2012 in order to reduce fuel costs (Moore et al., 2018). By 2015, most vessels had returned to the Channel TSS. Finally, there has also been a long-term trend of decreasing vessel speeds across all west coast waters (Moore et al., 2018), confounding use of vessel speeds in earlier years as a control compared to speeds during VSRs.
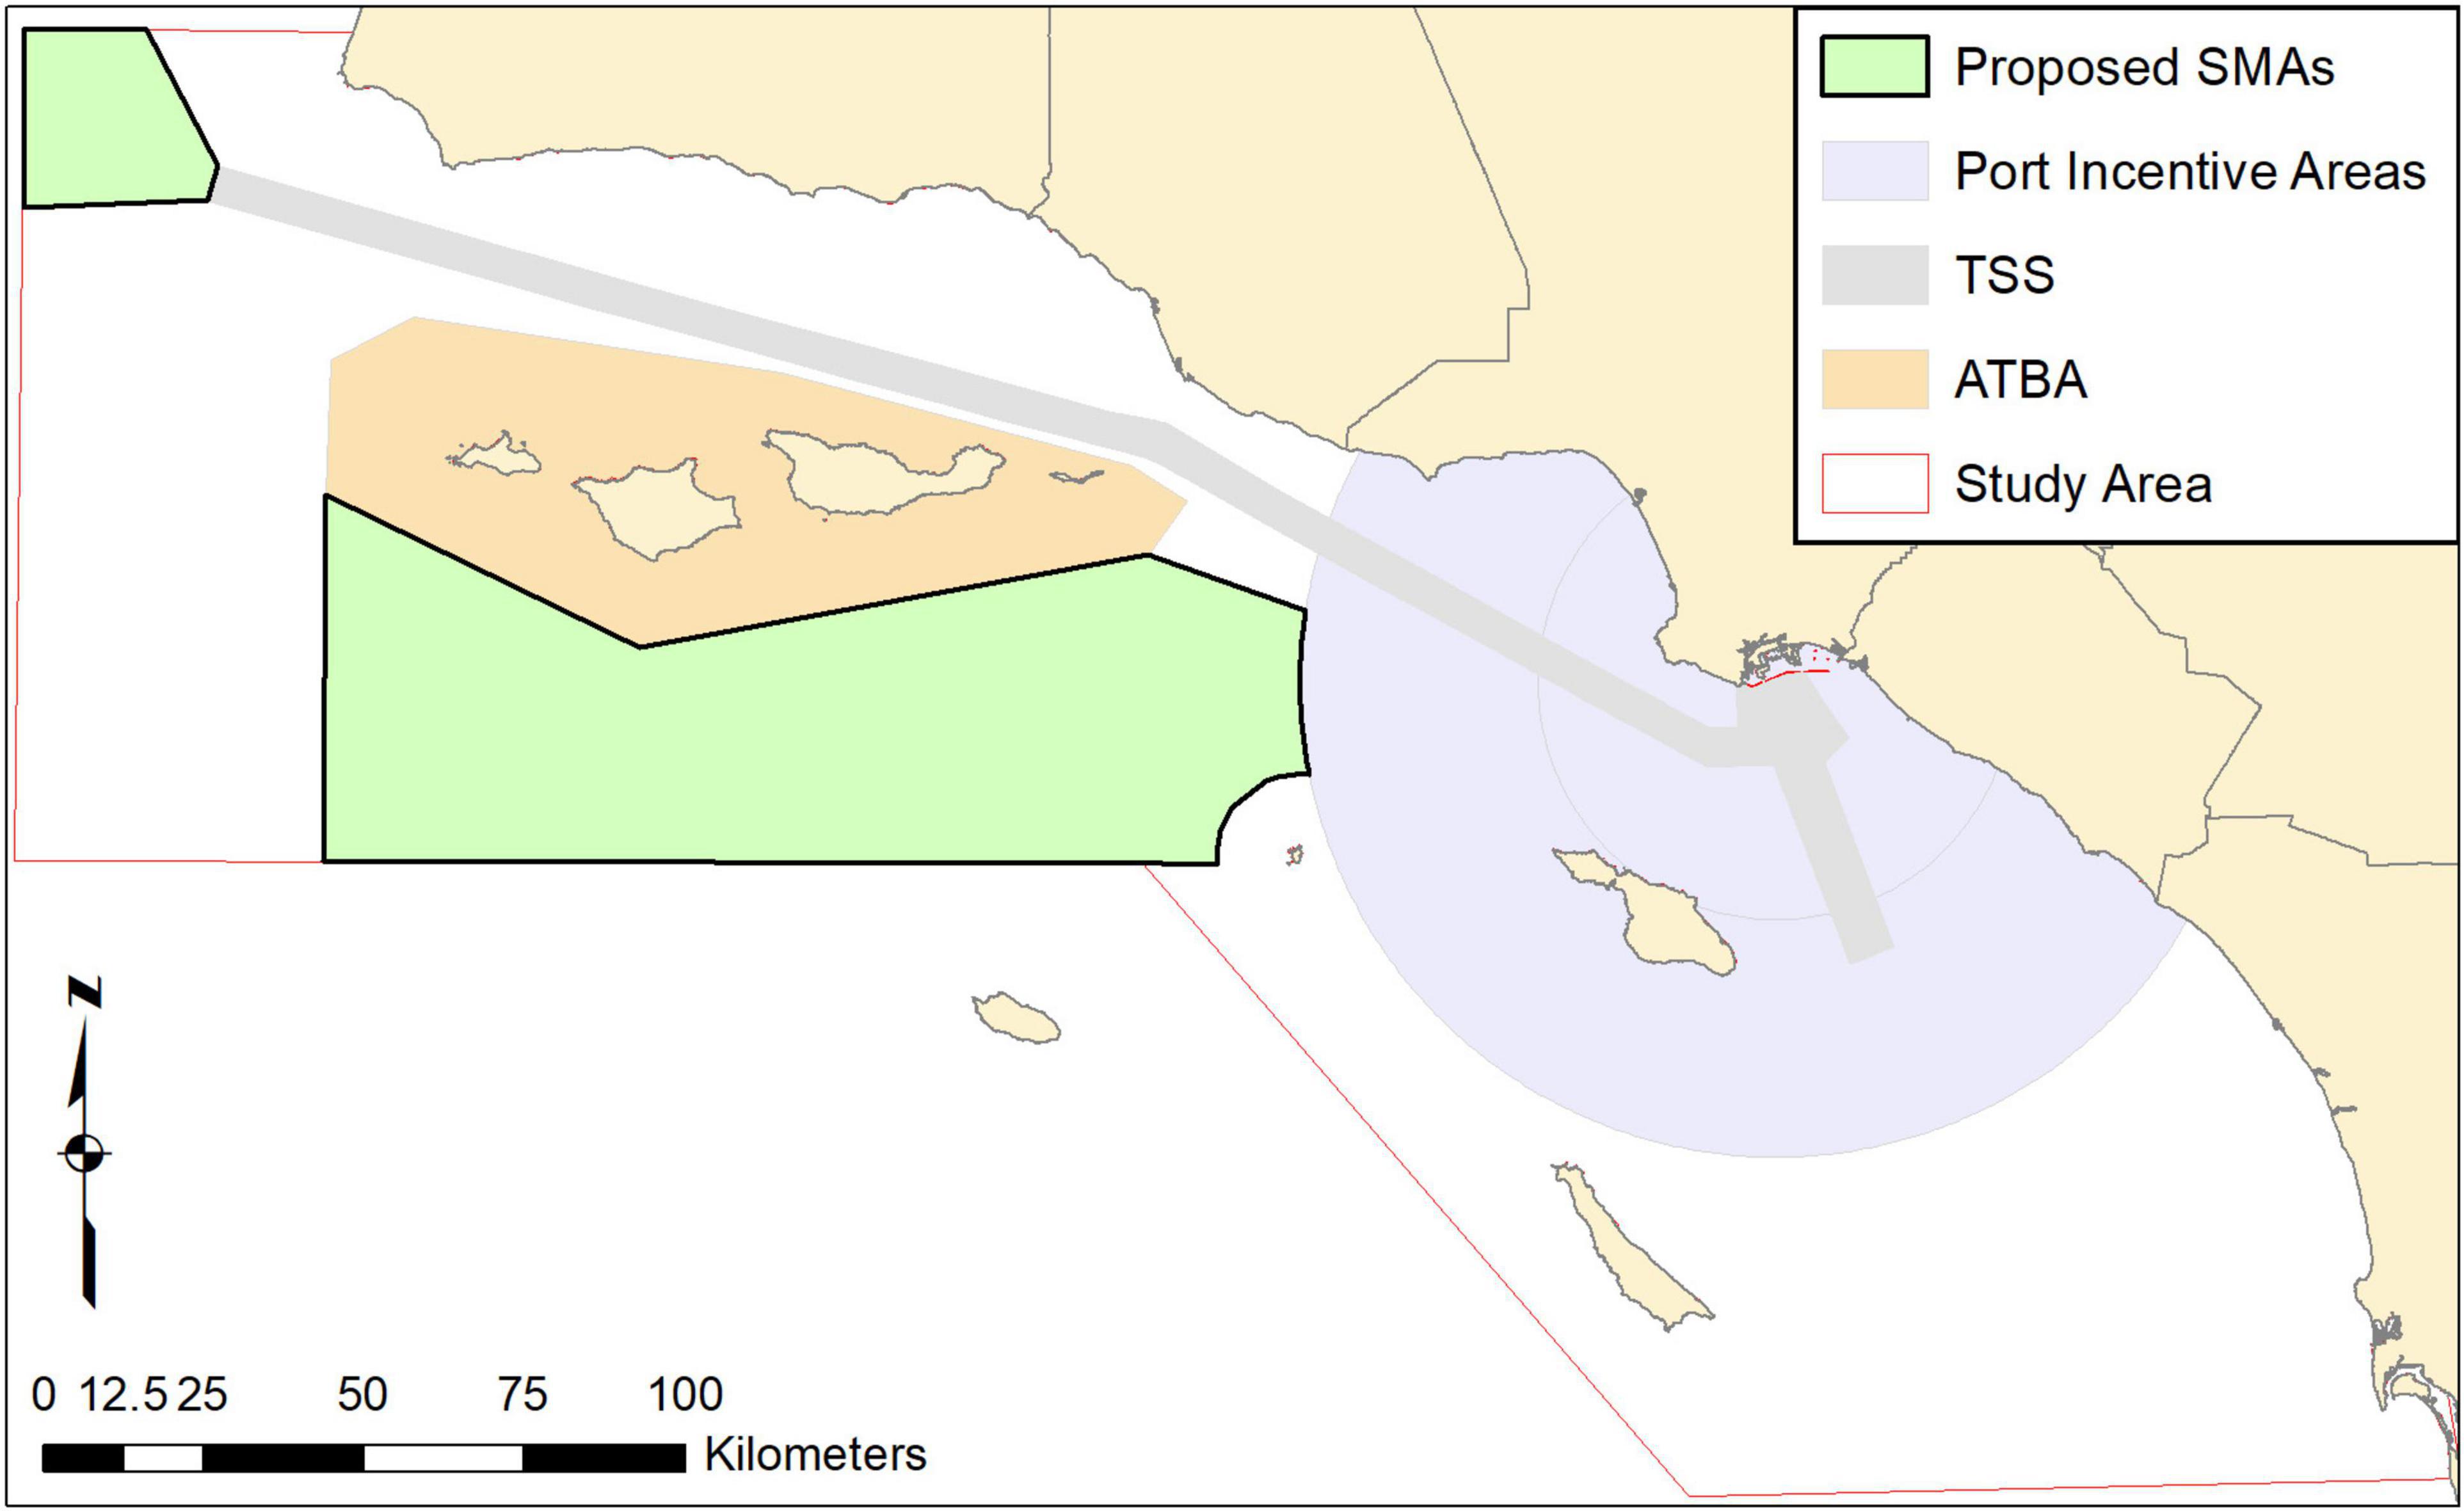
Figure 3. Two potential seasonal management areas (SMAs) for additional speed management delineated based on the greatest risk strike areas for all three whale species.
Despite these analytical complications, or perhaps because of them, it is important to evaluate vessel strikes and the effectiveness of past management action (VSRs) across years in as controlled and quantitative a manner as possible. To do this, we used whale habitat-based density models of blue, humpback, and fin whales (Becker et al., 2016, 2017) along with vessel data, in an encounter rate model to improve regional model predictions of vessel strike mortality for approaches to Los Angeles and Long Beach ports and surrounding waters. We also performed a model assessment of the change in mortality attributable to vessel speed changes during the years when the VSR was in effect. Finally, we modeled the hypothetical changes in vessel-related whale mortality under a variety of VSR scenarios including speed limits of 12 or 10 kn and cooperation levels ranging up to 95% cooperation. The results of this work help place the magnitude and spatial and temporal patterns of southern California strike mortality in context for three listed whale species. Our analysis of past VSRs can drive improvements to the VSR program. By simulating the results of potential future improvements in cooperation or changes in the area of management, decision-makers can chart the best path to decrease the deaths caused by vessel collisions. While we apply these methods to large whales in southern California, our approach can be applied in other regions and for other large marine species that are impacted by vessel strike mortality.
Materials and Methods
Study Area
The study area spans from Point Conception, California in the north to San Diego in the south and extends offshore approximately 100 km, covering a total of 39,889 km2 that includes the Sanctuary (Figure 1). Within the study area, the Santa Barbara and San Pedro Channels are particularly notable for high productivity and consistent feeding aggregations of baleen whales (Calambokidis et al., 2015). The Channel TSS extends northwest from the precautionary area outside the Los Angeles/Long Beach Port complex, traversing between the northern Channel Islands and the mainland (Figure 1).
We developed a spatial grid within the study area comprised of 47,955 ∼1 km2 grid cells. Vessel-strike related mortality for all three species was modeled across the entire study area, while pre/post VSR mortality comparisons were assessed only within the VSR request areas for each year (Figure 2), which covered 1,781 km2 and 2,434 cells in total. VSR scenarios were calculated within the TSS and two potential seasonal management areas (SMAs), which we defined for this analysis – polygon areas that contained the majority of high-mortality predictions outside the TSS (Figure 3).
Whale Data
Whale density for summer/fall (July–December) for all three species was sourced from model predictions produced by Becker et al. (2016; Figure 4). These data are available from the author by request. Humpback whale winter/spring (January–April) density was derived from Becker et al. (2017), which used similar modeling approaches. These data are available online at https://cetsound.noaa.gov/cda. To briefly review the methods: species distribution models were built using environmental predictors and fit to whale sightings from systematic boat-based line transect surveys. Surveys for Becker et al. (2016) were conducted by NOAA in June–November between 1991 and 2009, while those for Becker et al. (2017) were conducted by the California Cooperative Oceanic Fisheries Investigations program in January–April between 2005 and 2015 (Campbell et al., 2015). Generalized additive models were developed and selected using the R package pscl, followed by extensive validation with both the training survey data and independent data sets.
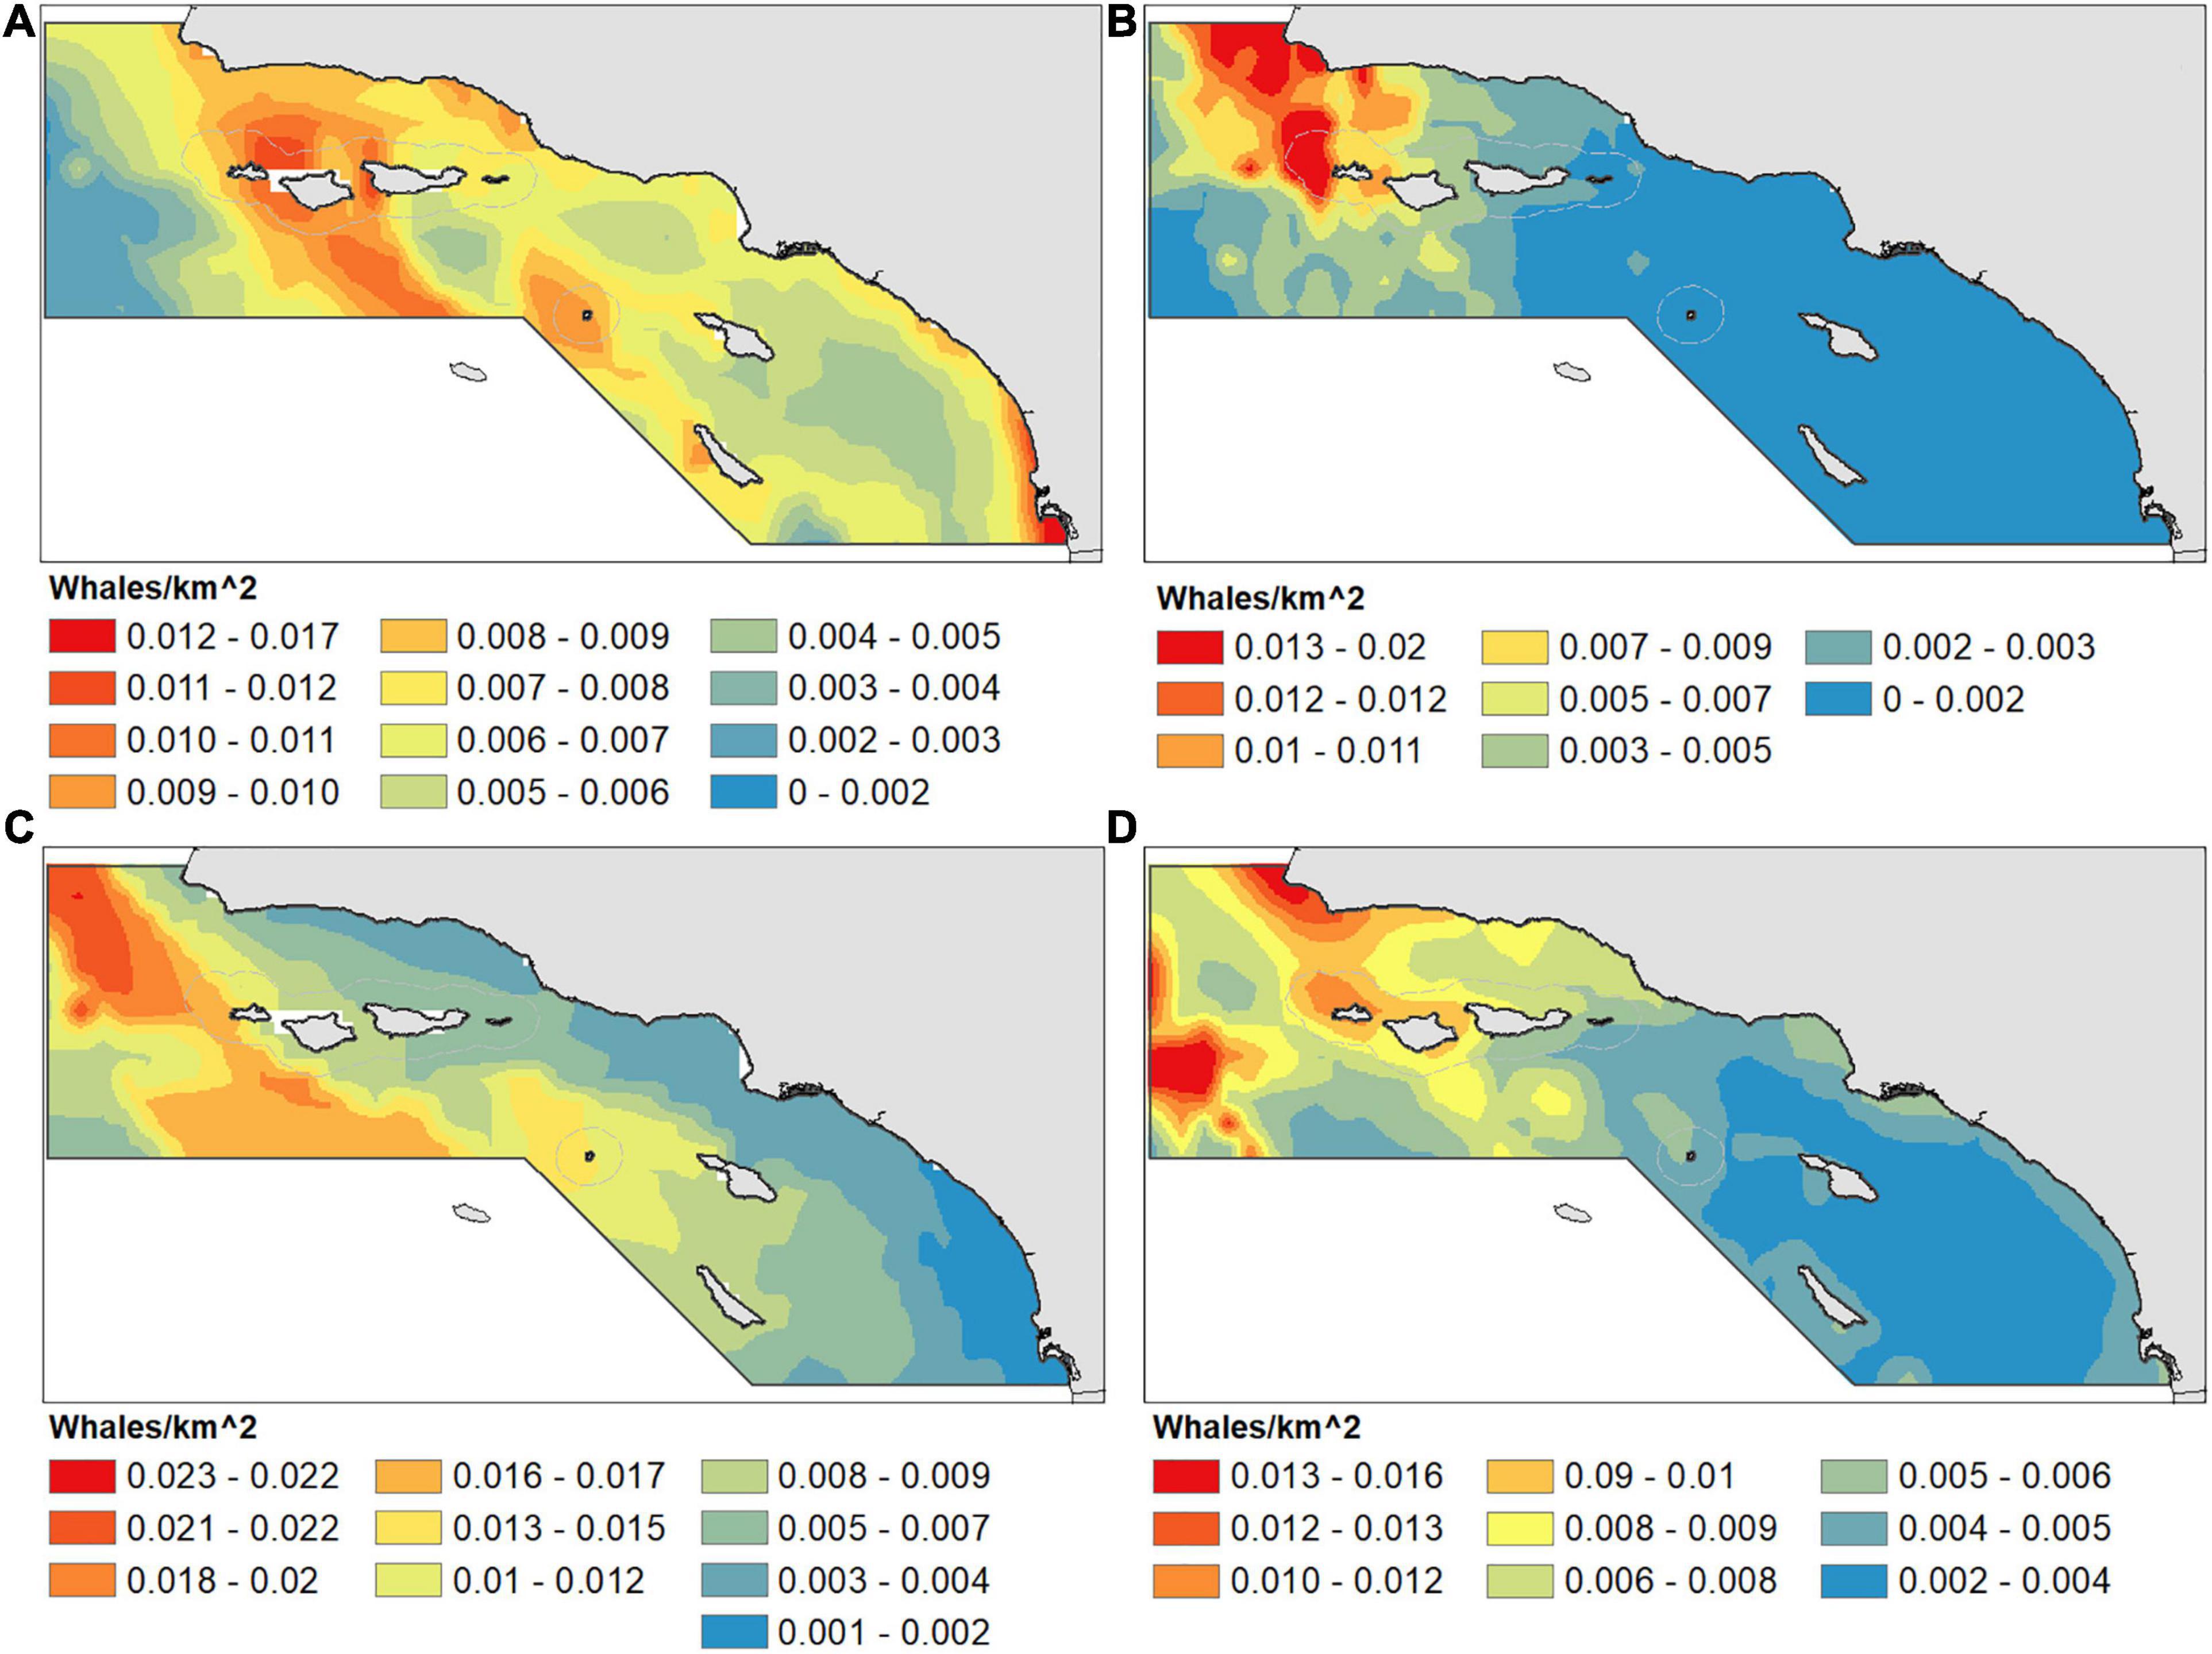
Figure 4. Species distribution model density for summer/fall (June–November) blue (A), humpback (B), and fin (C) whales and winter/spring (January–April) humpback (D) whales. Densities are from Becker et al. (2016) (A–C) and Becker et al. (2017) (D). Note the color scales are different for each species. Density predictions derived from NOAA cruise data from 1991–2009 (A–C) and 2005–2015 (D).
For this study, we used the mean of predicted whale density for all months and years when cruises were conducted. While monthly density estimates for the years we are analyzing [as in Rockwood et al. (2020a)] would allow us to estimate temporal variability, such whale model predictions are not available for this region. Only 90% confidence intervals for the mean density estimates were available, and the majority of the uncertainty captured by those was derived from interannual variation in environmental drivers of whale distributions (Becker et al., 2016). If we calculated our results for each month using those confidence intervals, it would compound the error inappropriately. Accordingly, we chose to only use the mean density predictions. Therefore, annual variation in our results only derives from differences in ship traffic and does not account for temporal changes in whale abundance and distribution.
The whale models are fitted to whale survey data mostly collected prior to the period analyzed (1991–2009 for summer/fall and 2005–2015 for winter/spring). However, these data cover long periods of time that encompass years with large environmental variability, including strong El Niño (1997–1998 and 2015) and La Niña (2007–2008 and 2010–2011). Since the model averages and underlying data cover a long time-series and there has been no evidence of drastic changes in the distributions of whales or their primary prey, we believe these data likely represent average expected whale distributions well for our study purposes. Nonetheless, this discrepancy in time-frames along with the use of whale predictions averaged across years means there is additional uncertainty in the results. While the summer/fall model data were derived from data collected during July–December, for simplicity in aligning with active and inactive VSR months, we applied the average whale densities with ship data for June–November. Full details of the whale model building, selection, and prediction methods can be found in each publication listed above. We converted whale density to number of whales per grid cell by multiplying the modeled densities by the area of each grid cell. We then disaggregated the model predictions (which were on a 10-km grid) by a factor of 10 to match our 1 km analysis grid (the grids aligned but had different initial resolutions). This approach maintains the modeled whale population per 10 km2 without compromising the higher data resolution available for vessel data.
Vessel Data
Our strike model requires vessel speed, draft, count, transit time, and track distance as inputs (Rockwood et al., 2017). We used automatic identification system (AIS) records to provide these data. AIS is a radio-based maritime safety technology that enables communication of vessel positions and headings (among other data) to help mariners avoid at-sea collisions. All vessels over 300 GT and most vessels over 65 ft are required to use AIS in United States waters. AIS units send very high frequency radio signals with a vessel’s position, heading, and physical characteristics. AIS messages containing position data (e.g., location, speed, heading) are broadcast every 2–10 s and messages with static vessel and voyage-related data (information provided about a vessel when AIS equipment is initialized; e.g., identifier, length, type) every 6 min. AIS messages are received by land-based stations and low-orbiting satellites. The AIS data collected by these networks of receiving stations are used for a variety of applications including enforcement and conservation (Robards et al., 2016).
We obtained 7 years (2012–2018) of raw AIS data collected by the USCG’s Nationwide Automatic Identification System (NAIS) network of land-based stations to conduct our analyses. The raw AIS data were decoded into comma separated value (CSV) files using the Department of Transportation’s VOLPE Data Center’s Transview (TV32) software application. The CSV data were stored and further processed within a spatially enabled PostgreSQL/PostGIS database. Vessel characteristics (e.g., vessel draft, vessel length, etc.) found in AIS data are entered manually by vessel operators. As a result, it is not uncommon for this data to contain omissions or entry errors. To ensure accurate model inputs, we limited our analysis to only those transits by vessels that we were able to cross-link to the IHS Maritime World Register of Ships (IHS), a database that houses confirmed vessel data on the global fleet.
The majority (76%) of reported or known whale deaths worldwide are caused by vessels longer than 19 m (Jensen and Silber, 2004) and collisions with smaller vessels are less likely to be lethal (Neilson et al., 2012; but see Sharp et al., 2019; Kelley et al., 2021 for emerging concern about smaller vessels as well). Even that proportion likely underestimates the contribution of larger vessels because smaller vessels are much more likely to feel and report a collision with a whale (Peel et al., 2018). In addition, only vessels larger than 65 ft (19.8 m) are required to use AIS, so the representation of smaller vessels in AIS data is likely to be biased, limiting the ability to evaluate strike risk from these vessels. We therefore filtered the AIS data to records associated with vessels greater than 19 m in length, with drafts of at least 2 m. Drafts below 2 m were excluded because longer vessels with such a shallow draft tend to be slow-moving such as barges that are unlikely to strike and kill whales. We aggregated temporally proximate records belonging to unique vessels to generate unique vessel tracks. Each track was intersected with our grid cell boundaries and the resulting track segments were assigned the vessel’s attributes (speed, beam, and draft) from the AIS records with the closest proximity. We also measured the track segment length and transit time through each cell directly from the resulting line segments.
Vessel transit time was defined as the elapsed time between the estimated track entry and exit from the grid cell except under circumstances when those times were likely to be erroneous. For cases where the time elapsed between entry and exit was greater than 2 h (corresponding to a speed of less than 0.38 kn (0.7 km/h) for the longest straight-line transit through a cell), we calculated transit time as speed divided by distance. Similarly, if reported speeds were zero, negative or greater than 40 kn (74 km/h) (indicating the AIS message was faulty) we calculated speed as the distance traveled divided by the time of transit. Finally, to exclude erroneous records and vessels not under way, we eliminated remaining segments with speeds less than 2 or greater than 40 kn and distances greater than 6 km. This resulted in the culling of less than 1% of all data records (i.e., track segments) and less than 0.25% of the total vessel distance traveled.
To align with the months when VSR are in effect, we produced vessel tracks for the summer/fall months of June–November while winter/spring vessel data covered January–April to align with winter/spring whale density predictions. We analyzed data from 2012 to 2018 to cover a control period when the 10-kn VSR was not in effect (2013 and 2014) and a period with the VSR in place (2012 and 2015–2018). However, it is important to note that this range of years is also divided into years prior to the TSS rerouting (2012–2013) and those after (2014–2018). Therefore, each type of analysis (annual mortality modeling, VSR effect modeling and scenario simulations) used particular year subsets to ensure the data was appropriate for each analysis. These timeframes are described below.
Model Framework
To estimate mortality, we utilized an encounter probability model developed by Martin et al. (2016) and adapted in Rockwood et al. (2017, 2020a). More detailed model descriptions including all equations can be found in those publications. Encounter theory has long been used in many fields to quantify spatial interactions between moving objects. For example, in ecology, statistical analysis of capture–recapture data is based on encounter models (Gurarie and Ovaskainen, 2013; Martin et al., 2016; Crum et al., 2019). To briefly describe the modeling methods, we used a two-dimensional geometrical encounter theory formulation to calculate vessel–whale encounter rates within each grid cell. Encounter rate is a function of whale and vessel size, velocity, distance traveled, and grid cell size. We integrate the effect of three-dimensional habitat use by whales on the risk of being in the vertical strike zone by use multi-sensor tag data to quantify whale time-at-depth. Here, as in Rockwood et al. (2017, 2020a), the strike zone is conservatively defined as the draft of the vessel though scale models suggest whales may be at risk up to twice the vessel draft (Silber et al., 2010). Finally, we convert encounter rates to estimates of whale mortality by multiplying with the probability of collision avoidance, the probability of mortality given a collision and the numbers of whales. The encounter rate model was formulated to be conservative (produce low estimates of mortality) but lacks comprehensive measures of uncertainty. A detailed exploration of the effect of model parameter uncertainty can be found in Rockwood et al. (2017) and the accompanying supplement.
As in Rockwood et al. (2020a), we made several changes to improve performance and accuracy compared to the original formulation in Rockwood et al. (2017). First, since using a linear relationship between avoidance response with increasing vessel speed resulted in very similar mortality results as a logistic relationship (Rockwood et al., 2017), we chose to limit our analysis to only the logistic formulation of avoidance. Though the speed-avoidance relationship remains poorly understood (Szesciorka et al., 2019), observations, and analysis have best supported the logistic formulation (Gende et al., 2011). In previous versions of this model (Rockwood et al., 2017), mean ship parameters were calculated across all vessels within a grid cell prior to running the mortality model. However, this approach was shown to introduce bias due to the non-linear relationships between strike mortality and some ship parameters, especially speed (Rockwood et al., 2020a). Thus, we instead calculate mortality independently for each vessel track and then summed those estimates within each grid cell. The mortality formulation for each grid cell was:
where b is the vessel track identifier, n is the number of tracks in the grid cell, λeb is the encounter rate, t_b is the vessel’s transit time, P(Strikedepth|Db) is the probability the whale is within the vessel strike depth given the vessel draft, (1−P(Avoidance|vb)) is the probability of no successful avoidance given the vessel’s speed, P(Mortality|vb) is the probability of mortality given the vessels speed, and N_m is the number of whales in the grid cell for species m. Equations for the encounter rate and three probabilities can be found in Rockwood et al. (2020a). For each month and species combination, we applied this model to each ship transit. We then summed the monthly results to create spatially explicit predictions of vessel-strike related mortality for each year from 2012 to 2018. All modeling and statistical calculations were done in the programming language, R (R Core Team, 2019), while all maps were produced using ArcGIS 10.7.
Spatial Statistics Within and Outside the TSS
A key goal of this research was to understand the pattern of risk and explore how that informs the highest priority management actions and where to apply them going forward. To provide a simplified picture of how important different portions of the region are to strike risk, we defined two classes of elevated predicted mortality: grid cells with predictions above (1) the 50th and (2) the 90th percentiles. We converted these areas to polygons and mapped them for visual assessment. For consistency in these spatial analyses, we only used results from 2014 to 2018, after the 2013 changes to the TSS.
To date, the greatest focus of conservation efforts has occurred in various parts of the TSS (Figure 2). To determine the relative priority of actions in the lanes compared to surrounding waters, we calculated the sum of mortality and proportion of total mortality within and outside the TSS. TSS polygons were produced by the NOAA Office of Coast Survey.1 For each area, we calculated the total mortality and the proportion of total mortality.
Speed Changes and VSR Effect on Mortality
There are multiple factors that can confound evaluation of the effect of past VSRs on the amount of whale mortality: differences in vessel traffic spatial patterns, vessel sizes, and whale density and distribution. Therefore, one cannot simply compare mortality during VSRs with mortality when no VSR was in place. To control for these confounding factors, we used a simulation approach where vessel speeds from times outside the VSR implementation were re-sampled and applied to vessel tracks from times during the VSR. Thus, for May–November of 2012 and 2015–2018 (when 10-kn VSRs were in place), we calculated model mortality first using true vessel speeds (VSR “reference” model mortality) and then using speeds resampled from non-VSR periods (“simulated” model mortality). Each annual simulation was limited to the area defined by NOAA for that year’s VSR (Figure 2). All other model variables (e.g., vessel drafts, vessel beam) were retained from the reference tracks. The differences between VSR “reference” and “simulated” model mortalities (calculated for each of the 5 years 2012 and 2015–2018) give an estimate for how speed changes between VSR and non-VSR periods altered mortality, while holding all other variables constant.
We used two time periods as controls: (1) years without VSR (2013–2014; henceforth “non-VSR” period) and (2) months outside of the VSR period (January–April; henceforth “inactive-VSR” period) but within the same year. Because there has been a long-term downward trend in vessel speeds (Moore et al., 2018), attributing speed changes (and therefore mortality changes) between 2013 and 2014 (non-VSR) and 2012 plus 2015–2018 (active-VSR) to the VSR specifically is challenging. Similarly, the potential for seasonal speed patterns (McKenna et al., 2012; Jensen et al., 2015) could influence within-year comparison of active- and inactive-VSR periods. Therefore, we used both non/active VSR simulation (applying 2013–2014 non-VSR speeds to 2012 and 2015–2018) and inactive/active simulation (applying January–April speeds to June–November of each year) as the temporal controls to assess the relative effect of VSRs on vessel-related whale mortality. We expected the inactive/active simulation to best isolate the VSR-specific effect, but were also interested in the inter-annual trend in modeled mortality due to changes in speed regardless of whether the changes were entirely a result of vessels adhering to an established VSR.
We accounted for spatial patterns in speed by pooling all speeds across non-VSR years (for the non/active analysis) and across inactive-VSR months (for the inactive/active analysis), but only resampled speeds within the same grid cell. For each VSR year, we generated 100 random samples (with replacement) and replaced the speed attribute of the vessel track lines. For each sample, we calculated the “simulated speed” mortality. To understand the effect the resampling process had on the results, we calculated the standard deviation for each year’s “simulated speed” mortality estimates.
Assessing Management Scenarios
The VSR programs in southern California have had consistently low cooperation with the voluntary speed requests (Freedman et al., 2017). Thus, determining how effective increased cooperation could be at decreasing strike mortality is key to setting management strategies and targets. In addition, from analysis of other regions (Lagueux et al., 2011; Rockwood et al., 2020a) as well as analysis of southern California (this study, Redfern et al., 2019), it is clear that a substantial strike risk is found outside of established TSSs. This means evaluating potential additional areas for VSR management may provide ways to achieve greater strike reductions. We applied our model to both the TSSs and two potential SMAs to simulate expected whale mortality rates under various hypothetical cooperation scenarios. Potential SMAs which we propose here were positioned at the northern end of the existing TSS and in the channel south of the Sanctuary (Figure 3) to encompass the highest mortality areas outside the TSS.
A lack of cooperation with voluntary VSR measures has been common (Wiley et al., 2008; Silber et al., 2012a; Freedman et al., 2017; Guzman et al., 2020), though progress has been made in some cases (Constantine et al., 2015; Moore et al., 2018; Rockwood et al., 2020a). In contrast, noteworthy increases in compliance occurred after right whale protections on the East Coast were made mandatory (Lagueux et al., 2011; Silber et al., 2014). While 73% is the highest level of VSR cooperation reported (Silber et al., 2014), we set our upper hypothetical cooperation to 95% to cover all possible outcomes.
For each month, we simulated hypothetical scenarios ranging from 30 to 95% of ship travel distance in cooperation with a 10-kn speed limit. To do so, we calculated the baseline cooperation for the month as the proportion of distance traveled at or below 10 kn. We then took the difference between the target cooperation and the baseline to determine the additional distance of 10 kn track lines necessary to achieve the target cooperation level. For example, if the actual cooperation was 28% and the target was 40%, an additional 12% of tracks would need to travel at the speed limit. We randomly selected that proportion of tracks and set their speed to the prescribed limit. To be as realistic as possible, we chose to modify speeds at set limits for the entire transit rather than a random selection of grid-clipped track segments. This means that the simulated cooperation levels diverged slightly from the target because the selected transit lengths varied. To assess the influence of the resampling on mortality estimates, we repeated the sampling process 100 times and calculated coefficient of variation (CV) for the results. To maintain relevance to current traffic patterns, we only used the years after the TSS rerouting (2014–2018) in this analysis.
We averaged across the 100 resampled estimates to get a single mortality estimate for each combination of month and target level of cooperation. These estimates were compared to the “VSR speed” model mortality estimated using actual vessel speeds. We fit a linear model to each year’s simulations to provide an estimated decrease in the number of whale deaths per percent increase in vessel speed cooperation.
Results
For context and to evaluate the importance of the fine-scale assessments described here, we compare our results to those from Rockwood et al. (2017), which estimated mortality for the entire U.S. West Coast EEZ. To make results comparable, the Rockwood et al. (2017) results were re-calculated for the VSR season and area of this study. All the values reported here are modeled estimates of vessel strike mortalities, not observed whale mortalities. Moreover, the model is a mechanistic approach that has not been validated statistically by comparing predictions with actual ship strike mortalities due to a lack of data to do so. Rockwood et al. (2017) did show that qualitative comparisons with observed strikes aligned well with the model outputs. Specifically, predictions from the model formulation used here compared to confirmed ship strike deaths from the NOAA stranding database equated to 2% recovery rate for blue whales, 10% for humpback whales and 3.7% for fin whales (Carretta et al., 2020). These estimates align well with literature estimates for large whale recovery which range from <1 to 36% (Williams et al., 2011; Pace et al., 2021). For simplicity we refer to the modelled estimates of vessel strike mortalities as simply as “mortality.”
Patterns of Study Area Mortality
The average (±SD) of 2012–2018 estimated mortality for June–November for the entire study area was 8.9 (±1.4) blue whales, 4.6 (±0.6) humpback whales, and 9.7 (±1.6) fin whales (Table 1). These estimates are 1.5 (17%), 1.2 (26%), and 1.4 (13%) deaths higher than the corresponding estimates from Rockwood et al. (2017). Mean estimated winter/spring mortality (January–April) for 2012–2018 was 5.7 (±0.7) for humpback whales.
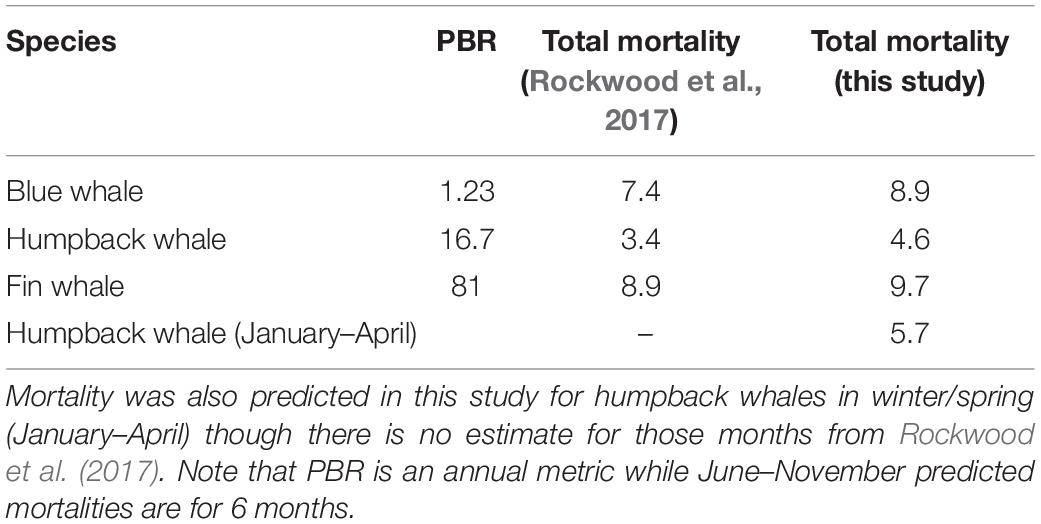
Table 1. Total study area mortality estimates (June–November) for each species compared to estimates from Rockwood et al. (2017).
The greatest predicted mortality for all species occurred in the Channel traffic lanes, though general patterns of mortality were slightly different for each species (Figure 5). The most distinct pattern of ship strike risk was for humpback whales in summer/fall, with mortality concentrated almost entirely in the northern half of the Channel lanes (Figure 5B). Because of their greater offshore concentration (Figure 4), fin whales have the highest risk in the western approach and beyond the end of the Channel lanes (Figure 5C). Though the port incentive VSR (Figure 3) is only for 12 kn, cooperation with the program is greater than 80% and the effect can be seen in slight decreases of predicted mortality in the southern leg of the Channel lanes for blue, fin, and winter/spring humpback whales (Figures 5A,C,D).
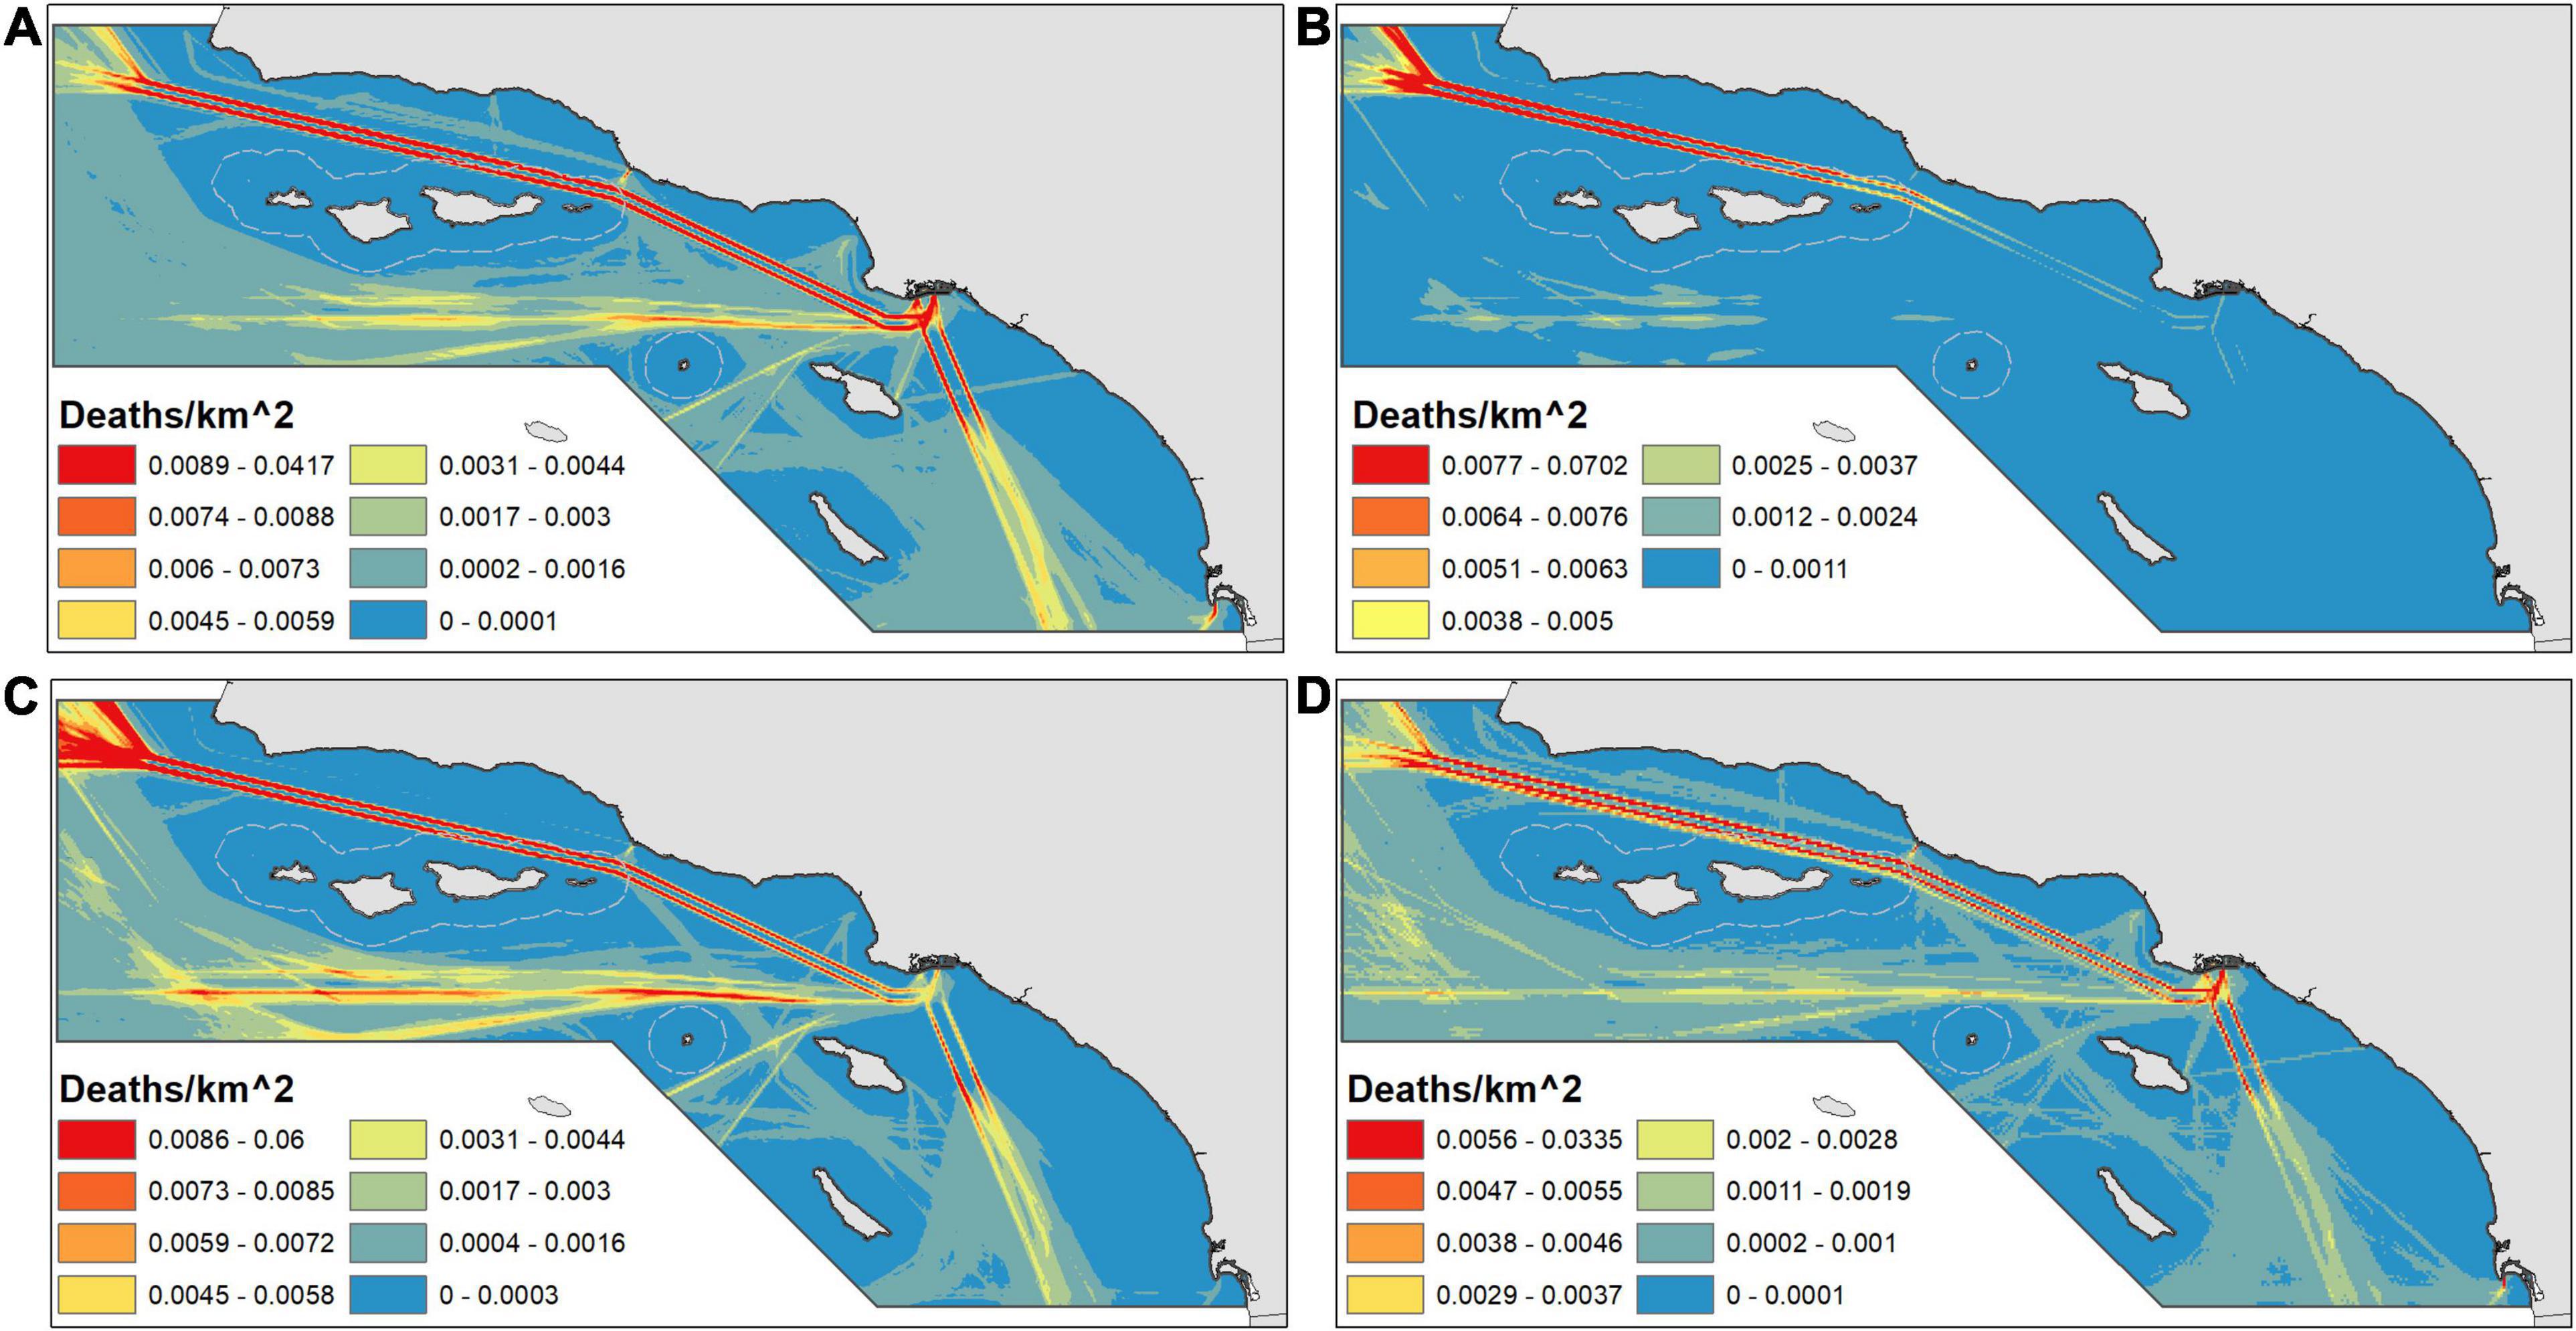
Figure 5. Distribution of mean summer/fall (June–November) blue (A), humpback (B), and fin (C) whale and winter/spring (January–April) humpback (D) whale predicted mortality averaged across all years (2012–2018). Warmer colors represent higher mortality and each color is a half a standard deviation except the highest range. Note the different scales for each panel. Values are predicted mortalities per 1 km2 grid cell. Dashed lines are National Marine Sanctuary boundaries.
When mortality is classified into moderate and high categories (50th and 90th percentile predictions), the areas most important for conservation become clearer (Figure 6). For all three species of whales, the Channel lanes consistently fall within the 90th percentile area. In addition, for all but humpback whales in summer/fall, vessels transiting southward from the ports of Los Angeles and Long Beach create areas of high risk that up until 2019 were not covered by VSRs. Maps of the 90th percentile show two distinct patterns of traffic in the western approach: one straight west from the ports of Los Angeles and Long Beach and one that traverses south to the edge of the study area before turning northwest. The former pattern of ship travel occurred during 2012–2014 when air pollution regulations altered traffic patterns while the straight traffic pattern occurred after pollution regulations changed in 2015–2018 (Redfern et al., 2019).
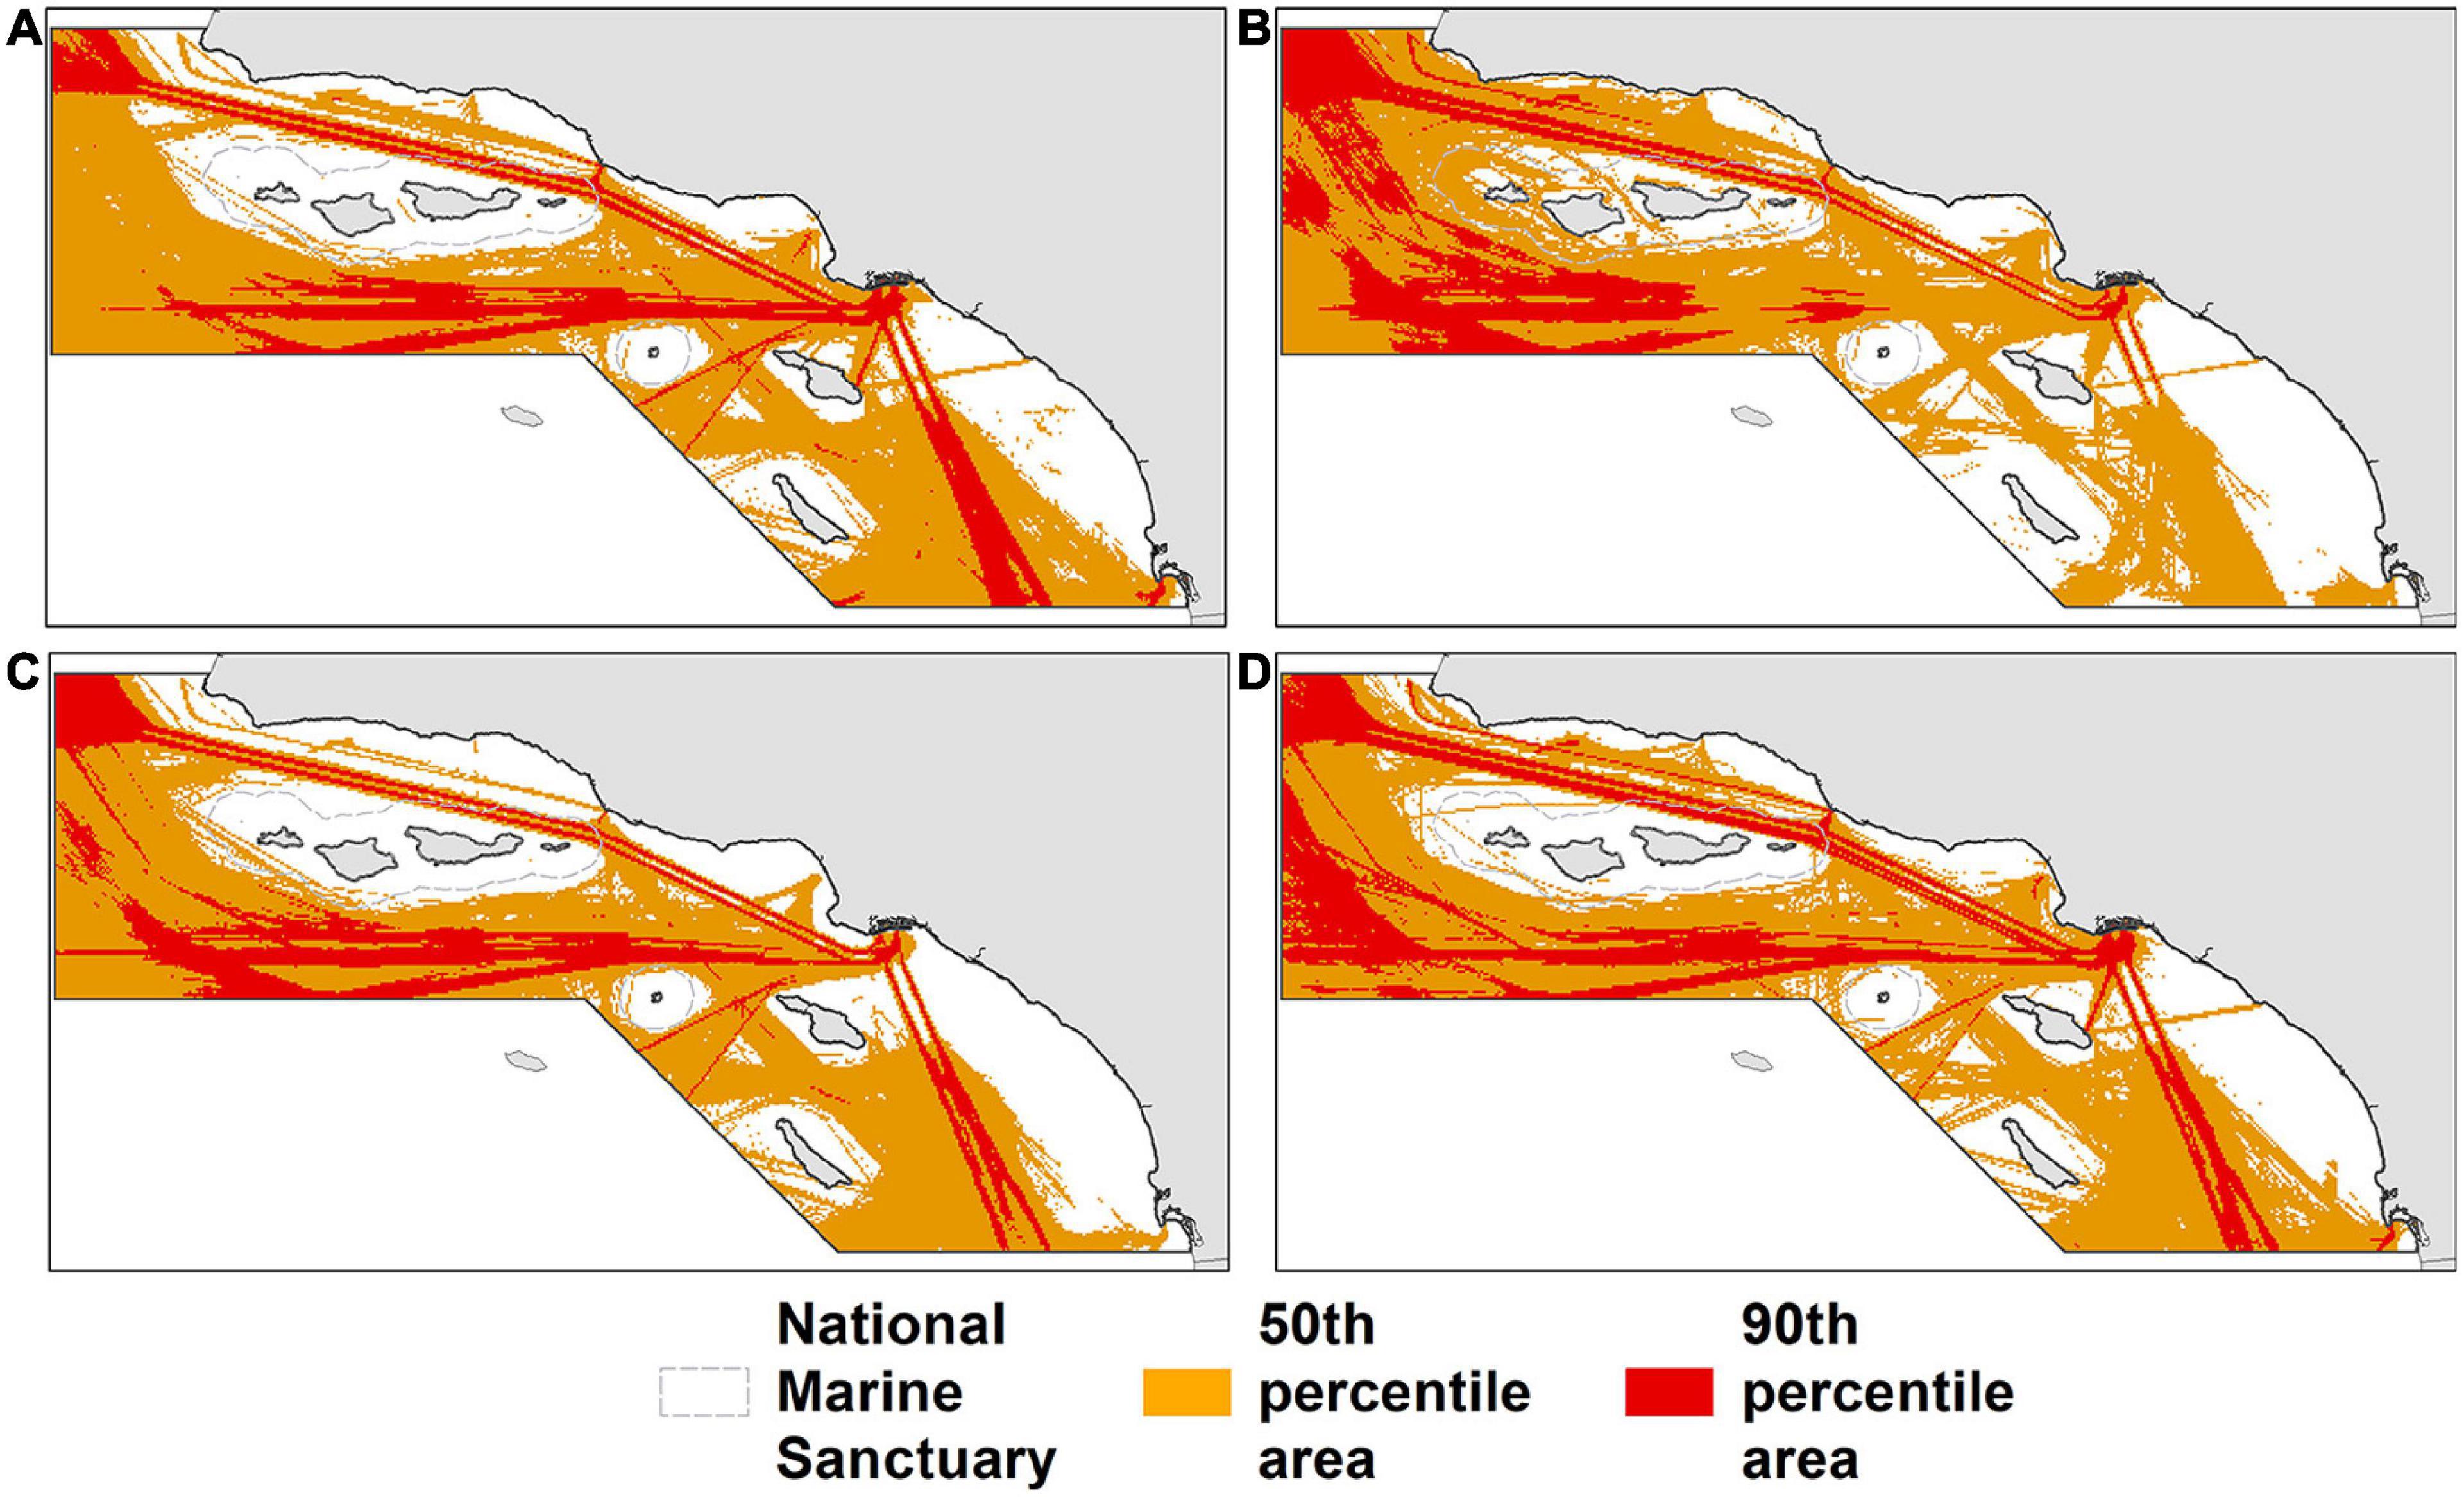
Figure 6. Areas classified as greater than the study area 50th (orange) and 90th percentile (red). Panels depict predicted whale mortality for summer/fall (June–November) blue (A), humpback (B), and fin (C) whales and winter/spring (January–April) humpback (D) whales.
The 50th percentile area comprised over 99% of mortality for all species and seasons, demonstrating that in half of the study area, strike mortality is small for the vessels analyzed (Table 2). In fact, most blue (74.8%), summer/fall humpback, (85.7%), fin (69.9%), and winter/spring humpback (72.4%) whale predicted mortality occurs in just ∼10% of the study area (the 90th percentile areas). The 90th percentile area includes portions of the western approach and waters beyond the ends of the lanes (Figure 6). We defined hypothetical SMAs (green polygons in Figure 3) to include most of the high-mortality areas outside the TSSs.
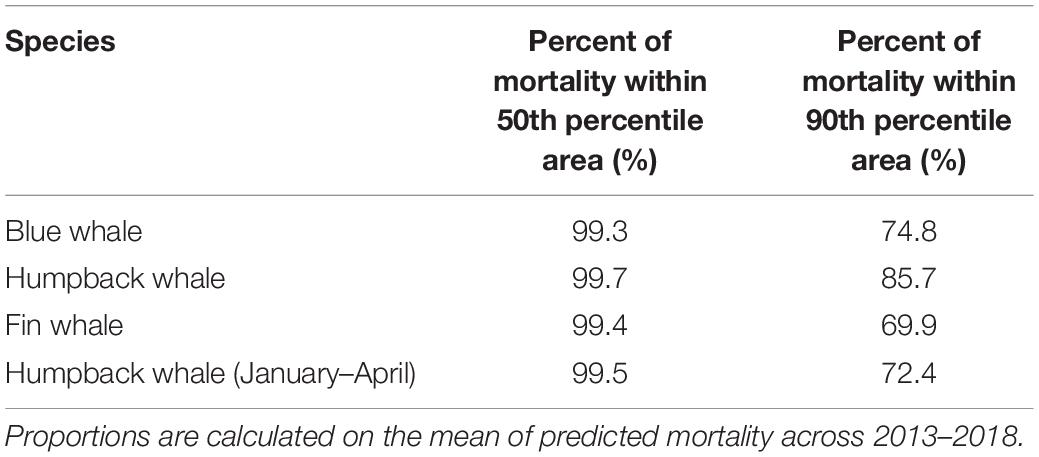
Table 2. Percent of predicted mortality that falls within the 50th and 90th percentile areas.
Until 2019, VSRs aimed at minimizing the number of strikes have mostly been focused in the shipping lanes, so we specifically compared expected mortality rates within the TSS with those outside (Table 3). The model indicated that 47, 53, and 48% of blue, summer/fall humpback and winter/spring humpback whale predicted mortality, respectively, occurs within TSSs. In contrast, just 30% of fin whale mortality was predicted in TSSs, highlighting the effect of the greater offshore concentrations of fin whales compared to the other species (Figure 4). We emphasize that specific mortalities reported here are estimates but where parameters are not well-defined, our model is designed to purposely under-estimate mortality. Thus, the ambiguity that remains for model parameters (e.g., avoidance behavior of whales, whale density) leads to some uncertainty that is not captured in mortality results.
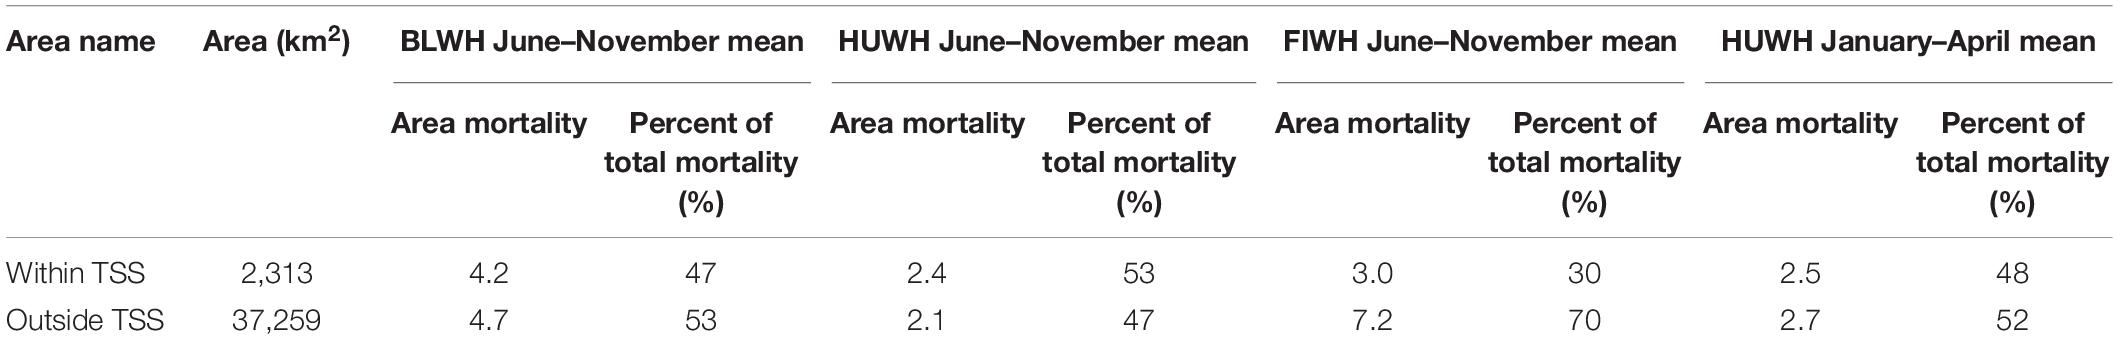
Table 3. Estimated mortality statistics comparing areas inside of the traffic separation scheme (TSS) to areas outside for blue (BLWH), humpback (HUWH), and fin (FIWH) whales in June–November and humpback whales in January–April.
Historical Effect of VSRs and Speed Changes on Mortality
For 2012 and 2015–2018 (the years with a 10 kn VSR in place), we simulated mortality using years without specific speed reductions recommended (2013–2014; the non-VSR control period) to assess the effect of reduced speeds on mortality rates, while keeping all other variables of our mortality model constant. For the 2 years without specific speed reductions, 2014 had lower mean speed (13.8 kn) and 2013 was slightly higher (13.9 kn) (Figure 7).
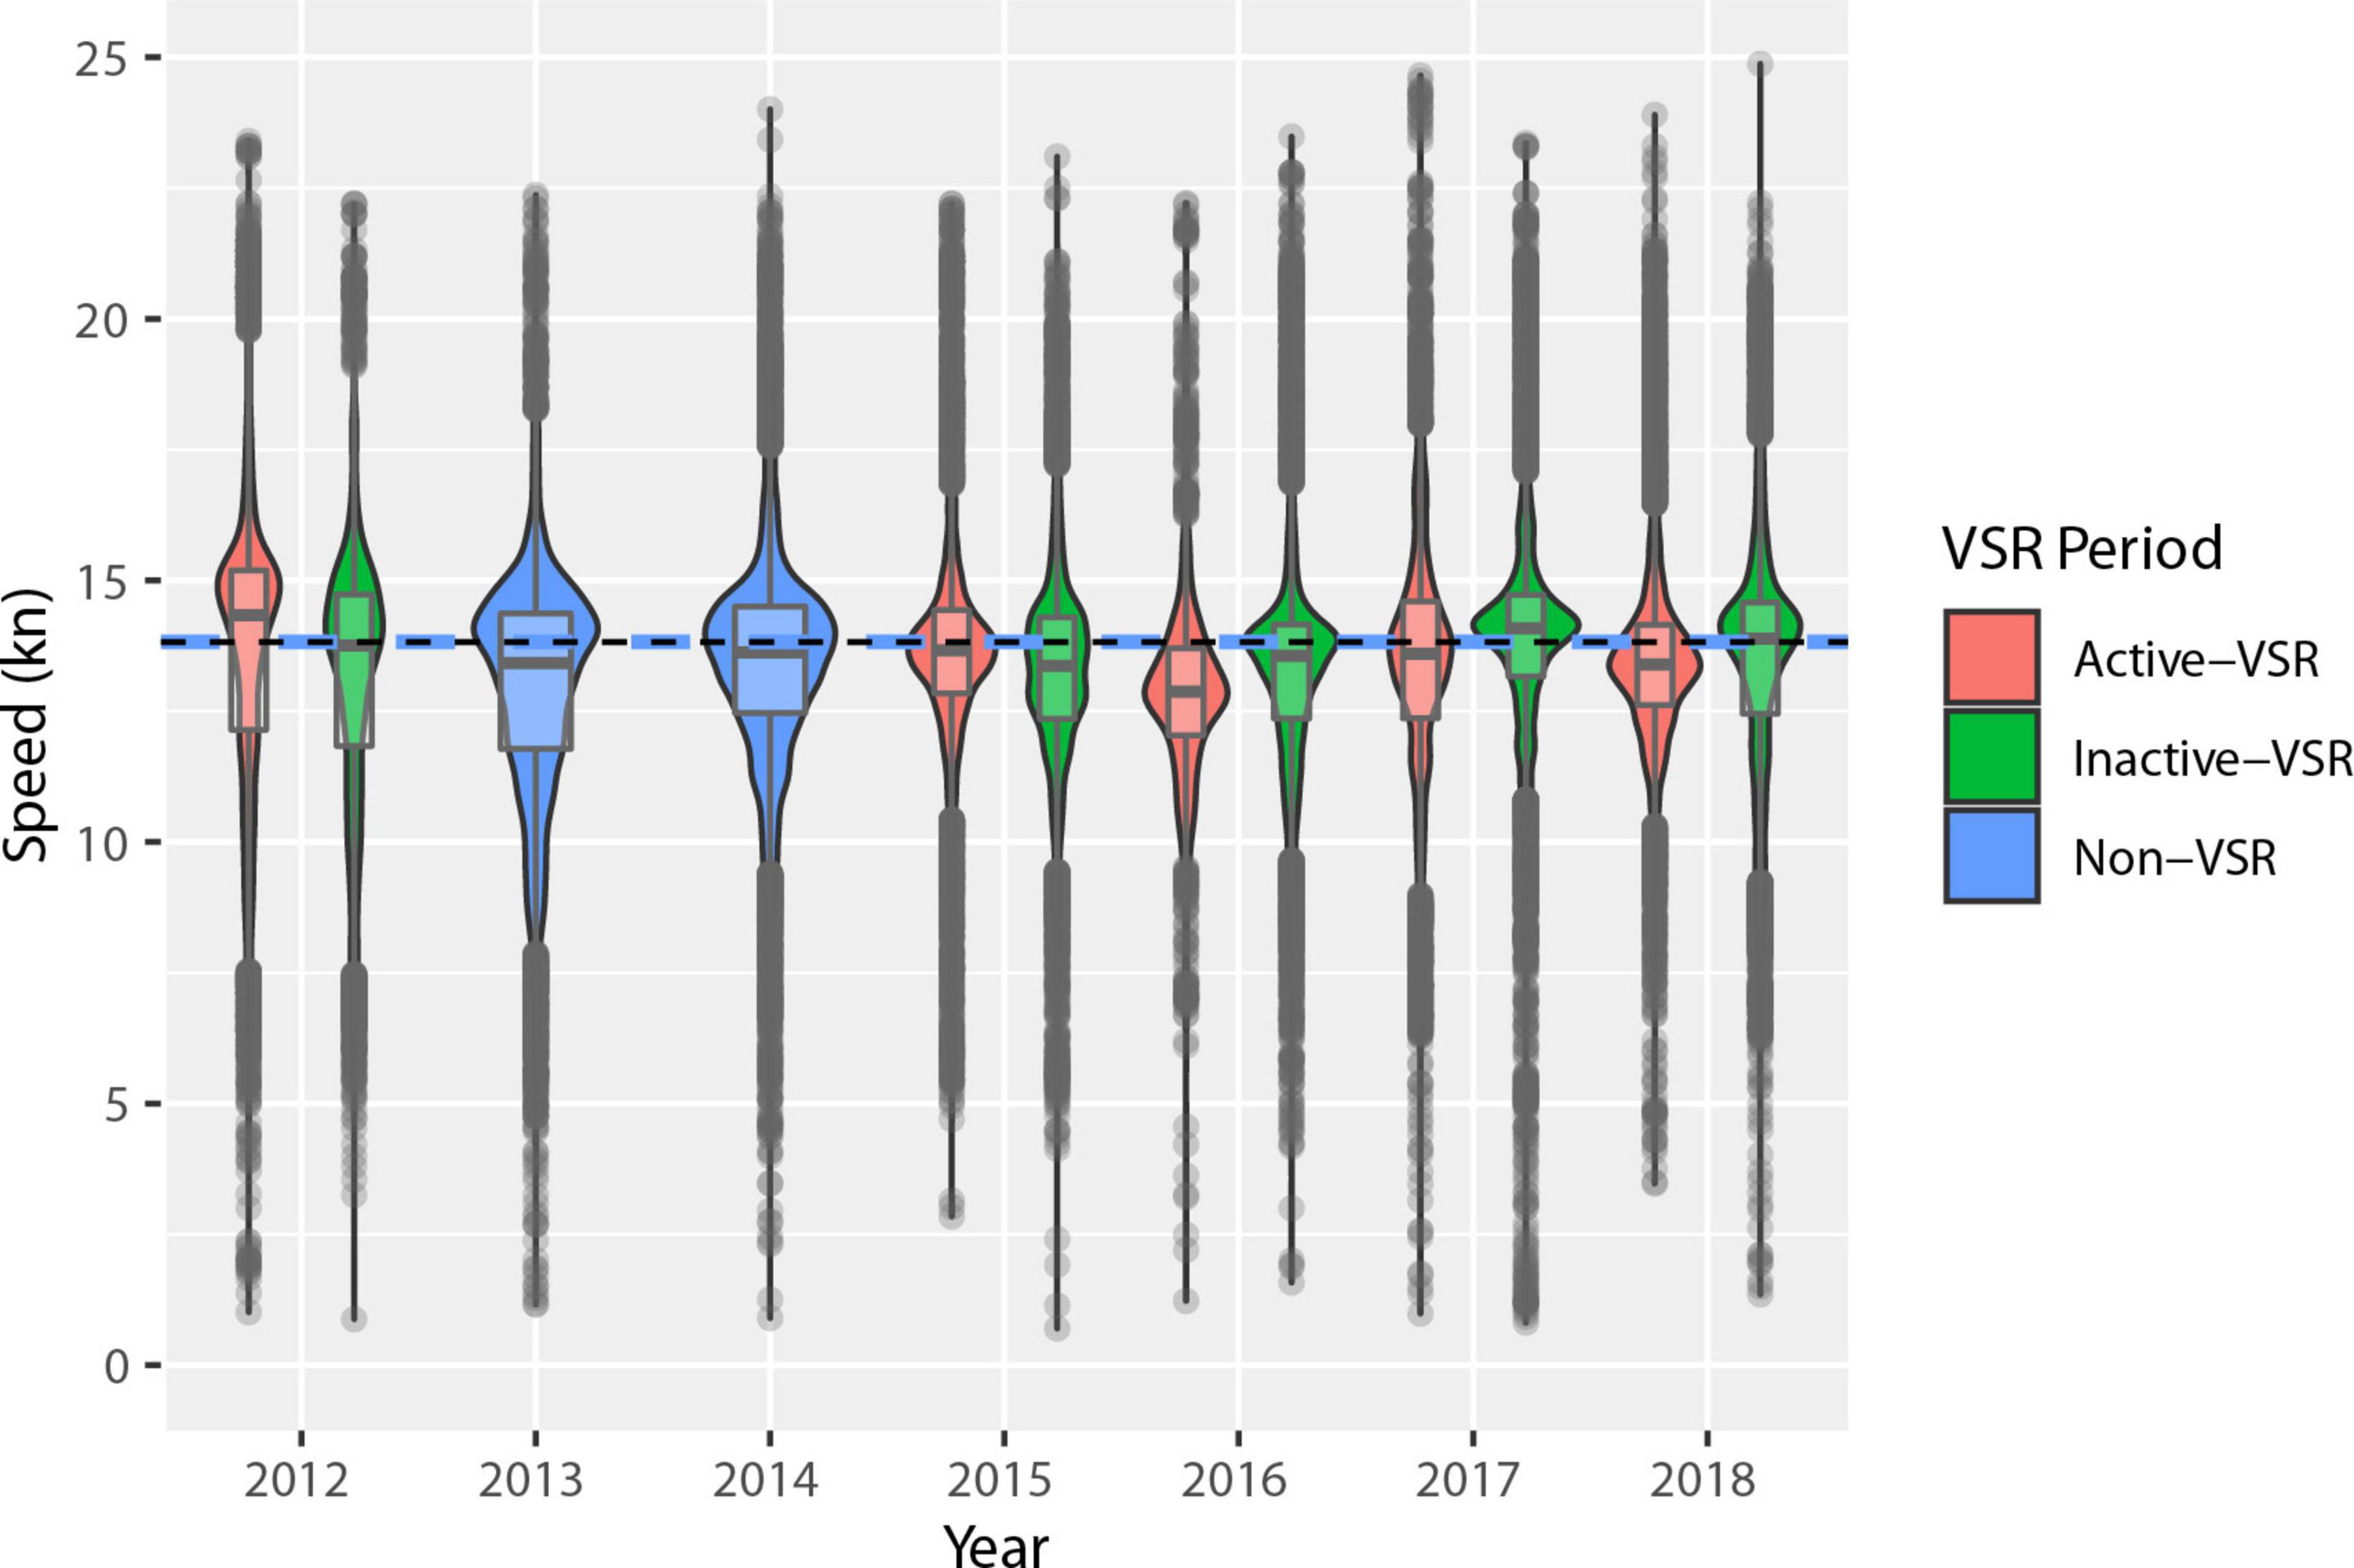
Figure 7. Distributions of distance-weighted vessel speeds within the VSR areas for 2012–2018. The width of the filled region is proportional to the number of values, the central gray line marks the mean and outliers are plotted as gray dots. Active VSR periods (May–November) are in red, non-VSR years in blue, and inactive VSR periods (January–April) are shown in green. The black and blue dashed line shows the non-VSR mean speed.
During years without specific speed requests, a greater proportion of vessels traveled under 10 kn during January–April (11.8%) than in June–November (11.0%), suggesting season may have a small influence on vessel speeds. In 2012, the proportion of vessels traveling under 10 kn during the VSR actually decreased by 2.6% relative to both non-VSR and inactive-VSR levels (Table 4). In all subsequent years, more vessels traveled under 10 kn during active compared to non- and inactive-VSR times.
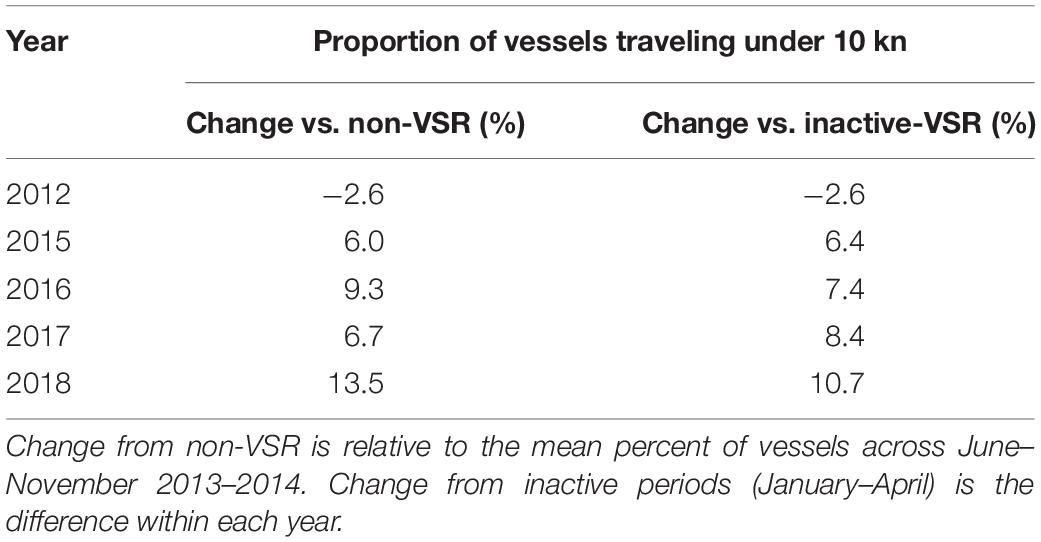
Table 4. Percent change in distance traveled by vessels going under 10 kn during active VSRs (June–November 2012 and 2015–2018) compared to corresponding non-VSR periods and inactive-VSR periods.
Reference mortality in 2016 (mortality modeled from actual speeds during VSR time periods) was lower (−1.9 to −5.1%) than simulated non- and inactive-VSR mortality (Table 5). Decreases were also predicted in 2018 for all species when compared to non-VSR simulated mortality as a result of lower vessel speed distributions in those years (Table 5 and Figure 7). For the remainder of years when comparing both control periods, mortality was actually greater using VSR speeds than simulated non-VSR speeds (Table 5). To help understand what drove the change in mortality, we plotted the distribution of active-VSR and inactive-VSR distance-weighted vessel speeds overlaid with the non-VSR distance-weighted speed distribution (Supplementary Figures 3, 4).
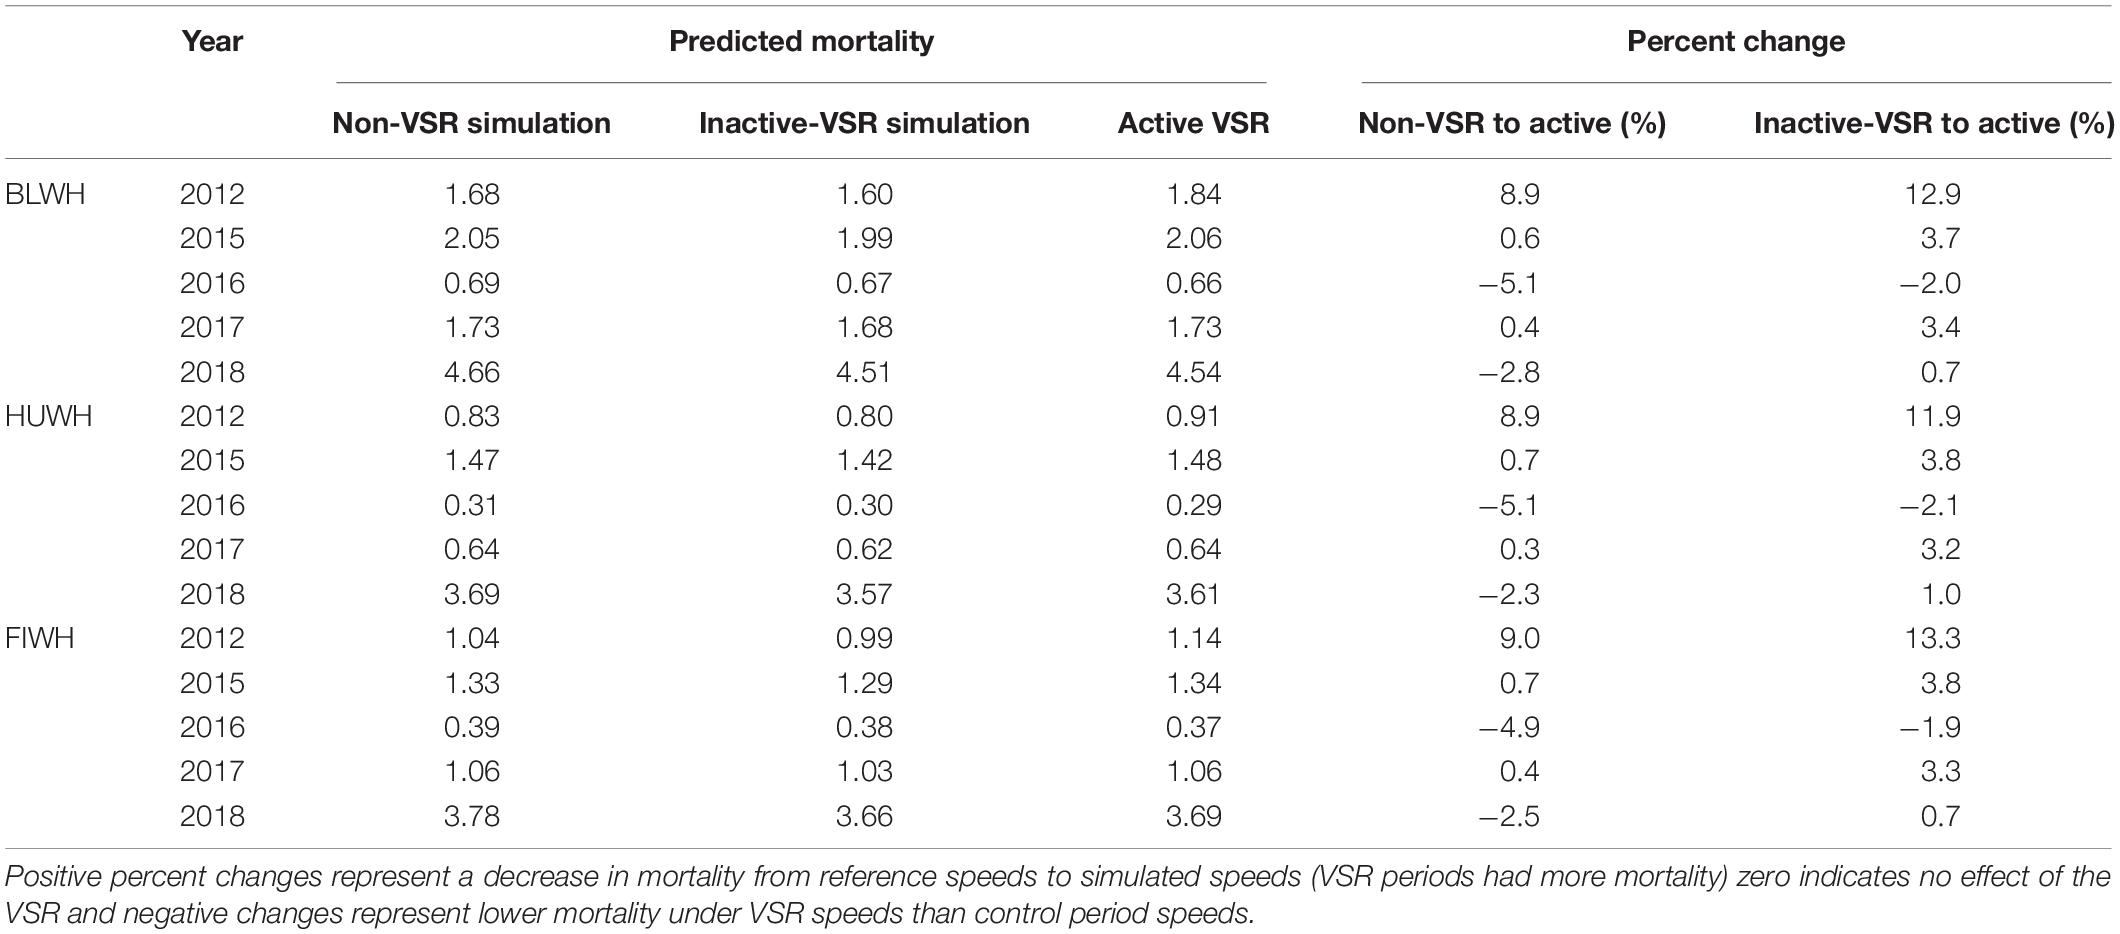
Table 5. Table of predicted mortality and percent change between reference (active-VSR) and simulated (non-VSR and inactive-VSR) whale model mortality in each VSR area for 2012 and 2015–2018.
VSR Speed and Cooperation Scenarios
The goal of the scenario modeling was to estimate the decreases in mortality that might be achieved in the southern California study area by increasing VSR cooperation in the TSS and managing vessel speeds in the hypothetical SMAs. We found that the reduction in mortality was linearly proportional to the simulated change in cooperation but the slopes of the linear fits varied slightly across years (Supplementary Figures 1, 2). In the TSS, achieving a 1% decline in mortality required a 2.7–3.4% increase in vessels traveling 10 kn or less. The ratio of mortality decrease to cooperation increase was greatest for humpbacks in summer/fall and least for blue whales. The greatest predicted decrease in mortality for a 10-kn speed scenario was 28.1% for humpbacks in summer/fall of 2014 with a 95% cooperation level (Table 6). Of all resampled estimates, the highest within-year CV was 2.1%, representing a prediction error of less than 0.001 deaths per month. These coefficients of variation only represent the error from the random simulation process, not variation between years of vessel traffic.
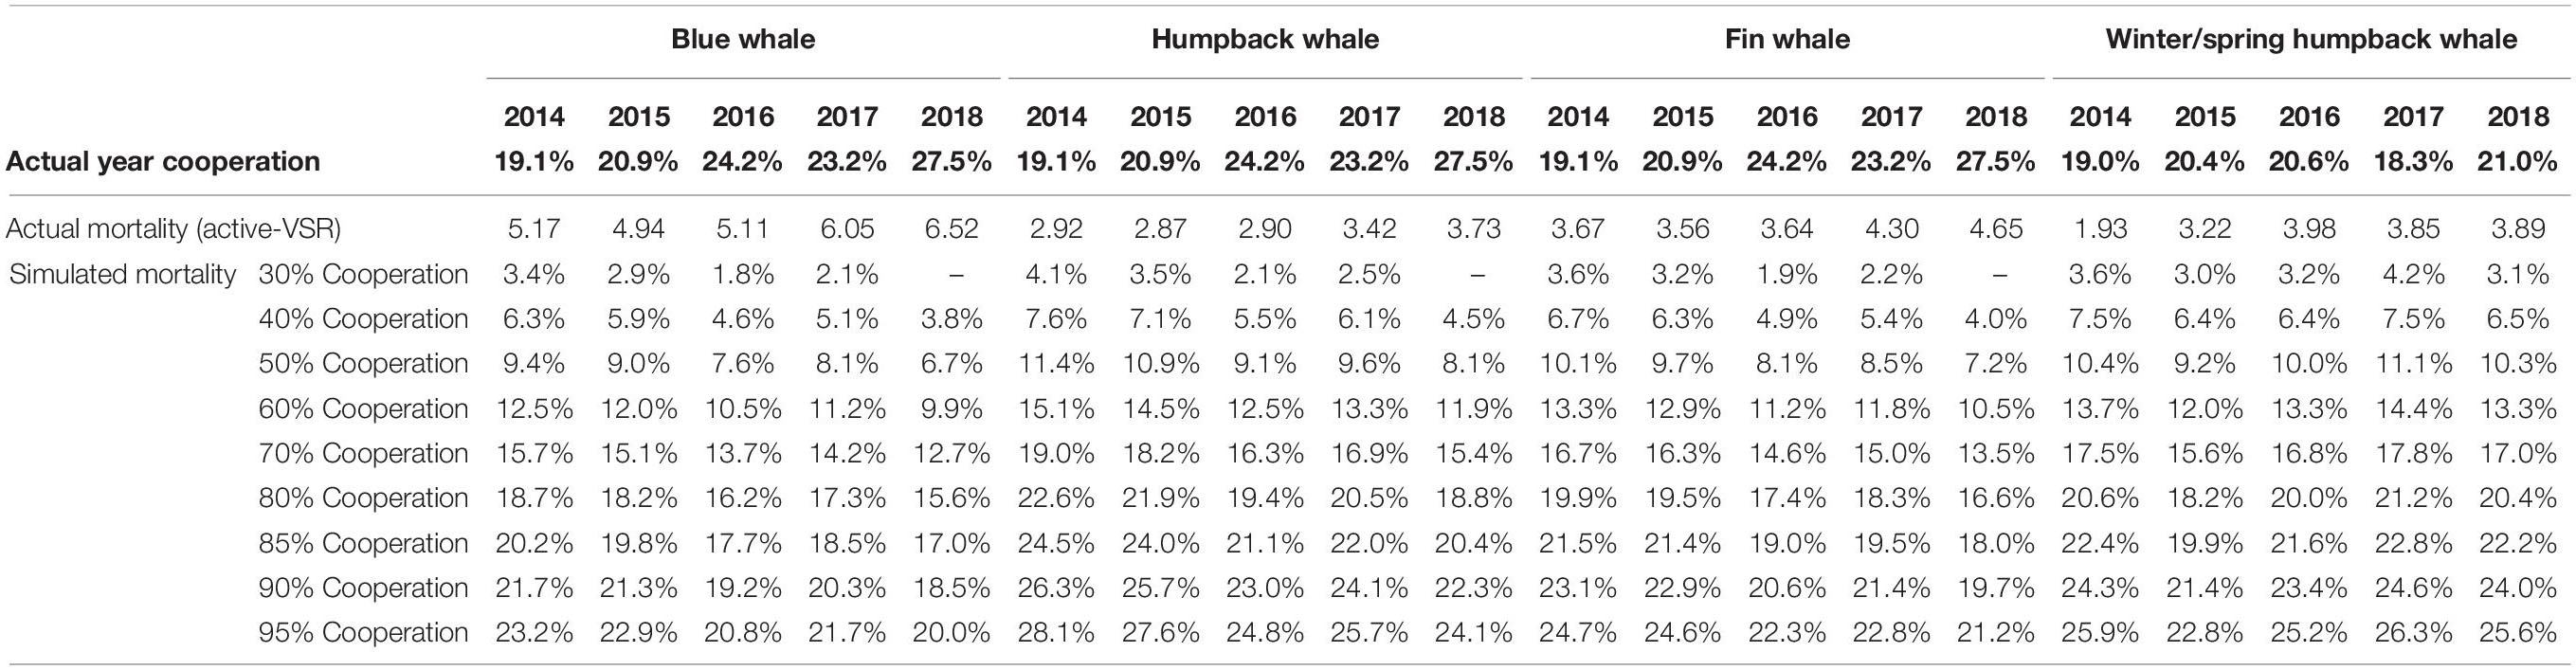
Table 6. Percent decrease in predicted mortality in the TSS relative to reference mortality for 10-kn cooperation scenarios ranging from 30 to 95% target cooperation.
Within the hypothetical SMA areas, the 10-kn scenarios resulted in a 1% decline in mortality for each 2.5–2.9% increase in compliant vessels (Supplementary Figure 2). In the SMAs, the greatest decreases in mortality were consistently higher than in TSS scenarios, topping out in 2015 with a 35% decline for humpback whales in summer/fall, a 34.2% decline for fin whales and a 33.8% decline for blue whales while winter/spring humpback decreases were greatest in 2014 at 34.4% (Table 7).
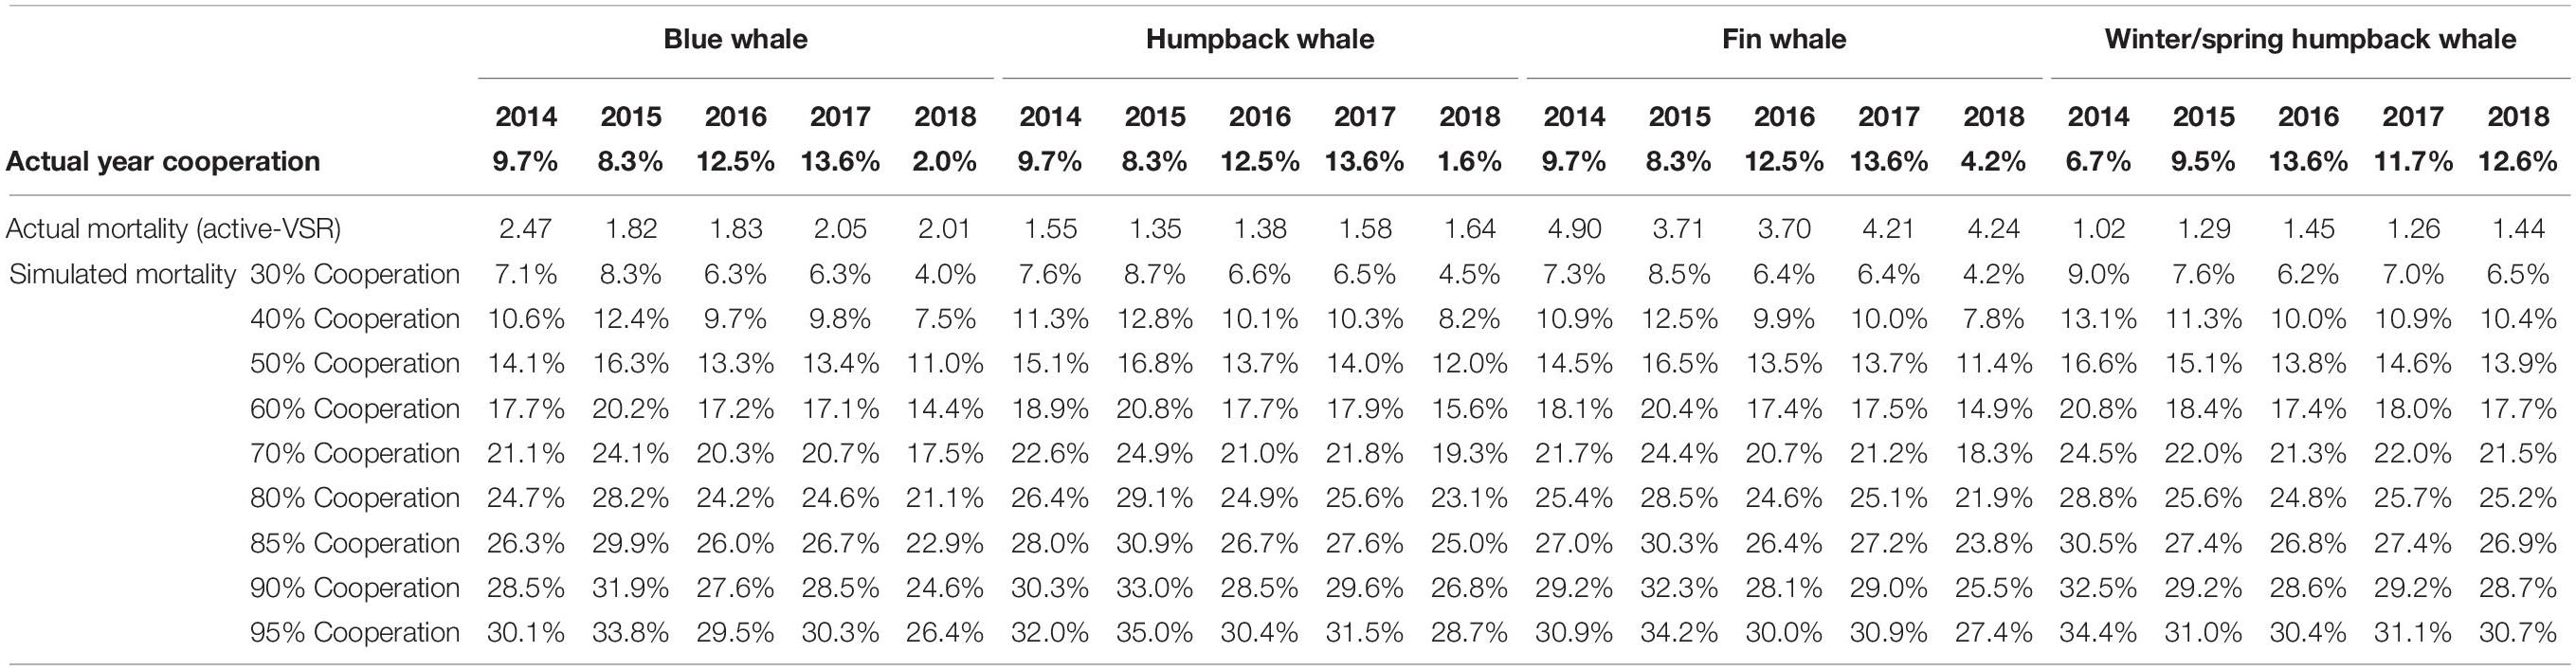
Table 7. Percent decrease in predicted mortality in the potential SMA areas relative to actual for 10-kn cooperation scenarios ranging from 30 to 95% target cooperation.
Finally, we summarized the total and proportional mortality decreases that would be achieved if 95% VSR cooperation occurred in both the TSS and hypothetical SMAs (Table 8). These statistics were calculated as averages across all years for which scenarios were run (2014–2018) to account for interannual variation in vessel transits and fleet characteristics. We found that 88.6, 96.5, 82.8, and 94.1% of study area mortality for blue, summer/fall humpback, fin, and winter/spring humpback whales, respectively, occurred in the combined TSS and SMA areas. Averaged across years, 95% cooperation with a 10-kn speed limit in these areas would result in 1.8 (±0.1) blue, 1.3 (±0.1) humpback, and 2.2 (±0.1) fin whales saved each year in June–November and 1.1 (±0.2) humpback whale in January–April. Those numbers equate to 21, 29, and 22% less mortality for blue, humpback, and fin whales, respectively, in June–November in the study area, and 25% fewer humpback whale deaths in January–April.
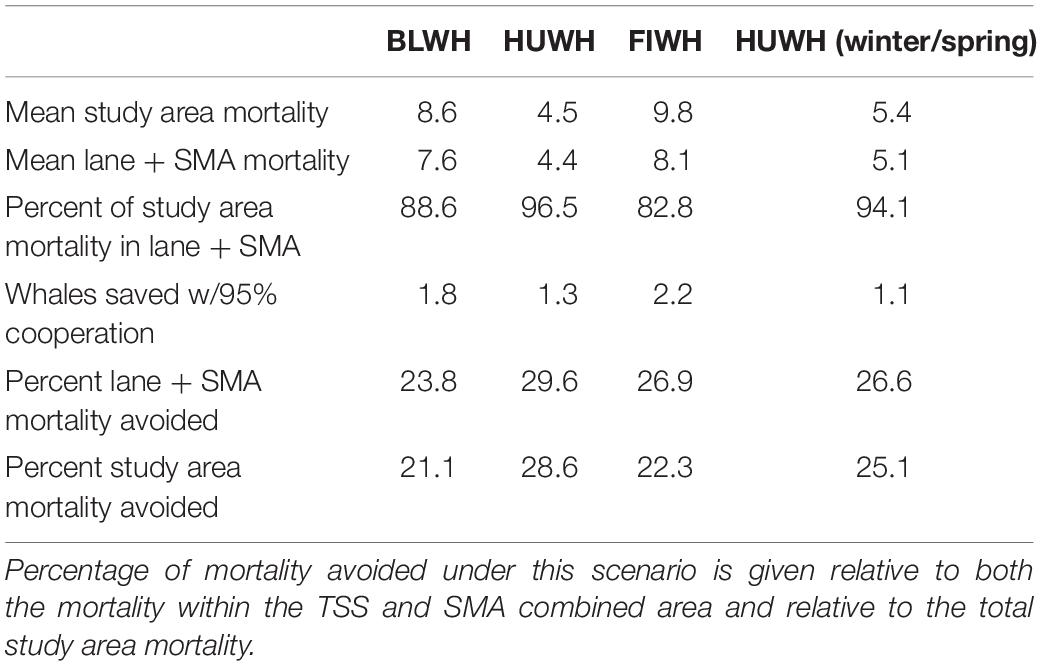
Table 8. Statistics for predicted effects on mortality if 95% cooperation were achieved in both the TSS lanes and the SMA areas.
Discussion
Reducing the number of whales killed by vessels around the world remains a challenging task (Clapham et al., 1999; Laist et al., 2001; van der Hoop et al., 2013). Vessel routing and speed reductions remain the primary tools employed (Silber et al., 2012b; Conn and Silber, 2013; Constantine et al., 2015; Rockwood et al., 2017; Guzman et al., 2020), though other technical approaches such as real-time whale position reporting have also been used (Sèbe et al., 2019). The implementation of both mandatory and voluntary VSRs in different locations has shown that VSR effectiveness can vary significantly (McKenna et al., 2012; Constantine et al., 2015; Silber et al., 2015; Freedman et al., 2017; Guzman et al., 2020). While slower vessel speeds can have additional benefits such as decreased ocean noise, lower emissions, and greater fuel efficiency (Leaper, 2019), longer transit times can add costs (Betz et al., 2011; Gonyo et al., 2019). Since the shipping industry may incur some costs for slowing down, it is important that sound science and effective analyses support the trade-offs involved in VSR management actions.
To reduce the probability of lethal vessel strikes, we assessed mortality using a refined encounter model approach and novel simulation approaches in the Channel TSS and surrounding waters. This work can inform management strategies and provide cooperation targets that will reduce vessel strikes in this high mortality area. While applied here to a specific location and species, this approach can evaluate strike risk and VSR program effectiveness in any region and for any marine megafauna populations where vessel traffic and animal density can be spatially quantified.
Overall Mortality and Comparison to EEZ-Wide Results
Strike mortality and co-occurrence of whales and marine vessels have been known problems in our study area for years (Redfern et al., 2013). Our results add to the evidence that the area has high strike mortality for blue, humpback, and fin whales (Rockwood et al., 2017). Previous strike mortality predictions used a single year of vessel data and averaged vessel parameters within grid cells, whereas here we used additional years of vessel traffic data and an improved model formulation which calculated expected encounters for each vessel transit independently. By evaluating each track rather than averaging vessel parameters per grid cell, we captured non-linear relationships between encounter rate and the probability of mortality and speed. When the vessels that change their speed are clustered at either tail of the speed distribution (especially fast or slow), the resulting changes in strike mortality are governed by those non-linear relationships. For this reason, ensuring accurate quantification of non-linear relationships is important for comparisons between time periods or simulated scenarios as were made here.
Compared to Rockwood et al. (2017), the improved model and more inclusive vessel data (vessel classes were not limited to cargo, passenger, and tug) resulted in higher mortality estimates (Table 1). These higher estimates elevate concern that PBR is exceeded for blue whales since in this region 8.9 blue whales are estimated to be killed by vessel strikes and in the area offshore of San Francisco evaluated by Rockwood et al. (2020a) the predicted number of deaths was 7. In these two areas alone, mortality estimates greatly exceed PBR, a metric that applies to the whole west coast EEZ. Nonetheless, a population model analysis questioned whether ship strike and entanglement mortality or carrying capacity (Monnahan et al., 2015) is the limiting factor responsible for the apparent lack of Eastern North Pacific blue whale population growth in the last decade (Calambokidis and Barlow, 2013; Carretta et al., 2020).
Whale abundances and distributions were a significant factor in monthly and annual variability in strike death predictions for central California (Rockwood et al., 2020a). Since monthly predictions of whale abundance and distribution were not available for this study region, we instead used a long-term average. Therefore, only changes in vessel traffic affected our predictions between months and years and our model was unable to estimate temporal variability in strike mortality realistically as was done in Rockwood et al. (2020a). Long-term whale average whale distribution and abundance is the most relevant to setting management targets, but cannot inform what to expect with regard to the level of variability ship strike mortality or mitigation success on an annual basis. Thus, it is important to keep this in mind when comparing real-world management results to the findings of this research.
To our knowledge, this was the first time that vessel strike risk or mortality had been examined for humpback whales in the winter/spring months (January–April). For example, because no density models were available, Rockwood et al. (2017) assumed that minimal strike risk occurred in winter/spring. Our results are notable because, at least in this area, estimated mortality was actually greater during January–April than during what is typically thought of as the peak whale season (June–November). However, some studies have found that humpback whales are present in southern California year-round, though with a more off-shore distribution (Campbell et al., 2015; Becker et al., 2017). For example, about 37% of survey sightings in Southern California were during January–April (Campbell et al., 2015). Similarly, fin whales may occupy the region during winter/spring (Campbell et al., 2015) and there may even be a resident population (Scales et al., 2017). If this is the case, there may be significant fin whale mortality that remains unaccounted for even within modeling efforts.
Implications of Spatial Patterns
As expected from previous analysis, much of the predicted mortality was within the TSS where the highest density of vessels occurs (Table 3). However, blue and humpback whales had nearly half of mortality within the TSS, while fin whales only had 30%. Because of this, the importance of vessel management inside compared to outside the TSS varies for the different species. In fact, some management actions may result in a trade-off where strikes are reduced for one species and increased for another (Redfern et al., 2013, 2019). One advantage of VSRs (compared to re-routing ships) is that, assuming no other changes in vessel traffic spatial patterns, strike mortality for all species can only decrease as a result of slower vessel speeds, though the effect may be greater or lesser depending on species distributions. In some cases, concentrating ship vessel traffic in lanes or changing routes may actually increase ship strike risk to particular species (Redfern et al., 2019).
While a large portion of predicted mortality for all species was in the Channel lanes, there were also high mortality predictions in the western approach, especially for fin whales (Figures 5, 6). Some of the mortality predicted there came from altered vessel traffic patterns due to air pollution regulations in 2012–2014 (Moore et al., 2018; Redfern et al., 2019). However, even after changes to those regulations in 2015, a portion of traffic still traveled directly west from the ports of Los Angeles/Long Beach. The potential to concentrate this traffic into lanes was explored by Redfern et al. (2019), but such changes were determined to have relatively little impact on strike risk. Instead, Redfern et al. (2019) concluded that, along with implementation of an expanded ATBA, broad-scale speed restrictions would be most effective at curbing whale mortality from collisions. For this reason, we examined both past VSRs and potential increases in VSR cooperation in greater detail.
Predicted Changes in Mortality From Decreased Speed and VSR Cooperation
Since the UME in 2007, there have been various VSR zones and timeframes in the Channel lanes (Figure 2), but all have been voluntary requests or incentive programs (Freedman et al., 2017). Knowing the effectiveness of past efforts can help inform whether changes are necessary to achieve conservation goals, especially because getting the shipping industry to increase cooperation with VSRs has been challenging. Average vessel speeds (Figure 7 and Supplementary Figures 3, 4) in the VSR areas showed no consistent pattern from 2012 to 2018, suggesting no trend toward lower speeds overall. However, cooperation with the 10-kn VSR steadily increased during VSR months in 2015–2018 relative to 2013–2014 (non-VSR years) (Table 4). Cooperation during VSRs was greater than during inactive-VSR periods of the same year for 2015–2018 but not 2012. The distance-weighted mean speeds remained similar across years while cooperation increased. This occurred because distance was traveled at or just under 10 kn, less distance at slower speeds (2–8 kn), but more high-speed vessel transits (12–30 kn). In other words, the distance-weighted speed distribution became positively skewed while the mean remained nearly the same (Supplementary Figures 3, 4). This indicates that evaluating VSR program success based only on the proportion of distance traveled by vessels can lead to erroneous assumptions about the effect the VSR is having on mortality. It is therefore important to evaluate changes in risk or modeled mortality as we do here.
There has been a clear long-term trend of slowing vessels along the entire California coast (Moore et al., 2018). This can confound attribution of speed, cooperation, and changes in strike mortality to VSRs. Average vessel speeds decreased from 16 to 14 kn between 2012 and 2016, presumably in order to decrease costs and increase fuel efficiency in response to emissions control regulations (Moore et al., 2018). For this reason, we rely on the inactive-VSR analysis (using vessel speeds from the same year but months outside the VSR) to most accurately establish changes in strike mortality resulting from VSRs. Regardless of which reference period was used for speed re-sampling, the simulation predicted that VSRs had little effect on mortality (Table 5). In most years, predicted mortality was actually greater when speed reductions were in place because of the low cooperation combined with other shifts in the distribution of vessel speeds.
Simulated changes in strike mortality from speeds during the non-VSR period (2013–2014) to those observed in 2012 and 2015–2018 were small (Table 5). In all but 2016 and 2018, simulated mortality levels actually increased compared to both control estimates (non-VSR and inactive-VSR) for all species (Table 5). These increases were counterintuitive to the increases in cooperation levels observed in 2015 and 2017 (Table 4). However, since the relationship between speed and estimated mortality is non-linear, if the increase in cooperation comes from vessels only making slight decreases in speed (for example from 10.5 to 10 kn), the effect on mortality is minimal. At the same time, non-cooperating vessels may increase their speeds on average without affecting the proportion of cooperating vessels. This is what appears has happened during our study period where the proportion of vessels traveling at speeds around 20 kn actually increased while vessels traveling both just above and below 10 kn altered their speeds to be closer to 10 kn (Supplementary Figures 3, 4). In addition to nuanced effects on strike mortality from the distribution speeds, changes to the number and length of transits from year to year and variation in fleet characteristics such as the beam and draft of vessels can also influence mortality but would go undetected by mean speed or cooperation metrics.
The simulated mortality decreases in 2016 relative to non-VSR are approximately equivalent to avoiding one blue and one humpback whale vessel strike mortality every 30 years and one fin whale vessel strike mortality every 40 years within the VSR area. These minor decreases in 1 year combined with actual increases in mortality during active-VSR periods compared to control periods suggests that the voluntary VSR program has had little effect on whale mortality to date. This lack of effect on predicted mortality is largely driven by the low industry cooperation with the VSR.
Neither the non-VSR nor inactive-VSR simulations can entirely control for all extraneous changes in speed (those not caused by the VSR). The long-term decline in vessel speeds is best controlled for by using the inactive-VSR control period while seasonal speed differences are best controlled by the non-VSR control period. Mean speeds were 0.1 kn greater during inactive than active VSR season, while mean speeds were 0.2 kn greater during non-VSR than active-VSR years. This is a very minor difference, but suggests the non-VSR simulation may be a slight overestimate of the effect of the VSR on whale strike mortality while the inactive-VSR simulation may have an even smaller overestimate due to seasonal speed differences. The difference between the pre-VSR and inactive-VSR mortality changes can then be taken as a slight overestimate of the effect of the long-term decline in speeds. By this logic, approximately 3% less mortality occurred in the VSR areas for all three species as a result of the long-term speed decline. On an EEZ-wide basis, these speed declines may have had a significant effect on vessel-strike related mortality, but growth in humpback and fin whale populations and shifts in blue whale distribution may have overshadowed that effect, leading to overall increases in strike risk from 2008 to 2015 (Redfern et al., 2020).
Management Scenarios and the Future of Whale Strike Mitigation
For the southern California region, greater spatial application of VSR and implementation of an expanded ATBA have been identified as the most impactful management actions (Redfern et al., 2019). Redfern et al. (2019) evaluated 100% compliance with VSRs in either just the TSS or within a 150 nm radius of the ports of Los Angeles/Long Beach. Unsurprisingly, a VSR in the larger, inclusive area had a greater effect on strike risk, decreasing it by 24% compared to 11–20% for just the lanes. However, experience has shown that achieving 100% cooperation with a 10-kn VSR is unlikely, especially for a voluntary program (Silber et al., 2015; Freedman et al., 2017; Guzman et al., 2020). For this reason, we evaluated the effect of a range of cooperation levels (30–95%) to better inform managers of likely outcomes of VSR efforts.
Our results suggest that decreases in strike risk of up to 23% for blue whales, 28% for summer/fall humpback whales, 25% for fin whales, and 26% for winter/spring humpback whales could be achieved in the TSS if 95% cooperation were achieved (Table 6 and Supplementary Figures 1, 2). With ship fleet characteristics similar to 2014, 95% cooperation with a 10-kn limit in the lanes would equate to saving 1.2 blue whales, 0.8 humpback whales, and 0.9 fin whales during June–November. If the VSR was extended to January–April, an additional 0.5 humpback whales could be saved.
Applying VSRs in our hypothetical SMAs proportionally reduced strike risk more than the equivalent VSR cooperation would in the TSSs. Percent decreases in vessel-strike related mortality within the SMAs ranged from 27.4 to 30.0% when 95% cooperation was simulated. However, absolute numbers of whales saved would be lower in the SMAs because they encompass less modeled mortality to begin with. Thus, for 95% cooperation, the maximum number of whales saved in the SMAs would be 0.7 blue whales, 0.5 summer/fall humpback whales, 1.5 fin whales, and 0.4 humpback whales in winter/spring. As with the findings of Redfern et al. (2019), combining VSRs in the TSS with expanded VSRs in the potential SMAs has the greatest potential to decrease vessel strikes in southern California. By taking these management actions, we predict that 21–29% of summer/fall deaths for all species and 25% of winter/spring humpback whale collision mortality can be avoided in the region (Table 8). While we could not incorporate interannual variation in whale density and distribution in our analysis, these results represent the expected average effect of management over time.
Our methods and those used by Redfern et al. (2019) differed, making direct comparison difficult. For example, we explicitly evaluated a range of VSR cooperation while the Redfern et al. (2019) implicitly assumed 100% cooperation. Our analysis spanned 2012–2018 while theirs spanned 2008–2015 and our model included the effect of vessel proportions on mortality. Nonetheless, when we compare our results for 2014 and 2015 (the years after air pollution rules no longer affected traffic patterns), they are qualitatively similar: high cooperation with VSRs in the lanes would have saved a substantial proportion of vessel-struck whales and expansion of VSRs to a wider area further enhances those conservation gains. However, we find that our smaller hypothetical SMAs (compared to VSR for the whole region) contributed more to potential mortality decreases. Redfern et al. (2019) calculated only a ∼4% decrease in collision risk when VSR was applied to the whole region, while our results suggest approximately 7–13% greater decreases in mortality could be achieved when combining VSRs in the TSS and hypothetical SMAs compared to just the TSS.
Overall, the VSR has resulted in more vessels transiting at or below 10 kn, but other changes in speed distributions mean the VSR has had little impact on whale mortality to date. Our findings that greater cooperation should significantly decrease whale deaths (Supplementary Figures 1, 2) reinforce the need for industry to increase cooperation. Under the MMPA and ESA, NOAA is charged with managing threats to listed whale populations, including vessel strikes. If desired cooperation levels to cannot be met with voluntary VSRs, there should be consideration of mandatory regulations. The application of VSRs to additional high-risk areas should also be considered as way to reach conservation goals. As of the writing of this article, NOAA greatly expanded the VSR in southern California from Pt. Arguello to Dana Pt., including the waters south of the islands.
Conclusion
One of the most effective ways of addressing vessel strikes in regions where heavy vessel traffic and whale use overlap is through VSRs. Vital to the success of such efforts, however, is cooperation of a large proportion of vessels (Silber et al., 2014). This analysis highlights how a metric like percent cooperation can suggest conservation gains while shifts in the overall distribution of vessel speeds in fact undermines any decreases in whale deaths. For this reason, we suggest that distance-weighted cooperation and mean speed metrics are helpful for rapid assessments of program progress and for reporting and enforcement purposes but may fall short when evaluating the true effect of VSRs on mortality. Thus, large increases in cooperation can safely be interpreted to result in meaningful conservation improvements while small increases in cooperation may not. Based on our model and other approaches to quantification of strike risk the most important factors include variation in whale distribution, vessel distribution, vessel speed, vessel sizes, and whale behavior through time (Calambokidis et al., 2019; Keen et al., 2019; Blondin et al., 2020; Rockwood et al., 2020a). Evaluation of speed distributions and using a full strike mortality model as done here will provide more robust VSR program evaluation.
Because cooperation is one of the key components of a successful VSR, a well-designed strategy is necessary to achieve the needed participation (van der Hoop et al., 2015; Sèbe et al., 2019). Collaboration with industry, as was done with the vessel strike working groups in this region, can be beneficial, and efforts at outreach and industry cooperation report cards have indicated some positive outcomes (Constantine et al., 2015). Following an increase in outreach, from 2018 to present there have been steady increases in cooperation levels documented with the voluntary VSR programs implemented in northern California. In 2019, the year after this study’s time period, cooperation in southern California increased to 50% and closer to 60% in 2020 (Jessica Morten, pers. comm.).
Our study region has both the whale and port pollution speed management programs in place and the differing goals have resulted in unintended consequences in the past (Moore et al., 2018; Redfern et al., 2019). Currently the port VSR requests 12 kn speeds within a 40 nm radius, but 10 kn has been shown to provide additional decreases in mortality of vessel-struck whales (Conn and Silber, 2013; Redfern et al., 2019). It may be beneficial both for the consistency of regulations and for greater conservation of whales, and further air and underwater noise pollution reduction, if port officials reduced the port VSR to 10 kn to align with the NOAA VSR.
While the shipping industry has expressed concerns about economic impacts of speed reductions in the past, they have proven unfounded (Silber and Bettridge, 2012). Similarly, an analysis of the likely economic effect of speed reduction in our study region suggests there would be little cost to industry (Betz et al., 2011; Gonyo et al., 2019). Thus, based on our analysis, we recommend that if vessels do not rapidly increase cooperation with the VSR to levels necessary to ensure vessel-strike related mortality does not inhibit reaching and maintaining optimal sustainable populations, a mandatory VSR should be considered. Historically, mandatory regulations have achieved the highest levels of cooperation with VSRs (McKenna et al., 2012; Silber et al., 2014). Moreover, establishing VSRs in the western channel may keep vessels from shifting transits to the western approach, as they did in the past due to air pollution regulation, and further increase the number of whales saved.
As long as speed restrictions remain one of the primary tools to address deaths from vessel strikes, it will be important to both evaluate past program effectiveness and explore management and cooperation scenarios for future planning. Our approach provides a comprehensive means for managers to consider multiple management scenarios and quantitatively explore potential outcomes. Thus, where information on species density and distribution can be combined with AIS data, vessel traffic, analytical methods similar to those employed here may prove useful in evaluating and developing management measures to improve the conservation of marine megafauna.
Data Availability Statement
The raw data supporting the conclusions of this article will be made available by the authors, without undue reservation.
Author Contributions
RR: conceptualization, visualization, and writing – original draft. RR and JA: data curation, formal analysis, and software. RR and JJ: funding acquisition, project administration, resources, and supervision. RR, JJ, and JA: investigation. RR, JJ, JA, JM, and SH: methodology and writing – review editing. All authors contributed to the article and approved the submitted version.
Funding
This analysis was funded by Battery Powered and the Gordon and Betty Moore Foundation. Funding for ACCESS and whale spatial modeling was provided in part by the Angell Family Foundation, Bently Foundation, Bonnell Cove Foundation, Boring Family Foundation, California Sea Grant, Elinor Patterson Baker Trust, Faucett Catalyst Fund, Firedoll Foundation, Hellman Family Foundation, Moore Family Foundation, National Fish and Wildlife Foundation, Office of National Marine Sanctuaries, Pacific Life Foundation, Resources Legacy Fund, Thelma Doelger Trust for Animals, and Point Blue donors.
Conflict of Interest
The authors declare that the research was conducted in the absence of any commercial or financial relationships that could be construed as a potential conflict of interest.
Publisher’s Note
All claims expressed in this article are solely those of the authors and do not necessarily represent those of their affiliated organizations, or those of the publisher, the editors and the reviewers. Any product that may be evaluated in this article, or claim that may be made by its manufacturer, is not guaranteed or endorsed by the publisher.
Acknowledgments
We thank Julie Howar for providing GIS data. We would like to thank Elizabeth Becker for providing whale density predictions. We would also like to thank John Calambokidis and Angela Szesciorka for compiling and analyzing tag data for time at depth calculations. John Calambokidis, Angela Szesciorka, James Fahlbusch, and Nathan Harrison developed and deployed whale tags. Earlier versions of this manuscript were greatly improved by Shannon Bettridge, Caroline Good, Eric Patterson, and Penny Ruvelas.
Supplementary Material
The Supplementary Material for this article can be found online at: https://www.frontiersin.org/articles/10.3389/fmars.2021.649890/full#supplementary-material
Footnotes
References
Abrahms, B., Hazen, E. L., Aikens, E. O., Savoca, M. S., Goldbogen, J. A., Bograd, S. J., et al. (2019). Memory and resource tracking drive blue whale migrations. Proc. Natl. Acad. Sci. U.S.A. 116, 5582–5587. doi: 10.1073/pnas.1819031116
Becker, E., Forney, K., Fiedler, P., Barlow, J., Chivers, S., Edwards, C., et al. (2016). Moving towards dynamic ocean management: how well do modeled ocean products predict species distributions? Remote Sens. 8:149. doi: 10.3390/rs8020149
Becker, E. A., Foley, D. G., Forney, K. A., Barlow, J., Redfern, J. V., and Gentemann, C. L. (2012). Forecasting cetacean abundance patterns to enhance management decisions. Endanger. Species Res. 16, 97–112. doi: 10.3354/esr00390
Becker, E. A., Forney, K. A., Thayre, B. J., Debich, A., Campbell, G. S., Whitaker, K., et al. (2017). Habitat-based density models for three cetacean species off Southern California illustrate pronounced seasonal differences. Front. Mar. Sci. 4:121. doi: 10.3389/fmars.2017.00121
Betz, S., Callahan, A. R., Campbell, L. E., Green, S. E., Labrum, K. M., Betz, S., et al. (2011). Reducing the Risk of Vessel Strikes to Endangered Whales in the Santa Barbara Channel: An Economic Analysis and Risk Assessment of Potential Management Scenarios. Santa Barbara, CA: Bren School of Environmental Science & Management University of California.
Blondin, H., Abrahms, B., Crowder, L. B., and Hazen, E. L. (2020). Combining high temporal resolution whale distribution and vessel tracking data improves estimates of ship strike risk. Biol. Conserv. 250:108757. doi: 10.1016/j.biocon.2020.108757
Calambokidis, J., and Barlow, J. (2013). Updated Abundance Estimates of Blue and Humpback Whales off the US West Coast Incorporating Photo-Identifications from 2010 and 2011. Available online at: https://www.cascadiaresearch.org/publications/updated-abundance-estimates-blue-and-humpback-whales-us-west-coast-incorporating-photo (accessed January 13, 2021).
Calambokidis, J., Fahlbusch, J. A., Szesciorka, A. R., Southall, B. L., Cade, D. E., Friedlaender, A. S., et al. (2019). Differential Vulnerability to ship strikes between day and night for blue, fin, and humpback whales based on dive and movement data from medium duration archival tags. Front. Mar. Sci. 6:503. doi: 10.3389/fmars.2019.00543
Calambokidis, J., Steiger, G. H., Curtice, C., Harrison, J., Ferguson, M. C., Becker, E., et al. (2015). 4. Biologically important areas for selected cetaceans within U.S. waters–west coast region. Aquat. Mamm. 41, 39–53. doi: 10.1578/AM.41.1.2015.39
Campbell, G. S., Thomas, L., Whitaker, K., Douglas, A. B., Calambokidis, J., and Hildebrand, J. A. (2015). Inter-annual and seasonal trends in cetacean distribution, density and abundance off southern {California}. Deep Sea Res. 2 Top. Stud. Oceanogr. 112, 143–157. doi: 10.1016/j.dsr2.2014.10.008
Carretta, J. V., Forney, K. A., Oleson, E. M., Weller, D. W., Lang, A. R., Baker, J., et al. (2020). U.S. Pacific Marine Mammal Stock Assessments: 2019. NOAA technical memorandum NOAA-TM-NMFS-SWFSC-629. Silver Spring, MD: NOAA Technical Memorandum. doi: 10.7289/V5/TM-SWFSC-629
Channel Islands National Marine Sanctuary Advisory Council Marine Shipping Working Group (2016). Marine Shipping Working Group Final Report. Santa Barbara, CA: Channel Islands National Marine Sanctuary Advisory Council Marine Shipping Working Group.
Clapham, P. J., Young, S. B., and Brownell, R. L. Jr. (1999). Baleen whales: conservation issues and the status of the most endangered populations. Mamm. Rev. 29, 37–60. doi: 10.1046/j.1365-2907.1999.00035.x
Conn, P. B., and Silber, G. K. (2013). Vessel speed restrictions reduce risk of collision-related mortality for North Atlantic right whales. Ecosphere 4, 1–15. doi: 10.1890/ES13-00004.1
Constantine, R., Johnson, M., Riekkola, L., Jervis, S., Kozmian-Ledward, L., Dennis, T., et al. (2015). Mitigation of vessel-strike mortality of endangered Bryde’s whales in the Hauraki Gulf, New Zealand. Biol. Conserv. 186, 149–157. doi: 10.1016/j.biocon.2015.03.008
Crum, N., Gowan, T., Krzystan, A., and Martin, J. (2019). Quantifying risk of whale–vessel collisions across space, time, and management policies. Ecosphere 10:e02713. doi: 10.1002/ecs2.2713
Freedman, R., Herron, S., Byrd, M., Birney, K., Morten, J., Shafritz, B., et al. (2017). The effectiveness of incentivized and non-incentivized vessel speed reduction programs: case study in the Santa Barbara channel. Ocean Coast. Manag. 148, 31–39. doi: 10.1016/j.ocecoaman.2017.07.013
Gende, S. M., Hendrix, A. N., Harris, K. R., Eichenlaub, B., Nielsen, J., and Pyare, S. (2011). A Bayesian approach for understanding the role of ship speed in whale–ship encounters. Ecol. Appl. 21, 2232–2240. doi: 10.1890/10-1965.1
Gonyo, S. B., Goedeke, T. L., Wolfe, K. E., Jeffrey, C. F. G., Gorstein, M., Poti, M., et al. (2019). An economic analysis of shipping costs related to potential changes in vessel operating procedures to manage the co-occurrence of maritime vessel traffic and whales in the Channel Islands region. Ocean Coast. Manag. 177, 179–187. doi: 10.1016/j.ocecoaman.2019.04.024
Gurarie, E., and Ovaskainen, O. (2013). Towards a general formalization of encounter rates in ecology. Theor. Ecol. 6, 189–202. doi: 10.1007/s12080-012-0170-4
Guzman, H. M., Hinojosa, N., and Kaiser, S. (2020). Ship’s compliance with a traffic separation scheme and speed limit in the Gulf of Panama and implications for the risk to humpback whales. Mar. Policy 120:104113. doi: 10.1016/j.marpol.2020.104113
Irvine, L. M., Mate, B. R., Winsor, M. H., Palacios, D. M., Bograd, S. J., Costa, D. P., et al. (2014). Spatial and temporal occurrence of blue whales off the U.S. west coast, with implications for management. PLoS One 9:e102959. doi: 10.1371/journal.pone.0102959
Irvine, L. M., Palacios, D. M., Lagerquist, B. A., and Mate, B. R. (2019). Scales of blue and fin whale feeding behavior off California, USA, with implications for prey patchiness. Front. Ecol. Evol. 7:338. doi: 10.3389/fevo.2019.00338
Jensen, A. S., and Silber, G. K. (2004). Large Whale Ship Strike Database, Vol. 33. Washington, DC: US Department of Commerce, National Oceanic and Atmospheric Administration, D647–D650.
Jensen, C. M., Hines, E., Holzman, B. A., Moore, T. J., Jahncke, J., and Redfern, J. V. (2015). Spatial and temporal variability in shipping traffic off San Francisco, California. Coast. Manag. 43, 575–588. doi: 10.1080/08920753.2015.1086947
Keen, E. M., Scales, K. L., Rone, B. K., Hazen, E. L., Falcone, E. A., and Schorr, G. S. (2019). Night and day: diel differences in ship strike risk for fin whales (Balaenoptera physalus) in the California Current System. Front. Mar. Sci. 6:730. doi: 10.3389/fmars.2019.00730
Kelley, D. E., Vlasic, J. P., and Brillant, S. W. (2021). Assessing the lethality of ship strikes on whales using simple biophysical models. Ma. Mamm. Sci. 37, 251–267. doi: 10.1111/mms.12745
Lagueux, K. M., Zani, M. A., Knowlton, A. R., and Kraus, S. D. (2011). Response by vessel operators to protection measures for right whales Eubalaena glacialis in the southeast US calving ground. Endanger. Species Res. 14, 69–77. doi: 10.3354/esr00335
Laist, D. W., Knowlton, A. R., Mead, J. G., Collet, A. S., and Podesta, M. (2001). Collisions between ships and whales. Mar. Mammal Sci. 17, 35–75. doi: 10.1111/j.1748-7692.2001.tb00980.x
Laist, D. W., Knowlton, A. R., and Pendleton, D. (2014). Effectiveness of mandatory vessel speed limits for protecting North Atlantic right whales. Endanger. Species Res. 23, 133–147. doi: 10.3354/esr00586
Leaper, R. (2019). The role of slower vessel speeds in reducing greenhouse gas emissions, underwater noise and collision risk to whales. Front. Mar. Sci. 6:505. doi: 10.3389/fmars.2019.00505
Louzao, M., Bécares, J., Rodríguez, B., Hyrenbach, K., Ruiz, A., and Arcos, J. (2009). Combining vessel-based surveys and tracking data to identify key marine areas for seabirds. Mar. Ecol. Prog. Ser. 391, 183–197. doi: 10.3354/meps08124
Martin, J., Sabatier, Q., Gowan, T. A., Giraud, C., Gurarie, E., Calleson, C. S., et al. (2016). A quantitative framework for investigating risk of deadly collisions between marine wildlife and boats. Methods Ecol. Evol. 7, 42–50. doi: 10.1111/2041-210X.12447
McKenna, M. F., Katz, S. L., Condit, C., and Walbridge, S. (2012). Response of commercial ships to a voluntary speed reduction measure: are voluntary strategies adequate for mitigating ship-strike risk? Coast. Manag. 40, 634–650. doi: 10.1080/08920753.2012.727749
Mizroch, S. A., Rice, D. W., Zwiefelhofer, D., Waite, J., and Perryman, W. L. (2009). Distribution and movements of fin whales in the North Pacific Ocean. Mamm. Rev. 39, 193–227. doi: 10.1111/j.1365-2907.2009.00147.x
Monnahan, C. C., Branch, T. A., and Punt, A. E. (2015). Do ship strikes threaten the recovery of endangered eastern North Pacific blue whales? Mar. Mammal Sci. 31, 279–297. doi: 10.1111/mms.12157
Moore, M. J., Mitchell, G. H., Rowles, T. K., and Early, G. (2020). Dead cetacean? Beach, bloat, float, sink. Front. Mar. Sci. 7:333. doi: 10.3389/fmars.2020.00333
Moore, T. J., Redfern, J. V., Carver, M., Hastings, S., Adams, J. D., and Silber, G. K. (2018). Exploring ship traffic variability off California. Ocean Coast. Manag. 163, 515–527. doi: 10.1016/j.ocecoaman.2018.03.010
Neilson, J. L., Gabriele, C. M., Jensen, A. S., Jackson, K., and Straley, J. M. (2012). Summary of reported whale-vessel collisions in Alaskan Waters. J. Mar. Biol. 2012:106282. doi: 10.1155/2012/106282
Nichol, L. M., Wright, B. M., O’Hara, P., and Ford, J. K. B. (2017). Risk of lethal vessel strikes to humpback and fin whales off the west coast of Vancouver Island, Canada. Endanger. Species Res. 32, 373–390. doi: 10.3354/esr00813
Oleson, E. M., Širović, A., Bayless, A. R., and Hildebr, J. A. (2014). Synchronous seasonal change in fin whale song in the North Pacific. PLoS One 9:e115678. doi: 10.1371/journal.pone.0115678
Pace, R. M., Corkeron, P. J., and Kraus, S. D. (2017). State-space mark-recapture estimates reveal a recent decline in abundance of North Atlantic right whales. Ecol. Evol. 7, 8730–8741. doi: 10.1002/ece3.3406
Pace, R. M., Williams, R., Kraus, S. D., Knowlton, A. R., and Pettis, H. M. (2021). Cryptic mortality of north atlantic right whales. Conserv. Sci. Pract. 3, 1–8. doi: 10.1111/csp2.346
Peel, D., Smith, J. N., and Childerhouse, S. (2018). Vessel strike of whales in Australia: the challenges of analysis of historical incident data. Front. Mar. Sci. 5:69. doi: 10.3389/fmars.2018.00069
Pirotta, V., Grech, A., Jonsen, I. D., Laurance, W. F., and Harcourt, R. G. (2019). Consequences of global shipping traffic for marine giants. Front. Ecol. Environ. 17:39–47. doi: 10.1002/fee.1987
R Core Team (2019). R: A Language and Environment for Statistical Computing. Vienna: R Foundation for Statistical Computing.
Redfern, J. V., Becker, E. A., and Moore, T. J. (2020). Effects of variability in ship traffic and whale distributions on the risk of ships striking whales. Front. Mar. Sci. 6:793. doi: 10.3389/fmars.2019.00793
Redfern, J. V., McKenna, M. F., Moore, T. J., Calambokidis, J., DeAngelis, M. L., Becker, E. A., et al. (2013). Assessing the risk of ships striking large whales in marine spatial planning. Conserv. Biol. 27, 292–302. doi: 10.1111/cobi.12029
Redfern, J. V., Moore, T. J., Becker, E. A., Calambokidis, J., Hastings, S. P., Irvine, L. M., et al. (2019). Evaluating stakeholder-derived strategies to reduce the risk of ships striking whales. Divers. Distrib. 25, 1575–1585. doi: 10.1111/ddi.12958
Reisdorf, A. G., Bux, R., Wyler, D., Benecke, M., Klug, C., Maisch, M. W., et al. (2012). Float, explode or sink: postmortem fate of lung-breathing marine vertebrates. Palaeobiodivers. Palaeoenviron. 92, 67–81. doi: 10.1007/s12549-011-0067-z
Robards, M. D., Silber, G. K., Adams, J. D., Arroyo, J., Lorenzini, D., Schwehr, K., et al. (2016). Conservation science and policy applications of the marine vessel automatic identification system (AIS)—a review. Bull. Mar. Sci. 92, 75–103. doi: 10.5343/bms.2015.1034
Rockwood, R. C., Adams, J., Silber, G., and Jahncke, J. (2020a). Estimating effectiveness of speed reduction measures for decreasing whale strike mortality in a high-risk region. Endanger. Species Res 43, 145–166. doi: 10.3354/esr01056
Rockwood, R. C., Calambokidis, J., and Jahncke, J. (2017). High mortality of blue, humpback and fin whales from modeling of vessel collisions on the U.S. West Coast suggests population impacts and insufficient protection. PLoS One 12:e0183052. doi: 10.1371/journal.pone.0183052
Rockwood, R. C., Elliott, M. L., Saenz, B., Nur, N., and Jahncke, J. (2020b). Modeling predator and prey hotspots: management implications of baleen whale co-occurrence with krill in Central California. PLoS One 15:e0235603. doi: 10.1371/journal.pone.0235603
Scales, K. L., Schorr, G. S., Hazen, E. L., Bograd, S. J., Miller, P. I., Andrews, R. D., et al. (2017). Should I stay or should I go? Modelling year-round habitat suitability and drivers of residency for fin whales in the California Current. Divers. Distrib. 23, 1204–1215. doi: 10.1111/ddi.12611
Schoeman, R. P., Patterson-Abrolat, C., and Plön, S. (2020). A global review of vessel collisions with marine animals. Front. Mar. Sci. 7:292. doi: 10.3389/fmars.2020.00292
Sèbe, M., Kontovas, C. A., and Pendleton, L. (2019). A decision-making framework to reduce the risk of collisions between ships and whales. Mar. Policy 109:103697. doi: 10.1016/j.marpol.2019.103697
Sharp, S. M., McLellan, W. A., Rotstein, D. S., Costidis, A. M., Barco, S. G., Durham, K., et al. (2019). Gross and histopathologic diagnoses from North Atlantic right whale Eubalaena glacialis mortalities between 2003 and 2018. Dis. Aquat. Organ. 135, 1–31. doi: 10.3354/dao03376
Silber, G. K., Adams, J. D., Asaro, M. J., Cole, T. V. N., Moore, K. S., Ward-Geiger, L. I., et al. (2015). The right whale mandatory ship reporting system: a retrospective. PeerJ 3:e866. doi: 10.7717/peerj.866
Silber, G. K., Adams, J. D., and Bettridge, S. (2012a). Vessel operator response to a voluntary measure for reducing collisions with whales. Endanger. Species Res. 17, 245–254. doi: 10.3354/esr00434
Silber, G. K., Adams, J. D., and Fonnesbeck, C. J. (2014). Compliance with vessel speed restrictions to protect North Atlantic right whales. PeerJ 2:e399. doi: 10.7717/peerj.399
Silber, G. K., and Bettridge, S. (2012). An Assessment of the Final Rule to Implement Vessel Speed Restrictions to Reduce the Threat of Vessel Collisions with North Atlantic Right Whales. NOAA Technical Memorandum NMFS-OPR-48. Silver Spring, MD: NOAA Technical Memorandum, 114.
Silber, G. K., Lettrich, M., and Thomas, P. O. (2016). Report of a Workshop on Best Approaches and Needs for Projecting Marine Mammal Distributions in a Changing Climate. NOAA Technical Memorandum NMFS-OPR-54. Silver Spring, MD: NOAA Technical Memorandum, 50.
Silber, G. K., Slutsky, J., and Bettridge, S. (2010). Hydrodynamics of a ship/whale collision. J. Exp. Mar. Bio. Ecol. 391, 10–19. doi: 10.1016/j.jembe.2010.05.013
Silber, G. K., Vanderlaan, A. S. M., Tejedor Arceredillo, A., Johnson, L., Taggart, C. T., Brown, M. W., et al. (2012b). The role of the International maritime organization in reducing vessel threat to whales: process, options, action and effectiveness. Mar. Policy 36, 1221–1233. doi: 10.1016/j.marpol.2012.03.008
Szesciorka, A. R., Allen, A. N., Calambokidis, J., Fahlbusch, J., McKenna, M. F., and Southall, B. (2019). A case study of a near vessel strike of a blue whale: perceptual cues and fine-scale aspects of behavioral avoidance. Front. Mar. Sci. 6:761. doi: 10.3389/fmars.2019.00761
Tournadre, J. (2014). Anthropogenic pressure on the open ocean: the growth. Geophys. Res. Lett. 41, 7924–7932. doi: 10.1002/2014GL061786
van der Hoop, J. M., Moore, M. J., Barco, S. G., Cole, T. V. N., Daoust, P. Y., Henry, A. G., et al. (2013). Assessment of management to mitigate anthropogenic effects on large whales. Conserv. Biol. 27, 121–133. doi: 10.1111/j.1523-1739.2012.01934.x
van der Hoop, J. M., Vanderlaan, A. S. M., Cole, T. V. N., Henry, A. G., Hall, L., Mase-Guthrie, B., et al. (2015). Vessel strikes to large whales before and after the 2008 ship strike rule. Conserv. Lett. 8, 24–32. doi: 10.1111/conl.12105
van der Hoop, J. M., Vanderlaan, A. S. M., and Taggart, C. T. (2012). Absolute probability estimates of lethal vessel-strikes to North Atlantic right whales in Roseway Basin, Scotian Shelf. Ecol. Appl. 22, 2021–2033. doi: 10.1890/11-1841.1
Vanderlaan, A. S. M., and Taggart, C. T. (2009). Efficacy of a voluntary area to be avoided to reduce risk of lethal vessel strikes to endangered whales. Conserv. Biol. 23, 1467–1474. doi: 10.1111/j.1523-1739.2009.01329.x
Wade, P. R. (1998). Calculating limits to the allowable human-caused mortality of cetaceans and pinnipeds. Mar. Mammal Sci. 14, 1–37.
Wade, P. R. (2017). Estimates of Abundance and Migratory Destination for North Pacific Humpback Whales in Both Summer Feeding Areas and Winter Mating and Calving Areas–Revision of Estimates in SC/66b/IA21. Available online at: https://archive.iwc.int/?r=6531 (accessed December 5, 2020).
Wiley, D. N., Moller, J. C., Pace, R. M., and Carlson, C. (2008). Effectiveness of voluntary conservation agreements: case study of endangered whales and commercial whale watching. Conserv. Biol. 22, 450–457. doi: 10.1111/j.1523-1739.2008.00897.x
Keywords: ship strikes, blue whale, humpback whale, fin whale, encounter model, speed restriction, shipping
Citation: Rockwood RC, Adams JD, Hastings S, Morten J and Jahncke J (2021) Modeling Whale Deaths From Vessel Strikes to Reduce the Risk of Fatality to Endangered Whales. Front. Mar. Sci. 8:649890. doi: 10.3389/fmars.2021.649890
Received: 05 January 2021; Accepted: 22 June 2021;
Published: 23 July 2021.
Edited by:
Lyne Morissette, M – Expertise Marine, CanadaReviewed by:
Francine Kershaw, Natural Resources Defense Council, United StatesJohn E. Joseph, Naval Postgraduate School, United States
Tetyana Margolina, Naval Postgraduate School, United States
Scott Gende, National Park Service, United States
Copyright © 2021 Rockwood, Adams, Hastings, Morten and Jahncke. This is an open-access article distributed under the terms of the Creative Commons Attribution License (CC BY). The use, distribution or reproduction in other forums is permitted, provided the original author(s) and the copyright owner(s) are credited and that the original publication in this journal is cited, in accordance with accepted academic practice. No use, distribution or reproduction is permitted which does not comply with these terms.
*Correspondence: R. Cotton Rockwood, Y3JvY2t3b29kQHBvaW50Ymx1ZS5vcmc=