 Cláudio Cardoso
 Rui M. A. Caldeira
- 1Observatório Oceânico da Madeira, Agência Regional para o Desenvolvimento da Investigação, Tecnologia e Inovação, Funchal, Portugal
- 2Instituto Dom Luiz, Faculdade de Ciências, Universidade de Lisboa, Lisbon, Portugal
The constant increase of marine plastic pollution poses an unprecedented risk to oceanic islands, which become increasingly exposed to a hazard of which they have very little control. Located in the Northeast Atlantic Ocean, the Macaronesia is comprised by the Azores, Madeira, Canary Islands, and Cabo Verde. Although past studies suggest that most plastic items collected on these islands are from offshore regions, their actual sources remain unclear to present date. As such, we focus on the characterization of the potential sources and pathways of plastic particles reaching the Macaronesia archipelagos. This is achieved by combining modeled datasets for ocean currents, winds and waves with a Lagrangian tool used to track virtual particles released around the archipelagos for a 10-year period, making a distinction between surface and submerged particles. Global drifter trajectories are also assessed, selecting those that intercept the archipelagos. Our results demonstrate that the North Atlantic subtropical gyre is the most conspicuous feature in particles and drifter trajectories. The Gulf Stream acts as the main pathway for all archipelagos at a regional scale, though with less significance to Cabo Verde. Surface particles are connected to regional sources in a shorter timescale than mixed particles, mainly because of the wind. Intercepting high-windage particle trajectories are dominant at the center of the North Atlantic subtropical gyre, demonstrating that particles originating from the North Atlantic “garbage patch” are most likely to intercept the archipelagos if considerably exposed to the wind. Regarding the connectivity to sources, all archipelagos are significantly exposed to areas of intensive fishing activity, mainly those located in the Gulf Stream (Azores), in international waters off the Portuguese coast (Madeira and Canary Islands) and along the Northwestern African coast (Cabo Verde). The east coasts of Central and North America are the main sources of land-based particles reaching the Azores, Madeira, and Canary Islands, whereas the Northwestern African coast is the main source for land-based particles reaching Cabo Verde. Our results demonstrate how vulnerable the Macaronesian archipelagos are to marine plastic pollution, highlighting the urgency for international cooperation to mitigate the exposure of oceanic islands to marine plastic pollution.
1. Introduction
The exponential growth of global plastic production from 5 million tons in the 1950s to 322 million tons in 2015 (Andrady, 2011) led to an equally exponential input of plastic objects into the marine environment (Ryan et al., 2009), with estimates between 4 and 12 million tonnes per year (MT.year−1; Jambeck et al., 2015). As a result, marine plastic litter has not only become ubiquitous in the world's oceans in the past few decades (e.g., Cozar et al., 2014; Law, 2017), but also continues to increase at an alarming rate (Lebreton et al., 2018). In fact, it is estimated that plastic items account for up to 80% of marine litter (Barnes et al., 2009), with estimates of abundance ranging from 5.2 trillion pieces (Eriksen et al., 2014) to 15–51 trillion pieces (van Sebille et al., 2015). However, recent studies have argued that the global load of plastic floating at the ocean surface is much lower than predictions (Cozar et al., 2014; Eriksen et al., 2014; van Sebille et al., 2015). Such discrepancy can relate with a variety of factors. For example, although surface-trawling plankton nets are mostly used to sample plastic debris at the ocean surface (e.g., van Sebille et al., 2015; Lebreton et al., 2018; Lacerda et al., 2019), it is now known that a significant amount of small-sized plastic debris are concealed in sub-surface layers, with a exponentially decreasing concentration along depth (Pabortsava and Lampitt, 2020). The vertical displacement of plastic particles can be driven by a variety of mechanisms, such as wind-induced vertical mixing (Kukulka et al., 2012; Reisser et al., 2015) or biofouling, which increases/decreases the average material density of plastic fragments and causes them to sink/re-suspend when the conditions for biological growth are favorable/unfavorable (Fazey and Ryan, 2016; Kooi et al., 2017). Recent studies have also demonstrated that besides being considered hotspots for the degradation of plastic into smaller fragments (Corcoran et al., 2009; Andrady, 2011; Isobe et al., 2014), sandy and rocky beaches can retain significant amounts of plastic fragments stranded at the surface (Thiel et al., 2013), and in deeper layers (Chubarenko et al., 2018; McWilliams et al., 2018). In fact, Turra et al. (2015) found plastic fragments as deep as 2 m, with surface layers accounting for <10% of the total abundance in the sediment column.
The growing accumulation of plastic litter in the marine environment poses an unattended environmental threat to islands, as they become increasingly exposed to pollution of which they have very little control (e.g., Baztan et al., 2014; Monteiro et al., 2018; Pham et al., 2020; Pieper et al., 2020). Its impacts are extensive and can be felt on highly vulnerable socio-economic sectors of which islands depend on, such as tourism, fisheries and shipping industries (Rodríguez et al., 2020). Beach clean-ups are often the only possible remediation measure for the removal of stranded plastic debris from local coastlines, representing an enormous cost to local organizations and governments (Burt et al., 2020; Rodríguez et al., 2020).
Local ecology is also severely impacted by marine plastic pollution through ingestion and entanglement, ranging from zooplankton (Desforges et al., 2015) to cetaceans (Baulch and Perry, 2014), seabirds (Avery-Gomm et al., 2018; Provencher et al., 2018), and marine reptiles (Aguilera et al., 2018). Persistent organic pollutants present in seawater are absorbed very efficiently by plastics and can be transferred into tissues and organs through ingestion (Rochman et al., 2013; Andrady, 2017), having a direct or indirect impact in all trophic-level organisms (Gassel et al., 2013) and potentially on humans (reviewed in Campanale et al., 2020). In addition, floating plastics such as resin pallets and derelict fishing gear have been reported to transport microbial communities (Carson et al., 2013), algae, invertebrates, and fish (Goldstein et al., 2014) to non-native regions (Barnes, 2002; Gregory, 2009). The systematic report of plastic debris stranded in uninhabited islands (e.g., Lavers and Bond, 2017; Fernandes, 2019; Ryan et al., 2019; Burt et al., 2020) further demonstrates how exposed such pristine and often fragile environments are to such hazard, forcing them to act as sentinels of global ocean pollution (Barnes et al., 2018). For all the reasons stated above, it is extremely important to understand how physical processes, such as ocean currents and wind mediate the transport of marine litter to presumably remote insular environments.
The Macaronesia is a biogeographic region located in the Northeast Atlantic Ocean and consists of 31 volcanic islands comprised in four archipelagos (blue polygons in Figure 1): the Azores, Madeira (and Selvagens), Canary Islands (hereafter referred as Canaries), and Cabo Verde (Freitas et al., 2019). Politically, Azores and Madeira are under the sovereignty of Portugal, whereas the Canaries are under the sovereignty of Spain. Cabo Verde is the only independent state and the only archipelago outside the European Union. In terms of oceanic and atmospheric conditions, all islands are under the influence of the North Atlantic subtropical gyre (Figure 1A) and the Azores High atmospheric pressure system (Figure 1B), respectively. For this reason, common patterns in the transport of incoming marine litter are expected to occur between the archipelagos. However, although recent studies strongly suggest that most of the debris collected on the Macaronesian islands come from the open ocean (e.g., Baztan et al., 2014; Fernandes, 2019; Álvarez et al., 2020; Pham et al., 2020), the exposure of the archipelagos to the regional transport of marine litter has, to the best of our knowledge, not been addressed to present date.
Figure 1. Ten-year climatology (2006–2016) for: (A) ocean currents from CMEMS, (B) wind from ECMWF, and (C) stokes drift from WW3. Black area in (A) represents the delimitation of the finer-resolution ocean currents dataset (GLORYS12V1). Blue polygons mark the location of the Azores, Madeira, Canaries, and Cabo Verde archipelagos (from north to south). Red arrows represent the main ocean currents: Gulf Stream (GS), Labrador Current (LC), Azores Current (AzC), North Atlantic Current (NAC), Portugal Current (PC), Canary Current (CC), Mauritania Current (MC), North Equatorial Current (NEC), North Equatorial Counter Current (NECC), the North Brazil Current (BC), and the Caribbean Current (CbC).
Our study focuses on the characterization of the potential sources and pathways of marine plastic litter affecting the archipelagos of the Macaronesia. Special attention was given to the ocean currents and winds responsible for the transport of particles to the archipelagos. Lagrangian simulations were performed, in which particles representative of micro- and macro-plastics (plastic particles smaller and larger than 5 mm in length, respectively; Barnes et al., 2009; Andrady, 2011) with a varying degree of exposure to the wind were released around the archipelagos and tracked backward in time to their origins. Serving as an in-situ reference, floating drifter trajectories intersecting the archipelagos were also characterized. As our study focuses primarily on the transport of particles at a regional scale, such as in the connectivity between archipelagos and continental coastal areas, the transport of particles between islands of the same archipelago is beyond the scope of this study and is not considered herein. This article is organized as follows: a brief introduction to the geographic setting of the archipelagos is presented in section 2; data being used, along with the modeling framework and simulations set-up are described in section 3; the main results and subsequent discussion are presented in section 4; and the main conclusions are summarized in section 5.
2. Oceanographic Setting
As the north-westernmost islands of the Macaronesia, the Azores archipelago extends for ~615 km across the Mid-Atlantic Ridge and is composed by nine islands divided in three groups: the western, central and the eastern groups (Figure 2A). The Azores is the most remote archipelago of the Macaronesia, being located at ~1,400 km distance from the nearest continental coast and ~860 km distance from Madeira (the nearest islands). The archipelago is surrounded by two main large-scale ocean currents: (i) the Gulf Stream and associated bifurcations affect the islands in the form of meanders and eddies from the west and north-west (Caldeira and Reis, 2017); (ii) and the Azores Current that originates from the southern branch of the Gulf Stream and flows south of the archipelago between 32 and 35°N (Figure 1A; Gould, 1985). Despite the dominant eastward-flow component, the Azores Current is characterized by the frequent occurrence of eddies (Zhou et al., 2000; Sangrà et al., 2009; Barbosa Aguiar et al., 2011) that often intersect the Azorean islands from the south and from the west (Sala et al., 2016; Caldeira and Reis, 2017).
Figure 2. Example of the release location of particles in the (A) Azores, (B) Madeira, (C) Canaries, and (D) Cabo Verde archipelagos. Black grids around the islands represent the boundaries in which particles are randomly released. Colors represent the particle windage groups.
Along its eastward path, the Azores Current produces three major bifurcations with a southward-flowing component (Klein and Siedler, 1989). At the easternmost bifurcation (~22°W), one branch meanders eastward toward the Gulf of Cadiz (Johnson and Stevens, 2000), whereas another branch turns southward and reaches the Madeira archipelago through the west/northwest (Figure 1A; Zhou et al., 2000). Here, this southward-flowing branch is separated into two branches as it intercepts Madeira (Stramma and Siedler, 1988; Barton, 2001), merging the south/southwestward-flowing Canary Current downstream (Stramma, 1984; Klein and Siedler, 1989; Zhou et al., 2000). Although weaker and wider (Martins et al., 2002), the Portugal Current also feeds the Canary Current as it flows toward Madeira from the north, being strongly influenced by the dominant neighboring Canary and Azores Currents at Madeira's latitude (Pérez et al., 2001). Being the smallest archipelago of the Macaronesia, Madeira is composed by three islands (Figure 2B) located at an intermediate geographical position between the Azores and the Canaries (Sala et al., 2013). As a consequence, Madeira is exposed to the seasonal oscillations of the Azores, Portugal, and Canary Currents (Barton, 2001; Caldeira et al., 2002; Martins et al., 2002).
As it progresses southward along the North-Western African coast, the Canary Current intercepts the Canaries at ~500 km distance from Madeira (Figure 1A; Martins et al., 2002). The Canaries are composed by seven major islands extending from near African coast to open ocean with a zonal orientation (Figure 1C) and is the largest archipelago of the Macaronesia (in terms of land surface area). These islands act as an obstacle to the propagation of the Canary Current, being partly responsible for the frequent generation of eddies in the lee side (e.g., Arístegui et al., 1994; Barton et al., 2000; Sangrà et al., 2009). Its close proximity to the adjacent African coast (~94 km) also exposes the Canaries to filaments and eddies pinching off from the Canary Current upwelling system, which often interact with island-induced eddies as they propagate offshore (Barton et al., 2004).
The southern limit of the Canary Current detaches from the continental margin between 25 and 20°N to connect with the wind-driven North Equatorial Current (Figure 1A; Mittelstaedt, 1983, 1991). With a initial southwestward flow, the North Equatorial Current intersects the Cabo Verde archipelago from the northeast (Lázaro et al., 2005) and then veers westward to become the southern limb of the North Atlantic subtropical gyre (Bourles et al., 1999), closing the gyre as it intersects the American continent and merges with the Gulf Stream (and associated upstream currents) further west (Figure 1A). Composed by 10 islands arrayed in a west-facing horseshoe disposition (Figure 2D, Ramalho, 2011), Cabo Verde marks the southern limit of the Macaronesia region (Figure 1A). The oceanographic context surrounding the archipelago is characterized by the complex interaction of several large-scale oceanic currents and features, strongly affected by the seasonal meridional migration of the atmospheric Intertropical Convergence Zone (Stramma and Schott, 1999). South of archipelago, the basin-wide North Equatorial Counter Current flows eastward and leaks Southern Atlantic waters into the North Atlantic as it meanders along the southern limit of the North Equatorial Current (Fratantoni, 2001). As the North Equatorial Counter Current approaches the African coast, part of its flow continues northward along the coast and forms the seasonal-varying Mauritanian Current (Figure 1A; Lázaro et al., 2005). Driven by the relaxation of the trade winds and consequent intensification of the North Equatorial Counter Current, the Mauritanian Current reaches its northernmost extension (20°N) during summer and autumn, where it intersects the North Equatorial Current and turns southwestward in the direction of Cabo Verde. During winter and spring the opposite occurs, as the trade winds intensify and force the Canary Current upwelling system to reach its southernmost extension (15°N, Mittelstaedt, 1991; Van Camp et al., 1991). Such dynamic variability at the Mauritania coast is expected to affect the Cabo Verde islands, located 450–600 km west. For example, filaments rich in Chlorophyll a have been observed to reach the archipelago during the upwelling season (Lathuilière et al., 2008; Ohde and Siegel, 2010), whereas eddies generated by the dynamic instabilities of the Mauritania Current (Lázaro et al., 2005) and by the interaction of coastal currents with topography (Schütte et al., 2016) are often blocked by the Cabo-Verdian islands as they propagate westward (Cardoso et al., 2020).
3. Data and Methods
3.1. Global Drifter Program
Surface drifting buoys (hereafter referred as drifters) are valuable instruments in providing in-situ information on the two-dimensional flow at the ocean surface or near surface, depending on the depth at which the drogue (sea anchor) is located (Lumpkin et al., 2017). As part of the Global Drifter Program (GDP) from the National Oceanic and Atmospheric Administration (NOAA), drifters are deployed throughout the global ocean since 1988, maintaining an array of ~1,250 drifters throughout the years. These drifters are drogued at 15 m depth so that they follow near-surface currents (Lumpkin and Pazos, 2007). Although their position is received via ARGOS satellite system at an irregular time interval, drifter trajectories are processed for quality-control and interpolated to a six-hourly interval (Lumpkin et al., 2013). A brief analysis of the GDP drifter trajectories that intercept the archipelagos of the Macaronesia is presented in the present study, comprising a total number of 632 trajectories in 32 years (Lumpkin and Centurioni, 2019).
3.2. Lagrangian Model and Forcing Datasets
The transport of marine litter was simulated through the modeling of virtual particles using version 2.0 of the OceanParcels lagrangian ocean analysis framework (Lange and van Sebille, 2017; Delandmeter and van Sebille, 2019). This numerical toolkit takes advantage of the scientific Python ecosystem, but simulations are carried in low-level C code for computational efficiency. In addition, the modular nature of OceanParcels enables the customization of kernels, meaning that particle behavior can be augmented with specific features (e.g., windage, beaching). In the present study, particle trajectories are integrated using a Runge-Kutta 4th order scheme, relying in the combination of ocean currents, wind and stokes-drift.
For the ocean currents we used two eddy-resolving ocean circulation reanalysis developed by Mercator-Océan in the framework of Copernicus Marine Environment Monitoring Service (CMEMS). These reanalysis products are produced with general ocean circulation models that assimilate in situ and satellite data, thus more representative of the ocean circulation (van Gennip et al., 2019). With a daily time step, their velocity components are based on the same ocean circulation models as the Nucleus for European Modeling of the Ocean (NEMO) framework, being forced at the surface by the ERA-Interim wind reanalysis from the European Center for Medium-Range Weather Forecasts (ECMWF). The GLORYS12V1 reanalysis is the first domain of the nested grid configuration, covering an area between 12–60°N and 33°W–10°E (black delimited area in Figure 1A) with a 1/12° spatial resolution (~8km at the equator). This area comprises the Macaronesia region and the neighboring continental coasts. The GLORYS2V4 is used for the rest of the study domain, covering an area between 0–70°N and 98°W–40°E with a 1/4° resolution. Although both reanalysis extend up to 5,500 m depth (50 and 75 vertical levels for GLORYS12V1 and GLORYS2V4, respectively), in the scope of this work lagrangian simulations were confined to depths varying from 0 to ~108 m (23 and 25 vertical levels for GLORYS12V1 and GLORYS2V4, respectively) and neglect vertical flow velocities, following a similar methodology as Delandmeter and van Sebille (2019). For further information on GLORYS12V1 and GLORYS2V4 model configurations and validation, please refer to Garric et al. (2018) and Lellouche et al. (2018), respectively. Sub-grid processes were parameterized using a stochastic zeroth-order Markov model (van Sebille et al., 2018) with a constant horizontal diffusion coefficient of Kh = 10m2.s−1, a value well suited for the resolution of the datasets being used (e.g., Lacerda et al., 2019; Kaandorp et al., 2020; van der Mheen et al., 2020). One should note that tidal forcing is not considered in the present study. Sterl et al. (2020) suggested that although barotropic tidal currents can have a significant influence in the transport of marine plastic litter at coastal regions and semi-enclosed seas, such currents have much less impact on the transport and accumulation of marine plastic debris in the open ocean, being thus negligible at the scale of the North Atlantic basin.
The transport of particles driven by the waves (i.e., Stokes drift) was calculated at the ocean surface (i.e., for particles at ≤0.52 m depth) for all simulations with the wave model WaveWatch III (WW3, The WaveWatch III Development Group, 2016), distributed by the Institut Français de Recherche pour l'Exploitation de la Mer (IFREMER). Like CMEMS datasets, this hindcast dataset is forced by the ECMWF ERA-Interim winds and has a 1/2° horizontal resolution. Although it is distributed with a 3-h temporal resolution, we use a daily average in the present study for consistency.
In order to maintain coherence between forcing mechanisms, the same ECMWF ERA-Interim wind reanalysis (at 10 m above sea surface) that is used to force the WW3 dataset is used to account for direct wind forcing on particles. This data is available with a 1/2° spatial resolution and a 3-h temporal resolution, being subsequently averaged into a daily time step.
3.3. Particle Setup
Marine litter has been reported to appear in various forms throughout the globe (e.g., Enders et al., 2015; Reisser et al., 2015; Pabortsava and Lampitt, 2020), being very difficult to find an universal distribution of their size, material densities and shapes (Kooi and Koelmans, 2019). Morét-Ferguson et al. (2010) argued that most marine litter found in the ocean is millimeter-sized and has an average material density lower than sea water (965 kg.m−3). Nevertheless, debris of larger size and material density higher than sea water can still be found floating at the sea, mostly due to air enclosures (e.g., foamed materials; Enders et al., 2015). As the distinction of particle shape and size is beyond the scope of our study, virtual particles are representative of debris with varying buoyancy ratios and neglect inertial forces. Released with a 3-day interval, particles' initial position was randomly generated within every 0.25° cell of equally-spaced grids arranged around the islands (Figure 2). Particles are removed from the simulation when initiated on land, exit the domain through an open boundary (Arctic or South Atlantic Ocean) or get stuck in a dry cell (i.e., land) and are considered beached. The verification of beached particles is made after the integration of all velocity fields (i.e., currents, wind, stokes drift, and diffusion) into the particle trajectory.
Most modeling studies attribute hypothetical windage coefficients (also known as wind drag or leeway drift) to their virtual particles in order to simulate the direct wind drag exerted on particles with specific buoyancy ratios (e.g., Gutow et al., 2018; Pereiro et al., 2018). Low windage coefficients are used in particles with low buoyancy and limited surface area exposed to the wind, whereas high windage coefficients are used for highly buoyant particles with large exposed surface area (Chubarenko et al., 2016). Considering the variety of marine plastic litter densities and shapes found in the Macaronesia region (e.g., Ríos et al., 2018; Fernandes, 2019; Herrera et al., 2020; Pham et al., 2020), our model particles were divided into five groups with random windage coefficients ranging from 0 to 1%, 1 to 2%, 2 to 3%, 3 to 4%, and 4 to 5% of the wind at 10 m height. This means that all grid cells arranged around the islands contributed with the release of five particles every 3 days, except when particles were initiated on land (Figure 2). A total of ~1.3 million particles were released in each simulation, from which ~360,000 were released in Azores, ~145,000 in Madeira, ~500,000 in Canaries, and ~320,000 in Cabo Verde.
3.4. Simulations
Four simulations were carried for a 10-year period between 2006 and 2016 (a summary of the simulations is shown in Table 1). To determine the potential sources and pathways of remote particles reaching the archipelagos, simulations Bsurface and Bmixed were conducted in a backward-in-time scenario, in which particles released around the islands between 2009 and 2016 were backtracked in time. This means that the particle's release location corresponds to the their destination, whereas the particles' final position correspond to their origins (e.g., van Gennip et al., 2019). On the other hand, simulations Fsurface and Fmixed were conducted in a forward-in-time scenario, in which particles released around the islands between 2006 and 2013 were tracked to their destinations. As the fate of domestic particles is beyond the scope of the present study, results associated to forward-in-time simulations were used as a complementary information. Following the same temporal resolution of the ocean circulation reanalysis, a daily time step was used for the calculation of particle trajectories. Although the temporal resolution of the forcing datasets may seem limiting, Onink et al. (2019) demonstrated that differences between flow data with 3 and 24 h time steps were not significant at the scale of an oceanic basin.
Table 1. Simulations overview.
To elucidate on the differences between particles with strong and weak buoyancy, both backward- and forward-in-time scenarios were run with two configurations. In simulations Bsurface and Fsurface, particles are transported only at the ocean surface, being thus exposed to direct wind forcing. Such particles (hereafter referred as surface particles) are mostly representative of macro-plastics, known for staying at the surface longer than micro-plastics (Chubarenko et al., 2016). Conversely, particles in simulations Bmixed and Fmixed have low buoyancy and are immersed in near-surface layers most of the time, being mostly representative of micro-plastics (Wichmann et al., 2019; Pabortsava and Lampitt, 2020). Although the horizontal transport of these submerged particles (hereafter referred as mixed particles) is less affected by direct wind forcing, their vertical positioning is strongly affected by the wind-induced turbulent mixing (Reisser et al., 2015). A brief description of how this vertical mixing is achieved is presented, but for full details please refer to Kukulka et al. (2012) and Wichmann et al. (2019). Considering the principle that the concentration of plastic particles follows an exponential distribution throughout depth (e.g., Reisser et al., 2015; Kooi et al., 2016), mixed particles are randomly displaced in the water column at each time step according to the exponential probability distribution proposed by Kukulka et al. (2012):
For λ = wr/A0, the particle rise velocity wr assumes a determinant role, followed by A0 = 1.5u*wkHs where u*w is the frictional velocity of water, k = 0.4 is the van Karman constant, and Hs is the significant wave height. Hs is parameterized by , where g = 9.81 m.s−1 is the gravitational constant, σ the wave age, and u*a the frictional air velocity. As in Kukulka et al. (2012), we assume a fully developed sea with σ = 35. With the purpose of simulating strong mixing effects, particle rise velocity wr was set to 0.001 m.s−1, which according to Reisser et al. (2015) is the minimum rise velocities of plastic particles found in the ocean. In this sense, we follow the same methodology of Wichmann et al. (2019), albeit the later authors used a wr of 0.003 m.s−1. Of course, such vertical positioning of particles is a gross oversimplification of a highly complex process, controlled mainly by particle density, shape, size (Kooi et al., 2017). Considering that the distinction of such particle characteristics is beyond the scope of this study, we believe that this methodology provides an adequate approximation for the proposed objectives.
3.5. Connectivity to Sources of Marine Litter
Understanding the potential sources of marine litter is an essential step in the mitigation of marine pollution (Ryan et al., 2019), especially for islands that are considerably exposed to debris originated elsewhere (e.g., Robinson et al., 2017; Chambault et al., 2018; van Gennip et al., 2019; van Sebille et al., 2019; Burt et al., 2020). As such, two distinct sources of marine litter are assessed in the present study.
3.5.1. Marine-Based Sources
It has been estimated that marine-based human activities, such as fishing, boating, and shipping are responsible for a considerable amount of plastic waste entering the ocean, being fisheries the most relevant activity with proportions ranging from ~18% (Lebreton et al., 2019) to ~20% by number of debris collected at the surface of the ocean (or 70% by weigh, Eriksen et al., 2014). Nonetheless, the proportion of fishing gear on stranded debris collected at oceanic islands increases quite significantly (Monteiro et al., 2018; Fernandes, 2019), reaching values as high as 83% (by weight, Burt et al., 2020). As such, it is very important to account for fishing activities as a likely source of marine litter intercepting the Macaronesian islands. Assuming that the quantity of waste particles is a function of the time spent fishing (e.g., van Gennip et al., 2019; van Sebille et al., 2019), we defined areas of intensive fishing activity as sources of marine-based debris using the Global Fishing Watch database (Kroodsma et al., 2018). This database quantifies the time spent fishing in every 0.1° grid cell for the period 2012-2016. As this fine spatial resolution generates many small areas of intensive fishing activity and hampers the definition of intense fishing zones, data was re-sampled to a 0.2° resolution grid and smoothed using a Gaussian filter with a 0.8° standard deviation. Areas of intense fishing were defined as those with >150 of cumulative fishing hours, which corresponds to >50 hours in the original 0.1° resolution (Supplementary Figure 1). Areas with <5,000 km2 were excluded from the analysis for the sake of clarity.
3.5.2. Land-Based Sources
Regions of high population density have been considered as the most probable land sources of marine plastic litter, especially where they are coastal or near rivers (Andrady, 2017). Indeed, ~12% of plastics entering the marine environment were estimated to come from inland population via riverine transport, whereas ~60% were estimated to originate from coastal areas (Lebreton et al., 2019). For this reason, population density has been commonly used as an index to estimate the input of marine plastic debris from land (e.g., Lebreton et al., 2012; Maximenko et al., 2012; Eriksen et al., 2014; Robinson et al., 2017; van Gennip et al., 2019). Nevertheless, it is important to note that this relation is overly simplified, as it depends on other factors, such as environmental regulations, solid waste management, and economic status (Jambeck et al., 2015; Kaandorp et al., 2020). Considering that the emission of particles from coastal regions is beyond the scope of this study, we used the population density projections for 2020 from the “Gridded Population of the World” dataset (Version 4, revision 11; Doxsey-Whitfield et al., 2015; CIESIN, 2018) to assess the likelihood of coastal regions to act as sources of marine litter.
It is important to note, however, that the beaching of marine litter at the real ocean/land boundary is a highly complex process. First, it is highly dependent on small-scale coastal dynamics that most ocean circulation models fail to replicate (Isobe et al., 2014; Zhang, 2017). Second, coastal geomorphology (Bowman et al., 1998; Vianello et al., 2013; Jalón-Rojas et al., 2019) and particle shape and size (Hinata et al., 2017) can mediate the rate at which particles are terminally deposited or washed back to sea. Third, physical processes, such as waves, tide, wind, or even UV radiation increase the degradation rate of plastic particles (Corcoran et al., 2009; Carson et al., 2013; Chubarenko et al., 2020), which can facilitate the burial of smaller particles into the sediments (Turra et al., 2015) or their transport to offshore waters (Isobe et al., 2014). As our domain covers a wide range of coastlines with different morphologies and under the influence of coastal dynamics not feasibly represented at this scale, any attempt of using a probabilistic approach to mimic the beaching of marine litter (e.g., Lebreton et al., 2018; Hinata et al., 2020; Kaandorp et al., 2020; van der Mheen et al., 2020) would be very difficult to assess. For this reason, we deem the first contact with dry cells as particle beaching, which depending on the nature of the simulation (i.e., backward- or forward-in-time tracking) represents a source or a sink location.
4. Results and Discussion
4.1. Drifter Trajectories
The trajectories of drifters that intercept the Macaronesia archipelagos are an important observational evidence for the analysis of simulated particle trajectories. As such, GDP drifter trajectories before and after intercepting the Macaronesian archipelagos are represented in Figure 3 left and right panels, respectively. Areas delimiting the archipelagos were defined as the combined grids used to release virtual particles around the islands (Figure 2). Because of a mechanical failure of the buoy-drogue connection, nearly 30 and 90% of GDP drifters lose their drogues in the first 3 and 18 months after deployment, respectively (Grodsky et al., 2011), increasing the estimated windage coefficient from 0.1 to 1% of the wind speed (Niiler et al., 1995). Considering that 1% of the wind speed is still at the lower end of the windage interval used in our simulations (0–5%), drogued and undrogued drifter trajectories are not differentiated in Figure 3, being mostly representative of submerged and low-windage particles.
Figure 3. GDP drifter trajectories and age (in months) before (left panels) and after (right panels) intersecting the Azores (A,B), Madeira (C,D), Canaries (E,F), and Cabo Verde (G,H). Red polygons around the archipelagos represent the delimited areas. Black circles and crosses mark the first and last transmitted position, respectively.
The generally long and old drifter trajectories intercepting the Azores (Figure 3A) demonstrate that the archipelago is vulnerable to far-field sources. Most of these drifters were deployed along the Gulf Stream and although they intersect the archipelago from all directions, they approach mostly from the west. In fact, the exposure of the Azores islands to the confluence of filaments and eddies pitching off from the Gulf Stream and from the Azores Current led Sala et al. (2016) to propose the archipelago as a potential retention zone for floating particles. Such hypothesis was later reinforced by Pham et al. (2020), who found that the Azorean beaches retain significant quantities of small fragments that are rapidly washed back to sea, acting as transitory repositories of small fragments in the region. After intersecting the Azorean area, drifters are mostly advected southward and eastward with varying meridional deflections, drifting through the Portugal and Canary currents and eventually closing the North Atlantic Gyre as they follow the North Equatorial Current and reach Central and North American coasts further west (Figures 3B, 1A). From a total of 269 drifters, 42 beached in the archipelago, 20 intersect the Madeira archipelago, and 11 intercept the Canaries (Table 2).
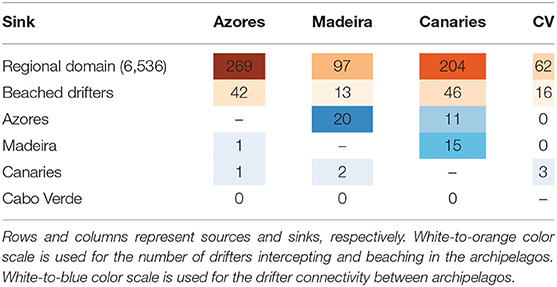
Table 2. Overview of the GDP drifters intercepting the Macaronesia archipelagos (top rows) and drifter connectivity between archipelagos (bottom rows).
Similarly to the Azores, drifter trajectories intercepting Madeira were mostly deployed west and north of the archipelago (Figure 3C) but approach mainly from the north. Extending from ~10 to 24°W (Pérez et al., 2001), the influence of the offshore branch of the Portugal Current (Figure 1A) is revealed by the southward trajectories west of the Iberian coast, while the influence of the Azores Current is revealed by the narrow horizontal band of drifter deployments north of Madeira (circles in Figure 3C). The Azores Current is still perceivable after drifters intercept the archipelago, evidenced by the eastward trajectories flowing toward Africa and by the swirling westward trajectories passing south of the Azores (Figure 3D), likely related with westward-propagating eddies pinching off from the Azores Current (Sangrà et al., 2009; Barbosa Aguiar et al., 2011; Caldeira and Reis, 2017). Nevertheless, most drifters that exit the Madeira delimited area without beaching (84 out of 97) flow south/southwestward, in which 15 cross the Canaries area (Table 2), 10 reach the American continent further west and 8 veer north into the Sargasso Sea at the center of the North Atlantic subtropical gyre (often referred as an important area for the accumulation of floating marine litter; e.g., Lebreton et al., 2012; Maximenko et al., 2012; Cozar et al., 2014; Eriksen et al., 2014; van Sebille et al., 2015; Law, 2017; Onink et al., 2019).
Portugal and Azores Currents are also important pathways for drifters intercepting the Canaries (Figure 3C). Even though these trajectories are generally very similar to the ones intercepting Madeira, a more careful inspection reveals that some of the drifters that intercept the Canaries are advected closer to the western Iberian coast. Such proximity is likely related with the Portugal Coastal Current which is active when the predominant northward Portugal Coastal Counter Current is suppressed by southward winds (mostly during summer, Martins et al., 2002). After intersecting the Canaries delimited area, most of the drifters that do not beach in the islands (158 out of 204, Table 2) continue southward along the Canary Current and then westward along the North Equatorial Current, reaching southern territories of the Central America, such as the Lesser Antilles in ~9 months (Figure 3D).
Three of the drifters leaving Canaries reach the Cabo Verde archipelago as they float in the easternmost branches of the Canary and North Equatorial Currents (Figures 3A, 1A), being the only common trajectories between Cabo Verde and the other archipelagos of the Macaronesia (Table 2). Although Cabo Verde lies at the southern limit of the North Atlantic Gyre, the archipelago is predominantly exposed to westward drifters released along the Northwestern African coast, most likely advected by the seasonal Mauritania Current (dashed arrow in Figure 1A; Lázaro et al., 2005), upwelling filaments (Lathuilière et al., 2008; Ohde and Siegel, 2010) or coastal-generated eddies (Schütte et al., 2016; Cardoso et al., 2020). Nevertheless, the eastward-flowing North Equatorial Counter Current can still be responsible for the advection of drifters released south of the archipelago. As 16 drifters beached in the islands of Cabo Verde (Table 2), some of the remaining 46 drifters followed a general westward trajectory and reached the Lesser Antilles islands, while two drifters crossed the equator (South Atlantic, Figure 3G).
To summarize, Azores is the archipelago most intercepted by drifters (269), followed by the Canaries (204), Madeira (97), and Cabo Verde (62, Table 2). Even though the number of drifters intercepting the archipelagos is linked to the extension of the delimiting areas, the location where drifters are deployed also play a key role in the pathways they follow (Reisser et al., 2013). For example, Madeira's delimiting area is significantly smaller than Cabo Verde's area, but it is exposed to oceanic currents that cover a broader area (Figure 1A) and are thus “seeded” by a larger number of drifters. Drifter trajectories intercepting the Azores are generally older and longer than the ones intercepting Madeira, Canaries, and Cabo Verde. Nevertheless, the exposure of these three archipelagos to far-field sources should not be completely discarded, given the fact that GDP drifters have a limited transmitting lifetime (Lumpkin and Pazos, 2007) which can hinder long-term patterns. Furthermore, Álvarez et al. (2020) argued that the dominance of cold colors (such as white, black, gray, and blue) in micro- and meso-litter collected in Madeira were likely related to the photo degradation of the incorporated pigments (Matsuguma et al., 2017; Syakti et al., 2017). This suggests that the collected fragments were exposed to sunlight for a considerable period of time before intercepting the archipelago (Yu et al., 2018).
4.2. Exposure to Remote Particles
4.2.1. Regional Pathways
In order to assess the potential pathways of remote marine litter affecting the archipelagos of the Macaronesia, we focus our attention in the proportions of Bsurface and Bmixed particles detected in every 0.5° grid cell (Figure 4). Corresponding seasonal variations were also assessed, but since the variations were not significant, seasonal Bsurface particle proportions are included as Supplementary Figure 2. It is important to note, however, that as our simulations do not take into account the actual sources and distribution of marine litter in the Atlantic Ocean, the trajectories of particles tracked backward in time can only serve as an indication of the possible directions taken by particles before reaching the archipelagos (Reisser et al., 2013).
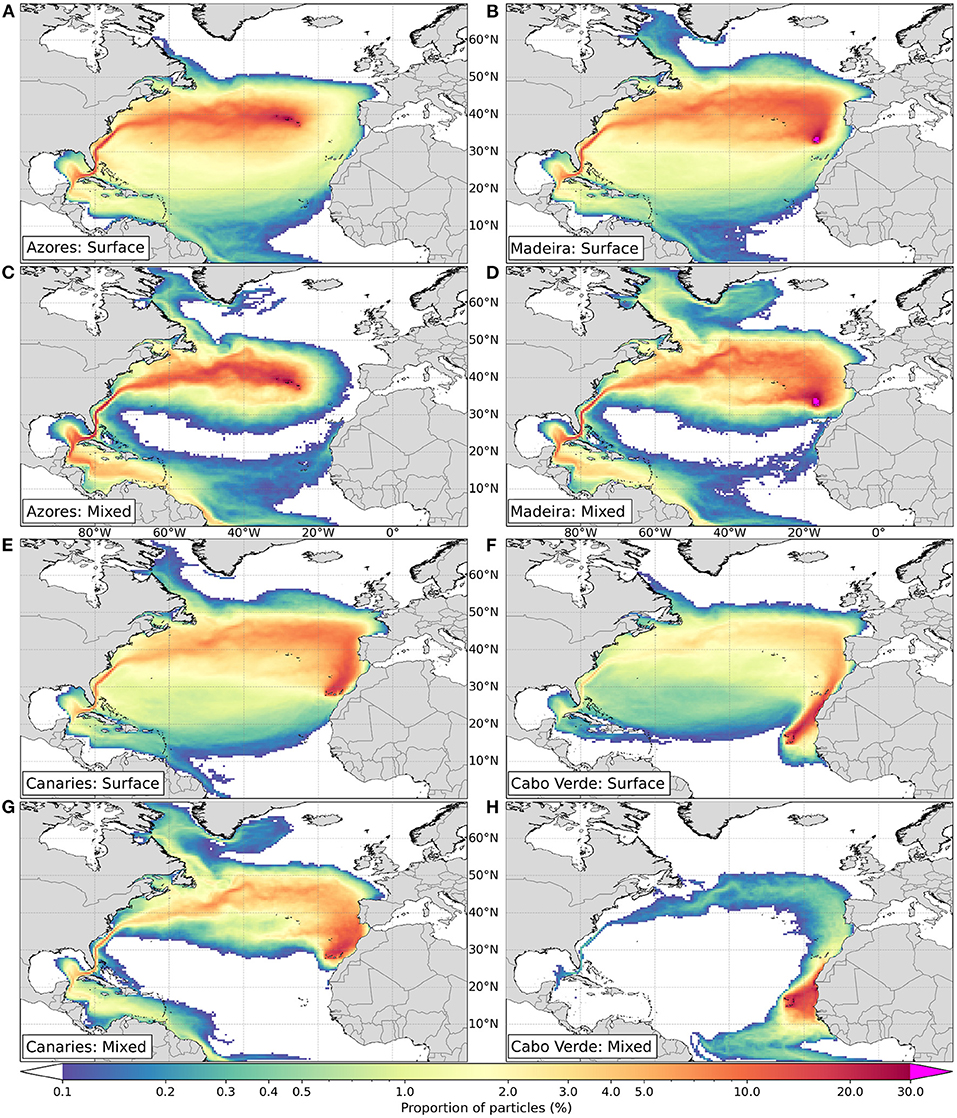
Figure 4. Proportion of Bsurface (A,B,E,F) and Bmixed (C,D,G,H) particles detected in 0.5° grid cells. Color map is in logarithmic scale, in which cells with < 0.1% are masked.
In general, Bsurface and Bmixed particle trajectories have similar patterns (Figures 4A–H, respectively), though Bsurface particles are much more dispersed throughout the North Atlantic basin. In fact, <0.1% of Bmixed particles traveled through the Sargasso Sea at the center of the North Atlantic subtropical gyre (between 20–30°N and 70–40°W). Considering that Bmixed particles are submerged most of the time and that the inclusion/exclusion of the wind drag from the equation of motion has been linked to the divergence/convergence of particle trajectories (Neumann et al., 2014), it is fair to assume that such spatial differences are caused by the particle exposure to the wind. Furthermore, GDP drifter trajectories before intercepting the archipelagos (Figure 3 left panels) resemble more closely with Bmixed (especially in Cabo Verde, Figures 3G, 4H) than with Bsurface patterns, reinforcing the idea that drifter trajectories are mostly representative of submerged and low-windage particles.
The influence of the North Atlantic subtropical gyre is naturally the most evident pattern in the transport of incoming Bsurface and Bmixed particles. The Gulf Stream acts as the dominant pathway for all archipelagos at a regional scale, though with less impact for Cabo Verde (Figure 4H). In fact, up tp ~30% of Bmixed particles and ~20% of Bsurface particles converge into the initial extension of the Gulf Stream (Figures 4A,C, respectively), which is impressive considering the >5,000 km distance from the southeast coast of the United States (US) to the archipelagos of the Macaronesia. The upstream currents that feed the Gulf Stream (i.e., the Florida, Loop, Antilles, Caribbean, and even the North Brazil Currents, Figure 1A) are still noticeable in the proportions of particles intercepting the Azores, Madeira, and Canaries (mainly Bmixed particles, Figures 4C,D,G, respectively). Such signal demonstrates that these archipelagos are significantly exposed to Central and North American sources, which according to Lebreton et al. (2012) account for 64–66% of the debris floating in the North Atlantic. The higher exposure of the Azores archipelago to Central and North American sources is consistent with plastic densities sampled at the beaches of the archipelago (>15,000 items m−2, Pham et al., 2020), which are among the highest densities reported for beaches of oceanic islands in the Atlantic Ocean (Herrera et al., 2018; Monteiro et al., 2018). Flowing southeastward along the northeastern coast of Canada (Lazier and Wright, 1993), the Labrador Current (Figure 1A) also acts as a source of particles transported by the offshore extension of the Gulf Stream. Although the Labrador region is less impacted by human activities on land, high levels of small-sized plastic debris were observed along the shoreline (McWilliams et al., 2018) and in gastro-intestinal samples of the Arctic seabird (Fulmarus glacialis, Avery-Gomm et al., 2018; Provencher et al., 2018), possibly linked to industrial fishing activity (Supplementary Figure 1; Bond et al., 2012).
Similarly to drifter trajectories (Figure 3A), Bsurface and Bmixed particles reaching the Azores from the west and from the north are mainly transported by the eastward Gulf Stream and associated branches (Figures 4A,C, respectively), whereas particles reaching the archipelago from the south are mainly transported by the eastward Azores Current (Figure 1A), more easily depicted in Bmixed particle trajectories (Figure 4C). Spatial patterns in Bmixed particle trajectories are in better agreement with Sala et al. (2016) than Bsurface particles, which is expected as these authors only considered ocean currents in their simulations. Some of the particles intercepting the Azores were also detected along the eastern boundary of the North Atlantic (0.1–2%), though Bsurface in higher proportion than Bmixed (Figures 4A,C, respectively).
Predictably, the main differences between the Azores and Madeira archipelagos appear at the local scale, as Bsurface and Bmixed particles reaching Madeira are mostly transported by the southward Portugal Current and by the eastward Azores Current (Figures 4B,D). Due to its seasonal meridional displacement, the Azores Current has an higher impact when the current reaches its southernmost latitude during Summer and Autumn (Supplementary Figures 2G,H; Stramma and Siedler, 1988; Klein and Siedler, 1989). In fact, the Azores Current has a bigger influence in particles intercepting Madeira than in particles intercepting the Azores (Figures 4B,D and 4A,C respectively), being more perceptible in Bmixed particle trajectories (Figure 4D). Although present results demonstrate that Madeira is more frequently exposed to particles intercepting the archipelago from the north and from the west, Álvarez et al. (2020) was unable to find a clear distinction in the accumulation of marine debris between the north and south coasts. Such non-conformity between model results and field surveys can relate to a variety of factors, such as variable beach substrates and exposure to wind and wave action (Herrera et al., 2018; McWilliams et al., 2018; Ríos et al., 2018; Pham et al., 2020) or even the transport of marine litter by coastal currents (Isobe et al., 2014; Pereiro et al., 2018; van Sebille et al., 2020).
Exposed to similar oceanic and atmospheric conditions as Madeira, the Canaries are intercepted by Bsurface and Bmixed particles mostly from the north (Figures 4E,G, respectively). These particles are advected by the wind-driven Canary Current, which in turn is fed by the same Portugal and Azores Currents that intercept the Madeira archipelago upstream (Barton, 2001; Martins et al., 2002, Figure 1A). Such results are in good agreement with previous studies, that found the highest concentrations of micro-plastics at the beaches directly exposed to the Canary Current and the trade winds (i.e., in the northern side of the islands; Baztan et al., 2014; Herrera et al., 2018). Despite the close proximity between archipelagos, the proportion of particles transiting in the Gulf Stream is lower for particles intercepting the Canaries (Figures 4E,F) than for particles intercepting the Azores and Madeira (Figures 4A–D, respectively). As first observed in GDP drifter trajectories (Figure 3E), such differences can be explained by the higher proportions of Canarian particles transiting closer to the Northwestern African and Western European coasts. As a consequence, such proximity increases the probability for particle beaching (i.e., connectivity to land-based sources) and reduces the number of particles transported by upstream currents.
Clearly, the same is applicable to particles intercepting Cabo Verde, which apart from being the most differentiated archipelago of the Macaronesia, is the archipelago with largest differences between Bsurface and Bmixed particle trajectories (Figures 4F,H, respectively). The major pathway for incoming Bsurface particles is depicted by the high proportions of particles flowing along the Northwestern African coast. Naturally, these particles are exposed to persistent trade winds (Figure 1B; Cardoso et al., 2020), which in turn are partly responsible for the equatorward flow of the Canary Current (Barton, 2001) and for the initial southwestward flow of the North Equatorial Current (Lázaro et al., 2005). On the other hand, the major pathway of incoming Bmixed particles is depicted by the high proportions of particles that connect the archipelago to the Northwestern African coast in the east. As Bmixed particles are less exposed to the wind, the transport of these particles is mainly influenced by: (i) the North Equatorial Current that detaches from the African Coast near Cape Blanc (Mittelstaedt, 1983); (ii) by the wind-driven Ekman currents associated with the seasonal upwelling off the Mauritanian coast (Mittelstaedt, 1991; Van Camp et al., 1991); (iii) by the Mauritanian Current that is active during summer and autumn (Supplementary Figures 2O,P; Lázaro et al., 2005); (iv) or by westward-propagating eddies pinching off from the Northwestern African coast (Schütte et al., 2016; Cardoso et al., 2020). Another characteristic that distinguishes Cabo Verde from the other archipelagos of the Macaronesia is the fact that Bmixed particles floating in the South Atlantic or in South American coastal regions can reach the Cabo Verde islands directly through the eastward North Equatorial Counter Current (Figure 4H). Such findings are consistent with the detection of plastic additives originated from the Amazon River plume along the entire length of tropical North Atlantic Ocean, reaching the longitudes of Cabo Verde (Schmidt et al., 2019).
4.2.2. Particles Travel Time
As marine plastic litter floats throughout the ocean, it is exposed to several environmental agents that can modify their properties (i.e., density, shape, and size) through fragmentation, weathering, erosion, or biofouling (reviewed in van Sebille et al., 2020). These changes can have profound implications in the transport of plastic debris. For instance, changes in particle buoyancy can lead them to sink/rise, making particles less/more exposed to the wind. For this reason, it is important to account for the estimated time a particle takes to intercept the archipelagos. The median travel time (i.e., particle age) for Bsurface and Bmixed particles detected in every 0.5° grid cell is presented in Figure 5, with reference to the moment of particle release (i.e., interception). We choose to present the median instead of the mean because the variability in particles' age passing through each cell is quiet large (>2 years standard deviation, Supplementary Figure 3). We suspect this is related with the fact that some particles remain at the ocean for a large period of time before beaching, leading them to pass through the same region more than once. Thus, we believe this analysis prevents an overestimation of the typical travel time a particle takes to intercept the archipelagos.
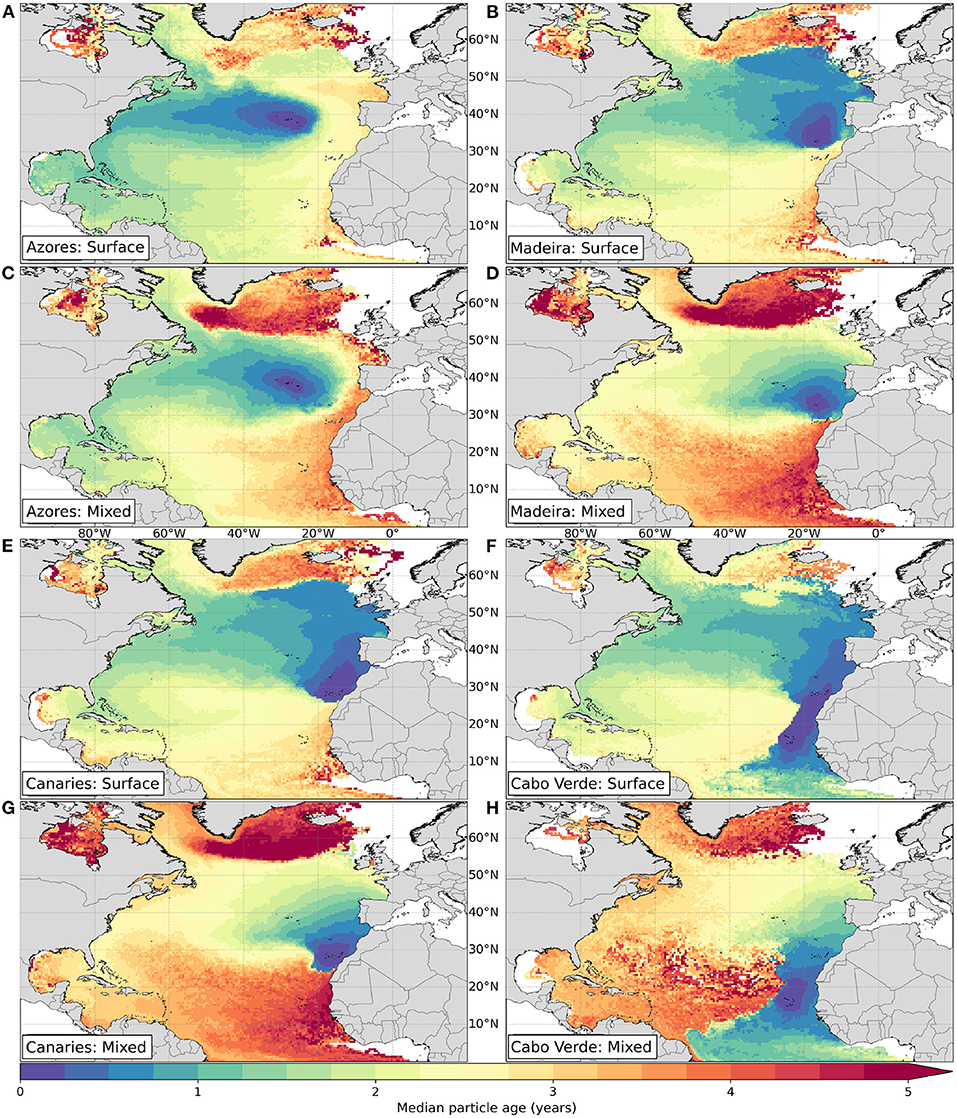
Figure 5. Median age of Bsurface (A,B,E,F) and Bmixed (C,D,G,H) particles before intercepting the archipelagos, detected in 0.5° grid cells. Color scale is divided with a 3-month interval.
In general, the timescales associated with the transport of intercepting particles (Figure 5) are of the same order of magnitude as the timescales associated with the GDP drifter trajectories before intercepting the archipelagos (Figure 3 left panels), especially Bmixed particles which are less exposed to the wind. Bsurface and Bmixed particles connect the North and Central American east coasts to the Macaronesian archipelagos in ~1–1.5 and ~1.5–3 years, respectively (Figure 5). On the other hand, the Southwestern European and Northwestern African coasts present a much more variable connectivity timescale, in which Bsurface and Bmixed particles take ~0.25–4 and ~0.25–>5 years, respectively, to reach the archipelagos. Naturally, the fact that timescales associated with the Bmixed particles are higher than those associated with Bsurface particles can be explained by the absence of wind advection and by the lower current velocities in subsurface layers.
Besides providing valuable information on the connectivity timescales, particle travel time (Figure 5)—in conjunction with particles' pathways (Figure 4)—can also indicate the dominant direction taken by the particles before intercepting the archipelagos. For example, Figures 4A,C shows that some of the particles intercepting the Azores archipelago were detected off the Southwestern European and Northwestern African coasts. Although Bsurface and Bmixed particles are physically closer to the Azores when transiting through this region, Figures 5A,C shows that such particles take >2 and 3 years longer to intercept the archipelago than those detected off the Northeastern American coast. This means that particles from Central and North American sources are less susceptible to fragmentation (e.g., Andrady, 2017; Lebreton et al., 2019) and biofouling (e.g., Fazey and Ryan, 2016; Kooi et al., 2017) before reaching the Azores, whereas particles from Southwestern European and Northwestern African sources have an increased probability of sinking before intercepting the archipelago. The same reasoning can be applied to Madeira, Canaries, and Cabo Verde, considering that the Central and North American coasts are located upstream of all Macaronesian archipelagos, whilst that's not always the case for the Southwestern European and Northwestern African coasts.
As expected, the travel time of Bsurface and Bmixed particles intercepting the archipelagos of Madeira and Canaries have similar patterns at a regional scale, connecting the archipelagos to the Central and North American east coasts in ~1.5 and 3 years, respectively (Figures 5B–G). Nevertheless, a more careful analysis reveals that although the Iberian Peninsula is physically closer to Madeira than to the Canaries, Bsurface particles take ~3 months longer to connect the Madeira archipelago to this region (Figures 5B,E). Considering that Bmixed particles connecting both archipelagos to the Iberian Peninsula share identical travel times (~0.75–1 year), such disparity in Bsurface particles can only be related with the wind.
Given the unique exposure of Cabo Verde to the complex interaction of large-scale currents and features (Figure 1A; Cardoso et al., 2020), Cabo Verde is the only archipelago in which intercepting particles can approach from very distinct directions (Figures 5F,H). Furthermore, Bsurface particles intercepting Cabo Verde are the ones that cover the broadest area in a relatively short period of time, connecting the archipelago to coastal regions that extend from Guinea (10°N) to the British Isles (50°N) in up to ~9 months travel time (Figure 5F). Naturally, the wind is the main contributor to the high-velocity transport of Bsurface particles intercepting the archipelago.
4.2.3. Windage Effects on Surface Particles
As demonstrated by the differences between Bsurface and Bmixed particle trajectories (Figure 4) and travel time (Figure 5), windage effects can have important implications in the distribution of floating marine debris (e.g., Neumann et al., 2014; Maximenko et al., 2018), being even considered the most important mechanism in the transport of light micro-plastics when floating at the surface (Chubarenko et al., 2016). In order to assess how different windage coefficients mediate the transport of particles intercepting the archipelagos of Macaronesia, Figure 6 illustrates the most frequent windage coefficient group of Bsurface particles detected in every 0.5° grid cell. Since submerged particles are much less affected by wind drift (Reisser et al., 2015), Bmixed particles are excluded from this analysis.
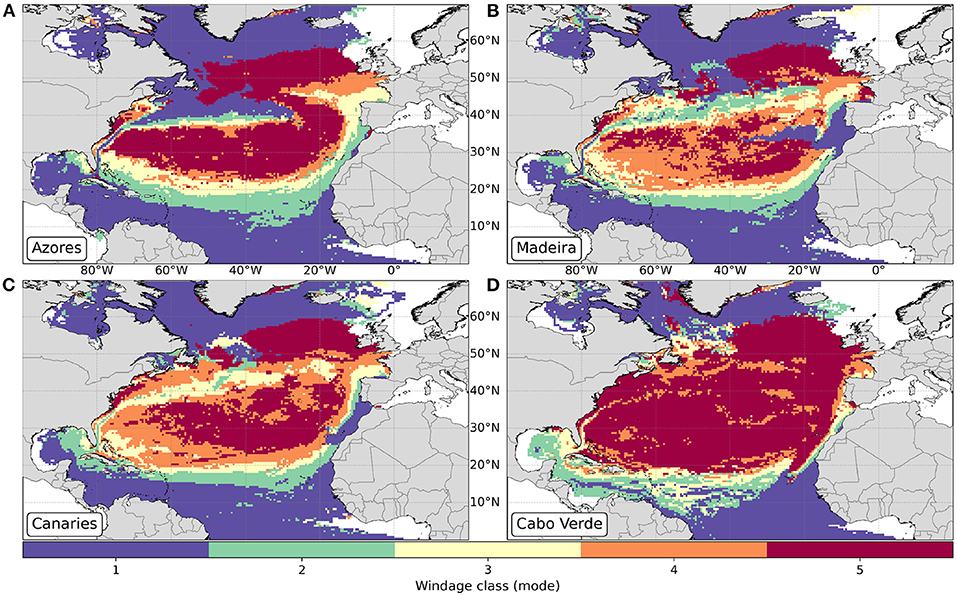
Figure 6. Most frequent occurrence of Bsurface particle windage class for particles released in the Azores (A), Madeira (B), Canaries (C), and Cabo Verde (D), detected in 0.5° grid cells. Windage coefficient values correspond to the percentage contributions of wind forcing at 10 m above sea level.
The most frequent occurrence of high-windage particles at the center of the North Atlantic subtropical gyre (Figure 6) is unquestionably the most conspicuous pattern between archipelagos, revealing the importance of the wind in the transport and delivery of particles from the North Atlantic “garbage patch” to the archipelagos of the Macaronesia. Considering the backward-in-time nature of this simulation, present results are consistent with past studies which reported that low- and null-windage particles tend to accumulate at the so-called “Great Pacific Garbage Patch” (a plastic accumulation zone formed in subtropical waters between California and Hawaii), whereas high-windage particles tend to be pushed out from this region by the wind (e.g., Lebreton et al., 2018; Maximenko et al., 2018). Furthermore, Lebreton et al. (2019) found that most objects captured at the “Great Pacific Garbage Patch” exhibited no or very little air draft when placed in seawater and argued that high-windage particles have higher probability of exiting oceanic “garbage patches” and being transported over larger areas. In fact, such pattern is confirmed by the accumulation of Fsurface (Supplementary Figures 4A,B,E,F) and most significantly Fmixed particles (Supplementary Figures 4C,D,G,H) at the center of the North Atlantic subtropical gyre, being the particles with low-windage coefficients the most frequent at this location (Supplementary Figure 5).
Apart from the regional similarities, a careful inspection at each of the archipelagos reveals distinct pathways of low- and high-windage particles. For instance, particles intercepting the Azores from the north and from the south have mostly low- and high-windage coefficients, respectively (Figure 6A). Considering that high-windage particles have the highest probability for beaching (Lebreton et al., 2019), present results corroborate with past studies that found the highest density of plastic debris on Azorean beaches oriented southwestward, facing the predominant wind direction (as illustrated in Figure 1B, Ríos et al., 2018; Pham et al., 2020). Furthermore, Pham et al. (2020) found that 59% of plastic items collected at the Azorean beaches were within the dominant size range (2.1–5.0 mm) reported to be floating in the western North Atlantic (Morét-Ferguson et al., 2010) and follow similar sizes and colors as the majority of fragments collected in the same region (Prunier et al., 2019), leading the authors to attribute their origin to the “large offshore plastic soup floating in the wider Atlantic Ocean.”
Contrary to the Azores archipelago—that is strongly affected by the Azores high atmospheric pressure system—the Madeira, Canaries, and Cabo Verde archipelagos are exposed to persistent northerly trade winds with varying intensity throughout the year (Figure 1B, Barton et al., 2000; Caldeira and Tomé, 2013; Cardoso et al., 2020). For this reason, particles that intercept these archipelagos from the north have mostly high-windage coefficients (Figures 6B–D). Indeed, beach surveys conducted in the Canaries (Baztan et al., 2014; Herrera et al., 2018; Álvarez-Hernández et al., 2019) and in a uninhabited island of Cabo Verde (Santa Luzia, Fernandes, 2019) revealed that the north coasts of the islands are accumulating significantly more amounts of macro- and micro-litter (with similar characteristics to those found in the Azores) in comparison with beaches from the south coasts. It is highly likely that the same is occurring in Madeira (Figure 6B), but further research is needed to confirm this trend (Álvarez et al., 2020).
Naturally, particles with low-windage coefficients are mostly transported by the currents. Such transport mechanism is easily depicted by the most frequent occurrence of low-windage particles intercepting the Azores from the west/northwest, concurrent to the eastward flow of the Gulf Stream (Figure 6A). Similarly, low-windage particles intercept the Madeira archipelago from the west as a result of the eastward-flowing Azores Current (Figure 6B), an hypothesis further supported by the high proportions of Bsurface and Bmixed particles that make the Azores Current easily discernible (Figures 4B,D). Furthermore, most particles that intercept Madeira and Canaries archipelagos from the east and northeast have predominantly low-windage coefficients (Figures 6B,C), demonstrating that the neighboring continental coastal regions (i.e., Morocco, Portugal, and Spain) are more likely to act as sources of low-windage particles than high-windage particles. The same applies to Cabo Verde, given the dominance of incoming low-windage particles originating from the adjacent Mauritanian and Senegalese coasts on the east (Figure 6D).
4.2.4. Connectivity to Sources of Marine Litter
With the purpose of making a distinction between the two main sources of marine plastic litter affecting the Macaronesian archipelagos, we herein focus our discussion in the connectivity of the archipelagos to marine-based and land-based sources.
4.2.4.1. Marine-Based Sources
Although land-based emissions have been commonly acknowledged as the principal sources of marine litter (Nollkaemper, 1994; Jambeck et al., 2015; Andrady, 2017; Lebreton et al., 2019), recent studies have demonstrated that marine-based sources are generally more important for macro-plastic debris stranded on islands (Unger and Harrison, 2016; Edyvane and Penny, 2017; Burt et al., 2020), being derelict fishing gear the most commonly sampled material on islands of the Atlantic Ocean (up to 40%; Monteiro et al., 2018; Fernandes, 2019). In order to assess the connectivity of the archipelagos to areas of intensive fishing activity, Figure 7 shows the proportion of Bsurface particles detected in 0.5° grid cells (following the same methodology as Figure 4), highlighting those that transited through these areas. For the sake of brevity, the corresponding analysis for Bmixed particles is included in Supplementary Figure 6.
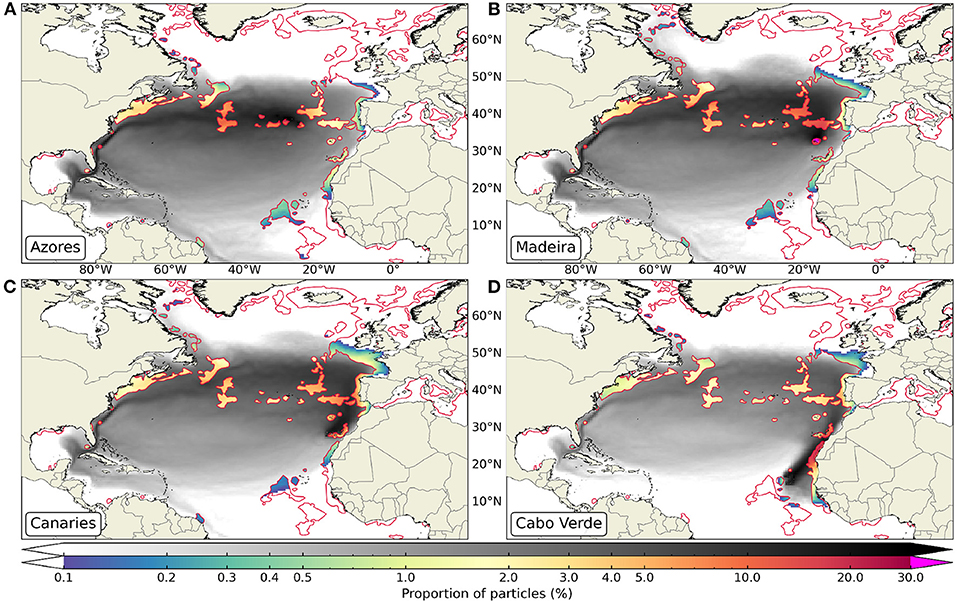
Figure 7. Proportion of Bsurface particles released in the Azores (A), Madeira (B), Canaries (C), and Cabo Verde (D), detected in 0.5° grid cells and clipped by the areas with >150 h of fishing effort (per 0.2° grid cell) reported in the Global Fishing Watch dataset (Kroodsma et al., 2018). Only fishing areas with >5,000 km2 are represented by the red contours. Color maps are in logarithmic scale, in which cells with < 0.1% are masked.
In general, all the archipelagos are exposed to common areas of intensive fishing activity, with varying degrees of exposure according to their surroundings and more importantly with their relation with upstream currents. Local fishing activity is relatively intensive around the Azores, Madeira and Canaries, as these archipelagos are almost entirely surrounded by such activity (Figures 7A–C). Indeed, surveys conducted at the seafloor of Azorean fishing grounds (around Faial and Pico islands) revealed that macro debris are mainly composed of derelict fishing gear (Pham et al., 2013; Rodríguez and Pham, 2017). Conversely, Chambault et al. (2018) noted that among 2,406 visual transects, derelict fishing gear was the third main type of debris floating around the archipelago, accounting for 18% of the total debris. Still, derelict fishing gear floating at the surface or lost on the seafloor caused the highest number of marine-litter related incidents in the archipelago, which often resulted in the entanglement of ship propellers and fishing gear (Rodríguez et al., 2020).
At a regional scale, the extensive fishing area located off the northeastern coast of the US shows similar proportions of particles intercepting the Azores, Madeira, and Canaries archipelagos (~2–5%, Figures 7A–C). Further to the east, patches of intensive fishing activity located along the offshore extension of the Gulf Stream and along the Azores Current have higher probability of acting as sources of debris reaching the Azores and Madeira archipelagos (Figures 7A,B). Most likely due to their proximity, Madeira and Canaries have very similar proportions of incoming particles (up to ~3%) passing through areas of intensive fishing activity located in the Labrador and Newfoundland region, but much more significant proportions (up to ~20%) are observed in offshore regions west of the Iberian Peninsula and in the West European Continental Shelf (Figures 7B,C). Such exposure to areas of intensive fishing activity off the Portuguese coast makes Madeira and Canaries archipelagos vulnerable not only to the abundant amount of floating debris observed in that region (likely originated from fisheries), but also to discharges and cargo losses from commercial vessels and cruise ships transiting through the major shipping corridors that connect Mediterranean, Northern European, and African countries (Sá et al., 2016).
As expected, Bsurface particles intercepting Cabo Verde are more likely to pass through the highly productive (e.g., Mittelstaedt, 1991; Van Camp et al., 1991; Lathuilière et al., 2008) areas of intensive fishing activity along the northwest African coast, extending from the Canaries to the Mauritanian coast (Figure 7D). Indeed, Fernandes (2019) found that >60% (by mass) of the plastic debris collected in the northern side of Santa Luzia island in Cabo Verde were fishing gear. Considering that derelict fishing nets can have a draft of several meters and are thus less influenced by the wind (Lebreton et al., 2019), fishing gear with low- or null-windage coefficient collected in Cabo Verde are most likely being discarded by fishing activities off the Western Sahara (disputed territory with Morocco), Mauritanian, and Senegalese coasts (Figure 4D and Supplementary Figure 6D). In fact, it is possible that the high amounts of octopus traps found in the northern side of Santa Luzia island (Fernandes, 2019) are related with the high abundance of such traps found at the Moroccan seafloor (>75%; Loulad et al., 2017). Octopus traps are normally deployed with a block of cement to fix it in the seafloor, but often loose these blocks due to rough weather conditions or vandalism, making them afloat (Loulad et al., 2017). Important areas of intensive fishing activity are also observed to the south and southwest of Cabo Verde, but as these areas are located downwind of the archipelago (Figure 1B), only low- or null-windage debris discarded at this location are able to reach the archipelago due to the advection by the North Equatorial Counter-Current (Supplementary Figure 6D).
4.2.4.2. Land-Based Sources
In order to assess the connectivity of the archipelagos to potential sources of marine litter on land, the final location of beached particles (tracked backward in time) was considered as the source, which then served to calculate the proportion of land-based particles emitted by coastal countries. As the exposure to the wind increases the probability of particle beaching (Lebreton et al., 2018, 2019), we choose to present only the proportions of land-based Bsurface particles per country coastline (represented by the respective Exclusive Economic Zones, Figure 8) for the sake of brevity, but the proportions of land-based Bmixed particles are included in Supplementary Figure 7 and in Table 3 for comparison. Considering that the vulnerability of the archipelagos to land-based sources is not only dependent on the connectivity to land, but also to the respective population size (Jambeck et al., 2015), population density was included in the figures to assess the likelihood of such coastal regions to act as sources of marine litter.
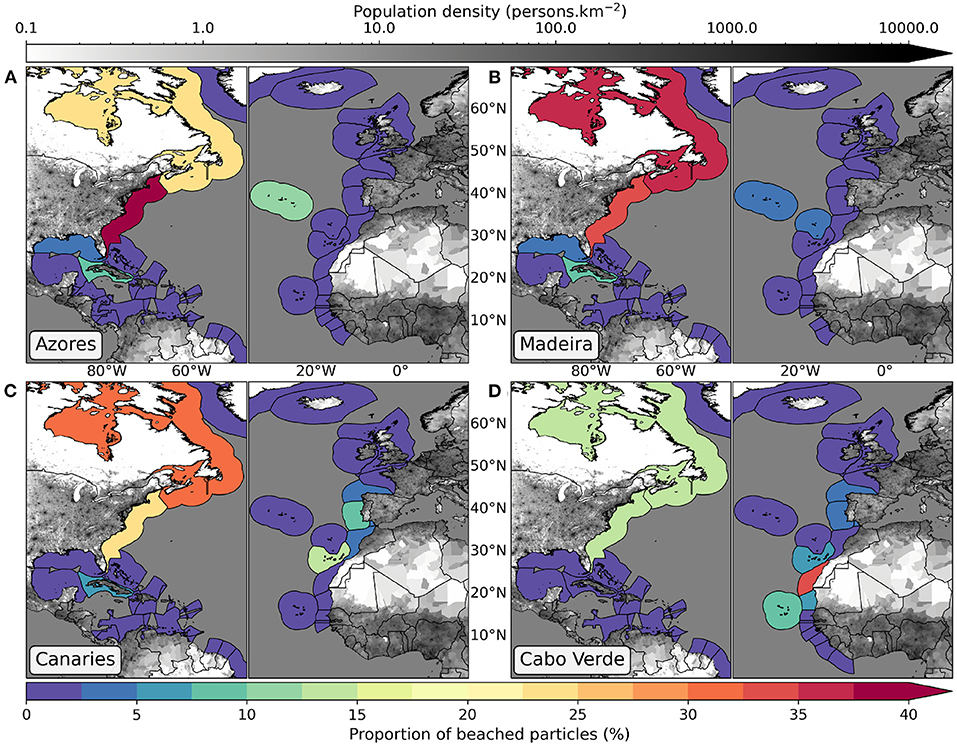
Figure 8. Proportion of Bsurface particles released in the Azores (A), Madeira (B), Canaries (C), and Cabo Verde (D) and beached per country coastline. Countries with coastlines in different seas are divided accordingly (e.g., Atlantic and Mediterranean Spain). On land, gray colors map represents population density.
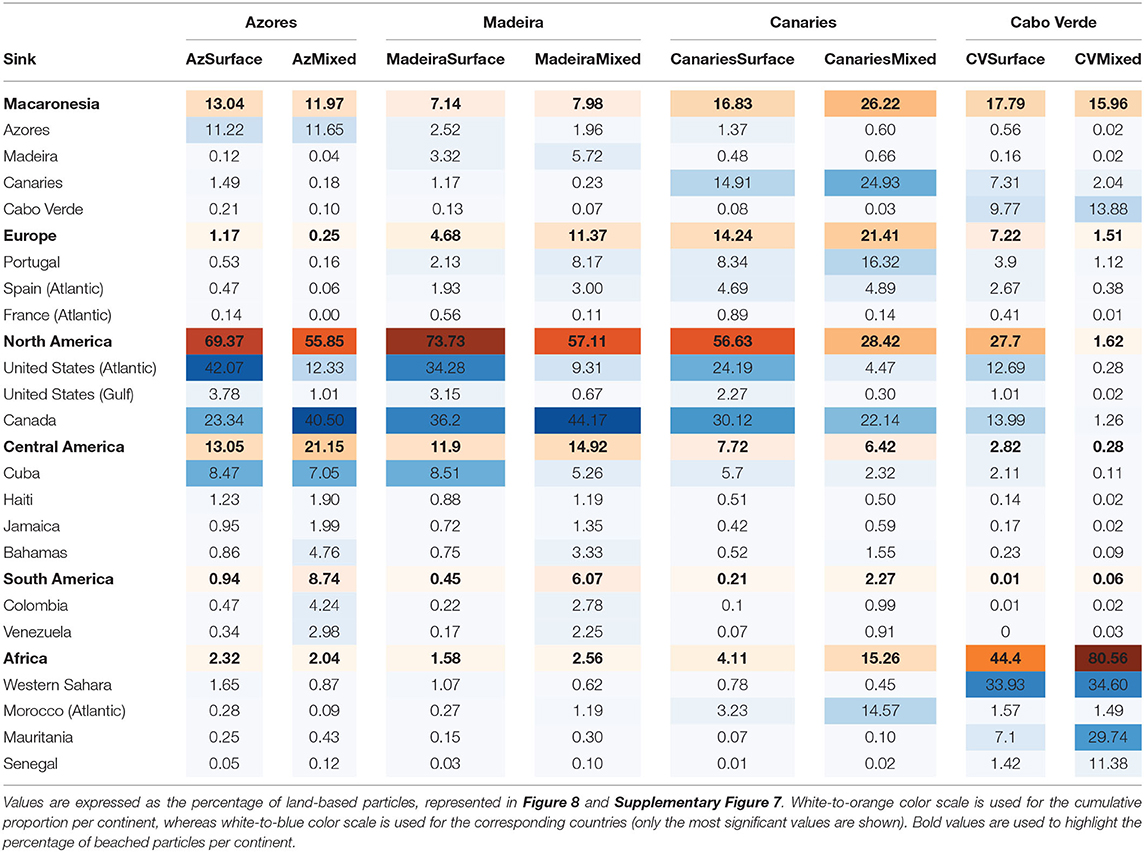
Table 3. Connectivity between sources (rows) and sinks (columns).
It is important to note that according to Onink et al. (2019), stokes drift is one of the most important drivers for particle beaching when tracked in forward time. This means that the effect of wave-driven particle beaching is reversed for backward-in-time simulations, thus acting as a potential buffer to particles being transported nearshore. Nevertheless, the coarse temporal and spatial resolution of the Stokes Drift data used in the present study are not sufficient to resolve such nearshore wave-related processes. In fact, present results show that almost all Bsurface and Bmixed particles reached land, specifically: 91.94 and 82.55% for Azores; 93.05 and 82.83% for Madeira; 95.30 and 90.39% for Canaries; and 98.00 and 95.24% for Cabo Verde, respectively. For this reason, we believe that the reverse wave-driven beaching effect on particles tracked backward in time are in this case negligible. The reason why the proportions of beached particles are significantly higher in relation to past studies (e.g., Robinson et al., 2017; van Gennip et al., 2019) can be related with the longer simulation period (10 years) and with the fact that the North Atlantic basin is surrounded by land in the west and in the east, constraining particle advection and ultimately leading to beaching.
In terms of Bsurface particle connectivity between archipelagos, the connectivity between Canaries –> Cabo Verde is the most significant (7.31%), followed by Azores –> Madeira (2.52%), Canaries –> Azores (1.49%) and vice versa (1.37%), and Canaries –> Madeira (1.17%; Table 3). The fact that Canaries acts primarily as a source to the Azores and Madeira is quite surprising, considering that the Azores and Madeira are located upstream of Canaries (Figure 1). Nevertheless, the Canaries becomes a sink to Fsurface particles released in the Azores and Madeira archipelagos (Supplementary Figure 8). This inconsistency between the two scenarios can be related with the different interpretations associated with backward- (origin) and forward-in-time (fate) simulations, as in the backward-in-time simulations we only track particles that intercept the archipelagos (e.g., van Sebille et al., 2019). Naturally, the proportions of “self-recruited” particles (i.e., the ones beached at the respective archipelago) are proportional to the size of the archipelagos.
In terms of connectivity of the archipelagos to external land-based sources, our results show that the Macaronesia archipelagos can be divided into two groups: the Azores, Madeira, and Canaries constitute one group due to the similar degree of exposure to particles entering the ocean from the Central and North American continent; whereas Cabo Verde is isolated from the other archipelagos due to the higher exposure to particles entering the ocean from the Northwestern African coast (especially Bmixed particles, Table 3). Curiously, Freitas et al. (2019) found significant differences in marine species between Cabo Verde and the other Macaronesian archipelagos and proposed an identical distinction for the restructuring of the Macaronesia as a biogeographic unit, in which the authors followed previous definitions (Spalding et al., 2007) and deemed the Azores, Madeira and Canaries as the Lusitanian archipelagos, whereas Cabo Verde was included in the West African Transition province (along with the Northwest African Upwelling region).
The east coast of North America acts as the primary source of land-based Bsurface particles to the Azores (69.37%), Madeira (73.73%), and Canaries (56.63%), and the secondary source to Cabo Verde (27.7%; Figure 8 and Table 3). Jambeck et al. (2015) used global solid waste management data compiled by the World Bank for the year of 2010 (Hoornweg and Bhada-Tata, 2012) and showed that although the US had the lowest rate of mismanaged waste (2%) among the top producers of plastic marine litter worldwide, the US had the highest annualized per capita plastic waste generation rate (~122 kg.person.year−1). This, together with a large coastal population (112.9 million people) lead to an estimated production of 0.04–0.11 MT.year−1 of plastic marine debris (Jambeck et al., 2015). As the global plastic production increased by 26% (from 334 to 422 Mt) between 2010 and 2016 (Geyer et al., 2017), Law et al. (2020) used updated data reported by the World Bank for 2016 (Kaza et al., 2018) and found that the US was still the largest producer of waste in the world, increasing the annualized per capita plastic waste generation rate by ~7% (to ~130 kg.person.year−1). Although this study does not estimate the amount of plastic debris entering the marine environment, it is highly probable that it followed the same trend as the amount of mismanaged plastic waste, which increased from 0.28 Mt in 2010 to 0.51–1.45 Mt in 2016 (Law et al., 2020). All things considered, it is fair to assume that the east coast of the US is the most probable source of Bsurface and Bmixed land-based particles reaching the Lusitanian archipelagos.
In agreement with Figure 4, the Lusitanian archipelagos are also vulnerable to countries from Central America that can act mainly as sources of incoming Bmixed particles (Table 3). From these countries, and most likely due to its geographic position in relation to the Gulf Stream (and associated upstream currents), Cuba stands out at as the main Central American source of land-based particles to all archipelagos.
Albeit closer to the archipelagos than the American continent, the European continent can be deemed as a secondary and tertiary source of land-based particles to the Lusitanian and to Cabo Verde archipelagos, respectively (Table 3). Given the meridionally long coastline facing the North Atlantic, Portugal is the dominant European source for all archipelagos, having a more significant impact for particles reaching the Canaries (especially for Bsurface particles, Table 3).
Partly due to their proximity to the continent, Cabo Verde and the Canaries are the only archipelagos considerably exposed to Northwestern African sources (Table 3). As previously observed in Figures 3G, 4H, almost all Bmixed particles intercepting Cabo Verde (81%; Table 3) originated from the Western Sahara, Mauritania, and Senegal. Although coastal population density is relatively low in this region (Figure 8), the lack of good waste management policies and infrastructure makes these countries probable sources of land-based marine litter. In fact, Morocco (including Western Sahara) ranks as the 18th country with the highest production of plastic marine debris worldwide (0.05–0.12 MMT.year−1), producing as much as all the coastal European Union countries combined (Jambeck et al., 2015).
5. Conclusions
Our study focused on the identification of the potential sources and pathways responsible for the transport of land- and marine-based litter to the archipelagos of the Macaronesia. To achieve this, we set up lagrangian simulations with surface particles—representative of floating plastics with a varying exposure to the wind—and mixed particles—representative of submerged plastics due to wind-induced vertical mixing—released around the archipelagos (Figure 2) and tracked backward in time to their origins. A forward-in-time scenario was also conducted, but was used as complementary information. As observational evidences, GDP drifter trajectories intercepting the archipelagos were also assessed.
In general, our simulations agreed well with the GDP drifter trajectories. Although the number of intercepting drifters differs quite substantially from the number of particles released in each archipelago (e.g., 269 drifters in comparison to ~360,000 particles released in the Azores), drifter trajectories and travel time before intercepting the archipelagos (Figure 3 left panels) show similar patterns as the distributions and the transport timescales of virtual particles, especially Bmixed particles that are less impacted by the wind (Figures 4C,D,G,H, 5C,D,G,H). The clockwise-circulating system of ocean currents termed as the North Atlantic subtropical gyre was the most conspicuous pattern in GDP drifter (Figure 3) and particle trajectories in both backward- and forward-in-time scenarios (Figure 4 and Supplementary Figure 4, respectively). Within this system, the Gulf Stream acts as the dominant pathway of particles intercepting all archipelagos at a regional scale, though with less impact for Cabo Verde. At a local scale, however, the Gulf Stream only has a direct impact to the Azores archipelago (Figures 3A, 4A,C). In conjunction with the atmospheric circulation (Figure 1B), the southward Portugal and Canary Currents act as important pathways for particles intercepting the Madeira and Canaries, respectively (Figures 3C,E, 4B,D,E,G). The Azores Current also plays an important role in the advection of particles to the Canary Current, having a more and an equally significant impact to the Madeira and Canaries archipelagos, respectively, in comparison to the Azores. For Cabo Verde, the initial extension of the North Equatorial Current acts as the dominant pathway for incoming Bsurface particles (Figure 3F), whereas the seasonal Mauritanian current, upwelling filaments and eddies generated off the Mauritanian coast are the most likely features driving the westward transport of incoming Bmixed particles (Figure 3H).
Present results also demonstrate that Bmixed particles are connected to regional sources in significantly longer timescales than Bsurface particles (Figure 5A), which is naturally related with the absence of wind advection and to the lower current speed along depth. Due to the archipelagos exposure to impinging currents and winds, the Central and North American east coasts are the regions from which plastic marine litter is more likely to reach the Azores in a shorter period of time, whereas Southwestern European and Northwestern African coasts are the closest regions to the other Macaronesian archipelagos time wise. Although counter-intuitive, the fact that Bsurface and Bmixed particles are in some cases physically closer but take significantly longer time to intersect the archipelagos (as it is the case of particles intercepting the Azores from Southwestern European and Northwestern African sources) demonstrate how important it is to account for “oceanographic distances” instead of physical distances in studies of this nature.
As expected, differences in the dispersion of Bsurface and Bmixed particles are mainly related with the exposure to the wind, an hypothesis further supported by the distinct patterns between low- and high-windage particles (Figure 6 and Supplementary Figure 5). In agreement with past studies (e.g., Lebreton et al., 2018; Maximenko et al., 2018), our results demonstrate that particles originating from the center of the North Atlantic subtropical gyre are more likely to intercept the archipelagos of the Macaronesia if considerably exposed to the wind (i.e., high-windage particles). This is further supported by the fact that low-windage particles tend to accumulate at this region and are thus less likely to exit (Supplementary Figures 4, 5). On the other hand, incoming low-windage particles are more likely to originate from distant sources, such as sub-polar regions and the South Atlantic Ocean (Figure 6).
In what concerns the connectivity to marine-based sources of marine litter—often deemed as the most important for insular environments (e.g., Monteiro et al., 2018; Fernandes, 2019; Burt et al., 2020)—present results demonstrate that all archipelagos are exposed to common areas of intensive fishing activity (Figure 7). Nevertheless, the archipelagos' geographical location ultimately determines the degree of exposure to such areas. For instance, areas of intensive fishing activity located in the offshore extension of the Gulf Stream are much more important to the Azores (Figure 7A and Supplementary Figure 6A) than to Madeira and Canaries, which are more exposed to fishing activity located offshore and along the western Iberian coast (Figure 7C and Supplementary Figure 6C). The same applies to Cabo Verde, as the archipelago is mostly affected by different pathways and is thus more exposed intensive fishing activity carried along the Northwestern African coast (Figure 7D).
A similar pattern was observed in the connectivity to land-based sources. The west coast of North America is unquestionably the dominant source of land-based particles intercepting the archipelagos of Azores, Madeira and Canaries (Figures 8A–C), whereas the Northwestern African coast is the primary source for land-based particles reaching Cabo Verde (Figure 8D). This is especially true for Bmixed particles intercepting Cabo Verde, as almost all of them originate from the Northwestern African coast (81% of the land-based particles; Table 3). In addition, and despite the fact that the Lusitanian archipelagos are also exposed to Southern Atlantic particles (mostly Bmixed and low-windage particles; Figures 4C,D,G, 6A–C, respectively), Cabo Verde is the only archipelago directly intercepted by such particles due to its exposure to the North Equatorial Counter Current (Figures 4H, 5H). Such findings reinforce the idea that Cabo Verde is located in a rather complex oceanographic context, which make the archipelago exposed to significantly different sources in relation to the other Macaronesian archipelagos.
Following the same trend as other islands located in different oceanic basins (e.g., Robinson et al., 2017; van Gennip et al., 2019; van Sebille et al., 2019), our study shows that the archipelagos of the Macaronesia are significantly vulnerable to marine litter originating from distant sources. Although at a greater distance from the America than from Europe, these archipelagos are much more exposed to marine litter entering the North Atlantic Ocean at the western boundary, with the exception of Cabo Verde that is much more exposed to Northwestern African sources. It was also demonstrated that the archipelagos are not as exposed to marine litter from the North Atlantic “garbage patch” as previously thought (e.g., Pham et al., 2020), unless these particles are significantly exposed to the wind.
It is important to note that the lagrangian set up used in our simulations is relatively general and uses course resolution. There are also some knowledge gaps associated with the transport of marine plastic particles at the present date. There are several important factors to consider: (i) the coarse temporal and spatial resolution of the ocean circulation and wind datasets is not able to fully resolve sub-mesoscale processes and coastal dynamics; (ii) the fact that our particles do not take into account plastic properties (such as density, shape, and size) that can influence their horizontal and vertical displacement; (iii) the negligence of particle weathering, fragmentation, and biofouling; and (iv) the simplification of highly chaotic (or turbulent) processes associated with particle beaching. Nevertheless, our modeled results demonstrate the importance of understanding how currents, waves and wind mediate the transport of marine litter from marine- and land-based sources to oceanic islands in the North Atlantic basin. Such understanding is vital, and it is expected that a multi-disciplinary approach between modeling and field-based results can benefit the creation of management and mitigation policies to reduce the vulnerability of oceanic islands to exogenous marine plastic pollution. It is also expected that some of the limitations of our study will be improved with the advent of new products with better resolution and calibration, made possible by future advances in computational power and numerical optimization routines, and by future satellite missions that will measure oceanic parameters with unprecedented precision, such as the Sea surface KInematics Multiscale monitoring (SKIM) concept (Ardhuin et al., 2018).
Data Availability Statement
Particle trajectories files cannot be provided due to size (>100 GB). Python scripts used to run the lagrangian simulations and for the data analysis are available at: https://github.com/claudiofgcardoso/CleanAtlantic_MACARONESIA.git. Global drifter trajectory data are available from the NOAA Global Drifter Program (www.aoml.noaa.gov/phod/gdp/). The ocean circulation datasets GLORYS2V4 and GLORYS12V1 can be found at the CMEMS website (https://resources.marine.copernicus.eu/?option=com_csw&view=details&product_id=GLOBAL_ANALYSIS_FORECAST_PHY_001_024; https://resources.marine.copernicus.eu/?option=com_csw&view=details&product_id=GLOBAL_REANALYSIS_PHY_001_030, respectively). WaveWatch III hindcast and wind dataset used to force the wave model and our virtual particles at the surface (ECMWF ERA-Interim Reanalysis) are available at the IFREMER FTP server (ftp://ftp.ifremer.fr/ifremer/ww3/HINDCAST/GLOBAL/). Shapefiles for the EEZ were made available by the Flanders Marine Institute (https://www.marineregions.org/). The “Gridded population of the world” (Version 4, revision 11) was produced by the centre for International Earth Science Information Network (CIESIN) and the Centro Internacional de Agricultura Tropical (CIAT) and is available online (https://sedac.ciesin.columbia.edu/data/collection/gpw-v4). The “Global Fishing Watch” database was produced by Kroodsma et al. (2018) and is available online (https://globalfishingwatch.org/datasets-and-code/fishing-effort/).
Author Contributions
CC assembled most of the writing and was responsible for the modeling and data collection, processing, and analysis. Both authors developed the original ideas, structure of the study, participated in the review process, and approved the final version.
Funding
This study was supported by the CleanAtlantic Project from the INTERREG Atlantic Area (EAPA_46/2016) and by the Oceanic Observatory of Madeira (M1420-01-0145-FEDER-000001). CC was funded by the Fundação para a Ciência e a Tecnologia (FCT, SFRH/BD/143792/2019) at the time of publication.
Conflict of Interest
The authors declare that the research was conducted in the absence of any commercial or financial relationships that could be construed as a potential conflict of interest.
Acknowledgments
We gratefully thank CESGA (Supercomputing Center of Galicia) for providing the necessary resources for the numerical simulations and data processing. We acknowledge Rui Vieira and Ricardo Faria for the support with computational demands and data processing, as well as Alexandra Rosa, Jesus Reis, Cátia Azevedo, José Alves, Carlos Lucas, and Annalisa Sambolino for the useful and constructive recommendations. We acknowledge the OceanParcels team for making the lagrangian framework available (www.oceanparcels.org) and for the technical support. Comments from Erik van Sebille and from a reviewer helped to improve the original manuscript.
Supplementary Material
The Supplementary Material for this article can be found online at: https://www.frontiersin.org/articles/10.3389/fmars.2021.653502/full#supplementary-material
References
Aguilera, M., Medina-Suárez, M., Pinós, J., Liria-Loza, A., and Benejam, L. (2018). Marine debris as a barrier: assessing the impacts on sea turtle hatchlings on their way to the ocean. Mar. Pollut. Bull. 137, 481–487. doi: 10.1016/j.marpolbul.2018.10.054
Álvarez, S., Gestoso, I., Herrera, A., Riera, L., and Canning-Clode, J. (2020). A comprehensive first baseline for marine litter characterization in the Madeira archipelago (NE Atlantic). Water Air Soil Pollut. 231, 182. doi: 10.1007/s11270-020-04517-x
Álvarez-Hernández, C., Cairós, C., López-Darias, J., Mazzetti, E., Hernández-Sánchez, C., González-Sálamo, J., et al. (2019). Microplastic debris in beaches of Tenerife (Canary Islands, Spain). Mar. Pollut. Bull. 146, 26–32. doi: 10.1016/j.marpolbul.2019.05.064
Andrady, A. L. (2011). Microplastics in the marine environment. Mar. Pollut. Bull. 62, 1596–1605. doi: 10.1016/j.marpolbul.2011.05.030
Andrady, A. L. (2017). The plastic in microplastics: a review. Mar. Pollut. Bull. 119, 12–22. doi: 10.1016/j.marpolbul.2017.01.082
Ardhuin, F., Aksenov, Y., Benetazzo, A., Bertino, L., Brandt, P., Caubet, E., et al. (2018). Measuring currents, ice drift, and waves from space: the Sea surface KInematics Multiscale monitoring (SKIM) concept. Ocean Sci. 14, 337–354. doi: 10.5194/os-14-337-2018
Arístegui, J., Sangrá, P., Hernández-León, S., Cantón, M., Hernández-Guerra, A., and Kerling, J. (1994). Island-induced eddies in the Canary islands. Deep Sea Res. I 41, 1509–1525. doi: 10.1016/0967-0637(94)90058-2
Avery-Gomm, S., Provencher, J. F., Liboiron, M., Poon, F. E., and Smith, P. A. (2018). Plastic pollution in the Labrador Sea: an assessment using the seabird northern fulmar Fulmarus glacialis as a biological monitoring species. Mar. Pollut. Bull. 127, 817–822. doi: 10.1016/j.marpolbul.2017.10.001
Barbosa Aguiar, A. C., Peliz, A. J., Cordeiro Pires, A., and Le Cann, B. (2011). Zonal structure of the mean flow and eddies in the Azores current system. J. Geophys. Res. Oceans 116, 1–14. doi: 10.1029/2010JC006538
Barnes, D. K., Galgani, F., Thompson, R. C., and Barlaz, M. (2009). Accumulation and fragmentation of plastic debris in global environments. Philos. Trans. R. Soc. B Biol. Sci. 364, 1985–1998. doi: 10.1098/rstb.2008.0205
Barnes, D. K., Morley, S. A., Bell, J., Brewin, P., Brigden, K., Collins, M., et al. (2018). Marine plastics threaten giant Atlantic marine protected areas. Curr. Biol. 28, R1137–R1138. doi: 10.1016/j.cub.2018.08.064
Barnes, D. K. A. (2002). Invasions by marine life on plastic debris. Nature 416, 808–809. doi: 10.1038/416808a
Barton, E. (2001). “Canary and Portugal currents,” in Encyclopedia of Ocean Sciences, ed J. H. Steele (Oxford: Academic Press), 380–389. doi: 10.1006/rwos.2001.0360
Barton, E. D., Arístegui, J., Tett, P., and Navarro-Pérez, E. (2004). Variability in the Canary Islands area of filament-eddy exchanges. Prog. Oceanogr. 62, 71–94. doi: 10.1016/j.pocean.2004.07.003
Barton, E. D., Basterretxea, G., Flament, P., Mitchelson-Jacob, E. G., Jones, B., Arístegui, J., et al. (2000). Lee region of Gran Canaria. J. Geophys. Res. Oceans 105, 17173–17193. doi: 10.1029/2000JC900010
Baulch, S., and Perry, C. (2014). Evaluating the impacts of marine debris on cetaceans. Mar. Pollut. Bull. 80, 210–221. doi: 10.1016/j.marpolbul.2013.12.050
Baztan, J., Carrasco, A., Chouinard, O., Cleaud, M., Gabaldon, J. E., Huck, T., et al. (2014). Protected areas in the Atlantic facing the hazards of micro-plastic pollution: first diagnosis of three islands in the Canary Current. Mar. Pollut. Bull. 80, 302–311. doi: 10.1016/j.marpolbul.2013.12.052
Bond, A. L., Montevecchi, W. A., Guse, N., Regular, P. M., Garthe, S., and Rail, J. F. (2012). Prevalence and composition of fishing gear debris in the nests of northern gannets (Morus bassanus) are related to fishing effort. Mar. Pollut. Bull. 64, 907–911. doi: 10.1016/j.marpolbul.2012.03.011
Bourles, B., Molinari, R. L., Johns, E., Wilson, W. D., and Leaman, K. D. (1999). Upper layer currents in the western tropical North Atlantic (1989–1991). J. Geophys. Res. Oceans 104, 1361–1375. doi: 10.1029/1998JC900025
Bowman, D., Manor-Samsonov, N., and Golik, A. (1998). Dynamics of litter pollution on Israeli Mediterranean beaches: a budgetary, litter flux approach. J. Coast. Res. 14, 418–482.
Burt, A. J., Raguain, J., Sanchez, C., Brice, J., Fleischer-Dogley, F., Goldberg, R., et al. (2020). The costs of removing the unsanctioned import of marine plastic litter to small island states. Sci. Rep. 10:14458. doi: 10.1038/s41598-020-71444-6
Caldeira, R., Groom, S., Miller, P., Pilgrim, D., and Nezlin, N. (2002). Sea-surface signatures of the island mass effect phenomena around Madeira Island, Northeast Atlantic. Rem. Sens. Environ. 80, 336–360. doi: 10.1016/S0034-4257(01)00316-9
Caldeira, R. M. A., and Reis, J. C. (2017). The Azores confluence zone. Front. Mar. Sci. 4:37. doi: 10.3389/fmars.2017.00037
Caldeira, R. M. A., and Tomé, R. (2013). Wake response to an ocean-feedback mechanism: Madeira Island case study. Bound. Layer Meteorol. 148, 419–436. doi: 10.1007/s10546-013-9817-y
Campanale, C., Massarelli, C., Savino, I., Locaputo, V., and Uricchio, V. F. (2020). A detailed review study on potential effects of microplastics and additives of concern on human health. Int. J. Environ. Res. Public Health 17:1212. doi: 10.3390/ijerph17041212
Cardoso, C., Caldeira, R. M., Relvas, P., and Stegner, A. (2020). Islands as eddy transformation and generation hotspots: Cabo Verde case study. Prog. Oceanogr. 184:102271. doi: 10.1016/j.pocean.2020.102271
Carson, H. S., Lamson, M. R., Nakashima, D., Toloumu, D., Hafner, J., Maximenko, N., et al. (2013). Tracking the sources and sinks of local marine debris in Hawai'i. Mar. Environ. Res. 84, 76–83. doi: 10.1016/j.marenvres.2012.12.002
Chambault, P., Vandeperre, F., Machete, M., Lagoa, J. C., and Pham, C. K. (2018). Distribution and composition of floating macro litter off the Azores archipelago and Madeira (NE Atlantic) using opportunistic surveys. Mar. Environ. Res. 141, 225–232. doi: 10.1016/j.marenvres.2018.09.015
Chubarenko, I., Bagaev, A., Zobkov, M., and Esiukova, E. (2016). On some physical and dynamical properties of microplastic particles in marine environment. Mar. Pollut. Bull. 108, 105–112. doi: 10.1016/j.marpolbul.2016.04.048
Chubarenko, I., Efimova, I., Bagaeva, M., Bagaev, A., and Isachenko, I. (2020). On mechanical fragmentation of single-use plastics in the sea swash zone with different types of bottom sediments: insights from laboratory experiments. Mar. Pollut. Bull. 150:110726. doi: 10.1016/j.marpolbul.2019.110726
Chubarenko, I. P., Esiukova, E. E., Bagaev, A. V., Bagaeva, M. A., and Grave, A. N. (2018). Three-dimensional distribution of anthropogenic microparticles in the body of sandy beaches. Sci. Total Environ. 628–629, 1340–1351. doi: 10.1016/j.scitotenv.2018.02.167
CIESIN (2018). Gridded Population of the World, Version 4 (GPWV4): Population Density, Revision 11. Palisades, NY: NASA Socioeconomic Data and Applications Center (SEDAC).
Corcoran, P. L., Biesinger, M. C., and Grifi, M. (2009). Plastics and beaches: a degrading relationship. Mar. Pollut. Bull. 58, 80–84. doi: 10.1016/j.marpolbul.2008.08.022
Cozar, A., Echevarria, F., Gonzalez-Gordillo, J. I., Irigoien, X., Ubeda, B., Hernandez-Leon, S., et al. (2014). Plastic debris in the open ocean. Proc. Natl. Acad. Sci. U.S.A. 111, 10239–10244. doi: 10.1073/pnas.1314705111
Delandmeter, P., and van Sebille, E. (2019). The Parcels v2.0 Lagrangian framework: new field interpolation schemes. Geosci. Model Dev. Discuss. 12, 1–24. doi: 10.5194/gmd-2018-339
Desforges, J. P. W., Galbraith, M., and Ross, P. S. (2015). Ingestion of microplastics by zooplankton in the Northeast Pacific Ocean. Archiv. Environ. Contamin. Toxicol. 69, 320–330. doi: 10.1007/s00244-015-0172-5
Doxsey-Whitfield, E., MacManus, K., Adamo, S. B., Pistolesi, L., Squires, J., Borkovska, O., et al. (2015). Taking advantage of the improved availability of census data: a first look at the gridded population of the world, version 4. Appl. Geogr. 1, 226–234. doi: 10.1080/23754931.2015.1014272
Edyvane, K. S., and Penny, S. S. (2017). Trends in derelict fishing nets and fishing activity in northern Australia: implications for trans-boundary fisheries management in the shared Arafura and Timor Seas. Fish. Res. 188, 23–37. doi: 10.1016/j.fishres.2016.11.021
Enders, K., Lenz, R., Stedmon, C. A., and Nielsen, T. G. (2015). Abundance, size and polymer composition of marine microplastics ≥ 10 μm in the Atlantic Ocean and their modelled vertical distribution. Mar. Pollut. Bull. 100, 70–81. doi: 10.1016/j.marpolbul.2015.09.027
Eriksen, M., Lebreton, L. C., Carson, H. S., Thiel, M., Moore, C. J., Borerro, J. C., et al. (2014). Plastic pollution in the world's oceans: more than 5 trillion plastic pieces weighing over 250,000 tons afloat at sea. PLoS ONE 9:e0111913. doi: 10.1371/journal.pone.0111913
Fazey, F. M., and Ryan, P. G. (2016). Biofouling on buoyant marine plastics: an experimental study into the effect of size on surface longevity. Environ. Pollut. 210, 354–360. doi: 10.1016/j.envpol.2016.01.026
Fernandes, M. F. (2019). Quantification of macro and microplastics on a Desert Island, Santa Luzia, Cabo Verde Archipelago, North East Atlantic Ocean (Master's thesis), Universidade do Porto, Porto, Portugal.
Fratantoni, D. M. (2001). North Atlantic surface circulation during the 1990's observed with satellite-tracked drifters. J. Geophys. Res. Oceans 106, 22067–22093. doi: 10.1029/2000JC000730
Freitas, R., Romeiras, M., Silva, L., Cordeiro, R., Madeira, P., González, J. A., et al. (2019). Restructuring of the ‘Macaronesia' biogeographic unit: a marine multi-taxon biogeographical approach. Sci. Rep. 9:15792. doi: 10.1038/s41598-019-51786-6
Garric, G., Parent, L., Greiner, E., Drévillon, M., Hamon, M., Lellouche, J.-M., et al. (2018). “Performance and quality assessment of the global ocean eddy-permitting physical reanalysis glorys2v4,” in Proceedings of the Eight EuroGOOS International Conference, 3–5 October 2017, Bergen, Norway, eds E. Buch, V. Fernández, D. Eparkhina, P. Gorringe, and G. Nolan (Brussels), 215–222.
Gassel, M., Harwani, S., Park, J. S., and Jahn, A. (2013). Detection of nonylphenol and persistent organic pollutants in fish from the North Pacific Central Gyre. Mar. Pollut. Bull. 73, 231–242. doi: 10.1016/j.marpolbul.2013.05.014
Geyer, R., Jambeck, J. R., and Law, K. L. (2017). Production, use, and fate of all plastics ever made. Sci. Adv. 3:e1700782. doi: 10.1126/sciadv.1700782
Goldstein, M. C., Carson, H. S., and Eriksen, M. (2014). Relationship of diversity and habitat area in North Pacific plastic-associated rafting communities. Mar. Biol. 161, 1441–1453. doi: 10.1007/s00227-014-2432-8
Gould, W. (1985). Physical oceanography of the Azores front. Prog. Oceanogr. 14, 167–190. doi: 10.1016/0079-6611(85)90010-2
Gregory, M. R. (2009). Environmental implications of plastic debris in marine settings–entanglement, ingestion, smothering, hangers-on, hitch-hiking and alien invasions. Philos. Trans. R. Soc. B Biol. Sci. 364, 2013–2025. doi: 10.1098/rstb.2008.0265
Grodsky, S. A., Lumpkin, R., and Carton, J. A. (2011). Spurious trends in global surface drifter currents. Geophys. Res. Lett. 38, 1–6. doi: 10.1029/2011GL047393
Gutow, L., Ricker, M., Holstein, J. M., Dannheim, J., Stanev, E. V., and Wolff, J. O. (2018). Distribution and trajectories of floating and benthic marine macrolitter in the south-eastern North Sea. Mar. Pollut. Bull. 131, 763–772. doi: 10.1016/j.marpolbul.2018.05.003
Herrera, A., Asensio, M., Martínez, I., Santana, A., Packard, T., and Gómez, M. (2018). Microplastic and tar pollution on three Canary Islands beaches: an annual study. Mar. Pollut. Bull. 129, 494–502. doi: 10.1016/j.marpolbul.2017.10.020
Herrera, A., Raymond, E., Martínez, I., Álvarez, S., Canning-Clode, J., Gestoso, I., et al. (2020). First evaluation of neustonic microplastics in the Macaronesian region, NE Atlantic. Mar. Pollut. Bull. 153:110999. doi: 10.1016/j.marpolbul.2020.110999
Hinata, H., Mori, K., Ohno, K., Miyao, Y., and Kataoka, T. (2017). An estimation of the average residence times and onshore-offshore diffusivities of beached microplastics based on the population decay of tagged meso- and macrolitter. Mar. Pollut. Bull. 122, 17–26. doi: 10.1016/j.marpolbul.2017.05.012
Hinata, H., Sagawa, N., Kataoka, T., and Takeoka, H. (2020). Numerical modeling of the beach process of marine plastics: a probabilistic and diagnostic approach with a particle tracking method. Mar. Pollut. Bull. 152:110910. doi: 10.1016/j.marpolbul.2020.110910
Hoornweg, D., and Bhada-Tata, P. (2012). What a Waste : A Global Review of Solid Waste Management. Urban development series; knowledge papers no. 15. Washington, DC: World Bank. Available online at: https://openknowledge.worldbank.org/handle/10986/17388
Isobe, A., Kubo, K., Tamura, Y., Kako, S., Nakashima, E., and Fujii, N. (2014). Selective transport of microplastics and mesoplastics by drifting in coastal waters. Mar. Pollut. Bull. 89, 324–330. doi: 10.1016/j.marpolbul.2014.09.041
Jalón-Rojas, I., Wang, X. H., and Fredj, E. (2019). A 3D numerical model to Track Marine Plastic Debris (TrackMPD): sensitivity of microplastic trajectories and fates to particle dynamical properties and physical processes. Mar. Pollut. Bull. 141, 256–272. doi: 10.1016/j.marpolbul.2019.02.052
Jambeck, J. R., Geyer, R., Wilcox, C., Siegler, T. R., Perryman, M., Andrady, A., et al. (2015). Plastic waste inputs from land into the ocean. Science 347, 768–771. doi: 10.1126/science.1260352
Johnson, J., and Stevens, I. (2000). A fine resolution model of the eastern North Atlantic between the Azores, the Canary Islands and the Gibraltar Strait. Deep Sea Res. I 47, 875–899. doi: 10.1016/S0967-0637(99)00073-4
Kaandorp, M. L. A., Dijkstra, H. A., and van Sebille, E. (2020). Closing the Mediterranean marine floating plastic mass budget: inverse modeling of sources and sinks. Environ. Sci. Technol. 54, 11980–11989. doi: 10.1021/acs.est.0c01984
Kaza, S., Yao, L., Bhada-Tata, P., and Van Woerden, F. (2018). What a Waste 2.0: A Global Snapshot of Solid Waste Management to 2050. Washington, DC: World Bank Publications.
Klein, B., and Siedler, G. (1989). On the origin of the Azores Current. J. Geophys. Res. 94:6159. doi: 10.1029/JC094iC05p06159
Kooi, M., and Koelmans, A. A. (2019). Simplifying microplastic via continuous probability distributions for size, shape, and density. Environ. Sci. Technol. Lett. 6, 551–557. doi: 10.1021/acs.estlett.9b00379
Kooi, M., Reisser, J., Slat, B., Ferrari, F. F., Schmid, M. S., Cunsolo, S., et al. (2016). The effect of particle properties on the depth profile of buoyant plastics in the ocean. Sci. Rep. 6:33882. doi: 10.1038/srep33882
Kooi, M., Van Nes, E. H., Scheffer, M., and Koelmans, A. A. (2017). Ups and downs in the ocean: effects of biofouling on vertical transport of microplastics. Environ. Sci. Technol. 51, 7963–7971. doi: 10.1021/acs.est.6b04702
Kroodsma, D. A., Mayorga, J., Hochberg, T., Miller, N. A., Boerder, K., Ferretti, F., et al. (2018). Tracking the global footprint of fisheries. Science 359, 904–908. doi: 10.1126/science.aao5646
Kukulka, T., Proskurowski, G., Morét-Ferguson, S., Meyer, D. W., and Law, K. L. (2012). The effect of wind mixing on the vertical distribution of buoyant plastic debris. Geophys. Res. Lett. 39, 1–6. doi: 10.1029/2012GL051116
Lacerda, A. L., Rodrigues, L. d. S., van Sebille, E., Rodrigues, F. L., Ribeiro, L., Secchi, E. R., et al. (2019). Plastics in sea surface waters around the Antarctic Peninsula. Sci. Rep. 9:3977. doi: 10.1038/s41598-019-40311-4
Lange, M., and van Sebille, E. (2017). Parcels v0.9: prototyping a Lagrangian ocean analysis framework for the petascale age. Geosci. Model Dev. 10, 4175–4186. doi: 10.5194/gmd-10-4175-2017
Lathuilière, C., Echevin, V., and Lévy, M. (2008). Seasonal and intraseasonal surface chlorophyll-a variability along the northwest African coast. J. Geophys. Res. 113:C05007. doi: 10.1029/2007JC004433
Lavers, J. L., and Bond, A. L. (2017). Exceptional and rapid accumulation of anthropogenic debris on one of the world's most remote and pristine islands. Proc. Natl. Acad. Sci. U.S.A. 114, 6052–6055. doi: 10.1073/pnas.1619818114
Law, K. L. (2017). Plastics in the marine environment. Annu. Rev. Mar. Sci. 9, 205–229. doi: 10.1146/annurev-marine-010816-060409
Law, K. L., Starr, N., Siegler, T. R., Jambeck, J. R., Mallos, N. J., and Leonard, G. H. (2020). The United States' contribution of plastic waste to land and ocean. Sci. Adv. 6:eabd0288. doi: 10.1126/sciadv.abd0288
Lázaro, C., Fernandes, M. J., Santos, A. M. P., and Oliveira, P. (2005). Seasonal and interannual variability of surface circulation in the Cape Verde region from 8 years of merged T/P and ERS-2 altimeter data. Rem. Sens. Environ. 98, 45–62. doi: 10.1016/j.rse.2005.06.005
Lazier, J. R. N., and Wright, D. G. (1993). Annual velocity variations in the Labrador Current. J. Phys. Oceanogr. 23, 659–678. doi: 10.1175/1520-0485(1993)023<0659:AVVITL>2.0.CO;2
Lebreton, L., Egger, M., and Slat, B. (2019). A global mass budget for positively buoyant macroplastic debris in the ocean. Sci. Rep. 9:12922. doi: 10.1038/s41598-019-49413-5
Lebreton, L., Slat, B., Ferrari, F., Sainte-Rose, B., Aitken, J., Marthouse, R., et al. (2018). Evidence that the Great Pacific Garbage Patch is rapidly accumulating plastic. Sci. Rep. 8:4666. doi: 10.1038/s41598-018-22939-w
Lebreton, L. C., Greer, S. D., and Borrero, J. C. (2012). Numerical modelling of floating debris in the world's oceans. Mar. Pollut. Bull. 64, 653–661. doi: 10.1016/j.marpolbul.2011.10.027
Lellouche, J. M., Greiner, E., Le Galloudec, O., Garric, G., Regnier, C., Drevillon, M., et al. (2018). Recent updates to the Copernicus Marine Service global ocean monitoring and forecasting real-time 1/12° high-resolution system. Ocean Sci. 14, 1093–1126. doi: 10.5194/os-14-1093-2018
Loulad, S., Houssa, R., Rhinane, H., Boumaaz, A., and Benazzouz, A. (2017). Spatial distribution of marine debris on the seafloor of Moroccan waters. Mar. Pollut. Bull. 124, 303–313. doi: 10.1016/j.marpolbul.2017.07.022
Lumpkin, R., and Centurioni, L. (2019). Global Drifter Program Quality-Controlled 6-Hour Interpolated Data From Ocean Surface Drifting Buoys. NOAA National Centers for Environmental Information. Dataset. Available online at: https://doi.org/10.25921/7ntx-z961 (accessed July 11, 2020).
Lumpkin, R., Grodsky, S. A., Centurioni, L., Rio, M. H., Carton, J. A., and Lee, D. (2013). Removing spurious low-frequency variability in drifter velocities. J. Atmos. Ocean. Technol. 30, 353–360. doi: 10.1175/JTECH-D-12-00139.1
Lumpkin, R., Özgökmen, T., and Centurioni, L. (2017). Advances in the application of surface drifters. Annu. Rev. Mar. Sci. 9, 59–81. doi: 10.1146/annurev-marine-010816-060641
Lumpkin, R., and Pazos, M. (2007). “Measuring surface currents with Surface Velocity Program drifters: the instruments, its data and some recent results,” in Lagrangian Analysis and Prediction of Coastal and Ocean Dynamics, eds A. Griffa, A. D. Kirwan, A. J. Mariano, T. Özgökmen, and H. T. Rossby (Cambridge, MA: Cambridge University Press), 1–56. doi: 10.1017/CBO9780511535901.003
Martins, C. S., Hamann, M., and Fiúza, A. F. (2002). Surface circulation in the eastern North Atlantic, from drifters and altimetry. J. Geophys. Res. Oceans 107, 10-1–10-22. doi: 10.1029/2000JC000345
Matsuguma, Y., Takada, H., Kumata, H., Kanke, H., Sakurai, S., Suzuki, T., et al. (2017). Microplastics in sediment cores from Asia and Africa as indicators of temporal trends in plastic pollution. Archiv. Environ. Contamin. Toxicol. 73, 230–239. doi: 10.1007/s00244-017-0414-9
Maximenko, N., Hafner, J., Kamachi, M., and MacFadyen, A. (2018). Numerical simulations of debris drift from the Great Japan Tsunami of 2011 and their verification with observational reports. Mar. Pollut. Bull. 132, 5–25. doi: 10.1016/j.marpolbul.2018.03.056
Maximenko, N., Hafner, J., and Niiler, P. (2012). Pathways of marine debris derived from trajectories of Lagrangian drifters. Mar. Pollut. Bull. 65, 51–62. doi: 10.1016/j.marpolbul.2011.04.016
McWilliams, M., Liboiron, M., and Wiersma, Y. (2018). Rocky shoreline protocols miss microplastics in marine debris surveys (Fogo Island, Newfoundland and Labrador). Mar. Pollut. Bull. 129, 480–486. doi: 10.1016/j.marpolbul.2017.10.018
Mittelstaedt, E. (1983). The upwelling area off Northwest Africa—a description of phenomena related to coastal upwelling. Prog. Oceanogr. 12, 307–331. doi: 10.1016/0079-6611(83)90012-5
Mittelstaedt, E. (1991). The ocean boundary along the northwest African coast: circulation and oceanographic properties at the sea surface. Prog. Oceanogr. 26, 307–355. doi: 10.1016/0079-6611(91)90011-A
Monteiro, R. C., Ivar do Sul, J. A., and Costa, M. F. (2018). Plastic pollution in islands of the Atlantic Ocean. Environ. Pollut. 238, 103–110. doi: 10.1016/j.envpol.2018.01.096
Morét-Ferguson, S., Law, K. L., Proskurowski, G., Murphy, E. K., Peacock, E. E., and Reddy, C. M. (2010). The size, mass, and composition of plastic debris in the western North Atlantic Ocean. Mar. Pollut. Bull. 60, 1873–1878. doi: 10.1016/j.marpolbul.2010.07.020
Neumann, D., Callies, U., and Matthies, M. (2014). Marine litter ensemble transport simulations in the southern North Sea. Mar. Pollut. Bull. 86, 219–228. doi: 10.1016/j.marpolbul.2014.07.016
Niiler, P. P., Sybrandy, A. S., Bi, K., Poulain, P. M., and Bitterman, D. (1995). Measurements of the water-following capability of holey-sock and TRISTAR drifters. Deep Sea Res. I 42, 1951–1955, 1957–1964. doi: 10.1016/0967-0637(95)00076-3
Nollkaemper, A. (1994). Land-based discharges of marine debris: from local to global regulation. Mar. Pollut. Bull. 28, 649–652. doi: 10.1016/0025-326X(94)90299-2
Ohde, T., and Siegel, H. (2010). Biological response to coastal upwelling and dust deposition in the area off Northwest Africa. Contin. Shelf Res. 30, 1108–1119. doi: 10.1016/j.csr.2010.02.016
Onink, V., Wichmann, D., Delandmeter, P., and Sebille, E. (2019). The role of Ekman Currents, geostrophy, and stokes drift in the accumulation of floating microplastic. J. Geophys. Res. Oceans 124, 1474–1490. doi: 10.1029/2018JC014547
Pabortsava, K., and Lampitt, R. S. (2020). High concentrations of plastic hidden beneath the surface of the Atlantic Ocean. Nat. Commun. 11:4073. doi: 10.1038/s41467-020-17932-9
Pereiro, D., Souto, C., and Gago, J. (2018). Calibration of a marine floating litter transport model. J. Oper. Oceanogr. 11, 125–133. doi: 10.1080/1755876X.2018.1470892
Pérez, F. F., Castro, C. G., Álvarez-Salgado, X. A., and Ríos, A. F. (2001). Coupling between the Iberian basin–scale circulation and the Portugal boundary current system: a chemical study. Deep Sea Res. I 48, 1519–1533. doi: 10.1016/S0967-0637(00)00101-1
Pham, C. K., Gomes-Pereira, J. N., Isidro, E. J., Santos, R. S., and Morato, T. (2013). Abundance of litter on Condor seamount (Azores, Portugal, Northeast Atlantic). Deep Sea Res. II 98, 204–208. doi: 10.1016/j.dsr2.2013.01.011
Pham, C. K., Pereira, J. M., Frias, J. P., Ríos, N., Carriço, R., Juliano, M., et al. (2020). Beaches of the Azores archipelago as transitory repositories for small plastic fragments floating in the North-East Atlantic. Environ. Pollut. 263:114494. doi: 10.1016/j.envpol.2020.114494
Pieper, C., Magalhães Loureiro, C., Law, K. L., Amaral-Zettler, L. A., Quintino, V., Rodrigues, A. M., et al. (2020). Marine litter footprint in the Azores Islands: a climatological perspective. Sci. Total Environ. 761:143310. doi: 10.1016/j.scitotenv.2020.143310
Provencher, J. F., Vermaire, J. C., Avery-Gomm, S., Braune, B. M., and Mallory, M. L. (2018). Garbage in guano? Microplastic debris found in faecal precursors of seabirds known to ingest plastics. Sci. Total Environ. 644, 1477–1484. doi: 10.1016/j.scitotenv.2018.07.101
Prunier, J., Maurice, L., Perez, E., Gigault, J., Pierson Wickmann, A. C., Davranche, M., et al. (2019). Trace metals in polyethylene debris from the North Atlantic subtropical gyre. Environ. Pollut. 245, 371–379. doi: 10.1016/j.envpol.2018.10.043
Ramalho, R. A. S. (2011). Building the Cape Verde Islands. Berlin; Heidelberg: Springer Berlin Heidelberg.
Reisser, J., Shaw, J., Wilcox, C., Hardesty, B. D., Proietti, M., Thums, M., et al. (2013). Marine plastic pollution in waters around Australia: characteristics, concentrations, and pathways. PLoS ONE 8:e80466. doi: 10.1371/journal.pone.0080466
Reisser, J., Slat, B., Noble, K., Du Plessis, K., Epp, M., Proietti, M., et al. (2015). The vertical distribution of buoyant plastics at sea: an observational study in the North Atlantic Gyre. Biogeosciences 12, 1249–1256. doi: 10.5194/bg-12-1249-2015
Ríos, N., Frias, J. P., Rodríguez, Y., Carriço, R., Garcia, S. M., Juliano, M., et al. (2018). Spatio-temporal variability of beached macro-litter on remote islands of the North Atlantic. Mar. Pollut. Bull. 133, 304–311. doi: 10.1016/j.marpolbul.2018.05.038
Robinson, J., New, A. L., Popova, E. E., Srokosz, M. A., and Yool, A. (2017). Far-field connectivity of the UK's four largest marine protected areas: four of a kind? Earths Future 5, 475–494. doi: 10.1002/2016EF000516
Rochman, C. M., Hoh, E., Hentschel, B. T., and Kaye, S. (2013). Long-term field measurement of sorption of organic contaminants to five types of plastic pellets: implications for plastic marine debris. Environ. Sci. Technol. 47, 1646–1654. doi: 10.1021/es303700s
Rodríguez, Y., and Pham, C. K. (2017). Marine litter on the seafloor of the Faial-Pico Passage, Azores Archipelago. Mari. Pollut. Bull. 116, 448–453. doi: 10.1016/j.marpolbul.2017.01.018
Rodríguez, Y., Ressurreição, A., and Pham, C. K. (2020). Socio-economic impacts of marine litter for remote oceanic islands: the case of the Azores. Mar. Pollut. Bull. 160:111631. doi: 10.1016/j.marpolbul.2020.111631
Ryan, P. G., Dilley, B. J., Ronconi, R. A., and Connan, M. (2019). Rapid increase in Asian bottles in the South Atlantic Ocean indicates major debris inputs from ships. Proc. Natl. Acad. Sci. U.S.A. 116, 20892–20897. doi: 10.1073/pnas.1909816116
Ryan, P. G., Moore, C. J., Van Franeker, J. A., and Moloney, C. L. (2009). Monitoring the abundance of plastic debris in the marine environment. Philos. Trans. R. Soc. B Biol. Sci. 364, 1999–2012. doi: 10.1098/rstb.2008.0207
Sá, S., Bastos-Santos, J., Araújo, H., Ferreira, M., Duro, V., Alves, F., et al. (2016). Spatial distribution of floating marine debris in offshore continental Portuguese waters. Mar. Pollut. Bull. 104, 269–278. doi: 10.1016/j.marpolbul.2016.01.011
Sala, I., Caldeira, R. M. A., Estrada-Allis, S. N., Froufe, E., and Couvelard, X. (2013). Lagrangian transport pathways in the northeast Atlantic and their environmental impact. Limnol. Oceanogr. 3, 40–60. doi: 10.1215/21573689-2152611
Sala, I., Harrison, C. S., and Caldeira, R. M. (2016). The role of the Azores Archipelago in capturing and retaining incoming particles. J. Mar. Syst. 154, 146–156. doi: 10.1016/j.jmarsys.2015.10.001
Sangrà, P., Pascual, A., Rodríguez-Santana, Á., Machín, F., Mason, E., McWilliams, J. C., et al. (2009). The Canary Eddy Corridor: a major pathway for long-lived eddies in the subtropical North Atlantic. Deep Sea Res. I 56, 2100–2114. doi: 10.1016/j.dsr.2009.08.008
Schmidt, N., Fauvelle, V., Ody, A., Castro-Jiménez, J., Jouanno, J., Changeux, T., et al. (2019). The Amazon river: a major source of organic plastic additives to the tropical North Atlantic? Environ. Sci. Technol. 53, 7513–7521. doi: 10.1021/acs.est.9b01585
Schütte, F., Brandt, P., and Karstensen, J. (2016). Occurrence and characteristics of mesoscale eddies in the tropical northeastern Atlantic Ocean. Ocean Sci. 12, 663–685. doi: 10.5194/os-12-663-2016
Spalding, M. D., Fox, H. E., Allen, G. R., Davidson, N., Ferdaña, Z. A., Finlayson, M., et al. (2007). Marine ecoregions of the world: a bioregionalization of coastal and shelf areas. BioScience 57, 573–583. doi: 10.1641/B570707
Sterl, M. F., Delandmeter, P., and van Sebille, E. (2020). Influence of barotropic tidal currents on transport and accumulation of floating microplastics in the global open ocean. J. Geophys. Res. Oceans 125:e2019JC015583. doi: 10.1029/2019JC015583
Stramma, L. (1984). Geostrophic transport in the Warm Water Sphere of the eastern subtropical North Atlantic. J. Mar. Res. 42, 537–558. doi: 10.1357/002224084788506022
Stramma, L., and Schott, F. (1999). The mean flow field of the tropical Atlantic Ocean. Deep Sea Res. II 46, 279–303. doi: 10.1016/S0967-0645(98)00109-X
Stramma, L., and Siedler, G. (1988). Seasonal changes in the North Atlantic subtropical gyre. J. Geophys. Res. 93:8111. doi: 10.1029/JC093iC07p08111
Syakti, A. D., Bouhroum, R., Hidayati, N. V., Koenawan, C. J., Boulkamh, A., Sulistyo, I., et al. (2017). Beach macro-litter monitoring and floating microplastic in a coastal area of Indonesia. Mar. Pollut. Bull. 122, 217–225. doi: 10.1016/j.marpolbul.2017.06.046
The WaveWatch III Development Group (2016). User Manual and System Documentation of Wavewatch III Version 5.16. Technical Report 329, NOAA/NWS/NCEP/MMAB, College Park, MD, United States.
Thiel, M., Hinojosa, I. A., Miranda, L., Pantoja, J. F., Rivadeneira, M. M., and Vásquez, N. (2013). Anthropogenic marine debris in the coastal environment: a multi-year comparison between coastal waters and local shores. Mar. Pollut. Bull. 71, 307–316. doi: 10.1016/j.marpolbul.2013.01.005
Turra, A., Manzano, A. B., Dias, R. J. S., Mahiques, M. M., Barbosa, L., Balthazar-Silva, D., et al. (2015). Three-dimensional distribution of plastic pellets in sandy beaches: shifting paradigms. Sci. Rep. 4:4435. doi: 10.1038/srep04435
Unger, A., and Harrison, N. (2016). Fisheries as a source of marine debris on beaches in the United Kingdom. Mar. Pollut. Bull. 107, 52–58. doi: 10.1016/j.marpolbul.2016.04.024
Van Camp, L., Nykjaer, L., Mittelstaedt, E., and Schlittenhardt, P. (1991). Upwelling and boundary circulation off Northwest Africa as depicted by infrared and visible satellite observations. Prog. Oceanogr. 26, 357–402. doi: 10.1016/0079-6611(91)90012-B
van der Mheen, M., van Sebille, E., and Pattiaratchi, C. (2020). Beaching patterns of plastic debris along the Indian Ocean rim. Ocean Sci. Discuss. 16, 1–31. doi: 10.5194/os-2020-50
van Gennip, S. J., Dewitte, B., Garçon, V., Thiel, M., Popova, E., Drillet, Y., et al. (2019). In search for the sources of plastic marine litter that contaminates the Easter Island Ecoregion. Sci. Rep. 9:19662. doi: 10.1038/s41598-019-56012-x
van Sebille, E., Aliani, S., Law, K. L., Maximenko, N., Alsina, J. M., Bagaev, A., et al. (2020). The physical oceanography of the transport of floating marine debris. Environ. Res. Lett. 15:023003. doi: 10.1088/1748-9326/ab6d7d
van Sebille, E., Delandmeter, P., Schofield, J., Hardesty, D., Jones, J., and Donnelly, A. (2019). Basin-scale sources and pathways of microplastic that ends up in the Galápagos Archipelago. Ocean Sci. Discuss. 15, 1–15. doi: 10.5194/os-2019-37
van Sebille, E., Griffies, S. M., Abernathey, R., Adams, T. P., Berloff, P., Biastoch, A., et al. (2018). Lagrangian ocean analysis: fundamentals and practices. Ocean Model. 121, 49–75. doi: 10.1016/j.ocemod.2017.11.008
van Sebille, E., Wilcox, C., Lebreton, L., Maximenko, N., Hardesty, B. D., van Franeker, J. A., et al. (2015). A global inventory of small floating plastic debris. Environ. Res. Lett. 10:124006. doi: 10.1088/1748-9326/10/12/124006
Vianello, A., Boldrin, A., Guerriero, P., Moschino, V., Rella, R., Sturaro, A., et al. (2013). Microplastic particles in sediments of Lagoon of Venice, Italy: first observations on occurrence, spatial patterns and identification. Estuar. Coast. Shelf Sci. 130, 54–61. doi: 10.1016/j.ecss.2013.03.022
Wichmann, D., Delandmeter, P., and Sebille, E. (2019). Influence of near–surface currents on the global dispersal of marine microplastic. J. Geophys. Res. Oceans 124, 6086–6096. doi: 10.1029/2019JC015328
Yu, X., Ladewig, S., Bao, S., Toline, C. A., Whitmire, S., and Chow, A. T. (2018). Occurrence and distribution of microplastics at selected coastal sites along the southeastern United States. Sci. Total Environ. 613–614, 298–305. doi: 10.1016/j.scitotenv.2017.09.100
Zhang, H. (2017). Transport of microplastics in coastal seas. Estuar. Coast. Shelf Sci. 199, 74–86. doi: 10.1016/j.ecss.2017.09.032
Keywords: Lagrangian transport, Azores, Madeira, Canary Islands, Cabo Verde, North Atlantic subtropical gyre, surface drifting buoys
Citation: Cardoso C and Caldeira RMA (2021) Modeling the Exposure of the Macaronesia Islands (NE Atlantic) to Marine Plastic Pollution. Front. Mar. Sci. 8:653502. doi: 10.3389/fmars.2021.653502
Received: 14 January 2021; Accepted: 15 March 2021;
Published: 30 April 2021.
Edited by:
Frédéric Cyr, Fisheries and Oceans Canada, CanadaReviewed by:
Erik Van Sebille, Utrecht University, NetherlandsAnnalisa Griffa, National Research Council (CNR), Italy
Copyright © 2021 Cardoso and Caldeira. This is an open-access article distributed under the terms of the Creative Commons Attribution License (CC BY). The use, distribution or reproduction in other forums is permitted, provided the original author(s) and the copyright owner(s) are credited and that the original publication in this journal is cited, in accordance with accepted academic practice. No use, distribution or reproduction is permitted which does not comply with these terms.
*Correspondence: Cláudio Cardoso, Y2xhdWRpby5jYXJkb3NvQG9vbS5hcmRpdGkucHQ=