 Pilar A. Haye
 Xavier Turon
 Nicolás I. Segovia
- 1Departamento de Biología Marina, Facultad de Ciencias de Mar, Universidad Católica del Norte, Coquimbo, Chile
- 2Instituto Milenio en Socio-ecología Costera (SECOS), Santiago, Chile
- 3Centre for Advanced Studies of Blanes (CEAB, CSIC), Blanes, Spain
- 4Instituto de Ecología y Biodiversidad (IEB), Santiago, Chile
Spatial and temporal variation of environmental parameters can affect dispersal, recruitment and population persistence of marine benthic species. Studies including inter-annual comparisons of genetic structure often indicate high/moderate temporal heterogeneity in marine invertebrates, which may be a prevailing pattern. This suggests that temporal studies are necessary to understand the dynamics of marine metapopulations. In this study, we analyzed the spatio-temporal genetic structure of the ascidian Pyura chilensis, a low dispersal sessile marine species endemic from the Southeast Pacific coast and highly demanded for human consumption. We sequenced a fragment of the mitochondrial gene Cytochrome Oxidase I (COI) from 1,005 individuals of six locations (30–40 individuals per site and year) spanning a wide latitudinal range (24°–42°S) and sampled over 5 years (2012, 2014, 2015, 2016, and 2017). The genetic structure of COI indicates the presence of three monophyletic lineages (haplogroups 1–3) previously described for the species, being one of them highly divergent and geographically restricted (~39°S, Los Molinos). Considering the whole dataset, a picture of strong spatial differentiation but temporal stability emerged in Pyura chilensis. However, detailed studies of the two main lineages revealed important differences in the extent of spatio-temporal variation. Analyses using haplotype frequencies sorted by site and year showed that, for haplogroup 1, genetic variation was explained mainly by differences between sites, while for haplogroup 2 differences between years were prevailing. Haplogroup 3 was restricted to the most southern sites, and also showed inter-annual variability in its frequency. These results point to disparate patterns of genetic differentiation, which may reflect different adaptive scope or variation in reproductive and dispersal features and could be a response to extreme events such as El Niño (2015–2016). This work calls for caution when obtaining general trends in species clearly differentiated in lineages, and prompts instead for separate analyses of sub-specific genetic lineages whenever possible.
Introduction
Marine benthic coastal species inhabit an environment that is not only variable geographically but also temporarily (Menge et al., 2003). Heterogeneous environmental factors exert a strong influence on the dispersal, recruitment and population persistence of marine benthic species (Siegel et al., 2008; Marshall et al., 2010). Yet, how much does genetic structure vary in space vs. time in marine invertebrates is a topic rarely investigated (e.g., Calderón et al., 2012; Pineda et al., 2016a; Couvray and Coupé, 2018).
Phylogeographic studies of marine benthic invertebrates have traditionally focused on the spatial genetic structure using one or more molecular markers, revealing that most benthic marine species show genetic structure in their range of distribution, related to different abiotic and biotic features (Weersing and Toonen, 2009; Kelly and Palumbi, 2010; Schiebelhut and Dawson, 2018). Studies that include inter-annual comparisons indicate that temporal variation in the genetic structure of populations is a prevailing pattern in the marine environment (e.g., Virgilio and Abbiati, 2006; Barshis et al., 2011; Quintero-Galvis et al., 2020).
Temporal studies are necessary to better understand the dynamics of marine metapopulations and how genetic diversity is affected by reproductive patterns of local populations (Crowder et al., 2000; Cobben et al., 2011; Ludford et al., 2012). Many factors can promote or suppress local larval retention, thus the degree of reproductive connectivity between populations is variable and stochastic in nature (Johnson, 2004; Siegel et al., 2008), ranging from highly connected populations, to populations that show variable degrees of isolation. Differential settlement and survival of arriving larvae has been widely documented in marine organisms (e.g., Berger et al., 2006; Penney et al., 2006; Vigliola et al., 2007) and can also be strongly affected by oceanographic factors such as coastal circulation and upwelling (Roughgarden et al., 1988; Shanks and Brink, 2005; Barshis et al., 2011).
Studies on temporal genetic structure in ascidians are scarce, and they show contrasting results, ranging from yearly or seasonal fluctuations in genetic composition (Paz et al., 2003; Reem et al., 2012; Caputi et al., 2019) to instances of temporal stability over seasons and years (Pineda et al., 2016a,b). Here, we studied the degree of interannual genetic variation of six local populations of the ascidian Pyura chilensis in the Chilean coast between 24 and 42°S, covering the southern portion of its geographic range of distribution (from 10 to 44°S), with 5 years of sampling. This species is a conspicuous and dominant competitor of hard substrates in the Humboldt Current System (Ambler and Cañete, 1991; Valdivia et al., 2005) and a bioengineer species (Castilla et al., 2004) that is widely distributed in the Southeast Pacific coast (Lancellotti and Vásquez, 2000). It can be therefore considered a keystone species in the shallow sublittoral habitats of these areas. Besides its ecological importance, P. chilensis has been intensively exploited for human consumption (Manríquez and Castilla, 2005).
The spatial genetic structure of P. chilensis was studied by Haye and Muñoz-Herrera (2013) along the same geographic area, and three distinct mitochondrial lineages or haplogroups were found (hereafter Hg1–Hg3); two of them widely distributed (Hg1 and Hg2) and one geographically restricted to the southern area (Hg3; 39°–42°S). The frequency of each haplogroup showed strong geographic variation. On the northernmost location, only the most widespread haplogroup was present (Hg1). In intermediate localities (between 26°S and 36°S) two haplogroups were present simpatrically (Hg1 and Hg2). Finally, in the southern localities these two clades together with the third haplogroup (Hg3) were present. This southern haplogroup (Hg3) was particularly abundant in Los Molinos (39°S). The nuclear gene Elongation Factor 1 alpha (EF1α) did not reveal the same structure in distinct groups as COI, and evidence was found of admixture between the two main haplogroups. Only some of the individuals of the more restricted COI haplogroup (Hg3) were divergent with EF1α. These results indicated that the three haplogroups are not reproductively isolated. The authors suggested that these haplogroups were formed during Pleistocene glacial cycles as a consequence of isolation during glaciations when sea-level fell. In the subsequent interglacial periods, populations could interbreed, resulting in the present day make-up of three divergent mitochondrial, yet not nuclear, lineages. In a follow up study, Segovia et al. (2017) analyzed P. chilensis populations on this same area using genome-wide SNP markers, detecting a strong geographical structure and a divergent nuclear lineage at Los Molinos (likely corresponding to haplogroup Hg3). However, in that work the COI haplotype composition of the studied individuals was not taken into account.
The present study tries to tackle the following main questions: (i) What is the relative importance of the temporal vs. the spatial components of genetic variation in P. chilensis, and (ii) Do the different lineages of P. chilensis have the same spatio-temporal pattern of genetic structure? To answer these questions, we obtained sequences of the COI gene from six local populations of P. chilensis at five time points (2012, 2014, 2015, 2016, and 2017). The data were used to assess the spatial-temporal patterns of genetic diversity in this ecologically and commercially important species.
Methods
Sample Collection
Samples were collected by local fishermen from the Fisheries Management Areas under their jurisdiction in six localities along the coast of Chile: Pan de Azúcar (PA; 26°08′S), Caleta Pajonales (CP; 27°44′S), La Herradura (LH; 29°58′S), Talcahuano (TH; 36°38′S), Los Molinos (LM; 39°50′S) and Ancud (AC; 41°52′S) (Table 1 and Figure 1). Samples of yearlings were taken from the same area of each locality in each year. Sampling locations were selected based on results of Haye and Muñoz-Herrera (2013), and included populations with a priori different proportions of the three mitochondrial haplogroups of Pyura chilensis. Collections were performed in 2014, 2015, 2016, and 2017 which, together with data available from samples collected in 2012 (see Haye and Muñoz-Herrera, 2013), led to five time periods analyzed for temporal comparison of genetic structure.
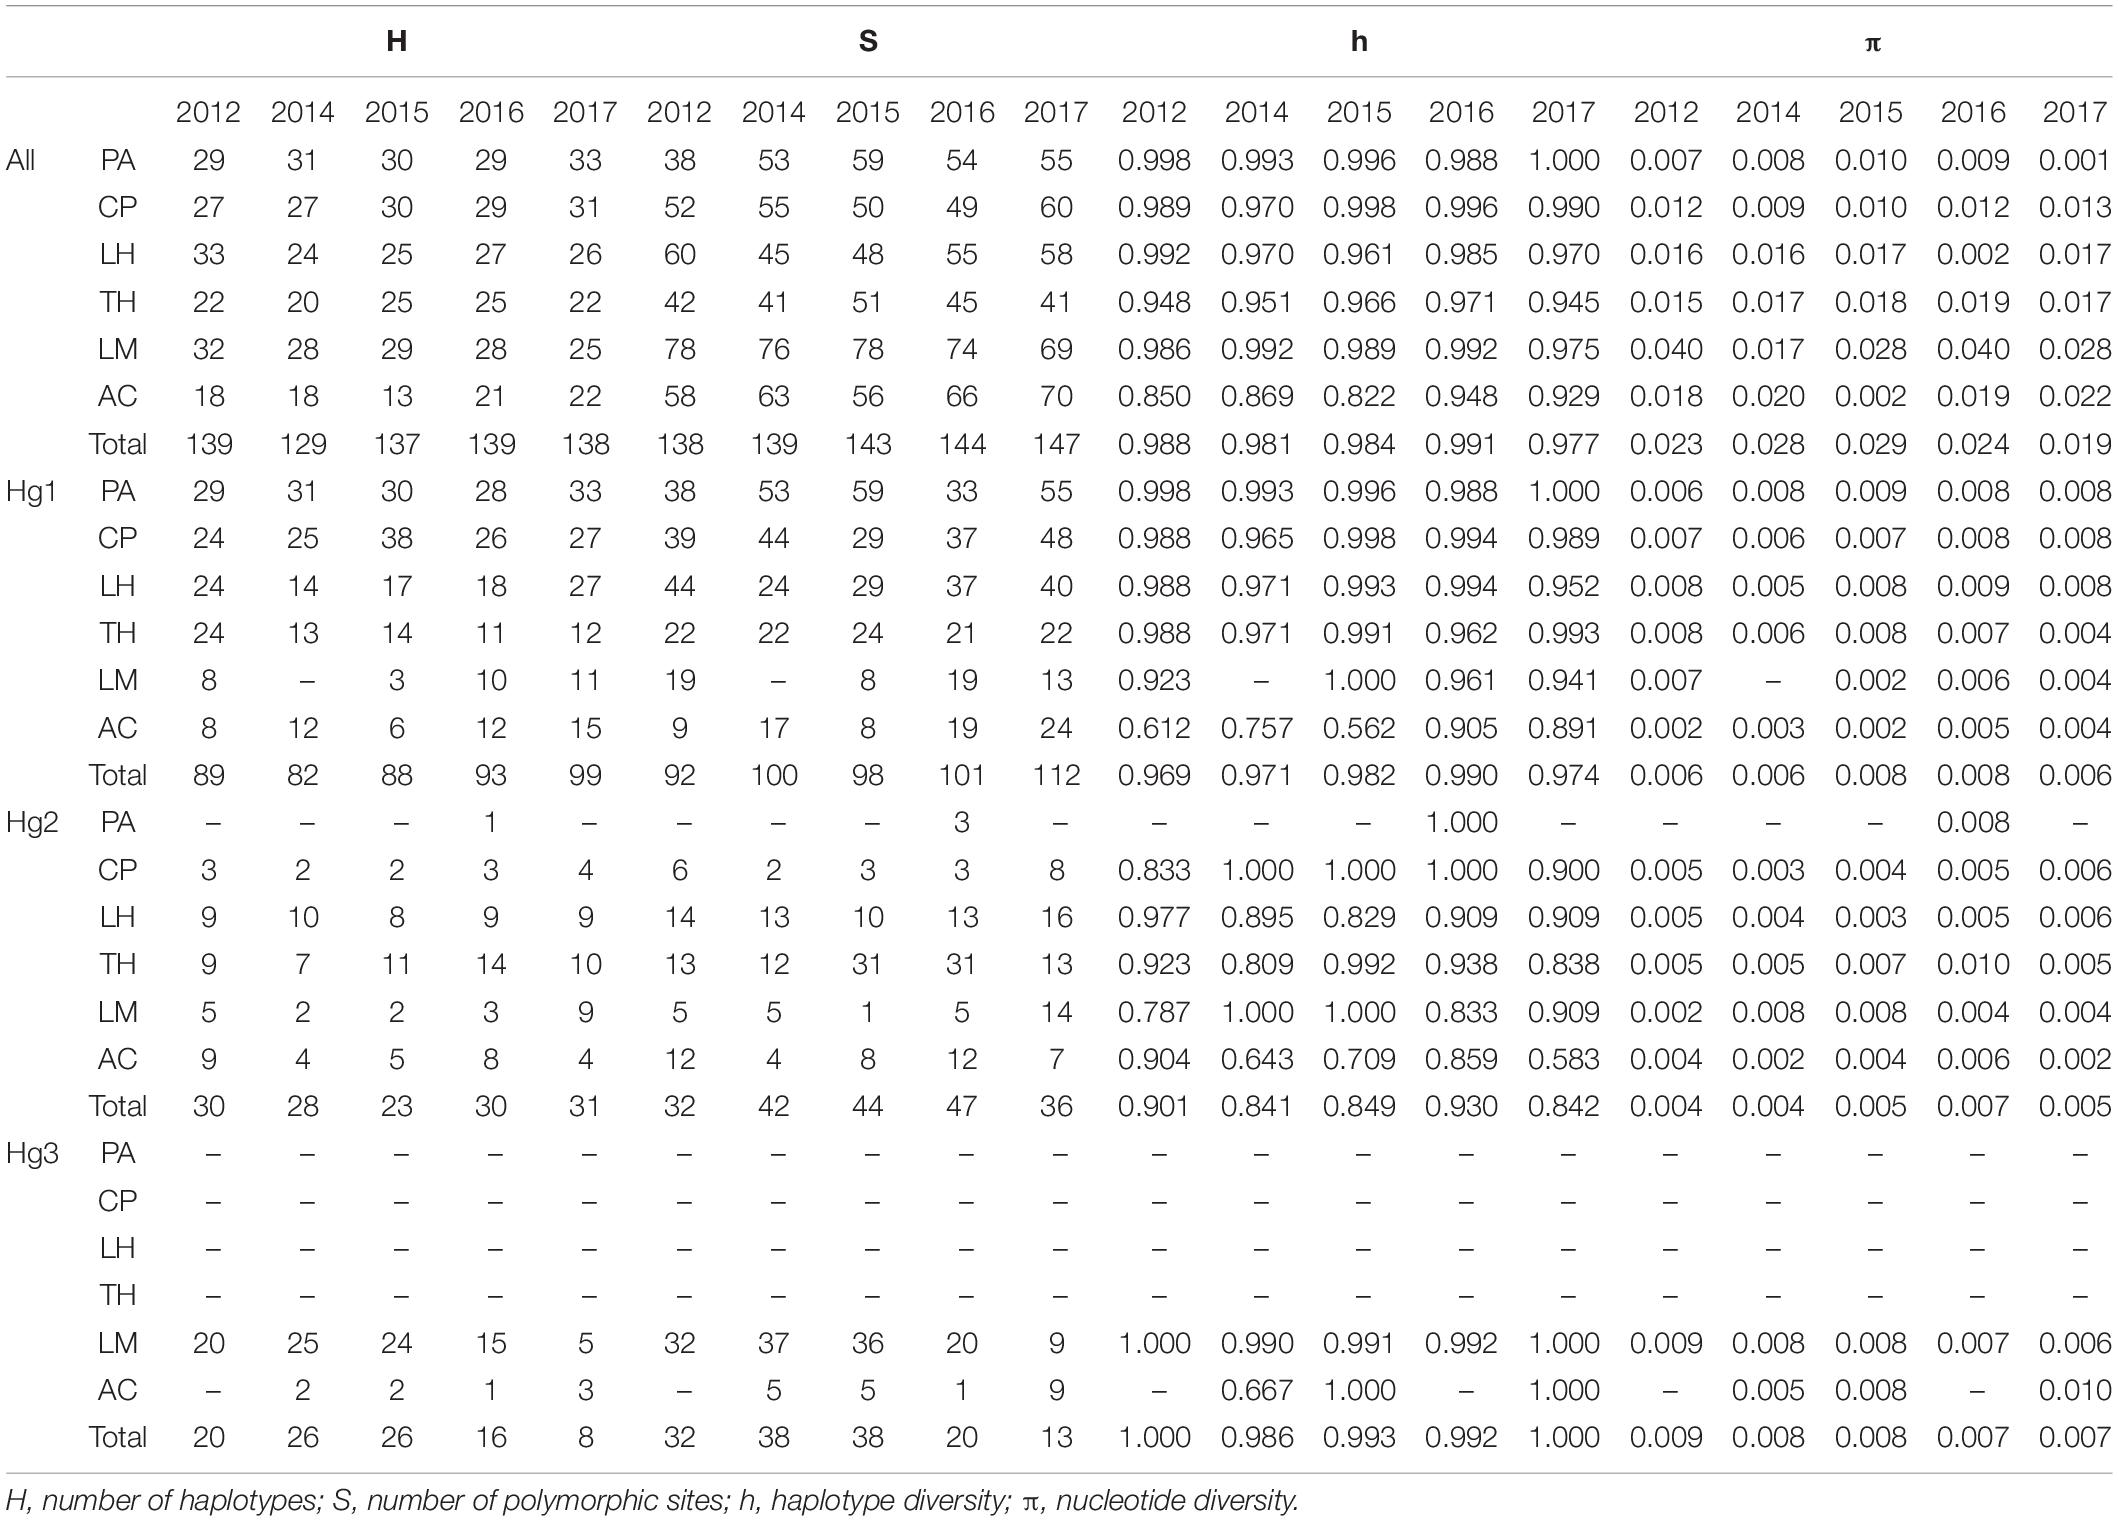
Table 1. Genetic diversity measures for all COI data and for haplogroups 1 2, and 3 (Hg1, Hg2, and Hg3, respectively) of Pyura chilensis from five temporal samples (years 2012, 2014, 2015, 2016, and 2017).
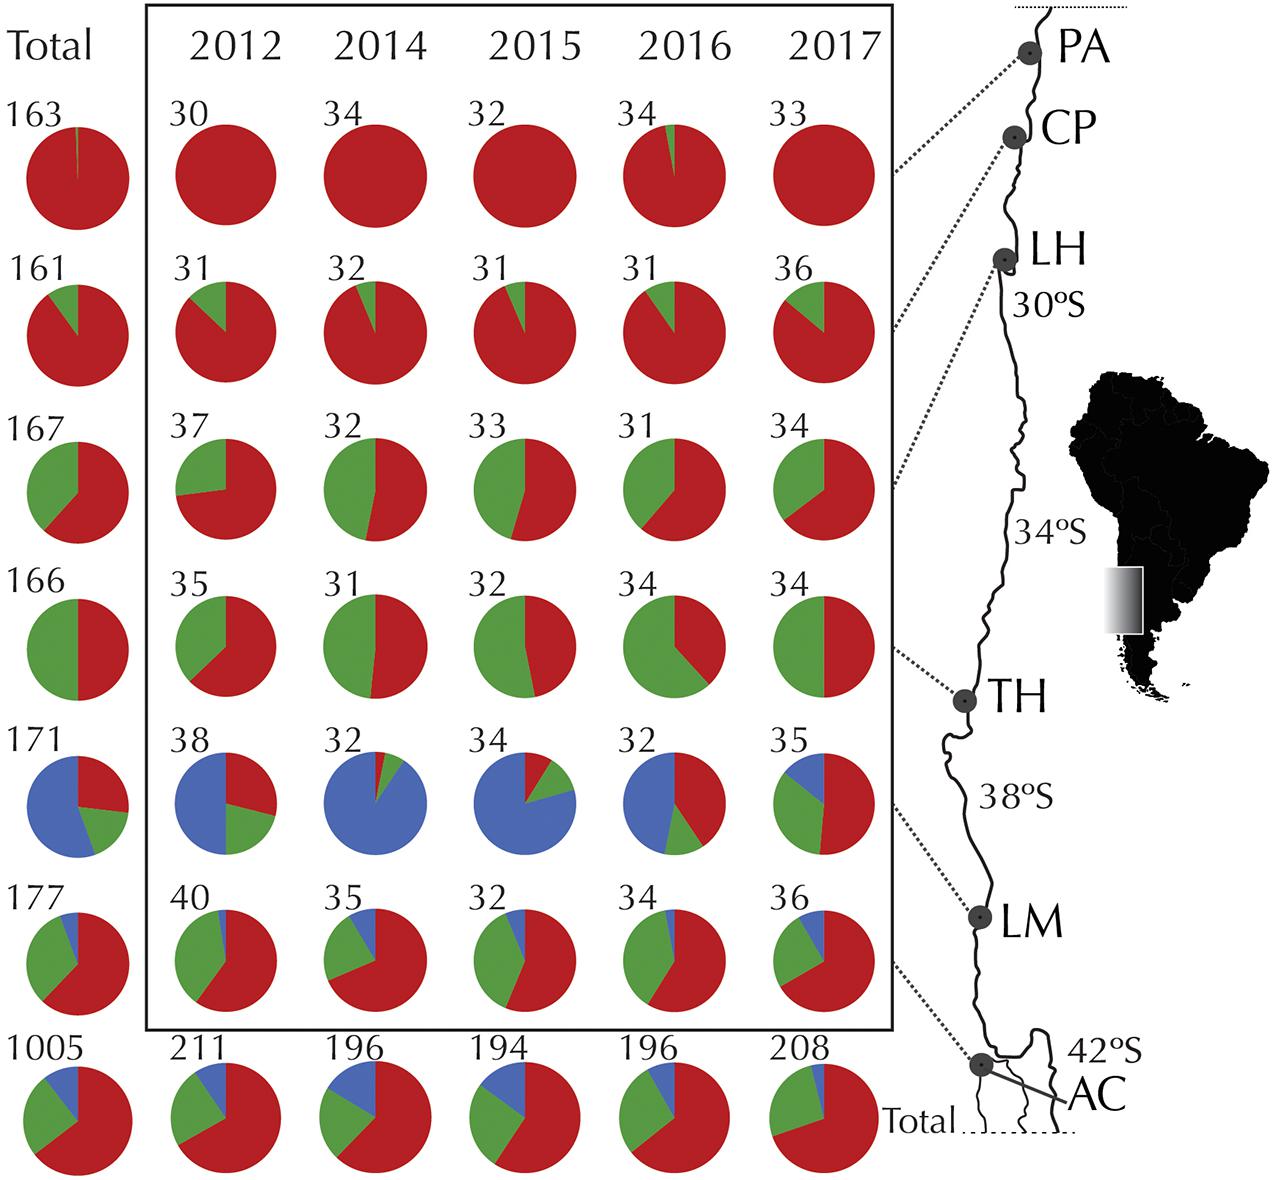
Figure 1. Temporal variation of COI haplogroups of Pyura chilensis. Geographic distribution and relative frequency of COI haplogroups for temporal samples (years 2012, 2014, 2015, 2016, and 2017). Pie charts represent the total number of sequences analyzed, colors represent COI haplogroups (red: Hg1, green: Hg2, blue: Hg3), and numbers by the pies indicate number of individuals analyzed per site per year.
Sampled individuals had a maximum size of 5 cm in order to avoid overlapping generations between samples of different years (Svane and Lundälv, 1982; Valdivia et al., 2005) and all individuals were obtained from clumps separated by at least 2 m. DNA extractions were performed from 25 mg of mantle tissue using the standard phenol-chloroform procedure. Partial sequences of mitochondrial COI gene were obtained using the universal primers HCO-LCO described in Folmer et al. (1994). For both primers, PCRs consisted of 1X PCR buffer, 1.3 Mm of MgCl2, 0.6 μM of each primer, 0.2 mM of each dNTP, 0.03 U μL–1 of Taq polymerase (Fermentas), 1.5 mg mL–1 Bovine Serum Albumin, and 20 ng of DNA template. Cycling conditions consisted of an initial soak of 10 min at 94°C followed by 35 cycles, each of 1 min at 94°C, 1 min at 40°C and 2 min at 72°C, and a final extension of 72°C for 13 min. Resulting sequences were aligned and inspected in the software Geneious R81.
Data Analyses
We determined for each year the frequency of haplogroups per location. Genetic diversity indices (haplotype and nucleotide diversity) were obtained with DnaSP 5.10 (Librado and Rozas, 2009).
To compare and examine the effect of both, spatial and temporal variation in genetic diversity, we used two approximations. First, AMOVA analyses were performed in Arlequin 3.5 (Excoffier and Lischer, 2010) using Years and Sites as a priori grouping, respectively, in order to evaluate the influence of both factors under a hierarchical structure (e.g., variation among sites within years and variation among years within sites). AMOVA was run using the FST estimator of Weir and Cockerham (1984) based on allele frequencies. Second, we carried out a permutation-based multivariate analysis (PERMANOVA) using the Adonis function in the vegan package (Oksanen et al., 2020) in R (R Development Core Team, 2020). With this function, we decomposed the variance for distance matrices using years and sites as crossed factors. We used a Bray-Curtis distance matrix based on haplotype frequencies calculated using vegdist function and transformed using Hellinger Method with the decostand function, in vegan. Significant values were estimated after 10,000 permutations. Both analyses were carried out using the complete dataset and separately for haplogroups Hg1 and Hg2. As haplogroup 3 (Hg3) was spatially restricted to two localities (with most individuals found in Los Molinos), it was not considered for separate analyses.
Population-pairwise (within years) and temporal-pairwise (within sites) differentiation was assessed using FST and Arlequin 3.5. The significance of the values obtained was tested with 10,000 permutations and a correction for multiple comparisons was applied following the false discovery rate (FDR) method described in Benjamini and Yekutieli (2001). As before, these analyses were performed for the complete dataset, and separately for the two main haplogroups (Hg1 and Hg2). To asses temporal stability of genetic differentiation, a congruence among distance matrices (CAMD) test (Legendre and Lapointe, 2004) was performed based on pairwise FST distance matrices between localities for each year. For this analysis, we used the CADM.global and CADM.post functions implemented in the ape package (Paradis and Schliep, 2019) in R, which conducted a permutation test (10,000 permutations) of the congruence of each distance matrix with respect to all the other matrices and then an extended Mantel test with a post hoc correction of Holm were conducted. Mantel values go from 0 to 1, with higher values meaning higher concordance between matrices and, thus, temporal stability. The null hypothesis was complete incongruence among matrices. The alternative hypothesis is that the matrix (year) tested is congruent with at least one other matrix of another year.
Finally, haplotype networks were constructed with the software PopArt v1.72 using a Median-Joining algorithm for each sampling site including all temporal samples.
Results
COI sequences were obtained for a total of 1,005 individuals of Pyura chilensis from six localities (Figure 1) and five time periods (2012, 2014, 2015, 2016, and 2017). The three COI haplogroups that had been described in a previous study of P. chilensis (Haye and Muñoz-Herrera, 2013) were found to have a temporally stable geographic distribution (Figure 1). Haplogroup 1 (Hg1) was found on all sampled locations in all years, and had the widest distributional range of all the haplogroups. Haplogroup 2 (Hg2) was found from Caleta Pajonales (CP) to the south, and was absent only in the northern location Pan de Azúcar (PA, 26°S) in all sampled years with the exception of a single individual in 2016 (Figure 1). As expected, Hg3 was the most restricted haplogroup, present only in the two southern locations, mainly in Los Molinos (LM) and at a much lower frequency in Ancud (AC). Haplogroup frequencies per location showed slight variation between years, with the exception of Los Molinos that showed strong variation between some years (LM, Figure 1). Including all years, a total of 386, 111, and 77 haplotypes were found for Hg1, Hg2, and Hg3, respectively. High haplotype diversity was found at all localities and haplogroups, while nucleotide diversity was low when considering each haplogroup separately (Table 1).
The relative genetic variation explained by sites and years was analyzed with AMOVAs (Table 2 and Figure 2). When comparing the results of years or sites as a priori groupings, we found for the complete dataset that the main factor “among sites” explained a significant amount of the variance (FCT = 0.0030, p = 0.012), while sampling year (among years) did not (FCT = 0.0021, p = 0.116). The same pattern was found for the most frequent haplogroup (Hg1), where 2.52% of the total variance was explained by differences among sites (FCT = 0.0252, p < 0.001) while the temporal component had a negative value (FCT = −0.0022, p = 0.555). Interestingly, this pattern was reversed for Hg2: among year differences explained 4.31% of the total variance and was significant (FCT = 0.0431, p = 0.004), while sites as a priori grouping had a negative percentage of explained variance and non-significant (p = 0.567). When sites or years were nested within each other, more subtle patterns emerged (Table 2). Even if year is not a significant main factor in the complete dataset, the variation among years within sites explains a low but significant amount of variation (FSC = 0.0082, p < 0.0001), indicating that, at least for some localities, temporal variation is significant. This same pattern is found for Hg1. Similarly, for Hg2, while sites as a main factor was not significant, variation between sites within years is (FSC = 0.0310, p = 0.004), indicating a significant spatial component at least in some years. In all cases, most genetic variance was found in the within population component (all percentages of variation explained >92%). In the same page, permutation-based analysis of variance (PERMANOVA) using sites and years as crossed factors showed that sampling site was the most important factor for the complete dataset (F-value = 1.6996, p < 0.001; Table 3) and for the most abundant haplogroup (Hg1) (F-value = 1.5507, p < 0.001). Differences between years, however, were also significant in both cases. For Hg2, on the other hand, this analysis showed that only differences between years were significant (F-value = 2.0873, p < 0.001).
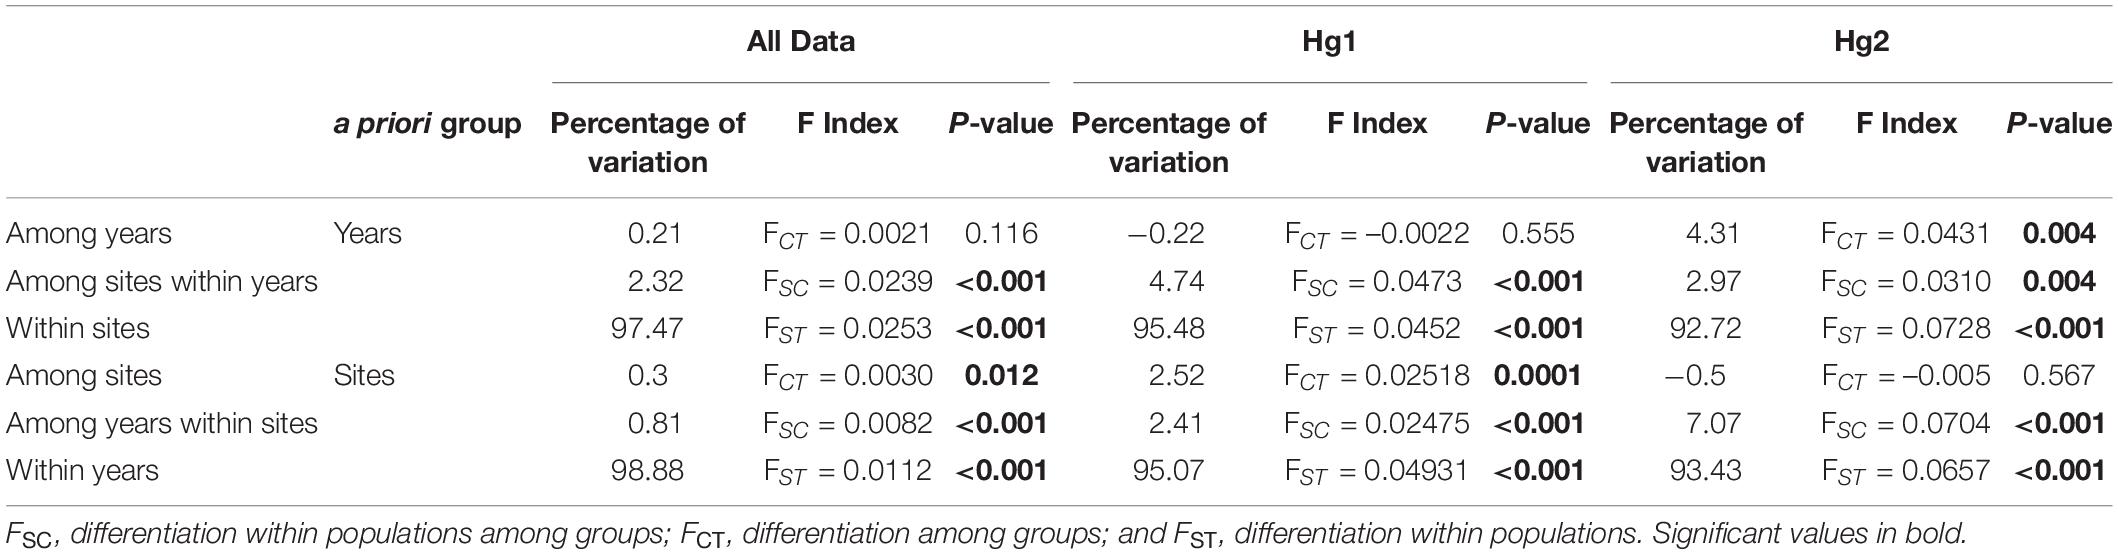
Table 2. Analysis of molecular variance (AMOVA) depicting the percentage of variation explained among groups (years or site), among populations within groups, and within populations for the complete COI dataset, Hg1 and Hg2.
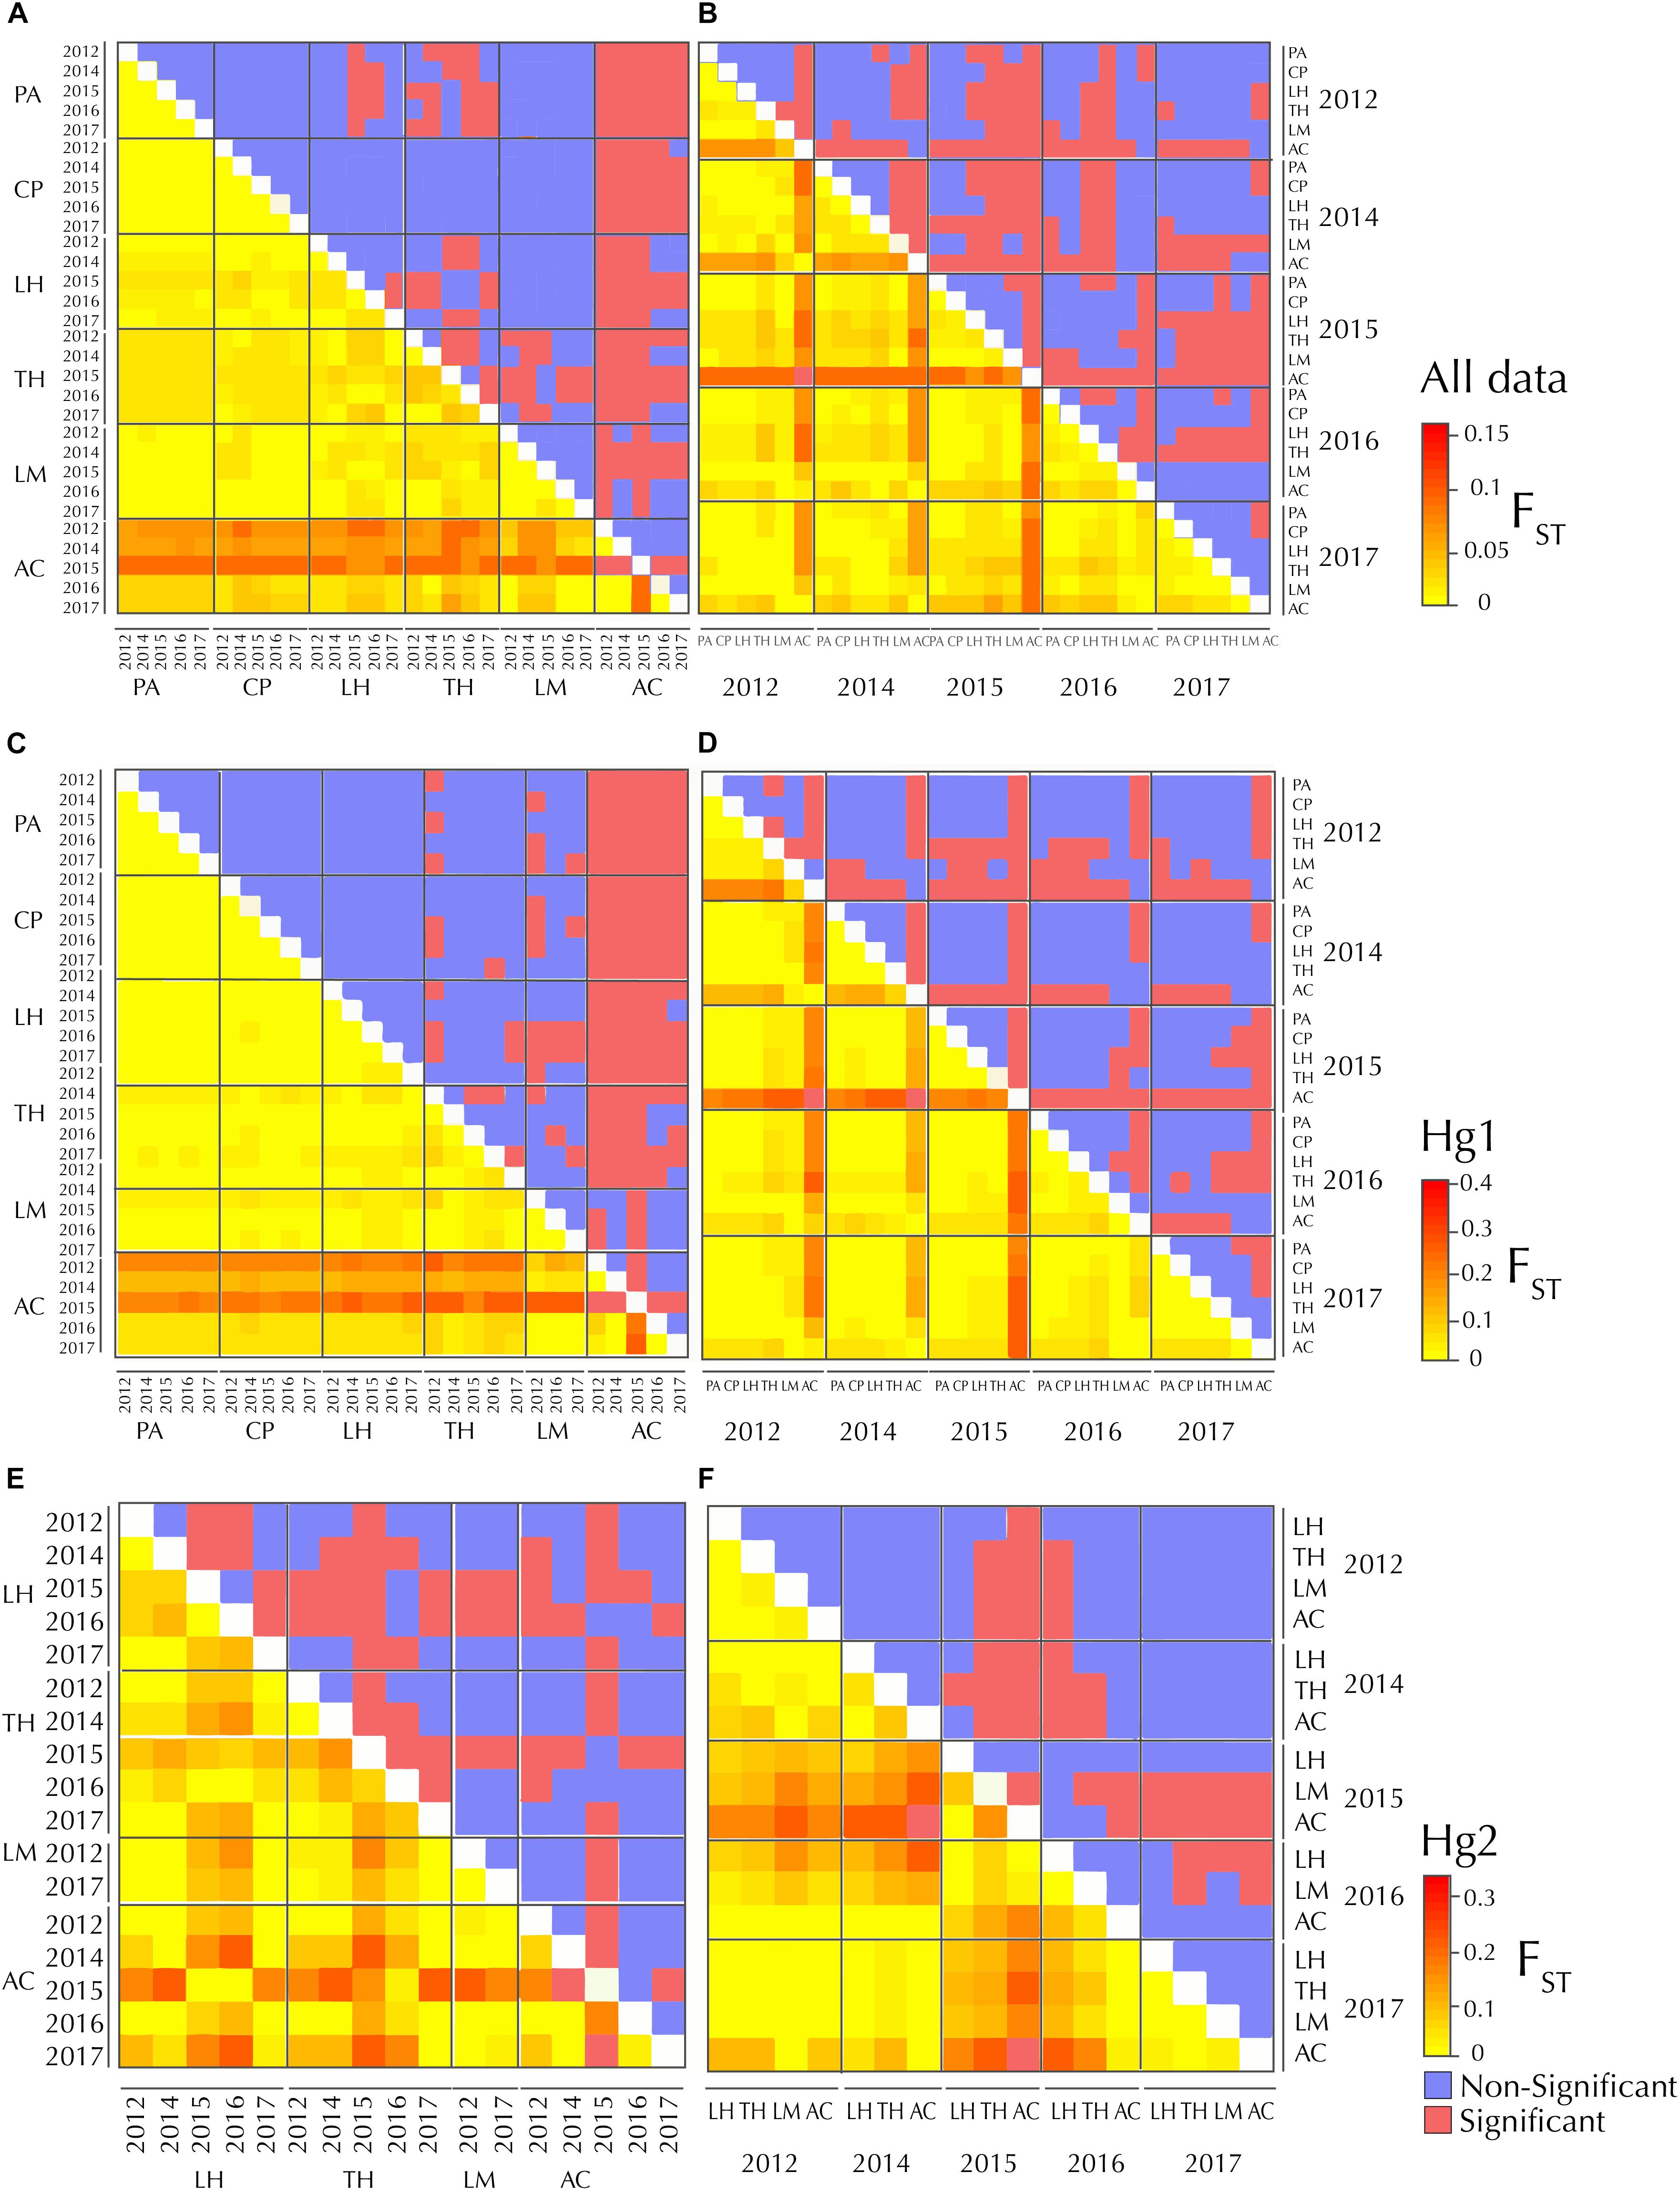
Figure 2. FST heatmaps between sites (left panels) and years (right panels), respectively in Pyura chilensis. Figure shows the representation of the same matrix, (A) with populations sorted by geographic location and (B) sorted by year for the complete dataset (A,B), Hg1 (C,D) and Hg2 (E,F). Lower diagonals display FST values. Upper diagonals show the significance of the FST values (after FDR correction), in red significant values and in blue non-significant values.
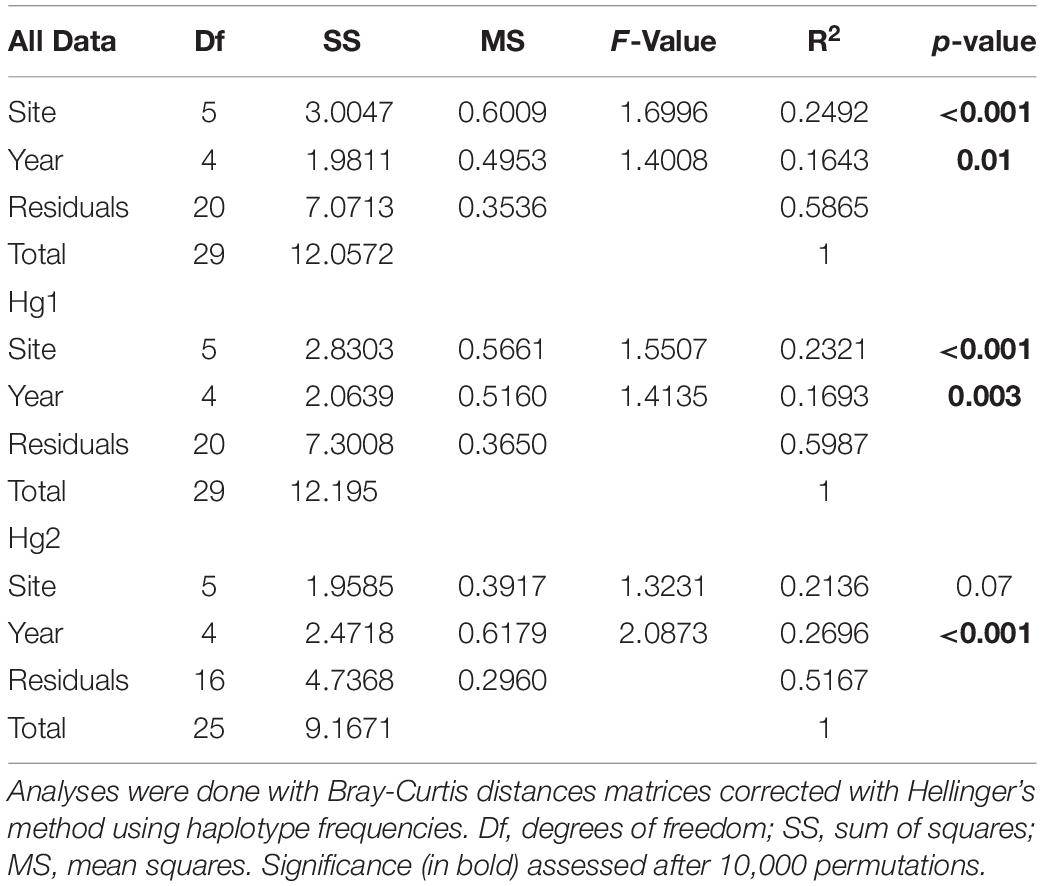
Table 3. Permutation-based multivariate analysis of variance in Pyura chilensis to determine the percentage of variance explained by the effects of sampling sites and year of sampling.
Pairwise FST matrices and heatmaps using haplotype frequencies sorted by site and year showed that, for the complete dataset and Hg1, genetic variation was explained mainly by differences between sites (Figures 2A–D and Table 4) and, particularly for Hg1, most of the significant outcomes involved the comparison between southern locations (TH, LM, and AC). Conversely, for Hg2 non-significant values were found between sites (Table 4) and most variation was explained by differences between years (Figures 2E,F and Table 5), with significant values generally involving comparisons of 2015 and 2016 with other years. These same years showed also significant comparisons for the global dataset and for Hg1, but the FST values were an order of magnitude higher for Hg2 (Table 5). Likewise, in the congruence among distance matrices analysis (CADM) for the complete dataset, the CADM.global function showed a high and significant Kendall coefficient of concordance (W = 0.76, χ2 = 53.47, p = 0.001), indicating overall congruence between distance matrices and, thus, temporal stability. Additionally, a posteriori Mantel correlation values (CADM.post) between each year and the rest of years ranged from 0.63–0.73 being significant for all years (Table 6). For Hg1, the global test also showed a high and significant Kendall coefficient (W = 0.71, χ2 = 50.23, p = 0.001). The a posteriori Mantel correlation values were all >0.6, but were only significant for 2012, 2017 and marginally significant for 2014 (Table 6), indicating that these were the years with higher temporal stability. Interestingly for Hg2, there was a low and non-significant Kendall coefficient (W = 0.19, χ2 = 8.57, p = 0.48), and Mantel correlation mean values ranged from −0.37 to 0.17, being none of them significant (Table 6). This means that, for Hg2, there is a complete incongruence of FST pairwise distance matrices among years, indicating a high temporal variability for this haplogroup.
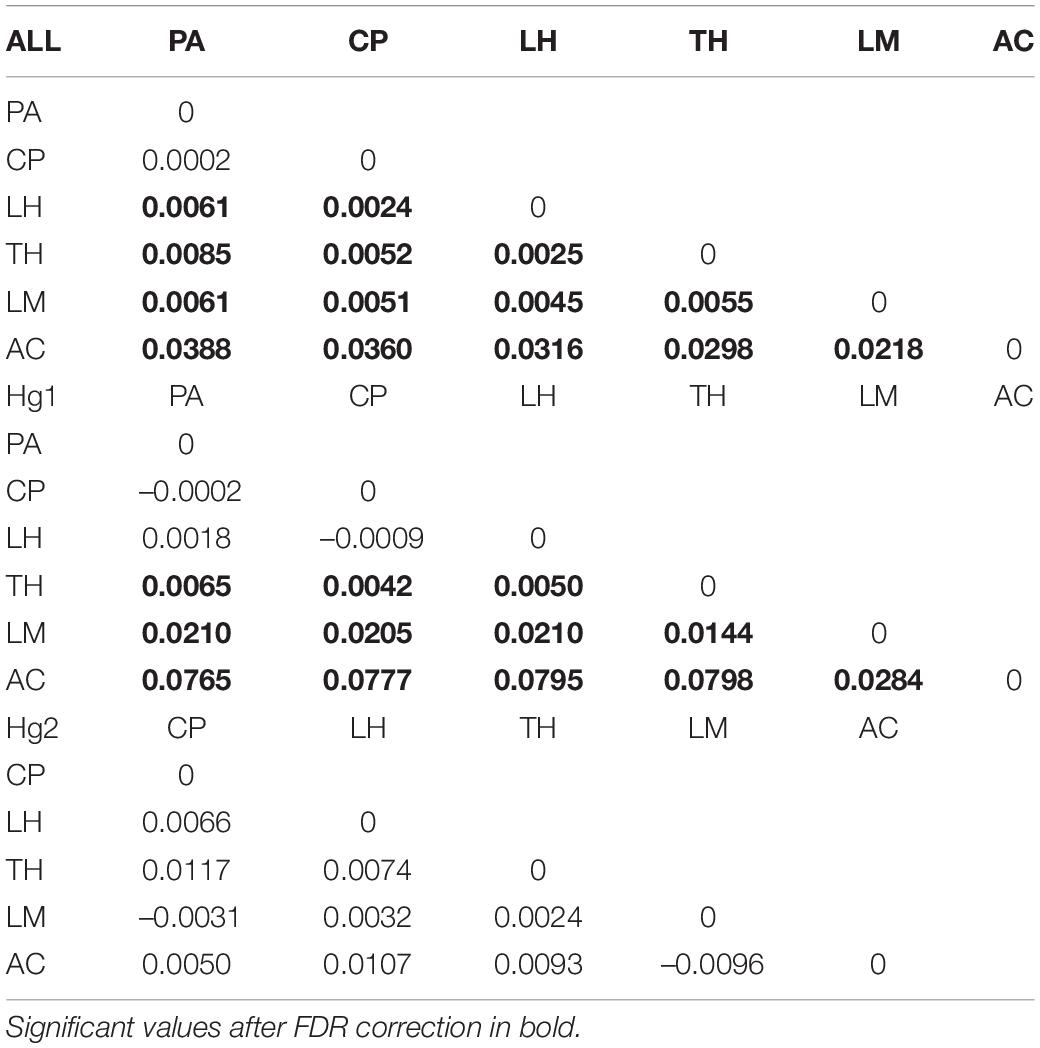
Table 4. Genetic differentiation (FST) values of the complete COI dataset, Hg1 and Hg2 in Pyura chilensis between sites, calculated with haplotype frequencies.
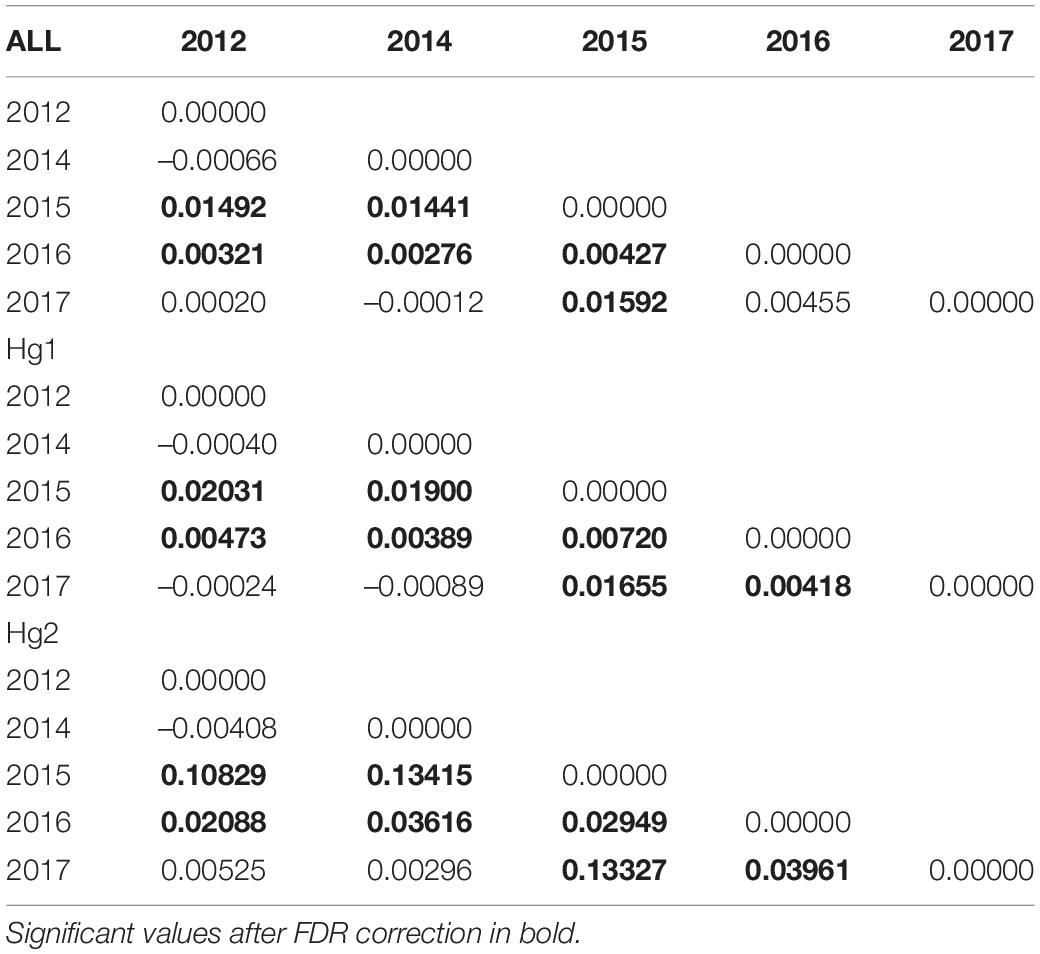
Table 5. Genetic differentiation (FST) values of the complete COI dataset, Hg1 and Hg2 in Pyura chilensis between years, calculated with haplotype frequencies.
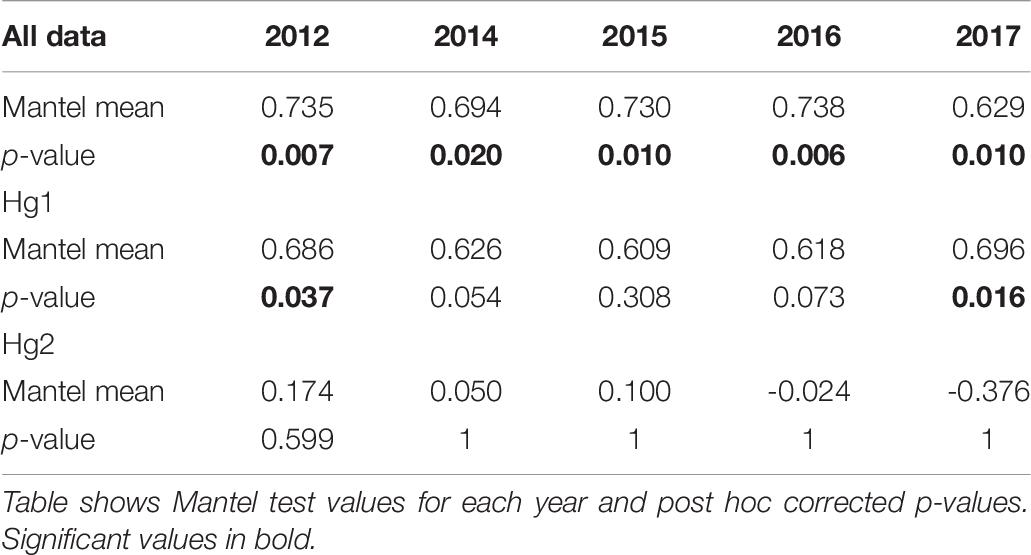
Table 6. Congruence among distance matrices analyses (CADM) comparing the pairwise-FST matrices of each year with the rest of the years in all COI data, Hg1, and Hg2 in Pyura chilensis.
Haplotype networks for each sampling site allowed the evaluation of the relationship between haplotypes and the temporal stability within localities (Figure 3). The networks showed that haplotypes sampled in 2012, 2014, 2017 were similar while those from 2015 and 2016 were often different (Figure 3), forming in general clusters that were separated from central haplotypes of each haplogroup. Similarly, haplotype sharing was common between the years 2012, 2014, 2017, while 2015 and 2016 haplotypes were more commonly shared only among these 2 years (Figure 3).
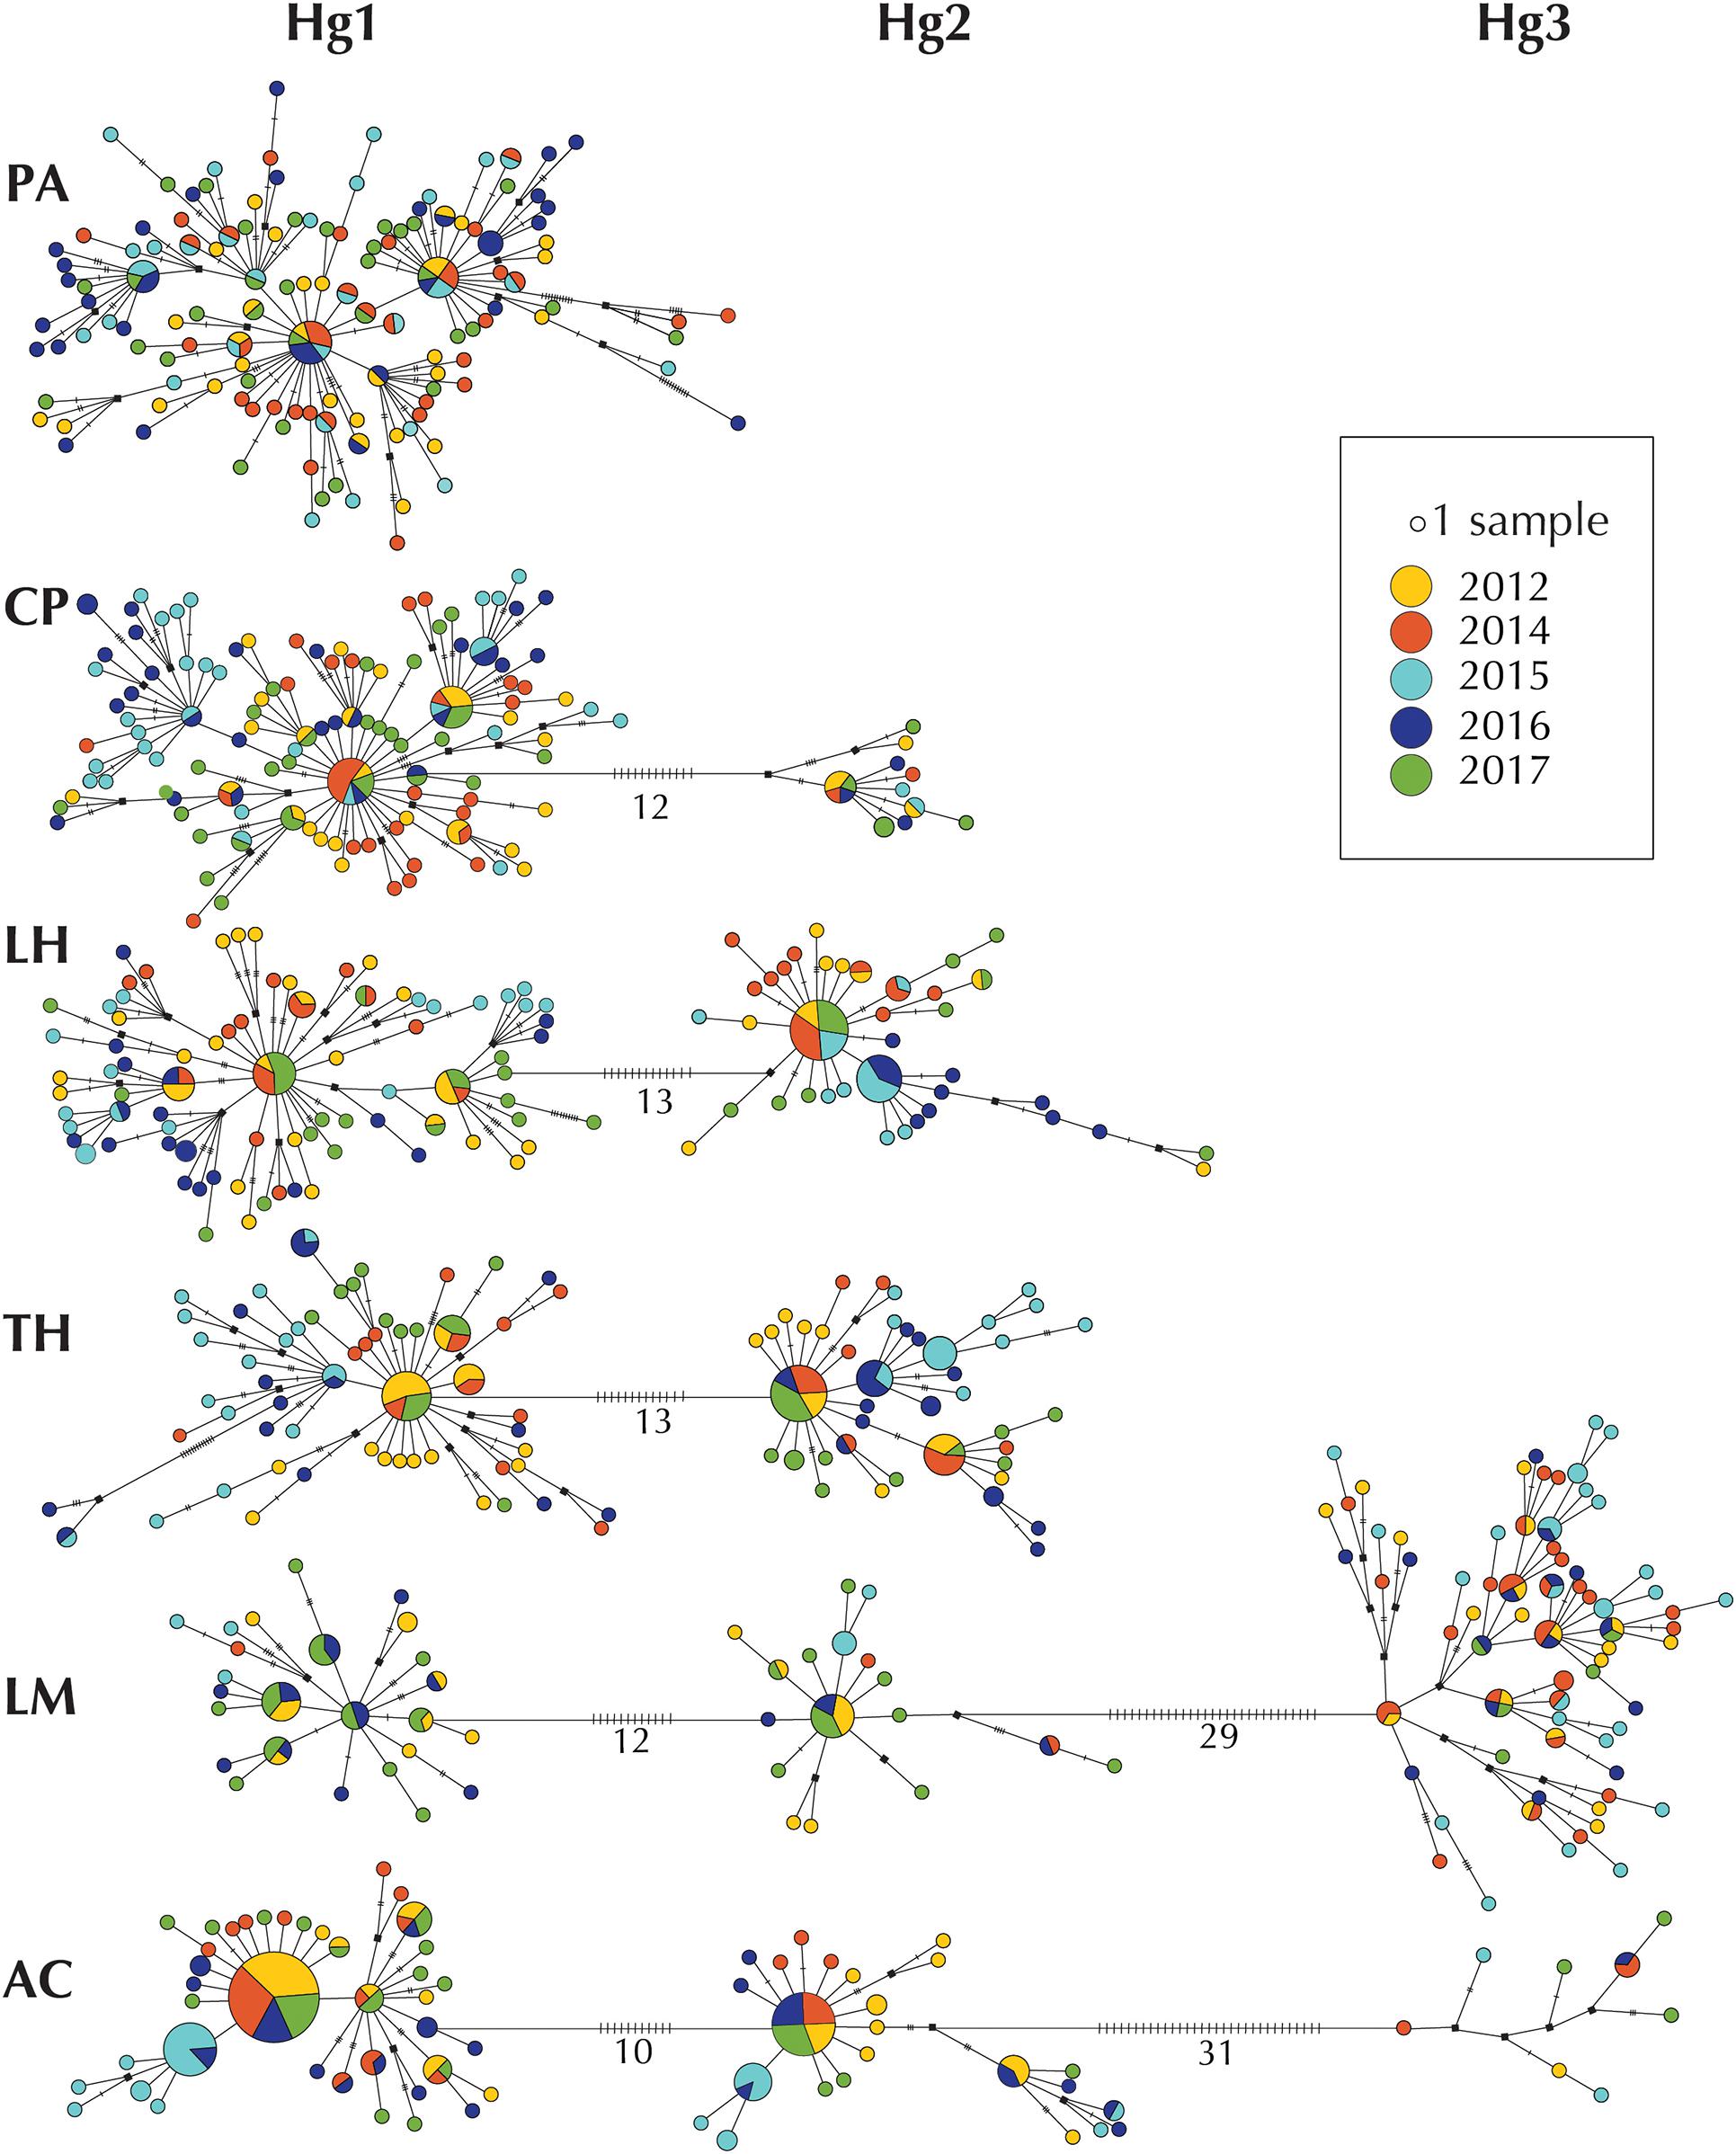
Figure 3. Haplotype networks per location of COI haplotypes of Pyura chilensis. Each circle represents a sampled haplotype, and the size is proportional to the number of individuals with the haplotype. Colors represent temporal samples (years 2012, 2014, 2015, 2016, and 2017). Lines between haplotypes represent a mutational step, and small crossed lines correspond to additional steps. Hypothetic/non-sampled haplotypes are represented with a black square. The three COI haplogroups (Hg1, Hg2, and Hg3) are shown in a single network per site and numbers represent the number of mutational steps between haplogroups.
Discussion
The genetic structure of P. chilensis consisted of three highly differentiated COI haplogroups. Haplogroup 1 (Hg1), the most frequent and present throughout the analyzed geographic area, Haplogroup 2 (Hg2), only missing on the northernmost site (Pan de Azúcar) and Haplogroup 3 (Hg3), the most differentiated and restricted to the two southern sites (mainly in Los Molinos), as shown previously by Haye and Muñoz-Herrera (2013). The proportion of haplogroups of P. chilensis did not vary between the 5 years sampled, with the exception of Los Molinos, where the frequencies of each Haplogroup, particularly Hg3, were more variable, especially in years 2015–2016.
A noteworthy result is the very high haplotype diversity found (in many cases each individual in a sample had a different haplotype). This is in agreement with Haye and Muñoz-Herrera (2013) results and is attributed by these authors to large effective population size and fast mutational rate. It also suggests that the populations are experimenting a demographic expansion in the sampling area. High haplotype diversity in COI, but less than in the present work, has also been found in other solitary ascidians, such as Microcosmus squamiger (Rius et al., 2009; overall Hd = 0.794), or Styela plicata (Pineda et al., 2011; overall Hd = 0.810).
When all the data were considered (all haplogroups together), the overall variability in genetic structure of Pyura chilensis showed a greater spatial than temporal component over the time frame studied (5 years). Despite this general trend, a striking result of this study is that the relative importance of spatial and temporal variation varies between the mitochondrial haplogroups of P. chilensis. The most frequent and spatially extended Hg1, showed a higher spatial than temporal variation between the 5 analyzed years. As in Hg1 most of the variance was explained by differences between sites and since this is the most abundant haplogroup, the trend of Hg1 may bias the general analysis, obscuring the temporal component.
Conversely, for Hg2, which was absent in the northernmost location (PA), most of the variance was explained by differences between years. A temporal genetic variation was also detected in the Hg3 if we consider its frequency in the site LM, which harbors most individuals of this geographically restricted COI haplogroup: the relative frequency of this group ranged from ca 0.2 to 0.9 in the years surveyed. We could not analyze, however, changes in haplotype frequencies due to limited data for this haplogroup. Albeit the spatial or temporal components are the dominant, respectively, in Hg1 and Hg2, there is nevertheless evidence for significant differences in haplotype composition in particular years in Hg1, as evidenced by PERMANOVA and pairwise FST results. For Hg2, AMOVA showed a significant site within years component, suggesting that spatial differentiation also exists in at least some years.
The existence of lineage specific differences in temporal and spatial components of variation was unexpected. Particularly because, using nuclear sequences of the Elongation Factor 1 alpha (EF1α) gene, Haye and Muñoz-Herrera (2013) showed that there is admixture between Hg1 and Hg2. Other solitary ascidians also show a lack of relationship between mitochondrial and nuclear genetic structure. For instance, in Styela plicata there are two groups based on COI haplotypes and two groups based on nuclear ANT sequences, but these groups are not congruent (Pineda et al., 2011), which can be explained by the different inheritance mechanisms of both genes. Nuclear genes can be shuffled by sexual reproduction leading to a different distribution than mitochondrial lineages. In addition, Pineda et al. (2011) found an excess of individuals bearing one allele of each nuclear group, indicating that selection may have favored admixture in this species. In the solitary ascidian Microcosmus squamiger there are also two main mitochondrial groups (Rius et al., 2009) and two nuclear clusters as defined by microsatellites (Rius and Teske, 2011). However, these two groups are also not congruent (Ordóñez et al., 2013). Interestingly, in this species it was found that nuclear lineages tend to remain separated even in sympatry in long-term introduced populations (Ordóñez et al., 2013), thus in this case interbreeding seems to be selected against.
We cannot explain at present what are the causes of the different spatio-temporal dynamics of the two haplogroups of P. chilensis. One option is that mitochondrial genes may determine reproductive or biological parameters that affect the dispersal capabilities of the species and, thus, the temporal variation. Alternatively, the differentiation between mitochondrial lineages can correspond to some degree to nuclear differentiation as well, and this may not be evident when evaluating a single gene (EF1α in Haye and Muñoz-Herrera, 2013). We reanalyzed the genome-wide SNP markers genotyped in a subset of the individuals here studied (data from Segovia et al., 2017, 2020), taking into account the mitochondrial information of the individuals. Our results (Supplementary File 1) revealed that the admixture between Hg1 and Hg2 is not perfect. Thus, there is some degree of nuclear differentiation between them, related both to neutral and to potentially selective processes. The processes responsible for the maintenance of imperfect admixture (either pre-zygotic or post-zygotic mechanisms) between haplogroups cannot be assessed at present and would require an in-depth knowledge of the biological features of each haplogroup and experimental crosses between them. Nevertheless, this nuclear differentiation opens a much wider scope of genetic differentiation than if only mitochondrial DNA could account for the differences observed. Selective or non-selective processes with implications in dispersal abilities can therefore translate into differences in the nuclear genetic makeup of the haplogroups that can explain their different spatio-temporal behavior. One such process may be the onset of the reproductive season (for instance, one lineage may reproduce at a time when currents are stronger). Another potential process could be differing thermal tolerance, that is relevant for larval survival (Perez-Valdes et al., 2017).
The general trend of greater spatial than temporal variation, with an overall low to moderate temporal variation, was also found in Styela plicata, an ascidian of similar biological features (Pineda et al., 2016b). This pattern has also been described in several other marine invertebrates such as polychaetes (Kesäniemi et al., 2014); molluscs (Kenchington et al., 2006; Cassista and Hart, 2007; Lee and Boulding, 2009; Ng et al., 2010), crustaceans (Ball and Chapman, 2003; Pascual et al., 2016), and urchins (Flowers et al., 2002; Calderón et al., 2009). On the contrary, a greater temporal than spatial variation similar to what we detected in Hg2 (and, although limited sampling allowed only to evaluate changes in relative frequencies, in Hg3), has been found in some marine invertebrates such as the barnacle Balanus glandula (Barshis et al., 2011), the oyster Ostrea edulis (Hedgecock et al., 2007), periwinkles Littorina spp. with planktonic larval development (Lee and Boulding, 2009), and the anomuran crab Petrolisthes cinctipes (Toonen and Grosberg, 2011).
A strong degree of spatial genetic differentiation is to be expected in marine invertebrates with low natural dispersal potential. This is a common result in population genetic analyses of ascidians (e.g., López-Legentil and Turon, 2006; Pérez-Portela and Turon, 2008), as they have lecitotrophic, short-lived larvae. In addition, temporal genetic variation may also be linked to the duration of the planktonic larval life stages. For example, species of the genus Littorina vary in their degree of temporal variation in accordance with their dispersal potential; species with planktonic larval dispersal showed high temporal variation while species with direct development showed low temporal variation (Lee and Boulding, 2009). In this sense, the finding of a strong temporal signature in Hg2 is somewhat unexpected and suggests strong temporal variation in response to environmental parameters.
Temporal genetic variation can be established by different processes (Calderón et al., 2009). In organisms with high fecundity and high larval mortality many factors affect reproductive success, including biotic variables (adult densities, sperm availability, larval traits) and abiotic parameters (current patterns, temperature changes, upwellings). These factors can determine selective forces with a variable effect on larvae (Watts et al., 1990). Alternatively, the sweepstakes reproductive success hypothesis (Hedgecock, 1994; Hedgecock and Pudovkin, 2011) establishes that stochastic changes in the environment can result in high variance in reproductive success, thereby different adults contribute to the pool of successful recruits in each generation. High variance in reproductive success can explain temporal variability in genetic diversity and structure (Turner et al., 2002; Pujolar et al., 2007; Calderón et al., 2009; Kesäniemi et al., 2014), this reproductive variance potentially leading to temporal chaotic genetic patchiness (Colgan, 1981; Johnson and Black, 1984; Hedgecock, 1994).
In our case, Hg2 had a significant overall temporal variation, but it is particularly strong when comparing the years 2015–2016 with the rest. For Hg1, the significant FST comparisons were also related to these 2 years (albeit with values one order of magnitude lower than in Hg2). Consistently, haplotype networks evidenced that in 2015/2016 a different suite of haplotypes was encountered in all haplogroups. Environmental conditions along the southeast Pacific coast are highly unpredictable as a result of processes that have temporal variation such as seasonal winds and upwelling, and the strong influence of the El Niño Southern Oscillation (ENSO), among others (Thiel et al., 2007). In this context, significant changes in haplotype frequencies in 2015/16 are coincident with one of the strongest recorded El Niño events (Blunden and Arndt, 2016) comparable only to the events of 1982/1983 and 1997/1998 in terms of intensity and anomalies in temperature (McPhaden and Zhang, 2009; Santoso et al., 2013) and salinity (Corbett et al., 2017). A recent study suggests that P. chilensis is sensitive to temperature changes, being one of the environmental variables that affects its adaptive genetic structure (Segovia et al., 2020). Sea Surface Temperature anomalies during 2015/2016 ENSO event reached ~3.5°C (Paek et al., 2017), which suggests that temporal stability in haplotype frequencies was significantly affected by these anomalies. Changes in upwelling intensity (Aravena et al., 2014; Pinochet et al., 2019) may also influence temporal patterns of genetic structure in P. chilensis, as reported for other species such as Balanus glandula in the northwest Atlantic coast (Barshis et al., 2011).
In short, our results suggest different mitochondrial lineage-specific patterns of spatio-temporal genetic variation in P. chilensis. The temporal dynamic that has been found is in accordance with the high temporal variability in environmental conditions in the Southeast Pacific. We also confirmed previous reports of spatial genetic differentiation of P. chilensis along its latitudinal range of distribution, reflected in different frequencies of haplogroups and, at least within the main haplogroup, a strong spatial signature with temporal stability. Our results call for caution when general trends are applied to species with highly differentiated lineages. We prompt instead for separate analyses of sub-specific lineages whenever possible, as they can prove a rich source of information otherwise untapped. This has been noted for the analyses of spatial genetic structure (i.e., Carreras et al., 2020), but a lineage-specific pattern of temporal variation has not, to our knowledge, been previously reported for any marine invertebrate.
Data Availability Statement
The datasets presented in this study can be found in online repositories. The names of the repository/repositories and accession number(s) can be found below: Genbank accession numbers of DNA sequences of haplotypes per year: MW785940-MW786618.
Author Contributions
PH and NS conceived the idea and contribuited to sample collection, laboratory work, and acquisition of data. PH, XT, and NS contributed reagents, materials, analysis tools, conceived and designed the analysis, and wrote the manuscript.
Funding
This study was funded by the Chilean National Fund for Scientific and Technological Development through Grants FONDECYT 1140862, FONDECYT 3190482, Millennium Science Initiative Program—ICN2019_015, and partly funded by project PopCOmics CTM2017-88080 (MCIU/AEI/FEDER) of the Spanish Government.
Conflict of Interest
The authors declare that the research was conducted in the absence of any commercial or financial relationships that could be construed as a potential conflict of interest.
Acknowledgments
We thank Natalia Muñoz, Raúl Vera, Francisca Gálvez, Diana Coral, and Katherine Ramírez for help with sampling and laboratory procedures. All the samples were collected by local fishermen from the Fisheries Management Areas (AMERBs) under their jurisdiction.
Supplementary Material
The Supplementary Material for this article can be found online at: https://www.frontiersin.org/articles/10.3389/fmars.2021.657411/full#supplementary-material
Footnotes
References
Ambler, R. P., and Cañete, J. I. (1991). Asentamiento y reclutamiento de Pyura chilensis Molina, 1782 (Urochordata: Ascidiacea) sobre placas artificiales suspendidas en Bahía La Herradura, Coquimbo Chille. Rev. Biol. Mar. 26, 403–413.
Aravena, G., Broitman, B., and Stenseth, N. C. (2014). Twelve years of change in coastal upwelling along the central-northern coast of Chile: spatially heterogeneous responses to climatic variability. PLoS One 9:e90276. doi: 10.1371/journal.pone.0090276
Ball, A. O., and Chapman, R. W. (2003). Population genetic analysis of white shrimp, Litopenaeus setiferus, using microsatellite genetic markers. Mol. Ecol. 12, 2319–2330. doi: 10.1046/j.1365-294x.2003.01922.x
Barshis, D. J., Sotka, E. E., Kelly, R. P., Sivasundar, A., Menge, B. A., Barth, J. A., et al. (2011). Coastal upwelling is linked to temporal genetic variability in the acorn barnacle Balanus glandula. Mar. Ecol. Prog. Ser. 439, 139–150. doi: 10.3354/meps09339
Benjamini, Y., and Yekutieli, D. (2001). The control of the false discovery rate in multiple testing under dependency. Ann. Stats. 29, 1165–1188.
Berger, M. S., Darrah, A. J., and Emlet, R. B. (2006). Spatial and temporal variability of the early post-settlement survivorship and growth in the barnacle Balanus glandula along an estuarine gradient. J. Exp. Mar. Biol. Ecol. 336, 74–87. doi: 10.1016/j.jembe.2006.04.009
Blunden, J., and Arndt, D. S. (2016). State of the climate in 2015. B. Am. Meteorol. Soc. 97, S1–S275.
Calderón, I., Palacín, C., and Turon, X. (2009). Microsatellite markers reveal shallow genetic differentiation between cohorts of the common sea urchin Paracentrotus lividus (Lamarck) in northwest Mediterranean. Mol. Ecol. 18, 3036–3049. doi: 10.1111/j.1365-294x.2009.04239.x
Calderón, I., Pita, L., Brusciotti, S., Palacín, C., and Turon, X. (2012). Time and space: genetic structure of the cohorts of the common sea urchin Paracentrotus lividus in Western Mediterranean. Mar. Biol. 159, 187–197. doi: 10.1007/s00227-011-1799-z
Caputi, L., Toscano, F., Arienzo, M., Ferrara, L., Procaccini, G., and Sordino, P. (2019). Temporal correlation of population composition and environmental variables in the marine invader Ciona robusta. Mar. Ecol. 40:e12543. doi: 10.1111/maec.12543
Carreras, C., García-Cisneros, A., Wangensteen, O. S., Ordóñez, V., Palacín, C., Pascual, M., et al. (2020). East is East and West is West: Population genomics and hierarchical analyses reveal genetic structure and adaptation footprints in the keystone species Paracentrotus lividus (Echinoidea). Divers. Distrib. 26, 382–398. doi: 10.1111/ddi.13016
Cassista, M. C., and Hart, M. W. (2007). Spatial and temporal genetic homogeneity in the Arctic surfclam (Mactromeris polynyma). Mar. Biol. 152, 569–579. doi: 10.1007/s00227-007-0711-3
Castilla, J. C., Lagos, N. A., and Cerda, M. (2004). Marine ecosystem engineering by the alien ascidian Pyura praeputialis on a mid-intertidal rocky shore. Mar. Ecol. Prog. Ser. 268, 119–130. doi: 10.3354/meps268119
Cobben, M. M., Verboom, J., Opdam, P. F. M., Odbam, R. F., Jochem, R., Arens, P., et al. (2011). Projected climate change causes loss and redistribution of genetic diversity in a model metapopulation of a medium-good disperser. Ecography 34, 920–932. doi: 10.1111/j.1600-0587.2011.06713.x
Colgan, D. J. (1981). Spatial and temporal variation in the genotypic frequencies of the mussel Brachidontes rostratus. Heredity 46, 197–208. doi: 10.1038/hdy.1981.27
Corbett, C. M., Subrahmanyam, B., and Giese, B. S. (2017). A comparison of sea surface salinity in the equatorial Pacific Ocean during the 1997-1998, 2012-2013, and 2014-2015 ENSO events. Clim. Dynam. 49, 3513–3526. doi: 10.1007/s00382-017-3527-y
Couvray, S., and Coupé, S. (2018). Three-year monitoring of genetic diversity reveals a micro-connectivity pattern and local recruitment in the broadcast marine species Paracentrotus lividus. Heredity 120, 110–124. doi: 10.1038/s41437-017-0013-6
Crowder, L. B., Lyman, S. J., Figueira, W. F., and Priddy, J. (2000). Source-sink population dynamics and the problem of sitting marine reserves. Bull. Mar. Sci. 66, 799–820.
Excoffier, L., and Lischer, H. E. L. (2010). Arlequin ver 3.5: a new series of programs to perform population genetics analyses under Linux and Windows. Mol. Ecol. Res. 10, 564–567. doi: 10.1111/j.1755-0998.2010.02847.x
Flowers, J. M., Schroeter, S. C., and Burton, R. S. (2002). The recruitment sweepstakes has many winners: genetic evidence from the sea urchin Strongylocentrotus purpuratus. Evolution 56, 1445–1453. doi: 10.1554/0014-3820(2002)056[1445:trshmw]2.0.co;2
Folmer, O., Black, M., Hoeh, W., Lutz, R., and Vrijenhoek, R. (1994). DNA primers for amplification of mitochondrial cytochrome c oxidase subunit I from diverse metazoan invertebrates. Mol. Mar. Biol. Biotechnol. 3, 294–299.
Haye, P. A., and Muñoz-Herrera, N. C. (2013). Isolation with differentiation followed by expansion with admixture in the tunicate Pyura chilensis. BMC. Evol. Biol. 13:252. doi: 10.1186/1471-2148-13-252
Hedgecock, D. (1994). Temporal and spatial genetic structure of marine animal populations in the California current. Calif. Coop. Ocean. Fish. Invest. Rep. 35, 73–81.
Hedgecock, D., Launey, S., Pudovkin, A. I., Naciri, Y., Lapegue, S., and Bonhomme, F. (2007). Small effective number of parents (N b) inferred for a naturally spawned cohort of juvenile European flat oysters Ostrea edulis. Mar. Biol. 150, 1173–1182. doi: 10.1007/s00227-006-0441-y
Hedgecock, D., and Pudovkin, A. I. (2011). Sweepstakes reproductive success in highly fecund marine fish and shellfish: a review and commentary. B. Mar. Sci. 87, 971–1002. doi: 10.5343/bms.2010.1051
Johnson, D. M. (2004). Source-sink dynamics in a temporally heterogeneous environment. Ecology 85, 2037–2045. doi: 10.1890/03-0508
Johnson, M. S., and Black, R. (1984). Pattern beneath the chaos: the effect of recruitment on genetic patchiness in an intertidal limpet. Evolution 38, 1371–1383. doi: 10.1111/j.1558-5646.1984.tb05658.x
Kelly, R. P., and Palumbi, S. R. (2010). Genetic structure among 50 species of the Northeastern Pacific rocky intertidal community. PLoS One 5:e8594. doi: 10.1371/journal.pone.0008594
Kenchington, E. L., Patwary, M. U., Zouros, E., and Bird, C. J. (2006). Genetic differentiation in relation to marine landscape in a broadcast-spawning bivalve mollusc (Placopecten magellanicus). Mol. Ecol. 15, 1781–1796. doi: 10.1111/j.1365-294x.2006.02915.x
Kesäniemi, J. E., Mustonen, M., Boström, C., Hansen, B. W., and Knott, K. E. (2014). Temporal genetic structure in a poecilogonous polychaete: the interplay of developmental mode and environmental stochasticity. BMC Evol. Biol. 14:12. doi: 10.1186/1471-2148-14-12
Lancellotti, D., and Vásquez, J. A. (2000). Zoogeografía de macroinvertebrados bentónicos de la costa de Chile: contribución para la conservación marina. Rev. Chil. Hist. Nat. 73, 99–129.
Lee, H. J., and Boulding, E. G. (2009). Spatial and temporal population genetic structure of four northeastern Pacific littorinid gastropods: the effect of mode of larval development on variation at one mitochondrial and two nuclear DNA markers. Mol. Ecol. 18, 2165–2184. doi: 10.1111/j.1365-294x.2009.04169.x
Legendre, P., and Lapointe, F. J. (2004). Assessing congruence among distance matrices: single-malt scotch whiskies revisited. Aust. N. Z. J. Stat. Aust. Nz. J. Stat. 46, 615–629. doi: 10.1111/j.1467-842x.2004.00357.x
Librado, P., and Rozas, J. (2009). DnaSP v5: A software for comprehensive analysis of DNA polymorphism data. Bioinformatics 25, 1451–1452. doi: 10.1093/bioinformatics/btp187
López-Legentil, S., and Turon, X. (2006). Population genetics, phylogeography and speciation of Cystodytes (Ascidiacea) in the western Mediterranean Sea. Biol J. Linn. Soc. 88, 203–214. doi: 10.1111/j.1095-8312.2006.00614.x
Ludford, A., Cole, V. J., Porri, F., Mcquaid, C. D., Nakin, M. D. V., and Erlandsson, J. (2012). Testing the source-sink theory: the spill-over of mussel recruits beyond marine protected areas. Landscape Ecol. 27, 859–868. doi: 10.1007/s10980-012-9739-y
Manríquez, P. H., and Castilla, J. C. (2005). Self-fertilization as an alternative mode of fertilization in the solitary tunicate Pyura chilensis. Mar. Ecol. Prog. Ser. 305, 113–125. doi: 10.3354/meps305113
Marshall, D. J., Monro, K., Bode, M., Keough, M. J., and Swearer, S. (2010). Phenotype-environment mismatches reduce connectivity in the sea. Ecol. Lett. 13, 128–140. doi: 10.1111/j.1461-0248.2009.01408.x
McPhaden, M. J., and Zhang, X. B. (2009). Asymmetry in zonal phase propagation of ENSO sea surface temperature anomalies. Geophys. Res. Lett. 36:L13703.
Menge, B. A., Lubchenco, J., Bracken, M. E. S., Chan, F., Foley, M. M., Freidenburg, T. L., et al. (2003). Coastal oceanography sets the pace of rocky intertidal community dynamics. Proc. Natl. Acad. Sci. U.S.A. 100, 12229–12234. doi: 10.1073/pnas.1534875100
Ng, W. C., Leung, F. C. C., Chak, S. T. C., Slingsby, G., and Williams, G. A. (2010). Temporal genetic variation in populations of the limpet Cellana gratafrom Hong Kong shores. Mar. Biol. 157, 325–337. doi: 10.1007/s00227-009-1320-0
Oksanen, J., Blanchet, F. G., Friendly, M., Kindt, R., Legendre, P., McGlinn, D., et al. (2020). vegan: Community Ecology Package. R Package Version 2.4-3.
Ordóñez, V., Pascual, M., Rius, M., and Turon, X. (2013). Mixed but not admixed: a spatial analysis of genetic variation of an invasive ascidian on natural and artificial substrates. Mar. Biol. 160, 1645–1660. doi: 10.1007/s00227-013-2217-5
Paek, H., Yu, J. Y., and Qian, C. (2017). Why were the 2015/2016 and 1997/1998 extreme El Niños different? Geophys. Res. Lett. 44, 1848–1856.
Paradis, E., and Schliep, K. (2019). Ape 5.0: an environment for modern phylogenetics and evolutionary analyses in R. Bioinformatics 35, 526–528. doi: 10.1093/bioinformatics/bty633
Pascual, M., Palero, F., García-Merchán, V. H., Macpherson, E., Robainas-Barcia, A., Mestres, F., et al. (2016). Temporal and spatial genetic differentiation in the crab Liocarcinus depurator across the Atlantic-Mediterranean transition. Sci. Rep. 6:29892.
Paz, G., Douek, J., Mo, C., Goren, M., and Rinkevich, B. (2003). Genetic structure of Botryllus schlosseri (Tunicata) populations from the Mediterranean coast of Israel. Mar. Ecol. Prog. Ser. 250, 153–162. doi: 10.3354/meps250153
Penney, R. W., Hart, M. J., and Templeman, N. D. (2006). Genotype-dependent survival, growth, and reproduction in cultured blue mussels, Mytilus spp.: results of a reciprocal seed transfer experiment. J. Shellf. Res. 25, 515–525. doi: 10.2983/0730-8000(2006)25[515:gsgapi]2.0.co;2
Pérez-Portela, R., and Turon, X. (2008). Cryptic divergence and strong population structure in the colonial invertebrate Pycnoclavella communis (Ascidiacea) inferred from molecular data. Zoology 111, 163–178. doi: 10.1016/j.zool.2007.06.006
Perez-Valdes, M., Figueroa-Aguilera, D., and Rojas-Perez, C. (2017). Reproductive cycle of sea squirt Pyura chilensis (Urochordata: Ascidiacea) originating from aquaculture mussel systems. Rev. Biol. Mar. Oceanog. 52, 333–342. doi: 10.4067/s0718-19572017000200012
Pineda, M. C., López-Legentil, S., and Turon, X. (2011). The whereabouts of an ancient wanderer: global phylogeography of the solitary ascidian Styela plicata. PLoS One 6:e25495. doi: 10.1371/journal.pone.0025495
Pineda, M. C., Lorente, B., López-Legentil, S., Palacín, C., and Turon, X. (2016a). Stochasticity in space, persistence in time: genetic heterogeneity in harbour populations of the introduced ascidian Styela plicata. PeerJ 4:e2158. doi: 10.7717/peerj.2158
Pineda, M. C., Turon, X., Pérez-Portela, R., and López-Legentil, S. (2016b). Stable populations in unstable habitats: temporal genetic structure in the introduced ascidian Styela plicata in North Carolina. Mar. Biol. 163:59.
Pinochet, A., Garcés-Vargas, J., Lara, C., and Olguín, F. (2019). Seasonal variability of upwelling off Central-Southern Chile. Remote. Sens. 11:1737. doi: 10.3390/rs11151737
Pujolar, J. M., Maes, G. E., and Volckaert, F. A. M. (2007). Genetic and morphometric heterogeneity among recruits of the European eel, Anguilla anguilla. Bull. Mar. Sci. 81, 297–308.
Quintero-Galvis, J. F., Bruning, P., Paleo-López, R., Gomez, D., Sánchez, R., and Cárdenas, L. (2020). Temporal variation in the genetic diversity of a marine in of a marine invertebrate with long larval phase, the muricid gastropod Concholepas concholepas. J. Exp. Ma.r Biol. Ecol. 53:151432. doi: 10.1016/j.jembe.2020.151432
R Development Core Team (2020). A Language and Environment for Statistical Computing. Vienna: R Foundation for Statistical Computing.
Reem, E., Douek, J., Katzir, G., and Rinkevich, B. (2012). Long-term population genetic structure of an invasive urochordate: the adcidian Botryllus schlosseri. Biol. Invasions 15, 225–241. doi: 10.1007/s10530-012-0281-2
Rius, M., Pineda, M. C., and Turon, X. (2009). Population dynamics and life cycle of the introduced ascidian Microcosmus squamiger in the Mediterranean Sea. Biol. Inv. 11, 2181–2194. doi: 10.1007/s10530-008-9375-2
Rius, M., and Teske, P. R. (2011). A revision of the Pyura stolonifera species complex (Tunicata, Ascidiacea), with a description of a new species from Australia. Zootaxa 2754, 27–40. doi: 10.11646/zootaxa.2754.1.2
Roughgarden, J., Gaines, S., and Possingham, H. (1988). Recruitment dynamics in complex life cycles. Science 241, 1460–1466. doi: 10.1126/science.11538249
Santoso, A., McGregor, S., Jin, F.-F., Cai, W., England, M. H., An, S. I. I., et al. (2013). Late-twentieth-century emergence of the El Niño propagation asymmetry and future projections. Nature 504, 126–130. doi: 10.1038/nature12683
Schiebelhut, L. M., and Dawson, M. N. (2018). Correlates of population genetic differentiation in marine and terrestrial environments. J. Biogeogr. 45, 2427–2441. doi: 10.1111/jbi.13437
Segovia, N. I., Gallardo-Escárate, C., Poulin, E., and Haye, P. A. (2017). Lineage divergence, local adaptation across a biogeographic break, and artificial transport, shape the genetic structure in the ascidian Pyura chilensis. Sci. Rep. 7, 1–12.
Segovia, N. I., González-Wevar, C. A., and Haye, P. A. (2020). Signatures of local adaptation in the spatial genetic structure of the ascidian Pyura chilensis along the southeast Pacific coast. Sci. rep. 10, 1–14.
Shanks, A. L., and Brink, L. (2005). Upwelling, downwelling, and cross-shelf transport of bivalve larvae: test of a hypothesis. Mar. Ecol. Prog. Ser. 302, 1–12. doi: 10.3354/meps302001
Siegel, D. A., Mitarai, S., Costello, C. J., Gaines, S. D., Kendal, B. E., Warner, R. R., et al. (2008). The stochastic nature of larval connectivity among nearshore marine populations. Proc. Natl. Ac. Sci. U.S.A. 105, 8974–8979. doi: 10.1073/pnas.0802544105
Svane, I., and Lundälv, T. (1982). Population dynamics and reproductive patterns of Boltenia echinata (Ascidiacea) on the Swedish West Coast. Neth. J. Sea. Res. 16, 105–118. doi: 10.1016/0077-7579(82)90022-9
Thiel, M., Macaya, E. C., Acuña, E., Arntz, W. E., Bastías, H., Brokordt, K., et al. (2007). The Humboldt Current system of northern and central Chile oceanographic processes, ecological interactions and socioeconomic feedback. Ocean. Mar. Biol. Annu. Rev. 45, 195–344. doi: 10.1201/9781420050943.ch6
Toonen, R. J., and Grosberg, R. K. (2011). “Chapter 4: Causes of chaos: spatial and temporal genetic heterogeneity in the intertidal anomuran crab Petrolisthes cinctipes,” in Phylogeography and Population Genetics in Crustacea, ed. L. Koenemann (Boca Raton, FL: CRC Press), 75–107. doi: 10.1201/b11113-6
Turner, F. T., Wares, J. P., and Gold, J. R. (2002). Genetic effective size is three orders of magnitude smaller than adult census size in an abundant, estuarine-dependent marine fish (Sciaenops ocellatus). Genetics 162, 1329–1339.
Valdivia, N., Heidemann, A., Thiel, M., Molis, M., and Wahl, M. (2005). Effects of disturbance on diversity of hard-bottom macrobenthic communities at the coast of Chile. Mar. Ecol. Prog. Ser. 299, 45–54. doi: 10.3354/meps299045
Vigliola, L., Doherty, P. J., Meekan, M. G., Drown, D. M., Jones, M. E., and Barber, P. H. (2007). Genetic identity determines risk of postsettlement mortality of a marine fish. Ecology 88, 1263–1277. doi: 10.1890/06-0066
Virgilio, M., and Abbiati, M. (2006). Temporal changes in the genetic structure of intertidal populations of Hediste diversicolor (Polychaeta: Nereididae). J. Sea. Res. 56, 53–58. doi: 10.1016/j.seares.2006.03.008
Watts, R. J., Johnson, M. S., and Black, R. (1990). Effects of recruitment on genetic patchiness in the urchin Echinometra mathaei in Western Australia. Mar. Biol. 105, 145–151. doi: 10.1007/bf01344280
Weersing, K., and Toonen, R. J. (2009). Population genetics, larval dispersal, and connectivity in marine systems. Mar. Ecol. Prog. Ser. 393, 1–12. doi: 10.3354/meps08287
Keywords: COI, tunicates, genetic structure, Humboldt Current System, temporal variability
Citation: Haye PA, Turon X and Segovia NI (2021) Time or Space? Relative Importance of Geographic Distribution and Interannual Variation in Three Lineages of the Ascidian Pyura chilensis in the Southeast Pacific Coast. Front. Mar. Sci. 8:657411. doi: 10.3389/fmars.2021.657411
Received: 22 January 2021; Accepted: 29 March 2021;
Published: 22 April 2021.
Edited by:
Sandie M. Degnan, The University of Queensland, AustraliaReviewed by:
Pablo Saenz-Agudelo, Austral University of Chile, ChileCarlos Vergara-Chen, Technological University of Panama, Panama
S. López-Legentil, University of North Carolina at Wilmington, United States
Copyright © 2021 Haye, Turon and Segovia. This is an open-access article distributed under the terms of the Creative Commons Attribution License (CC BY). The use, distribution or reproduction in other forums is permitted, provided the original author(s) and the copyright owner(s) are credited and that the original publication in this journal is cited, in accordance with accepted academic practice. No use, distribution or reproduction is permitted which does not comply with these terms.
*Correspondence: Nicolás I. Segovia, bnNlZ292aWFjQGdtYWlsLmNvbQ==