 Mathias Haunost
 Ulf Riebesell
 Francesco D’Amore1
 Ole Kelting
 Lennart T. Bach
- 1GEOMAR Helmholtz Centre for Ocean Research Kiel, Kiel, Germany
- 2Institute for Marine and Antarctic Studies, Ecology & Biodiversity, University of Tasmania, Hobart, TAS, Australia
Coccolithophores are an important group of ∼200 marine phytoplankton species which cover themselves with a calcium carbonate shell called “coccosphere.” Coccolithophores are ecologically and biogeochemically important but the reason why they calcify remains elusive. One key function may be that the coccosphere offers protection against microzooplankton predation, which is one of the main causes of phytoplankton death in the ocean. Here, we investigated the effect of the coccosphere on ingestion and growth of the heterotrophic dinoflagellate Oxyrrhis marina. Calcified and decalcified cells of the coccolithophore species Emiliania huxleyi, Pleurochrysis carterae, and Gephyrocapsa oceanica were offered separately to the predator as well as in an initial ∼1:1 mixture. The decrease of the prey concentrations and predator abundances were monitored over a period of 48–72 h. We found that O. marina did not actively select against calcified cells, but rather showed a size selective feeding behavior. Thus, the coccosphere does not provide a direct protection against grazing by O. marina. However, O. marina showed slower growth when calcified coccolithophores were fed. This could be due to reduced digestion rates of calcified cells and/or increased swimming efforts when ballasted with heavy calcium carbonate. Furthermore, we show that the coccosphere reduces the ingestion capacity simply by occupying much of the intracellular space of the predator. We speculate that the slower growth of the grazer when feeding on calcified cells is of limited benefit to the coccolithophore population because other co-occurring phytoplankton species within the community that do not invest energy in the formation of a calcite shell could also benefit from the reduced growth of the predators. Altogether, these new insights constitute a step forward in our understanding of the ecological relevance of calcification in coccolithophores.
Introduction
Coccolithophores are single-celled phytoplankton that produce small calcium carbonate (CaCO3) scales (coccoliths) which cover the cell surface in the form of a spherical coating, called coccosphere. They have been an integral part of marine plankton communities since the Jurassic (Bown et al., 2004; Hay, 2004). Today, coccolithophores contribute ∼1–10% to primary production in the surface ocean (Poulton et al., 2007) and ∼50% to pelagic CaCO3 sediments (Broecker and Clark, 2009). Their calcareous shell increases the sinking velocity of photosynthetically fixed CO2 into the deep ocean by ballasting organic matter (Klaas and Archer, 2002; Honjo et al., 2008). At the same time, the biogenic precipitation of calcium carbonate during coccolith formation reduces the total alkalinity of seawater and releases CO2 (Frankignoulle et al., 1994; Rost and Riebesell, 2004). Thus, coccolithophores play an important role in the marine carbon cycle by influencing the efficiency of the biological carbon pump and the oceanic uptake of atmospheric CO2.
There are about 200 extant coccolithophore species in the oceans (Young et al., 2005). It is currently not known why coccolithophores calcify and how their ability to produce coccoliths is associated with their ecological success (Young, 1987, 1994; Raven and Crawfurd, 2012; Monteiro et al., 2016; Müller, 2019). The most plausible benefit of having a coccosphere seems to be a protection against predators or viruses (Hamm and Smetacek, 2007; Monteiro et al., 2016). Viral infection is an important cause of phytoplankton death in the oceans (Brussaard, 2004), and it has recently been shown that calcification can influence the interaction between a coccolithophore and its virus (Johns et al., 2019; Haunost et al., 2020). The major predators of marine phytoplankton are microzooplankton like ciliates and dinoflagellates. These are estimated to consume about two-thirds of the primary production in the ocean (Calbet and Landry, 2004) and microzooplankton can exert a strong grazing pressure on coccolithophore populations (Mayers et al., 2019). Although calcification does not prevent predation, it has been argued that the coccosphere reduces the grazing efficiency by making it more difficult for the predator to utilize the organic content of coccolithophores (Young, 1994). Heterotrophic protists are able to selectively choose prey on the basis of its size or shape and through chemical signals (Tillmann, 2004; Breckels et al., 2011) and may thus favor other prey that is available and not protected by coccoliths.
Currently, the evidence supporting or refuting a protective function of the coccosphere against predation is limited. Fileman et al. (2002) and Olson and Strom (2002) found that overall microzooplankton predation rates were reduced during blooms of the coccolithophore Emiliania huxleyi. In contrast, Mayers et al. (2019) found high microzooplankton grazing rates on natural coccolithophore communities. Recently, Mayers et al. (2020) showed that in situ ingestion rates of microzooplankton on E. huxleyi did not differ significantly from those on similar sized non-calcifying phytoplankton. In laboratory experiments the heterotrophic dinoflagellate Oxyrrhis marina preferred calcified over non-calcified cells of E. huxleyi, which was hypothesized to be due to size selective feeding behavior, since calcified cells are larger than non-calcified E. huxleyi (Hansen et al., 1996). Harvey et al. (2015) investigated predation by the dinoflagellate O. marina on different genotypes of non-calcifying E. huxleyi as well as calcified strains that differed in the degree of calcification. They found that the ingestion rate of O. marina was dependent on the genotype of E. huxleyi that was offered, rather than on their degree of calcification. In the same study, however, the authors found that predators which preyed on non-calcifying genotypes grew faster than those fed with calcified cells (Harvey et al., 2015). Strom et al. (2018) compared predation rates of the dinoflagellate Amphidinium longum on calcified relative to naked E. huxleyi prey and found no evidence that the coccosphere prevents ingestion by the grazer. Instead, ingestion rates were dependent on the offered genotype of E. huxleyi (Strom et al., 2018). Altogether, these two studies suggest that the genotype has a strong influence on ingestion by the microzooplankton species, but if and how calcification protects coccolithophores from microzooplankton predation could not be fully clarified.
In this study, we build upon these previous findings and expand the investigation of grazing protection of the coccosphere (which was so far focused on E. huxleyi) on two additional coccolithophore species (Gephyrocapsa oceanica, Pleurochrysis carterae) using the model species Oxyrrhis marina. Furthermore, we developed a protocol that enabled us to compare grazing rates on calcified, and de-calcified clones of the exact same genotypes for 2–3 days (as opposed to previous bioassays which were restricted to either ∼30 min or the use of different genotypes). We tested whether calcification (1) reduces prey ingestion rates, (2) influences the coccolithophore prey selection of O. marina, (3) affects O. marina growth post prey ingestion.
Materials and Methods
The Model Organism O. marina
O. marina is a globally distributed heterotrophic dinoflagellate that inhabits coastal and shallow waters (Watts et al., 2011). It occurs in coastal habitats as well as intertidal pools and is a comparably well characterized model organism to study the trades of marine protozoa (Montagnes et al., 2011). O. marina is 20–30 μm in length (Lowe et al., 2011) and moves fast (90–179 μm s–1) (Boakes et al., 2011). It feeds by phagocytosis and is able to engulf encountered prey items within <15 s (Öpik and Flynn, 1989; Höhfeld and Melkonian, 1998). We used this model organism because it is easy to keep in culture and can be raised to high concentrations. The ingestion rate of O. marina increases with increasing prey density and maximizes under sufficient food concentrations, when the ingestion rate is limited by the predators capability to process the food (Type II functional response) (Roberts et al., 2011).
Basic Culturing Conditions of O. marina and Prey Algae
A starting culture of O. marina (SAG 21.89) was kindly provided by Dr. Urban Tillmann (Alfred Wegener Institute, Bremerhaven). The dinoflagellates were fed with Rhodomonas baltica. The cryptophyte R. baltica as well as the coccolithophore species were cultured under the same basic conditions: Sterile filtered artificial seawater (Kester et al., 1967) was enriched with 256 μmol kg–1 NaNO3, 16 μmol kg–1 NaH2PO4, 10 nmol kg–1 SeO2, vitamins and trace metals according to the f/2 medium (Guillard and Ryther, 1962) and 2 mL kg–1 of natural North Sea water (autoclaved and 0.2 μm filtered) to prevent potential limitation by other micronutrients that are not included in the f/2 receipt (Bach et al., 2011). Algal cultures were raised in a 12:12 h light-dark cycle with a photon flux density of 230 μmol photons m–2 s–1 (measured with a LI-COR LI-250A light meter) at 18°C. O. marina was inoculated into a growing culture of R. baltica and raised for a couple of days until high cell concentrations could be observed with the naked eye (The dinoflagellate cells appear in veil-like formations). Thereupon, the culture was placed dark at 18°C until all cells of R. baltica were eaten up, which was determined by flow cytometry (as described further below). The culture was further kept dark for about one week to starve the dinoflagellates. The concentration of starved cells was determined by flow cytometry. In this way, O. marina was raised to concentrations of ∼10 × 103 cells mL–1.
Experimental Design
The coccolithophores E. huxleyi (B92/11), G. oceanica (RCC 1303) and P. carterae (unknown strain number) were grown separately in a large volume (5 L) of medium and raised to high cell densities for the 3 predation experiments (∼275 × 103 E. huxleyi cells mL–1, ∼220 × 103 P. carterae mL–1, ∼130 × 103 G. oceanica mL–1), in order to have a certain margin for the dilution steps that followed later, when the concentrations between the treatments were adjusted and the grazer cultures was added (described below) (Figure 1). Thereupon, the coccolithophore cultures were incubated in the dark for 36 h to stop the growth of the cells. The first 12 h of the dark incubation corresponded to the regular 12-h night cycle during which cell division took place. The goal of the subsequent 24 h of darkness was to deplete the energy reserves of the coccolithophore cells through respiration, in order to reduce the ability of the cells to build a new layer of coccoliths in the dark after the decalcification treatment was completed. All further steps during the dark incubation were conducted under low light conditions (<0.01 μmol photons m–2 s–1) to keep energy inputs via photosynthesis at a minimum during handling.
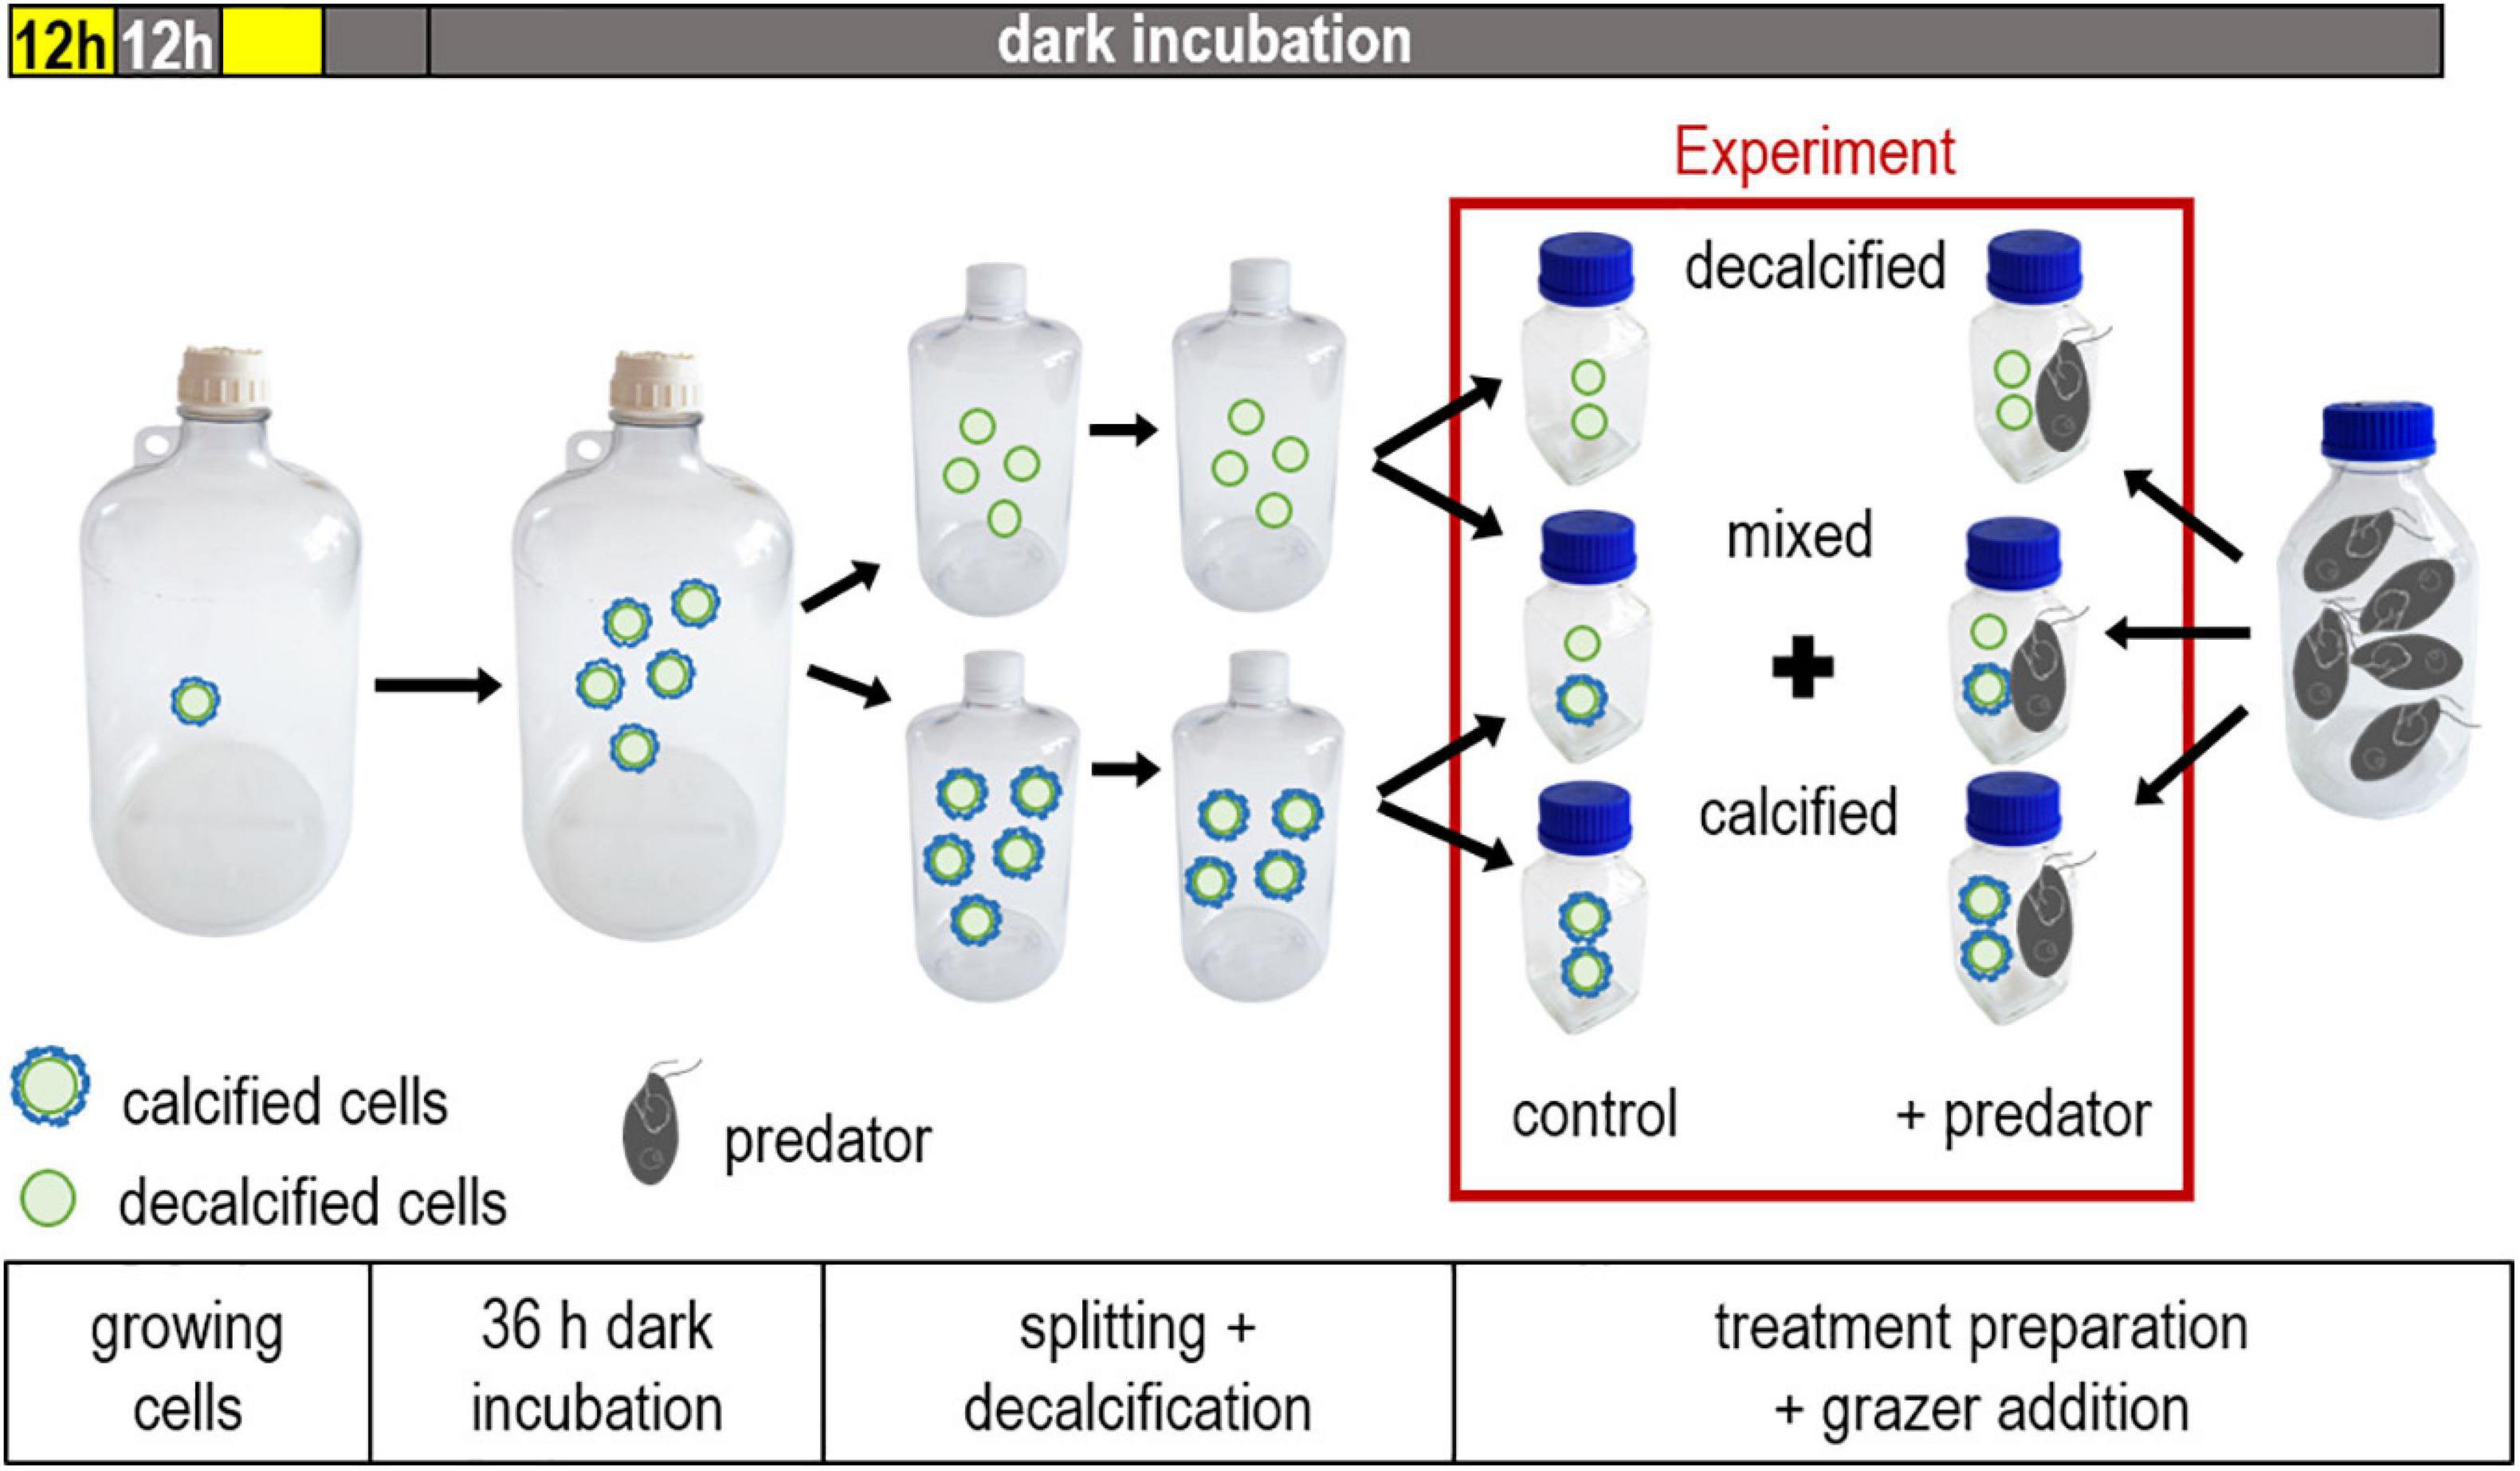
Figure 1. Overview of key steps for preparing each experiment. The coccolithophore cultures were raised to high cell concentrations in a 12:12 hour light-dark cycle followed by a dark incubation of 36 h to terminate growth. The culture was split and decalcified, thereafter treatments (calcified, decalcified and mixed) with approximately equal cell concentrations were prepared. Each experiment started with the addition of the predator. The treatment combinations used in the experiments are highlighted in the red box.
After 36 h in the dark we conducted the “decalcification step,” which was done with half of the population to remove the coccosphere of the treated cells (Figure 1). The large culture was split into two smaller bottles (2.3 L), one of which was treated with acid and base to remove the coccoliths. We added 2.5 mL 1M hydrochloric acid (HCl) L–1 to the cultures of E. huxleyi and P. carterae to dissolve the coccospheres. The cells of G. oceanica were decalcified by adding 3 mL of 1M HCl L–1 because this species is more heavily calcified. After the addition of the acid, the culture bottle was mixed for 1 min. Previous testing showed that the pH decreased to 4.3 during the brief acidification treatment. After this minute, the pH was brought back to the value before the acid addition by adding 1M sodium hydroxide (NaOH) solution. The bottles were rotated for 5 min to ensure that all flocculation from the addition of NaOH was dissolved. The decalcification procedure was conducted with a large culture volume (2.3 L) to keep the headspace at a minimum relative to the volume of the culture. In this way a potential degassing of CO2 during the low pH/high pCO2 period into the headspace of the volume was minimized. We tested this procedure in previous experiments to work out an appropriate volume of acid to be added to the cultures, which ensured the complete removal of the coccoliths (evaluated by microscopy) while keeping the decline of cell abundances at a minimum. However, cell concentrations always decreased to some extent due to the addition of the HCl and NaOH (by 6% for E. huxleyi, 18% for P. carterae, 7% for G. oceanica, of the target concentrations reported above). This was likely due to the contact with the highly concentrated acid and base at the time these were added. After the initial loss, the cell concentrations remained stable, which was determined by repeated flow cytometry measurements (as described below) over a period of 1 h. As the last step, the second (untreated) bottle with the calcified cells was diluted to an approximately equal concentration as in the acid-base treated bottles with 0.2 μm filtered artificial seawater. This facilitated the subsequent subdivision of both cultures into the replicate bottles of the individual treatments.
The content of both bottles containing either calcified or decalcified coccolithophores was split into eight replicate bottles (250 mL), respectively (Figure 1). Additionally, we established a mixed treatment by adding both, decalcified and calcified cells in a ∼ 1:1 mixture into eight replicate bottles. Thus, overall, we had a “decalcified” a “calcified” and a “mixed” treatment. Thereafter, an equal amount of the O. marina culture was added to the replicate bottles, some of which, however, were diluted with the same amount of 0.2 μm filtered artificial seawater instead and served as controls, to monitor the coccolithophore concentrations in the absence of the grazer. We took great care to keep the O. marina culture in a homogenous suspension during the addition by repeated mixing. All 8 bottles were mounted on a plankton wheel to prevent sedimentation of the algae. The experiments took place in complete darkness to minimize re-calcification of the decalcified cells and to prevent growth of the prey algae. Prey and predator abundances were sampled regularly, whereby the sampling took place under low light conditions as described above (Figure 1).
Enumeration of Prey and Predator Abundances
The coccolithophore concentrations were measured with a flow cytometer (Accuri C6, Becton Dickinson) at a flow rate of 66 μL min–1 from 1 mL subsamples that were taken from the replicate bottles and transferred into Eppendorf tubes. The coccolithophore population was identified based on the chlorophyll fluorescence signal (FL-3) versus the forward-scatter signal (FSC) using the BD Accuri C6 Software. Calcified cells scatter more light at right angles than decalcified cells so that both could be distinguished on the basis of their side-scatter signal (SSC) (Olson et al., 1989).
To enumerate the concentrations of O. marina, we took 20 mL subsamples, which were fixed with Lugol’s iodine (1% final concentration). In the experiment that was conducted with E. huxleyi the cell number of O. marina was counted with an inverted microscope (Zeiss Axiovert 100) using 10 mL Utermoehl sedimentation chambers. The numbers of O. marina in the experiments with G. oceanica and P. carterae were counted with Sedgewick counting chambers using a light microscope (Carl Zeiss).
Microscopic Observations
The cell size of the calcified and decalcified coccolithophores was measured via microscopy before the start of the experiment. 3.5 mL subsamples were taken from the initial cultures with calcified or decalcified cells before they were further split into the replicates. Subsamples were transferred onto slides for an inverted microscope (Zeiss Axiovert 100). Images were taken under 400-fold magnification with an Axiocam 105 color and cell diameters were measured with help of the ZEN 3.0 lite software (blue edition) (Carl Zeiss Microscopy GmbH). In addition, 3.5 mL subsamples were taken from single replicates that contained O. marina and either calcified or decalcified coccolithophores after 24, and 72 h, in order to observe grazer and prey interactions.
Data Analysis
The diameter of 20 calcified and decalcified cells of each species was determined and tested for significant differences in mean diameter with a Welch’s unequal variances t-test. The counts of O. marina between the start (5 h after the start in case of the E. huxleyi experiment) and end of each experiment were used to calculate growth rates of O. marina for each replicate: μ = (ln(xt)-ln(xt0))/(t-t0), where x = concentration of O. marina, t = time (in days). Differences in mean growth rates between the treatments were compared using an ANOVA. Data were tested for normal distribution and homogeneity of variances using Shapiro-Wilk and Levene’s tests, respectively. In case the null hypothesis of the ANOVA (mean growth rates are equal) was rejected (p < 0.05), a Tukey’s HSD test was used to compare the mean growth rates between treatments. Ingestion rates were calculated by dividing the difference in the prey cell concentration by the average predator concentration for a certain time interval, with the average predator concentration = (xt – xt0)/(ln(xt) – ln(xt0)) (Heinbokel, 1978).
Predation preferences of O. marina on calcified vs. decalcified coccolithophores within the mixed treatments were analyzed using the Chesson’s index α for depleting food densities (Manly et al., 1972; Chesson, 1983):
where n = cell concentration, i = ingested cells, and t = time. The index ranges from 0 to 1 and was calculated for every replicate. With only two prey types present, a value of α = 0.5 implies no preference for one of the two prey types and α < > 0.5 denotes that more cells of the respective type were consumed. A significant deviation of the mean α from 0.5 was tested with a Student’s t-test. Statistics were done using R 3.6.1 (R Core Team, 2019), and the packages car (Fox and Weisberg, 2019), and multcomp (Hothorn et al., 2008). Graphs were done with ggplot2 (Wickham, 2016).
Results and Discussion
In the controls without predator, the concentrations of decalcified and calcified cells of all three coccolithophore species remained stable during the prolonged darkness (Figures 2A–C). Thus, the decrease of coccolithophores observed in the treatments where they were exposed to O. marina (Figures 2D–F) was mainly due to predation. In all three experiments, the decalcified coccolithophores were consumed considerably faster than the calcified cells.
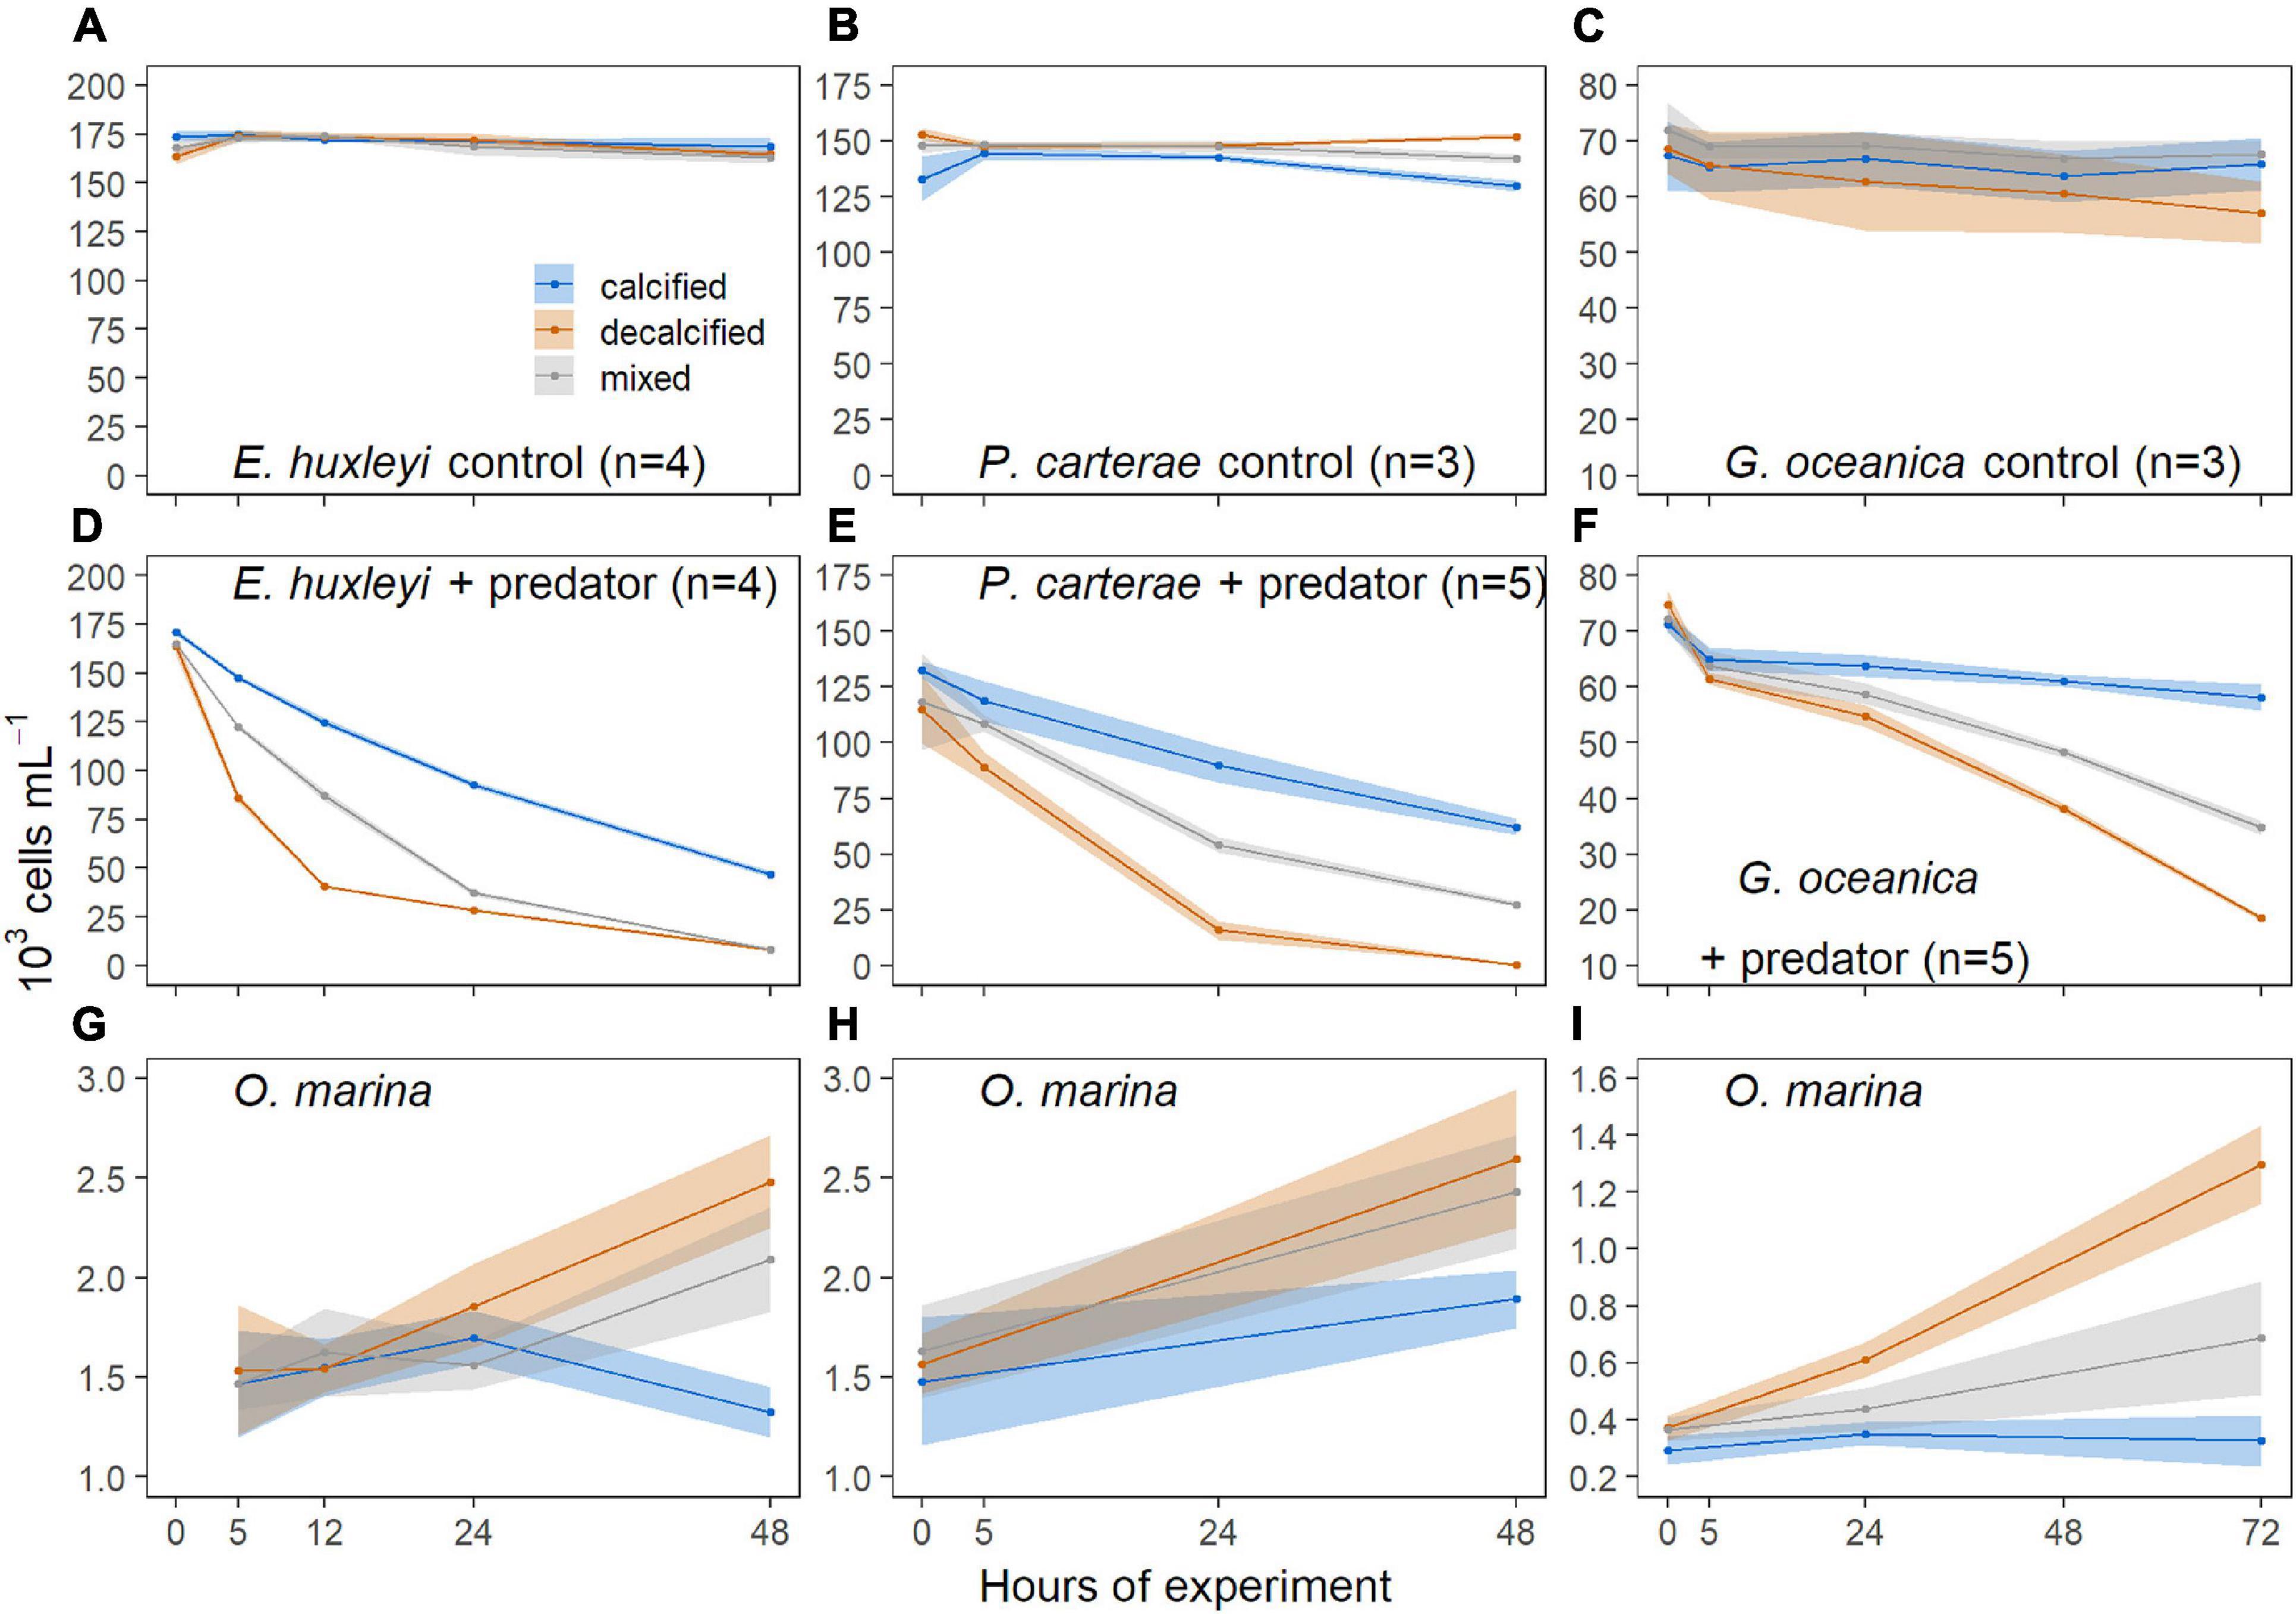
Figure 2. Concentrations (mean ± SD) of E. huxleyi (A,D), P. carterae (B,E), G. oceanica (C,F) in the treatments without (A–C) and with (D–F) predators. Concentrations (mean ± SD) of O. marina in the respective treatments with E. huxleyi (G), P. carterae (H), G. oceanica (I). Blue symbols = calcified, red = decalcified, gray = sum of calcified and decalcified cells in the mixed treatment.
The numbers of decalcified E. huxleyi decreased sharply within 12 h (Figure 2D) and fell below sufficient concentrations to maintain feeding saturation of the predator cells (see also Supplementary Figure 1), so that the ingestion rate of O. marina was limited by the supply of food (whereas under feeding saturation it is thought that the ingestion rate is limited by the predator’s capability to ingest and digest the prey items). The majority of the decalcified P. carterae was eaten up after 24 h (Figure 2E). The G. oceanica experiment was thereupon conducted with a higher prey to predator ratio, which ensured food supply for a longer period, so that the experiment could be continued for 72 h. The gray data points in Figure 2 represent the sum of both, calcified and decalcified cells within the mixed treatments. The total concentrations (calcified + decalcified) always showed an intermediate decline compared to the treatments that contained either calcified or decalcified cells only. In each experiment, O. marina showed a higher increase in abundance when decalcified coccolithophores were fed, compared to the treatments that contained calcified cells only (Figures 2G–I). The predator concentrations in the mixed treatments were located in between those of the other two, and were closer to the predator concentrations in the decalcified treatment in the experiments with E. huxleyi and P. carterae, but rather in the middle, or even closer to the concentrations in the calcified treatment in the G. oceanica experiment (Figures 2G–I).
In the E. huxleyi experiment, O. marina reached a mean growth rate of −0.046 ± 0.118 (SD) day–1 in the calcified treatment, 0.248 ± 0.148 (SD) d–1 in the decalcified, and 0.175 ± 0.078 (SD) d–1 in the mixed treatment. The effect of the treatment on growth of O. marina was significant [F (2,9) = 6.648, p = 0.0169], and the Tukey HSD test revealed that the growth rate was significantly higher in the decalcified treatment, compared to the calcified (p = 0.0164), but did not differ from the mixed treatment (p = 0.6735). Furthermore, the mean growth rate of the predators did not differ significantly between the calcified and mixed treatment (p = 0.0640).
In the P. carterae experiment, O. marina grew with a mean rate of 0.131 ± 0.108 (SD) d–1 in the calcified, 0.251 ± 0.056 (SD) d–1 in the decalcified, and 0.200 ± 0.069 (SD) d–1 in the mixed treatment. There was no significant difference in the mean growth rates between the treatments [F (2,12) = 2.793, p = 0.101].
In the experiment with G. oceanica, the mean growth rates of O. marina were 0.029 ± 0.098 (SD) d–1 in the calcified, 0.417 ± 0.051 (SD) d–1 in the decalcified, and 0.197 ± 0.128 (SD) d–1 in the mixed treatment, and differed significantly between all three treatments [F (2,12) = 19.79, p = 0.0002]: calcified-decalcified (p = < 0.001), calcified-mixed (p = 0.0455), decalcified-mixed (p = 0.0104).
Comparison of Ingestion Rates Between Coccolithophore Species
O. marina showed no growth when fed with calcified E. huxleyi and G. oceanica and only marginal growth when calcified P. carterae served as prey. It can be assumed that at the end of all three experiments, the prey concentrations in the calcified treatments were still sufficient to ensure feeding saturation of the grazers (Figure 2, compare Supplementary Figure 1 for E. huxleyi). Hence, the ingestion rates of O. marina on the different calcified coccolithophore species can be compared.
Overall, the mean ingestion rates of O. marina on the calcified coccolithophores were lower when calculated for the entire period of 48 h compared to the respective ingestion rates calculated for the initial 24 h of the experiments, suggesting that the digestion of prey particles that had already been ingested limited further food uptake (unless in the second half of the experiments the predator cells just ate less for other reasons). An average of 57 ± 5.3 (SD) calcified E. huxleyi predator–1 day–1, 26 ± 6.7 (SD) P. carterae, and 23 ± 7.0 (SD) G. oceanica pred. –1 d–1 were consumed during the first 24 h of the experiments. Between 24 and 48 h, additional 33 ± 3.4 E. huxleyi, 17 ± 4.1 P. carterae, and 6 ± 6.7 (SD) calcified G. oceanica pred. –1 d–1 were taken up. Ingestion rates calculated between 0 and 48 h were 21% lower in the E. huxleyi experiment, 18% lower for P. carterae and 36% lower for G. oceanica compared to the respective rates calculated for the period between 0 and 24 h. However, in the G. oceanica experiment, the decalcified cells were also still abundant after 48 h (Figure 2F), although the predator concentrations increased (Figure 2I). Here, O. marina ingested 35 ± 7.6 decalcified G. oceanica pred. –1 d–1 during the first 24 h and 22 ± 1.4 cells pred. –1 d–1 in the period between 24 to 48 h, when the ingestion rates were corrected with the calculated average predator concentrations during both intervals. Consequently, the ingestion rate of O. marina on decalcified G. oceanica were 37% lower in the second interval compared to the first 24 h.
Prey Preference of O. marina Within the Mixed Cultures
The decalcified cells of all three coccolithophore species could initially be distinguished from the calcified cells based on the strength of the side scatter signal measured with the flow cytometer. Both cell types appeared in two distinct clusters (Figure 3). However, a clear distinction between calcified and decalcified E. huxleyi was only possible until 24 h after the start of the experiment. Thereafter, the cluster of the decalcified cells overlapped with the cluster of the calcified cells, thereby impeding their differentiation in the flow cytograms (Figure 3). As a consequence, an increasing fraction of the initially decalcified cells was enumerated as calcified cells, which is why the concentrations of the latter increased between 24 to 48 h after the start (Figure 4A). More calcified than decalcified E. huxleyi cells were consumed during the first 24 h [α = 0.58 ± 0.003 (SD), t (3) = 53.29, p < 0.0001] and the calcified cells were eaten up completely after 48 h, whereas some decalcified were still left (Figure 4B).
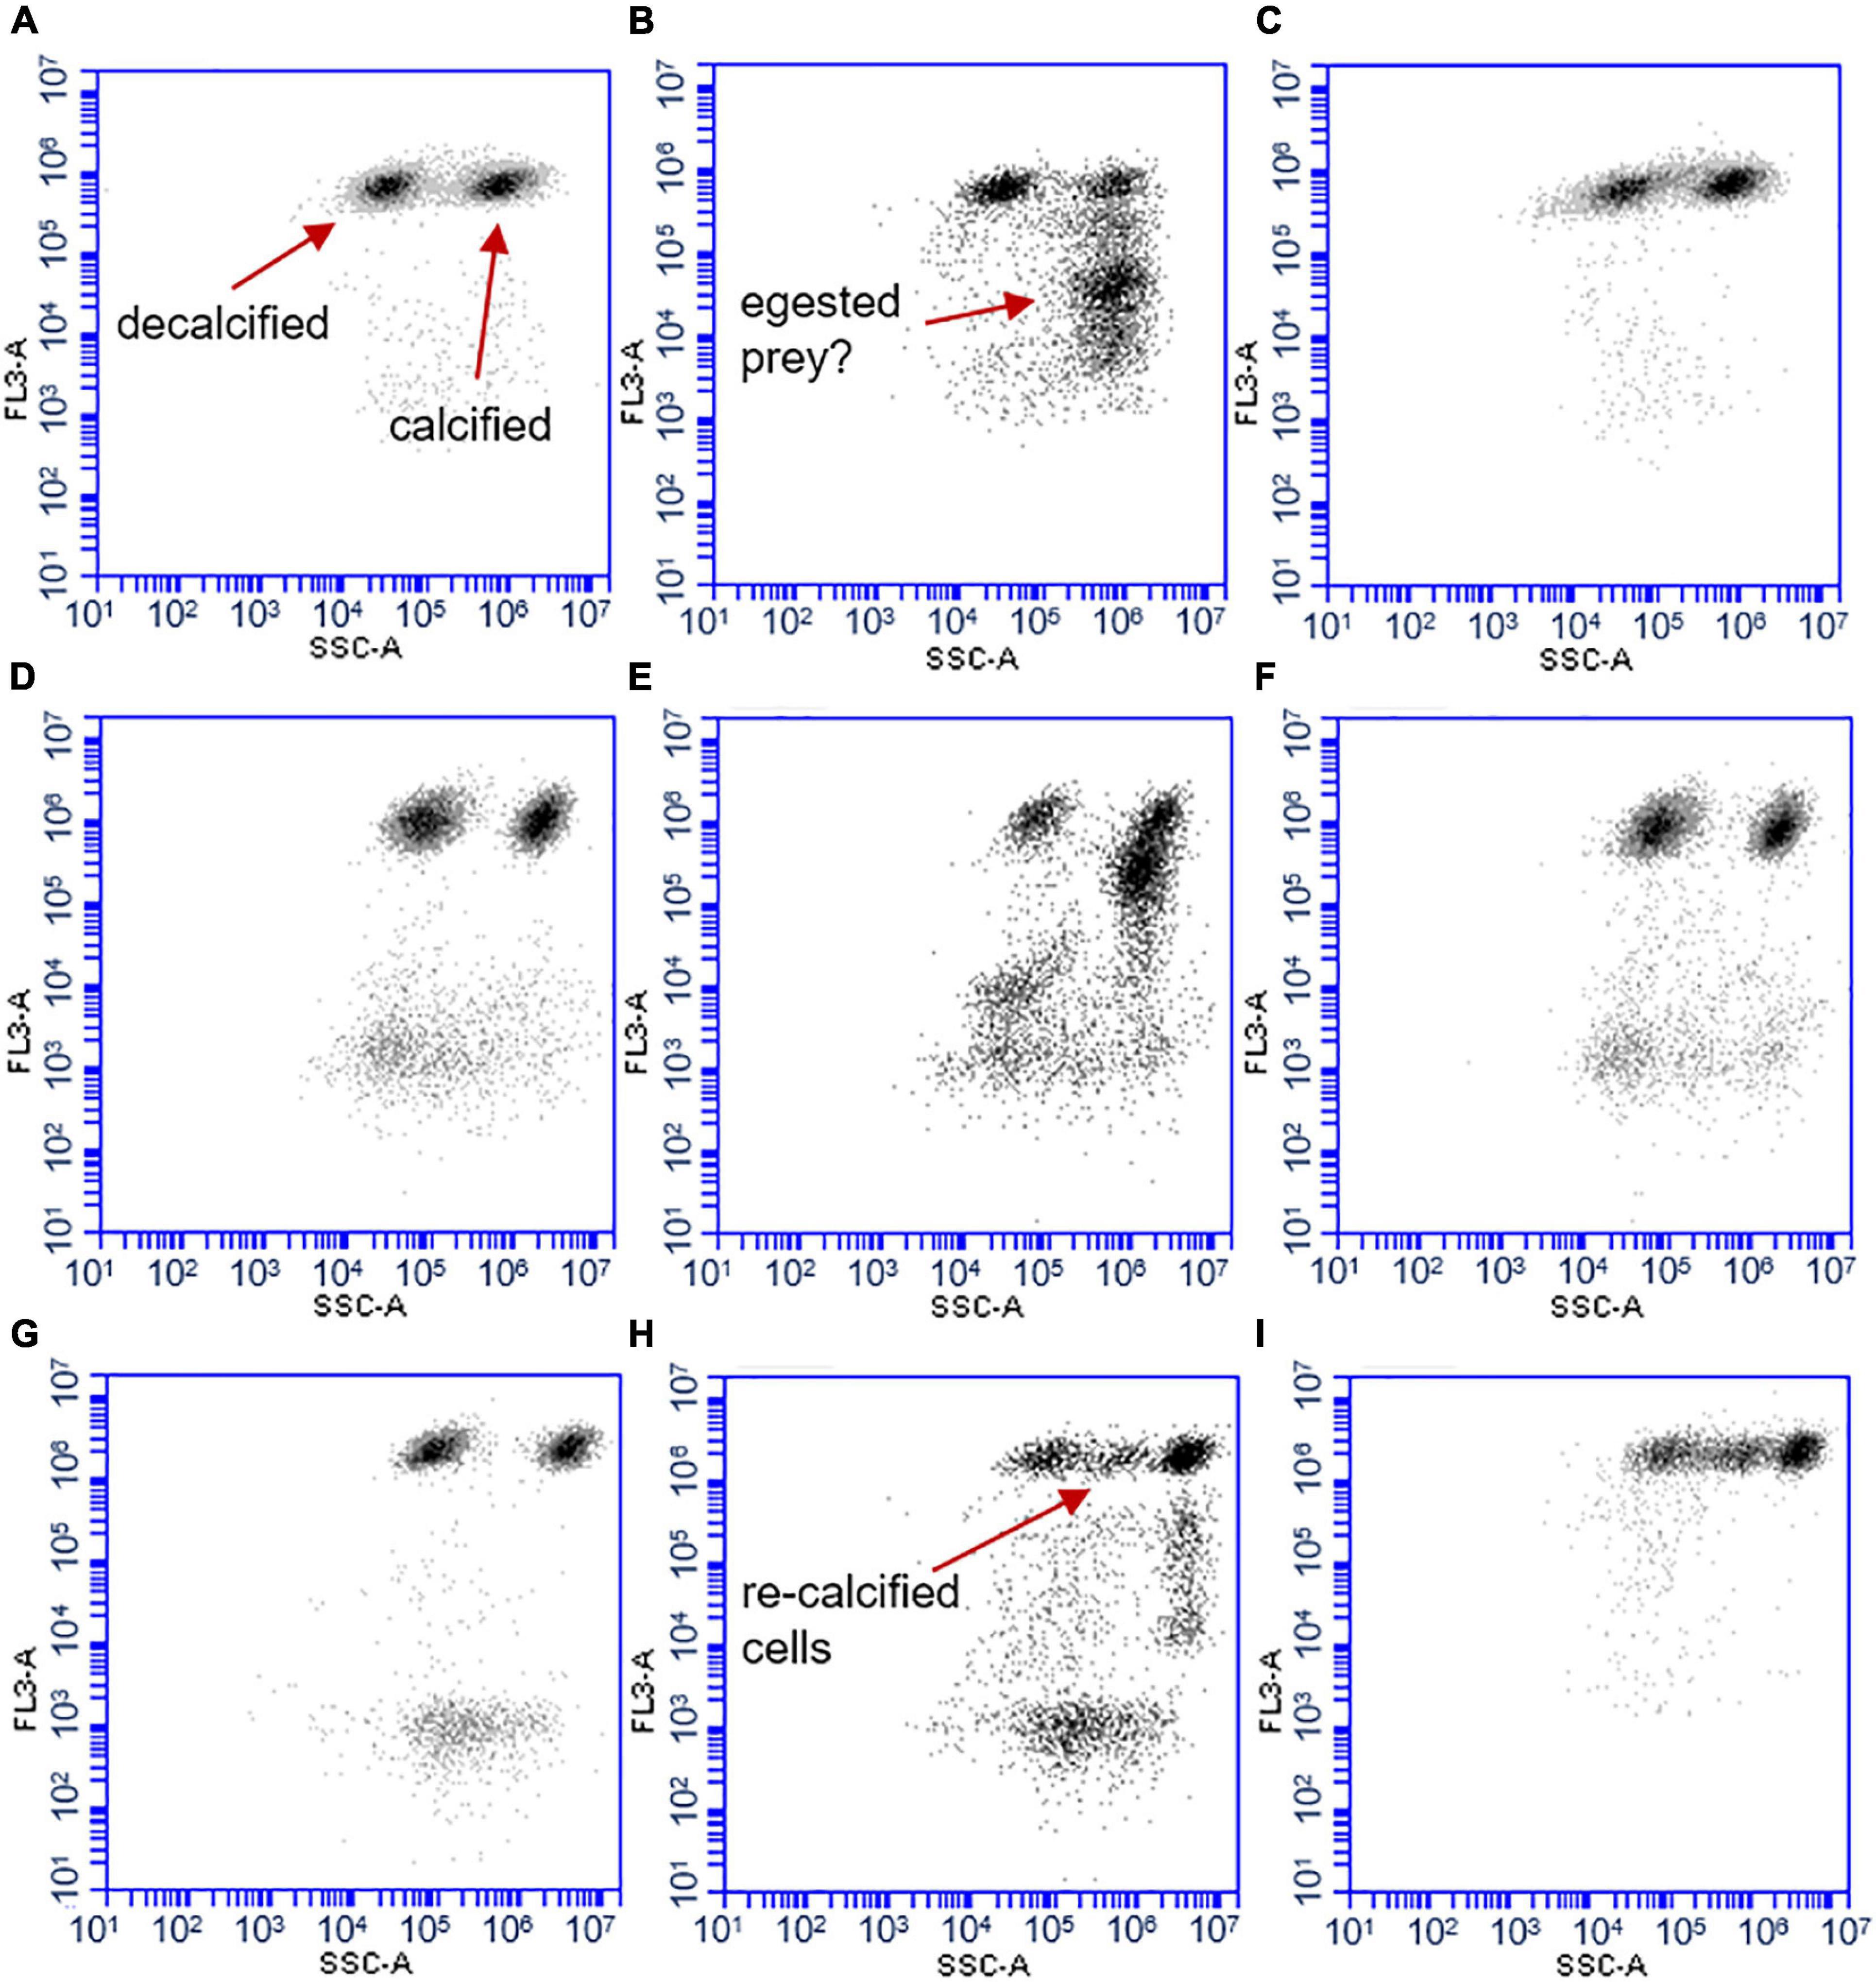
Figure 3. Cytograms of mixed cultures that contained both, decalcified and calcified coccolithophores. Decalcified coccolithophores display lower side-scatter signals (SSC-A on the x-axes, strength of the signal without unit) than the calcified cells (FL3-A on y-axes = red fluorescence). Cytograms of an E. huxleyi culture with grazers (A) at the start, (B) after 24 h, (C) control without grazers after 24 h. (D) P. carterae at start, (E) after 24 h, (F), control after 24 h. (G) G. oceanica start (H) after 72 h (I), control without predators after 72 h.
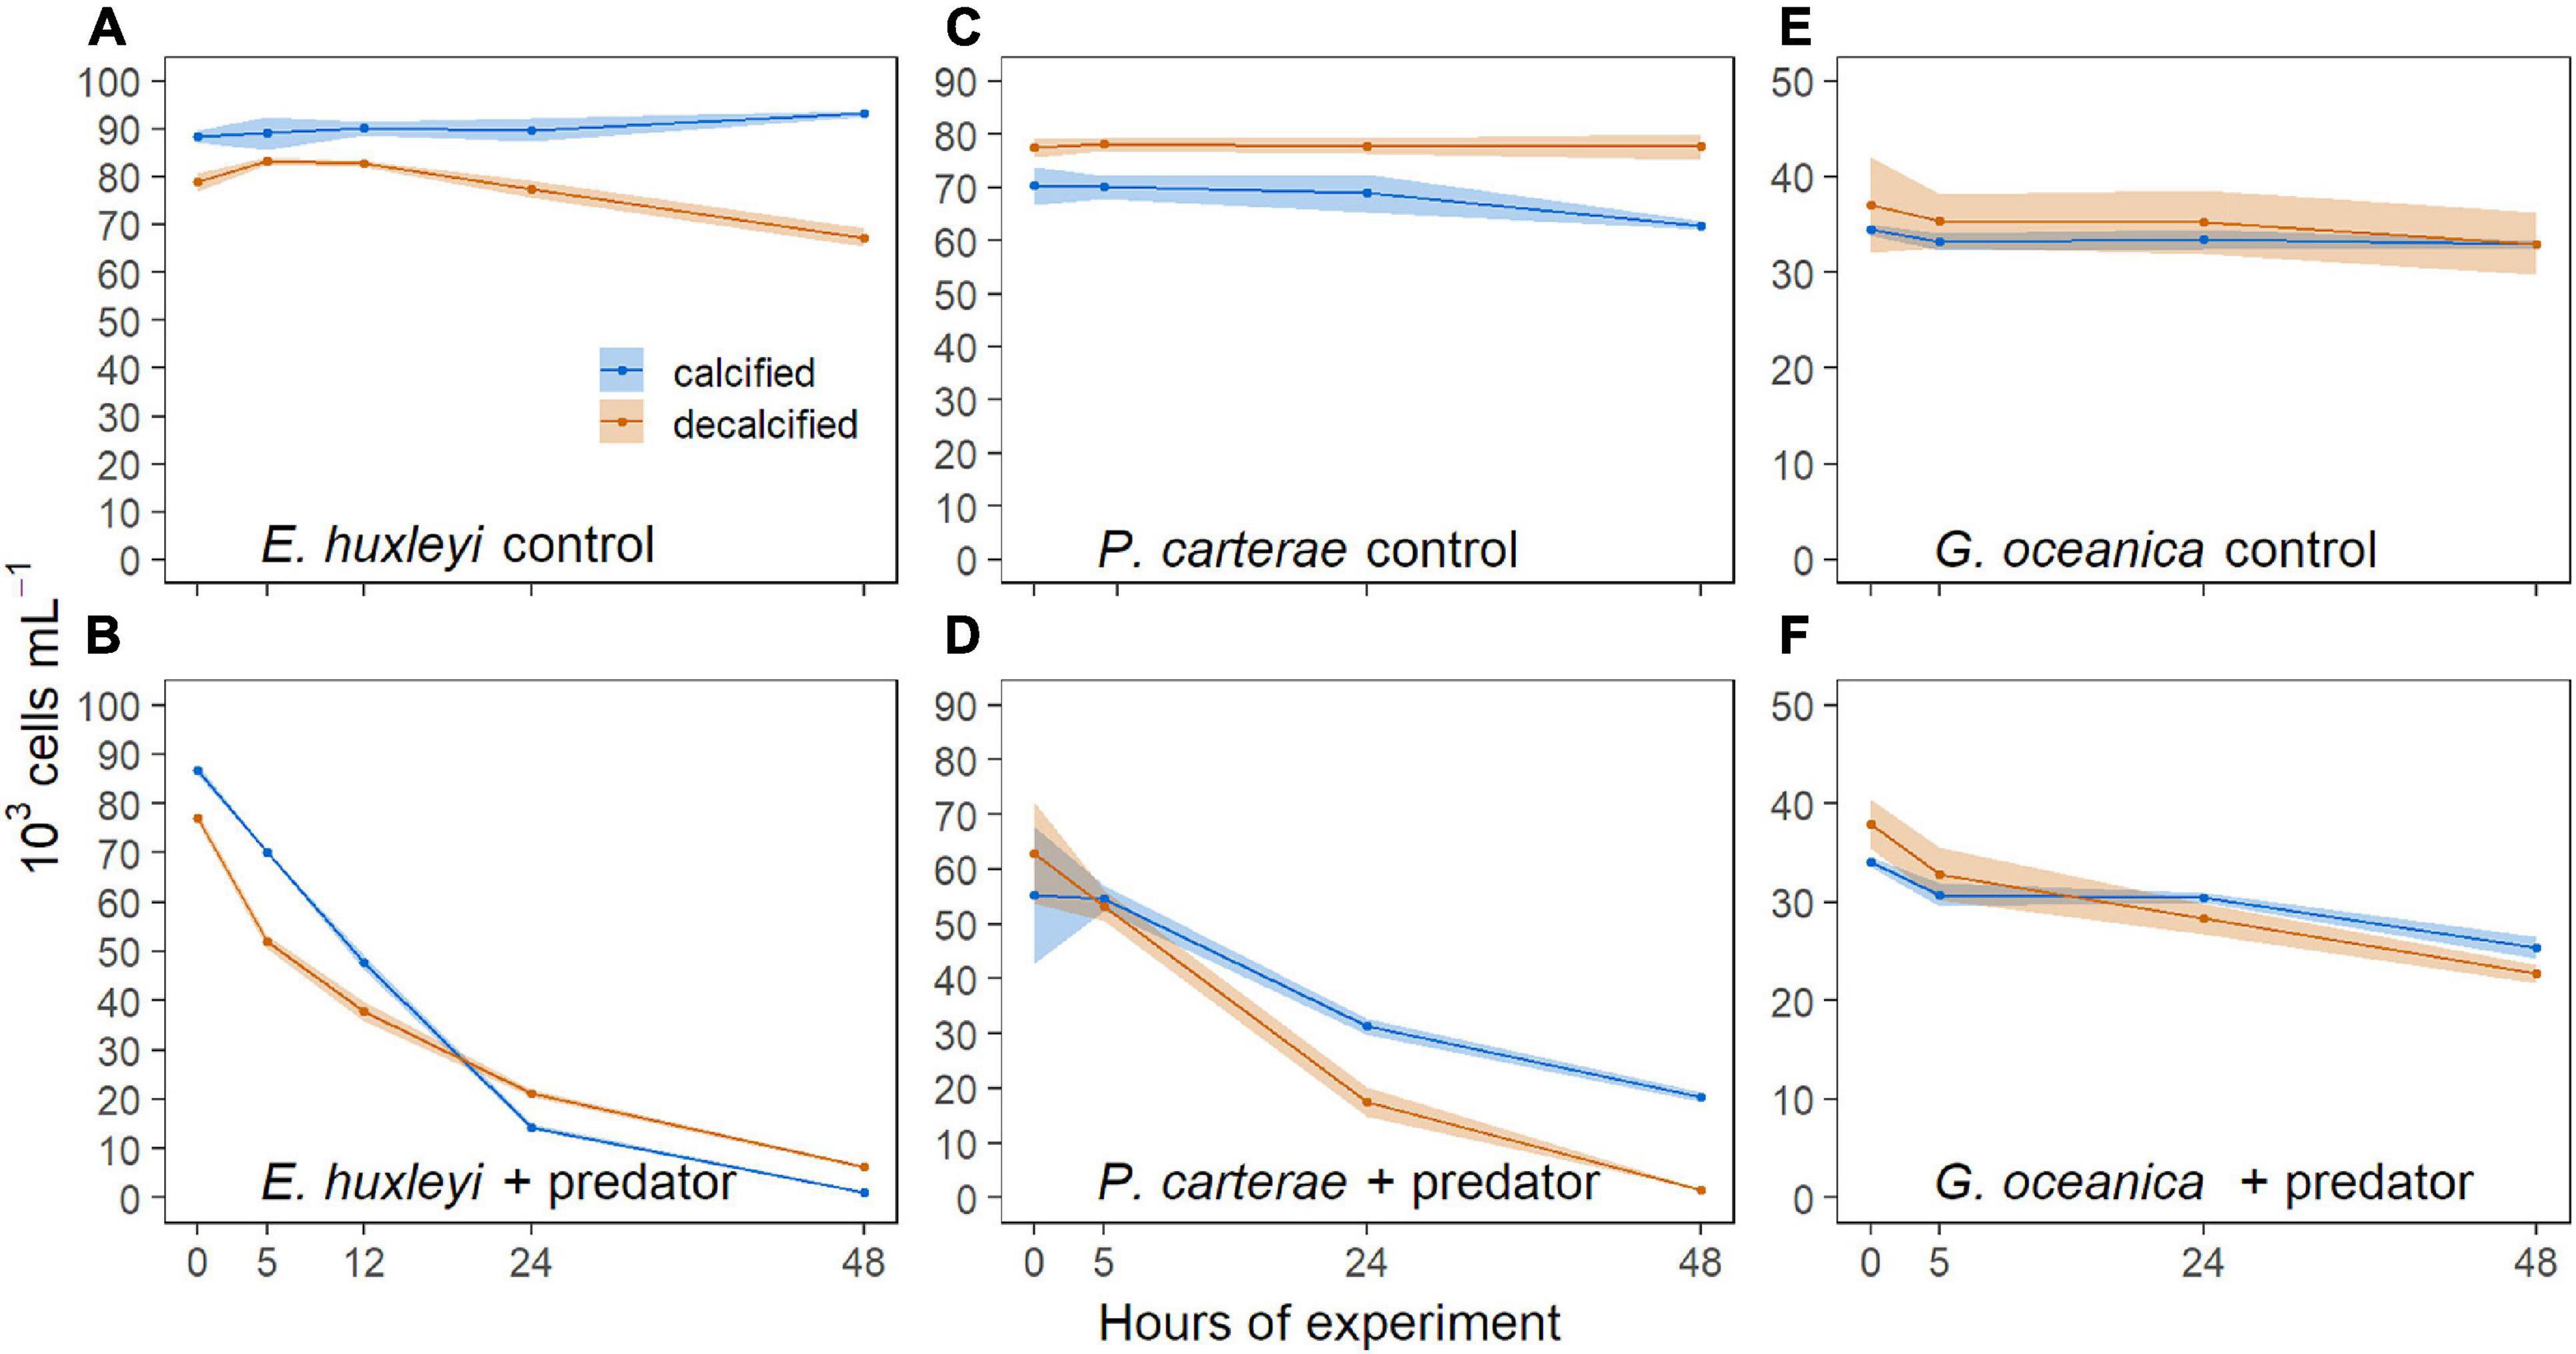
Figure 4. Concentrations (mean ± SD) of calcified (blue) and decalcified (red) cells within the mixed treatment. (A) E. huxleyi without, and (B) with grazers. (C) P. carterae without and (D) with predators. (E) G. oceanica without and (F) in the presence of O. marina.
Calcified and decalcified P. carterae could be distinguished from each other throughout the experiment in the mixed treatment based on the SSC and remained stable in concentration when predators were absent (Figure 4C). More decalcified than calcified P. carterae were consumed during the first 24 h of the experiment [α = 0.71 ± 0.09 (SD), t(4) = 5.63, p = 0.0049] and the decalcified cells were completely gone after 48 h (Figure 4D).
The decalcified G. oceanica were able to produce new coccoliths in the dark whereby the SSC of the cells increased. These re-calcified cells formed an intermediate cluster in the flow cytogram that was located in between those formed by the decalcified and the calcified cells, respectively (Figures 3H,I). Nevertheless, the cluster of calcified G. oceanica could be distinguished from the cluster of decalcified cells within the first 24 h of the experiment, during which O. marina ingested more decalcified than calcified G. oceanica [α = 0.73 ± 0.05 (SD), t (4) = 10.89, p = 0.0004] (Figures 4E,F). The intermediate cluster of re-calcified cells in the cytograms was more scattered when predators were present compared to the controls (Figures 3H,I). The mean SSC of the cluster of decalcified cells increased less over the course of the experiment when O. marina was present. This was also the case in the treatment that contained decalcified cells only, indicating that the grazers preferred the re-calcified cells (Supplementary Figure 2).
In the presence of O. marina, additional particle clusters could be observed on the cytograms, which were lower in red fluorescence than the coccolithophore cells, but showed similar FSC and SSC signals indicating they were of similar size (Figure 3). The additional particle cluster did not appear in the controls, but only in the presence of predators. Particles were more abundant in the cultures with calcified coccolithophores and likely represent egested food items.
Cell Size of Calcified and Decalcified Cells
The decalcified coccolithophores were smaller than the respective calcified cells: The mean diameter of decalcified E. huxleyi [3.77 ± 0.23 (SD) μm] was significantly smaller than the mean diameter of the calcified cells [4.81 ± 0.55 (SD) μm] [t (26) = 7.88, p < 0.0001]. This was also the case for P. carterae [decalcified = 8.50 ± 0.73 (SD) μm; calcified = 10.52 ± 1.02 (SD) μm; t (34) = 7.22, p < 0.0001] and G. oceanica [decalcified = 5.41 ± 0.74 (SD) μm; calcified = 7.01 ± 0.45 (SD) μm; t (31) = 8.27, p < 0.0001]. Calculations of spherical volumes (V = 4/3πr3) from the measured diameters showed that the volume (organic cell + coccosphere) of all three calcified species was roughly twice as large as the volume of the decalcified cells (organic only) (∼58 vs. ∼28 μm3 for E. huxleyi, ∼610 vs. ∼322 μm3 for P. carterae, ∼180 vs. ∼83 μm3 for G. oceanica). Thus, more decalcified cells could be taken up per individual predator simply due to their smaller size. The flow cytometry data suggest that the calcified E. huxleyi suffered less from the prolonged dark period than the decalcified cells (Supplementary Figure 3). The measurements showed that the chlorophyll fluorescence of the decalcified cells declined stronger and further indicate that the decalcified cells decreased slightly in size over the course of the experiment. However, this effect was small compared to the absolute difference between both treatments (Supplementary Figure 3).
Microscopic Observations
Observations that were done during (and after) the experiments from single replicates that contained either calcified or decalcified cells showed that more decalcified than calcified cells fit into an individual O. marina (Figure 5). Moreover, calcified cells inside the predator kept their shape and many of the O. marina cells that had ingested several calcified coccolithophores looked deformed (Figure 5A). It also needs to be mentioned that P. carterae is a motile species. At the high concentrations at which P. cartarae was grown prior to the start of the experiment a large fraction of cells was not moving in both treatments. However, the decalcified cells became sticky and we could often observe pairs of cells moving stuck together. The potential reduction of mobility of these decalcified cells could facilitate the uptake by O. marina.
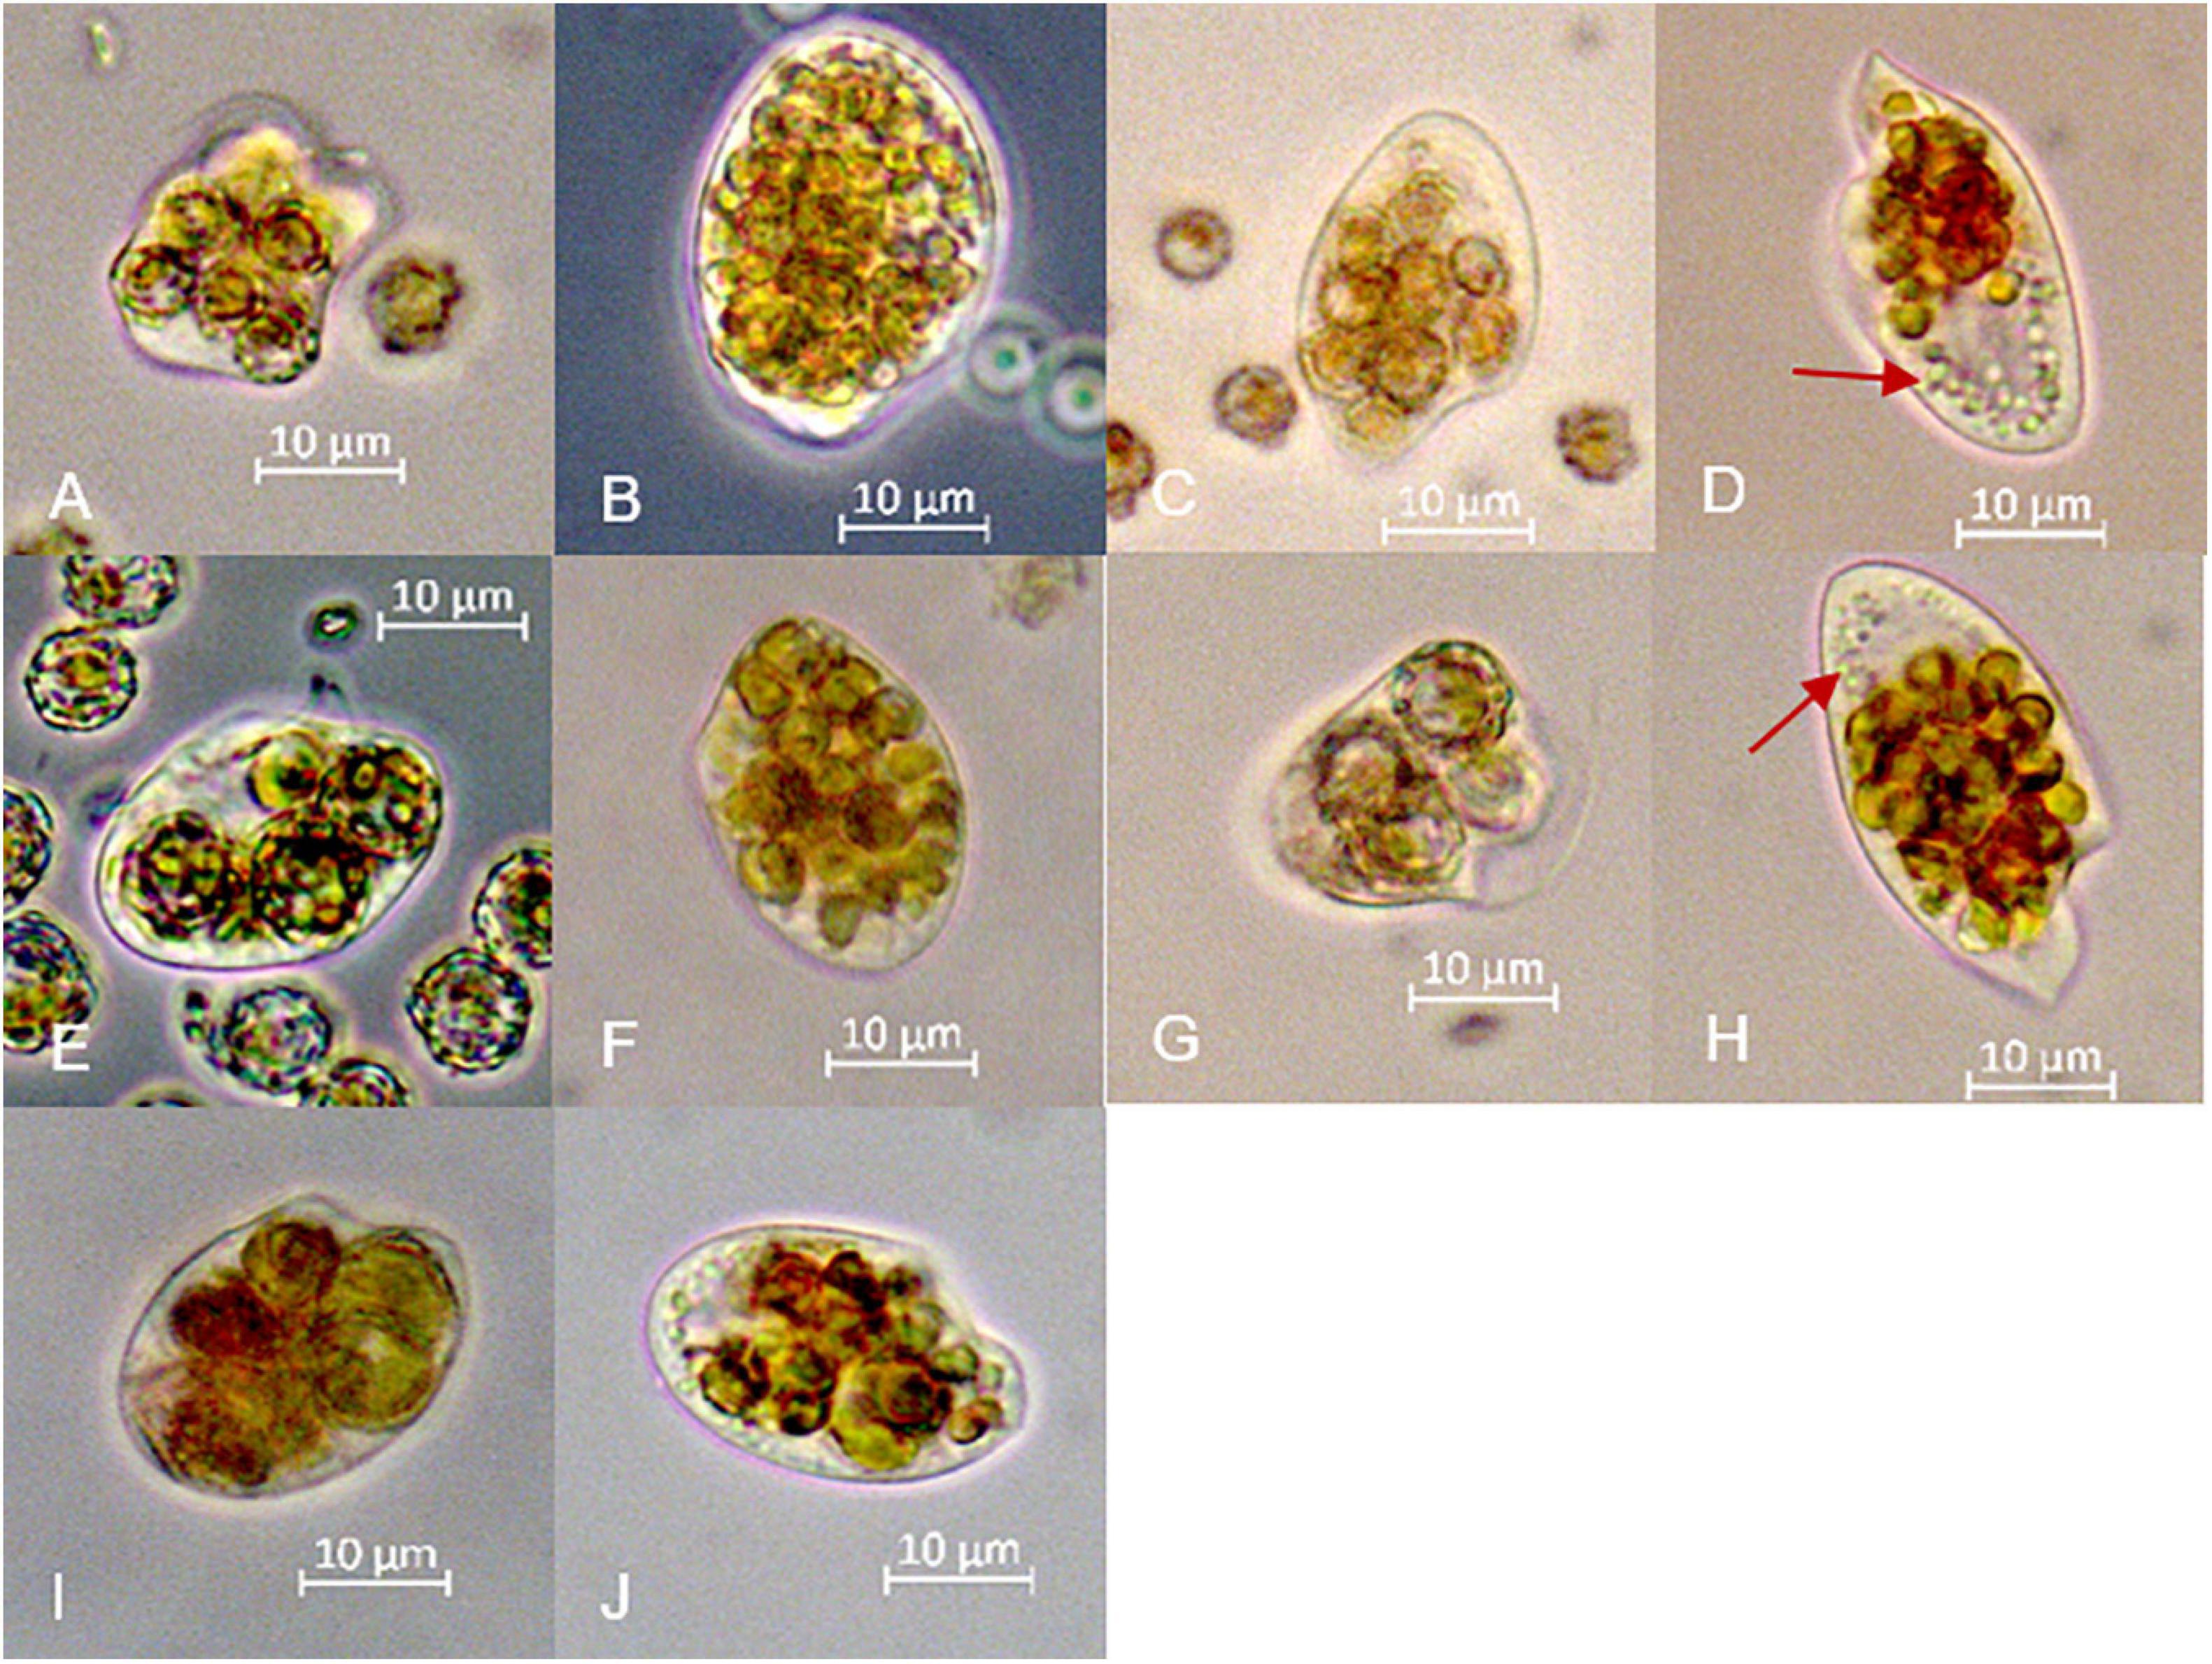
Figure 5. Microscopic images of different individuals of O. marina with ingested prey. (A) calcified and (B) decalcified E. huxleyi after 24 h. (C) calcified and (D) decalcified E. huxleyi after 72 h. (E) calcified and (F) decalcified G. oceanica after 24 h and (G) calcified (H) decalcified cells after 72 h. (I) calcified and (J) decalcified P. carterae after 24 h. Red arrows point to the small spherical objects in the apical part of the predatory cells, which resemble prey cells in an advanced stage of digestion.
Live O. marina were highly motile and thus difficult to observe and to photograph. However, they occasionally stopped their continuous spiral movement and remained motionless for a short period, during which some individuals sank to the bottom of the microscope slide and could be photographed. Pictures had to be taken quickly, which in part explains the lack of focus in some of them. The relatively few observations do not allow quantitative statements and, of course, can be challenged with respect to their representativeness regarding the bulk population of O. marina. Nevertheless, they provided important insights into prey digestion. After 72 h some individuals of O. marina that fed decalcified coccolithophores showed small inclusions (Figures 5D,H) that resembled coagulated prey items under progressive digestion as described by Öpik and Flynn (1989). We were not able to discover similar patterns in cells of O. marina that were fed with calcified coccolithophores, suggesting limited digestion of calcified cells. However, the lack of this observation may also have been due to the fact, however, that remnants of calcified cells were obscured by freshly engulfed cells, which were still abundant at the end of the experiments in contrast to the decalcified cells (Figure 2). We once observed an individual of O. marina egesting a relatively undigested calcified cell of E. huxleyi (Figure 6). The entire egestion process took about 15 min, during which the predator barely moved. In contrast, we observed another specimen that was packed with several calcified cells of E. huxleyi that rounded up its shape. It egested two virtually empty coccospheres within minutes and moved quickly out of sight (Figure 7).
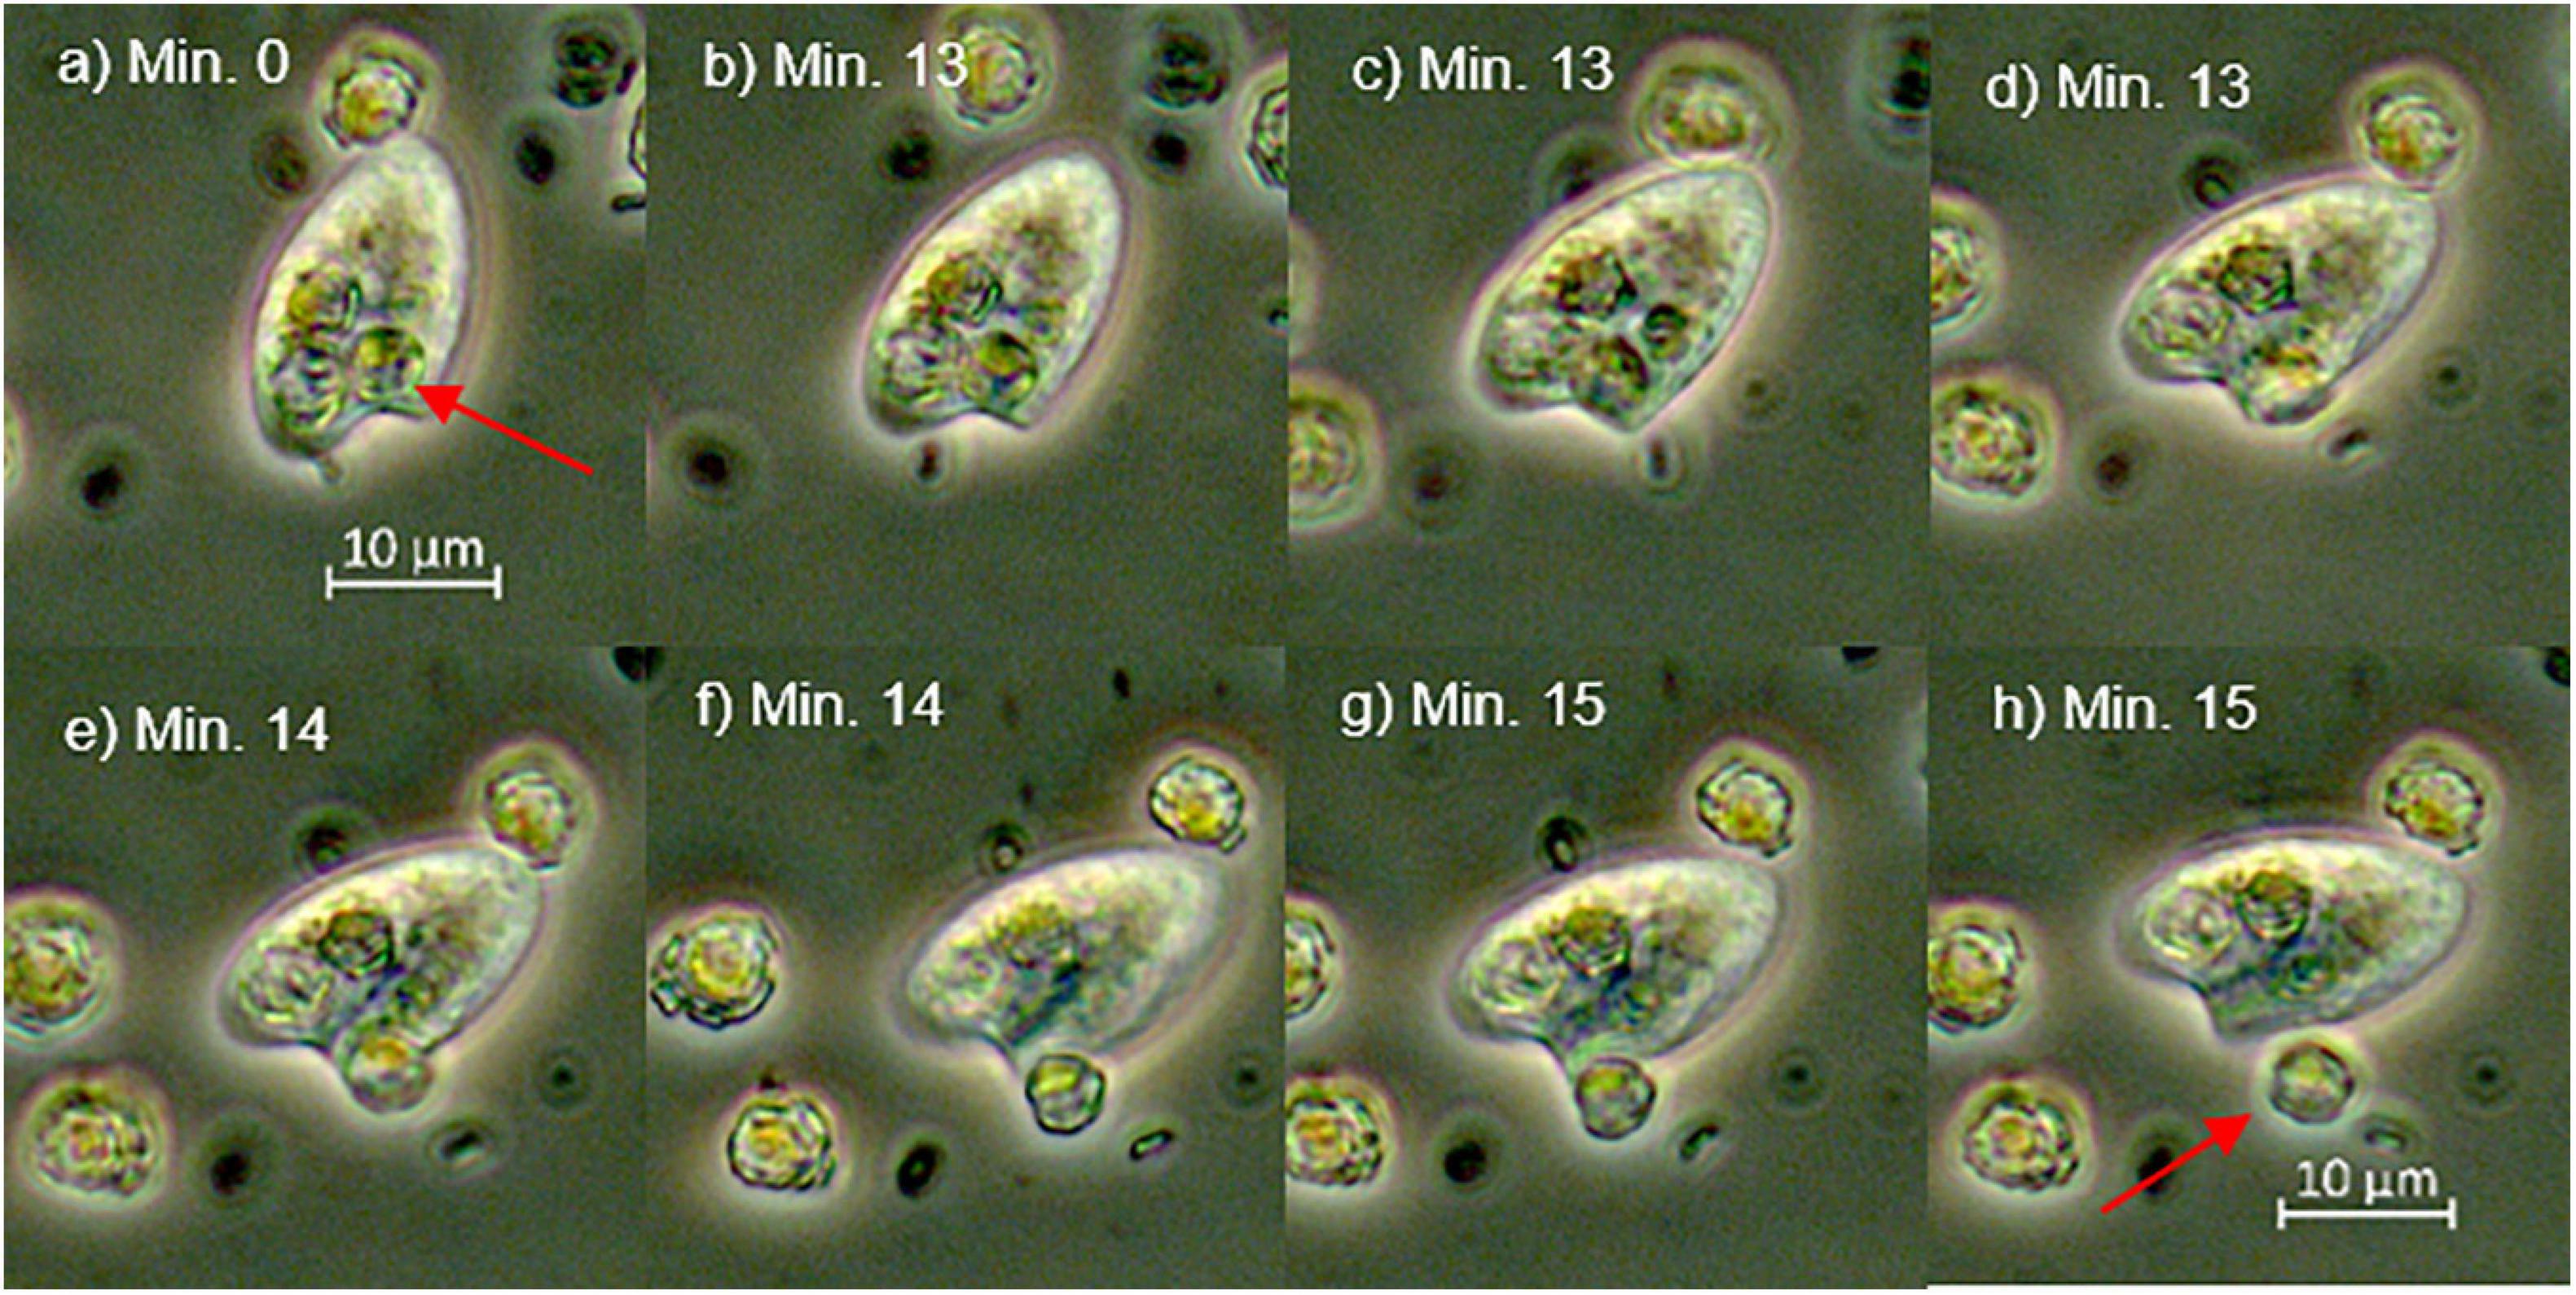
Figure 6. This set of photos (a–h) show an O. marina specimen egesting a cell of E. huxleyi (red arrow). Prey egestion occurred within 3 min. Images were taken in a separate experiment where cells of E. huxleyi were not incubated for 36 h in the dark. The images vary slightly with respect to the focal plane.
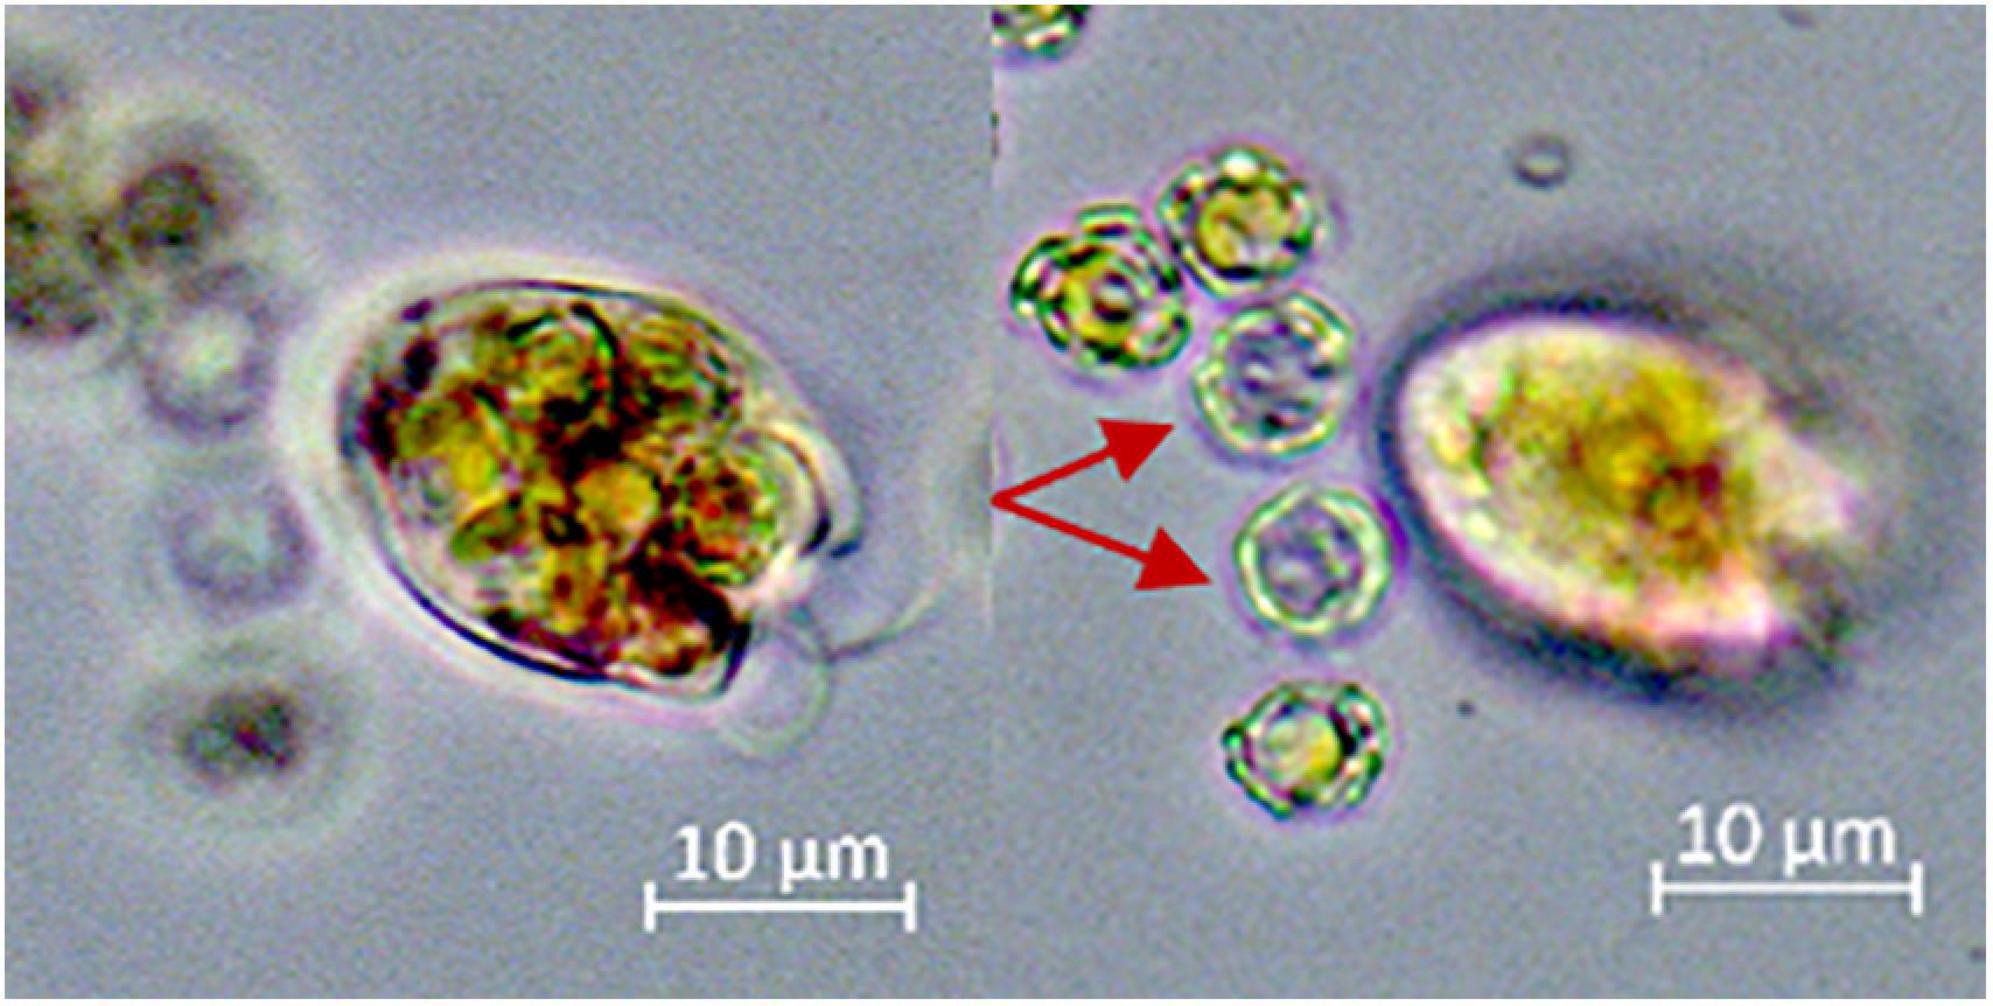
Figure 7. The figure shows two images taken from the same cell of O. marina in different focal planes. The predator was packed with several E. huxleyi and egested visually empty coccospheres (red arrows) within a few seconds.
Effects of Calcification on Growth of O. marina
Öpik and Flynn (1989) described O. marina as voracious predator. It feeds by engulfing several prey particles one after another until there is no further space to take up more. Ingested food particles are then assimilated successively (Öpik and Flynn, 1989; Roberts et al., 2011). The microscopic observations showed that the coccolithophores E. huxleyi, P. carterae and G. oceanica fit well into the prey size spectrum of the predator. Within the pure cultures that contained either calcified or decalcified coccolithophores, the decalcified cells disappeared faster due to predation. Furthermore, O. marina was able to grow when feeding on decalcified coccolithophores but not, or at reduced rates, when feeding on calcified cells. Growth inhibition through calcification was most pronounced when O. marina was fed with the most heavily calcified species (G. oceanica) and least pronounced when fed with the least calcified one (P. cartarae). This suggests that growth inhibition due to calcification is positively correlated with the relative proportion of calcite to organic carbon in the prey (compare Figure 8). We propose 3 possible mechanisms to explain how the coccosphere could have reduced grazer growth. These will be discussed consecutively in the following but they are not mutually exclusive.
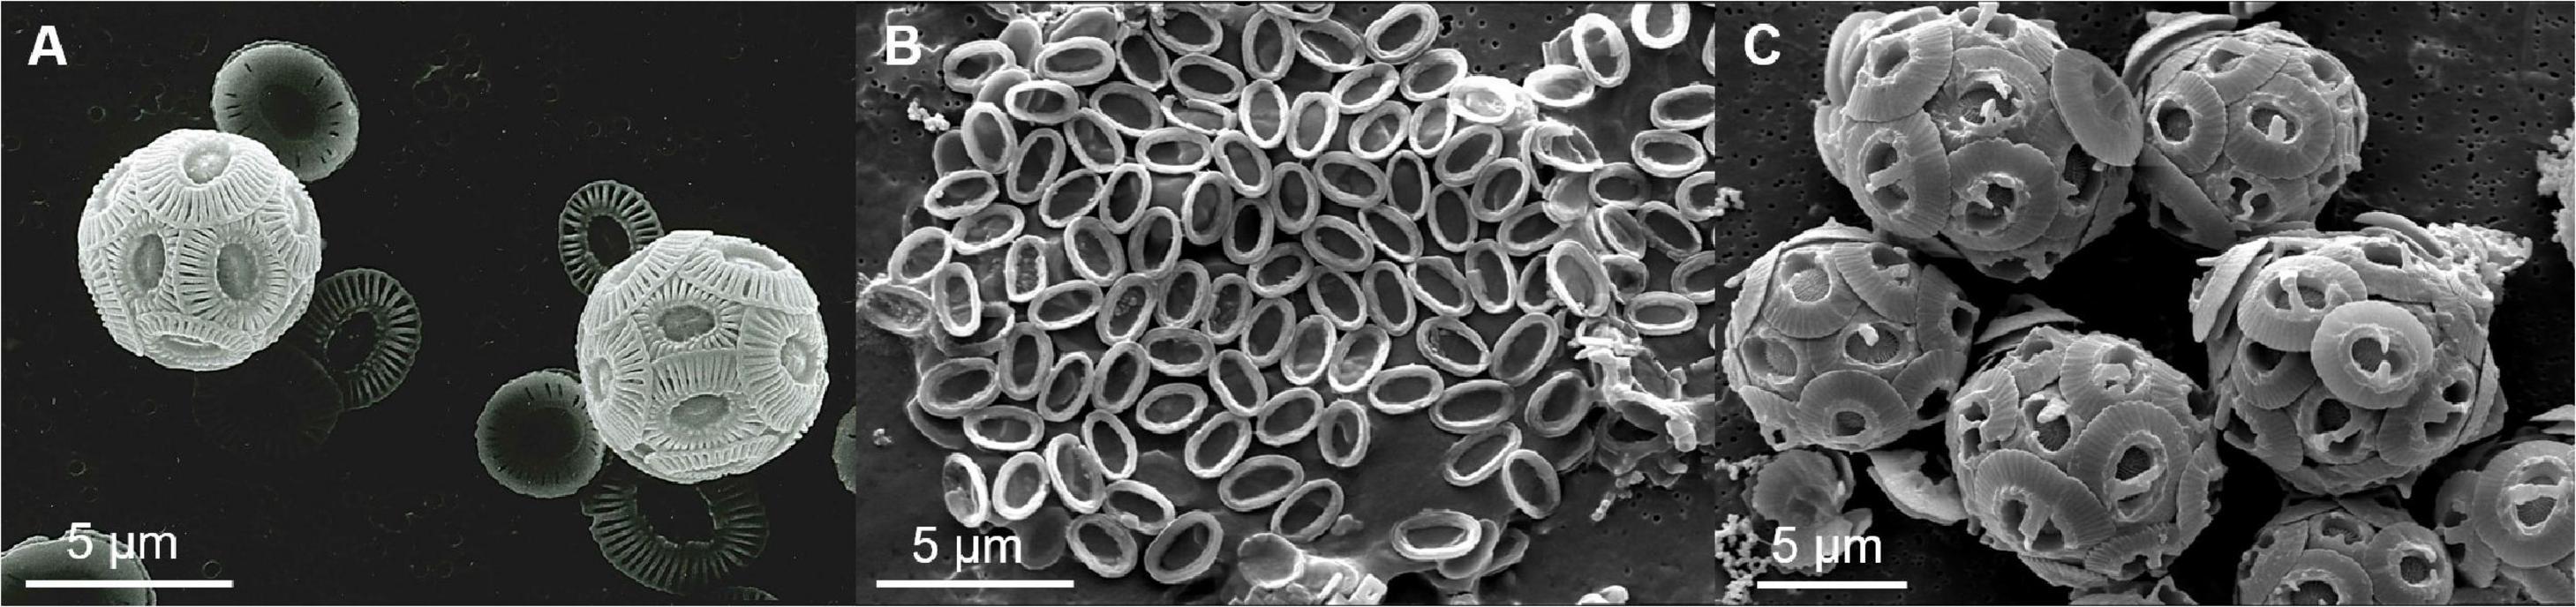
Figure 8. Scanning electron micrographs of individual coccolithophore species from the respective strains used in the experiments (see methods). (A) Coccospheres of E. huxleyi. (B) collapsed coccosphere of P. carterae. (C) Coccospheres of G. oceanica. The pictures (B,C) were kindly provided by Dr. Giulia Faucher and were published previously in a study that compared physiological and morphological characters of four coccolithophore species under different abiotic conditions (Faucher et al., 2020).
(I) Calcification of coccolithophores complicates digestion in phagotrophic protozoa: O. marina must cope with the coccosphere before reaching the nutritious organics of the cell. Our results are consistent with the findings of Harvey et al. (2015), who observed higher growth rates of O. marina when fed with naked E. huxleyi compared to calcified E. huxleyi strains. The coccosphere may impede the direct access of the digestive machinery to the valuable organics, thereby slowing down digestion. Harvey et al. (2015) hypothesized that the ingested CaCO3 may impede the digestive process by buffering the acidic pH in the food vacuoles of the predator. Acidic digestion has been demonstrated in some protozoa and may be common in phagotrophic microzooplankton (Mast, 1947; González et al., 1993; Barbeau et al., 1996; Kodama and Fujishima, 2005). According to this hypothesis, the predatory O. marina cell has to counteract the pH increase in the food vacuoles due to carbonate dissolution to sustain an acidic environment for the optimal functioning of digestive enzymes. The microscopic observations of egested prey cells presented in Figure 6 (and Supplementary Figure 4) lend some support for a dissolution of the CaCO3 inside O. marina (compare the egested cell to the healthy E. huxleyi in Figure 6; but note that it remains to be tested whether the seemingly smaller coccosphere is due to corrosion or some coccoliths simply fell off). This specimen of O. marina was apparently not able to effectively digest the engulfed E. huxleyi. In contrast, the specimen of O. marina in Figure 7 egested visually empty coccospheres and therefore seems capable to assimilate the organic material inside the coccosphere. The empty coccospheres shown in Figure 7 may correspond to those flow cytometry populations that have a similar SSC value but a reduced fluorescence signal compared to healthy E. huxleyi (Figure 3; egested prey). The putative cluster of “egested cells” in Figure 3 suggests that egestion of “empty” coccospheres is common. Thus, in addition to (or instead of) buffering a potentially acidic digestive environment, the coccosphere could also slow down digestion simply by impeding the access to the valuable organics of the prey cells.
(II) The coccosphere reduces the space to incorporate more cells: The coccosphere roughly doubles the total volume of the coccolithophore and O. marina is unable to destruct the coccospheres after ingestion. Thus, calcified cells require twice as much space within the digestive compartments of O. marina, which is likely to be detrimental for the turnover of organic material. The impact of this volume effect can be seen very clearly in Figure 5 where much more de-calcified cells fit into O. marina. Furthermore, the volume effect would be even higher in those species which have spines or other coccolith extensions. Almost 50% of heterococcolith-bearing species have such extensions, suggesting that the volume effect on digestion is potentially relevant for many coccolithophores (Monteiro et al., 2016).
(III) The coccosphere adds ballast to the grazer thereby making it less agile: The ingestion of the coccosphere adds significant ballast to the predator since CaCO3 is 2.7 times denser than organic material. The uptake of large amounts of CaCO3 may increase the demand of energy needed for locomotion, counteracting gravitational sinking, and impact swimming speed and prey encounter rate.
Preference for Calcified or Decalcified Coccolithophores by Oxyrrhis marina?
It has been shown that O. marina is size-selective (Hansen et al., 1996; Strom et al., 2012). Our results show that O. marina consumed more of the calcified than decalcified E. huxleyi. In contrast, more decalcified P. carterae and G. oceanica were ingested. Furthermore, the results of the flow cytometry measurements indicate that re-calcified cells of G. oceanica were primarily eaten. The results suggest that the differences in ingestion rates between calcified and decalcified coccolithophores within the mixed treatments were more likely due to the size of the prey algae than due to calcification. With regard to the prey size, O. marina preferred the larger calcified E. huxleyi (∼4.8 μm), which was the smallest of the three coccolithophore species that was tested in our experiments, but the smaller decalcified cells of P. carterae (∼8.5 μm), which was the largest species (calcified ∼10.5 μm) (Figure 8). This is consistent with previous findings that O. marina feeds optimally on prey sizes > 4 μm (Roberts et al., 2011).
The results suggest that calcification does not prevent O. marina from ingesting coccolithophores and confirm previous findings that the coccosphere does not deter protozoan grazers (Harvey et al., 2015; Strom et al., 2018; Mayers et al., 2020). It remains a key question, however, whether other microzooplankton species that are better adapted to natural phytoplankton communities would be able to select against calcified species. Protozoa that are capable to avoid calcareous cells and to select for more easily digestible food items would potentially have a clear advantage as they likely grow faster. The ability of O. marina to chemoreception is well developed. It has been shown that the grazer is able to select prey items based on their food quality (Meunier et al., 2012). Moreover, O. marina has been shown to feed on artificial particles that are flavored with organic molecules (Hammer et al., 2001), and is able to distinguish between artificial particles that are coated with different carbohydrate-binding proteins (Wootton et al., 2007).
Prey concentrations and encounter rates are much lower under natural conditions than in our experiments. In nature, protozoa usually need to browse large volumes of seawater to be able to cover their nutritional demand (Kiørboe, 2011), suggesting that they rarely have a choice to select their food. It has been argued that selection likely favors the evolution of chemosensory receptors in protozoa in order to seek for prey along chemical gradients (Breckels et al., 2011). The question is whether selection favors the evolution of appropriate receptors to detect an inorganic shell surrounding an otherwise attractive prey item in such a dilute environment.
Our results indicate that coccolithophore calcification can reduce the feeding efficiency and growth of phagotrophic protozoa. The benefit of this effect for coccolithophores is likely depending on their dominance within the bulk phytoplankton community. In a scenario where the calcified coccolithophore is a minor component of the phytoplankton community accessible to a non-selective protozoan, the decrease in predation pressure due to ingested calcite will primarily benefit the non-calcareous phytoplankton in the community. This is because competing non-calcifying species do not contribute to the substantial energetic burden associated with calcification (Monteiro et al., 2016), whereas they still benefit from the reduced predation pressure. However, reduced growth of the grazer through calcification will benefit coccolithophores that dominate the phytoplankton community and attenuate the top-down control on their proliferation (Harvey et al., 2015).
Conclusion
Our results show that coccolithophore calcification influences prey ingestion by O. marina primarily by altering the prey size. This can increase or decrease ingestion rates depending on the preferred size spectrum of the grazer. In contrast to ingestion, prey digestion is reduced by calcification. We concur with Harvey et al. (2015) that reduced digestion rates could be due to detrimental buffering of acidic digestion via intracellular calcium carbonate dissolution. Additionally, the coccosphere may simply impede the access to the organic part of the cell and/or handicap the swimming abilities of the predator by ballasting. We could show that the coccosphere strongly reduces the intracellular space for prey items inside the predator. This constitutes a simple, yet effective mechanism to impede digestion rates. However, we found that the coccosphere provides no direct protection against O. marina since it does not motivate the predator to select against calcified cells.
Data Availability Statement
The original contributions presented in the study are publicly available. This data can be found here: https://doi.pangaea.de/10.1594/PANGAEA.932273.
Author Contributions
MH and LB designed the study. MH, FD’A, and OK performed the experiments and conducted the measurements. MH, LB, and UR wrote the manuscript. All authors contributed to the article and approved the submitted version.
Funding
This research was funded by the German Science Foundation (DFG) (BA5188/1-1).
Conflict of Interest
The authors declare that the research was conducted in the absence of any commercial or financial relationships that could be construed as a potential conflict of interest.
Acknowledgments
We thank Urban Tillmann for providing a culture of O. marina, Ute Schuldt and Sebastian Meier for their support during SEM of E. huxleyi, Giulia Faucher and Elisabetta Erba for providing SEM pictures of P. carterae and G. oceanica. Furthermore, we thank the reviewers for valuable comments that significantly helped to improve the manuscript.
Supplementary Material
The Supplementary Material for this article can be found online at: https://www.frontiersin.org/articles/10.3389/fmars.2021.664269/full#supplementary-material
Supplementary Figure 1 | Functional response of O. marina to different prey concentrations of calcified (blue) and decalcified (red) E. huxleyi. In a separate experiment, both cell types were kept separately in different concentrations in 20 bottles, that contained ∼2000 O. marina mL–1 each. (A–D) Measurements took place 2.5–48 h after the start of the experiment.
Supplementary Figure 2 | Decalcified G. oceanica produced new coccoliths over the course of the experiments, which caused an increase in their side scatter signal (SSC) measured via flow cytometry. The increase in SSC was less pronounced when predators were present, suggesting that the re-calcified cells were eaten preferentially.
Supplementary Figure 3 | Development of the forward scatter (FSC) as a measure of size, and the red (chlorophyll) fluorescence (FL-3) of calcified and decalcified coccolithophores in the controls over the course of the experiments.
Supplementary Figure 4 | The set of images shows an individual O. marina specimen that ingested a Coccolithus braarudii cell. The predatory cell was moving quickly and difficult to photograph. We were not able to adjust the white balance in the first photo in the upper left, which shows a cell of C. braarudii inside O. marina (a). The microscopy slide was kept at 18°C in the dark for about 18 h and we were able to rediscover the same individual on the following day. We found it slowly moving at the bottom of the slide (b–f). After some time, it started to rotate intensely whereby it egested the prey item (g–o) and moved on (p).
References
Bach, L. T., Riebesell, U., and Schulz, K. G. (2011). Distinguishing between the effects of ocean acidification and ocean carbonation in the coccolithophore Emiliania huxleyi. Limnol. Oceanogr. 56, 2040–2050. doi: 10.4319/lo.2011.56.6.2040
Barbeau, K., Moffett, J. W., Caron, D. A., Croot, P. L., and Erdner, D. L. (1996). Role of protozoan grazing in relieving iron limitation of phytoplankton. Nature 380, 61–64. doi: 10.1038/380061a0
Boakes, D. E., Codling, E. A., Thorn, G. J., and Steinke, M. (2011). Analysis and modelling of swimming behaviour in Oxyrrhis marina. J. Plankton Res. 33, 641–649. doi: 10.1093/plankt/fbq136
Bown, P. R., Lees, J. A., and Young, J. R. (2004). “Calcareous nannoplankton evolution and diversity through time,” in Coccolithophores-From Molecular Processes to Global Impact, eds H. R. Thierstein and J. R. Young (Berlin: Springer), 481–508.
Breckels, M. N., Roberts, E. C., Archer, S. D., Malin, G., and Steinke, M. (2011). The role of dissolved infochemicals in mediating predator-prey interactions in the heterotrophic dinoflagellate Oxyrrhis marina. J. Plankton Res. 33, 629–639. doi: 10.1093/plankt/fbq114
Broecker, W., and Clark, E. (2009). Ratio of coccolith CaCO3 to foraminifera CaCO3 in late Holocene deep sea sediments. Paleoceanography 24:PA3205. doi: 10.1029/2009PA001731
Brussaard, C. P. D. (2004). Viral Control of Phytoplankton Populations—a Review. J. Eukaryot. Microbiol. 51, 125–138. doi: 10.1111/j.1550-7408.2004.tb00537.x
Calbet, A., and Landry, M. R. (2004). Phytoplankton growth, microzooplankton grazing, and carbon cycling in marine systems. Limnol. Oceanogr. 49, 51–57. doi: 10.4319/lo.2004.49.1.0051
Chesson, J. (1983). The Estimation and Analysis of Preference and Its Relationship to Foraging Models. Ecology 64, 1297–1304. doi: 10.2307/1937838
Faucher, G., Riebesell, U., and Bach, L. T. (2020). Can morphological features of coccolithophores serve as a reliable proxy to reconstruct environmental conditions of the past? Clim. Past 16, 1007–1025. doi: 10.5194/cp-16-1007-2020
Fileman, E. S., Cummings, D. G., and Llewellyn, C. A. (2002). Microplankton community structure and the impact of microzooplankton grazing during an Emiliania huxleyi bloom, off the Devon coast. J. Mar. Biol. Assoc. U. K. 82, 359–368. doi: 10.1017/S0025315402005593
Fox, J., and Weisberg, S. (2019). An R Companion to Applied Regression, 3rd Edn. Thousand Oaks CA: Sage.
Frankignoulle, M., Canon, C., and Gattuso, J.-P. (1994). Marine calcification as a source of carbon dioxide: Positive feedback of increasing atmospheric CO2. Limnol. Oceanogr. 39, 458–462. doi: 10.4319/lo.1994.39.2.0458
González, J. M., Sherr, B. F., and Sherr, E. B. (1993). Digestive enzyme activity as a quantitative measure of protistan grazing: the acid lysozyme assay for bacterivory. Mar. Ecol. Prog. Ser. 100, 197–206.
Guillard, R. R. L., and Ryther, J. H. (1962). Studies of marine planktonic diatoms: i. Cyclotella nana hustedt, and detonula confervacea (cleve) gran. Can. J. Microbiol. 8, 229–239. doi: 10.1139/m62-029
Hamm, C., and Smetacek, V. (2007). “Armor: Why, When, and How,” in Evolution of Primary Producers in the Sea, eds P. G. Falkowski and A. H. B. T. Knoll (Delhi: Academic Press), 311–332.
Hammer, A., Grüttner, C., and Schumann, R. (2001). New biocompatible tracer particles: use for estimation of microzooplankton grazing, digestion, and growth rates. Aquat. Microb. Ecol. 24, 153–161.
Hansen, F., Witte, H., and Passarge, J. (1996). Grazing in the heterotrophic dinoflagellate Oxyrrhis marina: size selectivity and preference for calcified Emiliania huxleyi cells. Aquat. Microb. Ecol. 10, 307–313.
Harvey, E. L., Bidle, K. D., and Johnson, M. D. (2015). Consequences of strain variability and calcification in Emiliania huxleyi on microzooplankton grazing. J. Plankton Res. 37, 1137–1148. doi: 10.1093/plankt/fbv081
Haunost, M., Riebesell, U., and Bach, L. T. (2020). The Calcium Carbonate Shell of Emiliania huxleyi Provides Limited Protection Against Viral Infection. Front. Mar. Sci. 7:735.
Hay, W. W. (2004). “Carbonate fluxes and calcareous nannoplankton,” in Coccolithophores-From Molecular Processes to Global Impact, eds H. R. Thierstein and J. R. Young (Berlin: Springer), 509–528.
Heinbokel, J. F. (1978). Studies on the functional role of tintinnids in the Southern California Bight. I. Grazing and growth rates in laboratory cultures. Mar. Biol. 47, 177–189. doi: 10.1007/BF00395638
Höhfeld, I., and Melkonian, M. (1998). Lifting the Curtain? The Microtubular Cytoskeleton of Oxyrrhis marina (Dinophyceae) and its Rearrangement during Phagocytosis. Protist 149, 75–88. doi: 10.1016/S1434-4610(98)70011-2
Honjo, S., Manganini, S. J., Krishfield, R. A., and Francois, R. (2008). Particulate organic carbon fluxes to the ocean interior and factors controlling the biological pump: A synthesis of global sediment trap programs since 1983. Prog. Oceanogr. 76, 217–285. doi: 10.1016/j.pocean.2007.11.003
Hothorn, T., Bretz, F., and Westfall, P. (2008). Simultaneous Inference in General Parametric Models. Biom. J. 50, 346–363. doi: 10.1002/bimj.200810425
Johns, C. T., Grubb, A. R., Nissimov, J. I., and others. (2019). The mutual interplay between calcification and coccolithovirus infection. Environ. Microbiol. 21, 1896–1915. doi: 10.1111/1462-2920.14362
Kester, D. R. I, Duedall, W., Connors, D. N., and Pytkowicz, R. M. (1967). Preparation of artificial seawater. Limnol. Oceanogr. 12, 176–179. doi: 10.4319/lo.1967.12.1.0176
Kiørboe, T. (2011). How zooplankton feed: mechanisms, traits and trade-offs. Biol. Rev. 86, 311–339. doi: 10.1111/j.1469-185X.2010.00148.x
Klaas, C., and Archer, D. E. (2002). Association of sinking organic matter with various types of mineral ballast in the deep sea: Implications for the rain ratio. Global Biogeochem. Cycles 16, 14–63. doi: 10.1029/2001GB001765
Kodama, Y., and Fujishima, M. (2005). Symbiotic Chlorella sp. of the ciliate Paramecium bursaria do not prevent acidification and lysosomal fusion of host digestive vacuoles during infection. Protoplasma 225, 191–203. doi: 10.1007/s00709-005-0087-5
Lowe, C. D., Keeling, P. J., Martin, L. E., Slamovits, C. H., Watts, P. C., and Montagnes, D. J. S. (2011). Who is Oxyrrhis marina? Morphological and phylogenetic studies on an unusual dinoflagellate. J. Plankton Res. 33, 555–567. doi: 10.1093/plankt/fbq110
Manly, B. F. J., Miller, P., and Cook, L. M. (1972). Analysis of a Selective Predation Experiment. Am. Nat. 106, 719–736. doi: 10.1086/282808
Mayers, K. M. J., Poulton, A. J., Bidle, K., and others. (2020). The Possession of Coccoliths Fails to Deter Microzooplankton Grazers. Front. Mar. Sci. 7:569896. doi: 10.3389/fmars.2020.569896
Mayers, K. M. J., Poulton, A. J., Daniels, C. J., and others. (2019). Growth and mortality of coccolithophores during spring in a temperate Shelf Sea (Celtic Sea, April 2015). Prog. Oceanogr. 177:101928. doi: 10.1016/j.pocean.2018.02.024
Meunier, C. L., Hantzsche, F. M., Cunha-Dupont, A. Ö, Haafke, J., Oppermann, B., Malzahn, A. M., et al. (2012). Intraspecific selectivity, compensatory feeding and flexible homeostasis in the phagotrophic flagellate Oxyrrhis marina: three ways to handle food quality fluctuations. Hydrobiologia 680, 53–62. doi: 10.1007/s10750-011-0900-4
Montagnes, D. J. S., Lowe, C. D., Roberts, E. C., and others. (2011). An introduction to the special issue: Oxyrrhis marina, a model organism? J. Plankton Res. 33, 549–554. doi: 10.1093/plankt/fbq121
Monteiro, F. M., Bach, L. T., Brownlee, C., and others. (2016). Why marine phytoplankton calcify. Sci. Adv. 2:e1501822. doi: 10.1126/sciadv.1501822
Müller, M. N. (2019). On the Genesis and Function of Coccolithophore Calcification. Front. Mar. Sci. 6:49. doi: 10.3389/fmars.2019.00049
Olson, M. B., and Strom, S. L. (2002). Phytoplankton growth, microzooplankton herbivory and community structure in the southeast Bering Sea: insight into the formation and temporal persistence of an Emiliania huxleyi bloom. Deep Sea Res. Part II Top. Stud. Oceanogr 49, 5969–5990. doi: 10.1016/S0967-0645(02)00329-6
Olson, R. J., Zettler, E. R., and Anderson, O. K. (1989). Discrimination of eukaryotic phytoplankton cell types from light scatter and autofluorescence properties measured by flow cytometry. Cytometry 10, 636–643. doi: 10.1002/cyto.990100520
Öpik, H., and Flynn, K. J. (1989). The digestive process of the dinoflagellate, Oxyrrhis marina Dujardin, feeding on the chlorophyte, Dunaliella primolecta Butcher: a combined study of ultrastructure and free amino acids. New Phytol. 113, 143–151. doi: 10.1111/j.1469-8137.1989.tb04700.x
Poulton, A. J., Adey, T. R., Balch, W. M., and Holligan, P. M. (2007). Relating coccolithophore calcification rates to phytoplankton community dynamics: Regional differences and implications for carbon export. Deep Sea Res. Part II Top. Stud. Oceanogr. 54, 538–557. doi: 10.1016/j.dsr2.2006.12.003
R Core Team (2019). R: A Language and Environment for Statistical Computing. Vienna: R Foundation for Statistical Computing. Available online at: https://www.R-project.org/
Raven, J., and Crawfurd, K. (2012). Environmental controls on coccolithophore calcification. Mar. Ecol. Prog. Ser. 470, 137–166.
Roberts, E. C., Wootton, E. C., Davidson, K., Jeong, H. J., Lowe, C. D., and Montagnes, D. J. S. (2011). Feeding in the dinoflagellate Oxyrrhis marina: linking behaviour with mechanisms. J. Plankton Res. 33, 603–614. doi: 10.1093/plankt/fbq118
Rost, B., and Riebesell, U. (2004). “Coccolithophores and the biological pump: responses to environmental changes,” in Coccolithophores-From Molecular Processes to Global Impact, eds H. R. Thierstein and J. R. Young (Berlin: Springer), 99–125.
Strom, S. L., Brahamsha, B., Fredrickson, K. A., Apple, J. K., and Rodríguez, A. G. (2012). A giant cell surface protein in Synechococcus WH8102 inhibits feeding by a dinoflagellate predator. Environ. Microbiol. 14, 807–816. doi: 10.1111/j.1462-2920.2011.02640.x
Strom, S. L., Bright, K. J., Fredrickson, K. A., and Cooney, E. C. (2018). Phytoplankton defenses: Do Emiliania huxleyi coccoliths protect against microzooplankton predators? Limnol. Oceanogr. 63, 617–627. doi: 10.1002/lno.10655
Tillmann, U. (2004). Interactions between Planktonic Microalgae and Protozoan Grazers. J. Eukaryot. Microbiol. 51, 156–168. doi: 10.1111/j.1550-7408.2004.tb00540.x
Watts, P. C., Martin, L. E., Kimmance, S. A., Montagnes, D. J. S., and Lowe, C. D. (2011). The distribution of Oxyrrhis marina: a global disperser or poorly characterized endemic? J. Plankton Res. 33, 579–589. doi: 10.1093/plankt/fbq148
Wootton, E. C., Zubkov, M. V., Jones, D. H., Jones, R. H., Martel, C. M., Thornton, C. A., et al. (2007). Biochemical prey recognition by planktonic protozoa. Environ. Microbiol. 9, 216–222. doi: 10.1111/j.1462-2920.2006.01130.x
Young, J. R. (1987). Possible Functional Interpretations of Coccolith Morphology. New York: Springer-Verlag, 305–313.
Young, J. R. (1994). “Functions of coccoliths,” in Coccolithophores, eds A. Winter and W. G. Siesser (Cambridge: Cambridge University Press), 63–82.
Keywords: calcification, phytoplankton, microzooplankton, grazing, Oxyrrhis marina
Citation: Haunost M, Riebesell U, D’Amore F, Kelting O and Bach LT (2021) Influence of the Calcium Carbonate Shell of Coccolithophores on Ingestion and Growth of a Dinoflagellate Predator. Front. Mar. Sci. 8:664269. doi: 10.3389/fmars.2021.664269
Received: 04 February 2021; Accepted: 25 May 2021;
Published: 30 June 2021.
Edited by:
Per Juel Hansen, University of Copenhagen, DenmarkReviewed by:
Jozef I. Nissimov, University of Waterloo, CanadaRong Bi, Ocean University of China, China
Copyright © 2021 Haunost, Riebesell, D’Amore, Kelting and Bach. This is an open-access article distributed under the terms of the Creative Commons Attribution License (CC BY). The use, distribution or reproduction in other forums is permitted, provided the original author(s) and the copyright owner(s) are credited and that the original publication in this journal is cited, in accordance with accepted academic practice. No use, distribution or reproduction is permitted which does not comply with these terms.
*Correspondence: Mathias Haunost, bWhhdW5vc3RAZ2VvbWFyLmRl