 Hee-kyu Choi1
 Ji Eun Jang1
 Seo Yeon Byeon1Yu Rim Kim1
 Dale Maschette2,3Sangdeok Chung4Seok-Gwan Choi4
 Hyun-Woo Kim5
 Hyuk Je Lee1*
- 1Molecular Ecology and Evolution Laboratory, Department of Biological Science, Sangji University, Wonju, South Korea
- 2Fisheries and Aquaculture Centre, Institute for Marine and Antarctic Studies, University of Tasmania, Hobart, TAS, Australia
- 3Department of Agriculture, Water and the Environment, Australian Antarctic Division, Kingston, TAS, Australia
- 4Distant Water Fisheries Resources Division, National Institute of Fisheries Science, Busan, South Korea
- 5Department of Marine Biology, Pukyong National University, Busan, South Korea
The Antarctic toothfish, Dissostichus mawsoni, serves as a valuable fishery resource around the Antarctic Continent since 1997, managed by the Commission for the Conservation of Antarctic Marine Living Resources (CCAMLR). Although delineating genetic or stock structure of populations is crucial for improving fishery management of this species, its number of genetic populations and genetic diversity levels remain ambiguous. In the present study, we assessed the population genetic and phylogeographic structure of the Antarctic toothfish across 20 geographic localities spanning from Subareas 88 (88.1, 88.2, and 88.3) to Subareas 58 (58.4 and 58.5) by using mitochondrial DNA (mtDNA) cytochrome oxidase I (COI) and 16S rRNA (16S) sequences and seven nuclear microsatellite loci. MtDNA revealed a low level of polymorphism (h = 0.571, π = 0.0006) with 40 haplotypes in 392 individuals, connected only by 1–5 mutational steps, which is indicative of shallow evolutionary history. Microsatellites showed a range of allelic richness (AR) from 6.328 (88.3 RB3) to 7.274 (88.3 RB6) within populations. Overall genetic diversity was generally higher in Subareas 58 than in Subareas 88, suggesting that effective population size (NE) is larger in Subareas 58. The results of population analyses using microsatellites suggest that the sampled populations are likely to comprise a well-admixed single gene pool (i.e., one genetic stock), perhaps due to high contemporary gene flow occurring during the prolonged larval phase of this fish. However, given weak, but significant microsatellite differentiation found in six population-pairs, the possibility of existence of multiple genetic populations could not be completely excluded. The mtDNA AMOVA suggests a genetic break between the Subareas 88 and 58 groups (FCT = 0.011, P = 0.004). Moreover, mtDNA genetic distances (FST) between populations were proportionally greater as geographic distances increase. The patterns of isolation by distance (IBD) shown only in mtDNA, but not in microsatellites might suggest that population differentiation or divergence processes underwent faster in mtDNA than microsatellites, due to its NE being only one-quarter of nuclear DNA. Temporal stability in the genetic structure of D. mawsoni is also indicated by the results of no genetic differentiation between juveniles and adults. The findings of this study will help to design effective stock management strategies for this valuable fishery resource. We suggest that a long-term genetic monitoring is needed to understand the population structure and dynamics of toothfish in response to ongoing climate changes.
Introduction
The Antarctic toothfish, Dissostichus mawsoni (Perciformes: Notothenidae) is endemic to the Antarctic Ocean with a circumpolar geographic distribution (Hanchet et al., 2015). This species can live up to more than 30 years and reach a total body length of 175 cm and weigh over 80 kg (Yukhov, 1971; Hanchet et al., 2015). While adults of the Antarctic toothfish typically use the entire water column over deep water, juveniles prefer to exploit benthic habitats in shallow coastal water. This species is known to have a pelagic larval stage of 4–5 months, and following this developmental period, its larvae drift for up to 9–12 months with oceanic currents until they reach a body length of 4–8 cm (Hanchet et al., 2008). Species with such a long pelagic larval stage is predicted to undergo extensive gene flow among geographic populations via passive dispersal of planktonic larvae by oceanic currents, likely ensuing spatial homogeneity in the population structure (Bohonak, 1999; Lee and Boulding, 2007, 2009; Faurby and Barber, 2012). However, genetic stock structure and population connectivity of D. mawsoni remain still poorly understood.
Dissostichus mawsoni has provided a valuable fishery resource around the Antarctic area since 1997, managed by the Commission for the Conservation of Antarctic Marine Living Resources (CCAMLR). Although delineating the genetic or stock population structure and genetic diversity levels of this species is critical for its fishery stock enhancement and improved management, the number of populations or stocks and diversity levels remain incongruent. A single genetic stock hypothesis with high gene flow via the Antarctic Circumpolar Current is originally proposed for the Antarctic toothfish, particularly in the Weddell Sea (Subareas 48) and Ross Sea (Subarea 88.1; Figure 1; Orsi et al., 1995). A recent study of single nucleotide polymorphisms (SNPs) at whole genome-levels supported the hypothesis of weak population structuring with high connectivity among geographic populations (Maschette et al., 2019). Two or more stock hypothesis has also been proposed, based on a combined analysis of population genetics [using random amplified polymorphic DNA (RAPD) markers], parasitology, stable isotopes and otolith microchemistry (Parker et al., 2002; Hanchet et al., 2015). Whether D. mawsoni is comprised of a single or multiple genetic populations surrounding this region remains therefore unresolved.
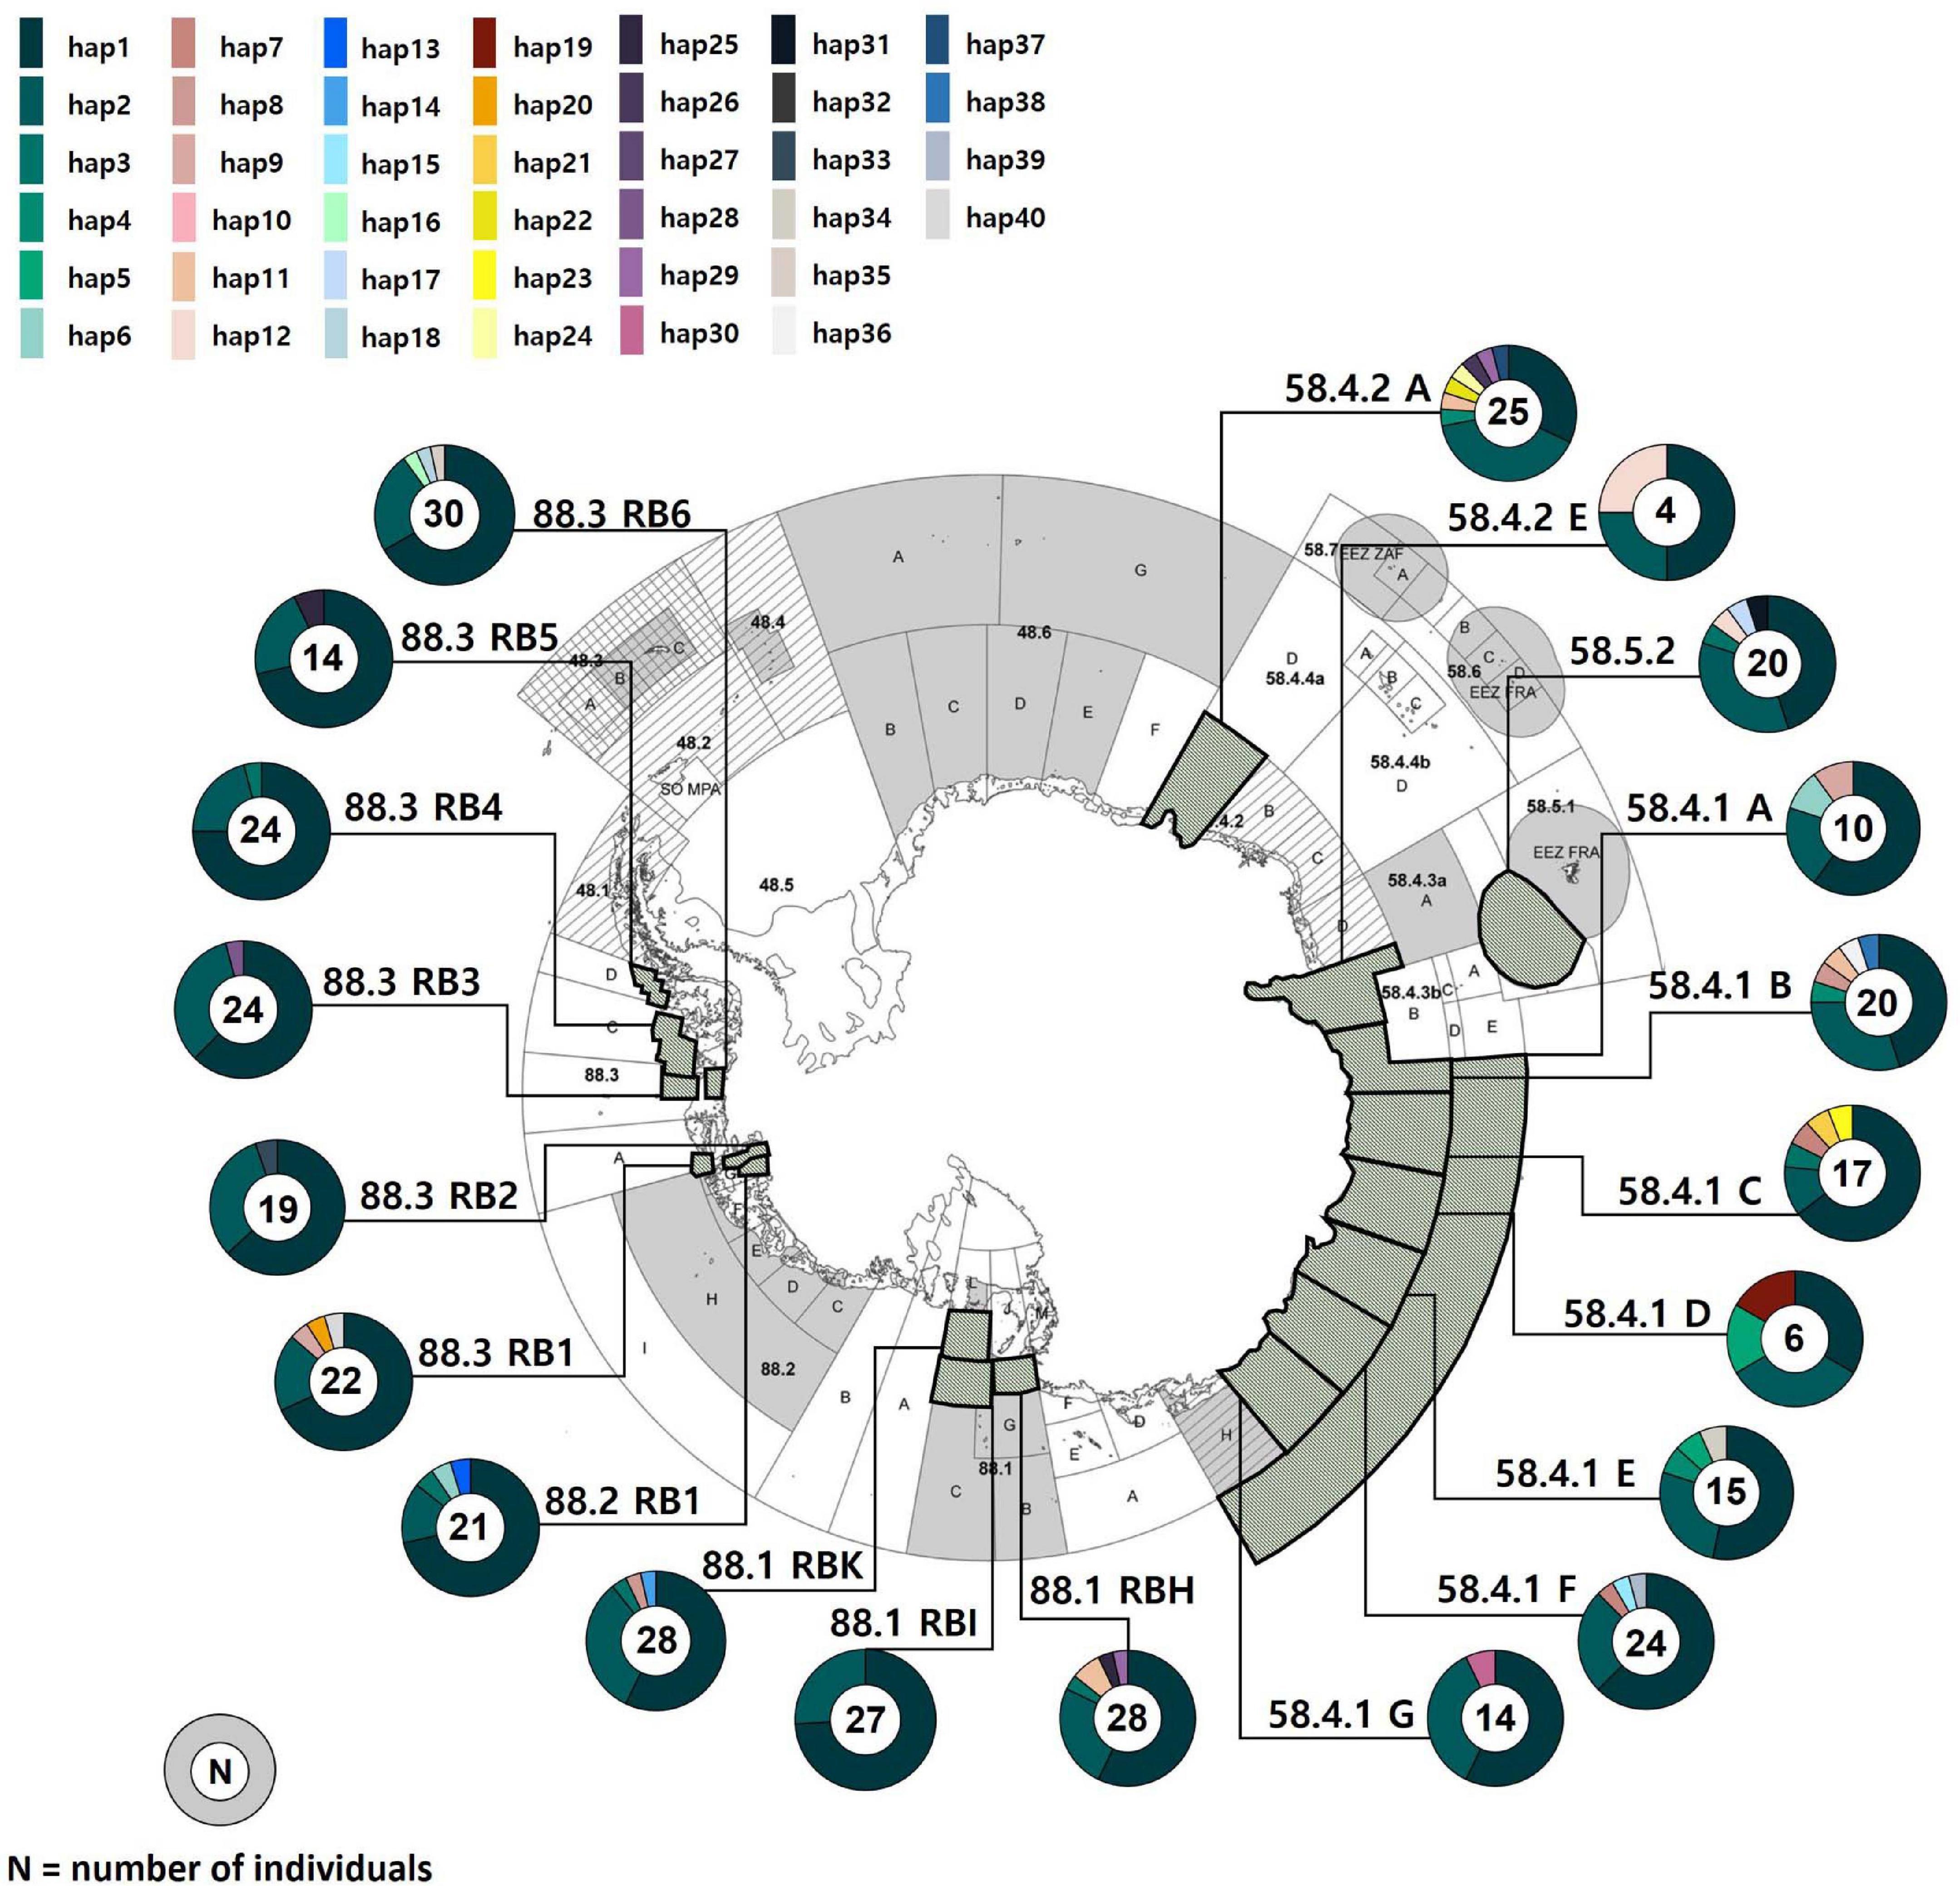
Figure 1. Sampling localities of Dissostichus mawsoni and the geographic distribution of mitochondrial DNA COI and 16S haplotypes (1,304 bp) that we determined. Each polygon in the map represents sampling areas. Different colors in circles denote 40 different haplotypes that show relative frequencies within populations. The map was extracted from CCAMLR area (Everson, 2017).
Although there are several studies that have been performed to elucidate the population genetic structure of the toothfish using mitochondrial (mt) and nuclear DNA markers (Parker et al., 2002; Smith and Gaffney, 2005; Kuhn and Gaffney, 2008; Mugue et al., 2014), the observed patterns of the genetic structure were not consistent across these studies, and also inconclusive, mainly due to low genetic polymorphism in the molecular markers used. Parker et al. (2002) initially suggested that populations from the Ross and Bellingshausen Seas (Subareas 88) have split into two genetically unique groups, indicating two separate genetic populations existed. A further investigation (Kuhn and Gaffney, 2008) revealed considerable genetic structure among the four CCAMLR subareas [Australian Antarctic Territory (Subarea 58.4.2), Ross Dependency (Subareas 88.1 and 88.2), and the South Shetland Islands (Subarea 48.1); see Figure 1], providing some evidence for the presence of multiple stocks of D. mawsoni, particular given genetic differentiation detected between Subareas 58 and Subareas 88. However, a lack of population structure was observed among the three geographic subareas, including Subareas 48.1, 88.1, and 58.4.2 (Smith and Gaffney, 2005; Mugue et al., 2014). Such discrepancies in the results of previous studies highlight the need for further study on the population genetics and phylogeography of the Antarctic toothfish. More importantly, future investigation with more polymorphic markers, such as microsatellites or a great amount of SNPs would provide better insights on discovering hidden population structure (Le Cam et al., 2019). Nevertheless, using 10,303 SNP markers Maschette et al. (2019) observed the absence of the spatial population structure among the sampling localities spanning nearly an entire geographic range of D. mawsoni. Unisexually inherited markers such as mitochondrial DNA (mtDNA) are presumed to diverge more rapidly than nuclear DNA considering genetic drift effects alone, as effective population size (NE) of mtDNA is only one-quarter of nuclear DNA (Hartl and Clark, 2007). By using a combined analysis of mtDNA and nuclear microsatellites, we here compared our results with those of Maschette et al. (2019) and discussed possible explanations on the population genetic structure of the tooth fish. Temporal stability in the genetic structure of D. mawsoni was also suggested, by using temporally replicated geographic samples (Mugue et al., 2014). However, age or body size was not considered in their study as a proxy for different temporal groups of 2011–2013 years. There could be differences in the population structure between juveniles and adults, possibly due to low reproductive success of dispersers and/or strong genetic drift effects over generations (Hedgecock, 1994; Lee and Boulding, 2007).
In the present study, we examined the population genetic and phylogeographic structure of the Antarctic toothfish across 20 geographic sites around the seas of the Antarctica Continent (Subareas 88 and Subareas 58; Figure 1) by using mtDNA cytochrome oxidase I (COI) and 16S rRNA (16S) sequences and also seven nuclear microsatellites. Although the previous work (Maschette et al., 2019) with large amount of genome-wide SNPs would be expected to outperform the present study, this study had five specific objectives, which were: (1) to examine the level of genetic diversity among 20 geographically separated populations (including 10 populations from the Subareas 88 and 10 from the Subareas 58); (2) to assess the genetic and phylogeographic structure of these populations for the stock identification; (3) to determine the phylogenetic relationships among the populations (and haplotypes/genotypes) and conduct phylogeographic analyses in order to infer its evolutionary and demographic histories; (4) to test whether there is a difference in genetic structure between juveniles vs. adults; (5) to discuss differences in genetic signals between mtDNA and microsatellites with respect to the population structure. To our knowledge, this is the first study to examine genetic differentiation between juveniles and adults in order to test for the temporal genetic stability in D. mawsoni, which has implications for the population stability or turnover rates. Moreover, a comparison of genetic signals in the population structure between different marker types (e.g., mtDNA vs. nuclear DNA) has not been made. The results of this study will contribute to make conservation and management efforts for this valuable fishery resource around the Antarctic Continent.
Materials and Methods
Study Sites and Sample Collection
A total of 392 individuals of the Antarctic toothfish were sampled from 20 sites in two CCAMLR Subareas by a bottom longline: Australian Antarctic Territory (Subareas 58.4; nine localities, and 58.5; one locality), and the Ross Dependency (Subareas 88.1; three localities, 88.2; one locality, and 88.3; six localities) around the seas of the Antarctic Continent from December 2016 to March 2020 (Figure 1 and Table 1). Tissue samples from Subareas 88 were obtained during commercial fishing operations in research blocks, granted by the Distant Water Fisheries Resources Division, National Institute of Fisheries Science (NIFS) in South Korea. The samples collected from Subareas 58.4 and 58.5 were provided by a research group of the Australian Antarctic Division, Australian Government, Australia (Maschette et al., 2019). Body size (total length; cm) and weight (g) were measured for every fish. Adult and juvenile samples from 10 populations for comparison of differences in genetic composition were classified based on a standard length (SL) of 81 cm [juveniles < 81 cm (mtDNA; N = 40, microsatellites; N = 42), adults >120 cm (mtDNA; N = 110, microsatellites; N = 114); Supplementary Table 1] following a previous study (Near et al., 2003). Fish individuals with a body size range of 81∼120 cm were excluded to avoid the possible confounding effects. The samples used for genetic analysis were comprised of muscle or dorsal fin tissues for the Subareas 58.4.1.A, 58.4.1.B, 58.4.1.E, 58.4.1.F, 58.4.2.A, 58.5.2, 88.1, 88.2, and 88.3 and stomach contents for the Subareas 58.4.1 C, 58.4.1 D, 58.4.1 E, 58.4.1 G, and 58.4.2 E. These genetic samples were immediately frozen at −20°C after preservation in 99% ethanol until genetic analysis.
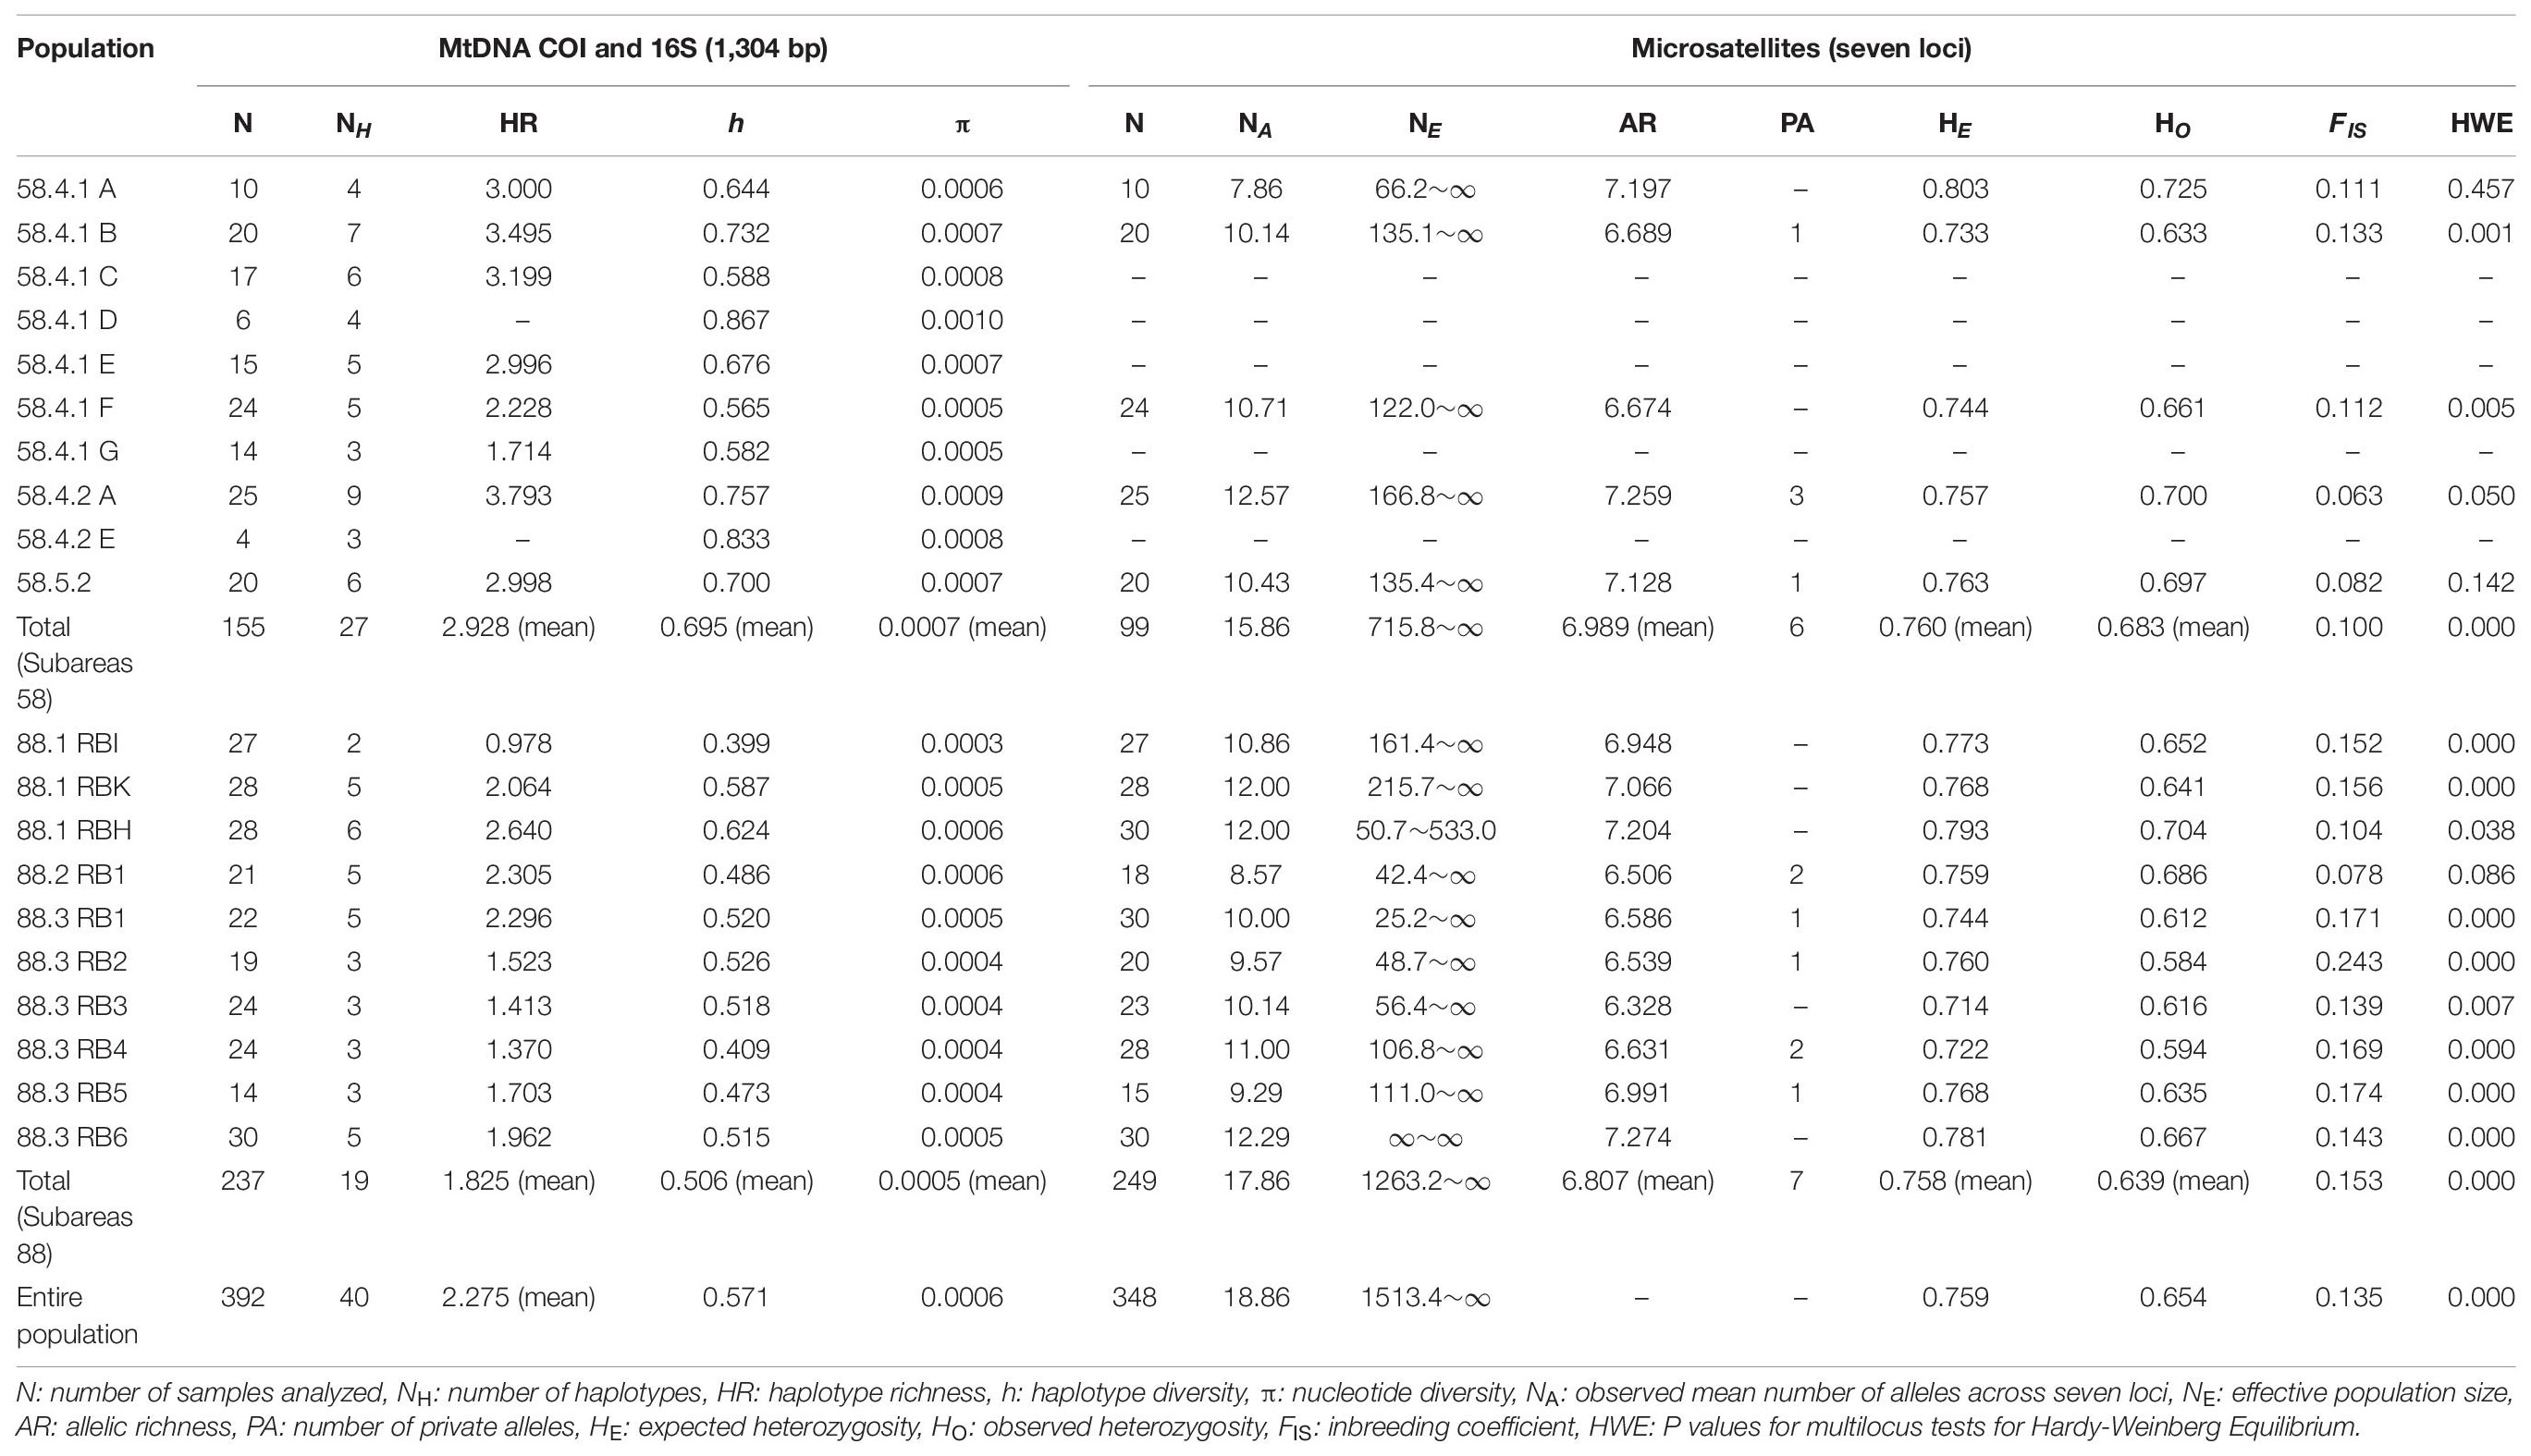
Table 1. Summary of the genetic diversity indices in Dissostichus mawsoni from the Antarctic Ocean at mtDNA (COI and 16S) and seven microsatellite loci.
Mitochondrial DNA Sequencing
Genomic DNA was extracted from the homogenized frozen stomach contents, dorsal fin or muscle tissues using a DNeasy Blood and Tissue Kit (Qiagen, Germany). MtDNA COI (685 bp) and 16S (619 bp) were amplified with our newly developed primers [COI forward (DM_COI_FW: 5-GTGGCCATCACACGTTGATTT-3) and reverse (DM_COI _RV: 5-GCCCAGACTATCCCCATATAGC-3); 16S forward (DM _16S_683F: 5-ATGCCAACATGGGAGTGACC-3) and reverse (DM_16S_683R: 5-AGCTGCTGCACCAATAGGAT-3)] based on the complete mtDNA sequences of D. mawsoni (Accession No.: LC138011.1).
Polymerase chain reaction (PCR) amplification was carried out in a reaction volume of 15 μl comprised of 1 × PCR buffer, 25 μM of each dNTP (Bio Basic Inc., Canada), 0.6 μM of each of the forward and reverse primers, 0.2 U of Taq polymerase (Thermo Fisher Scientific, Waltham, MA, United States) and 5.64∼561.98 ng/μl of DNA template. The following thermal conditions were applied: initial denaturation at 94°C for 3 min followed by 35 cycles of denaturation at 94°C for 1 min, annealing at 56°C (COI) and 60°C (16S) for 30 s and extension at 72°C for 45 s, followed by a final extension at 72°C for 10 min. PCR products were verified on 2% agarose gels stained with RedSafe (iNtRon Biotechnology, South Korea). The amplified PCR products were purified enzymatically by incubating them at 37°C for 15 min with Exonuclease I (New England BioLabs, United States) followed by 85°C for 15 min with Shrimp Alkaline Phosphatase (New England BioLabs). The purified mtDNA fragments were subjected to direct sequencing in the forward and reverse directions using the same forward and reverse primers as in the PCR and the BigDye Terminator 3.1 Cycle Sequencing Ready Reaction Kit (Applied Biosystems, United States) in an ABI 3730xl automated DNA sequencer (Applied Biosystems). The DNA sequences were edited using CHROMAS v2.01 computer software and aligned with Clustal W v2.0 (Larkin et al., 2007) implemented in BioEdit v7.2.5 (Hall, 1999), and finally verified manually.
Microsatellite Genotyping
Seven polymorphic nuclear microsatellite loci (DELIG1, DELIG3, DELIG9, DELIG12, DELIG14, DELIG22, and DELIG33), which were originally developed for the Patagonian toothfish, Dissostichus eleginoides (Garcia et al., 2019), were used for genotyping D. mawsoni in this study. Microsatellite genotyping was only successfully undertaken for dorsal fin or muscle tissue samples (N = 348) because PCR of the stomach specimens (from Subareas 58.4) was failed, due to a low DNA concentration. The forward primers were labeled with fluorescent dye (FAM and HEX). PCR reactions were performed as described for amplifying the mtDNA. PCR cycling conditions comprised an initial denaturation phase at 95°C for 5 min, 35 cycles of 95°C for 1 min, 57–62°C for 40 s, 72°C for 30 s and a final extension step at 72°C for 10 min. The PCR products were electrophoresed on an ABI 3730xl automated DNA sequencer (Applied Biosystems). Fragment sizes were determined with the ROX 500 bp size standard (ABI) using GENEMAPPER software v 5.0 (Applied Biosystems).
Data Analyses
Genetic Diversity
For mtDNA, we used mtDNA COI and 16S as a genetic marker in this study. We selected these genes, as they had relatively high polymorphism across the five regions evaluated [COI, NADH dehydrogenase 2 (ND2), cytochrome b (cyt b), 16S and control region (CR)] in our previous study (Choi et al., 2019). GenBank accession numbers for COI and 16S, and CR, cyt b, and ND2 are MW684720-MW684761 and MZ170964-MZ170973, respectively. In particular, the 16S marker showed the highest degree of diversity [haplotype diversity (h) = 0.468; nucleotide diversity (π) = 0.0009] (Choi et al., 2019). In the present study, a concatenated sequence (1,304 bp) of COI and 16S was used for formal analysis. The number of polymorphic sites and haplotypes, h and π for the concatenated fragment of mtDNA COI and 16S were estimated for each locality, each Subarea 58 and 88 and the entire pooled population of D. mawsoni using ARLEQUIN v3.5 (Excoffier and Lischer, 2010). These diversity indices were also calculated for each of the juvenile and adult groups. The rarefaction method was applied using CONTRIB v1.02 (Petit et al., 1998) to calculate haplotype richness (HR), which was corrected for unequal sample sizes across the populations. A Student’s t-test was performed to examine whether there was a significant difference in the level of HR, h, and π between the Subareas 88 (10 populations) and 58 (10 populations). Haplotype network was constructed using HAPSTAR v0.7 (Teacher and Griffiths, 2011) to determine the relationships between the mtDNA haplotypes identified.
To assess microsatellite diversity in D. mawsoni, the mean number of alleles per locus (NA), observed (HO) and expected (HE) heterozygosity, inbreeding coefficient (FIS) and allelic richness (AR) corrected for unequal sample sizes were calculated for the seven microsatellite loci using GENEPOP v4.0 (Rousset, 2008) and FSTAT v2.9.3.2 (Goudet, 2001). Multilocus tests for Hardy–Weinberg equilibrium (HWE), pairwise FST estimates (allele frequency-based genetic differentiation) and linkage disequilibrium (LD) tests for genotypes among pairs of the seven loci were also performed in GENEPOP. A Mann-Whitney U test was also conducted to test whether there was a significant difference in the level of AR, HE, and HO between the Subareas 88 (10 populations) and 58 (5 populations).
To test for evidence of a genetic bottleneck in each population of D. mawsoni, we used BOTTLENECK v1.2.02 (Piry et al., 1999) with the two-phase mutation model (TPM) of microsatellite evolution. A population bottleneck can be identified by the occurrence of a mode-shift (i.e., allele distribution shift) and/or a significant heterozygosity excess (Wilcoxon sign rank test) (Luikart et al., 1998). Contemporary effective population sizes (NE) were also calculated for each of the Antarctic toothfish samples based on the LD method in NeESTIMATOR v2.01 (Do et al., 2014).
Genetic Structure
Both exact tests for population differentiation (Raymond, 1995) and calculation of pairwise estimates of FST (Weir and Cockerham, 1984) were performed with ARLEQUIN and GENEPOP to estimate geographic differentiation between populations, and also between juvenile and adult groups. These analyses were done for the identification of genetic stock and temporal structure in our samples. The 95% significance levels for the pairwise population comparisons were adjusted using a Bonferroni correction. A hierarchical analysis of molecular variance (AMOVA) was further performed in ARLEQUIN to assess geographic population structure or a genetic break between the Subareas 88 and 58 populations, based on variation in mtDNA COI and 16S and seven microsatellite loci. The spatial AMOVA was undertaken by grouping populations according to two subareas: the Subareas 58 group (mtDNA: 58.4.1 A, 58.4.1 B, 58.4.1 C, 58.4.1 D, 58.4.1 E, 58.4.1 F, 58.4.1 G, 58.4.2 A, 58.4.2 E, and 58.5.2; microsatellites: 58.4.1 A, 58.4.1 B, 58.4.1 F, 58.4.2 A, and 58.5.2) and the Subareas 88 group (mtDNA and microsatellites: 88.1 RBI, 88.1 RBK, 88.1 RBH, 88.2 RB1, 88.3 RB1, 88.3 RB2, 88.3 RB3, 88.3 RB4, 88.3 RB5, and 88.3 RB6). Additional AMOVA was conducted with three groupings concerning the geographic affinity (Subareas 58 vs. 88.1 vs. 88.2/88.3; see Figure 1). These AMOVA partitioned the total molecular variances between the Subareas 88 and 58, and the Subareas 58, 88.1, and 88.2/88.3 (FCT = “inter-subarea” genetic variation), among populations within the subareas (FSC = “intra-subarea” genetic variation) and within populations regardless of grouping (FST). Furthermore, we tested for isolation by distance (IBD) among populations using the Mantel test in GenAlex v6.502 (Peakall and Smouse, 2006). Geographic distance was calculated as the shortest coastline distance between populations (e.g., a central point of each sampling site) in kilometers (Maier et al., 2005; Fontaine et al., 2007).
The microsatellite population structure of D. mawsoni was further evaluated using an individual-based Bayesian population assignment test in STRUCTURE v2.3.1 (Pritchard et al., 2000) under a model of admixed ancestry among populations and correlated allele frequencies. STRUCTURE calculates a likelihood score when the data are forced into a given number of genetic clusters (K) = 1--15. We tested 10 iterations at each K = 1--15, with 100,000 burn-in steps followed by 1,000,000 Markov Chain Monte Carlo (MCMC) generations. STRUCTURE analyses were also carried out separately for the populations in the Subareas 58 and Subareas 88 at K = 1--5 and K = 1--10, respectively. The analysis was further performed to examine if there is a difference in the population structure between juveniles and adults. The K value was estimated from the Structure Harvester1 website (Earl and vonHoldt, 2012), based on the rate of change in the probability of data between successive K values. Structure analysis ran three times independently to check for the convergence of similar values and found that the three runs arrived at identical K values. The bar plot from STRUCTURE shows individual assignment probability for a given K-value and each vertical bar represents one particular individual. Moreover, three different factorial correspondence analyses (FCA) for Subareas 58, Subareas 88 and all populations were performed using GENETIX v4.05.2 (Belkhir et al., 2004), based on genetic relationships between individuals with multi-locus genotypes.
Demographic History and Phylogenetic Relationships
Population expansion of D. mawsoni was tested using two different analyses including mismatch distribution and Tajima’s D and Fu’s Fs neutrality tests in ARLEQUIN (Tajima, 1989; Fu, 1997). The Tajima’s D and Fu’s Fs analyses were performed for the Subareas 58, Subareas 88 and all populations. The demographic history of this species was further determined using Bayesian Skyline Plot (BSP) analysis in BEAST v2.4.5 (Bouckaert et al., 2014). However, we could not resolve its demographic history (BSP data not shown) because our effective sample size (ESS) estimates could not reach a convergence (ESS = 32.1) due to low mtDNA variation, although ESS >200 is suggested as a rule of thumb for Bayesian phylogenetic analysis (Lanfear et al., 2016).
To investigate phylogenetic relationships between the 40 mtDNA haplotypes detected, mtDNA COI and 16S sequences of D. eleginoides (Accession No.: EU074420) and Notothenia coriiceps (Accession No.: MG729470) were used as an outgroup for the phylogenetic analysis. These two species were chosen as an outgroup based on a reconstructed phylogeny for the Antarctic fishes using mtDNA markers (Bargelloni et al., 2000). Phylogenetic tree was reconstructed with a maximum parsimony (MP) method using as implemented in MEGA v6.0 (Tamura et al., 2013) and statistical support was estimated by 1000 bootstrap replicates. Using POPTREE2 (Takezaki et al., 2010), phylogenetic analysis was also carried out with FST distances among the 15 populations from the Subareas 58 and 88 based on microsatellite allelic variation calculated.
Results
Level of Genetic Diversity
MtDNA
We found only 40 mtDNA COI and 16S haplotypes among 392 samples with one to maximum five mutational steps between haplotypes (Figures 1, 2). Estimates of h and π values for the entire toothfish population were 0.571 and 0.0006, respectively (Table 1). The most two common haplotypes (Hap1, Hap2) were shared by 235 and 104 individuals (59.9 and 26.5%), respectively and the second most common haplotype Hap3 had only six individuals (1.5%) and Hap4 three individuals (0.8%) of the total samples (Figure 2). Eight haplotypes were observed in two individuals (0.5%) and the remaining 28 haplotypes occurred only once (i.e., singleton). Haplotypes, Hap4, Hap5, Hap7, Hap11, and Hap12 were detected with 2–3 individuals, which were present only in the Subareas 58, and Hap10 was detected with two individuals, which occurred exclusively in the Subarea 88.1 RBH (Figures 1, 2), suggesting that these particular haplotypes might represent locally unique matrilineal lineages.
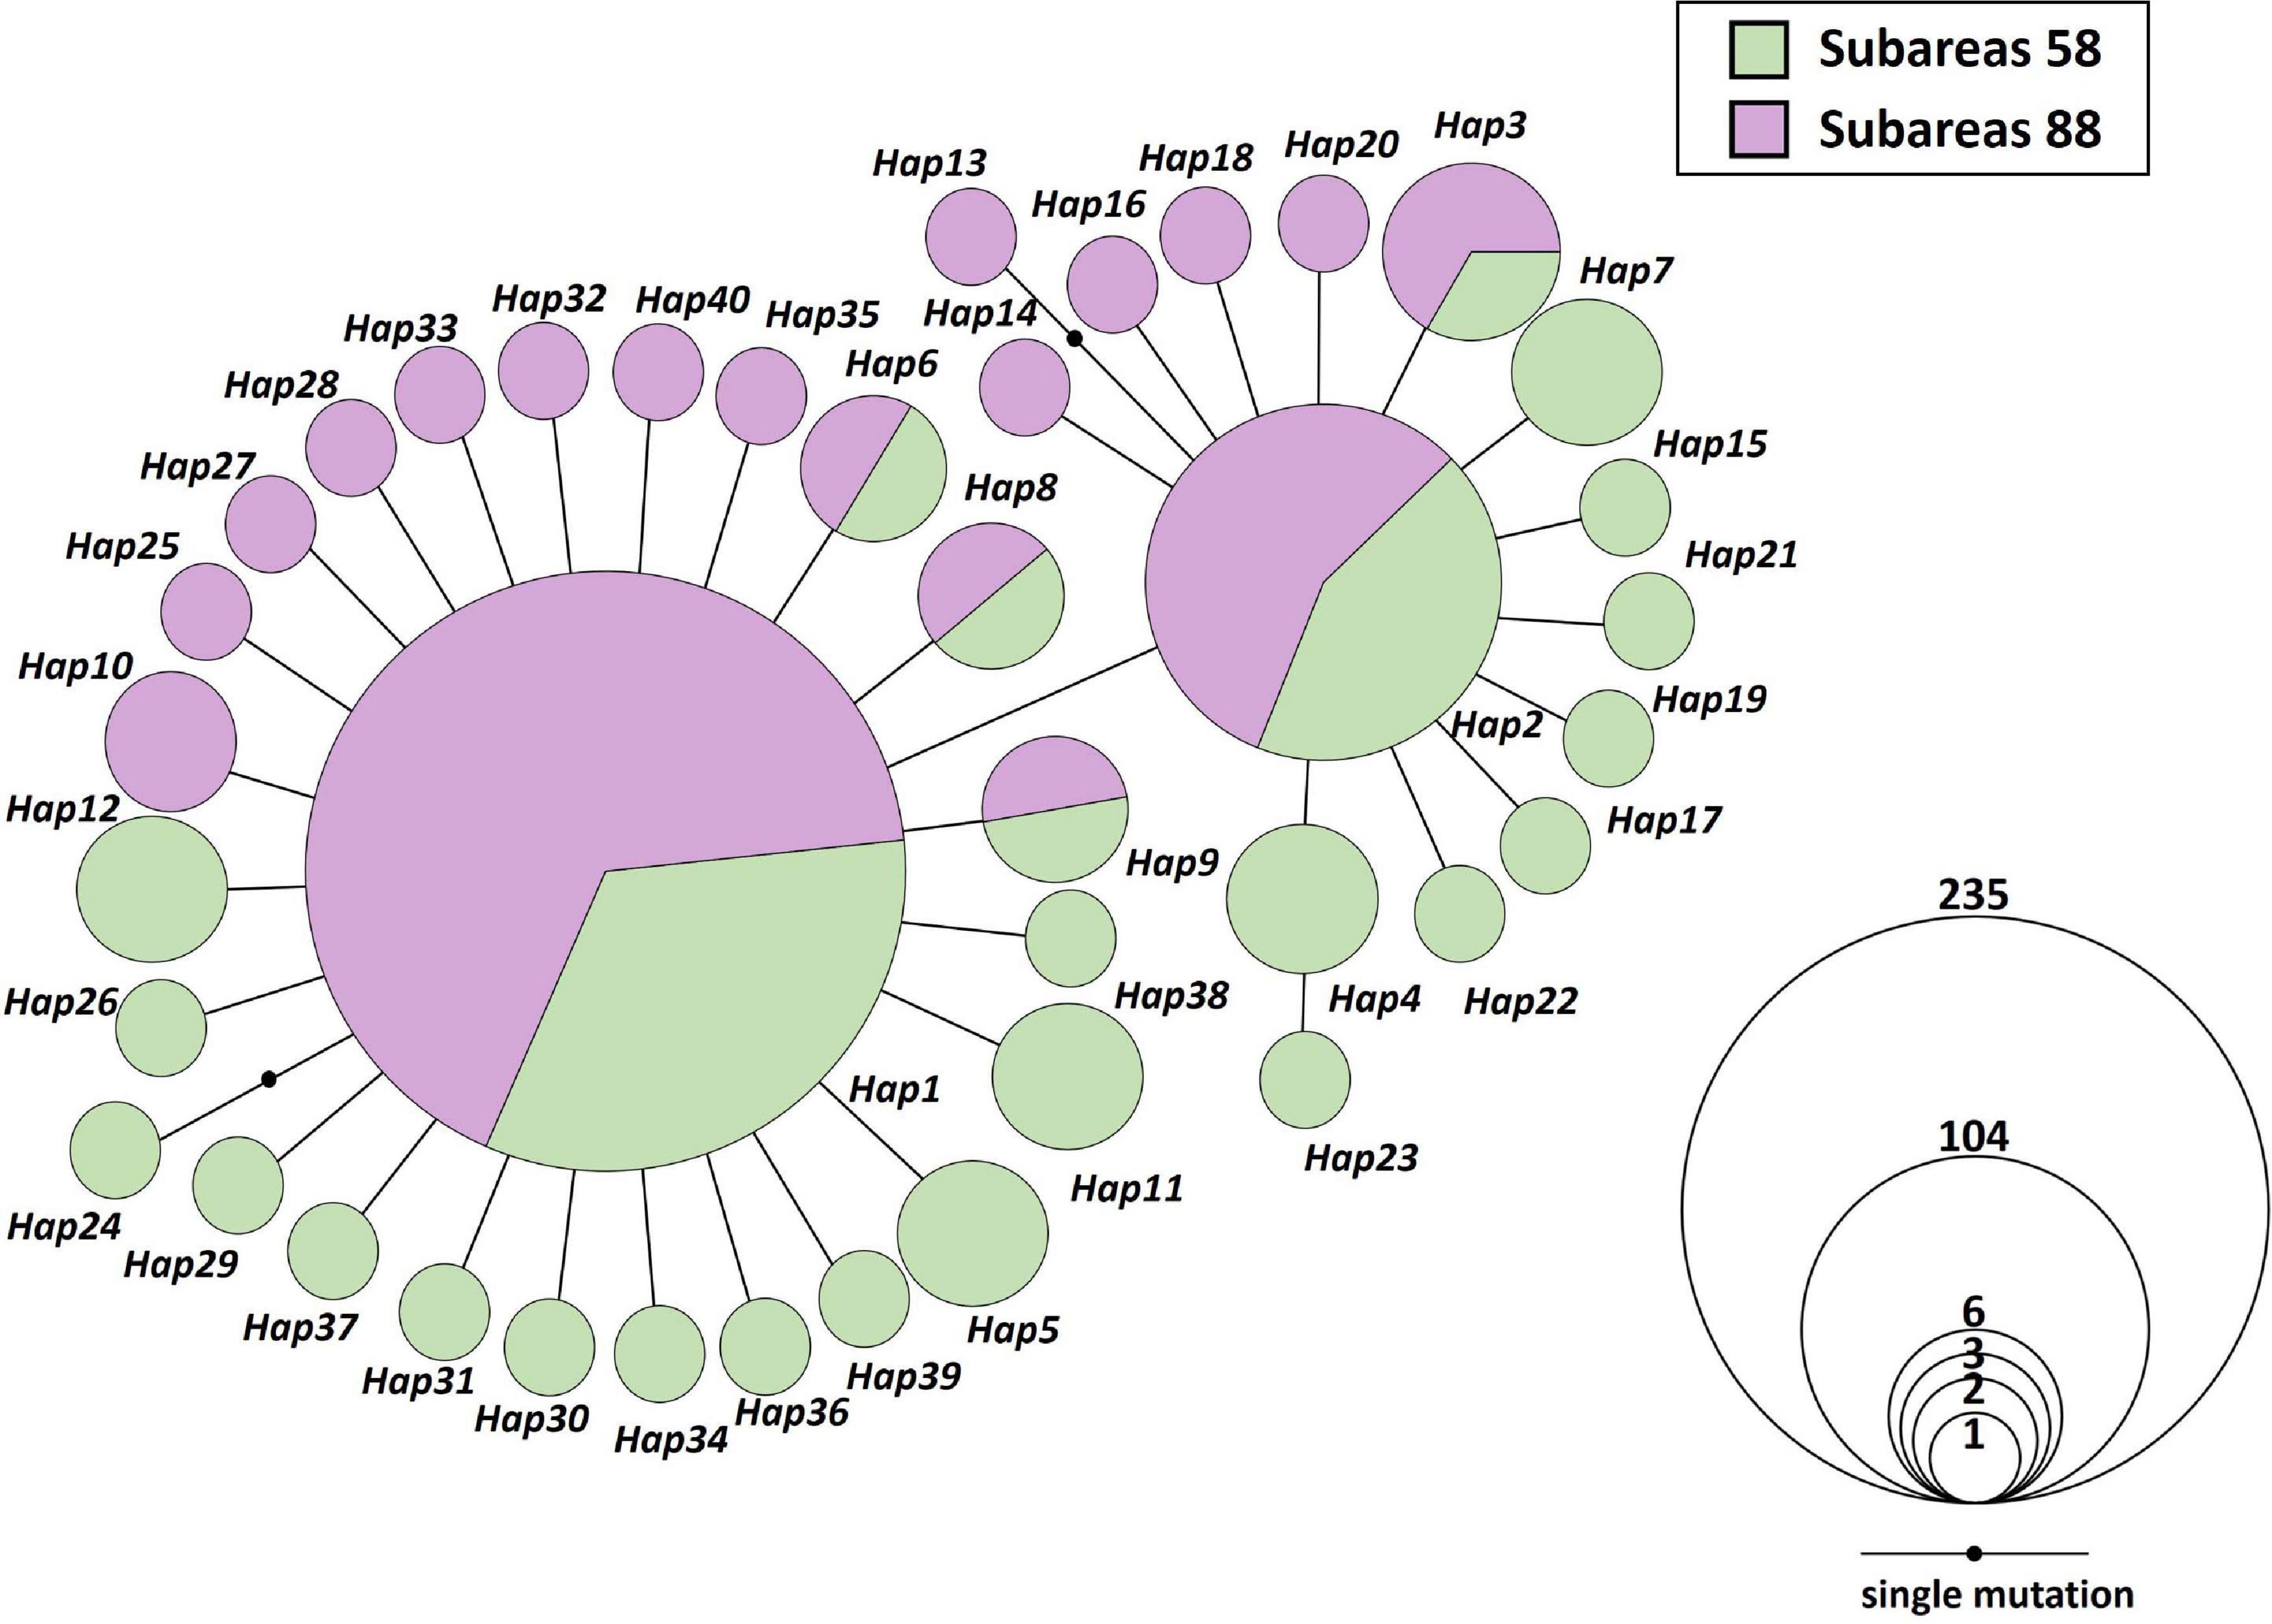
Figure 2. Mitochondrial DNA (MtDNA) COI and 16S haplotype network of 40 haplotypes from 20 Antarctic toothfish populations (N = 392). Each color indicates two different sampling regions (green; Subareas 58, purple; Subareas 88). Each line in the network represents one mutational step between haplotypes. Circle size is proportional to the number of samples belonging to respective haplotype (Hap1: 235; Hap2: 104; Hap3: 6; Hap4: 3; Hap5, Hap6, Hap7, Hap8, Hap9, Hap10, Hap11, Hap12: 2; the remaining 28 haplotypes: 1). Small black circles indicate an intermediate haplotype that is not present in our samples, but is necessary to construct the network.
The mean level of COI and 16S diversity was significantly higher for the Subareas 58 (HR = 2.928, h = 0.695, π = 0.0007) than for the Subareas 88 (HR = 1.825, h = 0.506, π = 0.0005) (Student’s t-test, P-value: HR = 0.002, h < 0.001, π = 0.001) (Figure 3A and Table 1). Within subareas, 58.4.2 A (HR = 3.793) and 88.1 RBH (HR = 2.640) harbored the greatest HR values (Supplementary Figure 1A). In addition, level of COI and 16S diversity was higher for adults (h = 0.554, π = 0.0006) than for juveniles (h = 0.445, π = 0.0004), although sample sizes were larger for adults (Supplementary Table 1).
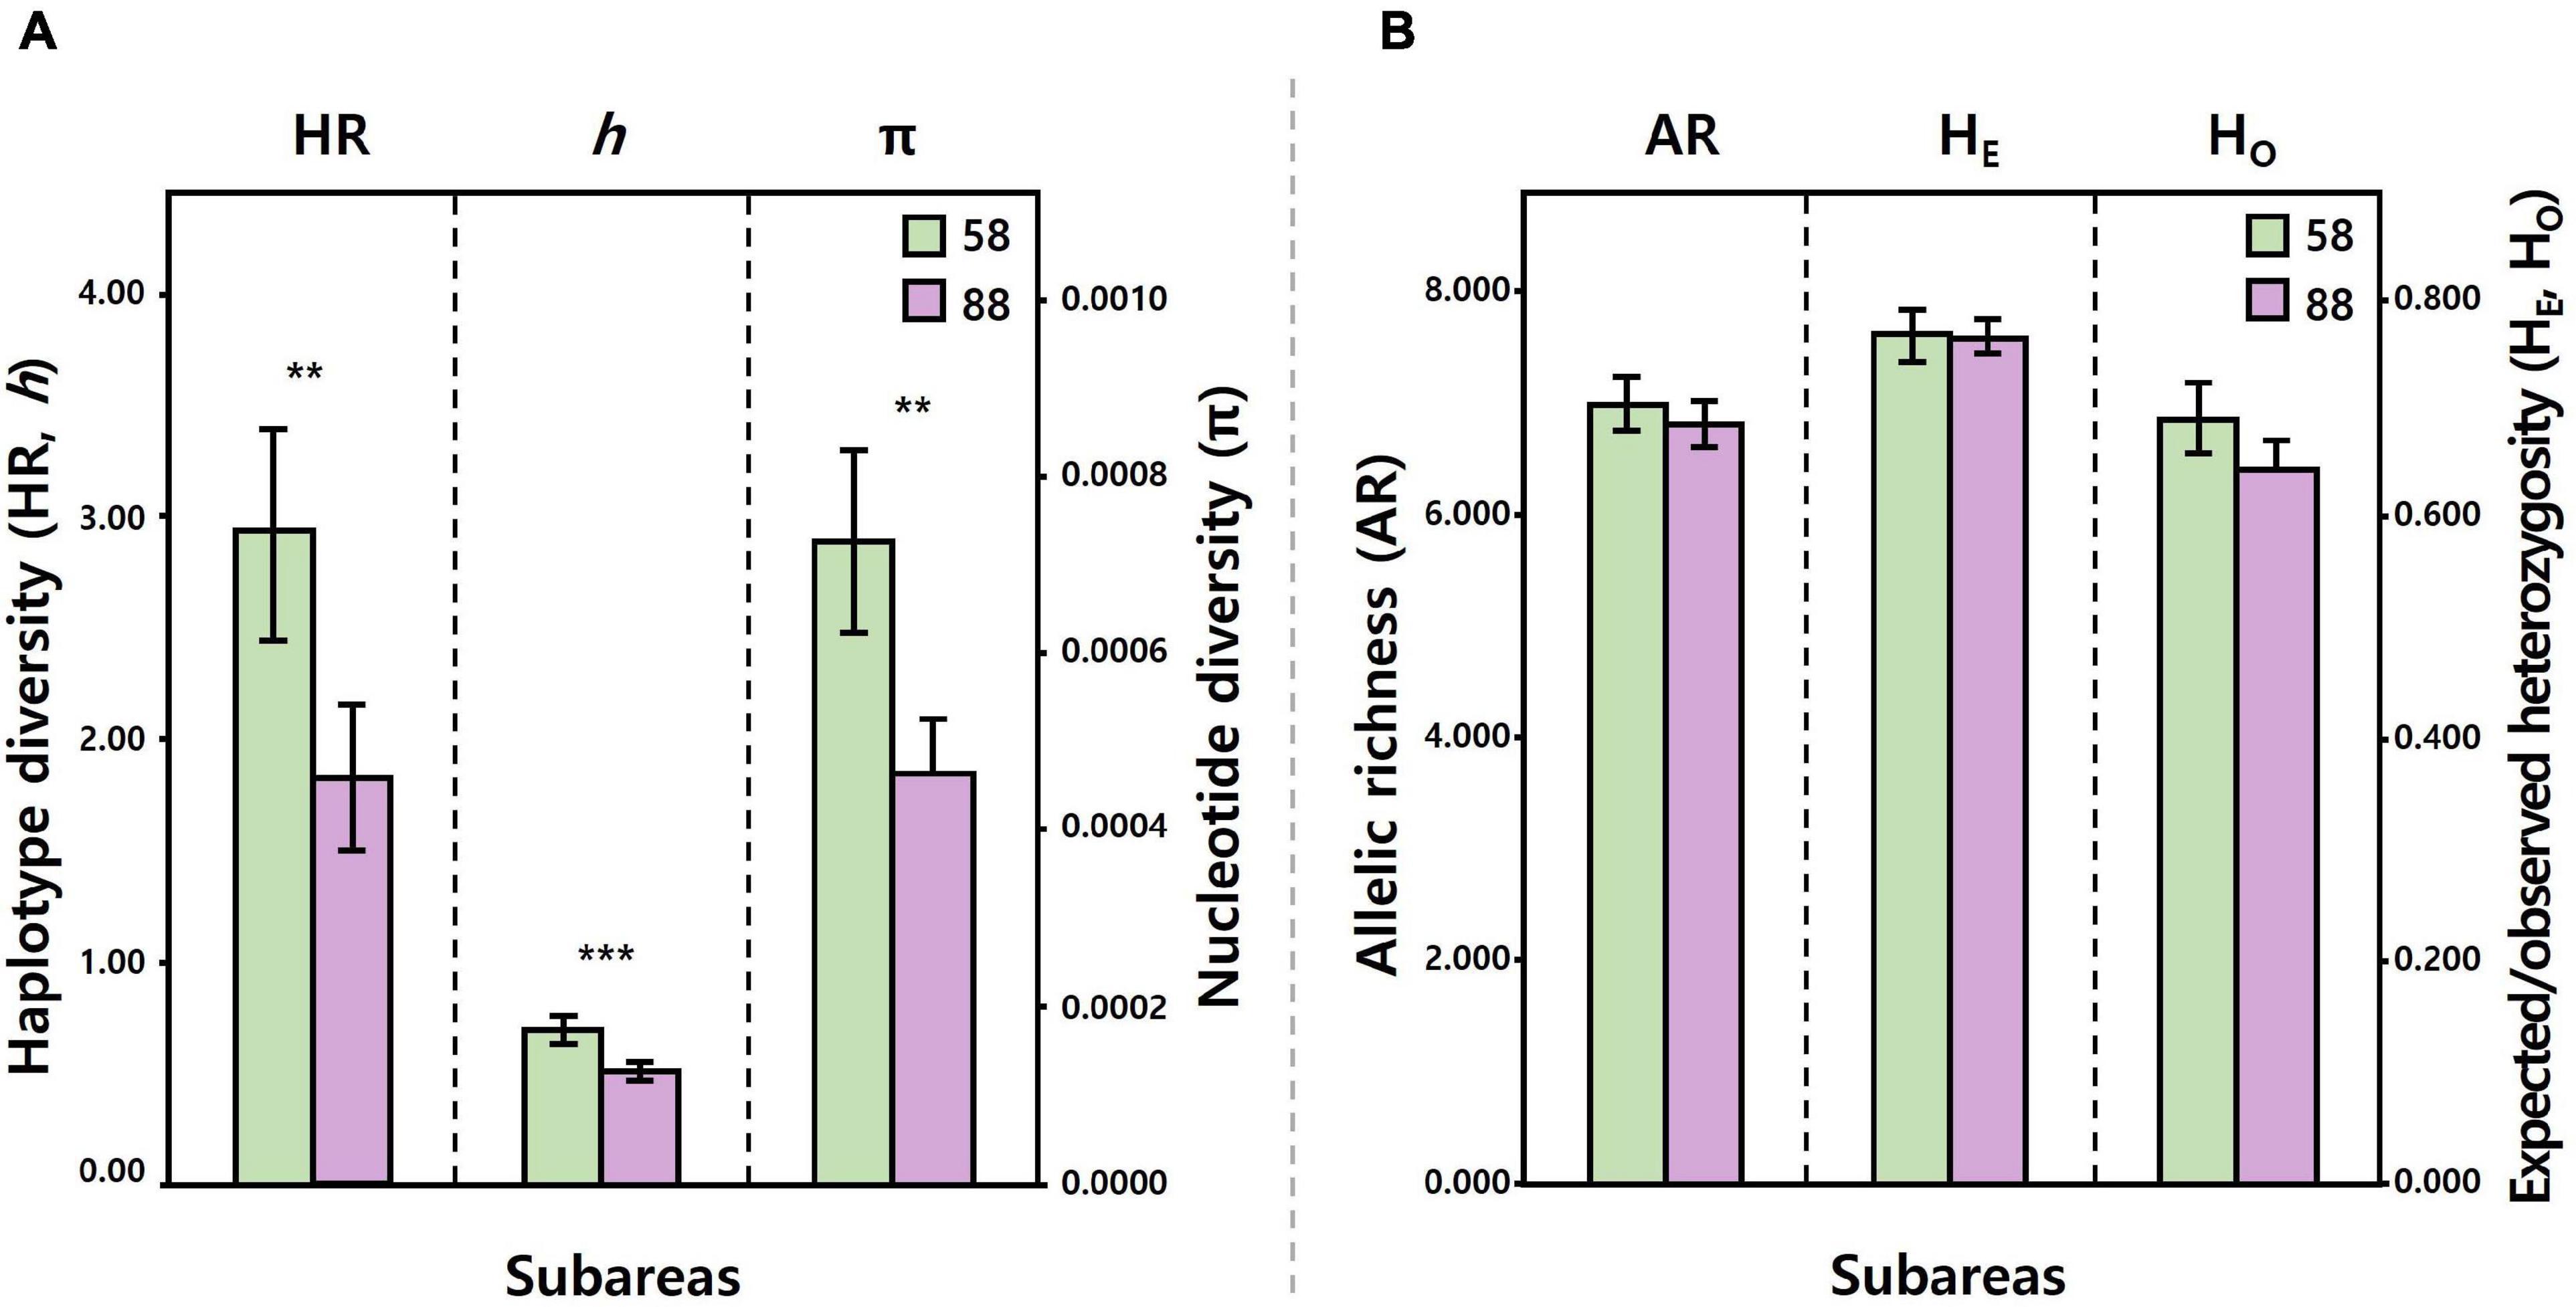
Figure 3. Comparisons of the level of mtDNA COI and 16S (A), seven microsatellite (B) diversity between the Subareas 58 (mtDNA: 10 populations, microsatellites: 5) and 88 (mtDNA: 10, microsatellites: 10). Levels of mtDNA diversity (HR, h, and π) were significantly higher for the Subareas 58 than for the Subareas 88. Levels of microsatellite diversity (AR, HE, and Ho) tended to be higher for the Subareas 58, albeit statistical non-significance. **: P < 0.01, ***: P < 0.001.
Microsatellites
The NA across the seven loci within 15 populations ranged from 7.86 (58.4.1 A) to 12.57 (58.4.2 A) (Table 1). NE of all subareas showed a median of infinite (∞) with 95% confidence interval (CI) of 1513.4 to ∞, and that of Subareas 58 and 88 were 715.8 to ∞ and 1263.2 to ∞, respectively (Table 1). AR ranged from 6.328 (88.3 RB3) to 7.274 (88.3 RB6), and PA (private allele) ranged from 1 (58.4.1 B, 58.5.2, 88.3 RB1, 88.3 RB2, and 88.3 RB5) to 3 (58.4.2 A) (Table 1). The 58.4.2 A population showed the highest NA and PA values. The entire pooled toothfish population had HO and HE were 0.654 ± 0.043 and 0.759 ± 0.025, respectively. The FIS and HWE P-value was 0.135 and <0.001, respectively, indicating the possibility of inbreeding except for seven geographic populations, including 58.4.1 A, 58.4.1 F, 58.4.2 A, 58.5.2, 88.1 RBH, 88.2 RB1, and 88.3 RB3 (Table 1). Tests of genotypic LD showed no allelic association between the seven loci after a Bonferroni correction (P > 0.05), suggesting that all loci can be considered as independent markers.
Similar to the mtDNA diversity, the mean level of microsatellite diversity was generally greater for the Subareas 58 (AR = 6.989, HO = 0.683, HE = 0.760) than for the Subareas 88 (AR = 6.807, HO = 0.639, HE = 0.758), despite statistical non-significance (Mann-Whitney U test, P-value: AR = 0.221, HE = 0.759, HO = 0.086) (Figure 3B and Table 1). Within subareas, 58.4.2 A (AR = 7.259) and 88.3 RB6 (7.274) had the greatest AR values (Supplementary Figure 1B). Level of microsatellite diversity was slightly higher for adults (HO = 0.663, HE = 0.763) than for juveniles (HO = 0.643, HE = 0.756) (Supplementary Table 1).
Allelic frequency distribution showed a normal L-shaped distribution with a probability of 0.688 (every population ranged from 0.297 to 1.000) (Supplementary Figure 2), assuming that all loci fit the TPM based on mutation-drift equilibrium. Therefore, null hypothesis could not be rejected with a Wilcoxon sign rank test, suggesting the study population is unlikely to have experienced a recent genetic bottleneck.
Genetic Structure and Differentiation
MtDNA
The hierarchical AMOVA for mtDNA revealed significant differences in the genetic structure between the subareas (Subareas 58 vs. 88: FCT = 0.011, P = 0.004; Subareas 58 vs. 88.1 vs. 88.2/88.3: FCT = 0.008, P = 0.025), but a lack of genetic structure among populations within the subareas (Subareas 58 vs. 88: FSC = −0.018, P = 0.994; Subareas 58 vs. 88.1 vs. 88.2/88.3: FSC = −0.018, P = 0.978) (Table 2). However, no significant genetic differentiation was observed in the pairwise FST estimates using mtDNA COI and 16S between 20 populations from the Subareas 58 and 88 (Table 3). In addition, no significant mtDNA differentiation was observed in the pairwise FST estimates between adults and juveniles (FST = −0.014, P = 0.982), albeit weak but significant results found in microsatellites (FST = 0.001, P < 0.05) (Supplementary Table 2). The Mantel test of mtDNA, however, revealed a significant correlation between genetic (FST values) and geographic distances (kilometers) for the pairwise comparisons among the 20 populations (r = 0.318, P = 0.010) (Figure 4A). The observed patterns of a genetic break between the Subareas 58 and 88 and also IBD suggest non-negligible phylogeograhic or population structure over space at least from a mtDNA perspective.
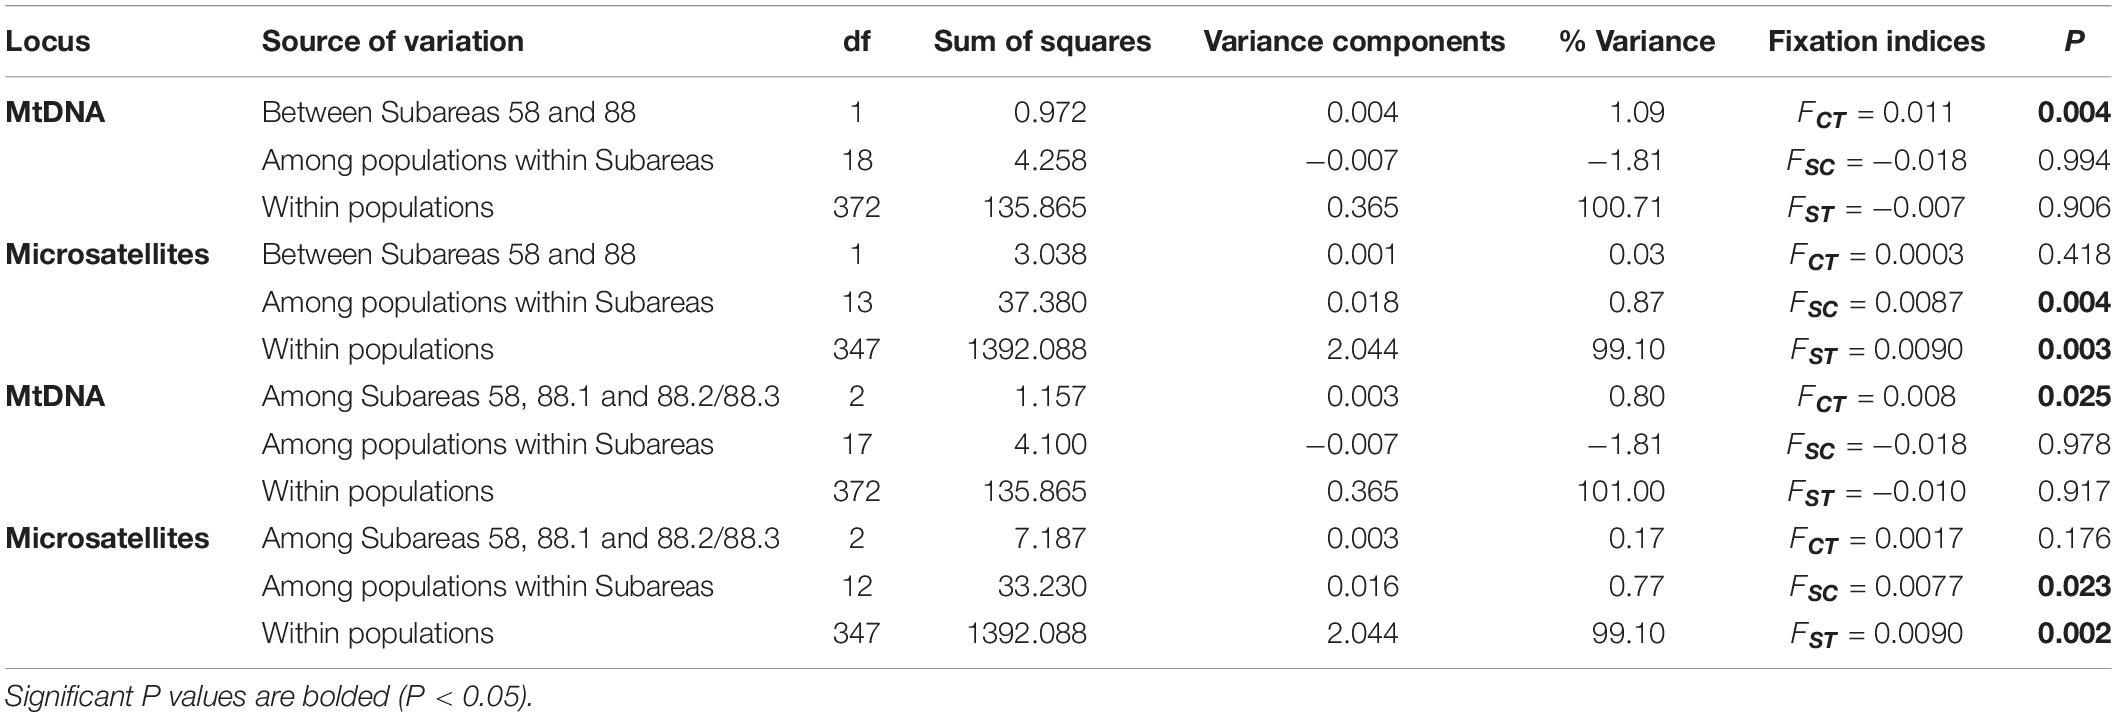
Table 2. Hierarchical AMOVA (Analysis of Molecular Variance) for the 20 (mtDNA) and 15 (microsatellites) populations of Dissostichus mawsoni based on mtDNA (COI and 16S) and seven microsatellite loci according to two different groupings (Subareas 58 vs. 88, Subareas 58 vs. 88.1 vs. 88.2/88.3).
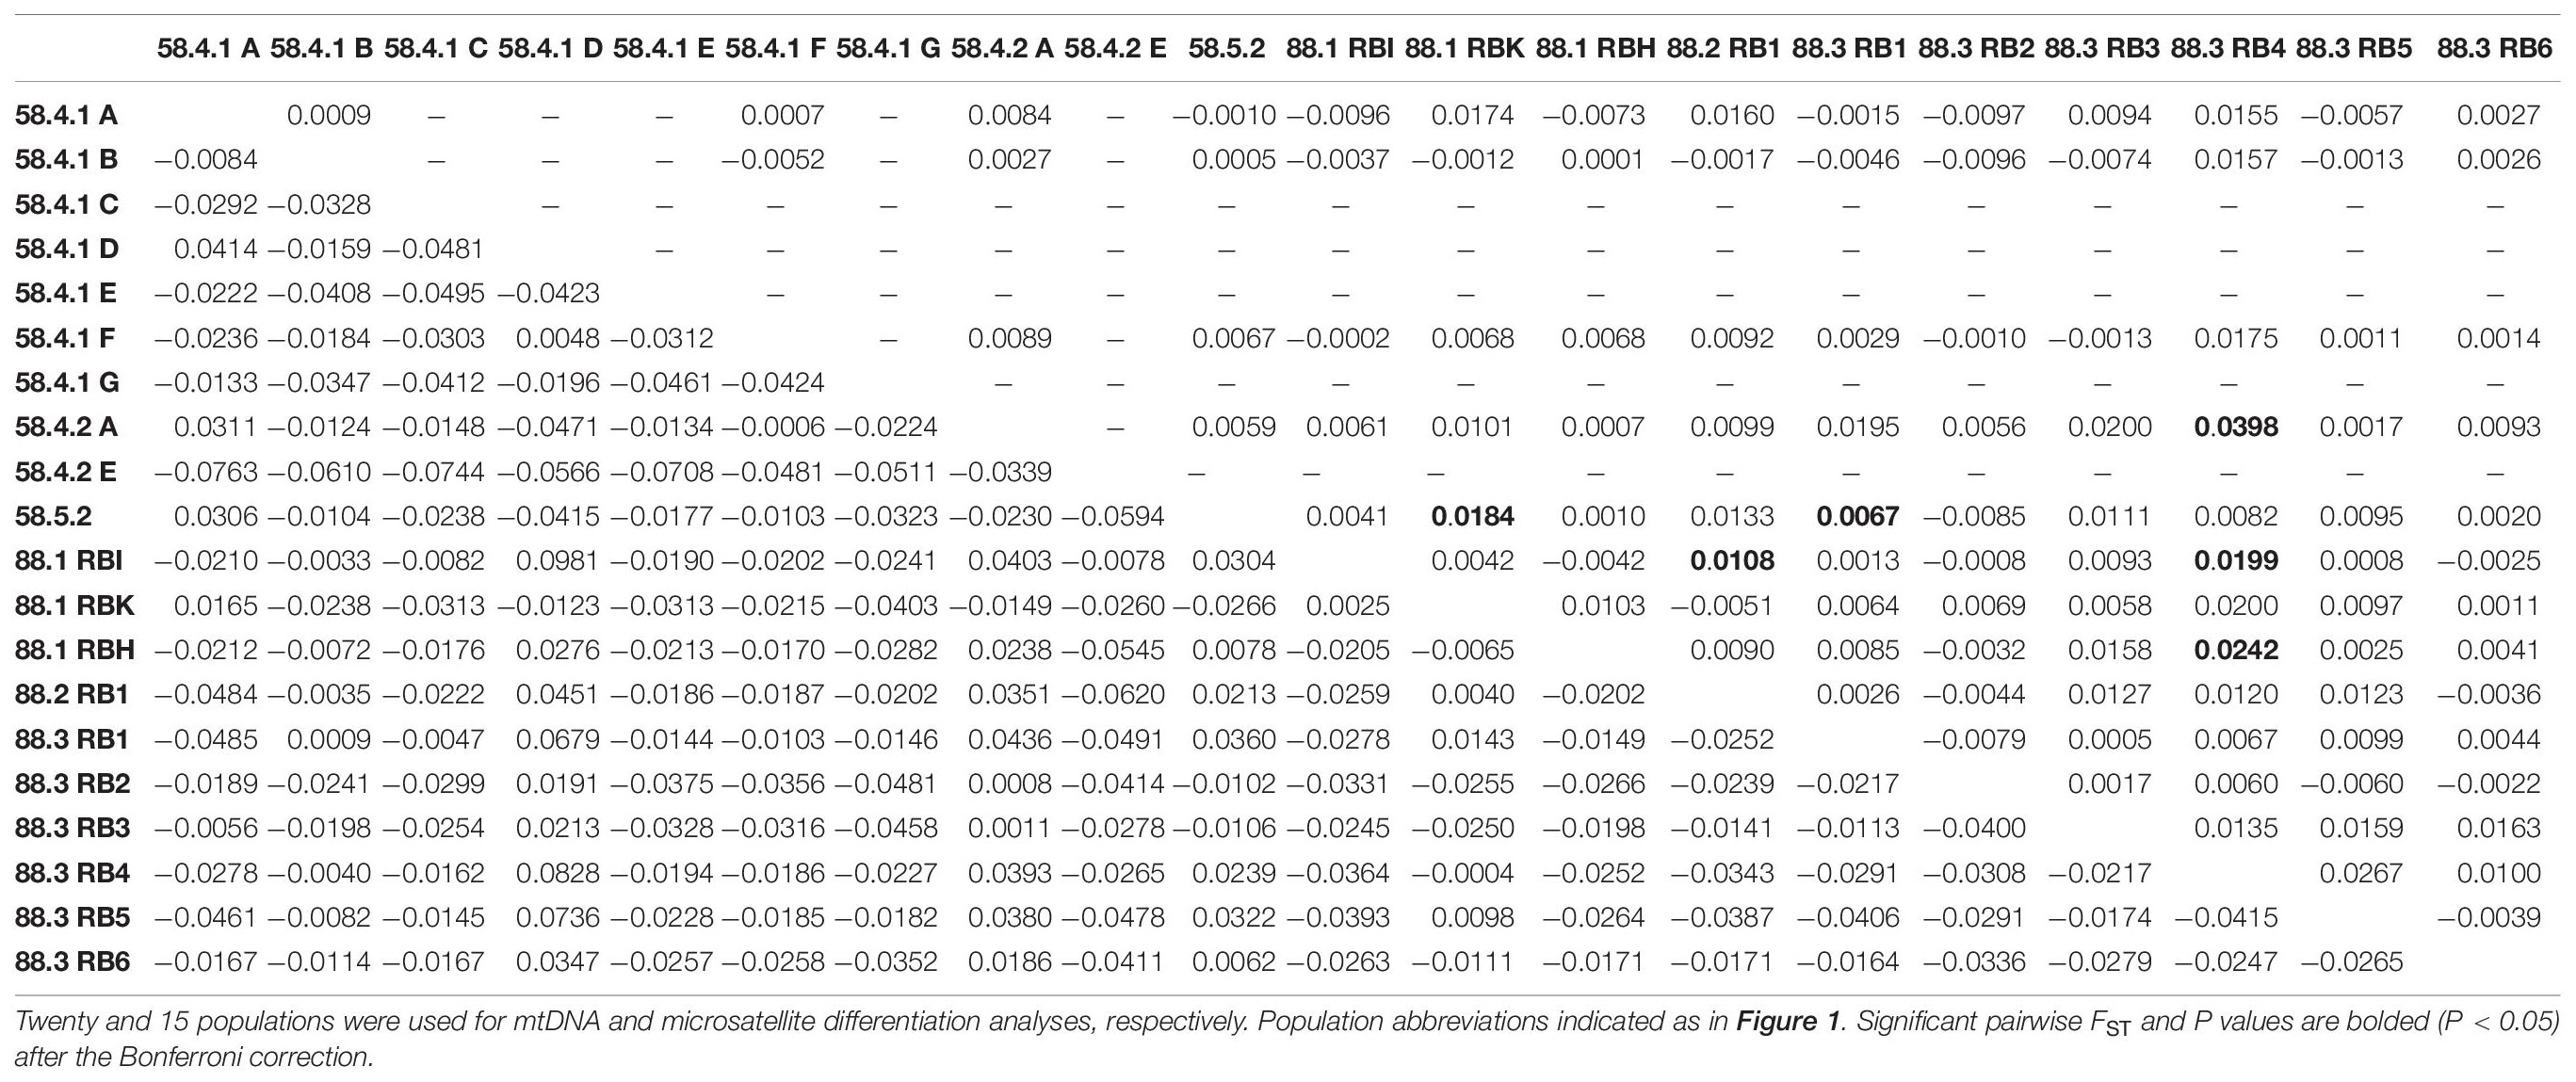
Table 3. Pairwise genetic differentiation (FST) based on mtDNA COI and 16S sequences (below diagonal) and seven microsatellites loci genotypes (above diagonal) for two Subareas 58 and 88 of Dissostichus mawsoni from the Antarctic Ocean.
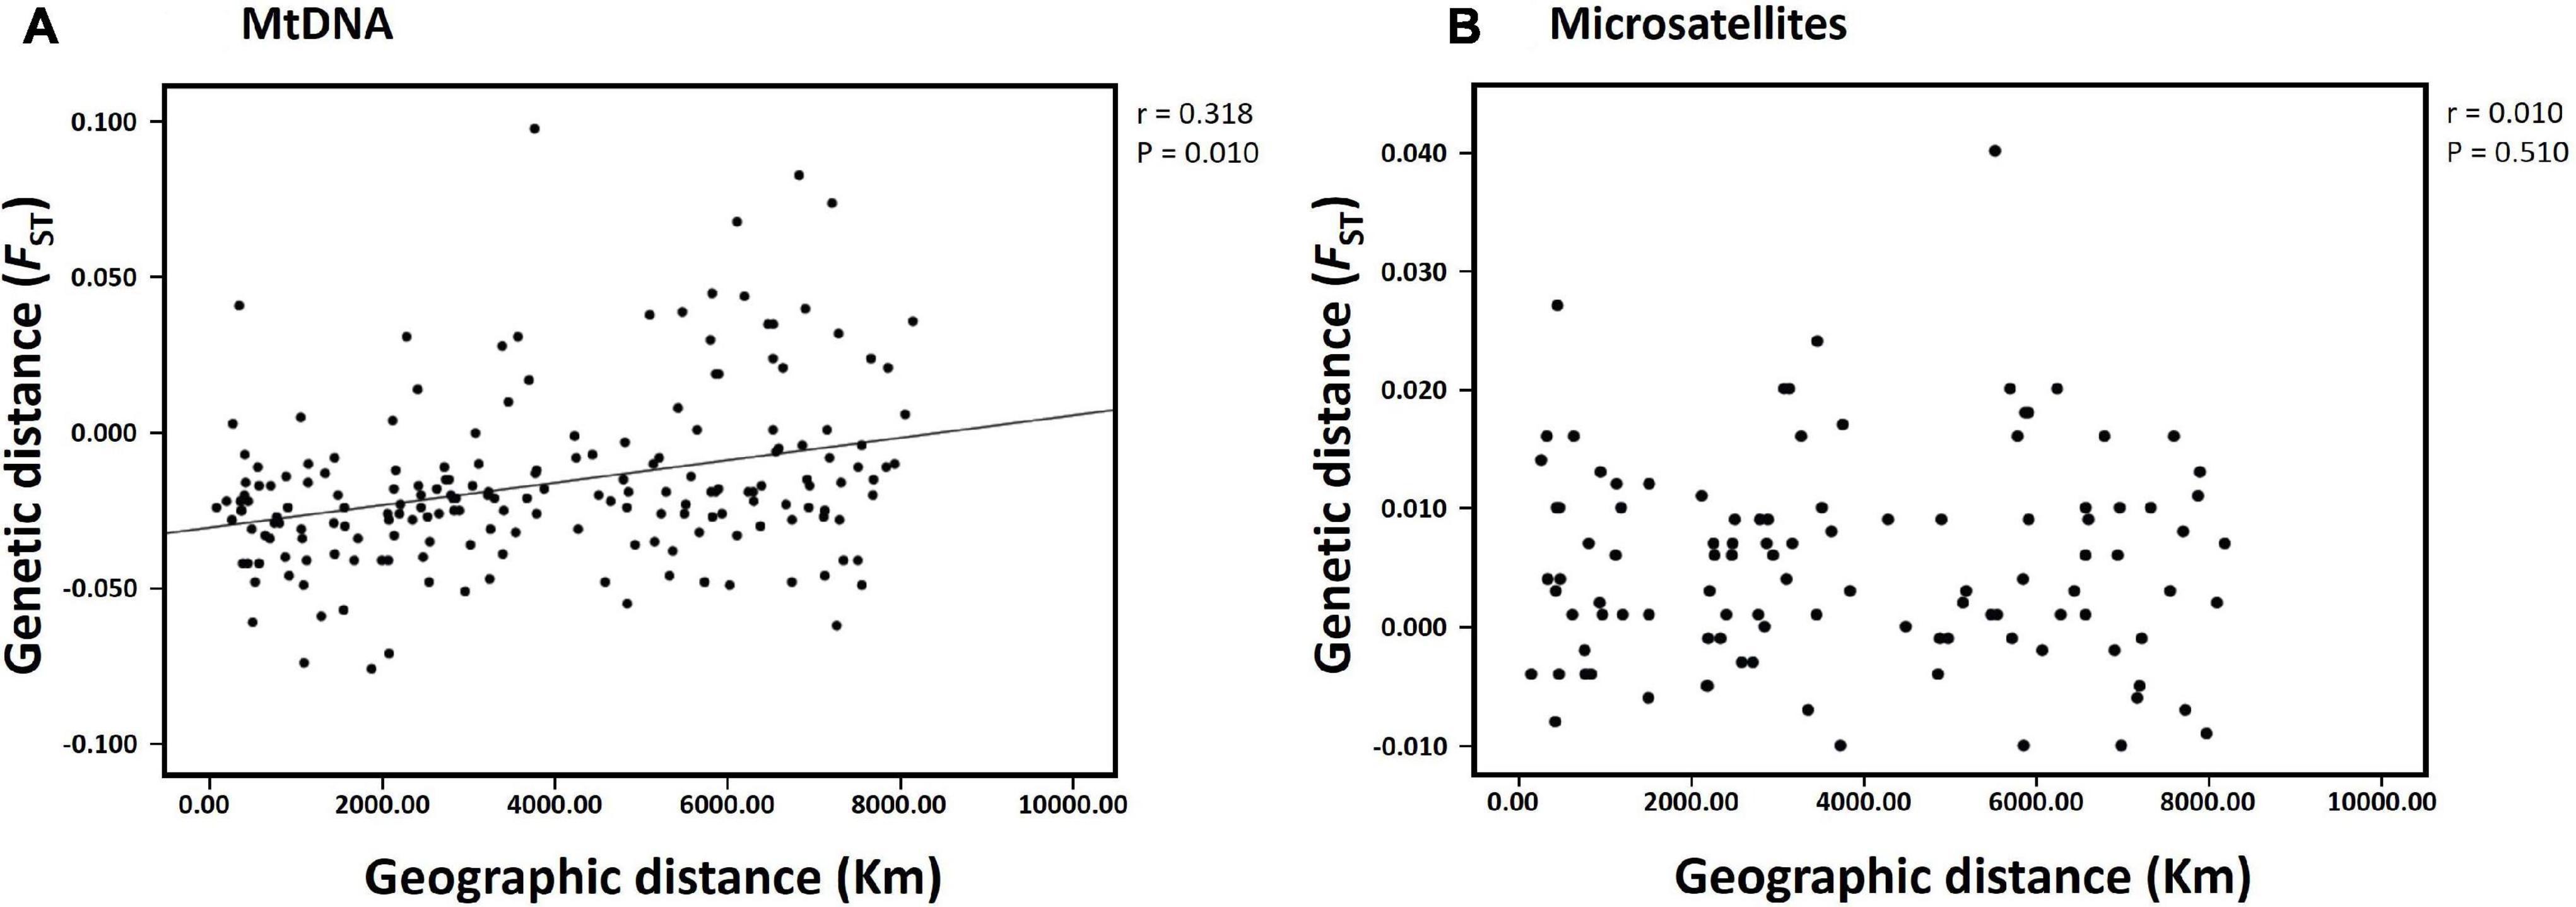
Figure 4. Results of isolation-by-distance (IBD) analysis with the Mantel test for the populations of Dissostichus mawsoni in Subareas 58 and 88. (A) mtDNA (20 populations); (B) microsatellites (15 populations). The relationship between genetic (FST) and geographic distances was statistically significant only for the mtDNA data set (r = 0.318, P = 0.010).
Microsatellites
The AMOVA for microsatellites revealed differences in the genetic structure among populations within the subareas (Subareas 58 vs. 88: FSC = 0.0087, P = 0.004; Subareas 58 vs. 88.1 vs.88.2/88.3: FSC = 0.0077, P = 0.025), but a lack of genetic structure between the subareas (Subareas 58 vs. 88: FCT = 0.0003, P = 0.418; Subareas 58 vs. 88.1 vs.88.2/88.3: FCT = 0.0017, P = 0.176) (Table 2), which is opposite to what we found from mtDNA analysis. We also found weak but statistically significant genetic differentiation detected in six population-pairs, including 58.4.2 A vs. 88.3 RB4, 58.5.2 vs. 88.1 RBK, 58.5.2 vs. 88.3 RB1, 88.1 RBI vs. 88.2 RB1, 88.1 RBI vs. 88.3 RB4, and 88.1 RBH vs. 88.3 RB4 (Table 3). These results might suggest the possibility of genetically different populations of D. mawsoni present in the Subareas 58 and 88.
The results of STRUCTURE analysis of the 15 populations from all populations (combined Subareas 58 and 88) suggested that they are most likely to form three genetic clusters (K = 3) (Figure 5 and Supplementary Figure 3A). Genetic composition appeared to be largely admixed across the 15 populations with homogeneous distribution of individual genotypes, despite they are located far apart at both ends of the Antarctica (Subareas 58 and 88), suggesting that all these populations are genetically indistinguishable as one group in general, albeit some local structure also present. Approximately similar proportions of the inferred three genetic clusters suggest that all populations are genetically undifferentiated and so could not form clusters most likely due to the very low level of FST values (overall mean FST = 0.0053) (Latch et al., 2006). When STRUCTURE analysis was performed separately for each Subarea 58 and 88, the observed most likely number of genetic clusters corresponded to two genetic clusters for the Subareas 58 (Supplementary Figures 3B, 4A), and three clusters for the Subareas 88 (Supplementary Figures 3C, 4B). Moreover, FCA results of seven microsatellites supported the well-admixed panmictic population constituting the Subareas 58 and Subareas 88 (Figure 6). When FCA analysis was performed separately for each Subarea 58 and 88, similarly results of no genetic clustering were found (Supplementary Figure 5). The Mantel test of microsatellites showed a non-significant correlation between genetic (FST values) and geographic distances for the 15 populations (r = 0.010, P = 0.510) (Figure 4B). The results of STRUCTURE analysis of adult-juvenile comparisons showed that they are most likely to form a single genetic group (K = 1) (Supplementary Figure 6), suggesting no genetic difference between juveniles and adults.
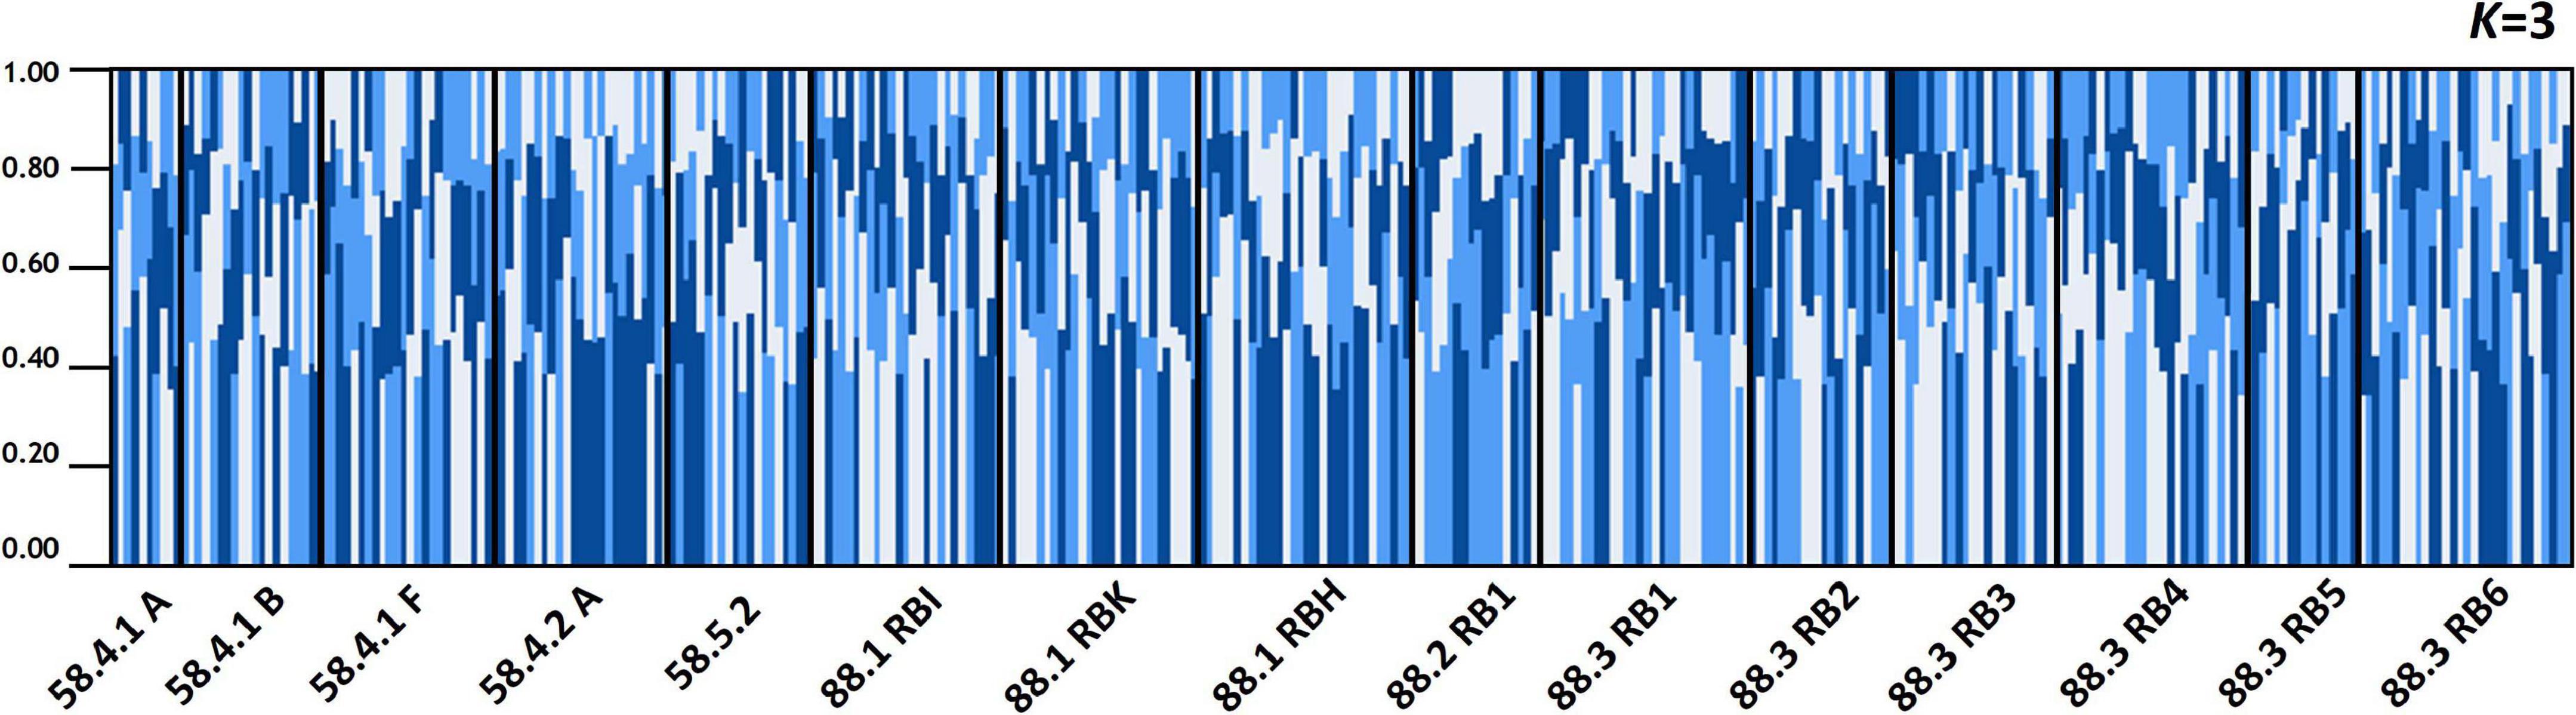
Figure 5. Population structure based on a Bayesian population assignment assuming of Dissostichus mawsoni for 15 populations from Subareas 58 and 88 in the Antarctic Ocean using seven microsatellite loci. Each individual is represented along the X-axis, and the Y-axis denotes the probability of that individual belonging to each of the genetic clusters. Analyses of population structure for the all 15 populations combined. The mixing of genetic units is apparent most likely due to high population connectivity.
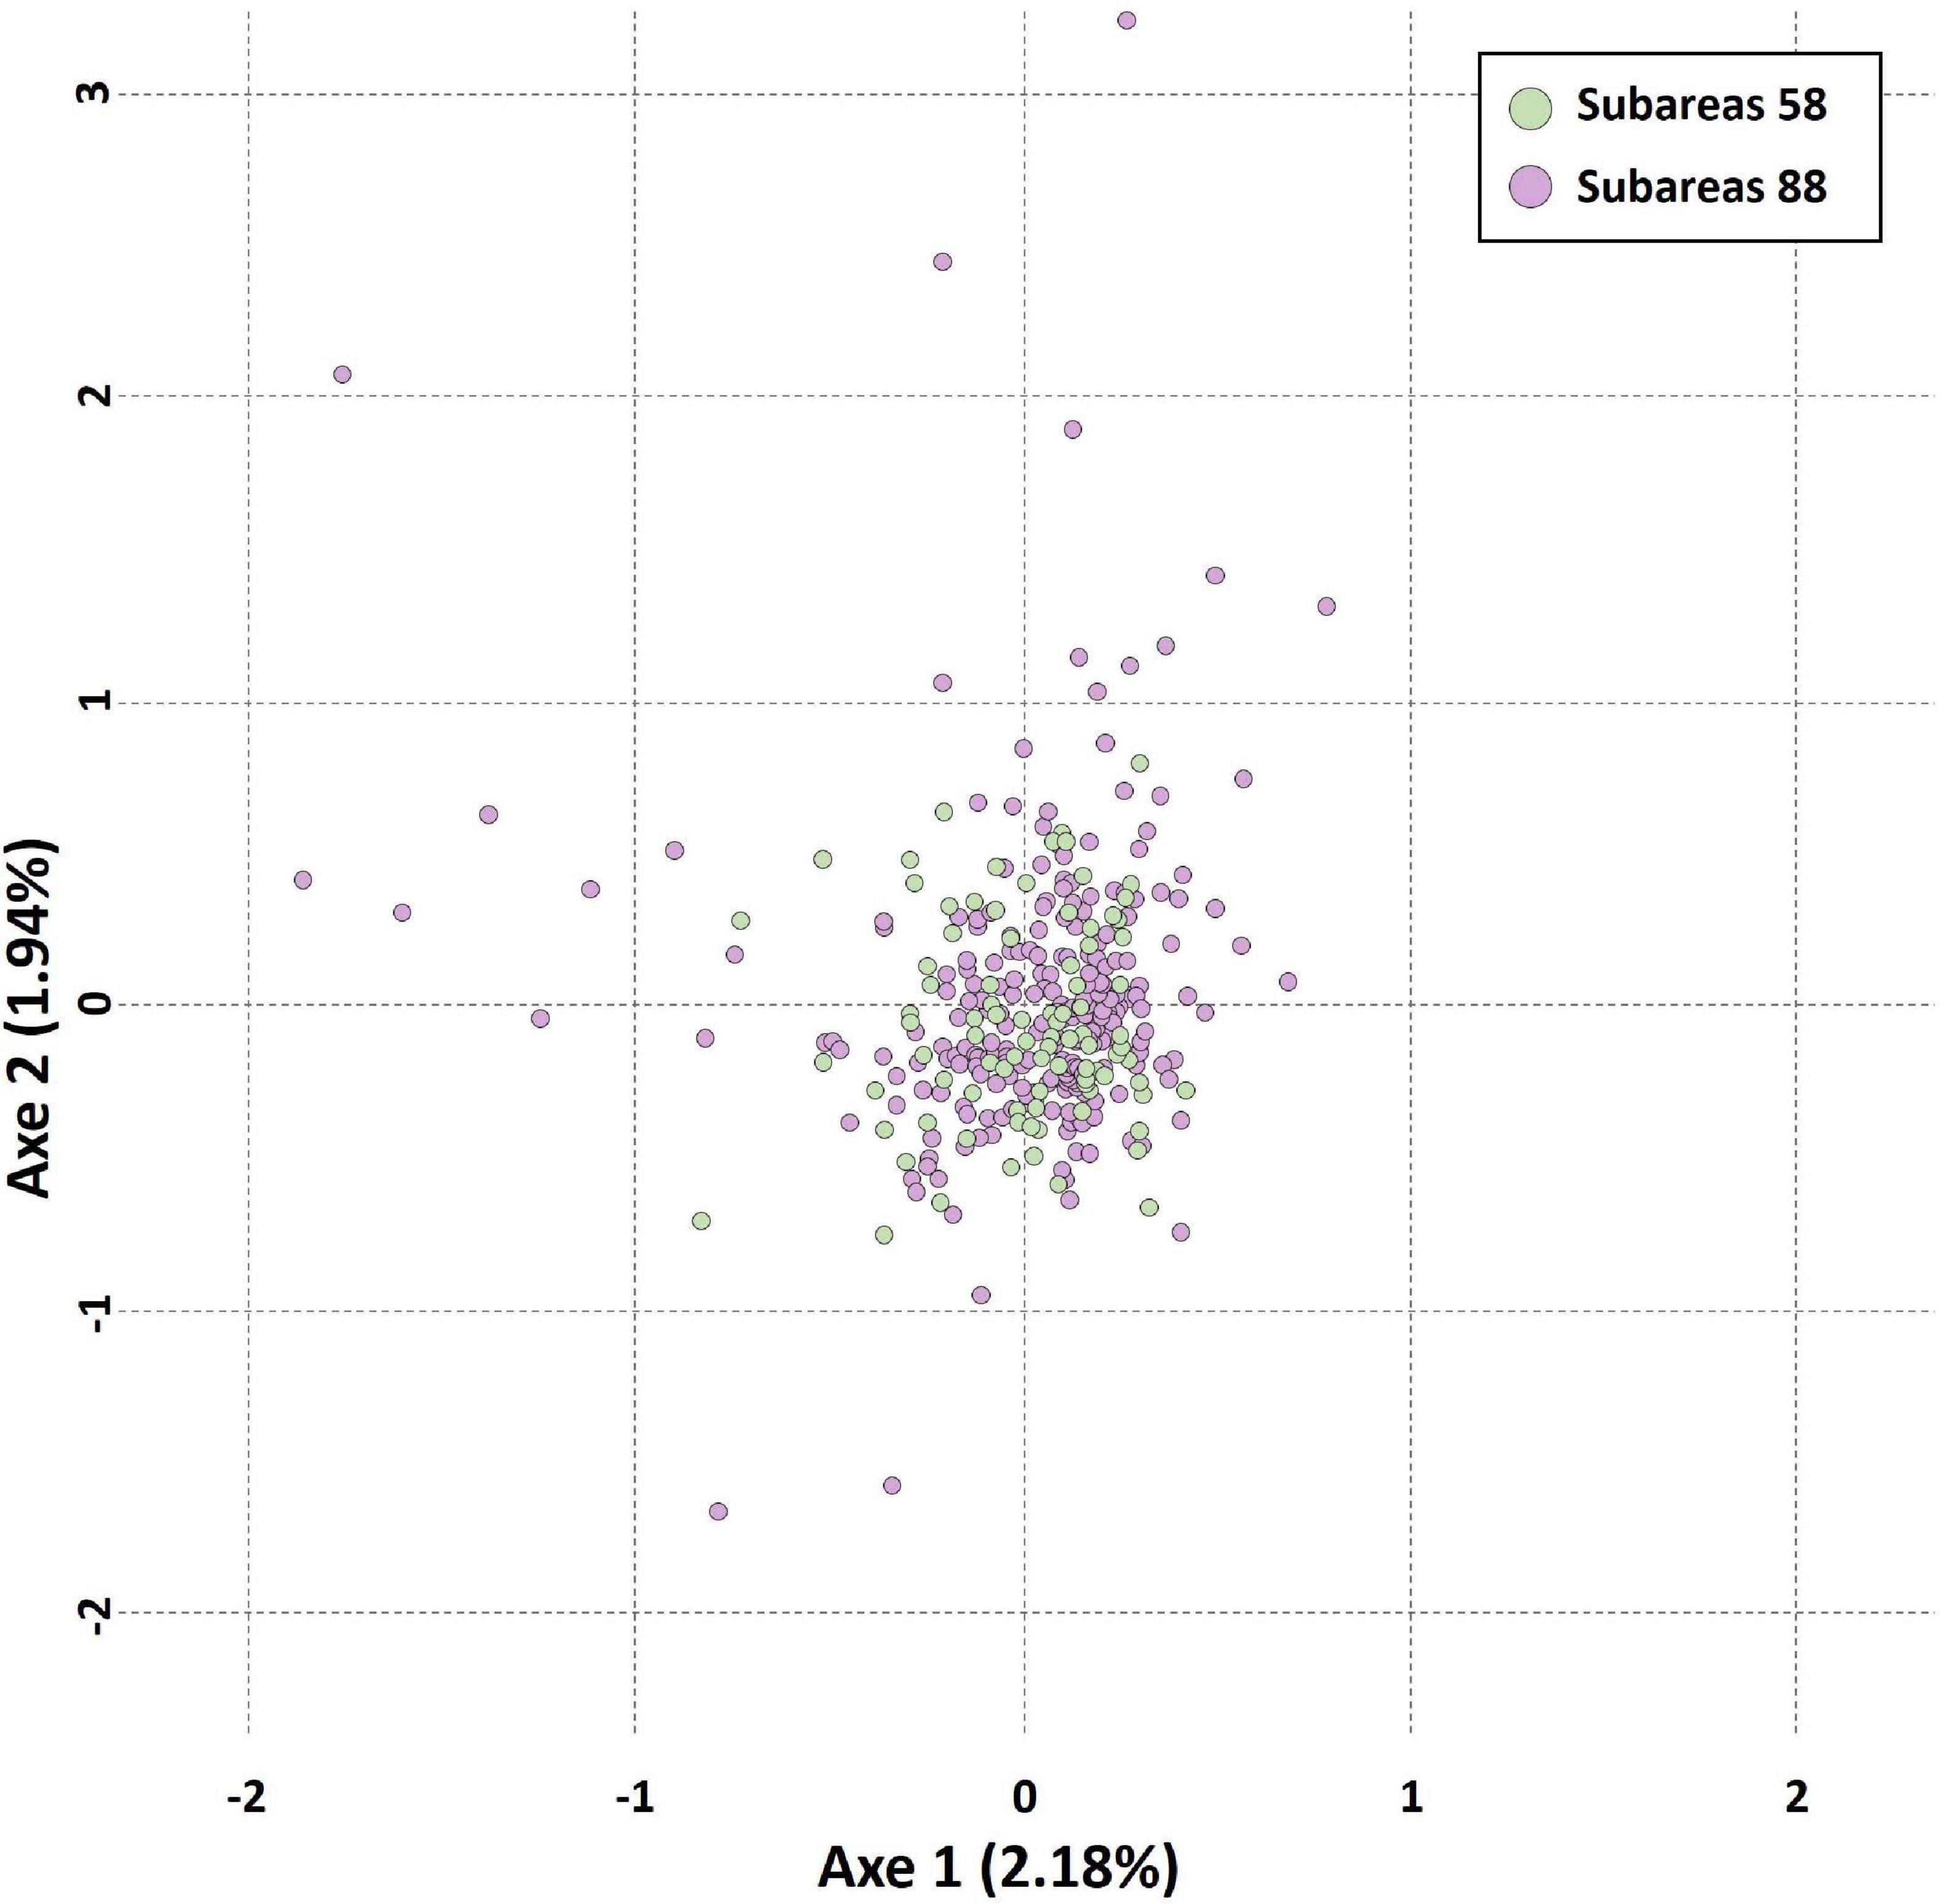
Figure 6. Results of factorial correspondence analysis (FCA) showing multivariate relationships between the Subareas 58 and 88 of Dissostichus mawsoni based on seven microsatellite allelic variation. Circles in green represent Subareas 58, and those in purple represent Subareas 88.
Demographic History and Phylogenetic Relationships
A sudden population expansion of D. mawsoni was supported by the results of the mismatch distribution and neutrality tests. Mismatch distribution of D. mawsoni showed smooth and unimodal shapes albeit statistical significance (sum of squared deviations = 0.1148, P = 0.01, raggedness index = 0.2884, P < 0.01; Figure 7), suggesting that sudden population expansion had occurred (Rogers and Harpending, 1992). Both the Tajima’s D and Fu’s Fs statistics for neutrality were negative in Subareas 58 (Tajima’s D = −2.19, P < 0.01; Fu’s Fs = −30.09, P < 0.01), Subareas 88 (Tajima’s D = −2.11, P < 0.01; Fu’s Fs = −21.20, P < 0.01) and all populations (Tajima’s D = −2.35, P < 0.01; Fu’s Fs = −29.16, P < 0.01), which indicates that a historical population expansion occurred following a population bottleneck.
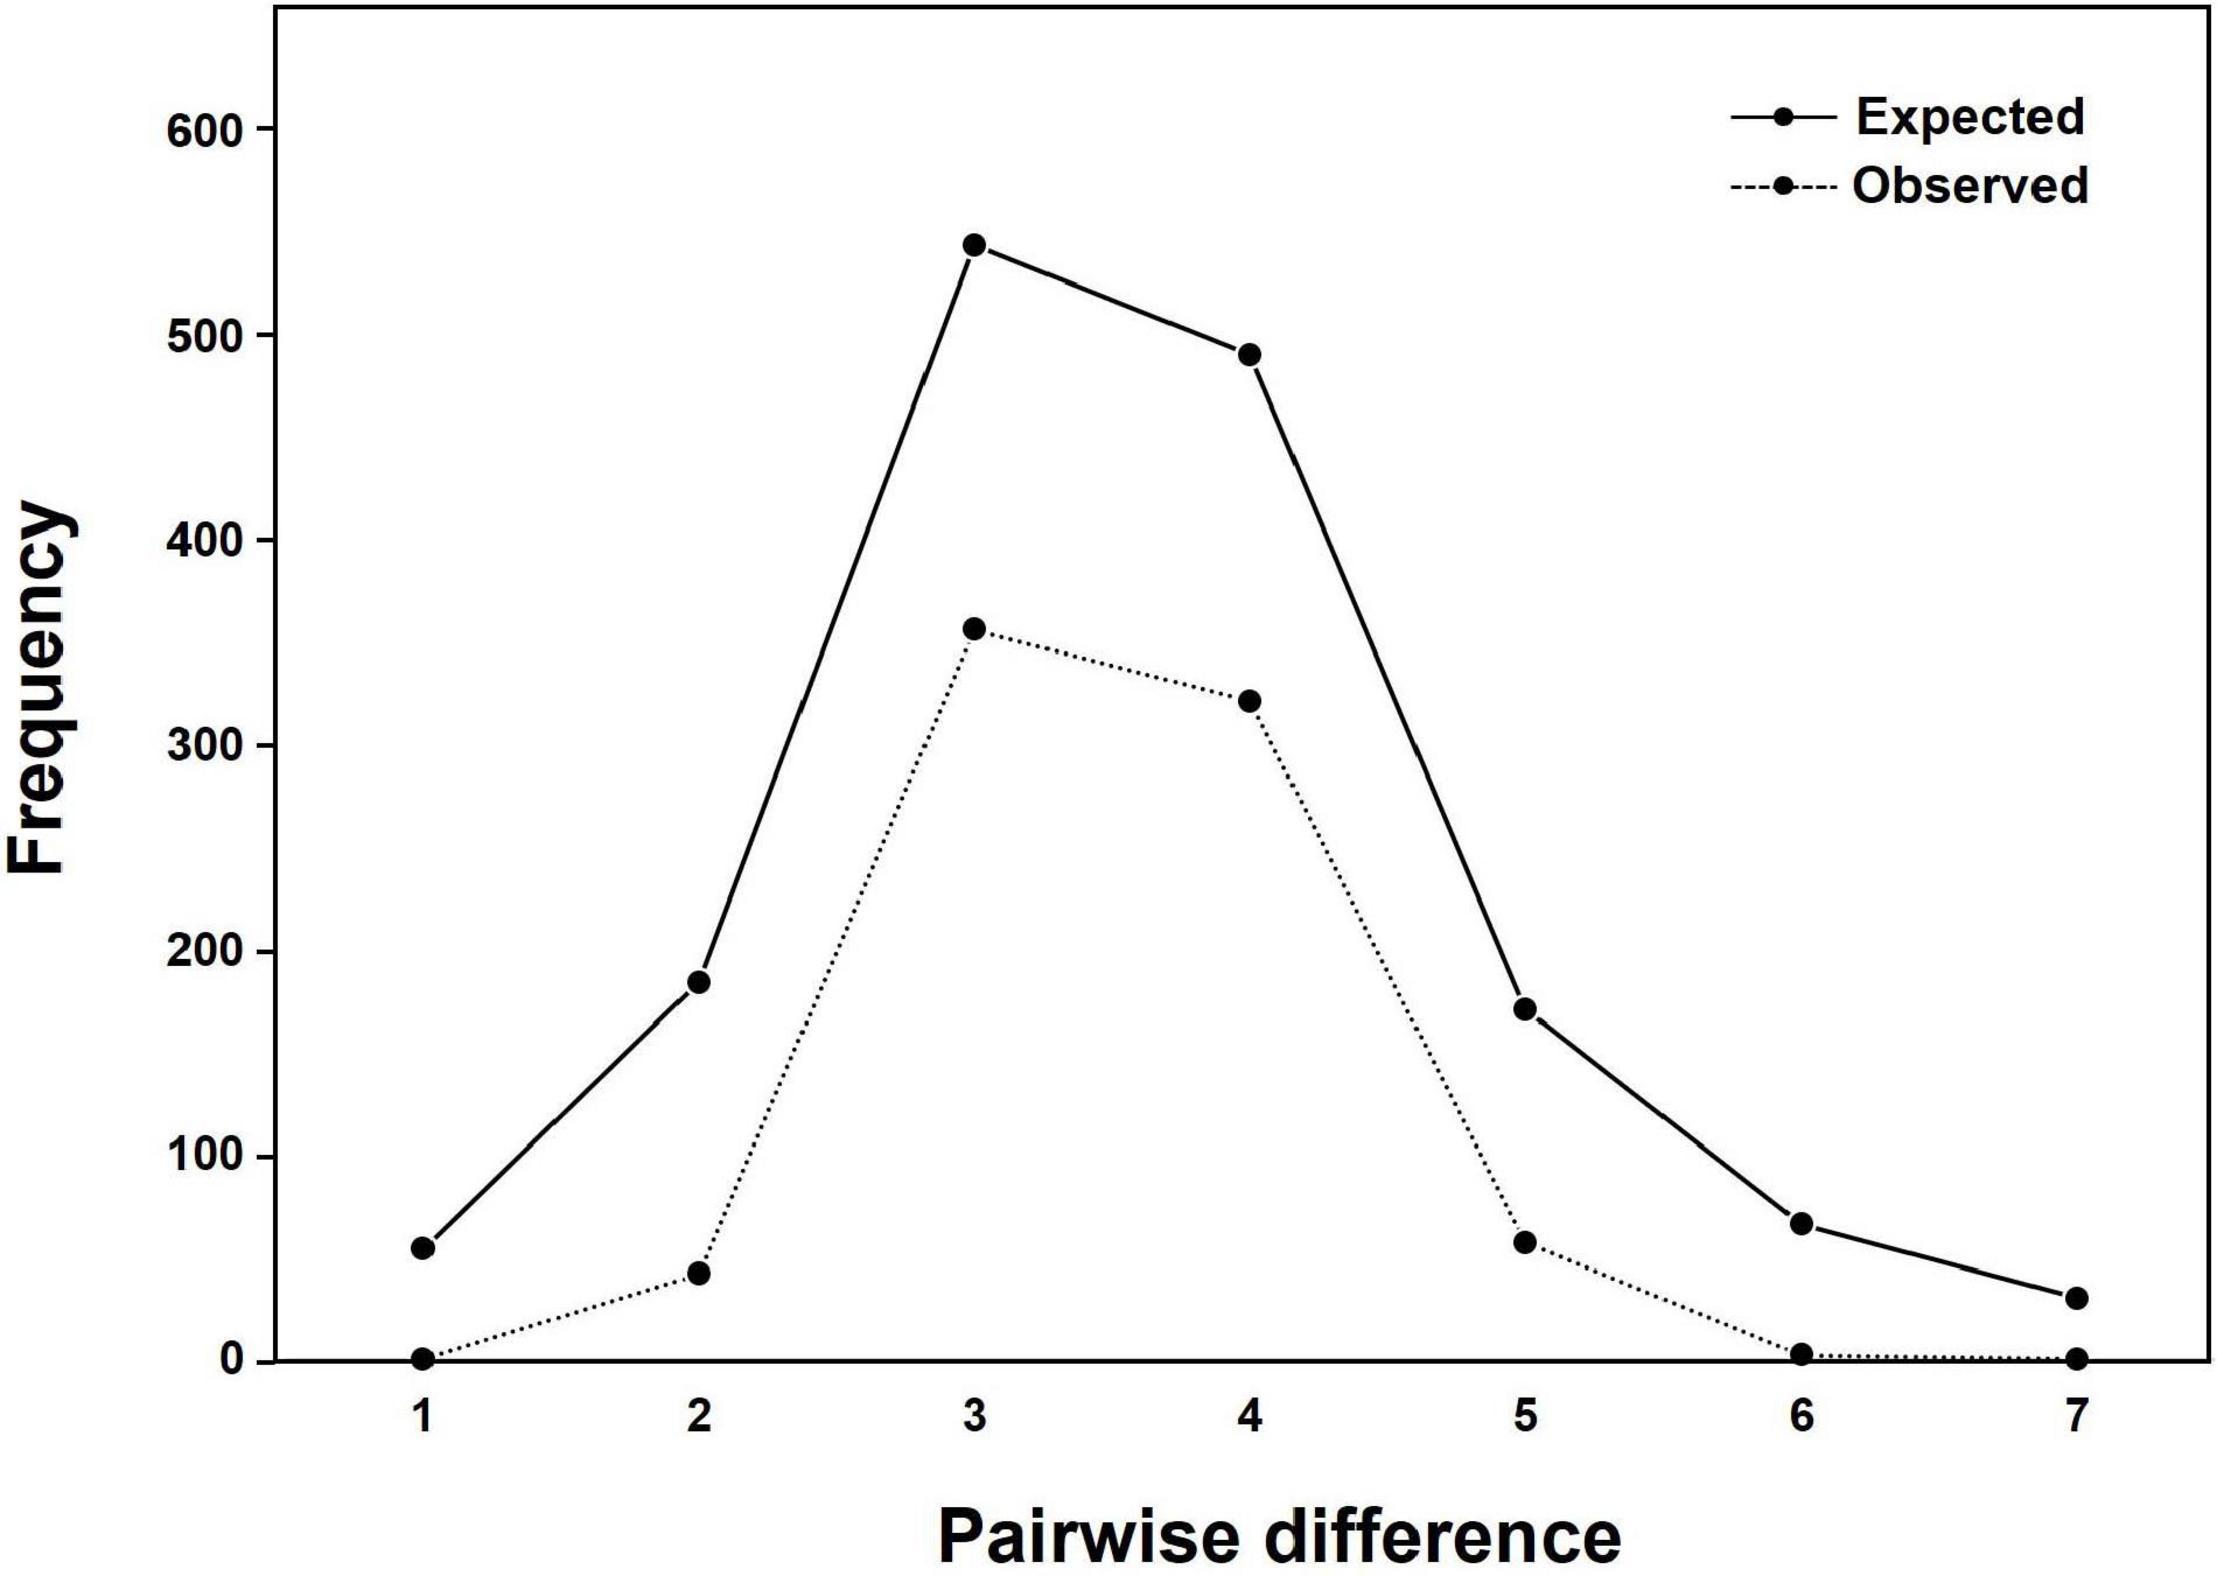
Figure 7. Results of mismatch distribution of nucleotide differences between pairs of mtDNA COI and 16S haplotypes (1,304 bp) in Dissostichus mawsoni. There was a significant difference between the observed and expected frequencies (sum of squared deviation = 0.1148, P = 0.01).
With respect to phylogenetic relationships, forty mtDNA haplotypes linked by only 1–5 mutational steps could not provide any evidence for diverged clades or lineages among haplotypes and also across localities (Supplementary Figure 7A), suggestive of their shallow evolutionary history. Similarly, NJ tree based on microsatellite distances did not show phylogenetic patterns of distinct clades locally evolved in the subareas (Supplementary Figure 7B).
Discussion
Genetic Diversity
Our study shows that an overall mitochondrial diversity in D. mawsoni is quite lower than the reported levels of mtDNA diversity in temperate or tropical fishes (Manel et al., 2020). The mtDNA COI nucleotide diversity levels (sequences longer than 500 bp) as estimated from the mean number of mutations per base pair (π) are found to be <0.001∼0.002 in temperate fishes, which is substantially lower than tropical fishes (π > 0.002) (Manel et al., 2020). Our estimated π value for D. mawsoni in COI (685 bp) is 0.00016 ± 0.00029, which is even approximately more than ten-fold lower than those levels. There are two hypotheses that have been proposed to explain the observed low mtDNA gene diversity in D. mawsoni than those of temperate and tropical fishes. Small NE or historical bottleneck events may lead to the low mtDNA diversity in this species (Parker et al., 2002). Alternative explanation would be that extremely cold environments drove low rates of micro-evolutionary change owing to much lower metabolic rates, resulting in the low mtDNA diversity in the Antarctic toothfish relative to temperate-zone fish (Parker et al., 2002). The first hypothesis could be rejected by our findings that none of the 20 populations from the Subareas 58 and 88 tested show a sign of population bottlenecks. However, star-like tree topology of the haplotype network, where the most common, two ancestral haplotypes are linked with more recent ones connected with only one or two mutations, typically represent the scenario of population expansion from a small number of founders around the Antarctic Ocean once the glacial maximum had passed and the ice cover sheets retreated (Figure 2). Marine organisms with high dispersal potential in the Antarctic Ocean have often shown the “star-like” pattern of haplotype network (Allcock and Strugnell, 2012). Results of Tajima’s D and Fu’s Fs statistics and mismatch distribution of D. mawsoni could also reject the hypothesis of the constant population size under mutation-drift equilibrium (Figure 7). A demographic expansion during the last glacial maximum (LGM) was documented for benthic fishes, Trematomus bernacchii and Trematomus pennelli (Janko et al., 2007). Nevertheless, the second “evolutionary speed” hypothesis is more likely to account for low mtDNA diversity, given a strong positive correlation between the rate of metabolism and DNA substitution rate for both nuclear and mtDNA in vertebrates (Avise et al., 1992; Bargelloni et al., 1994). Metabolic rates of Antarctic fish are known to be typically lower than those of temperate fish (Bargelloni et al., 1994). Such an association may be caused by oxidative damage by radicals, which are yielded as by-products of aerobic metabolism (Richter et al., 1988). A recent review of mitochondrial diversity in 3,815 marine fish species at the global scale showed that sea surface temperature is the major determinant of the global patterns of diversity (Manel et al., 2020). The causal link between temperature and diversity levels can be explained by the evolutionary speed hypothesis that cold temperature environments like the Antarctic region could lengthen generation times and slow-up mutation rates, thereby likely diminishing genetic diversity (Oppold et al., 2016). This interesting hypothesis of “the low metabolic rate driving slow molecular evolution in mtDNA” needs further a detailed investigation.
At the intraspecific levels, by comparison to a previous study of the Antarctic toothfish (Kuhn and Gaffney, 2008) using different mtDNA markers (ND2: h = 0.182, π = 0.0003; CR/tRNA: h = 0.032, π = 0.0001; cyt b: h = 0.153, π = 0.0003), our study shows that 20 geographic populations inhabiting the two main Subareas 58 and 88 in the Antarctic Ocean have relatively higher levels of mtDNA diversity (h = 0.571, π = 0.0006), although much larger sample sizes used in this study. The results of our study can therefore provide more conclusive information for delineating the population and phylogeographic structure, compared to previous studies using other mtDNA markers (Smith and Gaffney, 2005; Kuhn and Gaffney, 2008). The Patagonian toothfish (D. eleginoides), a sister species of our study organism, also showed a very low mtDNA diversity (h = 0.1193; π = 0.0007) in the 12S rRNA region (249 bp) for 151 individuals (Rogers et al., 2006). Among 40 mtDNA haplotypes detected in the present study, 21 haplotypes occurred exclusively at Subareas 58, whereas 13 haplotypes existed only at Subareas 88, although the remaining six haplotypes (Hap1, Hap2, Hap3, Hap6, Hap8, and Hap9) were shared between the two Subareas (Figures 1, 2). In particular, Hap4, Hap5, Hap7, Hap11, and Hap12 with 2–3 individuals, have evolved only in the Subareas 58 and Hap10 with two individuals has diverged only in the Subarea 88.1 RBH. The presence of locally and/or regionally unique matrilineal lineages might provide some evidence supporting the previous hypothesis that D. mawsoni populations form two genetically or phylogenetically distinct clusters or lineages (Ross and Bellingshausen Seas) based on RAPD markers (Parker et al., 2002). SNPs in the COI and 16S could distinguish distinct lineages between the Subareas 88 and 58, and also among the Subareas 58, 88.1, and 88.2/88.3, given significant differences detected in the genetic structure between/among these regions suggested by mtDNA AMOVA analyses, albeit no such a pattern shown in microsatellites (Table 2). Relatively higher mtDNA diversity in the Subareas 58 compared to Subareas 88 might in part contribute to the observed mtDNA population structure. The higher levels of genetic diversities can be interpreted as larger NE for the populations from Subareas 58 than for those from Subareas 88, given a positive correlation expected between population sizes and genetic diversity level according to population genetics theory (Freeland et al., 2011). Mean of a lower bound of NE is higher in the Subareas 58 (NE = 125.1) than the Subareas 88 (NE = 90.9) after excluding 88.3 RB6 with a lower bound of ∞ (Table 1). However, a mtDNA footprint of the phylogeographic structure (e.g., a genetic break from AMOVA, significant IBD) might have been erased by strong contemporary connectivity via ongoing gene flow occurring among the populations during their pelagic larval stage, as shown by weak population differentiation, absence of IBD, and large population admixture in the results of microsatellite analyses. The faster genetic differentiation or divergence processes undergone in mtDNA relative to nuclear DNA due to its one-quarter smaller NE (Avise, 2012) would be the most plausible explanation of how and why some detectable structure could only exist in mtDNA (see below). Although mtDNA genes have frequently been used as genetic markers for inferring evolutionary or demographic histories of organisms (i.e., phylogeography), microsatellite loci are suggested to be more suitable for elucidating “contemporary” processes of populations as they typically evolve faster (Avise, 2012).
Population Structure
In general, the results of our population structure analysis based on microsatellites support the notion that the sampled populations of D. mawsoni are likely to represent a genetically well-admixed panmixia, suggested by multiple lines of analyses such as pairwise F-statistics and STRUCTURE. Previous studies of mtDNA and nuclear intron markers also showed a negligible level of population structure over space and time in the Antarctic toothfish populations from the CCAMLR Subareas (Smith and Gaffney, 2005; Mugue et al., 2014). A recent population genomics study of D. mawsoni from the Subareas 48, 58, 88, and the South Pacific Regional Fisheries Management Organisation (SPRFMO) area north of Subarea 88.1 suggested a complete lack of the genetic structuring across the Southern Ocean (Maschette et al., 2019). The weak stock structure is most likely to result from high population connectivity through extensive larval dispersal by the Southern Ocean circulation systems during the free-swimming larval stage of D. mawsoni. The epipelagic period as planktonic larvae of D. mawsoni has been reported as up to 9–12 months (Hanchet et al., 2008). The findings of genetic homogeneity are therefore due to high ongoing gene flow across geographic localities with oceanic currents (e.g., Antarctic Circumpolar Current, Antarctic Coastal Current) during the planktonic larval stage of this fish. Long-distance dispersal of adults is also plausible, given adults can migrate up to over 4,000 km, based on mark-recapture tagging studies (CCAMLR-Secretariat, 2017).
However, we should be precautious about the interpretation of the single genetic stock (i.e., gene pool) of these populations, considering detectable microsatellite differentiation apparent for six population-pairs, mtDNA spatial structure present between the Subareas 58 and 88 and also among the Subareas 58, 88.1, and 88.2/88.3, and also the significant IBD patterns in mtDNA (see below). Some studies revealed significant geographic variation among populations, suggesting the possible existence of multiple genetic stocks in D. mawsoni in this region (Parker et al., 2002; Kuhn and Gaffney, 2008). Despite geographic isolation among the 15 populations in the Subareas 58 and 88, we found there was weak but statistically significant genetic differentiation only in six population-pairs, such as 58.4.2 A vs. 88.3 RB4 (FST = 0.0398, P < 0.001), 58.5.2 vs. 88.1 RBK (FST = 0.0184, P = 0.0004), 58.5.2 vs. 88.3 RB1 (FST = 0.0067, P = 0.0004), 88.1 RBI vs. 88.2 RB1 (FST = 0.0108, P = 0.0003), 88.1 RBI vs. 88.3 RB4 (FST = 0.0199, P < 0.001), and 88.1 RBH vs. 88.3 RB4 (FST = 0.0242, P < 0.001). Although there is generally no evidence for mtDNA differentiation among populations between the two Subareas 88 and 58 as indicated by F-statistics, it should be cautious about managing them as one stock (i.e., a panmictic population), given some microsatellite differentiation and also locally specific mtDNA lineages (Subareas 58: Hap4, Hap5, Hap7, Hap11, and Hap12; Subareas 88: Hap10) detected. The relatively higher between- and among-subarea variation, with reference to within-subarea variation suggested by multiple AMOVAs also indicates weak, but some detectable mtDNA variation exists between the Subareas (Table 2). Furthermore, a Mantel test of mtDNA suggests moderate evidence of positive relationship in genetic distances (FST) between populations and geographic distances, which is consistent with a recent genomic study of Maschette et al. (2019). These results suggest that while genetic differences between populations are rather small, they tend to accumulate with increasing geographic distances, supporting the non-negligible population structure. The observed patterns of IBD only present in mtDNA, but not in microsatellites might suggest the detectable phylogeographic structure shaped by evolutionary history of D. mawsoni, while this evolutionary signature has been wiped out by the strong contemporary processes (connectivity) among the populations via ongoing gene flow during its pelagic larval stage. This pattern was also indicated in the Patagonian toothfish (D. eleginoides) (Shaw et al., 2004). Population differentiation or divergence processes are predicted to undergo more quickly, in theory, four-times faster in mtDNA relative to nuclear DNA due to its NE being one-quarter of the nuclear genome (Moore, 1995). This could explain why we observed the significant IBD only in mtDNA, but not in microsatellites. Another possibility would simply be that the microsatellite loci used in this study have a poor resolution for discriminating geographic populations of the toothfish. No significant genetic differentiation between juveniles and adults suggests the temporal stability in the genetic structure of D. mawsoni, which is consistent with a previous finding of Mugue et al. (2014). No significant temporal genetic variation indicates that their NE values are large enough to prevent genetic drift effects over generations (Lee and Boulding, 2007). Our estimated NE values with a range of 1,514∼∞ may support this notion.
The population/stock structure of Antarctic toothfish provides important information for improving stock management/enhancement programs for at least two particular reasons: (1) it gives detailed information on the number and distribution of the genetic stocks of the species; (2) it offers information on the comparative genetic diversity levels. Based on our findings, we can provide two suggestions for the management and conservation of this fishery resource. The Antarctic toothfish fishery is now managed by CCAMLR at the Subarea and Division levels coordinated by different nations. Its primary aim is to make decision rules to set catch limits or “quota” at the management levels. In this regard, we suggest directions to “reduce the catch (harvest) in Subareas 88” in comparison to Subareas 58, given their significantly lower diversity. In theory, low genetic diversity within populations implies that NE is small and is thereby susceptible to the effects of inbreeding, genetic drift or a combination of the two (Hartl and Clark, 2007). While we observed only weak population structure of D. mawsoni across the Subareas 58 and 88 regions as suggested by Maschette et al. (2019), we cannot argue that the current fishery management policy needs to be changed as we are still uncertain that stock structure between the Subareas 58 and 88 may exist. Genetic analysis alone has, of course, a limitation in determining the stock structure, as information on ecological differentiation would be necessary. Assessments of ecological divergence between populations from Subareas 58 and Subareas 88 could compromise the limitations of genetic analysis alone in identifying the population/stock structure of D. mawsoni. For example, evaluating trophic niche differentiation between the regional populations through the analysis of their food compositions will help to understand the stock structure of this species (see below).
Given our results are inconclusive, adding more microsatellites (particularly D. mawsoni specific primers) to the existing dataset might help to more accurately determine the population or stock structure of D. mawsoni in the seas of the Antarctic Continent. Although the study sites and genetic approaches are different, our findings of a signal of some genetic differentiation or structure are inconsistent with the previous results of a complete lack of structure using 10,303 SNPs that were developed across the whole nuclear genome (less than 0.1% of the genetic variation) (Maschette et al., 2019). Based on the findings of the present study, it should be careful to manage fisheries for the genetically identical stock, although overall patterns suggest they are likely to share a common gene pool. Nevertheless, a mantel test of mtDNA for IBD indicates that the degree of genetic differentiation was positively correlated with geographic distances. Ecological features of the Antarctic toothfish, such as dietary composition and feeding strategy (Yoon et al., 2017), possible locations of its spawning grounds and effects of the Antarctic Ocean currents should be considered more carefully to better understand how the population/stock is shaped and structured. Different dietary composition between Subareas 58 and Subareas 88 represents ecological divergence between the two regional populations, which may facilitate the population structuring (Yoon et al., 2017). Using additional tissue samples from the Subareas 48 and also from the Subareas 88 will allow for defining the population/stock structure of this fish more precisely. A continuous long-term genetic monitoring will be crucial for understanding how well these valuable fishery populations will sustain particularly under current climate changes.
Data Availability Statement
The mtDNA COI and 16S, and CR, Cyt b and ND2 sequences obtained for this study have been deposited in GenBank under the accession numbers MW684720-MW684761 and MZ170964-MZ170973, respectively. The datasets (distribution of mtDNA haplotypes among the 20 sampling localities, microsatellite genotypes) are also included in Supplementary Tables 3, 4, respectively.
Ethics Statement
Ethical review and approval was not required for the animal study because Antarctic toothfish individuals were sampled from around the seas of the Antarctic Continent by a bottom longline for fishery and we used tissues of these animals that were already dead for our genetic analysis.
Author Contributions
SC, S-GC, H-WK, and HJL conceived and designed the study. H-kC, JEJ, SYB, YRK, DM, and HJL performed the experiments and analyzed the data. SC, S-GC, and DM supported the field expedition for Antarctic toothfish sampling. H-kC, JEJ, SYB, YRK, and HJL drafted the manuscript. All authors read and approved the final manuscript.
Funding
This work was supported by a grant from the National Institute of Fisheries Science, South Korea (NIFS; R2019021, R2020023, and R2021029).
Conflict of Interest
The authors declare that the research was conducted in the absence of any commercial or financial relationships that could be construed as a potential conflict of interest.
Publisher’s Note
All claims expressed in this article are solely those of the authors and do not necessarily represent those of their affiliated organizations, or those of the publisher, the editors and the reviewers. Any product that may be evaluated in this article, or claim that may be made by its manufacturer, is not guaranteed or endorsed by the publisher.
Acknowledgments
We thank members of the National Institute of Fisheries Science for organizing to collect Antarctic toothfish samples in the field. We also thank Soo Rin Lee and Gun Wook Baeck for helping to obtain tissues or stomach samples for DNA analysis.
Supplementary Material
The Supplementary Material for this article can be found online at: https://www.frontiersin.org/articles/10.3389/fmars.2021.666417/full#supplementary-material
Supplementary Figure 1 | Genetic diversity levels within the Subareas 58 and 88 in Dissostichus mawsoni. MtDNA COI and 16S (A); microsatellites (B).
Supplementary Figure 2 | Normal L-shaped curve of the distribution of a proportion of alleles in different allelic frequency classes in entire Dissostichus mawsoni population.
Supplementary Figure 3 | Genetic clusters after Delta K Evanno’s correction in results of STRUCTURE analyses. (A) All 15 populations combined: K = 3, mean (| Ln”(K)|) = 421.18, Stdev Ln P(K) = 18.70, Delta K = 22.52; (B) Subareas 58: K = 2, mean (| Ln”(K)|) = 31.37, Stdev Ln P(K) = 3.36, Delta K = 9.33; (C) Subareas 88: K = 3, mean (| Ln”(K)|) = 170.25, Stdev Ln P(K) = 10.21, Delta K = 16.68.
Supplementary Figure 4 | Population structure based on a Bayesian population assignment separately for the Subareas 58 and 88 of Dissostichus mawsoni in the Antarctic Ocean using seven microsatellite loci. Each individual is represented along the X-axis, and the Y-axis denotes the probability of that individual belonging to each of the genetic clusters. (A) Analyses of population structure only for five populations from the Subareas 58. The most likely number of genetic clusters after Delta K Evanno’s correction corresponds to K = 2 (Supplementary Figure 3B). (B) Analyses of population structure for ten populations from the Subareas 88. The most likely number of genetic clusters after Delta K Evanno’s correction corresponds to K = 3 (Supplementary Figure 3C).
Supplementary Figure 5 | Results of factorial correspondence analysis (FCA) showing multivariate relationships for each of the Subareas 58 and 88 of Dissostichus mawsoni based on seven microsatellite allelic variation. (A) Analyses of FCA for five populations from the Subareas 58. (B) Analyses of FCA for ten populations from the Subareas 88. Different colors of each circle represent different populations.
Supplementary Figure 6 | Population structure based on a Bayesian population assignment between juveniles and adults of Dissostichus mawsoni from the 10 populations (Subareas 88: 88.1 RBI, 88.2 RB1, 88.3 RB1, 88.3 RB3, 88.3 RB4, 88.3 RB5, and 88.3 RB6; Subareas 58: 58.4.1 A, 58.4.2 A, and 58.4.2 E) using seven microsatellite loci. Each individual is represented along the X-axis, and the Y-axis denotes the probability of that individual belonging to each of the genetic clusters. (A) Analyses of population structure for the two groups combined; (B) The most likely number of genetic clusters after Delta K Evanno’s correction corresponds to K = 1.
Supplementary Figure 7 | Mitochondrial and microsatellite phylogenetic relationships of Dissostichus mawsoni from CCAMLR. The phylogenetic trees were constructed from mtDNA COI and 16S haplotypes based on a maximum parsimony (MP) method including two Subareas 58 and 88 (A) and from seven microsatellite loci using the genetic distance (FST) based on neighbor joining (NJ) method (B). Numbers at branches indicate the bootstrap values MP and NJ, respectively. Hap1, 2, 3, 6, 8, 9 represent shared haplotypes between Subareas 58 and 88 (A).
Supplementary Table 1 | Comparisons of genetic diversity indices between juveniles and adults of Dissostichus mawsoni from 10 populations (Subareas 88: 88.1 RBI, 88.2 RB1, 88.3 RB1, 88.3 RB3, 88.3 RB4, 88.3 RB5, and 88.3 RB6; Subareas 58: 58.4.1 A, 58.4.2 A, and 58.4.2 E) at mtDNA (COI and 16S) and seven microsatellite loci. N: number of samples analyzed, NH: number of haplotypes, h: haplotype diversity, π: nucleotide diversity, NA: observed mean number of alleles across seven loci, NE: effective population size, PA: number of private alleles, HE: expected heterozygosity, HO: observed heterozygosity, FIS: inbreeding coefficient, HWE: P values for multilocus tests for Hardy-Weinberg Equilibrium.
Supplementary Table 2 | Pairwise genetic differentiation (FST) based on mtDNA COI and 16S sequences (below diagonal) and seven microsatellites loci genotypes (above diagonal) between juveniles and adults of Dissostichus mawsoni from 10 populations (Subareas 88: 88.1 RBI, 88.2 RB1, 88.3 RB1, 88.3 RB3, 88.3 RB4, 88.3 RB5, and 88.3 RB6; Subareas 58: 58.4.1 A, 58.4.2 A, and 58.4.2 E). Sampling localities and sample sizes of the 10 populations for juveniles and adults are given as in Supplementary Table 1. Significant pairwise FST and P values are bolded (P < 0.05).
Supplementary Table 3 | Distribution of forty haplotypes (COI: 14, 16S: 28) found in 392 individuals of Dissostichus mawsoni collected from the 20 research blocks in two CCAMLR Subareas (Subareas 58 and 88).
Supplementary Table 4 | Raw dataset of genotypes scored at seven microsatellite loci in Dissostichus mawsoni.
Footnotes
References
Allcock, A. L., and Strugnell, J. M. (2012). Southern ocean diversity: new paradigms from molecular ecology. Trends Ecol. Evol. 27, 520–528. doi: 10.1016/j.tree.2012.05.009
Avise, J. C. (2012). Molecular Markers, Natural History and Evolution. Berlin: Springer Science & Business Media.
Avise, J. C., Bowen, B. W., Lamb, T., Meylan, A. B., and Bermingham, E. (1992). Mitochondrial DNA evolution at a turtle’s pace: evidence for low genetic variability and reduced microevolutionary rate in the testudines. Mol. Biol. Evol. 9, 457–473.
Bargelloni, L., Marcato, S., Zane, L., and Patarnello, T. (2000). Mitochondrial phylogeny of notothenioids: a molecular approach to Antarctic fish evolution and biogeography. Syst. Biol. 49, 114–129. doi: 10.1080/10635150050207429
Bargelloni, L., Ritchie, P. A., Patarnello, T., Battaglia, B., Lambert, D. M., and Meyer, A. (1994). Molecular evolution at subzero temperatures: mitochondrial and nuclear phylogenies of fishes from Antarctica (suborder Notothenioidei), and the evolution of antifreeze glycopeptides. Mol. Biol. Evol. 11, 854–863.
Belkhir, K., Borsa, P., Chiki, L., Raufaste, N., and Bonhomme, F. (2004). 4.05, logiciel sous Windows TM pour la Génétique des Populations. CNRS UMR 5000. Montpellier: Université de Montpellier II.
Bohonak, A. J. (1999). Dispersal, gene flow, and population structure. Q. Rev. Biol. 74, 21–45. doi: 10.1086/392950
Bouckaert, R., Heled, J., Kühnert, D., Vaughan, T., Wu, C.-H., Xie, D., et al. (2014). BEAST 2: a software platform for Bayesian evolutionary analysis. PLoS Comput. Biol. 10:e1003537. doi: 10.1371/journal.pcbi.1003537
CCAMLR-Secretariat (2017). Long-distance Movements of Patagonian (Dissostichus eleginoides) and Antarctic Toothfish (D. mawsoni) from Fishery-based Mark-recapture Data. Hobart, TAN: CCAMLR. CCAMLR Doc. WG-FSA- 1706.
Choi, H.-k., Jang, J. E., Byeon, S. Y., Chung, S., Choi, S.-G., Kim, H.-W., et al. (2019). Population Structure of the Antarctic Toothfish, Dissostichus mawsoni from the Subareas 58 and 88 in the Antarctic Ocean Based on Mitochondrial and Microsatellite DNA Markers. Hobart, TAN: CCAMLR. CCAMLR Doc. WG-FSA-2019/36.
Do, C., Waples, R. S., Peel, D., Macbeth, G., Tillett, B. J., and Ovenden, J. R. (2014). NeEstimator v2: re-implementation of software for the estimation of contemporary effective population size (Ne) from genetic data. Mol. Ecol. Resour. 14, 209–214. doi: 10.1111/1755-0998.12157
Earl, D. A., and vonHoldt, B. (2012). Structure harvester: a website and program for visualizing structure output and implementing the Evanno method. Conserv. Genet. Resour. 4, 359–361. doi: 10.1007/s12686-011-9548-7
Everson, I. (2017). Designation and management of large-scale MPAs drawing on the experiences of CCAMLR. Fish Fish. 18, 145–159. doi: 10.1111/faf.12137
Excoffier, L., and Lischer, H. E. (2010). Arlequin suite ver 3.5: a new series of programs to perform population genetics analyses under Linux and Windows. Mol. Ecol. Resour. 10, 564–567. doi: 10.1111/j.1755-0998.2010.02847.x
Faurby, S., and Barber, P. H. (2012). Theoretical limits to the correlation between pelagic larval duration and population genetic structure. Mol. Ecol. 21, 3419–3432. doi: 10.1111/j.1365-294x.2012.05609.x
Fontaine, M. C., Baird, S. J., Piry, S., Ray, N., Tolley, K. A., Duke, S., et al. (2007). Rise of oceanographic barriers in continuous populations of a cetacean: the genetic structure of harbour porpoises in Old World waters. BMC Biol. 5:30. doi: 10.1186/1741-7007-5-30
Fu, Y.-X. (1997). Statistical tests of neutrality of mutations against population growth, hitchhiking and background selection. Genetics 147, 915–925. doi: 10.1093/genetics/147.2.915
Garcia, K. K., Touma, J., Bravo, S., Leiva, F., Vargas-Chacoff, L., Valenzuela, A., et al. (2019). Novel microsatellite markers discovery in Patagonian toothfish (Dissostichus eleginoides) using high-throughput sequencing. Mol. Biol. Rep. 46, 5525–5530. doi: 10.1007/s11033-019-04912-6
Goudet, J. (2001). FSTAT, a Program to Estimate and Test Gene Diversities and Fixation Indices, Version 2.9.3. Available online at: http://www2.unil.ch/popgen/softwares/fstat.htm.
Hall, T. A. (1999). BioEdit: a user-friendly biological sequence alignment editor and analysis program for Windows 95/98/NT. Nucleic Acids Symp. Ser. 41, 95–98.
Hanchet, S., Dunn, A., Parker, S., Horn, P., Stevens, D., and Mormede, S. (2015). The Antarctic toothfish (Dissostichus mawsoni): biology, ecology, and life history in the Ross Sea region. Hydrobiologia 761, 397–414. doi: 10.1007/s10750-015-2435-6
Hanchet, S., Rickard, G., Fenaughty, J., Dunn, A., and Williams, M. (2008). A hypothetical life cycle for Antarctic toothfish (Dissostichus mawsoni) in the Ross Sea region. CCAMLR Sci. 15, 35–53.
Hartl, D. L., and Clark, A. G. (2007). Principles of Population Genetics. Sunderland, MA: Sinauer Associates.
Hedgecock, D. (1994). Does variance in reproductive success limit effective population sizes of marine organisms. Genet. Evol. Aquatic Organ. 122, 122–134.
Janko, K., Lecointre, G., DeVries, A., Couloux, A., Cruaud, C., and Marshall, C. (2007). Did glacial advances during the Pleistocene influence differently the demographic histories of benthic and pelagic Antarctic shelf fishes?–Inferences from intraspecific mitochondrial and nuclear DNA sequence diversity. BMC Evol. Biol. 7:220. doi: 10.1186/1471-2148-7-220
Kuhn, K. L., and Gaffney, P. M. (2008). Population subdivision in the Antarctic toothfish (Dissostichus mawsoni) revealed by mitochondrial and nuclear single nucleotide polymorphisms (SNPs). Antarct. Sci. 20:327. doi: 10.1017/s0954102008000965
Lanfear, R., Hua, X., and Warren, D. L. (2016). Estimating the effective sample size of tree topologies from Bayesian phylogenetic analyses. Genome Biol. Evol. 8, 2319–2332. doi: 10.1093/gbe/evw171
Larkin, M. A., Blackshields, G., Brown, N. P., Chenna, R., McGettigan, P. A., McWilliam, H., et al. (2007). Clustal W and Clustal X version 2.0. Bioinformatics 23, 2947–2948. doi: 10.1093/bioinformatics/btm404
Latch, E. K., Dharmarajan, G., Glaubitz, J. C., and Rhodes, O. E. (2006). Relative performance of Bayesian clustering software for inferring population substructure and individual assignment at low levels of population differentiation. Conserv. Genet. 7, 295–302. doi: 10.1007/s10592-005-9098-1
Le Cam, B., Sargent, D., Gouzy, J., Amselem, J., Bellanger, M.-N., Bouchez, O., et al. (2019). Population genome sequencing of the scab fungal species Venturia inaequalis, Venturia pirina, Venturia aucupariae and Venturia asperata. G3: Genes Genomes Genetics 9, 2405–2414. doi: 10.1534/g3.119.400047
Lee, H. J., and Boulding, E. G. (2007). Mitochondrial DNA variation in space and time in the northeastern Pacific gastropod. Littorina keenae. Mol. Ecol. 16, 3084–3103. doi: 10.1111/j.1365-294x.2007.03364.x
Lee, H. J., and Boulding, E. G. (2009). Spatial and temporal population genetic structure of four northeastern Pacific littorinid gastropods: the effect of mode of larval development on variation at one mitochondrial and two nuclear DNA markers. Mol. Ecol. 18, 2165–2184. doi: 10.1111/j.1365-294x.2009.04169.x
Luikart, G., Allendorf, F., Cornuet, J., and Sherwin, W. (1998). Distortion of allele frequency distributions provides a test for recent population bottlenecks. J. Hered. 89, 238–247. doi: 10.1093/jhered/89.3.238
Maier, E., Tollrian, R., Rinkevich, B., and Nürnberger, B. (2005). Isolation by distance in the scleractinian coral Seriatopora hystrix from the Red Sea. Mar. Biol. 147, 1109–1120. doi: 10.1007/s00227-005-0013-6
Manel, S., Guerin, P.-E., Mouillot, D., Blanchet, S., Velez, L., Albouy, C., et al. (2020). Global determinants of freshwater and marine fish genetic diversity. Nat. Commun. 11:692.
Maschette, D., Wotherspoon, S., Polanowski, A., Deagle, B., Welsford, D., and Ziegler, P. (2019). Stock Connectivity of Antarctic Toothfish. Hobart, TAN: CCAMLR. CCAMLR Doc. WG-FSA-2019/P01.
Moore, W. S. (1995). Inferring phylogenies from mtDNA variation: mitochondrial-gene trees versus nuclear-gene trees. Evolution 49, 718–726. doi: 10.2307/2410325
Mugue, N., Petrov, A., Zelenina, D., Gordeev, I., and Sergeev, A. (2014). Low genetic diversity and temporal stability in the Antarctic toothfish (Dissostichus mawsoni) from near-continental seas of Antarctica. CCAMLR Sci. 21, 1–9.
Near, T. J., Russo, S. E., Jones, C. D., and DeVries, A. L. (2003). Ontogenetic shift in buoyancy and habitat in the Antarctic toothfish, Dissostichus mawsoni (Perciformes: Nototheniidae). Polar Biol. 26, 124–128. doi: 10.1007/s00300-002-0459-457
Oppold, A.-M., Pedrosa, J. A., Bálint, M., Diogo, J. B., Ilkova, J., Pestana, J. L., et al. (2016). Support for the evolutionary speed hypothesis from intraspecific population genetic data in the non-biting midge Chironomus riparius. Proc. R. Soc. Biol. Sci. 283:20152413. doi: 10.1098/rspb.2015.2413
Orsi, A. H., Whitworth, T. III, and Nowlin, W. D. Jr. (1995). On the meridional extent and fronts of the Antarctic Circumpolar Current. Deep Sea Res. Part I: Oceanographic Res. Papers 42, 641–673. doi: 10.1016/0967-0637(95)00021-w
Parker, R. W., Paige, K. N., and DeVries, A. L. (2002). Genetic variation among populations of the Antarctic toothfish: evolutionary insights and implications for conservation. Polar Biol. 25, 256–261. doi: 10.1007/s00300-001-0333-z
Peakall, R., and Smouse, P. E. (2006). GENALEX 6: genetic analysis in excel. population genetic software for teaching and research. Mol. Ecol. Notes 6, 288–295. doi: 10.1111/j.1471-8286.2005.01155.x
Petit, R. J., El Mousadik, A., and Pons, O. (1998). Identifying populations for conservation on the basis of genetic markers. Conserv. Biol. 12, 844–855. doi: 10.1046/j.1523-1739.1998.96489.x
Piry, S., Luikart, G., and Cornuet, J.-M. (1999). BOTTLENECK: a program for detecting recent effective population size reductions from allele data frequencies. J. Hered. 90, 502–503. doi: 10.1093/jhered/90.4.502
Pritchard, J. K., Stephens, M., and Donnelly, P. (2000). Inference of population structure using multilocus genotype data. Genetics 155, 945–959. doi: 10.1093/genetics/155.2.945
Raymond, M. (1995). Population genetics software for exact test and ecumenicism. J. Hered. 86, 248–249. doi: 10.1093/oxfordjournals.jhered.a111573
Richter, C., Park, J.-W., and Ames, B. N. (1988). Normal oxidative damage to mitochondrial and nuclear DNA is extensive. Proc. Natl. Acad. Sci. U.S.A. 85, 6465–6467. doi: 10.1073/pnas.85.17.6465
Rogers, A., Morley, S., Fitzcharles, E., Jarvis, K., and Belchier, M. (2006). Genetic structure of Patagonian toothfish (Dissostichus eleginoides) populations on the Patagonian Shelf and Atlantic and western Indian Ocean Sectors of the Southern Ocean. Mar. Biol. 149, 915–924. doi: 10.1007/s00227-006-0256-x
Rogers, A. R., and Harpending, H. (1992). Population growth makes waves in the distribution of pairwise genetic differences. Mol. Biol. Evol. 9, 552–569.
Rousset, F. (2008). genepop’007: a complete re-implementation of the genepop software for Windows and Linux. Mol. Ecol. Resour. 8, 103–106. doi: 10.1111/j.1471-8286.2007.01931.x
Shaw, P., Arkhipkin, A., and Al-Khairulla, H. (2004). Genetic structuring of Patagonian toothfish populations in the Southwest Atlantic Ocean: the effect of the Antarctic Polar Front and deep-water troughs as barriers to genetic exchange. Mol. Ecol. 13, 3293–3303. doi: 10.1111/j.1365-294x.2004.02327.x
Smith, P., and Gaffney, P. (2005). Low genetic diversity in the Antarctic toothfish (Dissostichus mawsoni) observed with mitochondrial and intron DNA markers. CCAMLR Sci. 12, 43–51.
Tajima, F. (1989). Statistical method for testing the neutral mutation hypothesis by DNA polymorphism. Genetics 123, 585–595. doi: 10.1093/genetics/123.3.585
Takezaki, N., Nei, M., and Tamura, K. (2010). POPTREE2: software for constructing population trees from allele frequency data and computing other population statistics with Windows interface. Mol. Biol. Evol. 27, 747–752. doi: 10.1093/molbev/msp312
Tamura, K., Stecher, G., Peterson, D., Filipski, A., and Kumar, S. (2013). MEGA6: molecular evolutionary genetics analysis version 6.0. Mol. Biol. Evol. 30, 2725–2729. doi: 10.1093/molbev/mst197
Teacher, A., and Griffiths, D. (2011). HapStar: automated haplotype network layout and visualization. Mol. Ecol. Resour. 11, 151–153. doi: 10.1111/j.1755-0998.2010.02890.x
Weir, B. S., and Cockerham, C. C. (1984). Estimating F-statistics for the analysis of population structure. Evolution 38, 1358–1370. doi: 10.1111/j.1558-5646.1984.tb05657.x
Yoon, T.-H., Kang, H.-E., Lee, S. R., Lee, J.-B., Baeck, G. W., Park, H., et al. (2017). Metabarcoding analysis of the stomach contents of the Antarctic Toothfish (Dissostichus mawsoni) collected in the Antarctic Ocean. PeerJ 5:e3977. doi: 10.7717/peerj.3977
Keywords: Antarctic toothfish, CCAMLR, fishery management, genetic diversity, population connectivity, contemporary gene flow, genetic stock, phylogeographic break
Citation: Choi H-k, Jang JE, Byeon SY, Kim YR, Maschette D, Chung S, Choi S-G, Kim H-W and Lee HJ (2021) Genetic Diversity and Population Structure of the Antarctic Toothfish, Dissostichus mawsoni, Using Mitochondrial and Microsatellite DNA Markers. Front. Mar. Sci. 8:666417. doi: 10.3389/fmars.2021.666417
Received: 11 February 2021; Accepted: 12 July 2021;
Published: 02 August 2021.
Edited by:
Shaili Johri, Stanford University, United StatesReviewed by:
Shang Yin Vanson Liu, National Sun Yat-sen University, TaiwanGustavo Sanchez, Hiroshima University, Japan
Yue Shi, University of Alaska Fairbanks, United States
Copyright © 2021 Choi, Jang, Byeon, Kim, Maschette, Chung, Choi, Kim and Lee. This is an open-access article distributed under the terms of the Creative Commons Attribution License (CC BY). The use, distribution or reproduction in other forums is permitted, provided the original author(s) and the copyright owner(s) are credited and that the original publication in this journal is cited, in accordance with accepted academic practice. No use, distribution or reproduction is permitted which does not comply with these terms.
*Correspondence: Hyuk Je Lee, aHl1a2plbGVlQHNhbmdqaS5hYy5rcg==