 Kirstie Jones-Williams
 Tamara S. Galloway2
 Victoria L. Peck
 Clara Manno
- 1British Antarctic Survey, Cambridge, United Kingdom
- 2College of Life and Environmental Sciences, University of Exeter, Exeter, United Kingdom
As the remote Canadian Arctic Archipelago (CAA) becomes increasingly connected to the rest of the world, there is an impetus to monitor the possible impact of this connectivity. The potential for increases in localised sources of plastic pollution resulting from the increasing navigability of the remote north has yet to be explored. Here we investigate microplastic samples which were collected aboard the Canadian Coast Guard Ship (CCGS) Amundsen in the summer of 2018 using the underway pump and a filtration system with Fourier transform infrared analysis. We investigate the character, abundance, and distribution of microplastic particles and fibres in the sub-surface waters across the Canadian Arctic and add to the limited dataset on plastic pollution in this region. We find that there are low concentrations of microplastics ranging from 0 to 0.282 n L–1 (average 0.031 ± 0.017 n L–1), comprising 71% polyester and acrylics. We investigate the size distribution of retained particles and fibres on three different filter mesh sizes connected to the underway pump (300, 100, and 50 μm) and find that a 300 μm mesh and a 100 μm mesh retain only 6 and 56%, respectively, of the total particles and fibres. We explore the role of shipping as a potential source of textile fibres and we suggest that future monitoring of plastics in the Canadian Arctic should use the current shipping fleet to monitor its own plastic footprint, utilising the underway pump and mesh sizes < 100 μm.
Introduction
The Canadian Arctic Archipelago (CAA) connects the Pacific and Atlantic Ocean, transporting waters eastwards from the Beaufort Sea toward Baffin Bay. Nunavut territory, spanning much of the CAA (Statistics Canada, 2020) is one of the most remote settled regions in the world, with a population density of 0.02 persons/km2. Despite this remoteness, the CAA has seen shipping traffic increase in recent years as sea ice loss increases and opens up previously unnavigable routes (Dawson et al., 2018). The consequences of rapidly increasing connectivity to the rest of the world demands careful monitoring and as part of the Ocean Plastic Charter in 2018, the Canadian Government called for increased research into the impacts of plastics on marine health in the Arctic.
Plastics are a dynamic pollutant in the environment, with their size, shape and chemical composition altering with time (GESAMP, 2015). The most bioavailable forms of plastic pollution are those comparable in size to food fed on by organisms at the base of the marine food chain (Cole et al., 2013; Law and Thompson, 2014). These so-called microplastics, here defined as those plastic particles and fibres sized between 1 and 5,000 μm (Thompson et al., 2004) have been found ubiquitously in the world’s oceans (Cózar et al., 2014), with the potential to threaten marine ecosystems (Galloway et al., 2017).
To date, much of the research into plastic pollution in the CAA has focused on plastic ingested by seabirds (Amélineau et al., 2016; Poon et al., 2017; Avery-Gomm et al., 2018; Baak et al., 2020), however, two recent publications (Huntington et al., 2020; Ross et al., 2021) examine microplastic pollution in relation to the lower trophic levels of the CAA and in the sub-surface waters, respectively. Huntington et al. (2020), specifically focused on the CAA investigating microplastics in different matrices, finding that 90% of both surface water samples and zooplankton contained microplastics, averaging 0.07 ± 0.08 particles/L. Similarly, as part of a pan-Arctic investigation, Ross et al. (2021), found that average concentrations in the CAA were 0.021 ± 0.005 particles/L. Prevailing winds and ocean currents have been hypothesised as a means for bringing high concentrations of microplastics from more populated areas to the remote north (Obbard et al., 2014; Onink et al., 2019; Bergmann et al., 2019). Nevertheless, the increasing navigability of the remote north (Dawson et al., 2018), also poses a risk of more localised sources of plastic pollution from increased shipping traffic. Establishing a baseline for the concentration distribution of microplastic within the CAA is a critical first step to establishing ongoing monitoring of the possible pathways and uptake of microplastic pollution in this region.
To establish the prevalence of microplastics in the CAA, we aimed to provide a comparable dataset of microplastic character, abundance and distribution in sub-surface waters. We consider the combined influence of surface environmental parameters (ice, currents, temperature, salinity) with human influence, by sampling along major shipping routes from Baffin Bay, through the High Arctic and the Kitikmeot region of the CAA. In doing so, we offer insight into the possibility of shipping as a local source of pollution but also as a cost-effective means to monitor plastics by utilising the underway pump and filtration system.
Methods
Sampling Region and Environmental Parameters
For the purposes of this study, the CAA has been classified into three regions; the High Arctic, Kitikmeot and Baffin Bay (Figure 1A). The High Arctic is typified by the deep (∼700 m) ice-dominated waters of Victoria Strait, Peel Sound and Lancaster Sound, transporting waters from the Arctic Ocean into the Atlantic Ocean (Melling et al., 2001). The Kitikmeot is defined by the complex, slow running and shallow (<100 m) waterways of the CAA, bounded in the south by the coastal mainland, and centred at Queen Maud Gulf. The Kitikmeot has seasonal ice, and was ice-free during the late summer sampling period (August–September, 2018). Baffin Bay is the largest region, comprising the whole of the Eastern Canadian Arctic (Bouchard et al., 2018). At the northernmost edge, just south of the Nares Strait, waters are influenced by the warmer Atlantic current (Figure 1B), which has in part, been brought via the weak West Greenland Current (Münchow et al., 2015). In contrast, samples taken in the southern portion of Baffin Bay are coastal to Baffin Island, receiving waters from the stronger northerly Arctic current (Münchow et al., 2015).
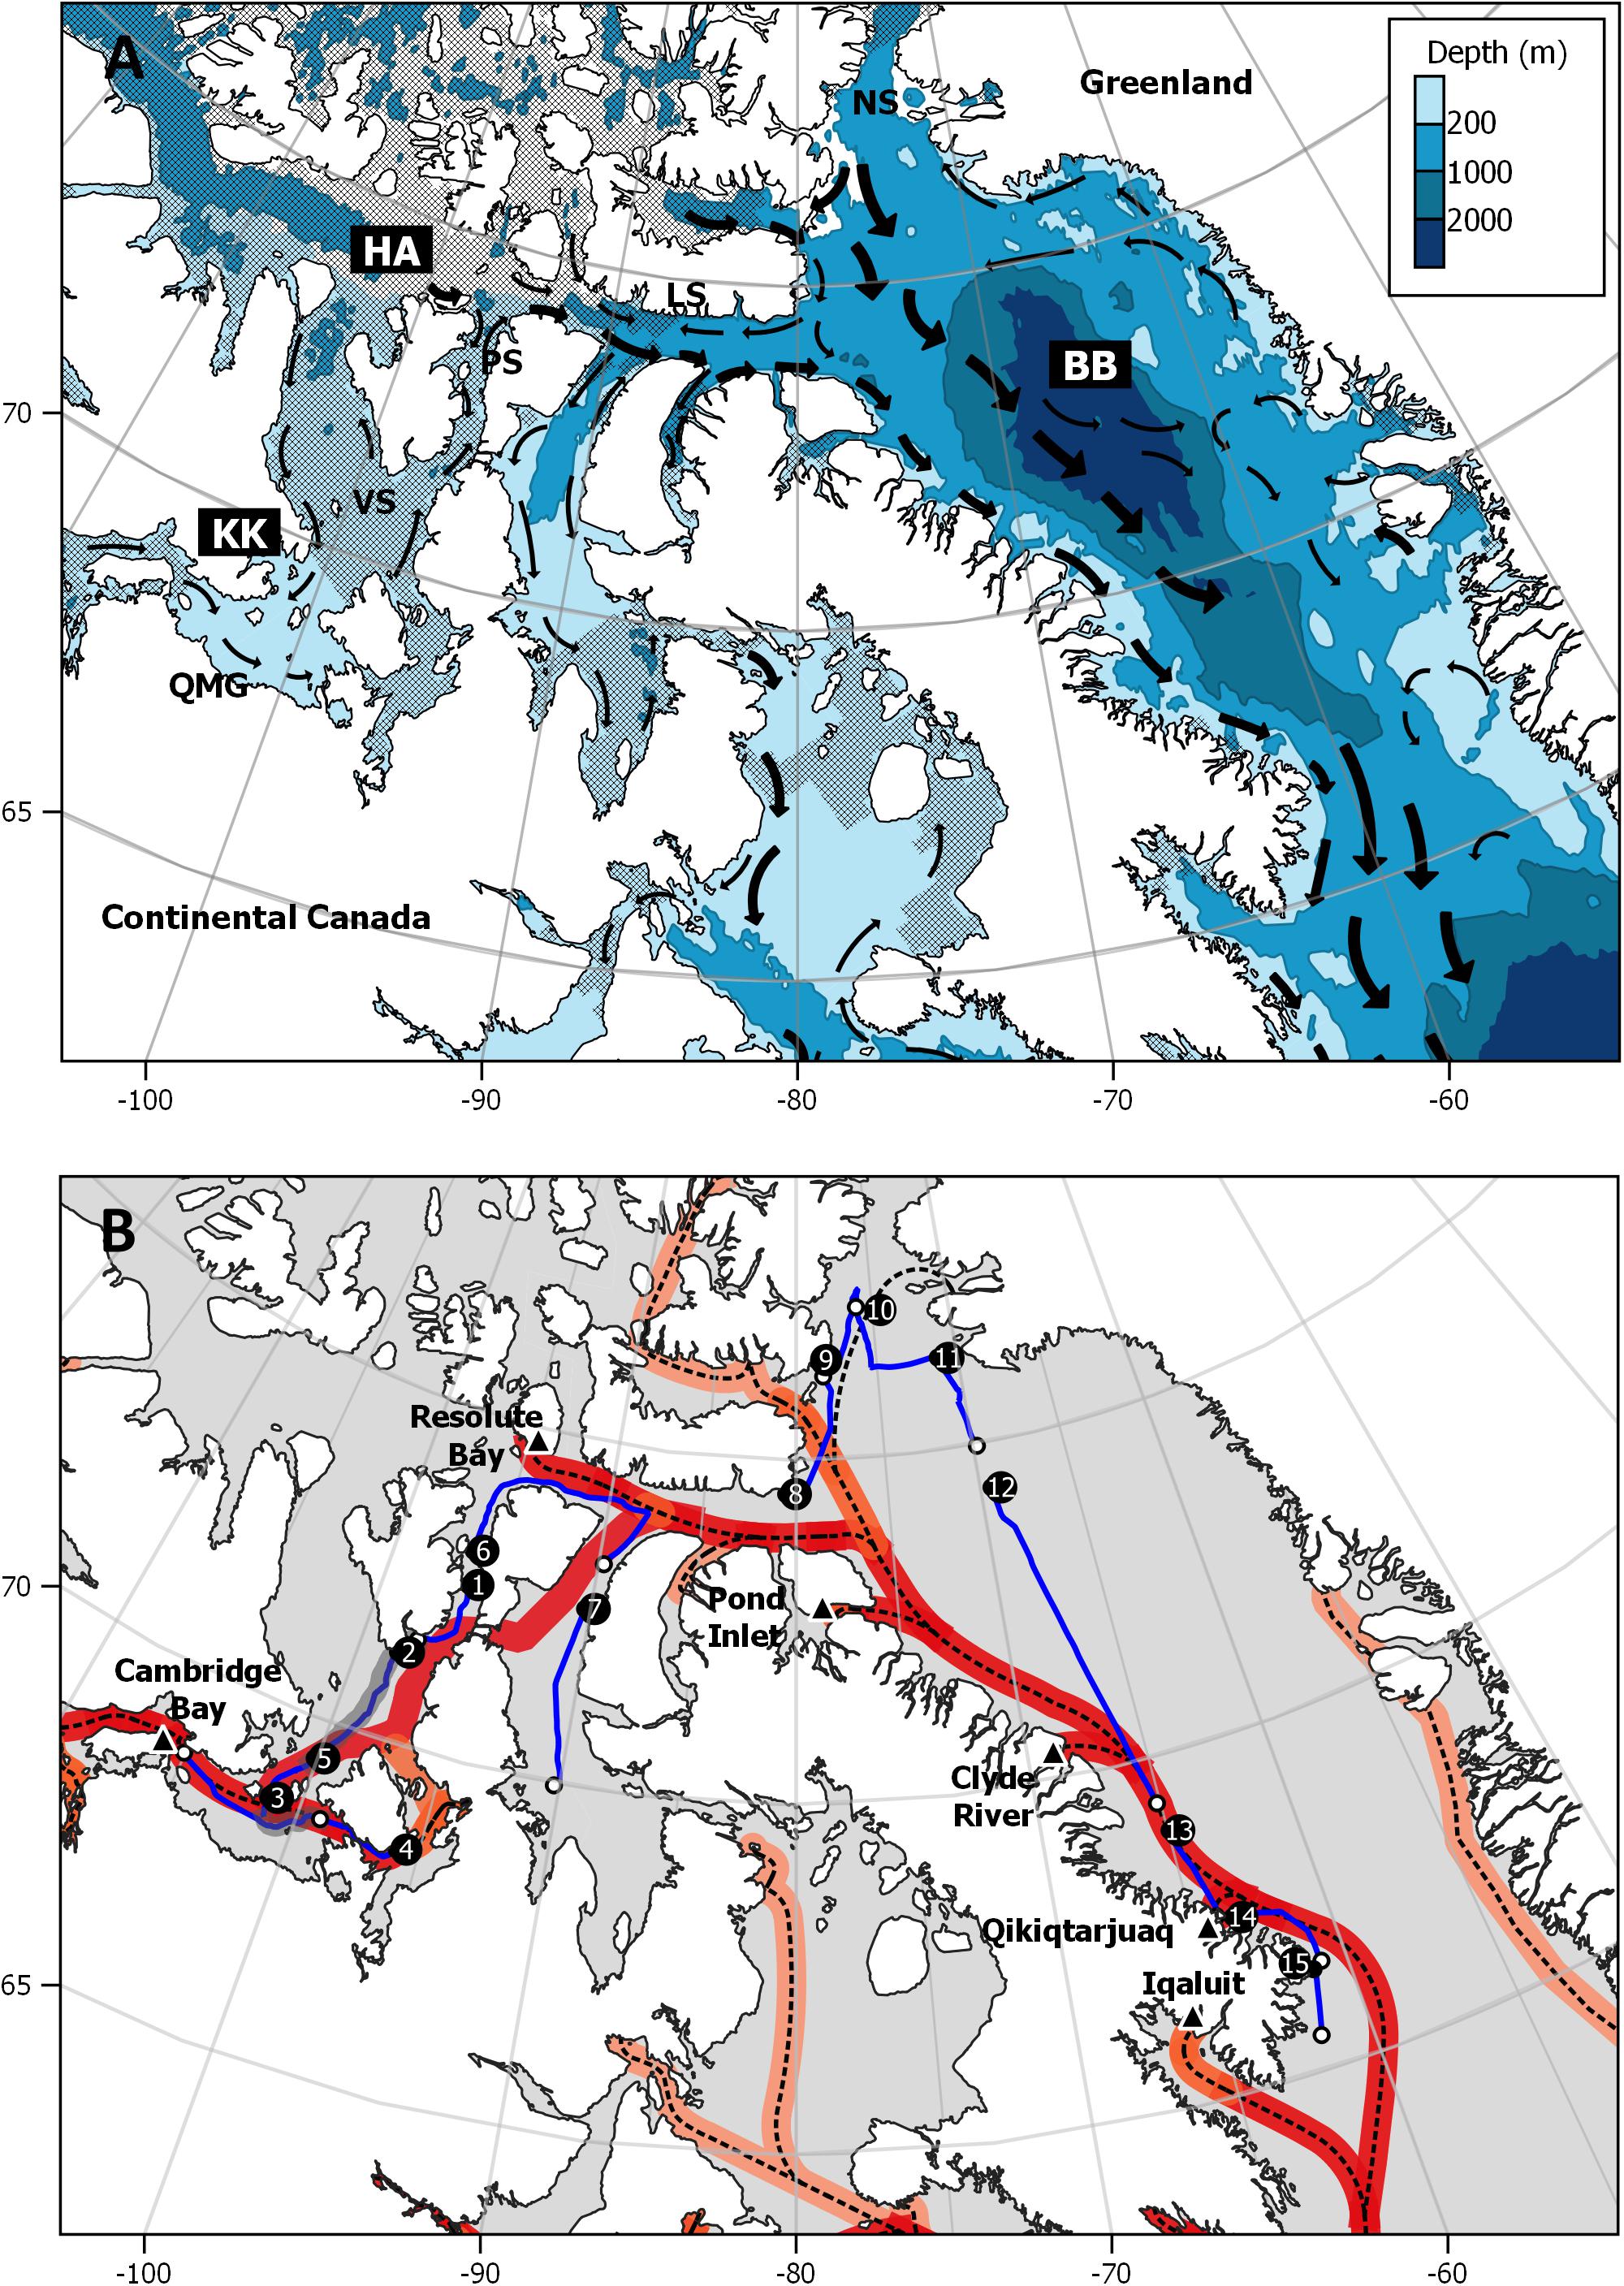
Figure 1. (A) Study area with three major regions highlighted in bold (HA, High Arctic; KK, Kitikmeot; BB, Baffin Bay). Descriptor locations include (PS: Peel Sound; VS, Victoria Strait; LS, Lancaster Sound; QMG, Queen Maud Gulf, and NS, Nares Strait). Crosshatching indicates sea ice extent for August 2018, downloaded from the National Snow and Ice Data Centre archives (nsidc.org/data/seaice_index/archives). Surface current (black arrows) display direction and strength (fair, medium, and strong) with larger arrows indicating stronger currents (Environment Canada, 2015). (B) Sampling transect with start of transect indicated by transect number and end (white marker). Major shipping routes (dashed line) with areas of increased shipping intensity (red) between 1990 and 2015, adapted from Dawson et al. (2018). Settlements with major ports in the NUNAVUT are indicated (triangular markers). Maps generated using QGIS 3.10.4.
Surface environmental parameters (temperature and salinity) were measured along transect using a thermosalinograph (Supplementary Material 2: tsg). Surface currents have been categorised into fair, medium and strong based (Environment Canada, 2015) and assigned numerical values for the purposes of statistical analysis (1, 2, and 3, respectively) (Supplementary Material 1: Table 3). Sea ice extent for August 20181 was transformed into binary data to simplify the potential ice influence along each transect (1 = ice present along transect, 0 = ice absent along transect). Approximate depths for each transect are reported, based on CTD report depths at associated stations during the cruise (Supplementary Material 1: Table 2).
A report by Dawson et al. (2018), details shipping traffic intensity for the Canadian Arctic between the years 1990–2015, excluding West Greenland. Increased shipping activity in the last 30 years is mostly associated with cargo to and from active mine sites along Baffin Island and increased transits through the Kitikmeot (Dawson et al., 2018; Figure 1A). Traffic data from West Greenland was not publically available, however, a main route exists along West Greenland (Figure 1), servicing ports and oil platforms in east Baffin Bay.
Sampling Protocol and Processing
Shipboard Sampling
Microplastics were collected using the non-contaminated seawater inlet (underway pump) at 7 m below the sea surface in the hull of the Canadian Coast Guard Ship (CCGS) Amundsen, during leg3b of Arctic Net 2018 (August–September). Underway sampling of non-contaminated seawater such as this, has previously been used to determine microplastic concentrations in sub-surface waters of the Arctic (Lusher et al., 2015; Rist et al., 2020; Ross et al., 2021). Here, we make a series of modifications to investigate sample retention, and minimise airborne contamination, whilst simultaneously reducing sampler effort and maximising reproducibility (full details provided in Supplementary Material 1: section “Detailed Ship-Board Sampling”). Briefly, we directed the flow of water through three nylon filters of decreasing pore size (300, 100, 50 μm). We aimed to optimise the retention of all particle sizes and used individual filters for each transect to prevent sample loss during cleaning or cross contamination between sampling transects. At the start of each transect a polycarbonate tube was connected to the system to run continuously either until the water in the finest filter (50 μm) became saturated with particulate matter, evidenced by the discolouration of the filter, or by any fatiguing of the filter which may suggest retention of water in the module. Mili-Q water was used to rinse and concentrate any residual particulate onto each respective filter. The filters were removed and handled carefully with nitrile gloves, and folding together in half. These were then sealed individually in aluminium foil and each transect in sample bags and frozen at −20°C; a quick process which limited exposure to airborne contamination.
Sample Preparation
There was no organic material retained on the 300 μm filter, indicating that no additional preparation of these samples was required prior to analysis. However, small amounts of phytoplankton was found on the two smaller filters (100 and 50 μm). Organic material on the finer filters are problematic for infrared analysis which requires a clean surface for polymer identification. Individual filters were placed in a 100 ml glass bottle with a 1.5% of sodium dodecylsulphate (SDS) solution to dissociate the organic material adhered to the surface of the plastics and prevent additional coagulation during the settling phase. The bottles were sonicated for 2 min (23 KHz) and any residual matter rinsed off the filter with Mili-Q, with the sample bottle of putative plastics and adhered organic matter subsequently placed in a water bath at 60°C to settle for 5 days. Each sample was decanted onto a silver filter (Sterlitech 5 μm, 47 mm silver filters) via vacuum filter, with Mili-Q water used to clean the sample of SDS and ensure the removal of all particulate from each beaker. For the 300 μm filter, particles and fibres were picked and placed onto clean silver filters in a glass petri dish for plastic polymer identification.
Sample Analysis
Optical Sorting of Putative Plastics
Identification of putative plastics was based on the workflow detailed in Jones-Williams et al. (2020). Briefly, this entailed preliminary optical investigations using a compound light microscope to classify each putative plastic based on their colour and shape. Only two distinct shapes were identified, and subsequently categroised as per Huntington et al. (2020); irregular particles (herein particles) and fibres. Particles and fibres were determined to be putative plastics if these classifications indicated synthetic origin such as lacking a cellular structure, (c.f Hidalgo-Ruz et al., 2012). Counts and colours were observed under an optical microscope, which will limit visual identification down to ∼100 μm. A random sub-sample of particles and fibres (n = 144) were then moved onto a clean silver filter, using tweezers or a pipette of Mili-Q water to suspend the matter in a droplet of water. The latter enabled the fibres to be flattened into a single plane of focus. The filter was dried on a hot plate and dimensions were measured using the camera appended to the Perkin Elmer Spotlight 400 Fourier transform infrared (FTIR) spectrometer prior to each infrared analysis for particles (n = 43) and fibres (n = 101).
Plastic Polymer Identification
The sub-sample of particles and fibres comprising 26.8% of the 537 putative plastics, were analysed using FTIR to determine what proportion were synthetic polymers (Supplementary Material 1: Table 6A). A Perkin Elmer Spotlight 400 spectrometer (MCT detector, KBr window) with the Spectrum software (PerkinElmer version 10.5.4.738) was used for FTIR analysis. The spectrometer was operated in reflectance mode for fibres and particles, whilst a drop-down μFTIR attenuated total reflectance (ATR) needle was used for those particles producing a very weak signal in reflectance mode. A standard resolution of 4 cm–1 was used for each sample, scanning between wavelengths of 4,000 and 600 cm–1. A minimum of 16 scans were collected for each fibre or particle.
Positive polymer identification was obtained through a stepwise process, with each spectra normalised by first derivative before analysis. The in-built spectral libraries were used for guidance rather than as a strict accept/decline match as these libraries, unless bespoke, rarely include relevant weathered particles. Weathering chemically alters the plastic, introducing new bonds associated with oxidation and therefore introducing new spectral peaks and affecting the overall absorption of infrared, particularly in regions where oxygen bonds are found (Pickett, 2018). To the best of the author’s knowledge, it is not currently possible to determine the degree of weathering, or age of a particle as weathering artefacts such as the absorptivity of the bonds, has a non-linear relationship to weathering time (Brandon et al., 2016). For this reason, plastic polymers were positively identified based both on spectral library indications, and a visual examination of the peaks associated with typical polymer functional groups.
Seawater concentrations of microplastics were estimated for each transect by calculating the frequency (n) of microplastic (1–5,000 μm) particles and fibres (herein microfibers) in each sample per litre (n L–1). The frequency of plastics was determined by normalising the total confirmed synthetic polymers from the sub-sample analysed with FTIR and applying this fraction of confirmed plastics to the remaining proportion of particles and fibres which were not analysed with FTIR (Supplementary Material 1: section “Concentration Calculations Using Correction Factors”). In short, microplastic particle concentrations are calculated as above, with microfibre concentrations using an estimated value only, given the application of air contamination correction factors detailed in section “Quality Assurance/Anti-Contamination.” The microfibre concentrations presented here are therefore corrected by subtracting the microfibres from the procedural blank (n = 5) and the amount of fibres isolated for each corresponding air contamination filter (Supplementary Material 1: Table 4). The concentrations for microfibres must therefore be considered as conservative as these correction factors assume that the number of microfibres which had fallen onto the contamination filter are equal to the number of microfibres which contaminated sampled filters, with the same logic applied to the procedural blanks.
Comparison of Putative Plastic Retention Between 300, 100, and 50 μm Mesh Size
With only 6 particles identified as plastic, we determined that a comparison of the concentration of microplastics between the three mesh sizes was not possible. Nevertheless, the on-board size fractionation from using a filter system documents the distribution of putative plastic particles and fibres (n = 537) retained on the different meshes. These were putatively plastic before spectral analysis and are used in this study as a proxy for determining potential microplastic retention across the different mesh sizes.
The percentage retention of putative plastics on each filter (300, 100, and 50 μm mesh size) was calculated by the relative distribution of the particles and fibres (n = 537) across the three filters.
It should be noted that the size of filter mesh corresponds to the open distance between two corners on the same line, and not the diagonal distance or stretched mesh size. It assumes that particulate does not pass through the diagonal plane and that the mesh does not stretch under pressure. Clamping the filters within the sampling system was not shown to stretch the mesh size.
Statistical Analysis
Statistical analyses were carried out using R v4.0.2. All data was tested for normality and homogeneity. Significance was assigned where p < 0.05. Given the small sample size (N < 16), Quantile-Quantile plots were used to test for normality of data, but could be further confirmed quantitatively with Shapiro Wilk test (p < 0.05). Kruskal-Wallis was used to test for significance of difference between concentrations of microplastic particles and microfibres and to test between concentrations between regions. Kendall-Tau’s correlation was used to investigate whether collection parameters (ship speed, flow rate and volume of water sampled) or surface environmental parameters (temperature, salinity, current strength, ice extent) had significant influence on the concentration of microplastics. Groupings of transects into regions (High Arctic, Kitikmeot and Baffin Bay) was confirmed through hierarchical cluster analysis using the Ward method and based on Euclidean distances.
Quality Assurance/Anti-contamination
A series of steps were employed to mitigate, or as a minimum, account for any contamination throughout each stage of the protocol. Firstly, the design of the microplastics collection system (Supplementary Material 1: Methods) meant that each nylon filter was exposed to air for a maximum of 30 s upon setup and termination of each sampling period. The nylon filters were additionally investigated under an optical microscope, and any fibres which may have landed on them when cutting the filters to size were removed with tweezers. They were subsequently stored in aluminium foil and used on board. A wetted polycarbonate filter was placed in a glass petri dish to log any airborne contamination during the handling of the samples on the ship (<60 s) and were seen to be clear of contamination. During these short periods of setup, only one person was present within the laboratory, wearing nitrile gloves and a cotton lab coat. Polyester fleece clothing was not worn in the laboratory during any of these times. All pieces of kit, and handling equipment, including nitrile gloves were rinsed three times with Mili-Q water. Prior to each use, Mili-Q water was used as a procedural blank to mimic the protocol carried out to quantify any background contamination during the processing of the 100 and 50 μm meshes in the laboratory. Three procedural blanks recovered 3, 5, and 7 fibres. The mean, 5 fibres, are therefore subtracted from those all transects where fibres were present on these meshes (n = 16).
In the same way that air contamination was logged on the ship, we monitored airborne particulates and fibres in the laboratory ashore where further contamination may have been introduced during infrared analysis. In the laboratory, samples remained sealed in aluminium foil until needed. During analysis, a wetted polycarbonate filter was placed in a glass petri dish aside the microscope. All glassware was acid washed before use and handling tools were rinsed three times with Mili-Q between each sample. Procedural blanks were carried out at all stages of sampling and analysis. During visual identification of the putative plastics, a scratch was made adjacent to candidates on the silver filter prior to movement onto the FTIR stage, as suggested by David Santillo (personal communication) to prevent possible false positives from airborne contamination.
No fibres or particles were collected on air contamination filters in the laminar flow cabinet. However, daily air contamination filters exposed during infrared analysis collected 1–12 fibres each. A sub-sample of these fibres revealed that 1/3 were cellulose derived (Supplementary Material 1: Table 4B), however, air contamination factors have been calculated assuming that the ambient air pollution has a random composition and taken a precautionary approach, has assumed to be 100% plastic. Factors were therefore calculated by dividing the total number of fibres on each filter, by the number of sample filters measured that day (Supplementary Material 1: section “Concentration Calculations Using Correction Factors” and Tables 4A–C).
Results
Characteristics of Microplastics in the Sub-surface Waters of the Canadian Arctic Archipelago
FTIR analysis of the sub-sample (fibres = 101, particles = 43), indicated that only 23.8% of fibres and 14.0% of particles, were identified as microplastics (Table 1). Scaled up and with correction factors, this equates to 20.8% (112/537) of the total sample being identified as microplastic. Polyester comprised 50% of the microfibres identified, with the remaining comprising polyamide and acrylic. Microfibres ranged in length from 120 to 4,000 μm (Figure 2). Of the six plastic particles, one polyamide particle and two co-polymers were found in transects 4, in the Kitikmeot region. The co-polymers were identified separately as ethylene and polypropylene in conjunction with other monomer peaks (Scott and Penlidis, 2017). Additionally, there were three particles with definitive polymeric spectra and physical characteristics of plastics, found in transects 2 in the High Arctic and in Baffin Bay (Transects 9 and 11), however, these could not be conclusively matched to a library, nor conclusively identified beyond “plastic”.
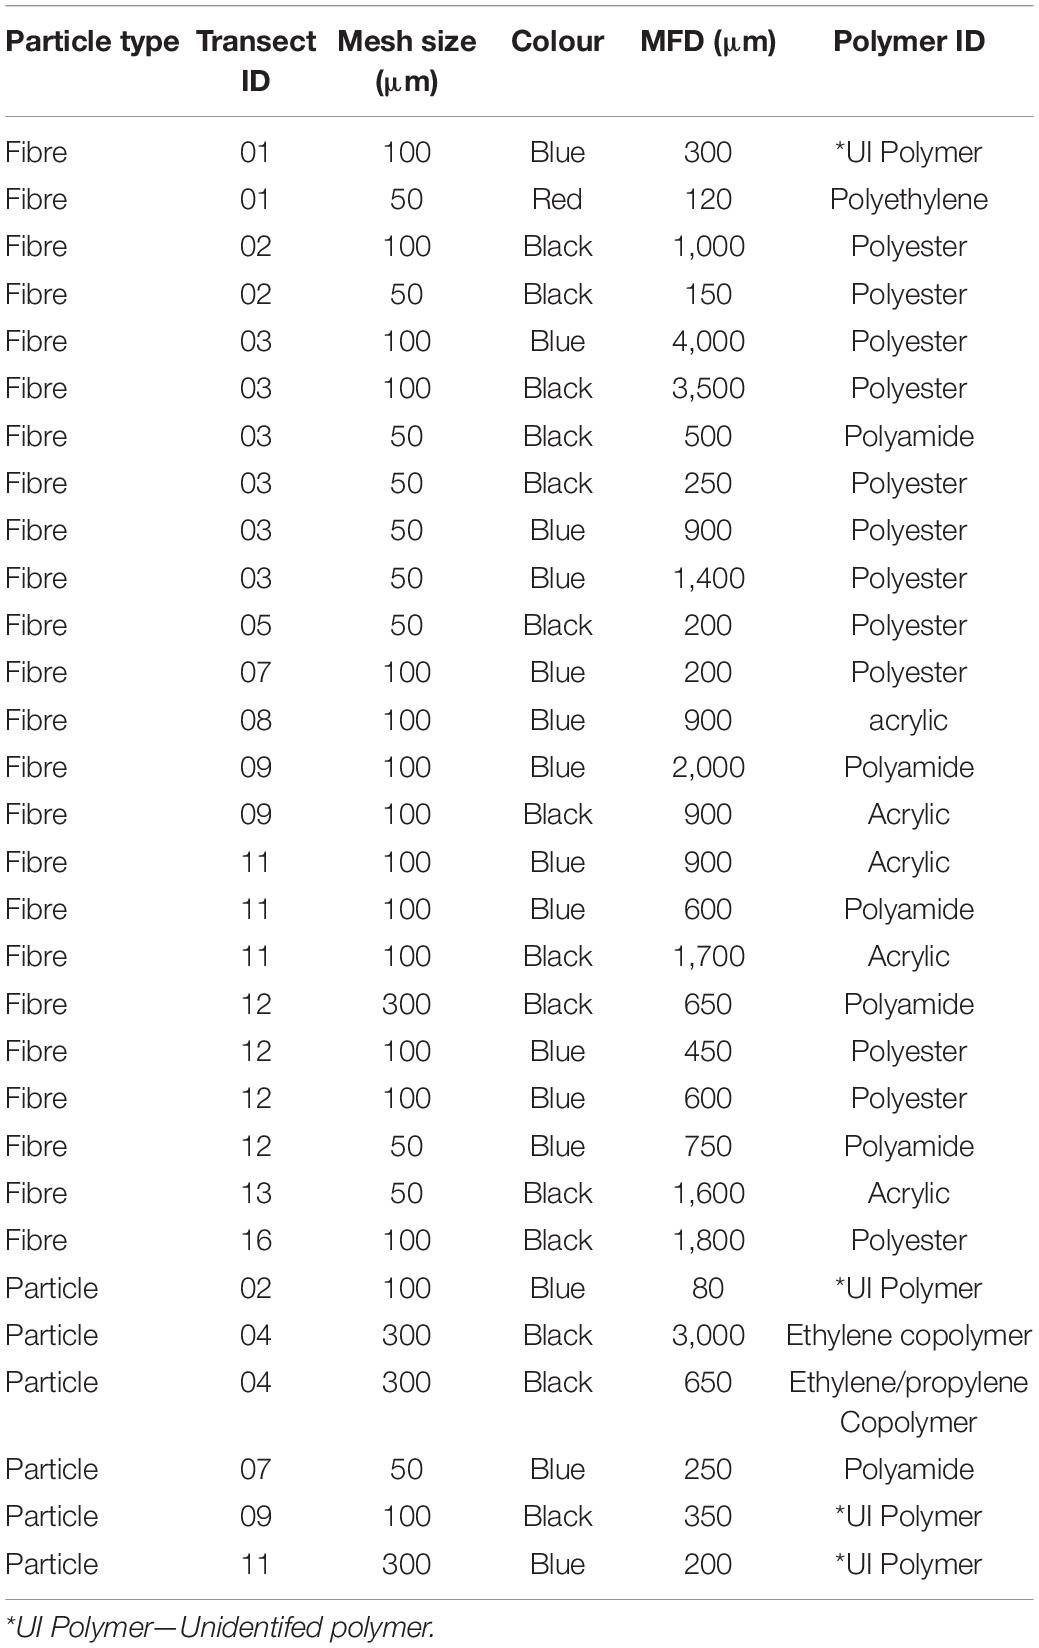
Table 1. Characteristics of confirmed microplastics.
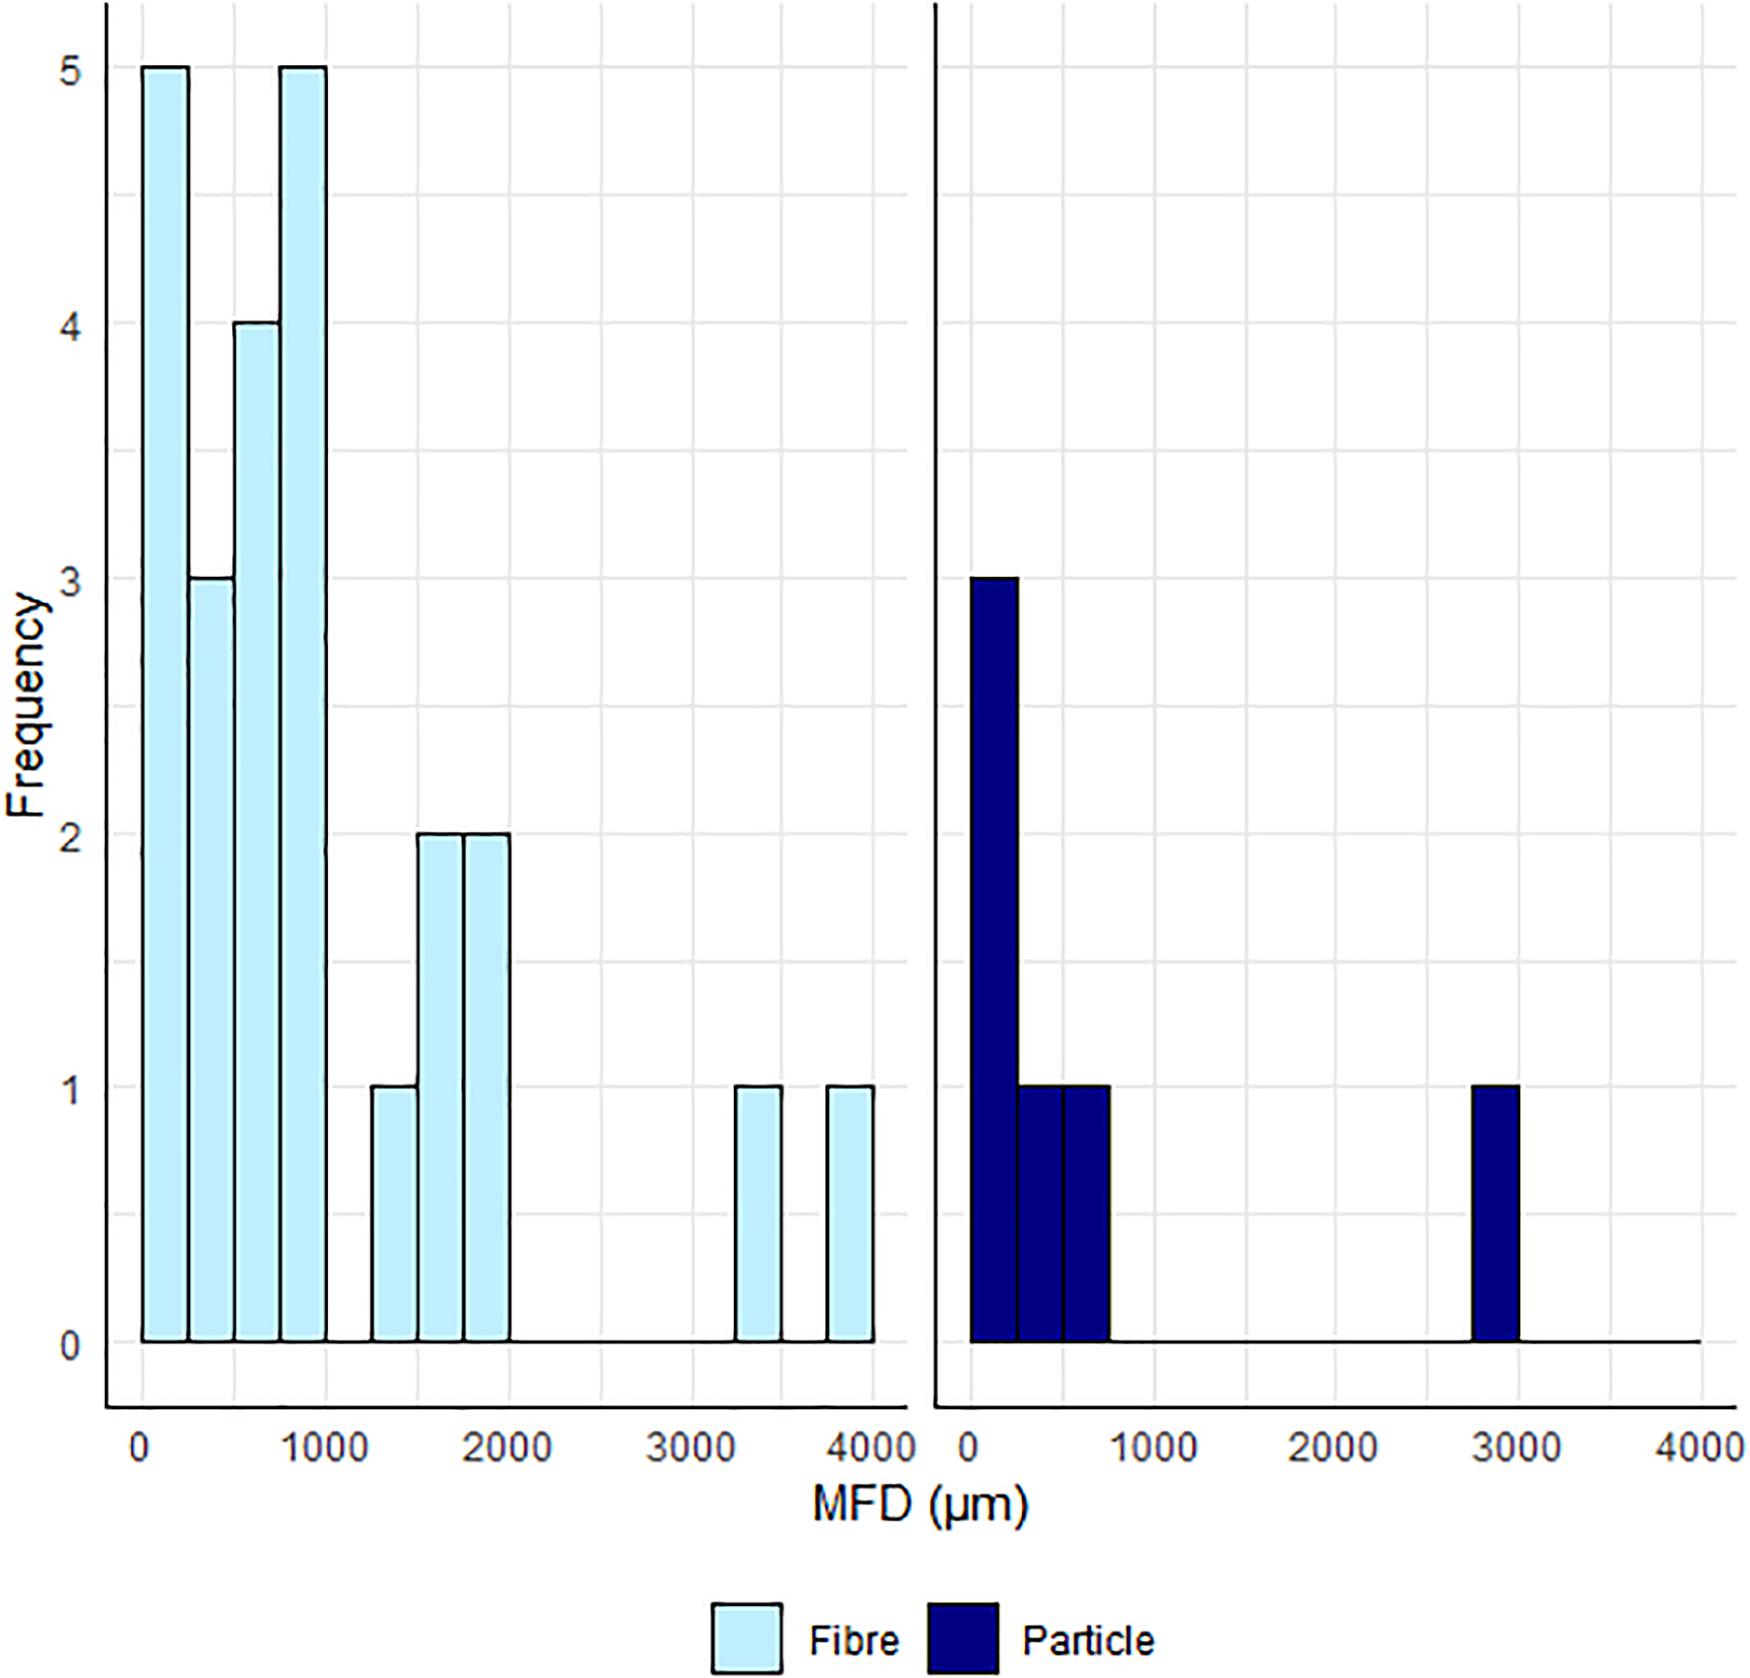
Figure 2. Size Frequency distribution of microplastic particles and microfibres (bin width = 250 μm).
Characteristics of Non-plastic Particles and Fibres
A total of 537 particles and fibres were collected from filtering 5,982 litres of seawater across 16 transects in the CAA. This comprised fibres (n = 412) and irregular particles (n = 125). Other particles and fibres made up 69.2% of the sample and can be separated into four groups based on their origin; anthropogenic, natural, ship-based and unknown. Those fibres that were not plastic (75.2%), mainly comprised cellulose derived fibres, such as cotton. These fibres, although not wholly synthetic, are a by-product of material manufacturing. Of the FTIR- analysed fibres, 56.4% (57/101) belonged to this anthropogenic category and were found in all sampled regions (Supplementary Material 1: Table 5D) although absent from transects one and five. The remaining fibres had inconclusive spectra and were added to the pool of unknowns that had not been analysed with FTIR (Supplementary Material 2: raw data). Particles analysed with FTIR that were not plastic (86%) were also assigned to most likely origin. Black particles made up 64% of the total particle count prior to FTIR analysis (n = 125). We recognised two morphologically distinct type of black particle under light microscope. One, metallic and vitreous; the other more “tar-like” in appearance. The former was concluded to be ship-derived metal, and the latter potentially a heavy oil fuel residue. Energy dispersive X ray spectroscopy of tar-like particles indicated a potassium and sulphur ratio (Supplementary Material 1: section “Supplementary Information”), consistent with a heavy fuel oil origin, however, further analysis would be required to confirm the source of this component of the particles recovered from surface waters within the CAA. Although optically identified as potentially being synthetic, 13 particles were conclusively identified as chitin and assigned a natural origin.
Distribution of Microplastics in the Sub-surface Waters of the Canadian Arctic Archipelago
Microplastics were found in 11/16 transects across the CAA and comprised microfibres (95.6%) and particles (4.4%). Plastic particles were only found in 5/16 transects compared with microfibres which were in 11/16 transects. There was a significant difference between the concentration of microplastic particles and microfibres (Kruskal Wallis p < 0.05). After blank and air contamination corrections (Supplementary Material 1: Table 4A), the average concentration of microplastics across all transects was 0.031 ± 0.017 n L–1 (Supplementary Material 1: Tables 5A–C). The highest concentration of microplastics was found on transect 11 (0.282 n L–1) in the Baffin Bay region (Figure 3A), and was one order of magnitude greater than other transects (Figure 3B). Transect 11 exhibited both the highest concentration of microplastic particles (0.011 n L–1) and microfibres (0.271 n L–1) (Figure 3B). When grouped based on surface environmental parameters, Baffin Bay had the highest total microplastic concentration (0.405 ± 0.027 n L–1), followed by the Kitikmeot (0.064 ± 0.03 n L–1), and the High Arctic (0.033 ± 0.004 n L–1), although these differences were not statistically significant (Kruskal Wallis, p > 0.05). There was no statistical correlation between the concentrations of confirmed plastics with ship parameters (ship speed, flow rate, water volume) (Supplementary Material 1: section “Statistics”). For example, when testing for correlation between microplastic concentrations and the total volume of water sampled, we see no correlation (Kendall Tau, τb = −0.1116, p > 0.05), likely due to the low number of transects sampled in this dataset. There was no correlation between microplastics and absolute environmental parameters (temperature, salinity, depth). Similarly, when partitioning transects based on relative conditions (current speed, shipping intensity, ice extent), there was no statistically significant difference between groups (Kruskal Wallis, p > 0.5) (Supplementary Material 1: section “Statistics”).
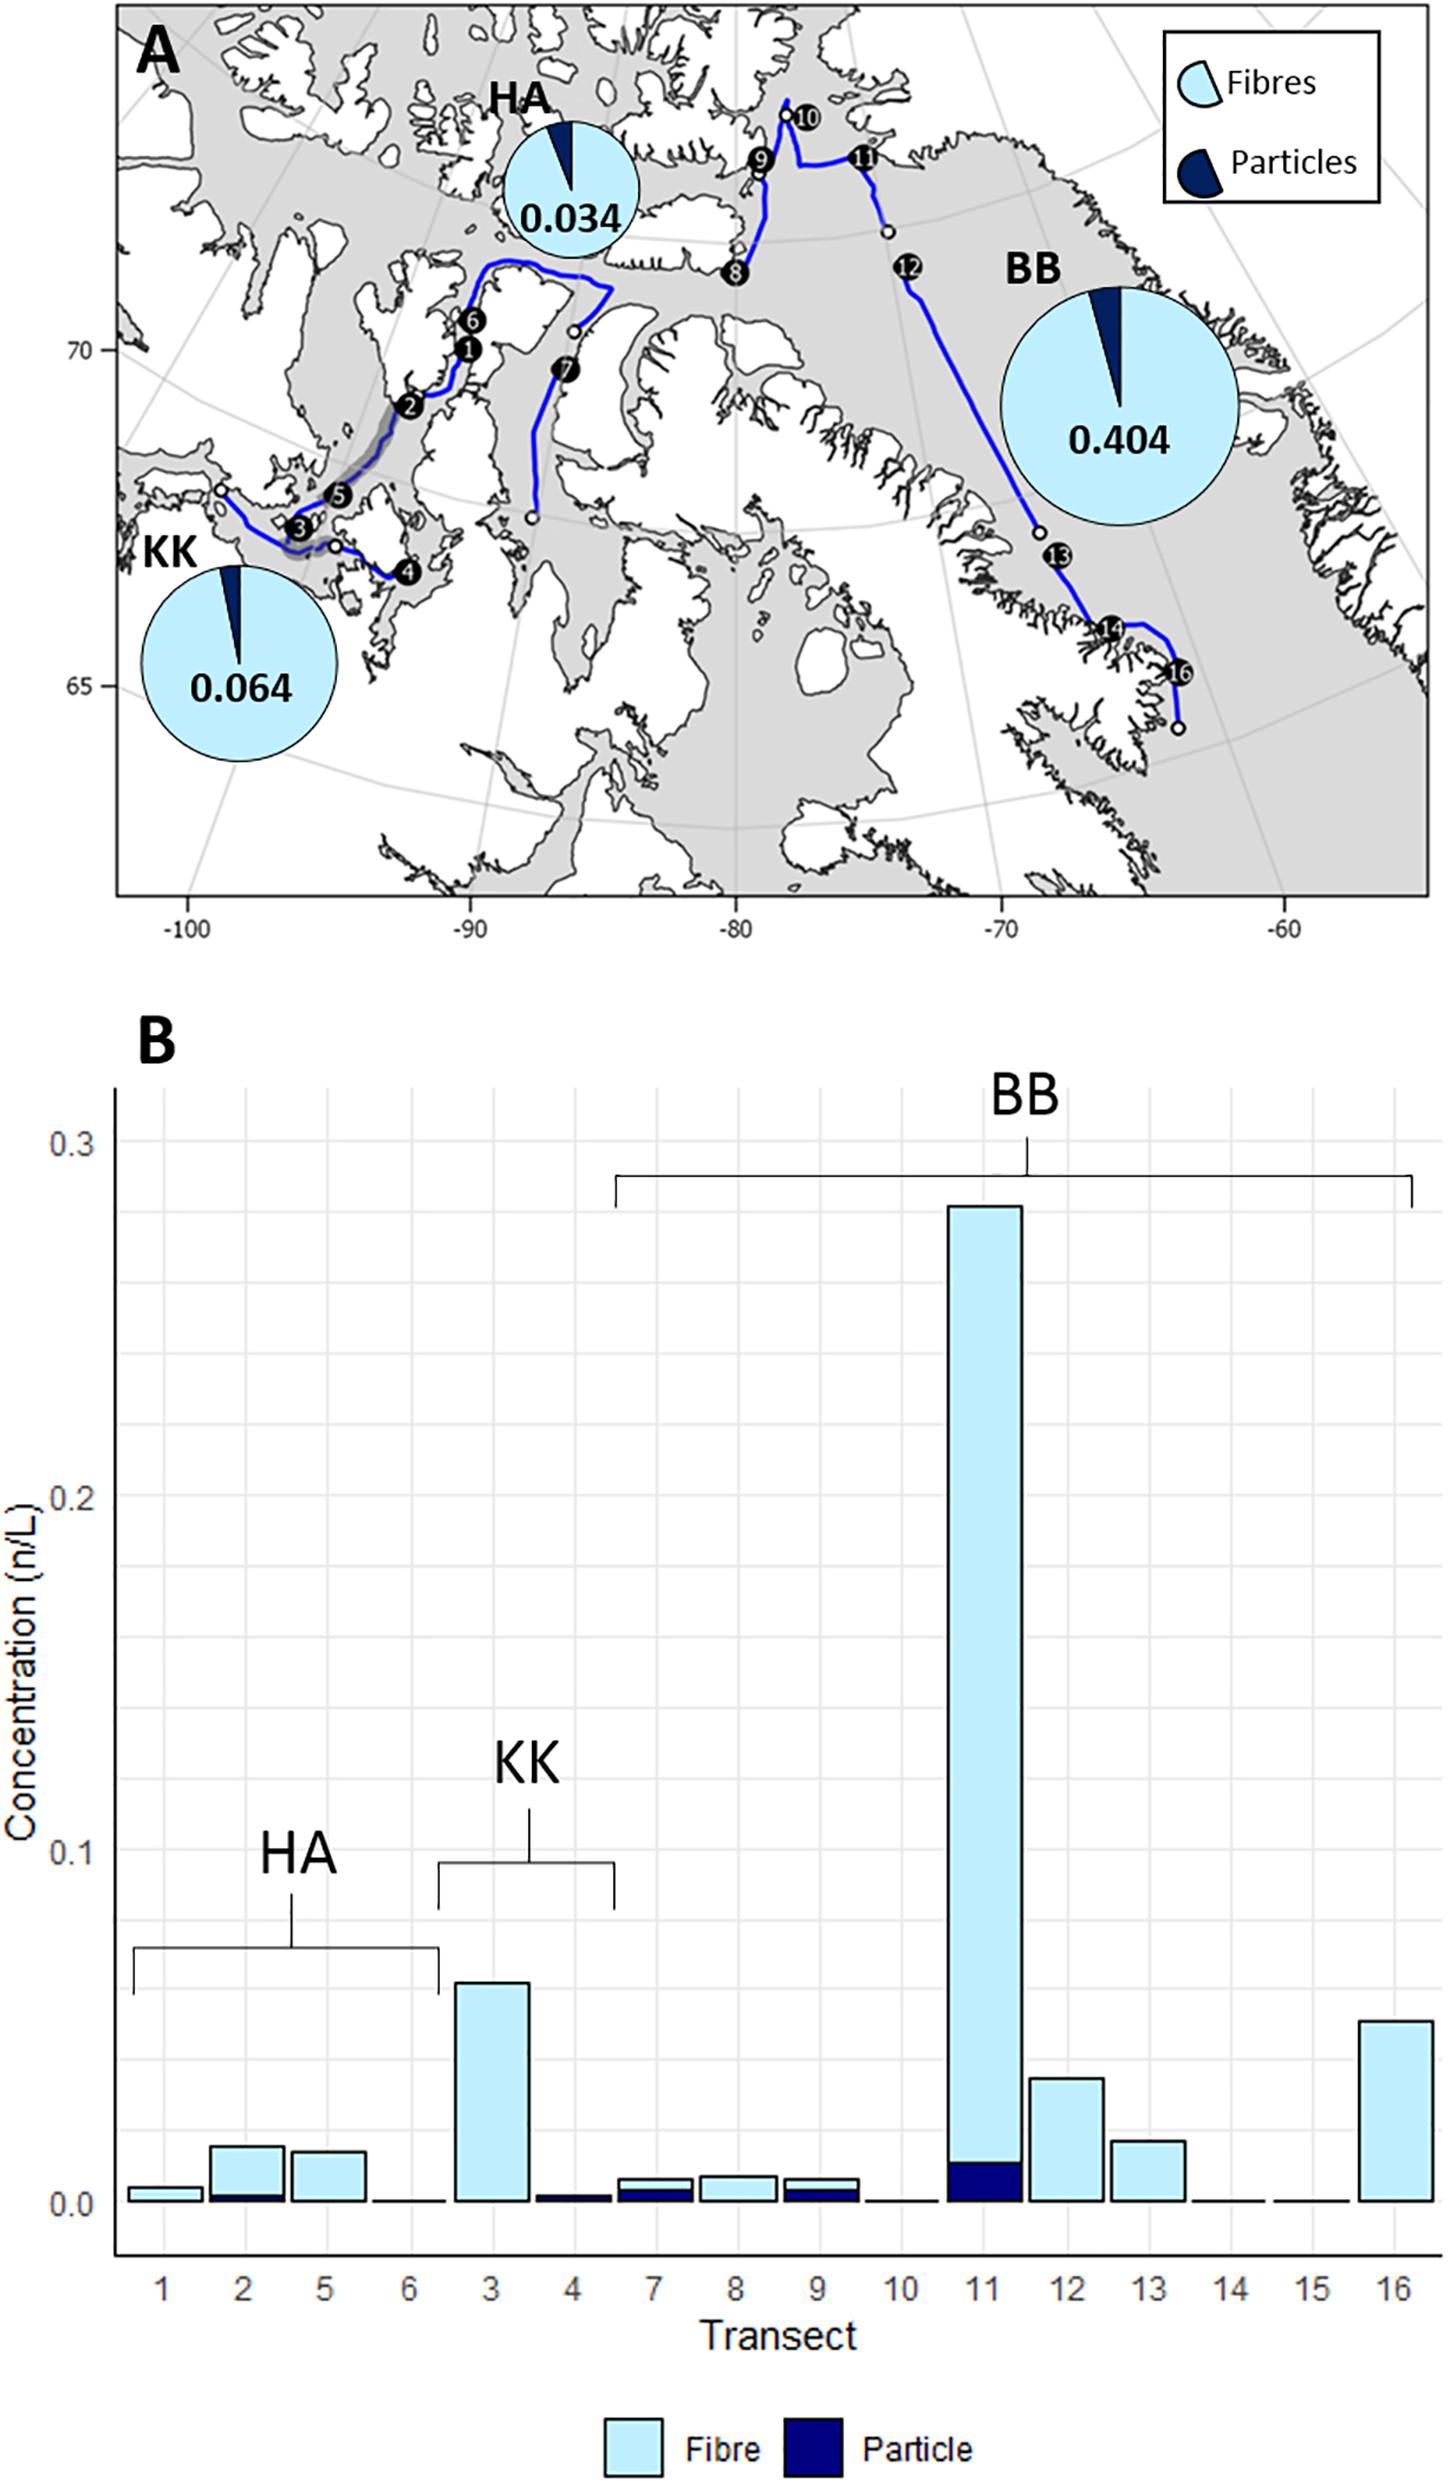
Figure 3. (A) Total microplastic concentrations for each region (HA, High Arctic; KK, Kitikmeot; BB, Baffin Bay) reported as n L− 1. Pie charts illustrate the proportion of this total made up by fibres and particles, with the relative size of each chart indicative of the total concentration. (B) Concentrations per transect.
Size Class Distribution of Putative Plastics Using an Inline Filter System
Mesh sizes of 300 and 100 μm, retained 6 and 56%, respectively, of the total particles and fibers collected in the underway pump filter system, with the remaining 38% captured on the smallest mesh size (Figure 4). Considering the fibres and particles separately, fibres had a distribution of 2.9, 61.9, and 35.2% across the 300, 100, and 50 μm meshes, respectively. Particles had a distribution 15.2, 36.0, and 48.8% across the 300, 100, and 50 μm meshes, indicating a larger retention percentage on the smallest mesh. The size of the measured particles, however, indicated that 48.9% had a Feret diameter greater than 300 μm, 44.2% were between 100 μm and 300 μm, and only 6.9% were less than 100 μm (Figure 4).
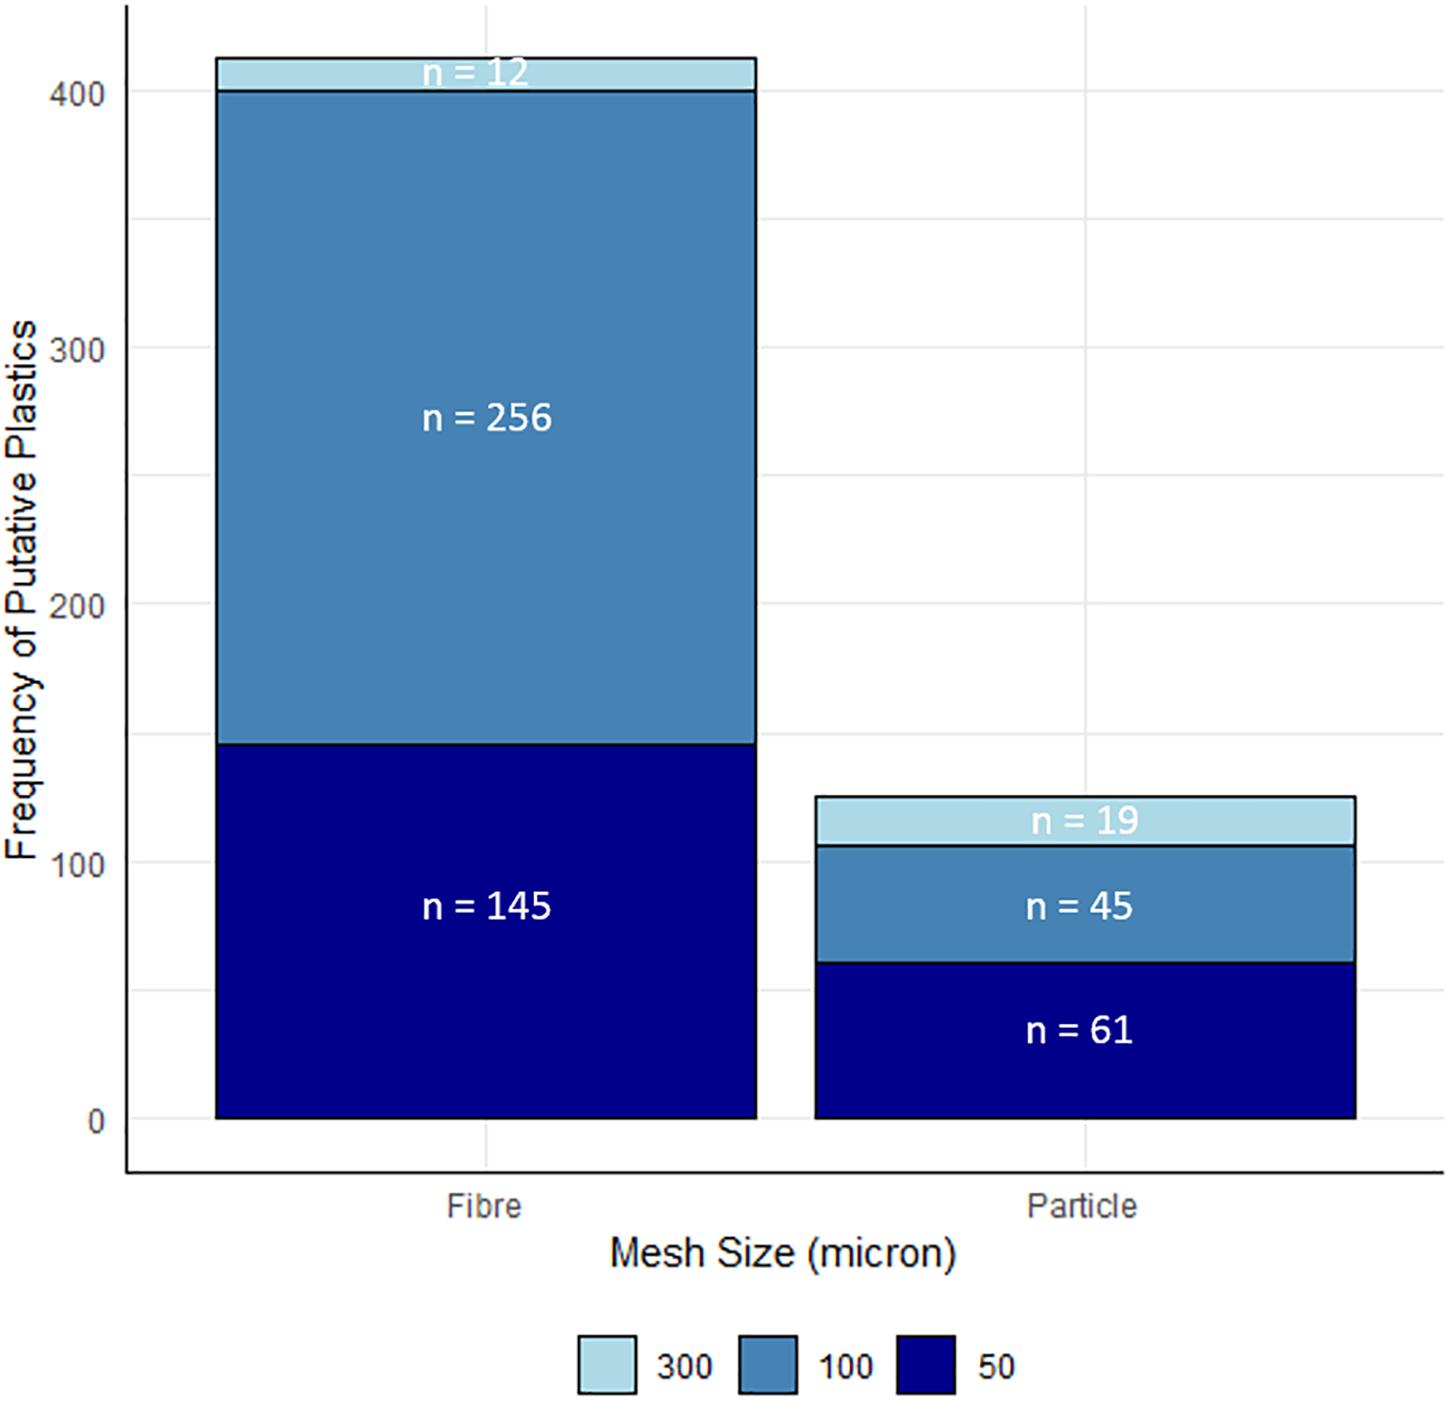
Figure 4. The proportional distribution of fibres, particles and combined (total) putative plastics across the different mesh sizes. Proportions are calculated based on the distribution of total material (n = 537) across the meshes prior to measurement of individual particles and fibres. Numbers given indicate the total number of each type, retained on all filters with the same mesh size.
Discussion
Microplastic Concentration and Distribution in the CAA
We estimate that the average concentration of microplastics in sub-surface waters of the Canadian Arctic are 0.031 n L–1 (31 particles/m3). Our results report the same order of magnitude as the two other studies in the Canadian Arctic (Huntington et al., 2020; Ross et al., 2021). Huntington et al. (2020), estimate 0.07 and 0.002 n/L microplastic fibres and particles, respectively, (300 μm Manta Net) compared with our average concentrations of microplastic fibres (0.01 n L–1) and particles (0.004 n L–1). Similarly Ross et al. (2021) sampled microplastics with an underway pump in the Western Arctic as part of a pan-Arctic study, reporting 0.021 ± 0.005 n L–1 total microplastics, equating to 0.019 n L–1 fibres and 0.001 n L–1 particles.
Whilst these concentrations are similar within the Canadian Arctic, previous analyses of surface and sub-surface waters throughout the Arctic (Table 2) range considerably from average concentrations of 0.091 microplastics/m3 (333 μm Manta Net) (Mu et al., 2019)—21,600 microplastics/m3 (1 L glass bottles) (Barrows et al., 2018).
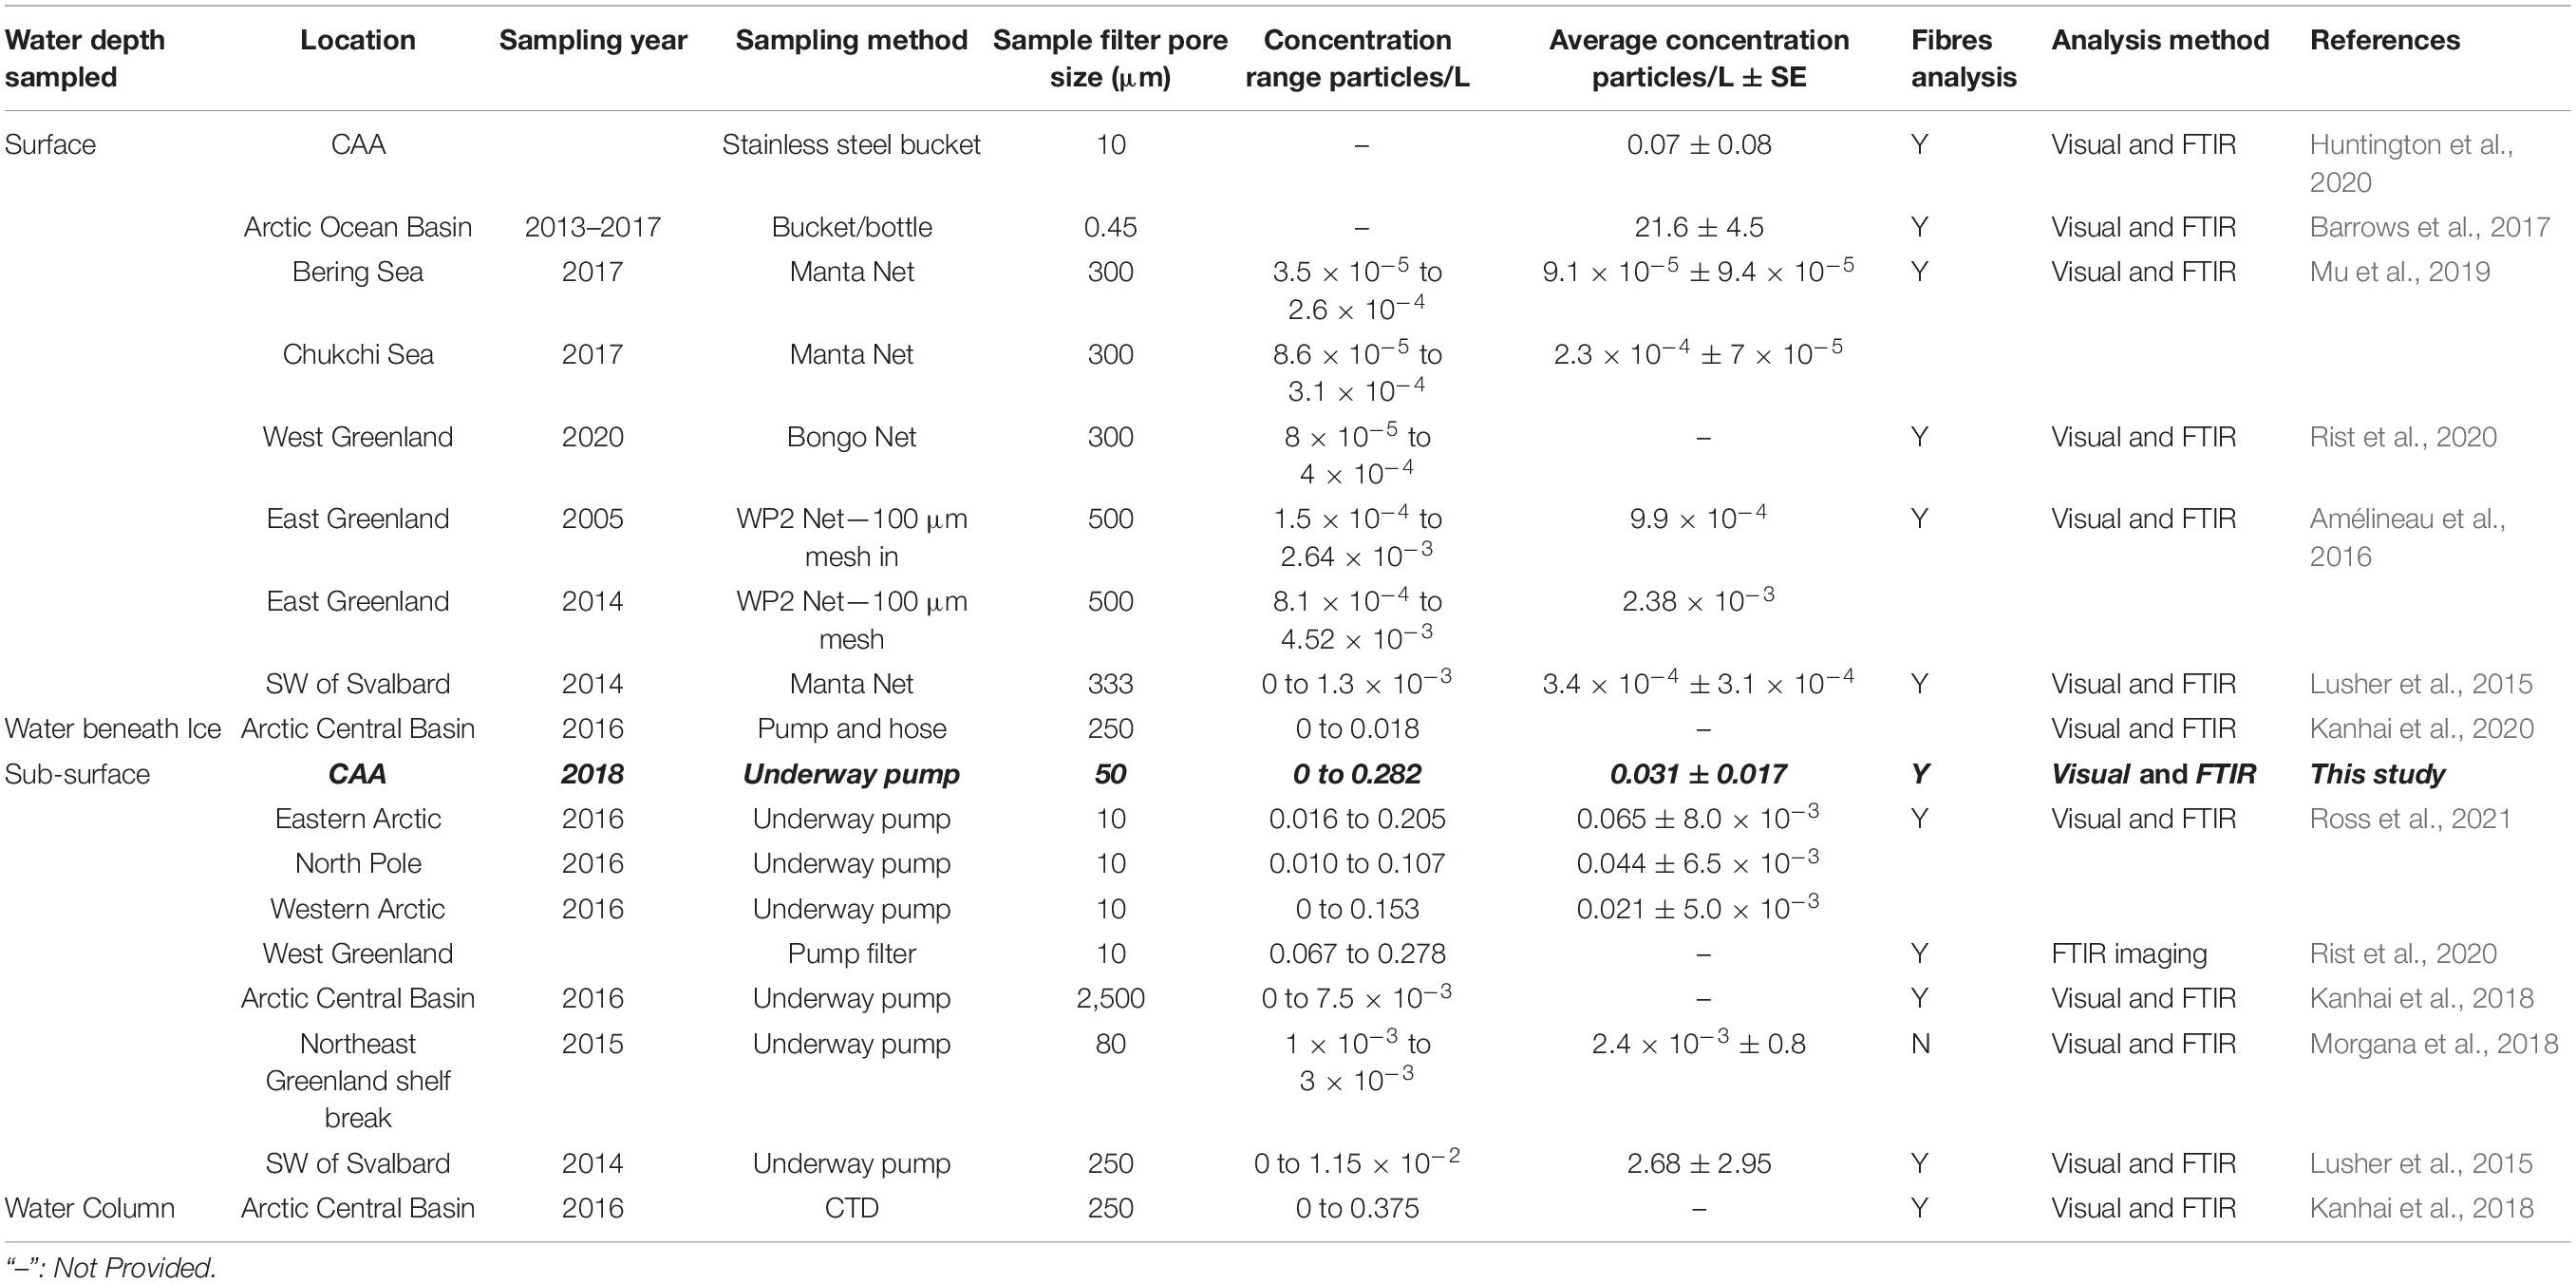
Table 2. Methods and findings of studies estimating microplastic concentrations in Arctic marine water.
The mechanisms for microplastic distribution in the Arctic are yet to be fully understood. Recent studies hypothesise the role of atmospheric circulation (Allen et al., 2019; Bergmann et al., 2019), as a means for brining microplastics to the remote north but research has predominantly focused on oceanic currents, particularly Atlantic input (Eriksen et al., 2014; Cózar et al., 2017; Onink et al., 2019; Ross et al., 2021).
In this study, we partitioned regions based on surface environmental parameters, and found no correlation between these parameters (temperature, salinity, current strength and ice) with concentrations. We found the highest concentration of microplastics in the Baffin Bay region (0.405 n L–1), however, this was dominated by the concentration on transect 11 (0.282 n L–1). This transect likely sampled Atlantic-derived waters via the West Greenland Current. However, an Atlantic origin of these plastics is not the only potential source of microplastics in this region. The West Greenland Current also transports melt water from the marine terminating glaciers off West Greenland, which have exhibited accelerated ice loss in recent decades (e.g., Rignot et al., 2011; Enderlin et al., 2014; King et al., 2020). The high concentration of microplastics on Transect 11 is consistent with high concentrations of microplastics recently found close to West Greenland glacier terminus (Rist et al., 2020). Huntington et al. (2020), who similarly sampled in the summer period, also observed some of their highest concentrations of microplastics in northern Baffin Bay surface waters in their CAA study (for example, 0.597 n L–1).
Alternatively, the higher concentration of microplastics on Transect 11 may be due to a major shipping route along West Greenland (Figure 1B). Shipping traffic intensity has increased most notably in the Kitikmeot region and in Queen Maud Gulf (QMG) of Kitikmeot, we recorded microplastics present in both transects (0.03 n L–1, range: 0.002–0.062 n L–1). Cambridge Bay, west of QMG (Figure 1), is the westernmost settlement in the CAA, experiencing one of the most significant increases of shipping traffic in the CAA in the last decade (Dawson et al., 2018). Comparison between the shipping data in Dawson et al. (2018) with microplastic concentration requires a higher resolution of microplastics sampling effort and we therefore failed to explain microplastic concentration based on the shipping intensity variation between transects (Kruskal Wallis, p > 0.05).
Shipping as a Potential Source of Microfibres to the Canadian Arctic
The dominance of microfibers in our study (95.6%), matches a trend seen amongst most other microplastic reports in the Arctic surface waters, where samples comprise more than 90% microfibers (Lusher et al., 2015; Amélineau et al., 2016; Kanhai et al., 2018; Mu et al., 2019; Huntington et al., 2020; Ross et al., 2021). Common amongst all of these studies, is the method of visual selection of particles and fibres before FITR analysis (Table 2). This pre-selection likely generates a bias toward microfibers being reported, as smaller microplastic fragments are not seen. However, one recent study by Rist et al. (2020) (West Greenland), found that fibres made up only 18% of samples that had been collected with an overboard filter pump (10 μm filter). One reason for this may be that this study was able to utilise FTIR imaging; a form of automated analysis that purportedly eliminates the bias generated by removing the visual pre-selection of particles and fibres for FITR (Primpke et al., 2019). This method is costly, however, and the ability for the software to adequately delineate between particles and fibres relies on the samples being prepared correctly (Primpke et al., 2019). Despite this difference in methodological approach, Rist et al. (2020), found that textile-derived polymers such as polyesters were the most common plastics in surface water samples (50%), which is in agreement with our study (71%) and most others which use the pre-selection method (c.f Amélineau et al., 2016; Barrows et al., 2018; Kanhai et al., 2018; Mu et al., 2019; Ross et al., 2021).
Although future research will tend toward automated analysis, the results we present here on the absolute concentrations of microfibers, and the dominance of textile based polymers suggests that a possible source of microfibers in the Arctic is from laundry effluent. The original source of this effluent is commonly thought to be brought via the Atlantic (Ross et al., 2021), however, here we explore the possibility of a more local source, linked to regional increases in shipping traffic. In the past decade, concern over the release of synthetic microfibres in laundry effluent has concentrated efforts into understanding the inputs from waste treatment plants (Browne et al., 2011; Napper and Thompson, 2016). Whilst treatment of greywater is regulated on shore, this is not the case for shipping (MARPOL, Vard, 2018). The untreated discharge of shipping greywater into the Canadian Arctic is currently permissible under MARPOL Annex IV. A recent report on the expected growth in the volume and diversity of shipping in the Canadian Arctic forecasts a substantial increase in the associated discharge of greywater (Vard, 2018) from 33,438,239 L in 2016—more than 60 million L in 2035. Here we provide an estimate on the annual release of plastic fibres from shipping in the Canadian Arctic (Supplementary Material 1: section “Greywater Microfibre Calculation” for detailed calculation) using data from: Vard (2018) and United States Environmental Protection Agencu [USEPA], (2011) that estimate 17% of shipping greywater is from laundry effluent, equating to 5,684,510 L of laundry effluent into the Canadian Arctic in a single year.
• An experiment by Napper and Thompson (2016) investigating fibre release per load of washing, which estimate 2,815–14,873 fibres/L (Based on one load using 49 L of water).
• The present study that estimates that 23.8% of fibres (section “Characteristics of Non-plastic Particles and Fibres”) are plastic. This is used to calculate the minimum estimate, with the maximum estimate assuming that all fibres are plastic.
This equates to 3.8–84.5 billion plastic fibres released into the Canadian Arctic based on 2016 shipping traffic alone. A similar estimation based on Napper and Thompson (2016), in the Southern Ocean is made by Waller et al. (2017) wherein authors calculate approximately 25.5 billion fibres released over a decade, however, this includes the removal of 90% of fibres during water treatment.
Here we highlight an opportunity to sample along a possible pathway for microplastic pollution; the release of microplastics from shipping greywater. The subsequent pathway from release will be dependent on the environment it is released into and out of the three regions studied here, we suggest the greatest risk is in the Kitikmeot. The shallow, restricted and relatively slow-moving waters in the Kitikmeot are less likely to facilitate the dispersal or dilution of greywater and therefore plastics may be more likely to accumulate here. Conversely, whilst the coast of southern Baffin Island has been identified as a region of increased shipping traffic, largely due to the presence of commercial fisheries operating out of locations such as Iqaluit (Dawson et al., 2018), no microplastic particles were found off the coast of southern Baffin Island in this study. We found plastic microfibres concentrations were also low (0.068 n L–1). These low concentrations may be accounted for by sinking of dense brines associated with shore lead polynyas proximal to Qikiqtarjuaq (Hannah et al., 2009) and/or the strong current, dispersing pollution.
Monitoring of Microplastics in the Canadian Arctic
The monitoring of microplastics as shipping intensifies within the CAA will require a cost-effective sampling method which can provide high temporal and spatial resolution. We demonstrate that inline filtering of the underway seawater supply along specific transects could be an effective, standardised method to monitor microplastic concentrations through the CAA. In this study, we successfully sampled along some of the major shipping routes in the CAA with a method that did not interrupt ship operations and could be adapted to any vessel. Furthermore, unlike towed equipment, such as the continuous plankton recorder (CPR), towed in the wake of the ship, our method is less likely to encounter grey water contamination from the host vessel. Both shipping traffic and the physical oceanographic setting need to be considered to identify potential microplastic hotspots.
The size fractionation of particles using sequentially finer meshes was implemented to reduce the potential clogging of the sampling system and therefore maximise the volume of seawater sampled and reduce analysis time. In addition, the on-board size fractionation approach reveals the extent to which microplastic concentrations may be underestimated when only using mesh sizes larger than > 100 μm. However, enabling the use of finer meshes by pre-filtering larger particles is particularly beneficial in the CAA where microplastics < 100 μm predominate and therefore, where possible automated analysis would be preferential (Peeken et al., 2018; Rist et al., 2020).
Conclusion
Here we provide one of the first assessments of near-surface seawater distribution and concentration of microplastics in the CAA and contribute to the increasing dataset of microplastics in remote regions. Whilst the pathways of microplastics in the CAA are difficult to elucidate, the presence of textile-based polymers despite conservative estimates, is in keeping with other studies of the Arctic. We recommend monitoring the plastic footprint from shipping, given both the forecasted increase in shipping to the CAA and lack of regulation preventing the release of synthetic microfibres via the release of laundry effluent. Based on these findings, authors would additionally recommend that the seasonality of microplastic pollution in relation to shipping traffic and glacier and sea ice melt be investigated. This can be done by monitoring in proximity to ice-influenced port settlements, such as Cambridge Bay and by utilising “vessels of opportunity” from the commercial shipping fleet to monitor along the main routes.
Data Availability Statement
The original contributions presented in the study are included in the article/Supplementary Material, further inquiries can be directed to the corresponding author/s.
Author Contributions
KJ-W, VP, and CM contributed to conception and design of the study. KJ-W and VP carried out the field work. CM funded the research project. KJ-W analysed the samples, organised the database, and wrote the first draft of the manuscript with the assistance of CM, VP, and TG. CM, VP, and TG aided in interpreting the results and provided theoretical overviews. All authors contributed to the article and approved the submitted version.
Funding
This work was funded by the GW4plus Doctoral Training Partnership (Grant No.: NE/L002434/1) and the UK-Canada Arctic Science Bursary Programme, supported by BEIS and delivered through the NERC Arctic Office.
Conflict of Interest
The authors declare that the research was conducted in the absence of any commercial or financial relationships that could be construed as a potential conflict of interest.
Acknowledgments
We would like to thank all crew and support staff aboard the CCGS Amundsen during leg3b of the Arctic Net expedition, and to Amundsen Science. In particular, a very special thank you to Gerald Darnis. We would also like to thank Jean-Eric Tremblay for facilitating the Canadian—UK collaboration. Thanks also to David Santillo, Exeter Greenpeace Labs, for his guidance and training in microplastics analysis.
Supplementary Material
The Supplementary Material for this article can be found online at: https://www.frontiersin.org/articles/10.3389/fmars.2021.666482/full#supplementary-material
Footnotes
References
Allen, S., Allen, D., Phoenix, V. R., Roux, G. Le, Duranteza, P., Simonneau, A., et al. (2019). Atmospheric transport and deposition of microplastics in a remote mountain catchment. Nat. Geosci. 12, 339–344. doi: 10.1038/s41561-019-0335-5
Amélineau, F., Bonnet, D., Heitz, O., Mortreux, V., Harding, A. M. A., Karnovsky, N., et al. (2016). Microplastic pollution in the Greenland Sea: background levels and selective contamination of planktivorous diving seabirds. Environ. Pollut. 219, 1131–1139. doi: 10.1016/j.envpol.2016.09.017
Avery-Gomm, S., Provencher, J. F., Liboiron, M., Poon, F. E., and Smith, P. A. (2018). Plastic pollution in the Labrador Sea: an assessment using the seabird northern fulmar Fulmarus glacialis as a biological monitoring species. Mar. Pollut. Bull. 127, 817–822. doi: 10.1016/j.marpolbul.2017.10.001
Baak, J. E., Linnebjerg, J. F., Barry, T., Gavrilo, M. V., Mallory, M. L., Price, C., et al. (2020). Plastic ingestion by seabirds in the circumpolar Arctic: a review. Environ. Rev. 28:29. doi: 10.1139/er-2020-0029
Barrows, A. P. W., Neumann, C. A., Berger, M. L., and Shaw, S. D. (2017). Grab vs. neuston tow net: a microplastic sampling performance comparison and possible advances in the field. Anal. Methods 9, 1446–1453. doi: 10.1039/C6AY02387H
Barrows, A. P. W., Cathey, S. E., and Petersen, C. W. (2018). Marine environment microfibre contamination: global patterns and the diversity of microparticle origins. Environ. Pollut. 237, 275–284. doi: 10.1016/j.envpol.2018.02.062
Bergmann, M., Mützel, S., Primpke, S., Tekman, M. B., Trachsel, J., and Gerdts, G. (2019). White and wonderful? Microplastics prevail in snow from the alps to the arctic. Sci. Adv. 5:eaax1157. doi: 10.1126/sciadv.aax1157
Bouchard, C., Geoffroy, M., LeBlanc, M., and Fortier, L. (2018). Larval and adult fish assemblages along the Northwest passage: the shallow Kitikmeot and the ice-covered Parry Channel as potential barriers to dispersal. Arctic Sci. 4:22. doi: 10.1139/as-2018-0003
Brandon, J., Goldstein, M., and Ohman, M. D. (2016). Long-term aging and degradation of microplastic particles: comparing in situ oceanic and experimental weathering patterns. Mar. Pollut. Bull. 110, 299–308. doi: 10.1016/j.marpolbul.2016.06.048
Browne, M. A., Crump, P., Niven, S. J., Teuten, E., Tonkin, A., Galloway, T. S., et al. (2011). Accumulation of microplastic on shorelines worldwide: sources and sinks. Environ. Sci. Technol. 45, 9175–9179. doi: 10.1021/es201811s
Cole, M., Lindeque, P., Fileman, E., Halsband, C., Goodhead, R., Moger, J., et al. (2013). Microplastic ingestion by zooplankton. Environ. Sci. Technol. 47, 6646–6655. doi: 10.1021/es400663f
Cózar, A., Echevarria, F., Gonzalez-Gordillo, J. I, Irigoien, X., Ubeda, B., Hernandez-Leon, S., et al. (2014). Plastic debris in the open ocean. Proc. Natl. Acad. Sci. U.S.A. 111, 239–210. doi: 10.1073/pnas.1314705111
Cózar, A., Martí, E., Duarte, C. M., García-de-Lomas, J., Van Sebille, E., Ballatore, T. J., et al. (2017). The Arctic Ocean as a dead end for floating plastics in the North Atlantic branch of the thermohaline circulation. Sci. Adv. 3:4. doi: 10.1126/sciadv.1600582
Dawson, J., Pizzolato, L., Howell, S., Copland, L., and Johnston, M. (2018). Temporal and spatial patterns of ship traffic in the Canadian Arctic from 1990 to 2015. Arctic 71, 1–113. doi: 10.2307/26387327
Enderlin, E. M., Howat, I. M., Jeong, S., Noh, M.-J., van Angelen, J. H., and van den Broeke, M. R. (2014). An improved mass budget for the Greenland ice sheet. Geophys. Res. Lett. 41, 866–872. doi: 10.1002/2013GL059010
Environment Canada, (2015). Arctic Average Water Currents. Available at: https://www.canada.ca/en/environment-climate-change/services/ice-forecasts-observations/latest-conditions/climatology/arctic-average-water-currents.html#shr-pg0 (accessed February 9, 2021).
Eriksen, M., Lebreton, L. C., Carson, H. S., Thiel, M., Moore, C. J., Borerro, J. C., et al. (2014). Plastic pollution in the world’s oceans: more than 5 trillion plastic pieces weighing over 250,000 tons afloat at sea. PLoS One 9:e111913. doi: 10.1371/journal.pone.0111913
Galloway, T., Cole, M., and Lewis, C. (2017). Interactions of microplastic debris throughout the marine ecosystem. Nat. Ecol. Evol. 1:0116. doi: 10.1038/s41559-017-0116
GESAMP, (2015). “Sources, fate and effects of microplastics in the marine environment: a global assessment,” in (IMO/FAO/UNESCO-IOC/UNIDO/WMO/IAEA/UN/UNEP/UNDP Joint Group of Experts on the Scientific Aspects of Marine Environmental Protection), ed. P. J. Kershaw (Rome: GESAMP).
Hannah, C., Dupont, F., and Dunphy, M. (2009). Polynyas and tidal currents in the canadian arctic archipelago. Arctic. 62:1.
Hidalgo-Ruz, V., Gutow, L., Thompson, R. C., and Thiel, M. (2012). Microplastics in the marine environment: a review of the methods used for identification and quantification. Environ. Sci. Technol. 46, 3060–3075. doi: 10.1021/es2031505
Huntington, A., Corcoran, P. L., Jantunen, L., Thaysen, C., Bernstein, S., Stern, G. A., et al. (2020). A first assessment of microplastics and other anthropogenic particles in hudson bay and the surrounding eastern canadian arctic waters of nunavut. Facets 5:42. doi: 10.1139/facets-2019-0042
Jones-Williams, K., Galloway, T. S., Cole, M., Stowasser, G., Waluda, C., and Manno, C. (2020). Close Encounters - Microplastic availability to pelagic amphipods in sub-Antarctic and Antarctic surface waters. Environ. Int. 140:105792. doi: 10.1016/J.ENVINT.2020.105792
Kanhai, D. K., Gardfeldt, K., Krumpen, T., Thompson, R. C., and O’Connor, I. (2020). Microplastics in sea ice and seawater beneath ice floes from the Arctic Ocean. Sci Rep. 10:5004. doi: 10.1038/s41598-020-61948-6
Kanhai, D. K., Gårdfeldt, K., Lyashevska, O., Hassellöv, M., Thompson, R. C., and O’Connor, I. (2018). Microplastics in sub-surface waters of the Arctic Central Basin. Mar. Pollut. Bull. 139, 8–18. doi: 10.1016/j.marpolbul.2018.03.011
King, M. D., Howat, I. M., Candela, S. G., Noh, M. J., Jeong, S., Noël, B. P. Y., et al. (2020). Dynamic ice loss from the Greenland Ice Sheet driven by sustained glacier retreat. Commun. Earth Environ. 1:1. doi: 10.1038/s43247-020-0001-2
Law, K., and Thompson, R. C. (2014). Microplastics in the seas - Concern is rising about widespread contamination of the marine environment by microplastics. Science 345:80. doi: 10.1002/2014EF000240
Lusher, A. L., Tirelli, V., O’Connor, I., and Officer, R. (2015). Microplastics in Arctic polar waters: the first reported values of particles in surface and sub-surface samples. Sci. Rep. 5:14947. doi: 10.1038/srep14947
Melling, H., Gratton, Y., and Ingram, G. (2001). Ocean circulation within the North Water polynya of Baffin Bay. Atmos. Ocean. 39, 301–325. doi: 10.1080/07055900.2001.9649683
Morgana, S., Ghigliotti, L., Estévez-Calvar, N., Stifanese, R., Wieckzorek, A., Doyle, T., et al. (2018). Microplastics in the Arctic: a case study with sub-surface water and fish samples off Northeast Greenland. Environ. Pollut. 242(Pt B), 1078–1086. doi: 10.1016/j.envpol.2018.08.001
Mu, J., Zhang, S., Qu, L., Jin, F. C., Ma, X., Zhang, W., et al. (2019). Microplastics abundance and characteristics in surface waters from the Northwest Pacific, the Bering Sea, and the Chukchi Sea. Mar. Pollut. Bull. 143, 58–65. doi: 10.1016/j.marpolbul.2019.04.023
Münchow, A., Falkner, K. K., and Melling, H. (2015). Baffin Island and west greenland current systems in northern Baffin Bay. Prog. Oceanogr. 132, 305–317. doi: 10.1016/j.pocean.2014.04.001
Napper, I. E., and Thompson, R. C. (2016). Release of synthetic microplastic plastic fibres from domestic washing machines: effects of fabric type and washing conditions. Mar. Pollut. Bull. 112, 1–2. doi: 10.1016/j.marpolbul.2016.09.025
Obbard, R. W., Sadri, S., Wong, Y. Q., Khitun, A. A., Baker, I., and Thompson, R. C. (2014). Global warming releases microplastic legacy frozen in Arctic Sea ice. Earth’s Future 2, 315–320.
Onink, V., Wichmann, D., Delandmeter, P., and van Sebille, E. (2019). The role of Ekman currents, geostrophy, and stokes drift in the accumulation of floating microplastic. J. Geophys. Res. Oceans 124, 1474–1490. doi: 10.1029/2018JC014547
Peeken, I., Primpke, S., Beyer, G. J., Katlein, C., Krumpen, T., Bergmann, M., et al. (2018). Arctic sea ice is an important temporal sink and means of transport for microplastic. Nat. Commun. 9:1505. doi: 10.1038/s41467-018-03825-5
Pickett, J. E. (2018). “Weathering of plastics,” in Handbook of Environmental Degradation of Materials, ed. M. Kutz (Norwich: William Andrew Publishing), 163–184.
Poon, F. E., Provencher, J. F., Mallory, M. L., Braune, B. M., and Smith, P. A. (2017). Levels of ingested debris vary across species in Canadian Arctic seabirds. Mar. Pollut. Bull. 116, 1–2. doi: 10.1016/j.marpolbul.2016.11.051
Primpke, S., Dias, P. A., and Gerdts, G. (2019). Automated identification and quantification of microfibres and microplastics. Anal. Methods 11, 2138–2147. doi: 10.1039/C9AY00126C
Rignot, E., Velicogna, I., van den Broeke, M. R., Monaghan, A., and Lenaerts, J. T. M. (2011). Acceleration of the contribution of the Greenland and Antarctic ice sheets to sea level rise. Geophys. Res. Lett. 38:L05503. doi: 10.1029/2011GL046583
Rist, S., Vianello, A., Winding, M. H. S., Nielsen, T. G., Almeda, R., Torres, R. R., et al. (2020). Quantification of plankton-sized microplastics in a productive coastal Arctic marine ecosystem. Environ. Pollut. 266:115248. doi: 10.1016/j.envpol.2020.115248
Ross, P. S., Chastain, S., Vassilenko, E., Etemadifar, A., Zimmermann, S., Quesnel, S.-A., et al. (2021). Pervasive distribution of polyester fibres in the Arctic Ocean is driven by Atlantic inputs. Nat. Commun. 12:106. doi: 10.1038/s41467-020-20347-1
Scott, A., and Penlidis, A. (2017). “Copolymerization,” in Reference Module in Chemistry, Molecular Sciences and Chemical Engineering, ed. J. Reedijk (Amsterdam: Elsevier).
Statistics Canada, (2020). Table 17-10-0009-01 Population Estimates, Quarterly. Canada: Statistics Canada.
Thompson, R. C., Olsen, Y., Mitchell, R. P., Davis, A., Rowland, S. J., John, A. W., et al. (2004). Lost at sea: where is all the plastic? Science 304:838.
United States Environmental Protection Agencu [USEPA], (2011). “Greywater Discharges from Vessels” (EPA-800-R-11-001 November 2011). Available at: https://www3.epa.gov/npdes/pubs/vgp_graywater.pdf (accessed May 1, 2021).
Vard, (2018). “Canadian Arctic Greywater Report: Estimates, forecasts, and treatment technologies” (Report #360-000, Rev 2). Available at: https://arcticwwf.org/site/assets/files/1851/wwf_canada_grey_water_report_2018_1.pdf (accessed May 1, 2021).
Keywords: microplastic, microfibre, Arctic, Canada, sub-surface, environmental monitoring, greywater
Citation: Jones-Williams K, Galloway TS, Peck VL and Manno C (2021) Remote, but Not Isolated—Microplastics in the Sub-surface Waters of the Canadian Arctic Archipelago. Front. Mar. Sci. 8:666482. doi: 10.3389/fmars.2021.666482
Received: 10 February 2021; Accepted: 18 May 2021;
Published: 11 June 2021.
Edited by:
Mario Barletta, Federal University of Pernambuco, BrazilReviewed by:
Felipe Amezcua, National Autonomous University of Mexico, MexicoSeung-Kyu Kim, Incheon National University, South Korea
Copyright © 2021 Jones-Williams, Galloway, Peck and Manno. This is an open-access article distributed under the terms of the Creative Commons Attribution License (CC BY). The use, distribution or reproduction in other forums is permitted, provided the original author(s) and the copyright owner(s) are credited and that the original publication in this journal is cited, in accordance with accepted academic practice. No use, distribution or reproduction is permitted which does not comply with these terms.
*Correspondence: Kirstie Jones-Williams, a2lybmVzNzlAYmFzLmFjLnVr