 Kristin Doering
 Claudia Ehlert
 Katharina Pahnke
 Martin Frank
 Ralph Schneider4
 Patricia Grasse
- 1Geomar Helmholtz Center for Ocean Research, Kiel, Germany
- 2Department of Oceanography, Dalhousie University, Halifax, NS, Canada
- 3Marine Isotope Geochemistry, Institute for Chemistry and Biology of the Marine Environment (ICBM), Carl von Ossietzky University, Oldenburg, Germany
- 4Institute of Geosciences, Christian-Albrechts-University of Kiel, Kiel, Germany
- 5German Centre for Integrative Biodiversity Research (iDiv) Halle-Jena-Leipzig, Leipzig, Germany
The global silicon (Si) cycle plays a critical role in regulating the biological pump and the carbon cycle in the oceans. A promising tool to reconstruct past dissolved silicic acid (DSi) concentrations is the silicon isotope signature of radiolaria (δ30Sirad), siliceous zooplankton that dwells at subsurface and intermediate water depths. However, to date, only a few studies on sediment δ30Sirad records are available. To investigate its applicability as a paleo proxy, we compare the δ30Sirad of different radiolarian taxa and mixed radiolarian samples from surface sediments off Peru to the DSi distribution and its δ30Si signatures (δ30SiDSi) along the coast between the equator and 15°S. Three different radiolarian taxa were selected according to their specific habitat depths of 0–50 m (Acrosphaera murrayana), 50–100 m (Dictyocoryne profunda/truncatum), and 200–400 m (Stylochlamydium venustum). Additionally, samples containing a mix of species from the bulk assemblage covering habitat depths of 0 to 400 m have been analyzed for comparison. We find distinct δ30Sirad mean values of +0.70 ± 0.17‰ (Acro; 2 SD), +1.61 ± 0.20 ‰ (Dictyo), +1.19 ± 0.31 ‰ (Stylo) and +1.04 ± 0.19 ‰ (mixed radiolaria). The δ30Si values of all individual taxa and the mixed radiolarian samples indicate a significant (p < 0.05) inverse relationship with DSi concentrations of their corresponding habitat depths. However, only δ30Si of A. murrayana are correlated to DSi concentrations under normally prevailing upwelling conditions. The δ30Si of Dictyocoryne sp., Stylochlamydium sp., and mixed radiolaria are significantly correlated to the lower DSi concentrations either associated with nutrient depletion or shallower habitat depths. Furthermore, we calculated the apparent Si isotope fractionation between radiolaria and DSi (Δ30Si ∼ 30ε = δ 30Sirad − δ 30SiDSi) and obtained values of −1.18 ± 0.17 ‰ (Acro), −0.05 ± 0.25 ‰ (Dictyo), −0.34 ± 0.27 ‰ (Stylo), and −0.62 ± 0.26 ‰ (mixed radiolaria). The significant differences in Δ30Si between the order of Nassellaria (A. murrayana) and Spumellaria (Dictyocoryne sp. and Stylochlamydium sp.) may be explained by order-specific Si isotope fractionation during DSi uptake, similar to species-specific fractionation observed for diatoms. Overall, our study provides information on the taxon-specific fractionation factor between radiolaria and seawater and highlights the importance of taxonomic identification and separation to interpret down-core records.
Introduction
Dissolved silicic acid (DSi) is a crucial component for the growth of phytoplankton, such as diatoms, which are responsible for exporting half of the marine organic matter that is sequestered in marine sediments (Nelson et al., 1995; Tréguer and De La Rocha, 2013). Information on silicon (Si) cycling in the ocean is of major interest due to its important control on the oceanic biological pump that transports nutrients and fixed carbon out of the surface ocean into deep waters (Sabine et al., 2004), thereby strongly influencing the global climate on various timescales. Quantifying past changes in DSi supply to surface waters is thus essential to estimate past changes in the biological pump, as well as carbon cycling and the global climate.
In recent years the interest to reconstruct changes in the marine nutrient cycle for the past has gained significant importance. To study the behavior of nutrients, proxies such as the stable silicon isotope composition (δ30Si) of diatoms (De La Rocha et al., 1997) and sponges (Hendry et al., 2019) can be applied. The biological uptake of DSi and the subsequent formation of biogenic opal (BSi) discriminate against the heavier Si isotopes (30Si), resulting in BSi with a lighter isotope composition compared to the surrounding seawater. Because burial of BSi is by far the main output of Si from the ocean (Tréguer and De La Rocha, 2013; Tréguer et al., 2020), δ30Si compositions in marine organisms, such as diatoms and marine sponges, have proven useful for reconstructions of the spatial and temporal variability of the marine silica cycle, from DSi utilization in surface waters (De La Rocha et al., 1998; Egan et al., 2012) to the variability in the Si inventory of the deep ocean (De La Rocha, 2003).
The Si isotope signatures of radiolaria (protozooplankton) present a rarely exploited window into the subsurface and deeper water DSi conditions. Polycystine radiolaria (Collodaria, Spumellaria, and Nassellaria) produce skeletons of opaline silica (Suzuki and Not, 2015), which are hardly affected by dissolution in the water column (Takahashi, 1981). Thus, they reach the sediments without substantial alteration of the species composition (Takahashi and Honjo, 1983). Today radiolarians are globally distributed in the shallow to deep oceans and dispersed horizontally from the high latitudes to subtropical and tropical waters, and vertically from the surface to deep waters of more than 4000 m water depth (WD; Suzuki and Aita, 2011; Suzuki and Not, 2015). The distribution of living radiolarians is generally related to specific hydrographic conditions such as sea-surface temperature, salinity, and nutrients (Kling and Boltovskoy, 1995; Abelmann and Gowing, 1996; Ikenoue et al., 2015). Therefore, radiolaria obtained from sediments provide crucial information about their marine environment (Moore, 1978; Zhang et al., 2018). Radiolaria are extremely abundant and diverse in the Pacific Ocean. Many species are restricted to specific environments (e.g., Kruglikova, 1989), which has led to intensive investigations of radiolarian assemblages for paleoenvironmental reconstructions (Petrushevskaya and Björklund, 2011). For example, in coastal upwelling regions, particular radiolarian assemblages and distinct species occur as a function of environmental conditions (Nigrini and Caulet, 1992).
There is potential for radiolarian δ30Si (δ30Sirad) to be used as a tool to constrain surface to mid-depth DSi concentrations, which will allow a more detailed reconstruction of the past silicon cycle. However, only a few studies have been carried out on the stable isotope composition of radiolarian opal (Egan et al., 2012; Hendry et al., 2014; Abelmann et al., 2015; Fontorbe et al., 2016, 2017, 2020). Radiolarian Si isotope fractionation factors are challenging to constrain given that it has so far not been possible to grow radiolarians through a reproduction cycle in culture (Kouduka et al., 2006; Krabberød et al., 2011), and short-term culture experiments have only been successful for certain species, such as spongodiscids (Sugiyama and Anderson, 1997; Ogane et al., 2010). Only one study has yet attempted to constrain an apparent Si isotope fractionation (Δ30Si ∼30ε = δ30Sirad −δ30SiDSi) between seawater and core-top or downcore radiolarians (ca. −0.5 ‰ to −0.9 ‰; Abelmann et al., 2015), which have been estimated to be similar to the fractionation range for modern diatoms. Studies that focus on the past δ30Sirad record thus have to revert to assumptions about the Si fractionation in radiolaria (Hendry et al., 2014; Fontorbe et al., 2016, 2017, 2020).
Based on surface sediments from the Southern Ocean, a first application has been presented by Abelmann et al. (2015) that has indicated an inverse relationship of DSi concentrations of the assumed radiolarian habitat depth with δ30Sirad. These authors observed a difference in δ30Sirad depending on the size fraction. While the > 250 μm fraction consisted of > 90% Actinomma antarctica and 1–10% Spongotrochus glacialis, both living within the upper 400 m of the water column, the 125–250 μm size fraction consisted of a more diverse radiolarian assemblage (for example, Spongopyle osculosa, Spongogurus pylomaticus, and Cromyecheinus Antarctica) with habitat depths generally deeper than 400 m. The isotopic differences between the two size fractions amounted to up to 1.5‰ in downcore records and were at least partly attributed to the smaller fraction’s deeper habitats. However, the differences could not be attributed to either species-related isotope effects or seasonal effects (Abelmann et al., 2015). The cause for this difference is not really known. Still, several processes might have an effect (i) the species dominating each size fraction grow at different water depths and time of the year and, consequently, tap various sources of DSi, and/or (ii) the fractionation associated with radiolarian BSi production varies with species or growth rate.
One of the main problems to apply δ30Sirad in downcore records is the unknown fractionation factor between radiolaria and seawater. Previously, different approaches were chosen to solve this issue. Hendry et al. (2014) used an offset of −1.1‰ to −2.1‰, assuming that radiolaria fractionate similar to diatoms in the Sargasso Sea to model DSi cycling during the most recent Heinrich Stadial (17 ka BP). A study by Fontorbe et al. (2017) used fractionation factors ranging from −0.8‰ to −1.5‰ for their DSi reconstructions of the deep equatorial Pacific during the Eocene-Oligocene (∼50–23 Ma ago) based on core-top estimations given by Abelmann et al. (2015) from the Southern Ocean. The range of Si fractionation of −0.8‰ to −1.5‰ was further shown to result in estimated differences in DSi concentrations of 30 to 70 μM when applying Holocene and glacial δ30Sirad values (Abelmann et al., 2015). This considerable range for DSi reconstruction clearly highlights the need for more precise values of Si fractionation to enable the use of δ30Sirad as a reliable tool to reconstruct past DSi concentrations.
To improve our knowledge on the Si isotope fractionation of radiolaria in a modern system, we analyzed the δ30Si values of three single radiolarian taxa (A. murrayana, Dictyocoryne sp., Stylochlamydium sp.) as well as from mixed-species samples from surface sediments of the Peruvian shelf, a region well studied in the context of modern and past Si cycling (Ehlert et al., 2012, 2013, 2015, 2016a; Grasse et al., 2013; Doering et al., 2016a, b; Grasse et al., under review). These radiolarian taxa have been selected according to their high abundance in the sediment samples and their respective habitat depths in surface, subsurface, and intermediate waters. The δ30Si signatures of the different radiolarian samples are then compared to recent DSi concentrations and δ30SiDSi values of the modern water column to infer potential correlations and to constrain the Si isotope to improve the potential for reconstructions of past DSi concentrations and δ30SiDSi of water masses along the Peruvian shelf.
Regional Setting
Along the Peruvian coast, strong annual upwelling delivers high nutrient subsurface waters to the surface, inducing intense surface productivity (Messié and Chavez, 2015). Along the shelf, the main water masses are the northward-flowing Peru Coastal Current (PCoastalC) at the surface and the southward flowing Peru-Chile Undercurrent (PCUC) (Brink et al., 1983; Toggweiler et al., 1991) in the subsurface (Figure 1A; Huyer et al., 1987; Karstensen and Ulloa, 2009). The PCUC is partly fed by the eastward flowing waters of the Equatorial Undercurrent (EUC) (Lukas, 1986; Penven, 2005; Kessler, 2006) and prevails at 50–150 m water depth (Huyer et al., 1987). The PCUC is the source of the upwelled waters with mean DSi concentrations of 15–20 μmol L–1 and a mean δ30SiDSi of +1.5 ± 0.1 ‰ (2s SEM; Ehlert et al., 2012; Supplementary Tables 1, 2; Figures 2B,G). Along the Peruvian coast between the equator and 10°S the DSi concentrations and δ30Si signatures within the PCUC remain relatively constant at 18 ± 11 μmol L–1, and +1.5 ± 0.4‰ (2SD), respectively. Further south, the DSi concentrations can increase to up to 30–40 μmol L–1, and δ30SiDSi signatures decrease slightly to +1.25 ‰ (Figures 2B,G). Overall, the subsurface water masses (50–150 m) in the offshore regions of the EEP and along the shelf of Peru are characterized by homogenous δ30SiDSi signatures of around +1.5 ± 0.3‰, but varying DSi concentrations (Beucher et al., 2008, 2011; de Souza et al., 2012a; Ehlert et al., 2012; Grasse et al., 2020; Grasse et al., under review). Therefore, the marked increase in DSi concentrations within the subsurface waters from 15 to 40 μmol L–1 (Bruland et al., 2005) along their southward flow path accompanied by nearly invariant δ30SiDSi signatures is most likely the combined result of remineralization processes in the water column and high benthic Si fluxes originating from the shelf sediments (Ehlert et al., 2012, 2016a; Franz et al., 2012).
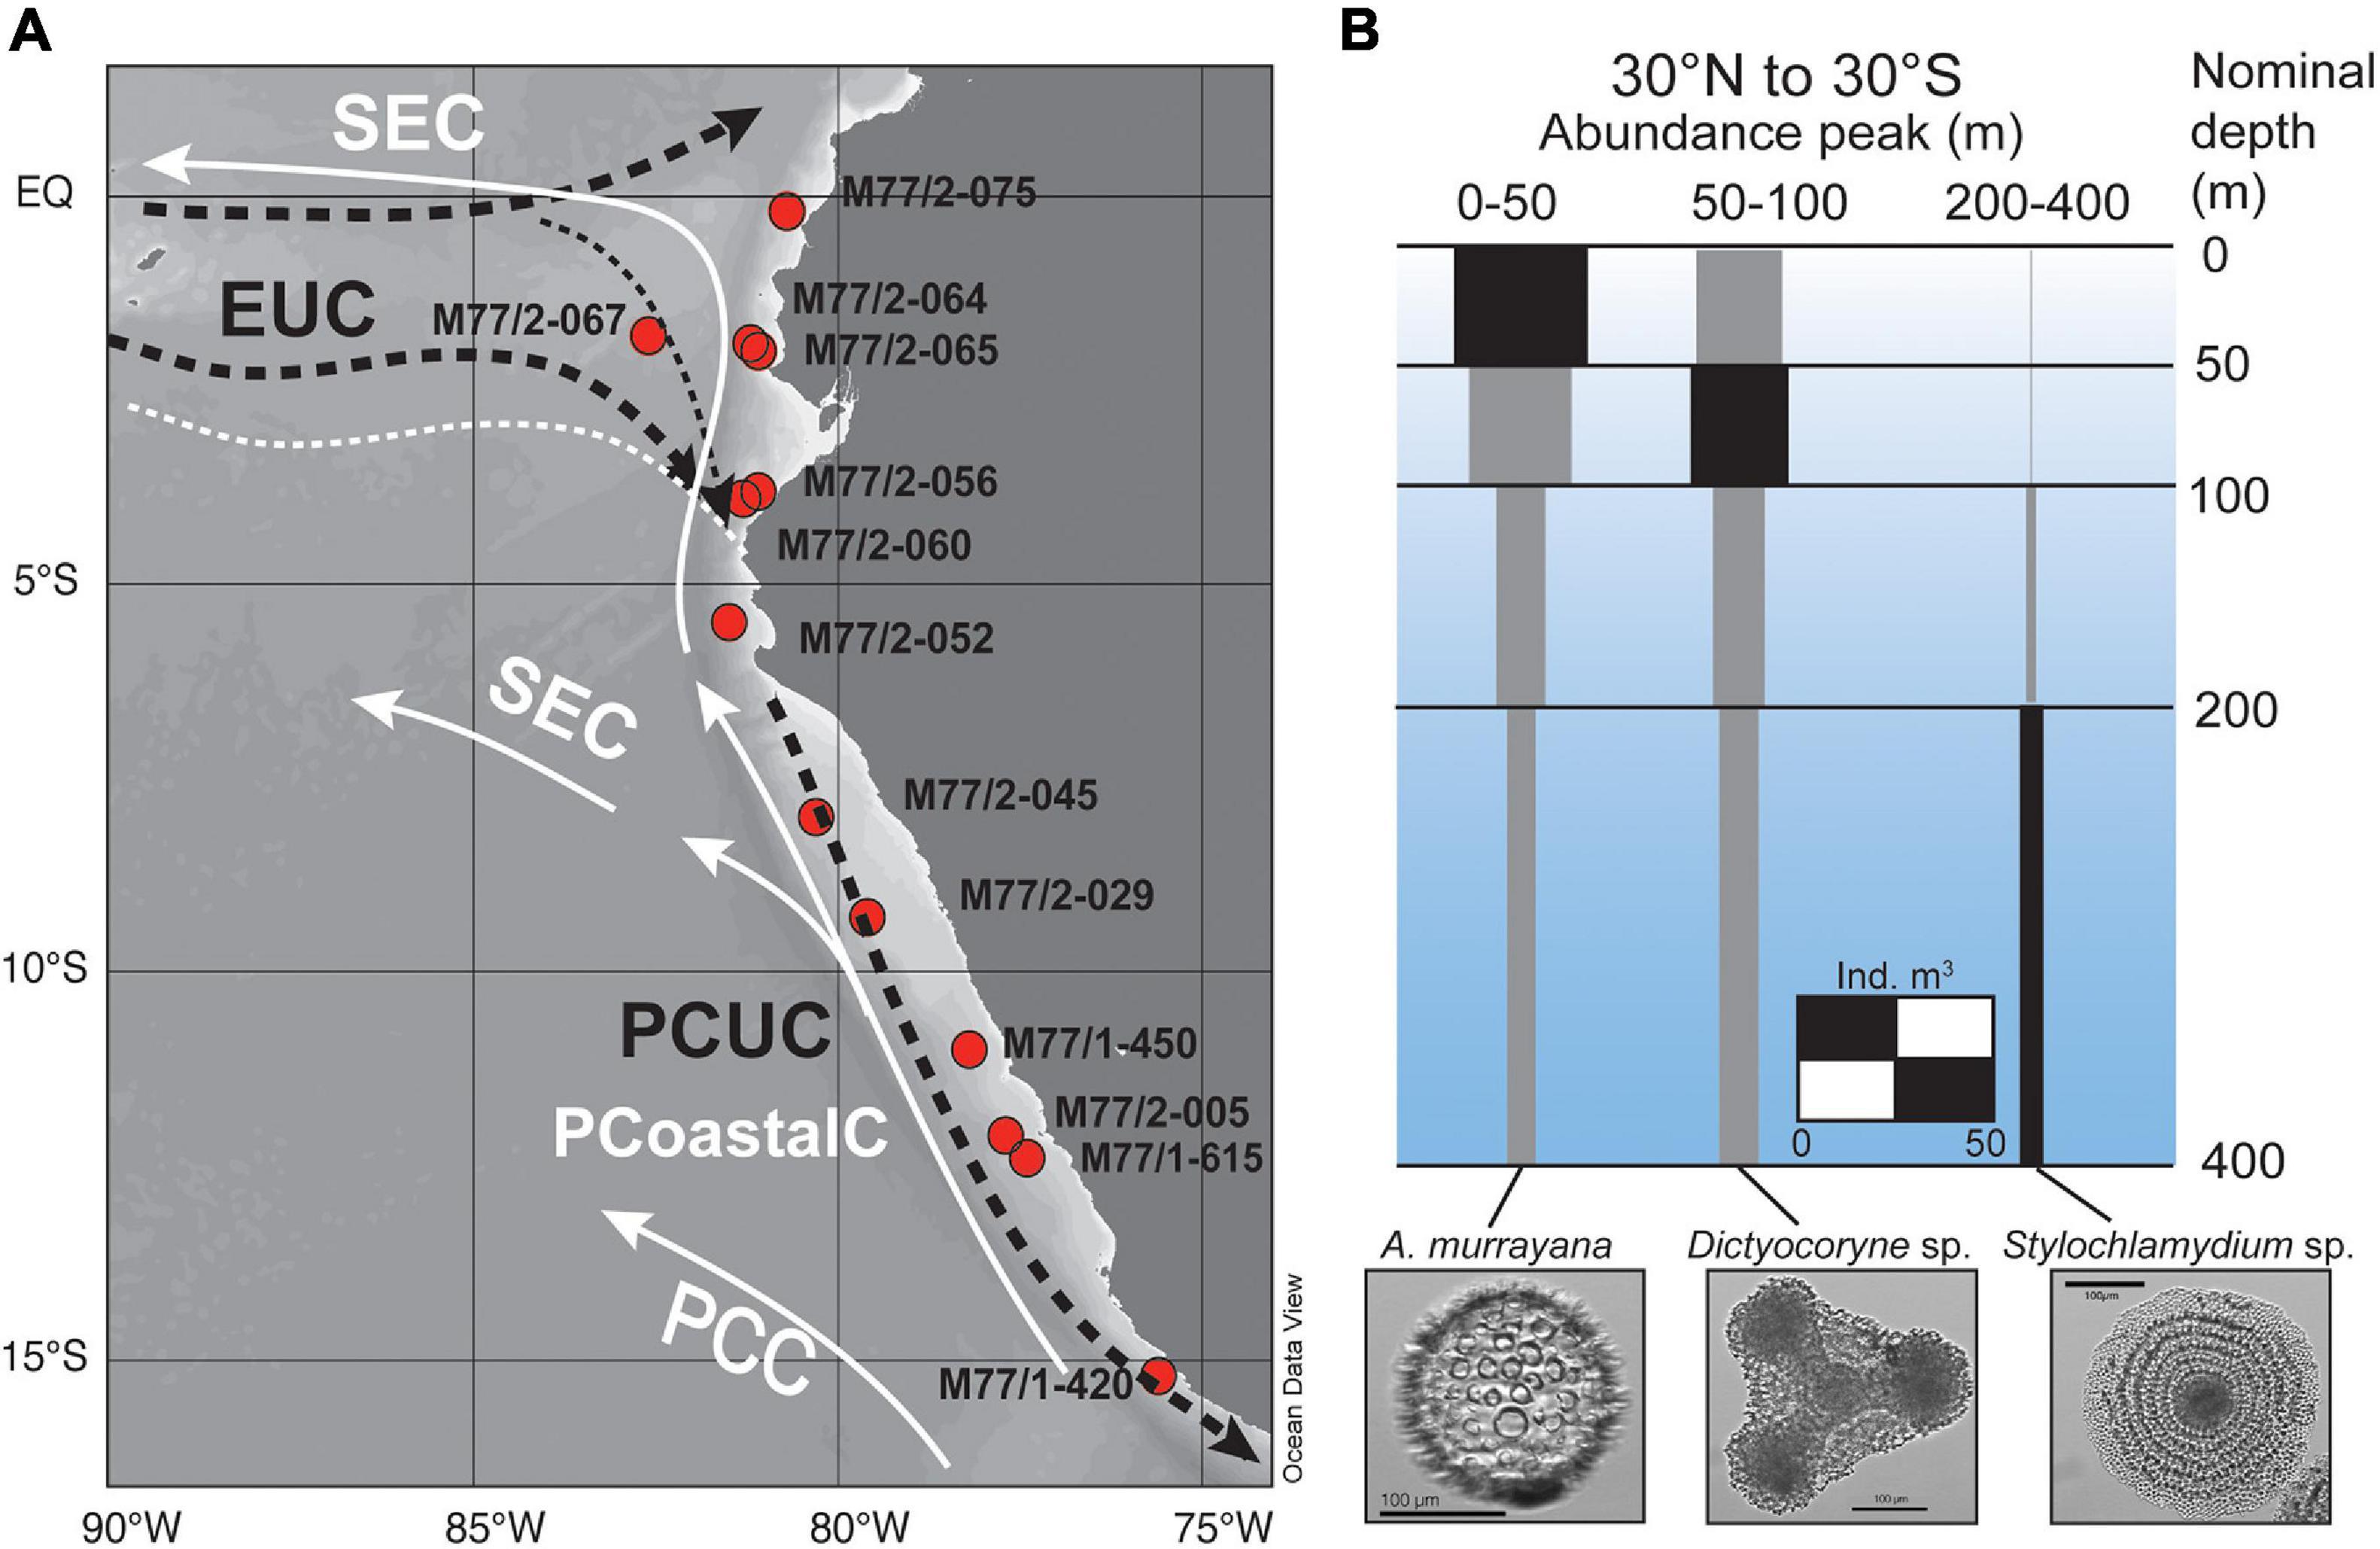
Figure 1. (A) Map of surface sediment sampling stations for radiolaria taken during cruises M77/1 and M77/2. Surface currents (white solid lines) are indicated for the equatorward flowing Peru Coastal Current (PCoastalC) and the South Equatorial Current (SEC), the main subsurface currents (indicated by dashed black lines) are the Equatorial Undercurrent (EUC) and the Peru-Chile Undercurrent (PCUC) flowing in 50–150 m water depth. (B) Global water column abundance peaks of Acrosphaera murrayana, Dictyocoryne profunda/truncatum, and Stylochlamydium venustum between 30°N and 30°S (individuals per m3; modified from Boltovskoy et al., 2010).
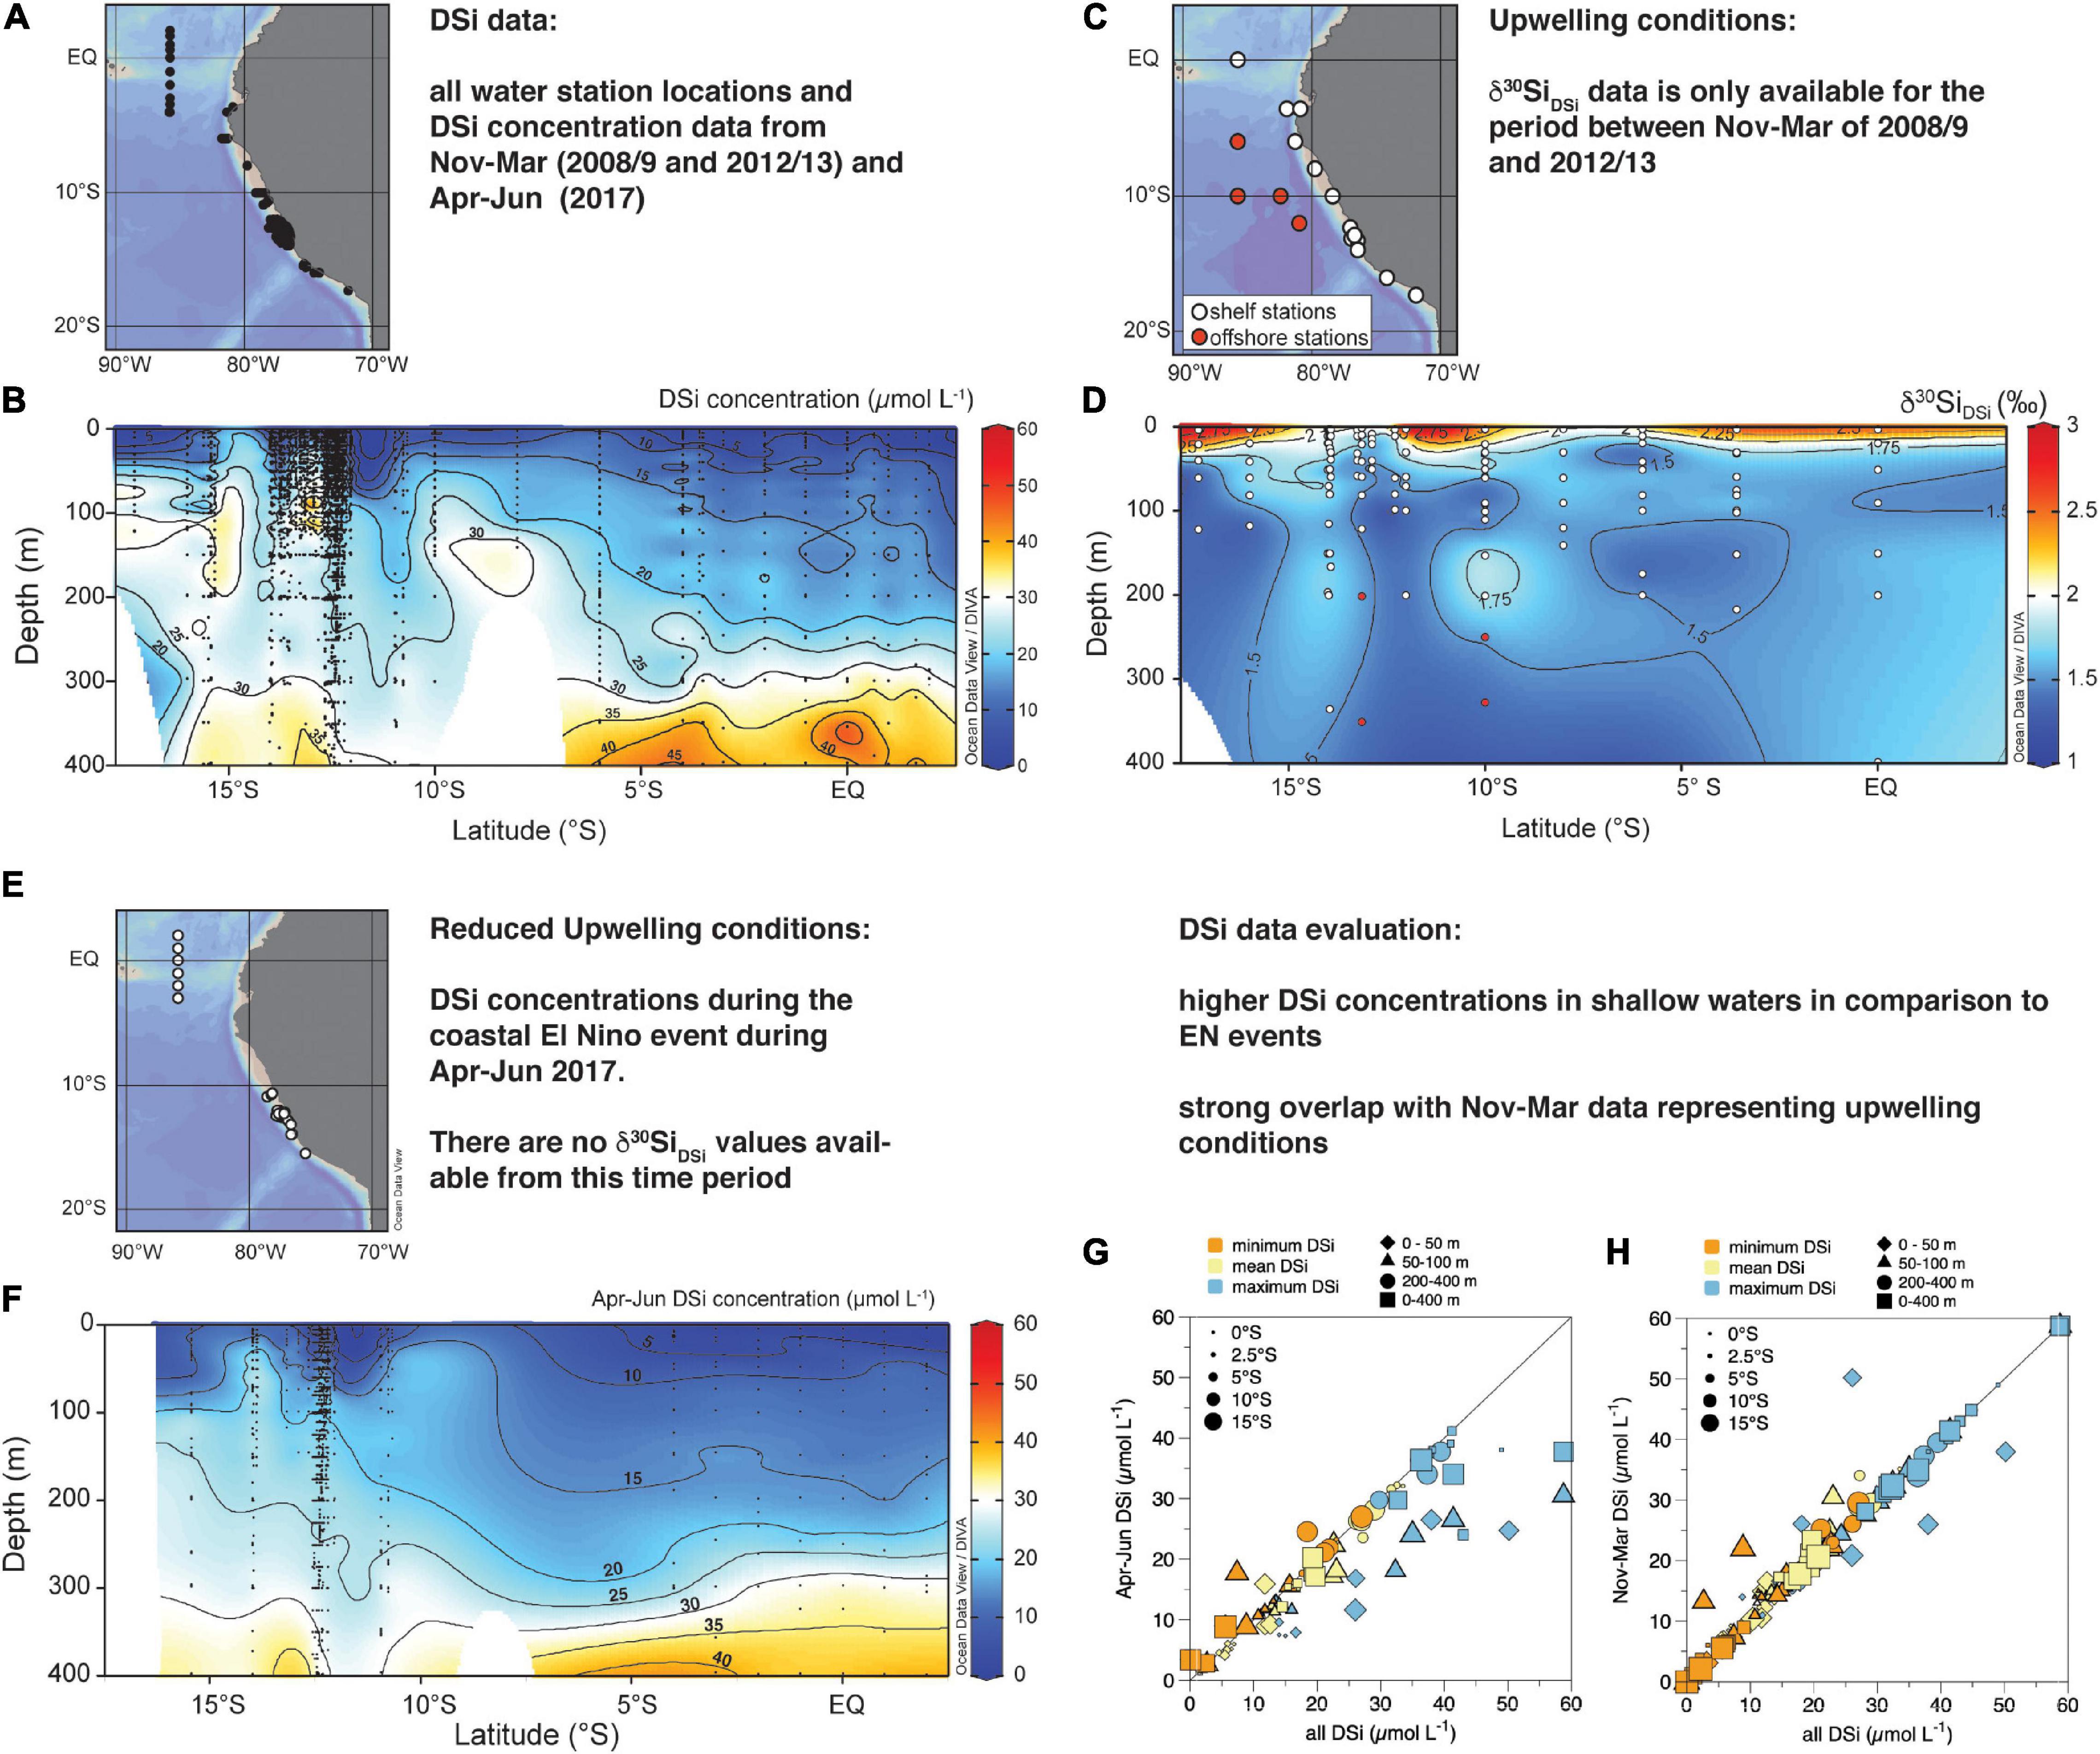
Figure 2. Water sampling locations for (A) DSi concentrations (μmol L–1) and (C) δ30Si values of DSi (δ30SiDSi) along the Peruvian coast; (B). North-South sections of mean DSi concentrations from cruises M77, M90, M93, M136, M137, and M138 for all water stations from 0–400 m water depth; (D) North-South sections of δ30SiDSi for all water column stations occupied during cruises M77 and M93, white dots indicate shelf stations, red dots indicate offshore stations; please note that offshore stations were only incorporated into data for 200–400 m due to the few data available for these depths of the shallow shelf stations (white dots); (E) Seasonal water sampling locations for DSi concentrations (μmol L–1) during cruises M136, 137, and 138 from April to June 2017 (El Niño); (F) DSi concentrations along the North-South transect during cruises M136, 137, and 138 from April to June 2017 (El Niño); Sections were plotted applying the DIVA interpolation of Ocean Data View (Schlitzer, 2020); (G) Comparison of the calculated DSi concentrations and measured Apr-June (2017) DSi concentration per degree latitude (as given in Table 2); (H) Comparison of the calculated DSi concentrations and measured Nov-Mar (2008/9 and 2012/13) DSi concentration per degree latitude; DSi concentrations are differentiated into minimum (orange), mean (yellow), and maximum (blue) and differentiated into the habitat depth of the studied radiolaria taxa of 0-50 m (diamonds), 50–100 m (triangles), 200–400 m (circles), and 0–400 m (squares). DSi concentrations are given as minimum (orange), mean and maximum; Correlations are performed for each habitat depth of 0–50 m (A,B), 50–100 m (C,D), 200–400 m (E,F), and 0–400 m (H,G). The size of the symbols indicates the latitude, with the smallest symbols representing stations close to the equator and the largest circles marking stations at 16.5°S. The black line indicates the 1:1 ratio.
On interannual time scales, the marine ecosystem off Peru can be modified substantially by local and/or remote forcing (Morales et al., 1999; Gutiérrez et al., 2008). Strong El Niño (EN) events affect circulation and water mass distribution, causing the deepening of the thermocline and the occurrence of large oxygenation events in the water column (Morales et al., 1999; Gutiérrez et al., 2008). During the EN events, a decrease in upwelling strength and enhanced stratification leads to increased in sea surface temperature, reduced nutrient availability in the surface, oxygenated subsurface waters, and decreased nitrogen loss processes off the coasts of Peru and Ecuador. At the beginning of 2017, a strong coastal El Niño took place. During this event, coastal waters off Peru showed a pronounced positive sea surface temperature anomaly of up to 4°C (Echevin et al., 2018; Garreaud, 2018), as a result of strong local alongshore wind anomalies and equatorial Kelvin waves propagating towards the Peruvian coast (Echevin et al., 2018; Peng et al., 2019). Due to a deepening of the thermocline, nutrients, such as DSi, do not upwell to the surface, causing nutrient-depleted conditions and a shift in the phytoplankton community from diatom-dominance (Blasco, 1971; Estrada and Blasco, 1985; DiTullio et al., 2005) to species such as dinoflagellates (Sanchez et al., 2000; Bach et al., 2020). During the coastal EN in 2017 remained lower in the surface ocean ranging on average from 4 to 16 μmol L–1 from north to south, with lowest DSi of 4 to 6 μmol L–1 north of 3.5°S and higher concentrations of 9.0 to 15.9 μmol L–1 between 10 and 15°S (Figure 3D). While the North-South increase in DSi concentration still persists during this season (EN 2017), the highest observed DSi concentrations only reach 26 μmol L–1 at the beginning of austral winter (Apr-Jul; Figure 2F) in comparison to 50 μmol L–1 during the normally occurring strong upwelling during austral summer (Nov-Mar; see also Supplementary Tables 1, 3). δ30Si signatures of the water masses during EN events are so far not available.
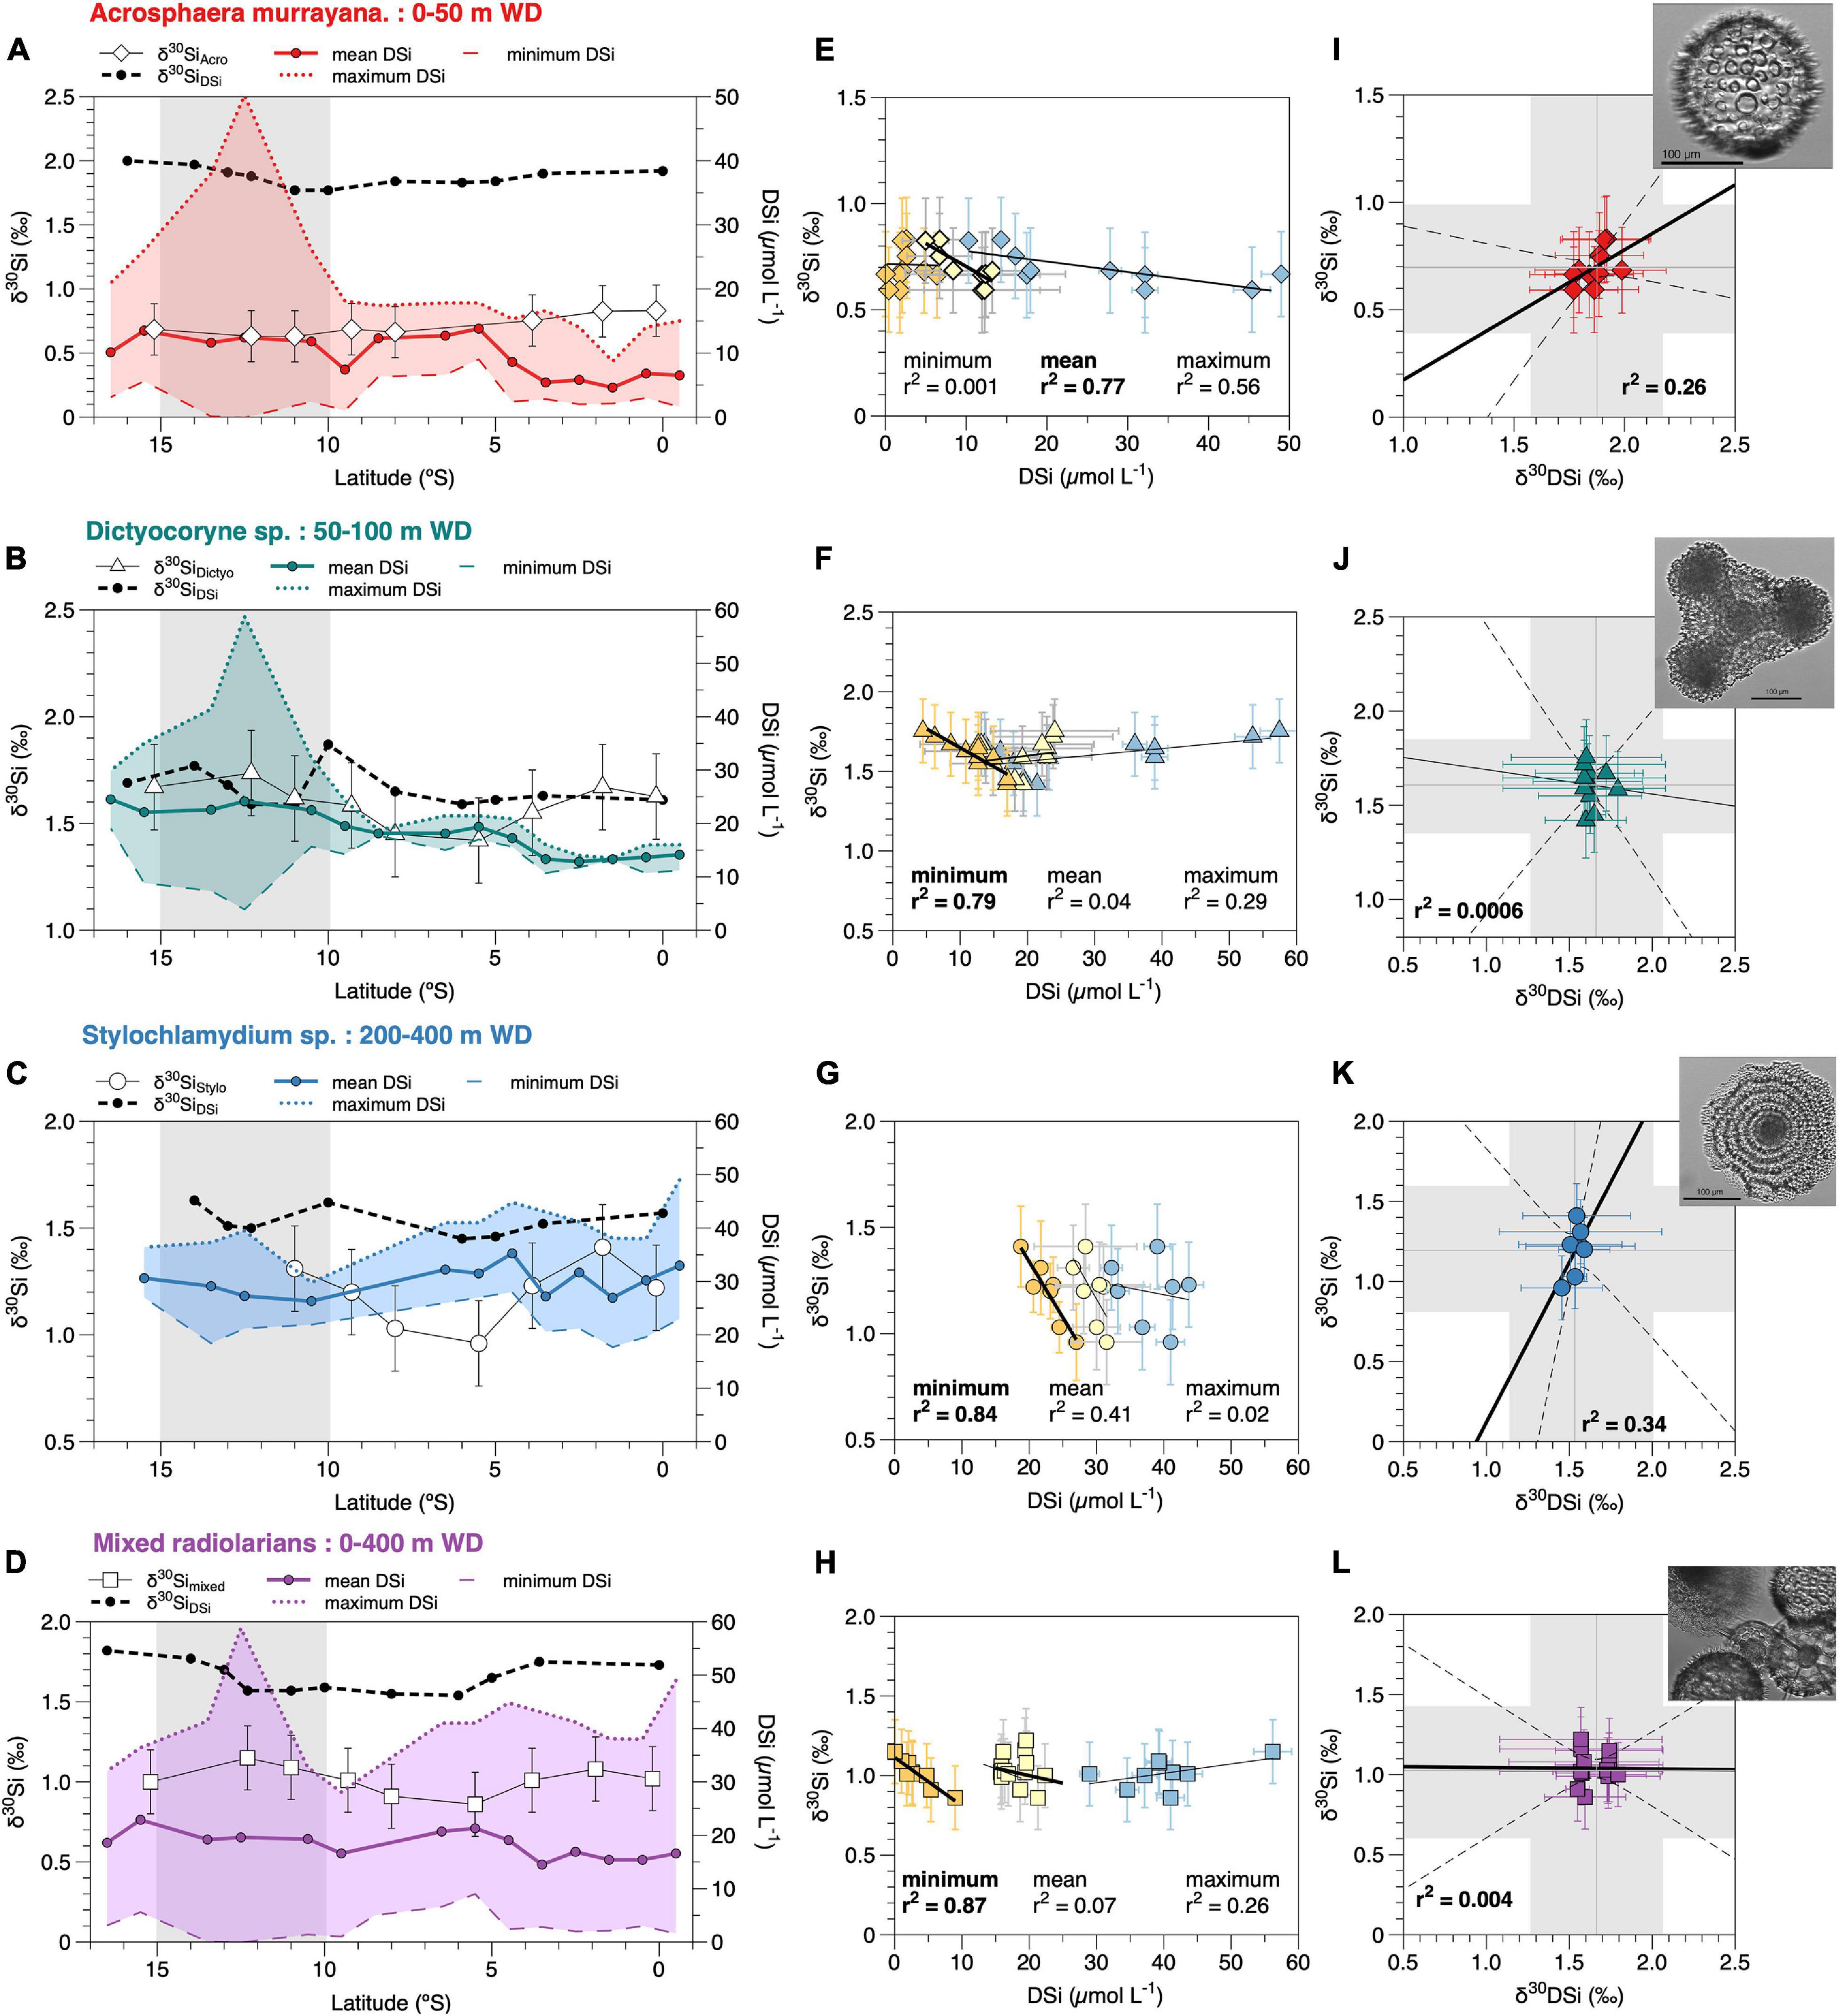
Figure 3. (A–D) δ30Si signatures of radiolaria and the DSi concentrations of their respective habitat depth over latitude – A. murrayana (diamonds) 0–50 m, Dictyocoryne sp. (triangles) 50–100 m, Stylochlamydium sp. (dots) 200–400 m, mixed radiolaria (squares) 0–400 m water depth (WD). The DSi concentrations are given as mean (solid line), maximum (dotted line), and minimum (thin dashed line) values. The δ30SiDSi signatures from the respective water depths are indicated as black dashed lines. The gray shaded area indicates the main upwelling area along the coast. (E–H) Correlation of the δ30Si of each radiolarian group with minimum (orange), mean (yellow), and maximum (blue) DSi concentrations from their habitat depths (Table 2); (I–L) Correlation of δ30SiDSi signatures from the respective water depth with the δ30Si for each radiolarian group. The gray shaded areas indicate the 2 SD error range of external reproducibility for each variable. Black solid lines indicate the linear regression, dashed lines show the confidence intervals. Pictures are representative of the respective species, as presented in Figure 1. For better readability, all statistical values for regressions are given in Table 3.
Materials and Methods
Sample Locations
Surface sediments from 14 stations along the Peruvian shelf area between the equator and 15°S were analyzed (Table 1 and Figure 1B). Sediment samples were retrieved during cruises M77/1 and M77/2 with the German RV Meteor in 2008 from 200 to 1250 m depth (Table 1) [for further information, see Ehlert et al. (2012) and Doering et al. (2016a)].
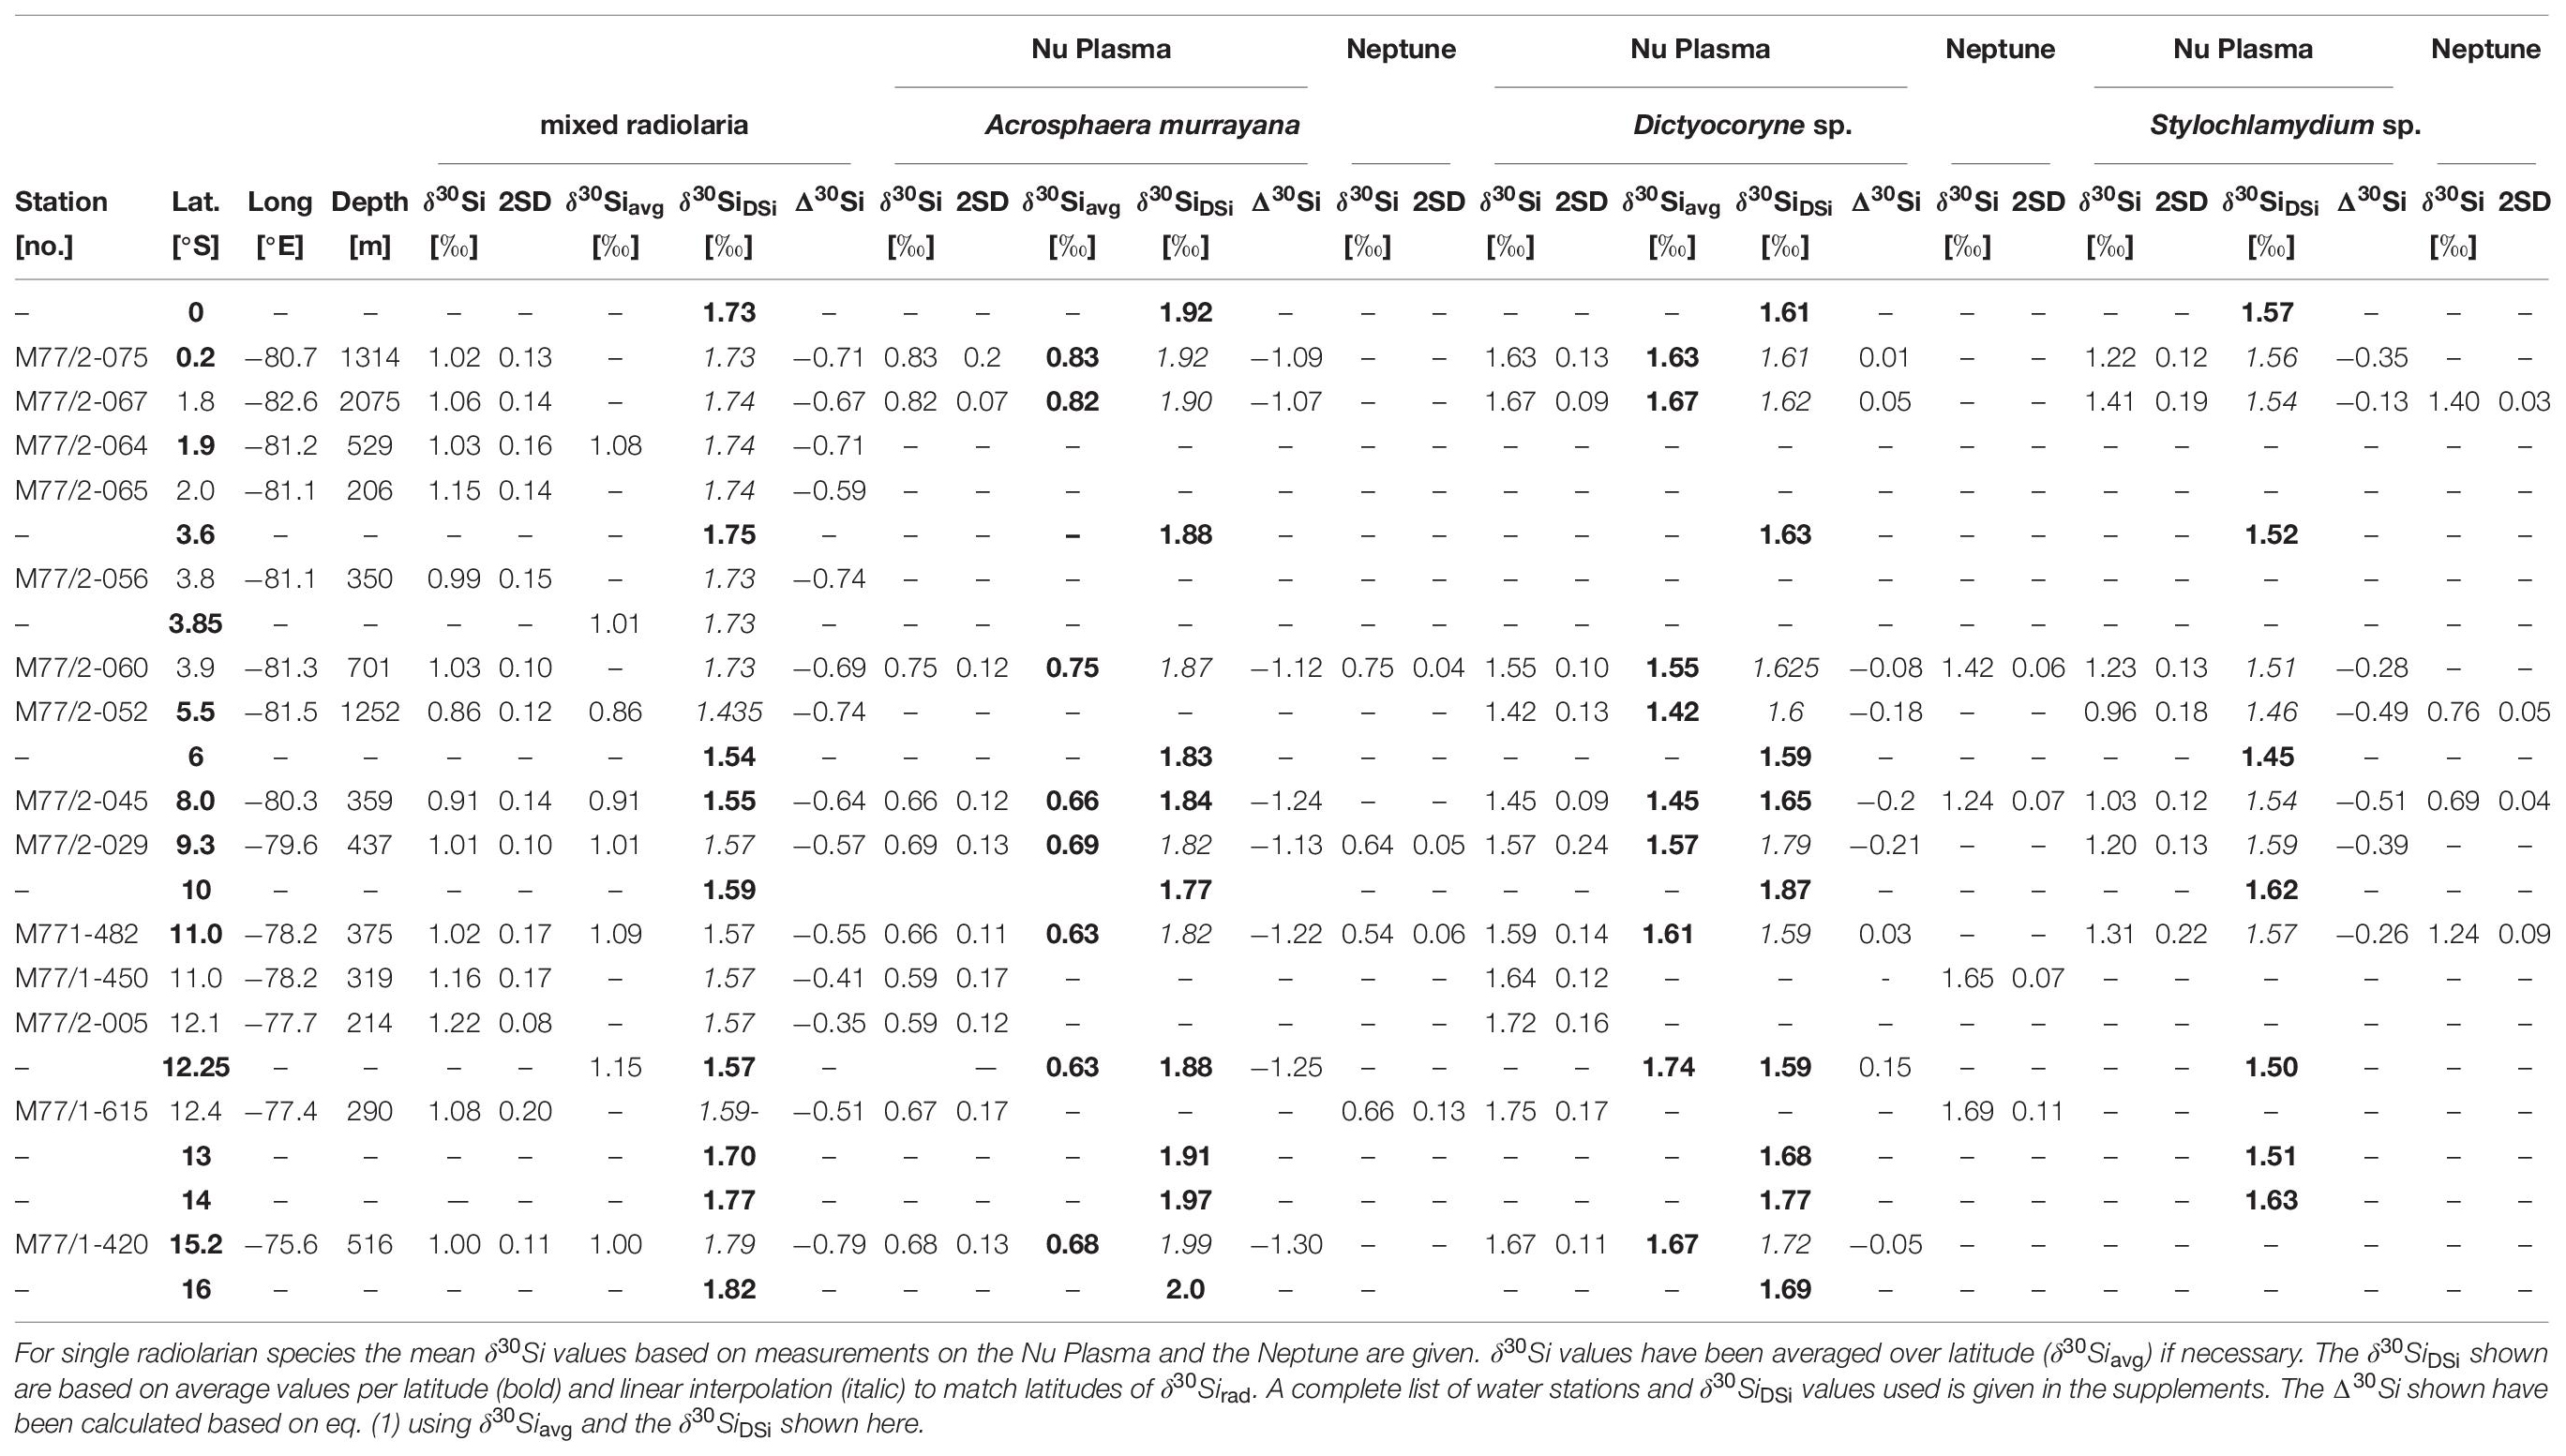
Table 1. Sampling locations of Si isotope data (δ30Si, in ‰) for mixed radiolaria, A. murrayana, Dictyocoryne sp. and Stylochlamydium sp. and δ30SiDSi values (‰).
Sample Preparation
In total, 42 radiolarian samples were analyzed for their δ30Si composition. The sample material of the upper centimeter of sediment was freeze-dried, wet-sieved through a 63 μm sieve, and the coarse fraction was further size-fractionated. From the 125–250 μm fraction, between 100 and 200 radiolarian tests were handpicked under a light microscope. Following previous studies (Hendry et al., 2014; Abelmann et al., 2015; Fontorbe et al., 2016, 2017, 2020), first, radiolarian samples were picked to represent the typical bulk radiolarian community, i.e., mixed radiolarian samples. The mixed radiolarian samples mainly contained species dwelling between 0–50 m (e.g., Spongurus sp., Tetrapyle octacantha) and 50–150 m (e.g., Lamprocyclas sp., Dicytocoryne sp.) water depth and only a few taxa dwelling between 150–500 m (e.g., Euchitonia sp., Stylochlamydium astericus; Figure 1B; Supplementary Table 4; Boltovskoy et al., 2010). Note that Acrosphaera murrayana was not included in the mixed radiolarian samples. In a second step, samples from three different taxa representing the dominant groups for the different water depths were handpicked and analyzed as well: Acrosphaera murrayana (Haeckel; Acro; 0–50 m), Dictyocoryne profunda, and Dictyocoryne truncatum group (Ehrenberg; Dictyo; 50–100 m), and Stylochlamydium sp. (Bailey; Stylo; 200–400 m). Dictyocoryne profunda and truncatum are rarely separated in the literature. Thus, we will refer to the Dictyocoryne profunda/truncatum group as Dictyocoryne sp., not differentiating between both species. Detailed species descriptions are given at the end of the main text. A list of all identified radiolarian species for six samples is given in Supplementary Table 4 of the supplement.
Sample Digestion and Silicon Isotope Analyses
All radiolarian samples received ultrasonic treatment in ethanol followed by rinsing in MilliQ water (Merck Millipore, 18.2 MΩ cm–1) before being transferred into 7 ml Savillex® PFA vials and dried down at 80°C. Subsequently, samples were dissolved in 500 μl 0.1 M NaOH (Merck, Suprapur®) at 120°C for 36 to 48 h and afterward dried down, treated with 200 μl H2O2 (Merck, Suprapur®) for 1-2 h before being dissolved again in 500 μl 0.1 M NaOH at 120°C for 36 to 48 h and diluted with 2 ml MilliQ water. Final sample solutions were neutralized with 75 μl 1 M HCl, followed by chromatographic purification with 1 ml pre-cleaned AG50W-X8 cation exchange resin (BioRad, mesh 200–400). The Si isotope ratios of the purified Si solutions were measured at 0.6 ppm using a multi-collector inductively coupled plasma mass spectrometer (MC-ICPMS, Nu Plasma, GEOMAR) via standard-sample bracketing. The Si isotope compositions are reported in δ-notation using the reference standard NBS28 in parts per thousand (δ 30Si = [(Rsample/Rstandard) - 1) ∗1000], where Rsample is the 30Si/28Si ratio of the sample and Rstandard is the 30Si/28Si ratio of the RM8546 - NBS28 silica sand standard. All δ30Si samples were run at least three times (during three or more analytical sessions) and always measured as four standard-sample brackets (i.e., four times per analytical session), which resulted in reproducibilities between 0.06‰ and 0.23‰ (2 SD, Table 1). Repeated measurements of reference materials NBS28, IRMM018, Diatomite and BigBatch gave average δ30Si values of 0.00 ± 0.23‰ (2 SD, n = 17), −1.43 ± 0.21‰ (2 SD, n = 14), 1.23 ± 0.20‰ (2 SD, n = 10) and −10.59 ± 0.26‰ (2 SD, n = 7), respectively. δ30Si values for solid standard material are in good agreement with values obtained by the inter-laboratory comparison study of Reynolds et al. (2007). Additionally, two in-house matrix standards have been measured. The radiolarian matrix standard (consisting of a mixture of ten samples) yielded an average δ30Si value of 0.95 ± 0.19‰ (2 SD, n = 17), and a diatom matrix standard (consisting of pure Ethmodiscus rex) gave −0.99 ± 0.17‰ (2 SD, n = 11). Error bars in the figures indicate the uncertainty of the external reproducibility of NBS28 (2 SD).
Twelve samples (4 samples for each taxon) were additionally measured on the Neptune Plus MC-ICP-MS (Thermo FisherTM) at the ICBM, University of Oldenburg, which allows a higher precision compared to the Nu Plasma (Table 1). Sample preparation was performed in the same way as for the Nu Plasma measurements, but samples were measured at higher Si concentrations of 0.8 ppm Si and in wet plasma mode. Additionally, samples were doped with an Mg solution at a concentration of 0.5 ppm to correct for isotope mass bias effects (for details, see Ehlert et al. (2016b). All δ30Si samples were measured three times in one session (n = 1), which resulted in internal reproducibilities between 0.03‰ and 0.13‰ (2 SD, Table 1, and Supplementary Figure 5). Measurements of the reference material between 2017 and 2019 gave average δ30Si values of 0.00 ± 0.15‰ (2 SD, n = 16, NBS28), 1.22 ± 0.15‰ (2 SD, n = 11, Diatomite), and −10.76 ± 0.27‰ (2 SD, n = 17, BigBatch). More details on the measurements are provided in the supplement.
Dissolved Silicic Acid Concentrations
The data presented in this study are based on the comparison of surface sediment samples with previously published DSi concentrations and δ30 SiDSi water column data from different stations along the Peruvian coast. All data were obtained during cruises conducted in the frame of the SFB 754 (M77, M90, M93, M136-M138) representing conditions covering the normal upwelling season (Nov-Mar, 2008-2009 and 2012-2013; M77/3: doi: 10.1594/PANGAEA.81996; M77/4: doi: 10.1594/PANGAEA.79315; M90: doi: 10.1594/PANGAEA.85794; M93: doi: 10.1594/PANGAEA.90555) as well as an El-Niño event (Apr-Jun, 2017; M136: doi: 10.1594/PANGAEA.90440; M137: doi: 10.1594/PANGAEA.90440) in the Peruvian upwelling region (see Figure 2). Analytical precision for DSi measurements obtained from replicate measurements ranged between 0.2 and 1% (1 SD). As replicate measurements are not available for all stations, we used a more conservative uncertainty of 5% for all data according to JGOFS Analytical protocols.
A high latitudinal resolution of DSi concentrations is available between 2°N and 17°S sampled under normal upwelling conditions in austral summer (Nov-Mar), while no data is available between 5°S and 10°S for the EN event in 2017 (Figure 2C). Given that there are no direct observations of the preferred seasonal or interannual occurrence of any radiolarian species from the study area, we choose to compare our radiolaria data set to this data set of DSi concentrations that represents normal to strong upwelling intensities generally observed during austral summer (Nov-Mar), while generally weaker upwelling conditions persist during austral winter. The Nov-Mar data is complemented with data from an El Niño event in Apr-Jun 2017. While the latter is not representative of the normal weaker upwelling conditions, it provides a comparison to even more extreme nutrient depletion in the surface waters to evaluate potential biases induced by the data selection. We compared the latitudinally averaged DSi concentrations for the Nov-Mar and Apr-Jun with the entire data set (Figure 3G,H). Due to the larger dataset from strong upwelling conditions, the data set used here overestimates DSi concentrations in the main upwelling region. This also holds compared to the annual data set for DSi concentrations available from the World Ocean Atlas (WOA13), which includes all nutrient data until 2013 collected in the World Ocean Database (Garcia et al., 2014).
From the entire DSi data set available (i.e., Nov-Mar 2008/9 and 2012/13, and Apr-Jun 2017), only water stations were selected that are located close to surface sediment stations used for δ30Sirad measurements (see Figure 2A for water stations and Figure 1A for surface sediment stations). All DSi data was sorted in 1°S latitude steps (i.e., 6.5°S includes all stations between 6°S and 7°S) and for all stations included in this 1° latitude grid mean, maximum and minimum DSi concentration values were calculated for the different habitat depths of the radiolarian taxa (i.e., 0–50 m, 50–100 m, 200–400 m, and 0–400 m). A list of the calculated mean values from −0.5°S to 16.5°S (in 1° latitude steps) for the following comparison and calculations is provided in Table 2. An additional overview of all mean, minimum, and maximum DSi concentrations in 1° steps for Nov-Mar, Apr-June and all DSi data for 0–50 m, 50–100 m, 200–400 m, and 0–400 m (Figure 2D) is given in Supplementary Table 3. As surface sediment stations deviate from this 1°S grid (i.e., stations at 9.3°S and 12.1°S), a simple linear regression between was used to calculate mean, minimum and maximum DSi concentrations for the exact latitudes of surface sediment stations (e.g., linear regression between 8.5°S and 9.5°S calculated to drive value for 9.3°S).
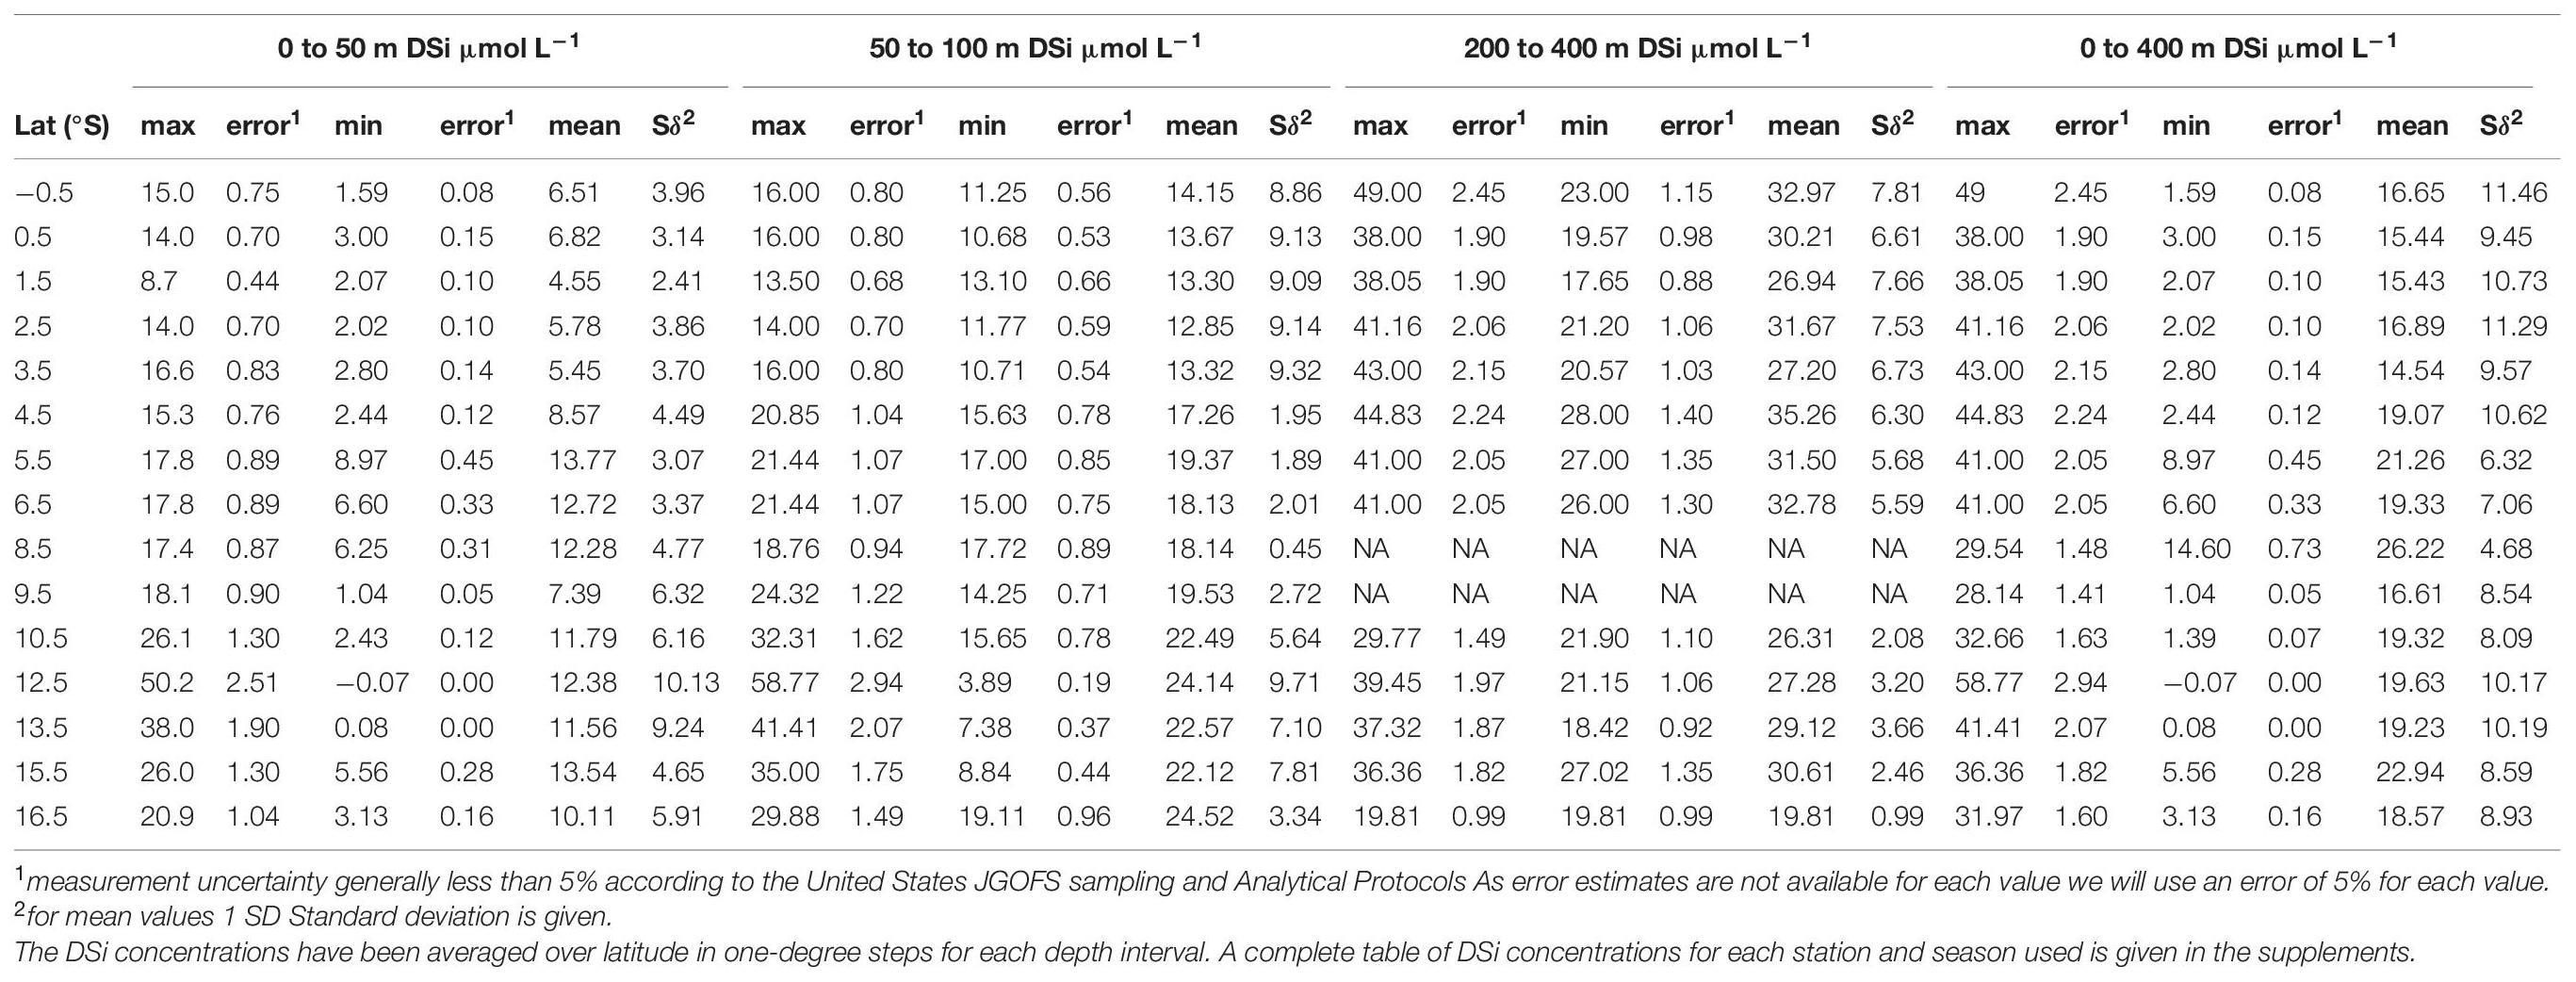
Table 2. DSi concentrations (μmol L–1) versus latitude for all water stations presented in Figure 2.
δ30SiDSi of the Water Column and Calculation of Δ30Si
The dataset of δ30SiDSi values presented here mainly consists of previously published data from cruises M77/3 and M77/4 (Ehlert et al., 2012; Grasse et al., 2013, 2016; doi: 10.1594/PANGAEA.81996) and has been complemented by new data from cruise M93 covering stations from the southern shelf between 11°S and 15°S (data is published separately in Grasse et al., under review at Frontiers in Marine Sciences, 2021; Figures 1A, 2C,D; doi: 10.1594/PANGAEA.90555). For comparison with the δ30Sirad data, all δ30SiDSi values have been grouped according to radiolarian habitat depths (0–50 m, 50–100 m, 200–400 m, and 0–400 m) and subsequently averaged for 1° latitude steps (Table 1). These values have been interpolated over latitude to match radiolarian sampling sites.
In agreement with previous studies (Abelmann et al., 2015; Fontorbe et al., 2016), we assume that radiolarians build their Si skeletons in equilibrium with the surrounding seawater. This means that DSi uptake by radiolaria does not significantly impact the DSi pool (DSi utilization approximately < 10 %). Under low substrate utilization, the isotopic difference between the substrate (DSi) and the product (BSi) is assumed to be equal to the enrichment factor ε, given by the following equation:
Statistical Analyses: Linear Regression and Deming Regression
Statistical evaluation of correlations between δ30Sirad samples with different (mean, maximum, and minimum) DSi concentrations was performed by ordinary linear regression and Deming regression. The linear regressions model tests the null hypothesis that the independent variable has no correlation with the dependent variable. If the p-value is less than the significance level (0.05 or 5%), the data provide sufficient evidence to reject the null hypothesis and, thus, the regression model is reliable (statistically significant). Significant linear regressions with the highest correlation (r2) are indicated in Figures 3E–H). Correlations between DSi concentrations and Δ30Si of radiolaria have only been performed for DSi concentrations that resulted in the best fits for each radiolarian taxon or group.
Deming regressions have been estimated for the best-fitted DSi concentrations and δ30Sirad and Δ30Si indicated by linear regression. The Deming regression model differs from the linear regression as it accounts for the errors in observations on both the x and the y variable. Error estimations are based on the 2 SD of repeated sample measurements for δ30Sirad values, the propagated error of Δ30Si, based on the 5% uncertainty considered for absolute DSi concentrations and based on the 1 SD for mean DSi concentrations. Deming regressions were performed using the cran ‘deming’ package in ‘R’ (R Core Team, 2018). Deming regressions are generally thought to be the least affected by biases (i.e., range of measurements, imprecision profiles, or incorrect error estimates; Haeckel et al., 2013; Wu and Yu, 2018). The ‘R’ script, as well as the data tables for calculations of linear and Deming regressions, can be found in the supplements (Supplementary Text 6, Supplementary Tables 6.1, 6.2).
Results
Silicon Isotope Signatures and DSi Concentrations
The analyzed δ30Si values of all radiolarian samples range from +0.59‰ to +0.83‰ for A. murrayana (Neptune: +0.54‰ to +0.75‰), from +1.42‰ to +1.75‰ for Dictyocoryne sp. (Neptune:+1.24‰ to +1.69‰), from +0.95‰ to +1.41‰ for Stylochlamydium sp. (Neptune: +0.7‰ to +1.4‰) and from +0.82‰ to +1.22‰ for mixed radiolarian samples (Figure 3 and Table 1).
The δ30Si values measured on the Neptune and the Nu Plasma are identical within the external reproducibility of the measurements (0.23‰ and 0.15‰, 2 SD) (for further details, see Supplementary Material 5). To compare δ30Sirad with DSi concentrations, we only use data measured on the Nu Plasma for consistency. The DSi concentrations for the different habitat depths are given as mean, minimum, and maximum for latitudes along the shelf and offshore stations close to the equator. DSi concentrations are highest in deeper waters (300–400 m), reaching up to 60 μmol L–1, and lowest at the surface (upper 10 m) where concentrations between 0 and 5 μmol L–1 prevail. In the main upwelling region (10°S to 15°S), high DSi concentrations of up to 50 μmol L–1 are reached in surface waters during recent upwelling events (Figure 2B).
Strong seasonal upwelling occurs during Nov-Mar (within the available data set), causing an increase in DSi concentration of up to 60 μmol L–1 reaching surface waters between 11°S and 16°S, but also increases DSi concentrations to up to 30 μmol L–1 in 50 to 300 m water depth between 8°S and 10°S. In contrast, during intra-seasonally occurring El Niño events, such as the coastal El Niño observed during Apr-Jun 2017 (Figure 2F), DSi was generally more depleted in the surface waters, ranging between 1.5 and 10 μmol L–1, but occasionally still reached values of up to 25 μmol L–1 in the upper 50 m and 18 μmol L–1 in the upper 10 m between 12°S and 14°S.
A. murrayana (Surface-Dwelling, 0–50 m)
The δ30SiAcro values show a decreasing trend from +0.83‰ at 0.2°S to +0.59‰ at 12°S (Figure 3A, white diamonds). The mean DSi concentrations at 0 to 50 m water depth range between 4.5 and 13.8 μmol L–1, concentrations are lowest between 4.5 and 6.9 μmol L–1 in the north between the equator and 4.5°S and increase to up to 13.8 μmol L–1 between 5.5°S and 16.5°S (Figures 2B, 3A and Table 2). The maximum DSi concentrations indicate a consistent southward increase as well with lowest concentrations of 9 to 18 μmol L–1 between the equator and 10°S, followed by a marked increase to up to 50 μmol L–1 at 12°S in the main upwelling area. Concentrations remain high at 26 μmol L–1 further south at 16.5°S. The minimum DSi concentrations are unaffected by upwelling intensity and remain between 0 and 13 μmol L–1, with highest concentrations between 5°S and 9°S and at 15.5°S. Seasonal DSi concentrations are similar in regard to minimum and mean concentrations per latitude in different years. However, maximum DSi concentrations are highest during upwelling events, thus overestimating values in comparison to non-upwelling seasons/El Nino conditions.
Dictyocoryne sp. (Surface to Subsurface Dwelling, 50–100 m)
The δ30SiDictyo are on average +1.61 ± 0.20‰. Over latitude, the δ30SiDictyo values are highest between the equator and 2°S and between 11°S and 15°S, reaching values between +1.60‰ and +1.75‰ and decrease to +1.42‰ between 5°S and 10°S. Over latitude, the δ30SiDictyo values are highest between the equator and 2°S and between 11°S and 15°S, reaching values between +1.60‰ and +1.75‰ and decrease to +1.42‰ between 5°S and 10°S (Figure 3B, white triangles). Mean DSi concentrations remain close to 13 μmol L–1 between 0°S and 3.8°S before increasing to ∼18 μmol L–1 between 4°S and 10°S and reaching the highest values of 23 μmol L–1 further south. The maximum DSi concentrations show a similar southward increase; however, maximum values between 10°S and 17°S can be as high as 59 μmol L–1 caused by coastal upwelling. In contrast, minimum DSi concentrations only show only a slight increase in concentrations from 11 to 18 μmol L–1 between the equator and 8°S before values decrease to 3 μmol L–1 at 12°S and 17°S.
Stylochlamydium sp. (Subsurface to Intermediate Waters, 200–400 m)
For comparison of δ30SiStylo with DSi concentrations and δ30SiDSi signatures of 200–400 m water depth, data from offshore stations (M77 stations: 004, 007, 117, 134 and 93; Grasse et al., 2013; Figure 2C, red dots) had to be included for calculations of mean values per latitude given that the shelf water stations only reached a maximum depth of about 200 m. The δ30SiStylo are on average +1.19 ± 0.31 ‰ and indicate the highest variability of all radiolarian taxa investigated here. Over latitude, the δ30SiStylo are highest with values of + 1.17‰ to +1.48‰ between 0°S and 3.4°S and +1.26‰ to +1.38‰ between 9°S and 11°S but decrease to +0.95‰ between 5°S and 8°S. Over latitude, the δ30SiStylo are highest with values of +1.17‰ to +1.48‰ between 0°S and 3.4°S and +1.26 h to +1.38‰ between 9°S and 11°S but decrease to +0.95‰ between 5°S and 8°S (Figure 3C, white dots). The mean DSi concentrations range between 26 and 36 μmol L–1 reaching the highest values at the equator, between 5.5°S and 8.5°S and at 15.5°S. Maximum DSi concentrations show a southward decrease from 49 μmol L–1 to 36 μmol L–1 at 15.5°S, only at 10.5°S and 16.5°S values are as low as 30 and 20 μmol L–1. Minimum DSi concentrations range between 18 and 28 μmol L–1 and remain close to 20 μmol L–1 throughout the transect, and highest values of 26 to 28 μmol L–1 are observed at 5.5°S to 6.5°S and 15.5°S.
Mixed Radiolarian Samples (Integrated Surface to Intermediate Waters, 0–400 m)
δ30Simixed are on average at +1.04 ± 0.19‰, over latitude highest δ30Simixed values of +1.15‰ are observed between 0.2°S and 2°S, and between 11°S and 13°S. Between 3°S to 9°S and further south, the δ30Simixed values are all lower than +1‰ before slightly increasing up to 1.22‰ at 12°S. The mean DSi concentrations show little variability and only slightly increase from 18 μmol L–1 at the equator over 20 μmol L–1 at 4.5°S to 25 μmol L–1 at 15.5°S. Maximum DSi concentrations slightly decrease from 49 μmol L–1 at the equator towards 28 μmol L–1 at 9.5°S and show peak values of 59 μmol L–1 at 12.5°S before decreasing to 32 μmol L–1 at 16.5°S. Minimum DSi concentrations range between 0 and 12 μmol L–1, with highest values of 8 to 12.2 μmol L–1 only occurring between 4.5°S and 8.5°S.
Correlation of DSi Concentration and δ30Sirad and Δ30Sirad:
Linear Regressions
For A. murrayana, the linear regression of average δ30SiAcro (see Table 1) with DSi concentrations shows a significant negative relationship with mean DSi concentrations of surface waters (0–50 m; r2 = 0.766, p < 0.05; Figure 3I). Similarly, maximum DSi concentrations indicate a significant negative correlation (r2 = 0.57, p < 0.05). However, δ30SiAcro signatures do not correlate with minimum DSi concentrations (r2 = 0.001, p = 0.9; Figure 3E and Table 3).
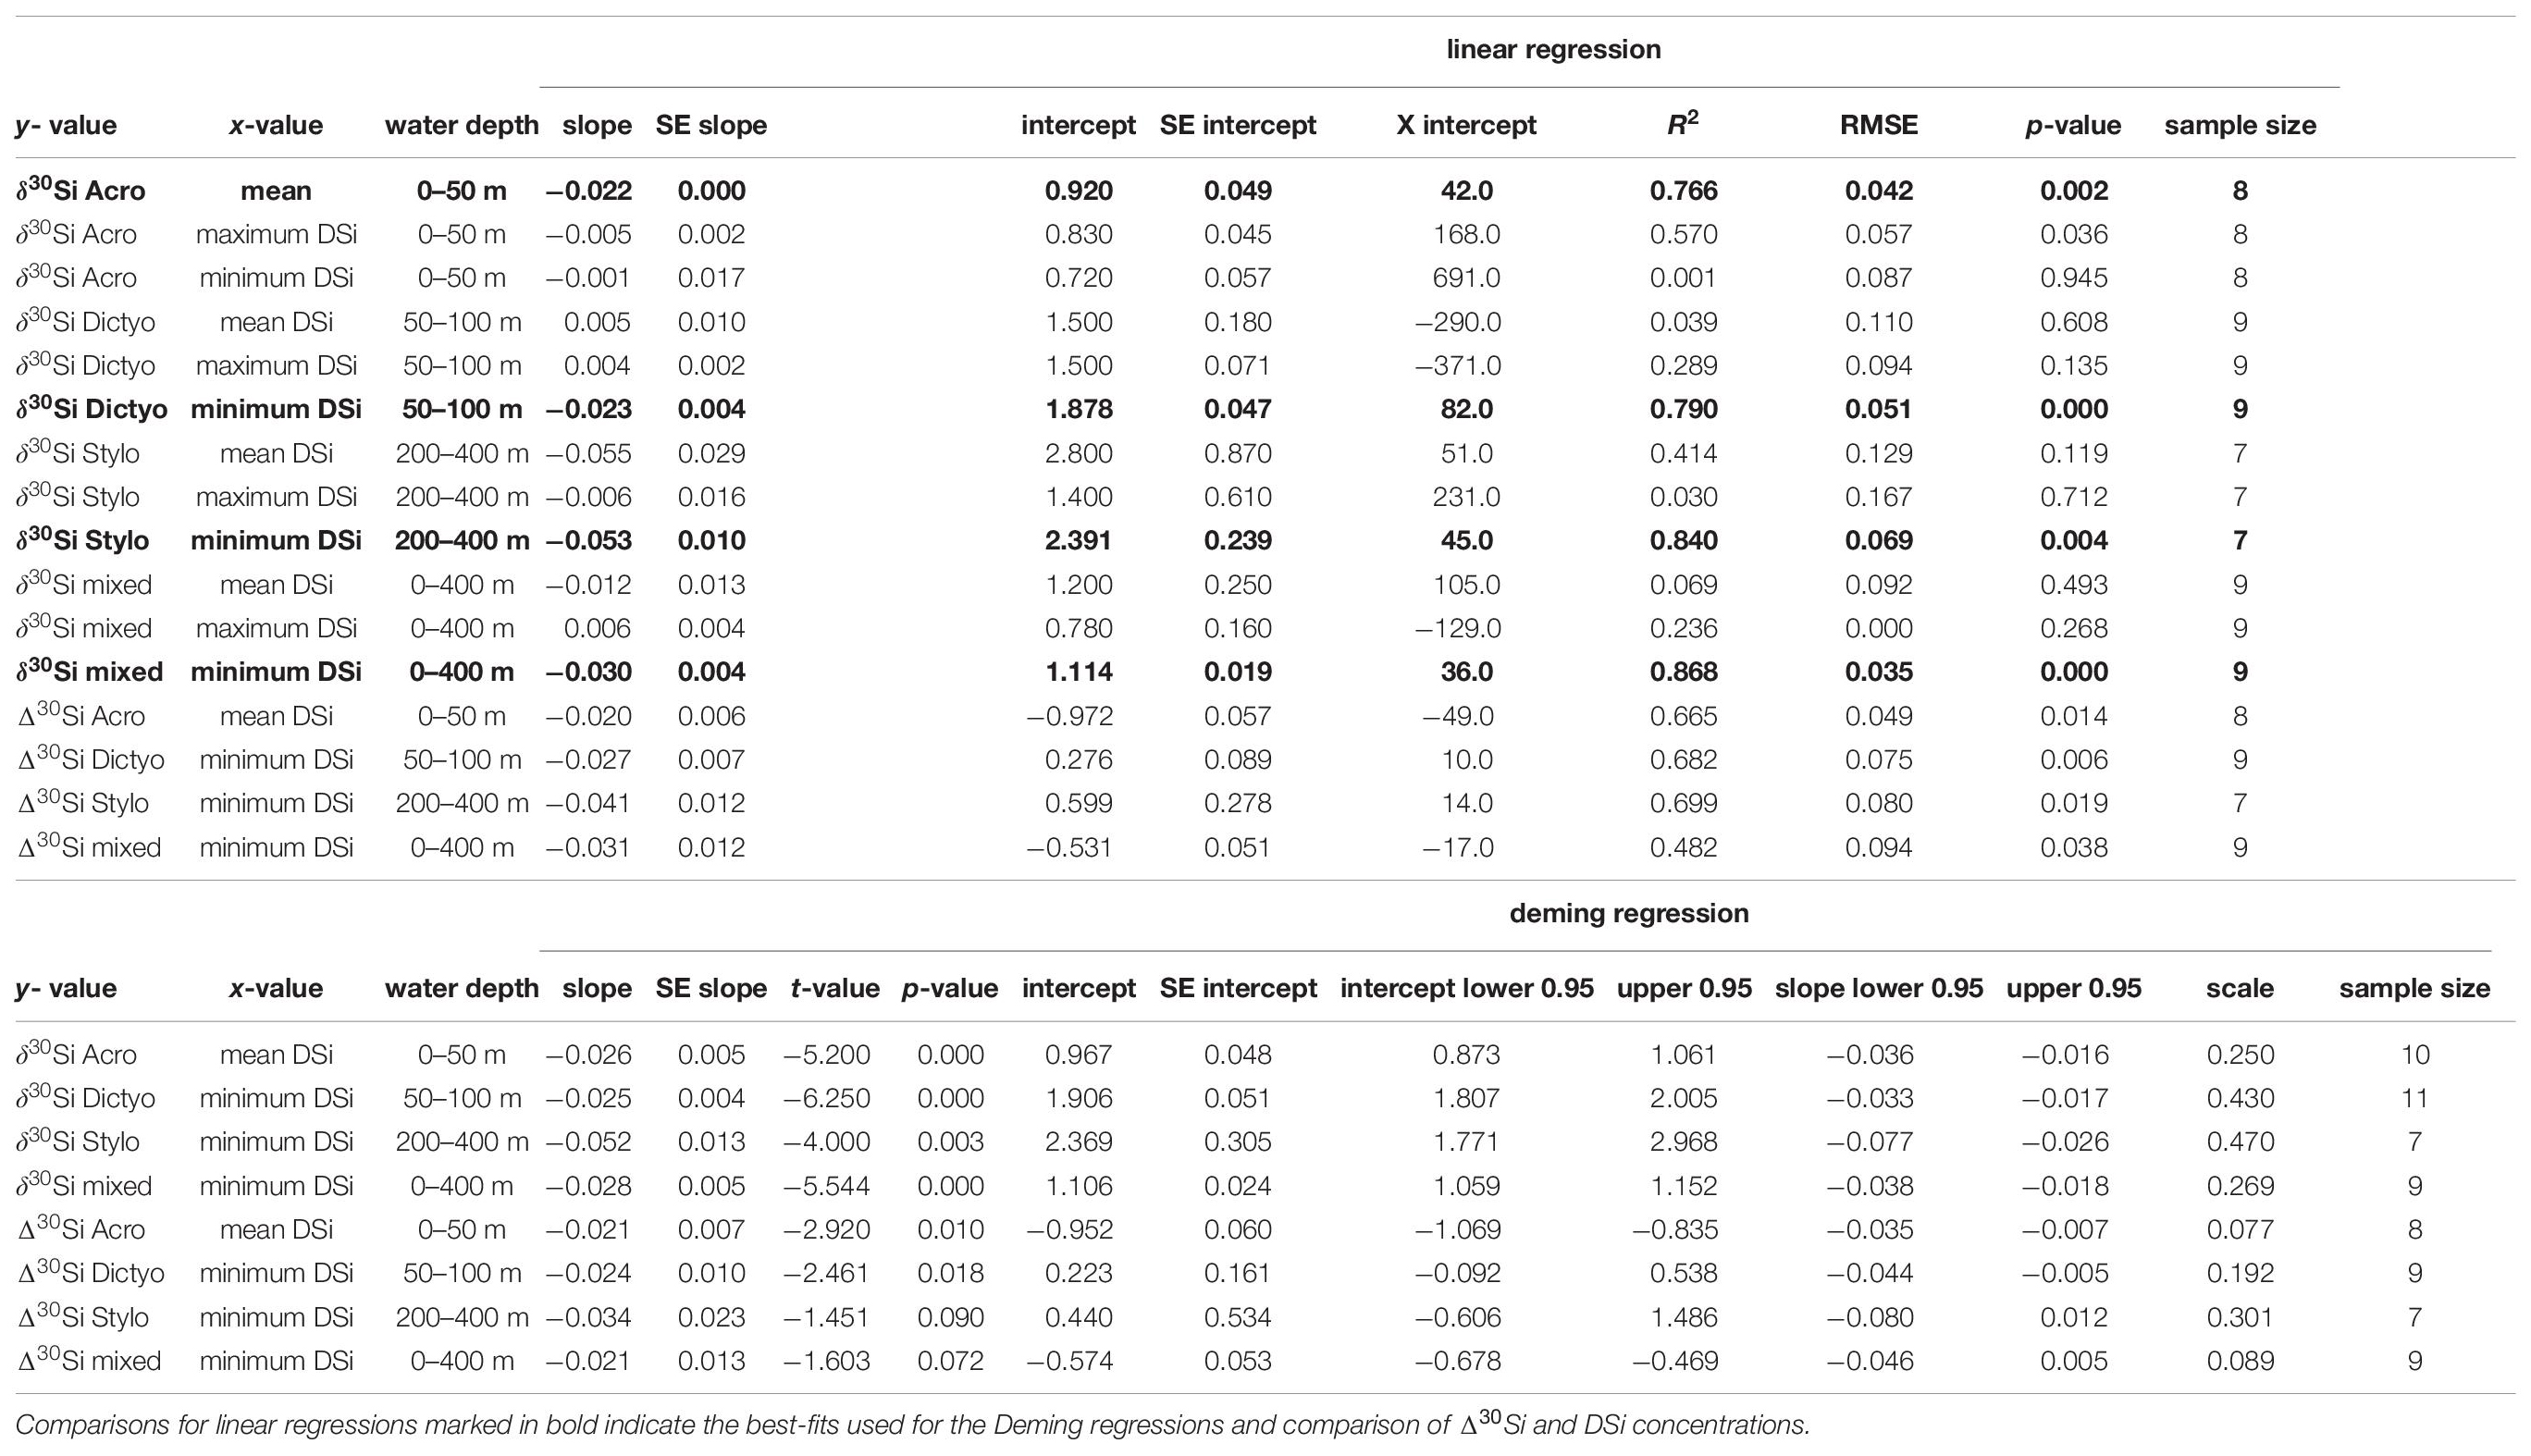
Table 3. Comparison of linear regression and Deming regression results for the different radiolaria species and their respective δ30Si and Δ30Si with different DSi concentrations of Peru.
For Dictyocoryne sp., we observe a negative correlation of average δ30SiDictyo with minimum DSi concentrations (50–100 m; r2 = 0.79, p < 0.01; Figure 3J) but no significant positive correlation of δ30SiDictyo with mean (r2 = 0.04, p = 0.6) and maximum (r2 = 0.29, p = 0.13) DSi concentrations (Figure 3F and Table 3).
For Stylochlamydium sp. linear regression of δ30SiStylo with minimum DSi concentrations show a significant negative correlation (200–400 m; r2 = 0.84, p < 0.05; Figure 3K) but no significant correlation with mean (r2 = 0.41, p = 0.12) and maximum (r2 = 0.03, p = 0.7) DSi concentrations (Figure 3G and Table 3).
For mixed radiolaria the linear regression of average δ30Simixed with minimum DSi concentration show a significant negative correlation (0–400 m; r2 = 0.87, p < 0.01; Figure 3L) but is not significant for mean DSi concentrations (r2 = 0.07, p = 0.5), and maximum DSi concentrations result in a non-significant positive relationship (r2 = 0.24, p = 0.27; Figure 3H and Table 3).
Deming Regressions
For our data comparison, the linear fits obtained from Deming regressions are generally similar in intercept and slope compared to fits obtained by linear regression for estimates based on δ30Si and Δ30Si (see Table 3). Differences in the mean values for intercepts and slopes range between 0.008 and 0.491 and between 0.001 and 0.029. The largest difference is observed for the correlation of Δ30Si of mixed radiolaria and minimum DSi concentrations, with a considerably flatter slope indicated by the Deming fit. As both the linear and Deming regression model yield very similar results, the model choices is not critical in this case. However, we will refer to the equations based on the Deming fit throughout the discussion.
For all Deming regressions, p-values were calculated to test if the slope is significantly different from zero (i.e., null hypothesis = slope is zero). All Deming regressions for δ30Sirad correlated to DSi concentrations indicate a significant relationship (p < 0.05). For Δ30Sirad, Deming regressions are only significant in cases of Δ30SiAcro and Δ30SiDicyto [(p < 0.05), but not for Δ30SiStylo and Δ30Simixed (p = 0.09 and p = 0.07; Table 3].
Apparent Si Isotope Fractionation
By applying equation (1), we arrive at mean apparent fractionation factors (Δ30Si ∼ε = enrichment factor) of −1.18 ± 0.17‰ for δ 30SiAcro, −0.05 ± 0.25‰ for δ30SiDictyo, −0.34 ± 0.27‰ for δ30SiStylo and −0.62 ± 0.26‰ for δ30Simixed (Table 1 and Figure 4B). Except for Dictyocoryne sp., the Δ30Si values agree well with the values observed in a previous study (Abelmann et al., 2015), ranging between −0.54 and −0.91‰.
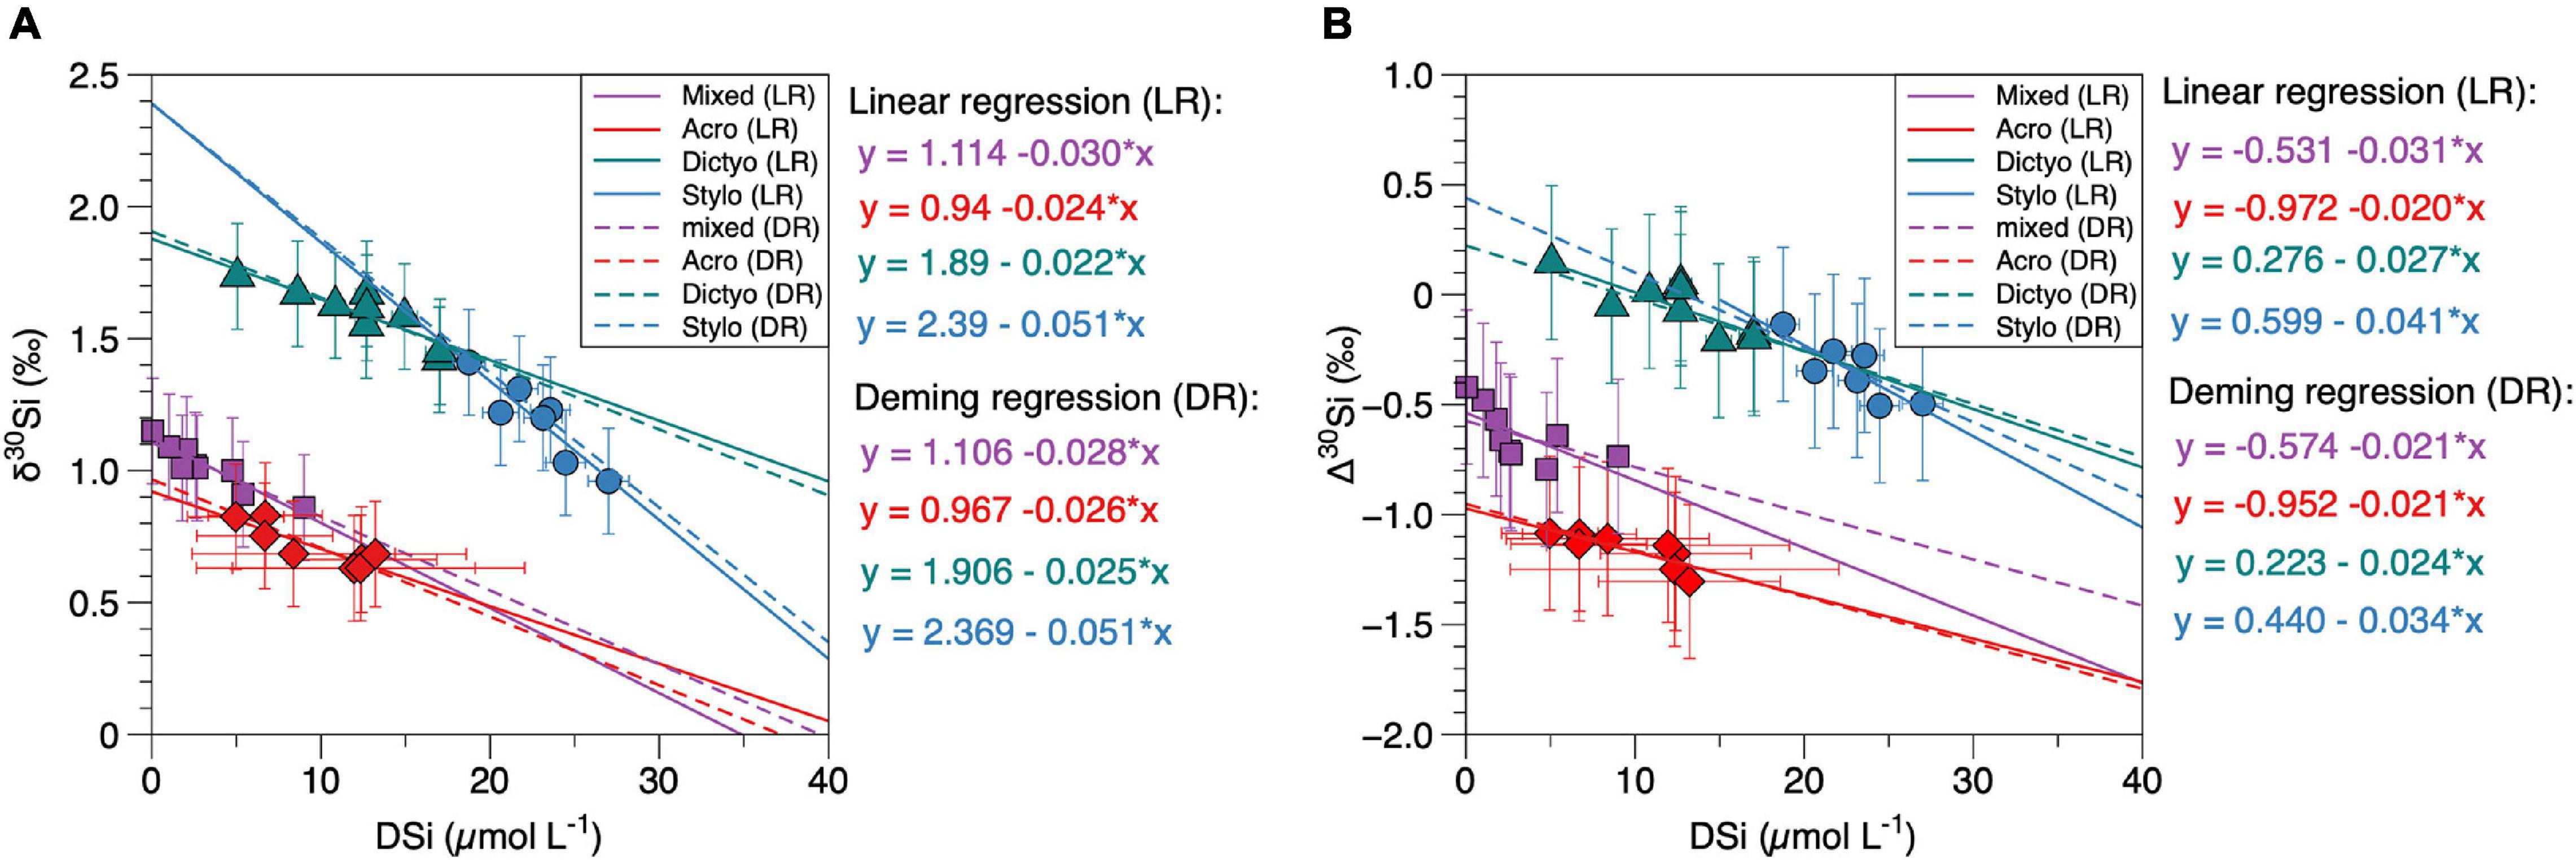
Figure 4. (A,B) δ30Si and Δ30Si values of radiolarian groups (δ30Sirad) compared to DSi concentrations (same as marked in bold in Figures 3E–H and in Table 3). Colors refer to different radiolarian taxa (red: A. murrayana, green: Dictyocoryne sp., blue: Stylochlamydium sp., purple: mixed radiolaria). Colored lines indicate linear regressions for each group, dashed lines indicate the Deming regressions. Error bars indicate the external reproducibility in (A), in (B), the propagated error is given for values on the y-axis. For better readability, all statistical values for regressions are given in Table 3.
Discussion
The new δ30Sirad data of different radiolarian taxa presented here reveal values ranging from +0.6‰ to +1.8‰ and are thus in the range of previously published data from surface sediments (+0.7‰ to +1.3‰; Abelmann et al., 2015) and sediment cores (+0.3‰ to +2.0‰; Hendry et al., 2014; Abelmann et al., 2015; Fontorbe et al., 2016, 2017, 2020). However, our results show systematic isotopic differences between the mean δ30Si signatures of the different radiolaria taxa of up to 0.9‰ (mean δ30SiAcro = +0.7‰; mean δ30SiDictyo = +1.6‰). The differences observed in the δ30Sirad of the taxa further result in substantially different enrichment factors between radiolaria and their surrounding seawater, with Δ30Si for all taxa ranging between −0.1‰ and −0.8 ‰. When correlating the δ30Si of all radiolarian taxa with DSi concentrations (mean or minimum values for the respective water depth, according to Figures 3E–H), there is no consistent best fit for all radiolarian signatures (Figure 4A).
Environmental Adaptation of Radiolaria and Their Association With DSi and δ30SiDSi in the Water Column
Radiolaria are assumed to fractionate Si isotopes depending on the DSi concentration of the surrounding seawater. Therefore, δ30Si of radiolaria can be used as an archive to reconstruct past DSi concentrations. However, very little is known about the Si isotope fractionation in radiolaria. This is due to the lack of information on environmental conditions of living radiolaria and difficulties in cultivation that have so far prevented in situ experiments. It was shown that the availability of DSi is a prerequisite, but their global distribution is thought to be affected by several variables (e.g., temperature, salinity, nutrients, and Chl a) and often associated with specific water masses (Kling and Boltovskoy, 1995; Abelmann and Gowing, 1996; Ikenoue et al., 2015). Knowledge on the occurrences of radiolarian taxa for the Peruvian coastal upwelling region is derived primarily from micropaleontological studies of the sediments (Molina-Cruz, 1977; Nigrini and Caulet, 1992). Accordingly, the relationship of occurrences with different water depth and upwelling conditions is only inferred from investigations of past radiolarian assemblages as follows. Among the three selected taxa investigated here, Acrosphaera murrayana is the only species/taxon associated with cold waters or coastal upwelling conditions (Molina-Cruz, 1977; Nigrini and Caulet, 1992). It is a surface-dwelling radiolarian species with the highest abundance in the upper 50 m of the water column. Here, we do not consider the abundance beneath 50 m water depth indicated by the global distribution (Figure 1B), as sampling procedures not commonly considered separation between living and dead cells, thus decreasing numbers with depth often occur simply by the accumulation of sinking dead cells. The genus Acrosphaera consists of colonial radiolarians that can grow up to several millimeters (Latz et al., 1987; Anderson and Gupta, 1998). Such colonial radiolarians, mainly of the order Collodaria, have also been observed by in situ imaging of organisms > 600 μm in the upper ocean or epipelagic zone (mean vertical niche = 35 m) of well-oxygenated and silicon-depleted waters of the California Current ecosystem (Biard et al., 2016; Biard and Ohman, 2020).
Dictyocoryne sp. appears to indicate warm water mesotrophic subtropical conditions (Matsuzaki et al., 2014), reaching its highest abundances between 50 to 100 m (Boltovskoy et al., 2017). Stylochlamydium venustum occurs both in warm and cold waters with a shallower abundance maximum in cold waters between 30°N–30°S and absolute abundances that vary widely (0.001–12 individuals L–1) (Boltovskoy et al., 2017). It is a ’tropical submergence’ taxon (Ishitani et al., 2008) and in the subtropics generally dwells in subsurface to intermediate water masses below 200 m water depth (Boltovskoy et al., 2017).
All habitat depths indicated are based on global compilations of data for plankton tows, sediment traps, and surface sediment samples (Boltovskoy et al., 2010; Boltovskoy and Correa, 2016). The habitat depths for all radiolarian species are defined based on their respective abundance peaks in the vertical profiles assumed to pinpoint each species’ preferred habitat (Boltovskoy et al., 2017). Due to missing sediment trap studies from the Peruvian Coastal Upwelling region, we could not to apply more regional information on radiolarian habitat depth and consequently rely on observations from the sediment records and associations with sea-surface temperature and nutrient availability from other regions (Figure 1B).
The DSi concentrations and the δ30SiDSi signatures used for comparison to the sediment data are from water stations previously published (Ehlert et al., 2012; Grasse et al., 2013), complemented by DSi concentrations obtained during RV Meteor research cruises in November to December 2012 (M90), February to March 2013 (M93) and April to July 2017 (M136, M137, M138). This dataset represents high-resolution data of both the period of strong upwelling (November-March) and weak/non-upwelling conditions (El-Niño, April-Jun).
Different Silicon Isotope Signatures for Different Radiolarian Species: Do They Reflect Water Column DSi Concentrations?
To test the applicability of δ30Sirad signatures as a proxy for past DSi concentrations, we investigate how well the δ30Si compositions of each species correlate to modern DSi concentrations and δ30SiDSi values in the Peruvian Upwelling (Table 2; Ehlert et al., 2012; Grasse et al., 2013). In the study area, surface δ30SiDSi signatures range from +1.7‰ to +3‰, with lowest δ30SiDSi corresponding to highest surface DSi concentrations of 15 μmol L–1 and highest δ30SiDSi to lowest DSi concentrations of 2 μmol L–1 (Figures 2B,G). At the subsurface to intermediate water depths, no significant correlation is observed between the high DSi concentrations and (lower) δ30SiDSi. This is in agreement with the global data set, where within the euphotic zone (upper 20 m of the water column), DSi uptake by diatoms leads to the highest δ30SiDSi values ranging from +1.2‰ to +4.4‰ (Figure 2G; Varela et al., 2004; Reynolds et al., 2006; Fripiat et al., 2011; de Souza et al., 2012a, b; Grasse et al., 2013). Below the euphotic zone, the δ30SiDSi values decrease with depth, mirroring the increase in DSi concentrations.
We only find correlations of the δ30Si signatures of the different radiolarian groups with specific DSi conditions. Accordingly, A. murrayana shows a significant correlation (p < 0.01) with the mean DSi concentration at 050 m water depth (Figure 3I), in agreement with the assumption that this species dwells in the upper water column and that the species is associated with high nutrient or potentially upwelling conditions (Molina-Cruz, 1977; Nigrini and Caulet, 1992). Accordingly, δ30SiAcro signatures also show a good correlation (r2 = 0.54) with maximum DSi concentrations, but nearly no correlation (r2 = 0.001) with minimum DSi from the same water depth (Figure 3E), which would reflect weak or relaxed upwelling conditions.
In contrast, the δ30Si signatures of Dictyocoryne sp. and Stylochlamydium sp. best correlate with minimum DSi concentration of their respective habitat depth (50–100 m and 200–400 m water depth; Figures 3J,K). These subsurface waters are not low (i.e., < 1 μmol L–1) in DSi compared to surface waters but remain between 10 and 15 μmol L–1 (50–100 m) and 20 to 35 μmol L–1 (200–400 m) throughout the year. The minimum DSi concentrations (Figure 2B, dashed line) show a decrease to values < 10 μmol L–1 south of 10°S, in contrast to mean and maximum DSi concentrations, all of which indicate a southward increase in DSi. These ‘low’ subsurface DSi concentrations are observed during both investigated seasons Nov-Mar and Apr-Jul (Supplementary Table 3). Given that the DSi concentration of the subsurface water mass (PCUC) is generally not expected to decrease along the shelf, a potential mechanism explaining these “decreasing” concentrations could be the entrainment of Si-depleted offshore water masses into the subsurface layer via anticyclonic eddy formation (José et al., 2017). Such anticyclonic eddies have been reported to preferentially form downstream of sharp topographic bends (Thomsen et al., 2016), which can be found in the southern section of the Peruvian shelf between 12°S and 17°S. Again, this is in agreement with studies indicating that Dictyocoryne sp. is associated with warm water conditions (Matsuzaki et al., 2014), and Stylochlamydium sp. is a ’tropical submergence’ taxon (Ishitani et al., 2008) that dwells in the subsurface to intermediate water masses between 200 m and 400 m in the subtropics (Boltovskoy et al., 2017). Furthermore, the correlation of δ30SiStylo with minimum DSi concentrations suggests that this taxon likely dwells in slightly shallower waters between 200–300 m, where annual and seasonal DSi concentrations are generally lower than in 300–400 m water depth (Figures 2A,E). This is further supported by the disappearance of Stylochlamydium sp. specimen on the shallow shelf south of 12°S, where no/not enough specimen from the available samples could be obtained for isotope analysis. The disappearance of Stylochlamydium sp. specimen on the shallow shelf agrees with the assumption that this species remains in the deeper waters and does not dwell on the shallow shelf, in particular not in the area of the strongest present-day upwelling.
Lastly, for the mixed radiolarian samples representing the entire range of habitat depth of 0–400 m, the best correlation is also found for minimum DSi concentrations. The available counting of radiolaria species shows that Dictyocoryne sp. and Stylochlamydium sp. make up 13% to 34% of the picked radiolaria species (Supplementary Table 4). Considering their massive skeleton compared to spherical species, such as A. murrayana, the δ30Simixed can be partially affected by heavier δ30SiDictyo and δ30SiStylo signatures. However, we do not observe a strong shift towards heavier signatures in δ30Simixed values.
The results of distinct δ30Si signatures of radiolarian taxa could substantially impact downcore records of mixed radiolaria samples if the radiolarian assemblage is changing. A simple calculation shows the following: if we assume that 87% of the radiolaria in a sample have a δ30Si value of +0.70‰ (mean for δ30SiAcro) and 13% have a δ30Si value of +1.45‰ (average of all δ30SiDicyto and δ30SiStylo), the mixed sample will have a signature of +0.8‰. By increasing the abundance of the species with the higher isotope signature of +1.45‰ to 34%, the overall signature will increase to +0.96‰. Furthermore, the species’ volume has to be taken into account. Should the species with the high δ30Si value be twice as large in comparison to a species with a lower isotope signature (+0.7‰), the δ30Si value of the mix will increase to +0.87‰ for 13% abundance and +1.08‰ for 34% abundance. This demonstrates the importance of considering the composition of the radiolarian assemblages in the interpretation of mixed radiolarian δ30Si values.
Mechanisms Controlling the Silicon Isotope Fractionation of Radiolaria
There is no detailed information on how radiolaria incorporate DSi into their tests, as laboratory investigations have been limited to short-term culture experiments (Sugiyama and Anderson, 1997; Ogane et al., 2010). The only available data on apparent Si isotope fractionation is based on a correlation between seawater and core-top radiolarians (ca. −0.5‰ to −0.9‰; Abelmann et al., 2015), similar to the approach presented here. Investigations on the formation process of polycystine skeletons are currently mainly based on examination of skeletons in various growth stages (Suzuki, 2006), incomplete growth shells (Anderson et al., 1987, 1988), and cross-sections of skeletons (Hurd and Theyer, 1977; Nishimura, 1990).
However, even with this limited information, we know that there is a fundamental difference in biosilicification between radiolarian orders such as Spumellaria and Nassellaria. Two major types of skeletal shell formation are known: (1) bridge growth and (2) rim growth (Afanasieva, 2006). Accordingly, the skeletal tissue in Spumellaria (Dictyocoryne and Stylochlamydium) is formed by (1) bridge growth, while the skeleton of Nassellaria, especially in spherical polycystine radiolarians such as A. murrayana, is formed by (2) rim growth. Due to the limited knowledge about the processes associated with skeleton formation in radiolaria, we will discuss potential factors for Si fractionation based on the Δ30Si values for the different radiolarian taxa and their potential correlation with DSi concentrations. The mean apparent fractionation factors (Δ30Si∼ε) were calculated based on eq. (1) and range between −1.18 ± 0.17‰ (Δ30SiAcro) and −0.05 ± 0.23‰ (Δ30SiDictyo). These values for isotopic fractionation of Si in radiolaria are slightly smaller than those found for cultured diatoms (−1.1‰, De La Rocha et al., 1997; −1.5‰, Milligan et al., 2004; −0.5‰ to −2.1‰, Sutton et al., 2013; Sun et al., 2014) and much smaller compared to sponges (−1.5‰ to −5.3‰; Wille et al., 2010; Hendry and Robinson, 2012) and cultured choanoflagellates (−5‰ to −7‰; Marron et al., 2019). In addition, we find a significant difference between the Δ30Si of A. murrayana (Nassellaria) and mixed radiolarians compared to Dictyocoryne sp. and Stylochlamydium sp. This difference in Δ30Si persists when comparing the Δ30Si of the different taxa with DSi concentrations (Figure 4B). Our results of all single taxa, as well as mixed radiolarian samples, indicate a significant correlation with DSi concentrations (Figures 3I–L) which can be described by the following equations derived from the Deming regressions (Figure 4B and Table 3):
Overall, the mean Δ30Si values for each taxon or group (calculated from taxon-specific Δ30Si values as given in Table 1) indicate that Spumellaria (Dictyocoryne, Stylochlamydium) only show a small (−0.05‰ to −0.34‰) apparent fractionation and Nassellaria (Acrosphaera) a stronger (−1.2‰) apparent fractionation effect between the radiolaria and the seawater. Similar differences have been found on a species-specific level for diatoms (Sutton et al., 2013). There is no experimental evidence of what causes this difference between species, but it is likely directly connected to the Si uptake and transport within the organism. Si isotope fractionation has been investigated previously for diatoms and sponge spicules (Milligan et al., 2004; Wille et al., 2010; Cassarino et al., 2018). We will discuss observations from these siliceous groups and evaluate similar processes in radiolaria based on the Δ30Si and linear relationships given by the Deming regressions (Figure 4B) derived in this study.
The three most important fluxes controlling isotope fractionation are (1) transport across cellular membranes during DSi influx, (2) incorporation of Si via polymerization, and (3) efflux of excess DSi from the cell (Popp et al., 1989; Martin-Jézéquel et al., 2000; Milligan et al., 2004; Hildebrand, 2008). According to Milligan et al. (2004), the overall isotopic fractionation effect is related to the flux ratio given by the equation:
where εf is the total Si isotopic fractionation factor, εt1 is the Si isotopic fractionation associated with transport into the cell, εp is the Si isotopic fractionation associated with polymerization, and εt2 Si isotopic fractionation associated with transport out of the cell; v[Si],E is the rate of Si efflux and v[Si],I is the rate of Si influx. Given the assumption of an intercellular isotopic discrimination step, fractionation would be at maximum at a high efflux:influx ratio because a high efflux rate decreases the likelihood that the heavy isotope (30Si) will be incorporated into the biogenic silica before it is removed from the cell (Milligan et al., 2004). A low efflux:influx ratio increases the likelihood that the heavy isotope will react within the cell and become incorporated, resulting in diminished fractionation. Hence, the overall effect should be a linear function of the flux ratio (Milligan et al., 2004).
Accordingly, under low DSi concentrations, most or all the Si entering the cell is consumed, resulting in a neglectable efflux (v[Si], E = 0), causing the last term of eq. (2) to become zero, and εf = εt1 (Wille et al., 2010). Consequently, the εt1 equals the intercept values indicated by the linear functions for single and mixed taxa radiolaria Δ30Si correlated to DSi concentrations (Figure 4B, Deming regression). The positive εt1 of +0.22‰ and +0.44‰ for Dictyocoryne and Stylochlamydium likely result from missing δ30Sirad values for lower DSi concentrations, which do not decrease further in the respective habitat depth in our study area. Therefore, it is more appropriate for these taxa to assume εt1 based on their Δ30Si under the lowest observed DSi concentrations. Accordingly, the lowest observed minimum DSi concentration is 3.95 μmol L–1 associated with a Δ30SiDicyto value of -0.07 ± 0.2‰ (Tables 1, 3 and Figure 4B) and a minimum DSi concentration of 18.7 μmol L–1 associated with a Δ30SiStylo value of −0.19 ± 0.2 ‰ (Table 1 and Figure 4B), resulting in εt1 of −0.07 ± 0.2 ‰ (Dictyo) and −0.19 ± 0.2 ‰ (Stylo).
Previous studies have shown that the isotope fractionation during uptake (εt1) in sponges varies between −1.34‰ and −1.55‰ (Wille et al., 2010; Hendry and Robinson, 2012). For diatoms, it was shown that a change in the efflux does not impact ε (Milligan et al., 2004), and a constant fractionation factor (εt1) between the diatom silica and the ambient DSi is assumed, ascribing variations of δ30Si of diatoms to fractionation within a closed or open-system (De La Rocha et al., 1997; Varela et al., 2004; Reynolds et al., 2006; Cardinal et al., 2007).
Still, the question remains what causes the correlation of Δ30Si of radiolaria with DSi concentrations. A non-linear relationship of Si isotope fractionation with DSi is observed for sponges, likely due to a dependence of the sponge growth rate on DSi availability (Wille et al., 2010; Hendry and Robinson, 2012). The fractionation during spicule polymerization (or more precisely εp - εt2) has been calculated based on data from laboratory experiments (Reincke and Barthel, 1997) to be as strong as −5.4‰ (Hendry and Robinson, 2012). However, while radiolaria can incorporate DSi from seawater under low ambient concentrations, it has been shown in laboratory experiments that DSi supplementation does not increase the mean weight of silicate deposited in specific species, like D. trunctatum (Anderson et al., 1989, 1990; Matsuoka, 1992; Sugiyama and Anderson, 1997; Suzuki et al., 2013). Instead, some pylonioid Spumellaria dispel formed siliceous fragments at concentrations of 10 μM (Suzuki et al., 2013), while extremely high DSi concentrations (up to 150 μM) can be lethal for flat-shaped radiolarians (Sugiyama and Anderson, 1997). Consequently, variations in DSi concentration may not directly affect radiolarian growth, contrary to observations for sponges. Therefore, we suggest that it is more likely that the relationship between Δ30Si and ambient DSi concentrations is driven by the impact of DSi variations on the efflux:influx ratio on potential fractionation during polymerization and efflux as proposed by eq. (2) (Popp et al., 1989; Milligan et al., 2004). The assumption is that under increasing ambient DSi concentrations, the efflux increase will at some point equal the influx of DSi, and thus the efflux:influx ratio (v[Si],E / v[Si], I) will equal 1. Assuming this will be the case at the highest DSi concentrations associated with Δ30Si for each radiolarian taxon, mixed radiolaria, and Spumellaria we arrive at values of −0.39‰ (Acro), −0.36‰ (Dictyo), −0.36‰ (Stylo), −0.21‰ (mixed) and −0.79‰ (Spumellaria) for the term εp - εt2 in eq. (2). These values indicate the maximum fractionation that could occur either during polymerization or efflux from the cell for each radiolarian group based on our data.
Overall, the Si isotope fractionation in radiolaria seems more comparable to diatoms than to sponges or choanoflagellates, with differences between species and taxon/order most likely associated with initial fractionation during uptake or transport. Although experimental observations for DSi transport mechanisms in radiolaria are limited, there are some observations from both diatoms and radiolaria that support this hypothesis. For example, for diatoms, it is known that they can actively transport DSi across the cell membrane via silicon isotope transporters (SITs) and transfer the newly acquired DSi into the silica deposition vesicle (SDV), where it is polymerized into BSi (Hildebrand, 2008). Both SITs (Marron et al., 2016) and SDVs or similar structures might also exist in polycystines, as indicated by images of probable silica aggregate granules based on transmission electron microscopy (Ogane et al., 2009). Furthermore, it was shown for diatoms and sponges that Si transport across the cell membrane could result in Si fractionation by active or passive membrane proteins (Thamatrakoln and Hildebrand, 2007; Maldonado et al., 2011; Marron et al., 2016). If the species-specific Si isotope fractionation in diatoms is associated with SDVs and transport via proteins between species, there might be similarities in the mechanism driving the different Δ30Si values observed here for radiolarian orders (i.e., Nassellaria and Spumellaria).
Paleoceanographic Application
Paleoceanographic studies on downcore δ30Sirad records have focused on analyses of bulk species samples and the comparison with the isotopic signatures of sponge spicules. This comparison was used to evaluate differences in the Si cycling of deep and intermediate (subsurface) water masses and potential changes in their DSi concentration. δ30Sirad has been mainly applied as paleoceanographic proxy for DSi concentrations based on specimen retrieved from marine sediments since the last glacial maximum (last ∼25 kyrs BP; Hendry et al., 2014) and since the Palaeogene (30–60 Myrs ago; Fontorbe et al., 2016, 2017, 2020). However, to apply δ30Si as a direct proxy for DSi concentrations of specific water masses or water depth, detailed knowledge of the fractionation factor and a proper calibration for DSi concentrations has been lacking.
The new radiolaria δ30Si data extracted from surface sediments presented here show significantly different signatures for each taxon. These differences are likely caused by different fractionation factors, potentially on order level (i.e., Spumellaria and Nassellaria). This observation needs further investigation and needs to be considered when interpreting the δ30Si of radiolaria from sediment cores.
The comparison with a recent DSi dataset revealed inverse statistical significant correlations between DSi concentrations for all single taxa. However, we find that the selected DSi (i.e., upwelling or non-upwelling season and corresponding to maximum, mean, or minimum values) has a significant impact on the correlation between the δ30Si, which is particularly visible in the highly variable data for DSi off Peru (Figures 3E–H). In addition to the importance of sufficient resolution of DSi concentrations and δ30Sirad signatures for correlations, the precision of the measurements of the isotope ratios has a large influence on the precision of the reconstructed DSi Concentrations as well. Based on the Deming regressions derived for δ30Sirad and DSi concentrations (Figure 4A) and an external reproducibility of 0.23‰ (2 SD) for δ30Sirad, we calculated that the range in DSi concentrations must be at least 8 μM (Stylochlamydium sp.) to 15 μM (A. murrayana). Please note that due to the small range in δ30SiAcro signatures (+0.59‰ to +0.83‰), associated DSi concentrations only range within 10 μM and are thus lower than the needed range difference of 15 μM, limiting the reliable application of δ30SiAcro as a paleo-proxy for DSi concentrations based on the correlation presented here. However, further investigations of δ30Sirad signatures in different ocean areas could improve the correlation and thus its application.
Positive though, due to their considerable size (> 100 μm), it is possible to retrieve sufficient amounts of single radiolaria taxa (> 80 specimen) from the surface and downcore sediments to study their application as a tracer for water mass δ30SiDSi values and DSi concentrations. Mixed radiolarian samples should be avoided. However, if mixed radiolarian samples are to be investigated, we suggest not to mix different orders such as Nassellaria and Spumellaria. This agrees with previous studies using mainly Spumellaria (Hendry et al., 2014; Abelmann et al., 2015) and/or nearly single taxa samples (> 90% Actinomma antarctica; Abelmann et al., 2015).
Overall, the information on isotope fractionation in radiolarians remains incomplete and requires further efforts. This includes further studies on the Si isotopic signature of radiolaria in the water column, if possible, incubation and culturing studies to investigate the Si fractionation factor and the overall uptake mechanisms in different radiolarian taxa, adapted to specific DSi ranges and habitat depth.
Conclusion
In this study, we present the first δ30Sirad from the Peruvian Coastal Upwelling System and introduce a new approach to investigate the potential of δ30Sirad as a proxy for past DSi concentrations by analyzing three single taxa and mixed radiolarian samples in a dedicated surface sediment study. These different taxa and mixed radiolarian samples show significantly different δ30Si values of on average +0.7‰ (δ30SiAcro), +1.6‰ (δ30SiDictyo), +1.2‰ (δ30SiStylo), and +1.0‰ (δ30Simixed). For all taxa, we find significant correlations with mean DSi concentrations in their respective habitat depths under high and low nutrient conditions (based on combined DSi data representing different upwelling conditions). The results for individual taxa indicate that δ30Si of A. murrayana corresponds to DSi concentrations under initially high nutrient conditions (upwelling) in 0–50 m, while the δ30Si of Dictyocoryne sp. and Stylochlamydium sp. better correlate to DSi concentrations under more nutrient replete conditions reflected in water depth of 50–100 m and 200–400 m, or more specific water depth (i.e., 200–300 m habitat depth for Stylochlamydium sp.).
The calculated apparent fractionation factors (Δ30Si ∼ε) show differences between single taxa with values ranging between −1.07‰ to −1.31‰ (A. murrayana), +0.15‰ to −0.21‰ (Dictyocoryne sp.) and −0.13‰ to −0.49‰ (Stylochlamydium sp.). We assume that the Δ30Si associated with the lowest DSi concentration reflects Si fractionation during uptake and transport [Δ30Si: −1.07‰ (Acro); +0.15‰ (Dictyo); −0.13‰ (Stylo)]. Potential Si fractionation during polymerization and/or efflux is enhanced under high ambient DSi concentrations causing enhanced efflux:influx ratios and can account for further fractionations of up to −0.39‰ (Acro), −0.36‰ (Dictyo), and −0.36‰ (Stylo; for either polymerization or efflux). However, designated laboratory experiments are needed to investigate these processes and to confirm these hypothetical fractionation values.
Overall, we find for the first time significantly different δ30Si signatures as well as associated Δ30Si and thus Si fractionation for several radiolaria taxa. This is an important finding for future applications as a paleo proxy. We observed significant relationships between δ30Sirad / Δ30Sirad and DSi concentrations. However, these relationships have a large uncertainty given the small range in observed DSi concentrations (0–30 μmol L–1).
The knowledge of habitat depth of each species and modern water column data is essential for the paleo application, and reconstructions cannot identify changes below 10 to 15 μmol L–1 DSi. Our results based on mixed radiolarian samples (mixture of Nassellaria and Spumellaria) show that it is crucial to consider changes in species assemblage, especially when little is known about the specific radiolarian species included in mixed radiolarian samples.
Data Availability Statement
The original contributions presented in the study are included in the article/Supplementary Materials, further inquiries can be directed to the corresponding author/s.
Author Contributions
KD designed the study, analyzed samples on the Nu Plasma, and drafted the manuscript. CE analyzed samples on the Neptune Plus. All authors listed contributed to the writing and intellectual contribution of the manuscript and approved it for publication.
Funding
This work is a contribution of the Collaborative Research Centre (SFB) 754 “Climate-Biogeochemistry interactions in the Tropical Ocean” (www.sfb754.de), which was supported by the Deutsche Forschungsgemeinschaft (DFG, German Research Foundation). This research was funded through a Mini-proposal granted by the SFB754 in 2017.
Conflict of Interest
The authors declare that the research was conducted in the absence of any commercial or financial relationships that could be construed as a potential conflict of interest.
Acknowledgments
We would like to thank Dirk Nürnberg for providing the sieved sediment samples. We particularly thank Jutta Heinze (GEOMAR) for her help in the clean laboratory. We thank the reviewers whose comments and suggestions helped to improve and clarify this manuscript.
Supplementary Material
The Supplementary Material for this article can be found online at: https://www.frontiersin.org/articles/10.3389/fmars.2021.666896/full#supplementary-material
References
Abelmann, A., Gersonde, R., Knorr, G., Zhang, X., Chapligin, B., Maier, E., et al. (2015). The seasonal sea-ice zone in the glacial Southern Ocean as a carbon sink. Nat. Commun. 6:8136. doi: 10.1038/ncomms9136
Abelmann, A., and Gowing, M. M. (1996). Horizontal and vertical distribution pattern of living radiolarians along a transect from the Southern Ocean to the South Atlantic subtropical region. Deep Sea Res. Part I Oceanogr. Res. Pap. 43, 361–382. doi: 10.1016/0967-0637(96)00003-9
Afanasieva, M. S. (2006). Radiolarian skeletons: formation and morphology of skeletal shells. Paleontol. J. 40, 476–489. doi: 10.1134/s0031030106050029
Anderson, O., and Gupta, S. (1998). Evidence of binary division in mature central capsules of a collosphaerid colonial radiolarians: implications for shell ontogenetic patterns in modern and Fossil species. Palaeontol. Electron. 1:13. doi: 10.26879/98002
Anderson, O. R., Bennett, P., and Bryan, M. (1989). Experimental and observational studies of radiolarian physiological ecology: 3. effects of temperature, salinity and light intensity on the growth and survival of Spongaster tetras tetras maintained in laboratory culture. Mar. Micropaleontol. 14, 275–282. doi: 10.1016/0377-8398(89)90014-5
Anderson, O. R., Bryan, M., and Bennett, P. (1990). Experimental and observational studies of radiolarian physiological ecology: 4. factors determining the distribution and survival of Didymocyrtis tetrathalamus tetrathalamus with implications for paleoecological interpretations. Mar. Micropaleontol. 16, 155–167. doi: 10.1016/0377-8398(90)90001-3
Anderson, O. R., Hays, J. D., and Gross, M. (1988). An ontogenetic analysis of changes in morphology during phylogeny of some Lamprocyrtis spp. from deep sea sediments. Micropaleontology 34, 41–51.
Anderson, O. R., Moss, M. L., and Skalak, R. (1987). “The cytoskeletal and biomineralized supportive structures in Radiolaria,” in Cytomechanics: The Mechanical Basis of Cell Form and Structure, J. Bereiter-Hahn, O. R. Anderson, W. Reif (New York, NY: Springer-Verlag), 200–211.
Bach, L. T., Paul, A. J., Boxhammer, T., von der Esch, E., Graco, M., Schulz, K. G., et al. (2020). Factors controlling plankton community production, export flux, and particulate matter stoichiometry in the coastal upwelling system off Peru. Biogeosciences 17, 4831–4852. doi: 10.5194/bg-17-4831-2020
Beucher, C. P., Brzezinski, M. A., and Jones, J. L. (2008). Sources and biological fractionation of Silicon isotopes in the Eastern Equatorial Pacific. Geochim. Cosmochim. Acta 72, 3063–3073. doi: 10.1016/j.gca.2008.04.021
Beucher, C. P., Brzezinski, M. A., and Jones, J. L. (2011). Mechanisms controlling silicon isotope distribution in the Eastern Equatorial Pacific. Geochim. Cosmochim. Acta 75, 4286–4294. doi: 10.1016/j.gca.2011.05.024
Biard, T., and Ohman, M. D. (2020). Vertical niche definition of test-bearing protists (Rhizaria) into the twilight zone revealed by in situ imaging. Limnol. Oceanogr. 65, 2583–2602. doi: 10.1002/lno.11472
Biard, T., Stemmann, L., Picheral, M., Mayot, N., Vandromme, P., Hauss, H., et al. (2016). In situ imaging reveals the biomass of giant protists in the global ocean. Nature 532, 504–507. doi: 10.1038/nature17652
Blasco, D. (1971). Compsición y Distribución del Fitoplancton en la Región del Afliamientio de las Costas Peruanas. Amsterdam: Inv. Pesq, 61–112.
Boltovskoy, D., Anderson, O. R., and Correa, N. (2017). “Radiolaria and phaeodaria,” in Handbook of the Protists, eds J. M. Archibald, A. G. B. Simpson, and C. Slamovits (Springer), 1–33.
Boltovskoy, D., and Correa, N. (2016). Biogeography of Radiolaria Polycystina (Protista) in the World Ocean. Prog. Oceanogr. 149, 82–105. doi: 10.1016/j.pocean.2016.09.006
Boltovskoy, D., Kling, S. A., Takahashi, K., and Bjoerklund, K. (2010). World atlas of distribution of recent polycystina (Radiolaria). Palaeontol. Electron. 13:230.
Brink, K. H., Halpern, D., Huyer, A., and Smith, R. L. (1983). The physical-environment of the peruvian upwelling system. Prog. Oceanogr. 12, 285–305.
Bruland, K. W., Rue, E. L., Smith, G. J., and DiTullio, G. R. (2005). Iron, macronutrients and diatom blooms in the Peru upwelling regime: brown and blue waters of Peru. Mar. Chem. 93, 81–103. doi: 10.1016/j.marchem.2004.06.011
Cardinal, D., Savoye, N., Trull, T. W., Dehairs, F., Kopczynska, E. E., Fripiat, F., et al. (2007). Silicon isotopes in spring Southern Ocean diatoms: large zonal changes despite homogeneity among size fractions. Mar. Chem. 106, 46–62. doi: 10.1016/j.marchem.2006.04.006
Cassarino, L., Coath, C. D., Xavier, J. R., and Hendry, K. R. (2018). Silicon isotopes of deep-sea sponges: new insights into biomineralisation and skeletal structure. Biogeosciences 1–30. doi: 10.5194/bg-2018-328
De La Rocha, C. L. (2003). Silicon isotope fractionation by marine sponges and the reconstruction of the silicon isotope composition of ancient deep water. Geology 31:423. doi: 10.1130/0091-76132003031<0423:sifbms<2.0.co;2
De La Rocha, C. L., Brzezinski, M. A., and DeNiro, M. J. (1997). Fractionation of silicon isotopes by marine diatoms during biogenic silica formation. Geochim. Cosmochim. Acta 61, 5051–5056.
De La Rocha, C. L., Brzezinski, M. A., DeNiro, M. J., and Shemesh, A. (1998). Silicon-isotope composition of diatoms as an indicator of past oceanic change. Nature 395, 680–683.
de Souza, G. F., Reynolds, B. C., Johnson, G. C., Bullister, J. L., and Bourdon, B. (2012a). Silicon stable isotope distribution traces Southern Ocean export of Si to the eastern South Pacific thermocline. Biogeosciences 9, 4199–4213. doi: 10.5194/bg-9-4199-2012-supplement
de Souza, G. F., Reynolds, B. C., Rickli, J., Frank, M., Saito, M. A., Gerringa, L. J. A., et al. (2012b). Southern Ocean control of silicon stable isotope distribution in the deep Atlantic Ocean. Global Biogeochem. Cycles 26, 2035–2047. doi: 10.1029/2011gb004141
DiTullio, G. R., Geesey, M. E., Maucher, J. M., and Alm, M. B. (2005). Influence of iron on algal community composition and physiological status in the Peru upwelling system. Limnol. Oceanogr. 50, 1887–1907.
Doering, K., Ehlert, C., Grasse, P., Crosta, X., Fleury, S., Frank, M., et al. (2016a). Differences between mono-generic and mixed diatom silicon isotope compositions trace present and past nutrient utilisation off Peru. Geochim. Cosmochim. Acta 177, 30–47. doi: 10.1016/j.gca.2015.12.029
Doering, K., Erdem, Z., Ehlert, C., Fleury, S., Frank, M., and Schneider, R. (2016b). Changes in diatom productivity and upwelling intensity off peru since the last glacial maximum: response to basin-scale atmospheric and oceanic forcing. Paleoceanography 31, 1453–1473. doi: 10.1002/2016pa002936
Echevin, V., Colas, F., Espinoza-Morriberon, D., Vasquez, L., Anculle, T., and Gutierrez, D. (2018). Forcings and evolution of the 2017 coastal El Niño Off Northern Peru and Ecuador. Front. Mar. Sci. 5:367. doi: 10.3389/fmars.2018.00367
Egan, K. E., Rickaby, R. E. M., Leng, M. J., Hendry, K. R., Hermoso, M., Sloane, H. J., et al. (2012). Diatom silicon isotopes as a proxy for silicic acid utilisation: a Southern Ocean core top calibration. Geochim. Cosmochim. Acta 96, 174–192. doi: 10.1016/j.gca.2012.08.002
Ehlert, C., Doering, K., Wallmann, K., Scholz, F., Sommer, S., Grasse, P., et al. (2016a). Stable silicon isotope signatures of marine pore waters – Biogenic opal dissolution versus authigenic clay mineral formation. Geochim. Cosmochim. Acta 191, 102–117. doi: 10.1016/j.gca.2016.07.022
Ehlert, C., Grasse, P., and Frank, M. (2013). Changes in silicate utilisation and upwelling intensity off Peru since the Last Glacial Maximum - insights from silicon and neodymium isotopes. Q. Sci. Rev. 72, 18–35. doi: 10.1016/j.quascirev.2013.04.013
Ehlert, C., Grasse, P., Gutiérrez, D., Salvatteci, R., and Frank, M. (2015). Nutrient utilisation and weathering inputs in the Peruvian upwelling region since the Little Ice Age. Clim. Past 11, 187–202. doi: 10.5194/cp-11-187-2015-supplement
Ehlert, C., Grasse, P., Mollier-Vogel, E., Böschen, T., Franz, J., de Souza, G. F., et al. (2012). Factors controlling the silicon isotope distribution in waters and surface sediments of the Peruvian coastal upwelling. Geochim. Cosmochim. Acta 99, 128–145. doi: 10.1016/j.gca.2012.09.038
Ehlert, C., Reckhardt, A., Greskowiak, J., Liguori, B. T. P., Böning, P., Paffrath, R., et al. (2016b). Transformation of silicon in a sandy beach ecosystem: Insights from stable silicon isotopes from fresh and saline groundwaters. Chem. Geol. 440, 207–218. doi: 10.1016/j.chemgeo.2016.07.015
Estrada, M., and Blasco, D. (1985). “Phytoplankton assemblages in coastal upwelling areas,” in Intl. Symp. On the Upwelling Areas off Western Africa, Vol. 1, eds. C. Bas, R. Margalef, and P. Rubies (Barcelona: Instituto de Investigaciones Pesqueras), 379–402.
Fontorbe, G., Frings, P. J., De La Rocha, C. L., Hendry, K. R., Carstensen, J., and Conley, D. J. (2017). Enrichment of dissolved silica in the deep Equatorial Pacific during the Eocene-Oligocene. Paleoceanography 32, 848–863. doi: 10.1002/2017pa003090
Fontorbe, G., Frings, P. J., De La Rocha, C. L., Hendry, K. R., and Conley, D. J. (2016). A silicon depleted North Atlantic since the Palaeogene: evidence from sponge and radiolarian silicon isotopes. Earth Planet. Sci. Lett. 453, 67–77. doi: 10.1016/j.epsl.2016.08.006
Fontorbe, G., Frings, P. J., Rocha, C. L. D. L., Hendry, K. R., and Conley, D. J. (2020). Constraints on earth system functioning at the paleocene-eocene thermal maximum from the marine silicon cycle. Paleoceanogr. Paleoclimatol. 35:e2020A003873. doi: 10.1029/2020pa003873
Franz, J., Krahmann, G., Lavik, G., Grasse, P., Dittmar, T., and Riebesell, U. (2012). Dynamics and stoichiometry of nutrients and phytoplankton in waters influenced by the oxygen minimum zone in the eastern tropical Pacific. Deep Sea Res. Part I 62, 20–31. doi: 10.1016/j.dsr.2011.12.004
Fripiat, F., Cavagna, A. J., Dehairs, F., Speich, S., André, L., and Cardinal, D. (2011). Silicon pool dynamics and biogenic silica export in the Southern Ocean inferred from Si-isotopes. Ocean Sci. 7, 533–547. doi: 10.5194/os-7-533-2011
Garcia, H. E., Locarnini, R. A., Boyer, T. P., Antonov, J. I., Baranova, O. K., Zweng, M. M., et al. (2014). in World Ocean Atlas 2013, Volume 4: Dissolved Inorganic Nutrients (Phosphate, Nitrate, Silicate), Vol. 76, eds S. Levitus and A. Mishonov (Silver Spring, MD: NOAA Atlas NESDIS), 25.
Garreaud, R. D. (2018). A plausible atmospheric trigger for the 2017 coastal El Niño. Int. J. Climatol. 38, e1296–e1302. doi: 10.1002/joc.5426
Grasse, P., Closset, I., Jones, J. L., Geilert, S., and Brzezinski, M. A. (2020). Controls on dissolved silicon isotopes along the U.S. GEOTRACES Eastern Pacific Zonal Transect (GP16). Global Biogeochem. Cycle 34:e2020GB006538. doi: 10.1029/2020gb006538
Grasse, P., Ehlert, C., and Frank, M. (2013). The influence of water mass mixing on the dissolved Si isotope composition in the Eastern Equatorial Pacific. Earth Planet Sci Lett 380, 60–71. doi: 10.1016/j.epsl.2013.07.033
Grasse, P., Ryabenko, E., Ehlert, C., Altabet, M. A., and Frank, M. (2016). Silicon and nitrogen cycling in the upwelling area off Peru: a dual isotope approach. Limnol. Oceanogr. 61, 1661–1676. doi: 10.1002/lno.10324
Gutiérrez, D., Enríquez, E., Purca, S., Quipúzcoa, L., Marquina, R., Flores, G., et al. (2008). Oxygenation episodes on the continental shelf of central Peru: remote forcing and benthic ecosystem response. Prog. Oceanogr. 79, 177–189. doi: 10.1016/j.pocean.2008.10.025
Haeckel, R., Wosniok, W., and Klauke, R. (2013). Comparison of ordinary linear regression, orthogonal regression, standardized principal component analysis, Deming and Passing-Bablok approach for method validation in laboratory medicine. Laboratoriumsmedizin 37, 147–163. doi: 10.1515/labmed-2013-0003
Hendry, K. R., Cassarino, L., Bates, S. L., Culwick, T., Frost, M., Goodwin, C., et al. (2019). Silicon isotopic systematics of deep-sea sponge grounds in the North Atlantic. Q. Sci. Rev. 210, 1–14. doi: 10.1016/j.quascirev.2019.02.017
Hendry, K. R., and Robinson, L. F. (2012). The relationship between silicon isotope fractionation in sponges and silicic acid concentration: modern and core-top studies of biogenic opal. Geochim. Cosmochim. Acta 81, 1–12. doi: 10.1016/j.gca.2011.12.010
Hendry, K. R., Robinson, L. F., McManus, J. F., and Hays, J. D. (2014). Silicon isotopes indicate enhanced carbon export efficiency in the North Atlantic during deglaciation. Nat. Commun. 5:3107. doi: 10.1038/ncomms4107
Hildebrand, M. (2008). Diatoms, Biomineralization Processes, and Genomics. Chem. Rev. 108, 4855–4874. doi: 10.1021/cr078253z
Hurd, D. C., and Theyer, F. (1977). Changes in the physical and chemical properties of biogenic silica from the Central Equatorial Pacific: part 2. Refractive index, density, and water content of acidcleaned samples. Am. J. Sci. 277, 1168–1202.
Huyer, A., Smith, R. L., and Paluszkiewicz, T. (1987). Coastal upwelling off Peru during normal and El Niño times, 1981–1984. J. Geophys. Res. Oceans (1978–2012) 92, 14297–14307.
Ikenoue, T., Bjørklund, K. R., Kruglikova, S. B., Onodera, J., Kimoto, K., and Harada, N. (2015). Flux variations and vertical distributions of siliceous Rhizaria (Radiolaria and Phaeodaria) in the western Arctic Ocean: indices of environmental changes. Biogeosci. Discuss. 12, 2019–2046. doi: 10.5194/bg-12-2019-2015
Ishitani, Y., Takahashi, K., Okazaki, Y., and Tanaka, S. (2008). Vertical and geographic distribution of selected radiolarian species in the North Pacific. Micropaleontology 54, 27–39. doi: 10.2307/30135296
José, Y. S., Dietze, H., and Oschlies, A. (2017). Linking diverse nutrient patterns to different water masses within anticyclonic eddies in the upwelling system off Peru. Biogeosciences 14, 1349–1364. doi: 10.5194/bg-14-1349-2017
Karstensen, J., and O. Ulloa (2009). “Peru–chile current system,” in Encyclopedia of Ocean Sciences, eds. J. H. Steele, K. K. Turekian, and S. A. Thorpe (Amsterdam: Elsevier), 385–392.
Kessler, W. S. (2006). The circulation of the eastern tropical Pacific: A review. Pro. Oceanogr. 69, 181–217. doi: 10.1016/j.pocean.2006.03.009
Kling, S. A., and Boltovskoy, D. (1995). Radiolarian vertical distribution patterns across the Southern California current. Deep Sea Res. Part I Oceanogr. Res. Pap. 42, 191–231. doi: 10.1016/0967-0637(94)00038-t
Kouduka, M., Matsuoka, A., and Nishigaki, K. (2006). Acquisition of genome information from single-celled unculturable organisms (radiolaria) by exploiting genome profiling (GP). BMC Genomics 7:135. doi: 10.1186/1471-2164-7-135
Krabberød, A. K., Bråte, J., Dolven, J. K., Ose, R. F., Klaveness, D., Kristensen, T., et al. (2011). Radiolaria divided into polycystina and spasmaria in combined 18S and 28S rDNA Phylogeny. PLoS One 6:e23526. doi: 10.1371/journal.pone.0023526
Kruglikova, S. B. (1989). Certain aspects of radiolarian data as evidence of the paleoenvironment. Palaeogeogr. Palaeoclimatol. Palaeoecol. 69, 303–320. doi: 10.1016/0031-0182(89)90171-5
Latz, M. I., Frank, T. M., Case, J. F., Swift, E., and Bidigare, R. R. (1987). Bioluminescence of colonial radiolaria in the western Sargasso Sea. J. Exp. Mar. Biol. Ecol 109, 25–38. doi: 10.1016/0022-0981(87)90183-3
Lukas, R. (1986). The Termination of the equatorial undercurrent in the Eastern Pacific. Prog. Oceanogr. 16, 63–90.
Maldonado, M., Navarro, L., Grasa, A., Gonzalez, A., and Vaquerizo, I. (2011). Silicon uptake by sponges: a twist to understanding nutrient cycling on continental margins. Sci. Rep. 1:30. doi: 10.1038/srep00030
Marron, A., Cassarino, L., Hatton, J., Curnow, P., and Hendry, K. R. (2019). Technical note: the silicon isotopic composition of choanoflagellates: implications for a mechanistic understanding of isotopic fractionation during biosilicification. Biogeosci. Discuss. 16, 4805–4813. doi: 10.5194/bg-16-4805-2019
Marron, A. O., Ratcliffe, S., Wheeler, G. L., Goldstein, R. E., King, N., Not, F., et al. (2016). The evolution of silicon transport in eukaryotes. Mol. Biol. Evol. 33, 3226–3248. doi: 10.1093/molbev/msw209
Martin-Jézéquel, V., Hildebrand, M., and Brzezinski, M. A. (2000). Silicon metabolism in diatoms: implications for growth. J. Phycol. 36, 821–840.
Matsuoka, A. (1992). Skeletal growth of a spongiose radiolarian Dictyocoryne truncatum in laboratory culture. Mar. Micropaleontol. 19, 287–297. doi: 10.1016/0377-8398(92)90034-h
Matsuzaki, K. M., Nishi, H., Suzuki, N., Cortese, G., Eynaud, F., Takashima, R., et al. (2014). Paleoceanographic history of the Northwest Pacific Ocean over the past 740kyr, discerned from radiolarian fauna. Palaeogeogr. Palaeoclimatol. Palaeoecol. 396, 26–40. doi: 10.1016/j.palaeo.2013.12.036
Messié, M., and Chavez, F. (2015). Seasonal regulation of primary production in eastern boundary upwelling systems. Prog. Oceanogr. 134, 1–18. doi: 10.1016/j.pocean.2014.10.011
Milligan, A. J., Varela, D. E., Brzezinski, M. A., and Morel, F. M. M. (2004). Dynamics of silicon metabolism and silicon isotopic discrimination in a marine diatom as a function of pCO2. Limnol. Oceanogr 49:329.
Molina-Cruz, A. (1977). Radiolarian assemblages and their relationship to the oceanography of the subtropical southeastern Pacific. Mar. Micropaleontol. 2, 315–352.
Moore, T. C. Jr. (1978). The distribution of radiolarian assemblages in the modern and ice-age Pacific. Mar. Micropaleontol. 3, 229–266.
Morales, C. E., Hormazábal, S. E., and Blanco, J. (1999). Interannual variability in the mesoscale distribution of the depth of the upper boundary of the oxygen minimum layer off northern Chile (18–24S): Implications for the pelagic system and biogeochemical cycling. J. Mar. Res. 57, 909–932. doi: 10.1357/002224099321514097
Nelson, D. M., Tréguer, P., Brzezinski, M. A., Leynaert, A., and Queguiner, B. (1995). Production and dissolution of biogenic silica in the ocean: Revised global estimates, comparison with regional data and relationship to biogenic sedimentation. Global Biogeochem. Cycles 9, 359–372.
Nigrini, C., and Caulet, J. P. (1992). Late neogene radiolarian assemblages characteristic of Indo-Pacific Areas of upwelling. Micropaleontology 38:139. doi: 10.2307/1485992
Nishimura, H. (1990). Taxonomic study on Cenozoic Nassellaria (Radiolaria). Science Reports of the Institute of Geoscience, University of Tsukuba, section B, Geological Sciences 11, 69–172.
Ogane, K., Tuji, A., Suzuki, N., Kurihara, T., and Matsuoka, A. (2009). First application of PDMPO to examine silicification in polycystine Radiolaria. Plankton Benthos Res. 4, 89–94. doi: 10.3800/pbr.4.89
Ogane, K., Tuji, A., Suzuki, N., Matsuoka, A., Kurihara, T., and Hori, R. S. (2010). Direct observation of the skeletal growth patterns of polycystine radiolarians using a fluorescent marker. Mar. Micropaleontol. 77, 137–144. doi: 10.1016/j.marmicro.2010.08.005
Peng, Q., Xie, S.-P., Wang, D., Zheng, X.-T., and Zhang, H. (2019). Coupled ocean-atmosphere dynamics of the 2017 extreme coastal El Niño. Nat. Commun. 10:298. doi: 10.1038/s41467-018-08258-8
Penven, P. (2005). Average circulation, seasonal cycle, and mesoscale dynamics of the Peru Current System: a modeling approach. J. Geophys. Res. 110:C10021. doi: 10.1029/2005jc002945
Petrushevskaya, M. G., and Björklund, K. R. (2011). Radiolarians in Holocene sediments of the Norwegian-Greenland seas. Sarsia 57, 33–46. doi: 10.1080/00364827.1974.10411269
Popp, B. N., Takigiku, R., Hayes, J. M., Louda, J. W., and Baker, E. W. (1989). The post-Paleozoic chronology and mechanism of 13 C depletion in primary marine organic matter. Am. J. Sci. 289, 436–454.
R Core Team (2018). R: A Language and Environment for Statistical Computing. Vienna: R Foundation for Statistical Computing.
Reincke, T., and Barthel, D. (1997). Silica uptake kinetics of Halichondria paniceain Kiel Bight. Mar. Biol. 129, 591–593. doi: 10.1007/s002270050200
Reynolds, B. C., Aggarwal, J., Andr, L., Baxter, D., Beucher, C., Brzezinski, M. A., et al. (2007). An inter-laboratory comparison of Si isotope reference materials. J. Analyt. At. Spectrom. 22:561. doi: 10.1039/b616755a
Reynolds, B. C., Frank, M., and Halliday, A. N. (2006). Silicon isotope fractionation during nutrient utilization in the North Pacific. Earth Planet. Sci. Lett. 244, 431–443. doi: 10.1016/j.epsl.2006.02.002
Sabine, C. L., Feely, R. A., Gruber, N., Key, R. M., Lee, K., Bullister, J. L., et al. (2004). The Oceanic Sink for Anthropogenic CO2. Science 305, 367–371. doi: 10.1126/science.1097403
Sanchez, G., Calienes, R., and Zuta, S. (2000). The 1997-98 El Niño and its effects on the coastal marine ecosystem off Peru. Rep. Calif. Cooperat. Oceanic Fish. Invest. 41, 62–86.
Schlitzer, R. (2020). Ocean Data View. Available online at: https//www.odv.awi.de.
Sugiyama, K., and Anderson, O. R. (1997). Experimental and observational studies of radiolarian physiological ecology, 6. effects of silicate-supplemented seawater on the longevity and weight gain of spongiose radiolarians Spongaster tetras and Dictyocoryne truncatum. Mar. Micropaleontol. 29, 159–172. doi: 10.1016/s0377-8398(96)00011-4
Sun, X., Olofsson, M., Andersson, P. S., Fry, B., Legrand, C., Humborg, C., et al. (2014). Effects of growth and dissolution on the fractionation of silicon isotopes by estuarine diatoms. Geochim. Cosmochim. Acta 130, 156–166. doi: 10.1016/j.gca.2014.01.024
Sutton, J. N., Varela, D. E., Brzezinski, M. A., and Beucher, C. P. (2013). Species-dependent silicon isotope fractionation by marine diatoms. Geochim. Cosmochim. Acta 104, 300–309. doi: 10.1016/j.gca.2012.10.057
Suzuki, N., and Aita, Y. (2011). Radiolaria: achievements and unresolved issues: taxonomy and cytology. Plankton Benthos Res. 6, 69–91. doi: 10.3800/pbr.6.69
Suzuki, N., and Not, F. (2015). “Biology and ecology of radiolaria,” in Undefined Marine PROTISTS, eds S. Ohtsuka, T. Horiguchi, N. Suzuki, and F. Not (Tokyo: Springer), 179–222. doi: 10.1007/978-4-431-55130-0_8
Suzuki, N., Ogawa, K., Ogane, K., and Tuji, A. (2013). Patchwork silicification and disposal activity of siliceous fragments of a polycystine radiolarian. Revue Micropaléontol 56, 63–74. doi: 10.1016/j.revmic.2013.04.002
Takahashi, K. (1981). Vertical Flux, Ecology and Dissolution of Radiolaria in Tropical Oceans: Implications for the Silica Cycle. Ph.D. thesis. Cambridge MA: Massachusetts Institute of Technology and Woods Hole Oceanographic Institution, doi: 10.1575/1912/2420
Takahashi, K., and Honjo, S. (1983). Radiolarian skeletons: size, weight, sinking speed, and residence time in tropical pelagic oceans. Deep Sea Res. Part A Oceanogr. Research Papers 30, 543–568. doi: 10.1016/0198-0149(83)90088-2
Thamatrakoln, K., and Hildebrand, M. (2007). Analysis of thalassiosira pseudonana silicon transporters indicates distinct regulatory levels and transport activity through the cell cycle. Eukaryotic Cell 6, 271–279. doi: 10.1128/ec.00235-06
Thomsen, S., Kanzow, T., Krahmann, G., Greatbatch, R. J., Dengler, M., and Lavik, G. (2016). The formation of a subsurface anticyclonic eddy in the Peru-Chile Undercurrent and its impact on the near-coastal salinity, oxygen, and nutrient distributions. J. Geophys. Res. Oceans 121, 476–501. doi: 10.1002/2015jc010878
Toggweiler, J. R., Dixon, K., and Broecker, W. S. (1991). The Peru upwelling and the ventilation of the South-Pacific Thermocline. J. Geophys. Res. 96, 20467–20497.
Tréguer, P. J., and De La Rocha, C. L. (2013). The World Ocean silica cycle. Annu. Rev. Mar. Sci. 5, 477–501. doi: 10.1146/annurev-marine-121211-172346
Tréguer, P. J., Sutton, J. N., Brzezinski, M., Charette, M. A., Devries, T., Dutkiewicz, S., et al. (2020). Reviews and syntheses: the biogeochemical cycle of silicon in the modern ocean. Biogeosci. Discuss. 2020, 1–43. doi: 10.5194/bg-2020-274
Varela, D. E., Pride, C. J., and Brzezinski, M. A. (2004). Biological fractionation of silicon isotopes in Southern Ocean surface waters. Global Biogeochem. Cycles 18, 1047–1054. doi: 10.1029/2003gb002140
Wille, M., Sutton, J., Ellwood, M. J., Sambridge, M., Maher, W., Eggins, S., et al. (2010). Silicon isotopic fractionation in marine sponges: A new model for understanding silicon isotopic variations in sponges. Earth Planet. Sci. Lett. 292, 281–289. doi: 10.1016/j.epsl.2010.01.036
Wu, C., and Yu, J. Z. (2018). Evaluation of linear regression techniques for atmospheric applications: the importance of appropriate weighting. Atmos. Meas. Tech. 11, 1233–1250. doi: 10.5194/amt-11-1233-2018
Zhang, Y., Peng, C., Wang, J., Huang, S., Hu, Y., Zhang, J., et al. (2018). Temperature and silicate are significant driving factors for the seasonal shift of dominant diatoms in a drinking water reservoir. J. Oceanol. Limnol. 113, 81–12. doi: 10.1007/s00343-019-8040-1
Taxonomy
Acrosphaera murrayana (Haeckel 1887) Hilmers, 1906
Rhizaria (infrakingdom) > Radiozoa (Phylum) > Polycystina (class) > Nassellaria (Order) > Collozoidae (Family) > Collosphaeridae (Subfamily) > Acrosphaera (Genus)
Description
Shell spherical, with large circular or roundish pores of unequal size. Ten to twelve pores in the half meridian of the shell. The margin of every pore has a coronal of six to nine short and acute spines, not longer than half the diameter of the pores. There are no spines between the pores.
Dictyocoryne profunda Ehrenberg, 1872
Rhizaria (infrakingdom) > Radiozoa (Phylum) > Polycystina (class) > Spumellaria (Order) > Spongodiscoidea (Family) > Dictyocoryne (Genus)
Description
Conchilla with spongy central chamber, disk-shaped, radiating 3 equidistant arms of approximately equal size, club-shaped, bulging and spongy at their distal ends. The angles formed by the arms with the central disk are more or less equal. The patagio or delicate spongy net acquires a slightly convex form between the arms and can reach until the ends of them. The length of the arms from the geometric center to the ends is 175 μm.
Dictyocoryne truncatum (Ehrenberg) Nigrini and Moore, 1979
Rhizaria (infrakingdom) > Radiozoa (Phylum) > Polycystina (class) > Spumellaria (Order) > Spongodiscoidea (Family) > Dictyocoryne (Genus)
Description
Test with three, broad, spongy arms, equally to bilaterally disposed, generally with, but in several specimens without, a spongy patagium between. The patagium developed between the arms tends to be somewhat concave. Length of the arms from the geometric center to the ends is 150 μm. Central region not spongy, consisting of 5–10 or more concentric latticed discoidal shells; arms narrow proximally for a short distance, becoming broad and thick, elliptical in section, distally. In specimens without a patagium the arms have a definite margin; in those with a patagium margin of arms indefinite, appears to merge with the spongy patagium; in several specimens’ arms are observed only as triangular dark areas.
Stylochlamydium venustum (Bailey) Haeckel, 1887
Rhizaria (infrakingdom) > Radiozoa (Phylum) > Polycystina (class) > Spumellaria (Order) > Spongodiscoidea (Family) > Stylochlamydium (Genus)
Description
Shell discoidal with a thickened spongiform central mass and a broad cellulose margin with numerous rays prolonged into projecting spines. This species includes specimens with an opaque, biconvex central region (concentric discoidal shells), surrounded in a single plane by generally irregular concentric rings which may be broken into concave outward segments near the periphery of the test. A porous sieve plate covers the rings on both sides of the test.
Keywords: silicon isotopes, Peruvian upwelling system, silicon cycle, isotope fractionation, core-top calibration, protozooplankton, Nassellaria and Spumellaria
Citation: Doering K, Ehlert C, Pahnke K, Frank M, Schneider R and Grasse P (2021) Silicon Isotope Signatures of Radiolaria Reveal Taxon-Specific Differences in Isotope Fractionation. Front. Mar. Sci. 8:666896. doi: 10.3389/fmars.2021.666896
Received: 11 February 2021; Accepted: 01 June 2021;
Published: 28 June 2021.
Edited by:
Sunil Kumar Singh, Physical Research Laboratory, IndiaReviewed by:
Gregory De Souza, ETH Zürich, SwitzerlandSatinder Pal Singh, Indian Institute of Science Education and Research, Bhopal, India
Copyright © 2021 Doering, Ehlert, Pahnke, Frank, Schneider and Grasse. This is an open-access article distributed under the terms of the Creative Commons Attribution License (CC BY). The use, distribution or reproduction in other forums is permitted, provided the original author(s) and the copyright owner(s) are credited and that the original publication in this journal is cited, in accordance with accepted academic practice. No use, distribution or reproduction is permitted which does not comply with these terms.
*Correspondence: Kristin Doering, a2RvZXJpbmdAZ2VvbWFyLmRl