 Kevin J. Flynn
 Susan A. Kimmance
 Darren R. Clark
 Aditee Mitra2
 Luca Polimene
 William H. Wilson
- 1Plymouth Marine Laboratory, Plymouth, United Kingdom
- 2School of Earth and Environmental Sciences, Cardiff University, Cardiff, United Kingdom
- 3Marine Biological Association of the UK, The Laboratory, Plymouth, United Kingdom
- 4School of Biological and Marine Sciences, University of Plymouth, Plymouth, United Kingdom
A mechanistic system dynamics description is developed of the interactions between a single lytic-virus – phytoplankton-host couple. The model has state variables for virus, uninfected and infected host biomass, and describes virus and host allometry and physiology. The model, analogous to experimental laboratory virus-host systems but more amenable to hypothesis testing, enables us to explore the relative importance of some of the poorly understood factors suspected to impact plankton virus-host dynamics. Model behaviour is explored with respect to abiotic factors (light, mixed layer depth, nutrient and suspended particle loading), host traits (size, growth rate, motility) and virus traits (size, latent period and burst size including linkage to compromised host physiology, and decay rates). Simulations show that the optimal performance of a virus (i.e., optimal trait characterisation) is a function of many factors relating to the virus, its host, and the environment. In general, smaller viruses and smaller motile hosts give rise to more productive infection outcomes that result in rapid demise of the host and high post-infection virus abundance. However, the timing of the development of the interaction (relative abundance of virus to host at the start of rapid host population growth), overlain on the growth rate and physiological status of the host, was seen to be critical. Thus, for any one configuration of the model, the inoculum level of the virus (multiplicity of infection- MOI) displayed an optimum time-point between the infection developing too quickly, limiting biomass accumulation, or too late so that nutrient or light limitation compromised host physiology and hence the burst size. Importantly, the success of an infection depended also upon the suspended particle load which, if high enough, adsorbs so many viruses that the infection does not develop. We conclude that adding viruses to plankton ecosystem models in a realistic fashion is a complicated process due to the way that the individual and coupled virus-host processes interact with the environment.
Introduction
Viruses of marine planktonic organisms are recognised as important factors potentially controlling bloom formation and termination and enhancing production and recycling of dissolved organic matter (DOM) through both the biological and microbial carbon pumps (Suttle, 2007; Jiao and Zheng, 2011; Zimmerman et al., 2020). Their importance is seen at not only local but also global scales (Gustavsen et al., 2014), since viruses are viewed as everywhere-all-the-time. In consequence, with the potential to play an important ancillary role in climate change impacts on plankton dynamics (Danovaro et al., 2011), viruses may have a direct impact upon one of the most important groups of primary producers on the planet. That role of viruses will inevitably be affected by both climate change impacts on the success of their potential hosts and upon their own (post-host lysis) survival. However, despite this perceived significance, viruses are poorly described in marine ecosystem models, where their action is either simply ignored or included implicitly as a generalised loss rate applied to hosts (e.g., Jacquet et al., 2010; Mateus, 2017).
Most models of virus growth kinetics have, unsurprisingly, been applied to non-marine examples, with some extrapolation to interpreting events in aquatic systems (e.g., Choua et al., 2020). This situation largely reflects the many challenges to the inclusion of viruses in numeric models. Since much of our understanding of plankton viruses comes from studies of very few host species, much is assumed from the physiology and biochemistry of classic prokaryote-virus (phage) systems. Our knowledge of marine viruses also stems mainly from experiments that exploit grossly simplified systems, often optimised (inadvertently or deliberately) for viral replication rather than studying factors that may in nature decrease the impact of viruses upon hosts. Unfortunately, experiments on plankton-virus interactions have typically also not determined parameter values for use in configuring models to explicitly describe the dynamics of the key processes in a mechanistic fashion. To progress the subject necessitates a better appreciation of the factors with greatest significance on lytic virus-host interactions, and thus warrant explicit inclusion in numeric models.
This work sets out to explore these challenges, and in doing so we present a numerical model mechanistically describing virus-phytoplankton interactions with the aim to (i) highlight knowledge gaps, and (ii) identify key traits for successful infection and thus aid/inform further empirical as well as future and especially broader, ecosystem modelling activities. Mateus (2017), in a review of modelling papers considering marine viruses, highlighted the lack of models describing host-virus interactions in a framework that also describes other environmental features such as variable stoichiometry, nutrient loading, irradiance and mixed layer depth. This work presents an attempt to bring together such processes and interactions in one modelling framework. While directed explicitly towards phytoplankton as hosts, organisms which are responsible for ca. 50% of global primary production (Field et al., 1998), the general structure of the model is likely applicable to other lytic-virus - microbe couples. Before describing the model, however, we introduce the parameters used its construction.
Virus-Host and Virus-Particle Encounters
Viruses are non-motile and too small to have an effective sinking rate. Encounters between viral particles and other particles are thus dominated by advective-diffusion (Murray and Jackson, 1992). Encounters do not just occur between viruses and their hosts; indeed, the bulk of encounters likely occur with non-host items, such as other organisms, fragments of lysed organisms, faecal material, diatom frustules, coccoliths, other suspended particles, and transparent exopolymer particles (TEP). The encounter of viruses to each of these particles decreases the likelihood of encountering a potential host. Encounter kinetics are functions of the size of the virus and the other particle, diffusivity and particle motion. A larger, faster moving (sinking or swimming) particle will be encountered by more viruses (Murray and Jackson, 1992). From all of this, the potential for complex interactions between the timing and magnitude of abiotic and biotic processes in enabling a successful viral attack is apparent.
All else being equal, larger hosts are more likely to be encountered by an individual virus. However, for a given amount of nutrient (e.g., mgN m–3) available to support host growth there will also be far more smaller organisms than larger ones. Thus, with reference to size described for pragmatic reasons as equivalent spherical diameter (ESD), as encounter probability is related to ESD2, while numeric abundance is related to ESD3, smaller and more abundant organisms are more likely to be encountered by viruses at the population level. From this, and again assuming all else to be equal, we may expect that smaller organisms are more likely to be controlled by lytic viruses. However, there is potential for other allometric-related interactions because encounter rates are also affected greatly by motility of the hosts (Murray and Jackson, 1992; Edwards et al., 2020), and larger motile protists swim faster than smaller ones (Flynn and Mitra, 2016). There is in addition, the relationship between host size and viral replication to consider.
Virus Replication and Host Physiological Status
While interactions between virus and host commence with a successful (for the virus) encounter, this does not always ensure a successful productive infection. In addition to specificity not only for a host species, but also for the host strain or clade (Sahlsten, 1998; Schroeder et al., 2003; Clerissi et al., 2012; Johannessen et al., 2017), virus replication success is intrinsically bound to the physiological status of that host. Interpreting host-virus interactions are greatly complicated by facets of host physiological status and growth rate (relative and absolute) at the time of infection and the time of data collection.
From a modelling perspective, the factors that are most informative in this regard are: latent period (LP) – the period from initial infection (adsorption) to lysis (this would include the eclipse period plus the maturation duration); consumption/conversion of host material into viral progeny during virus replication; and burst size (B) – the number of virus progeny released at lysis (the number of infectious progeny is likely of most consequence). To a large extent, these factors all interact through the physiology of the host (whether it is, at the time of infection, growing well) and the sizes and elemental composition of both parties.
An optimal host, in this context, is one that is also competitive in terms of resource acquisition and growth rate. Edwards and Steward (2018) and Choua et al. (2020) consider host growth rate limitation by nutrient availability; for phototrophic hosts, that nutrient could most obviously be N, P or C. Acquisition of C by phototrophs is a function of light-limitation as well as of N and/or P stress. These interact through the mixed layer depth (MLD) and the collective biomass within that MLD that absorbs light and causes self-shading. Unsurprisingly, then, light and nutrient limitations affect virus replication in phytoplankton, though different viruses give different degrees of infectivity and replication impacts with different host physiological status (Maat et al., 2016; Zimmerman et al., 2019).
There is also a clear potential for a linkage of virus replication to temperature simply through impacts (advantageous or deleterious) on host physiology (Breton et al., 2020; Demory et al., 2020b). Thus, the host could be of good nutritional status with respect to C:N:P but growing at a sub-optimal rate because of temperature-limitation or light-limitation (Maat et al., 2017; Derelle et al., 2018; Demory et al., 2020a,b). How these matters relate to latent period (LP) and burst size (B) are unclear as the appropriate data have not been collected over a sufficiently large range of virus-host combinations. Ultimately, however, we may expect that the LP will be a function of the rate of activity of the host biochemical machinery.
Decay and Loss of Viruses
Infectious viruses released from the planktonic host may spend some considerable time in the water column before encountering an uninfected host. As mentioned earlier, many if not the vast bulk of viruses may be lost either by adsorption onto non-host particles, or through other decay processes/mortality pathways. Viruses are removed by adsorption to particles including clay and other suspended particles. Thus, sediments washed in from glaciers remove viruses (Maat et al., 2019) and although the adsorption process is reversible (but then so too will be re-adsorption), it nonetheless delays the onset of effective control of the plankton blooms that are stimulated by nutrients released in the same ice melts. Finiguerra et al. (2011) report that phage de-activation is primarily associated with adsorption onto living organisms, and onto heat-labile colloids and macromolecules of > 10 kDa (which will include material liberated during host lysis and grazing activities). Such adsorption will also affect attempts to determine infection success (Garza and Suttle, 1998).
Decay of viruses in seawater is enhanced by sunlight, or specifically by UV light. Light interactions are more complex than a simple link to irradiance, with potential for damage-repair rather than destruction by UV-B, and loss also being offset by production of new progeny in the surface waters (Wilhelm et al., 1998). Selection of UV-resistance in viruses varies between summer and winter conditions (Garza and Suttle, 1998) and evolution of host defences may also be higher in coastal waters where the greater diversity of plankton species provides greater scope for selection pressures (Wilhelm et al., 1998). Models need to have the potential to consider how the average UV level in the mixed layer changes as the organic load (organisms, detrital materials, DOM) varies.
A Roadmap for Modelling
The rationale behind the model we develop here is to explore the potentialities of the many unknowns and poorly understood factors to impact plankton virus-host dynamics. This exercise will thus act to highlight areas of most importance to those dynamics, informing the design of future experiments. Another purpose of this work is to aid the understanding of the level of detail required for virus modelling in marine ecosystem models, to capture the ecologically relevant consequences of viral infection on phytoplankton. Here we present and explore a single host-virus process approach to ensure that the base understanding is sufficiently robust before extending the work to more ecologically realistic scenarios. This work is specifically intended to demonstrate the phytoplankton-virus model rather than to explore more complex ecological implications, virus-facing or host-facing evolution or other questions; those matters will be considered in subsequent papers.
Methods
Overview of the Virus-Host Model Description
Here we describe and justify the construction of a simulation model for a single virus-host system in which the host is considered as a photoautotroph (phytoplankton) with growth limited by light and/or nutrient. We use a system dynamics approach; that is one in which the amount of material is rigorously tracked around the system. The model is a single currency, N-based, construct consistent with the form of models used in most IPCC simulations (Arora et al., 2013) exploiting classic Nutrient-Phytoplankton-Zooplankton (NPZ) models (e.g., Fasham et al., 1990). A schematic of the model is given in Figure 1A; with example output shown in Figure 1B to illustrate the linkage between model construction and output (see legend and considered further in section “RESULTS”). Full equations are given in the Supplementary File, online. The following gives a discursive overview.
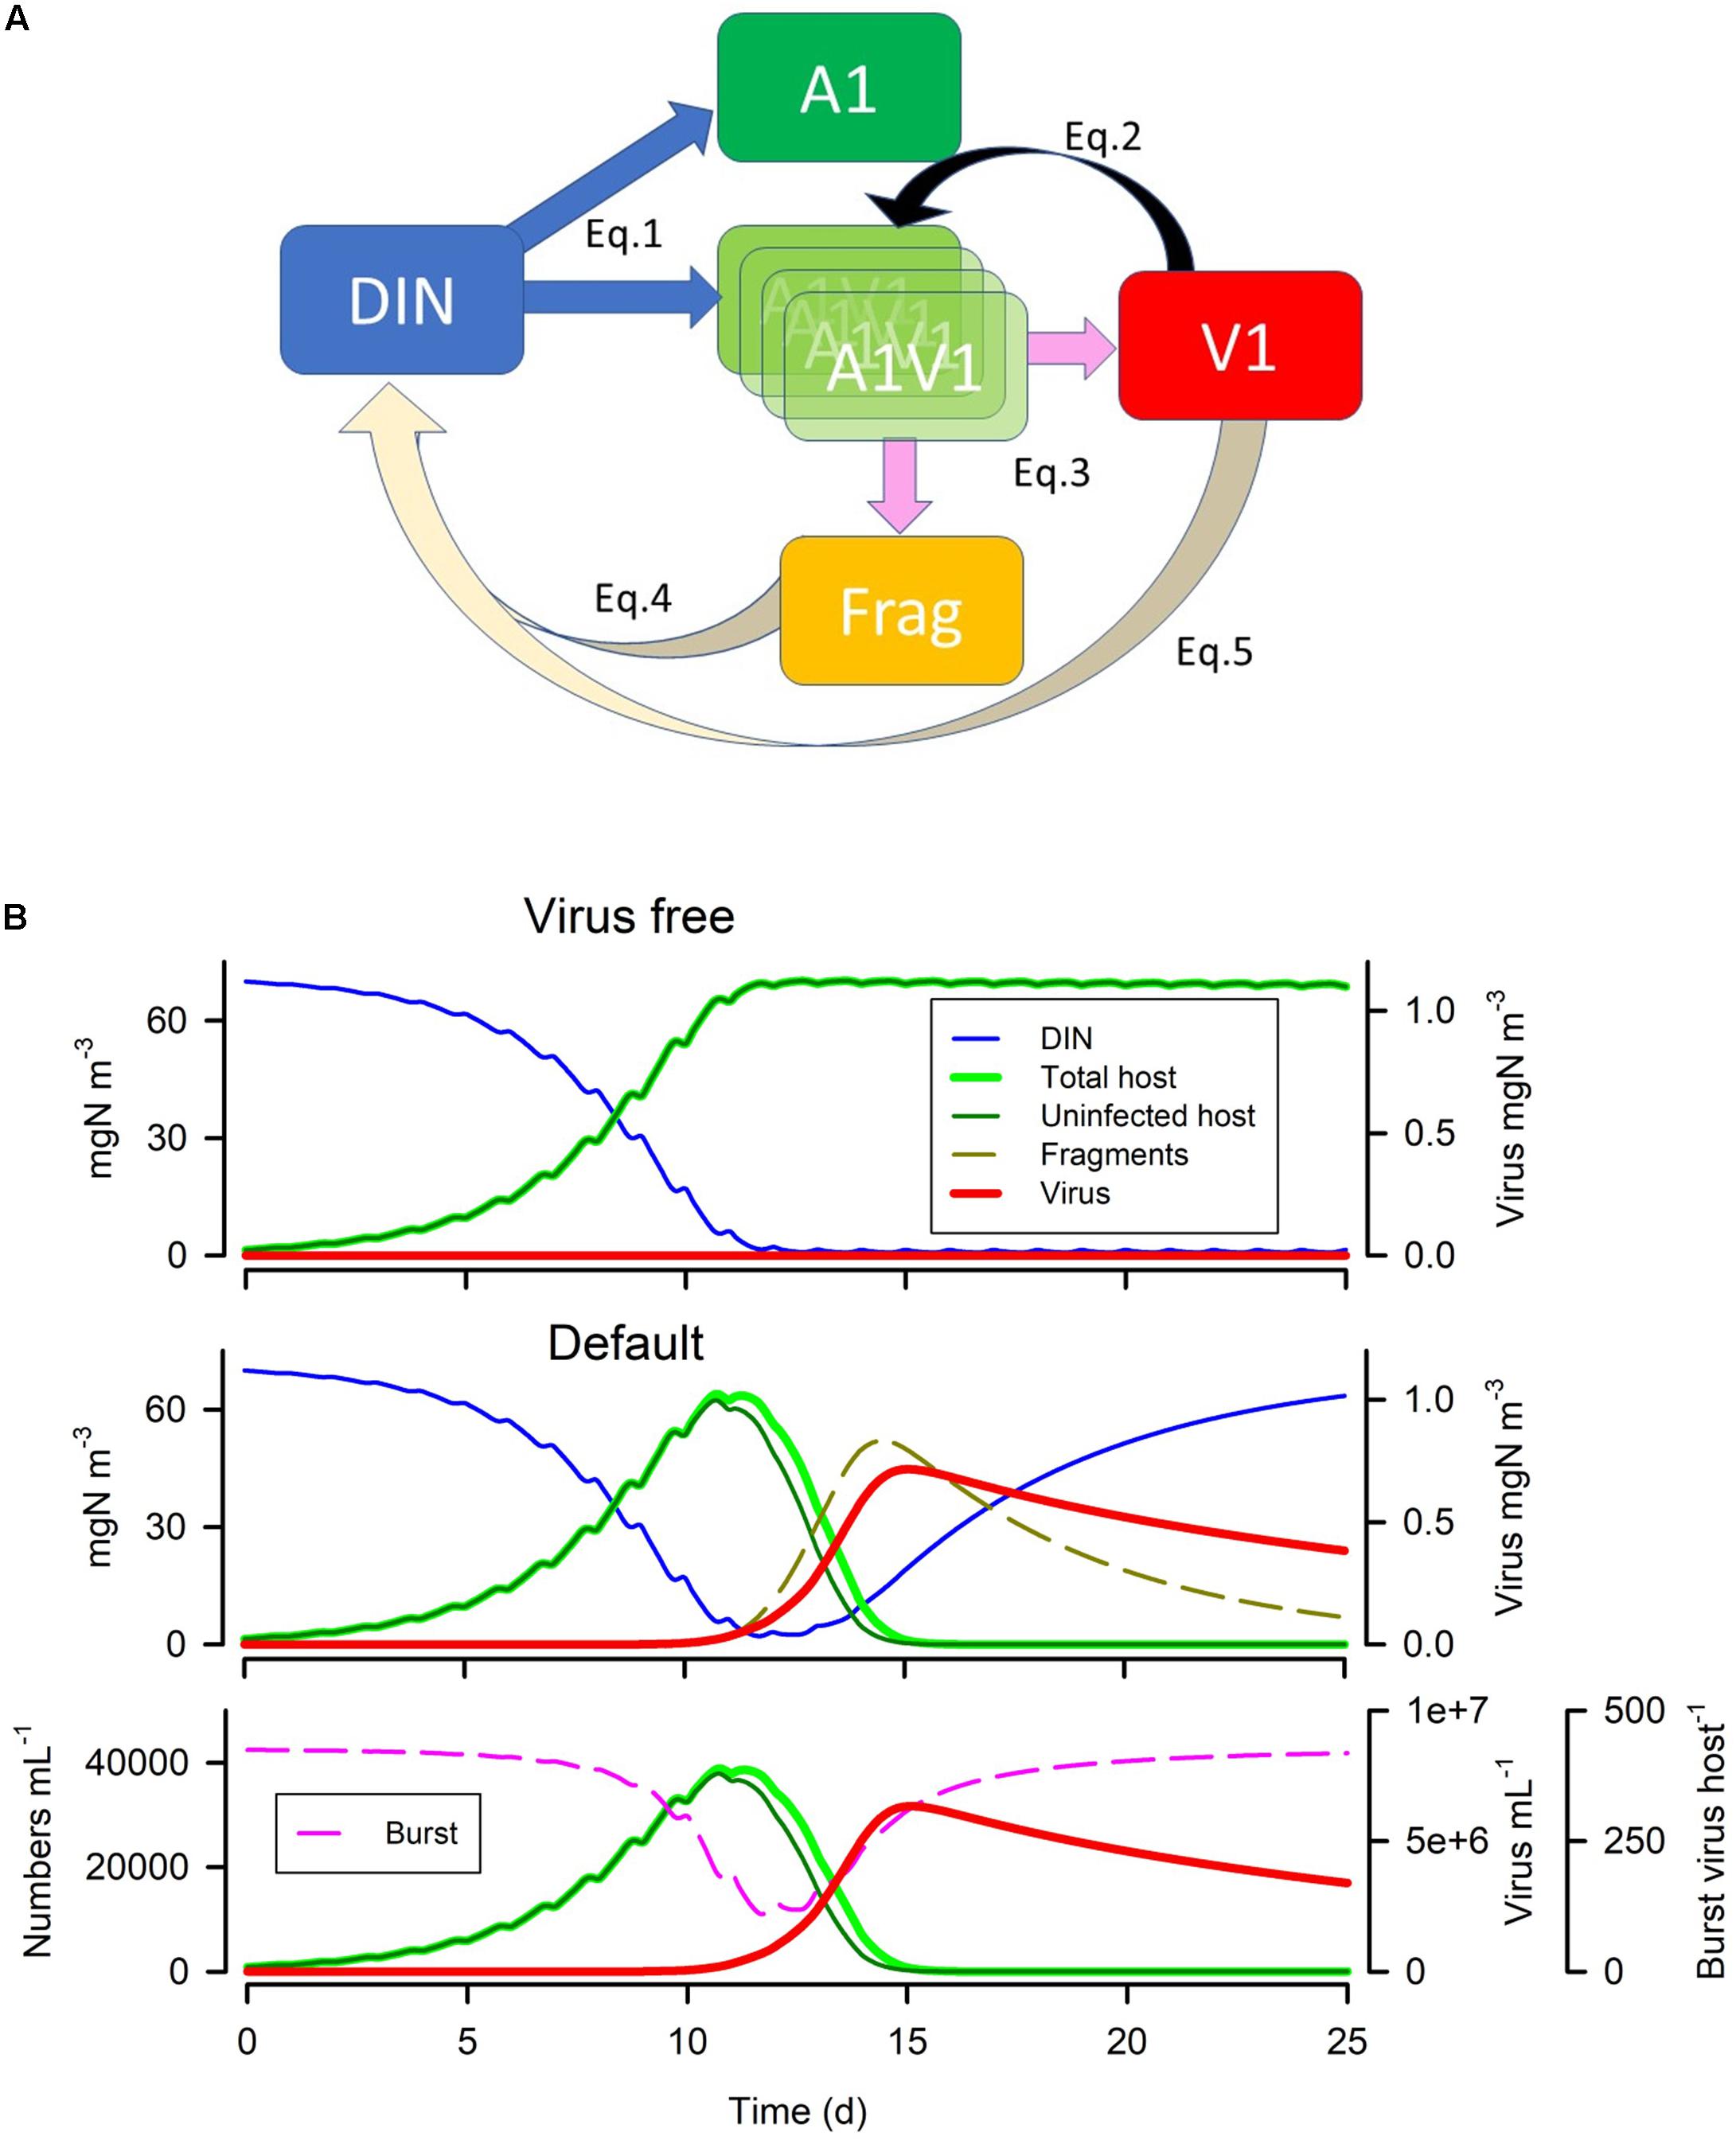
Figure 1. Model schematic and example (default) simulations. Panel (A) shows the connectivity between the state variables for inorganic nutrient (dissolved inorganic N; DIN), the phytoplankton host (A1), virus (V1), infected host (A1V1) and fragments of burst host (Frag). Note that A1V1 is described by an arrayed state variable, such that infection introduces a value into the lowest array member, and at each timestep the values are moved up through the array until they either reach the top, or the latent period is attained. The infected host then bursts releasing fragments (Frag) and new V1. See equations and adjoining text in Methods for more information. Panel (B) shows the default simulation output, showing in the upper plot the dynamics with no infection, and in the lower two panels the dynamics with infection. The lowest plot shows numeric abundance with burst size; note that burst size decreases slightly with declining host nutrient status (which tracks declining DIN). The proportion of host (A1) that is infected is seen by the difference between “total” and “uninfected”. See also Table 4.
The model (Figure 1A) comprises state variables for:
• inorganic nutrient (DIN as ammonium),
• host phytoplankton (A1),
• virus (V1) associated with host A1, as free particles
• infected host (A1V1)
• fragments of burst A1 (Frag)
In addition, the model includes:
• an implicit bacterial activity that converts (decays) all N associated with cell fragments and adhered viral particles back to DIN.
• suspended particles which affect virus-particle encounters as well as loss of material from the system.
• mixing within water of a stated mixing depth acts in a fashion akin to a chemostat dilution, bringing in nutrient particles from outside of the mixed layer, and washing out a proportion of all materials in the mixed layer.
All state variables are described in units of mgN m–3. All particulate components are also associated with an equivalent spherical diameter (ESD), and thence with a particle mass calculated from an allometric equation of the form {mass} = a × {ESD}b. The suspended particles are described only with reference to abundance and their size.
DON is not modelled here since it does not interact on virus-host dynamics. However, an explicit state variable describing DON should be considered if/when the model is used in a more realistic ecological context. Sedimentation (sinking) of organisms is not considered here.
With reference to Figure 1A, the dynamics are described by the following functions:
Most of this work is directed towards the description of the virus-host dynamics; the host phytoplankton growth routines follow a standard, largely traditional, structure. Care must be taken with all the calculations described below, to observe the units; often in the literature different units are encountered, of length (m vs cm), volume (m3 vs mL), and of time (s, min, d).
Phytoplankton Sub-Model
Phytoplankton growth is described using a slightly modified Fasham-style approach (Fasham et al., 1990) with biomass described only as a N-based entity with assumed fixed N:C and Chl:C stoichiometry. Growth is limited by DIN and light using a depth-integrated routine that takes into account self-shading of the cumulative phytoplankton biomass within a water column of stated mixed layer depth (MLD). The nutrient status is described as a quotient according to a Michaelis-Menten style equation; this interacts with the maximum growth rate to define the maximum gross photosynthetic rate. Maximum growth rate is then calculated by subtracting the respiration rate from the maximum gross photosynthetic rate. Although, in reality there is no direct effect of nutrient limitation on virus replication, host growth rate (light or nutrient restricted) and nutrient status (nutrient availability) do affect virus growth dynamics; this is accomplished in the model by reference to light and nutrient availabilities. We consider the implications of different host maximum growth rates and light-nutrient interactions on virus replication, in Results.
The uninfected phytoplankton biomass is described through a single state variable (A1). Infected host (i.e., A1 +V1) are described using the arrayed state-variable A1V1 that holds the biomass of the infected phytoplankton at each timestep. Infection sees the initiation of the first element in the array and, at each timestep, the biomass of each array element is progressed until the elapsed period equates to the latent period. The array is thus of a dimension that allows this progression to attain the maximum possible latent period. At the array dimension equating to the latent period, the biomass of A1V1 is lysed (converted into fragments) and the state variable for virus V1 increased according to the burst size and the number of host lysing (this calculated from the phytoplankton biomass and allometric constants).
Growth of the infected host biomass is assumed to proceed at the same rate as that of the uninfected counterparts, though this could be modified if required. Although there are often observable differences between infected and non-infected host phytoplankton, we lack sufficient understanding of the effects of infection upon gross physiology at this time to model this robustly. However, because the model explicitly differentiates between infected and uninfected host and between hosts infected at different stages of virus replication, it would be a simple matter to include a step to modify growth of the infected host relative to that of the uninfected host.
The remainder of the former A1V1 biomass is recycled eventually to DIN (Figure 1). First, each lysed host cell is considered as transformed into a set number of fragments (a value set by the modeller), each of which for simplicity is assumed to be of equal size. The ESD of the fragments is calculated from the volume of the un-lysed cell divided by the number of fragments. These fragments absorb virus particles (see virus sub-model) and they also decay, with their N returning to the DIN state variable. We consider the implications of different fragment numbers being produced, with different decay rates, in Results.
Virus Sub-Model
Virus-Particle Encounter
Viruses are so small (most have an ESD of ca. 10–100 nm) that contact with other particles is considered as primarily a function of advection-enhanced diffusion. It is important to note that encounters are not just with hosts, but with other particles. Virus-particle encounters thus need to be computed for all combinations other than virus-virus; viruses themselves are considered as being so small that they do not adhere to each other.
It is unclear as to the bounds of virus-particle adherence, and how allometric relationships affect the probability of binding. The probability of binding will in any case be affected by factors such as particle charge and covalent bonding, matters associated with the chemical nature of the materials (e.g., TEP vs clay). Determination of host-particle encounter rates are computed through reference to the parameters described in Table 1.
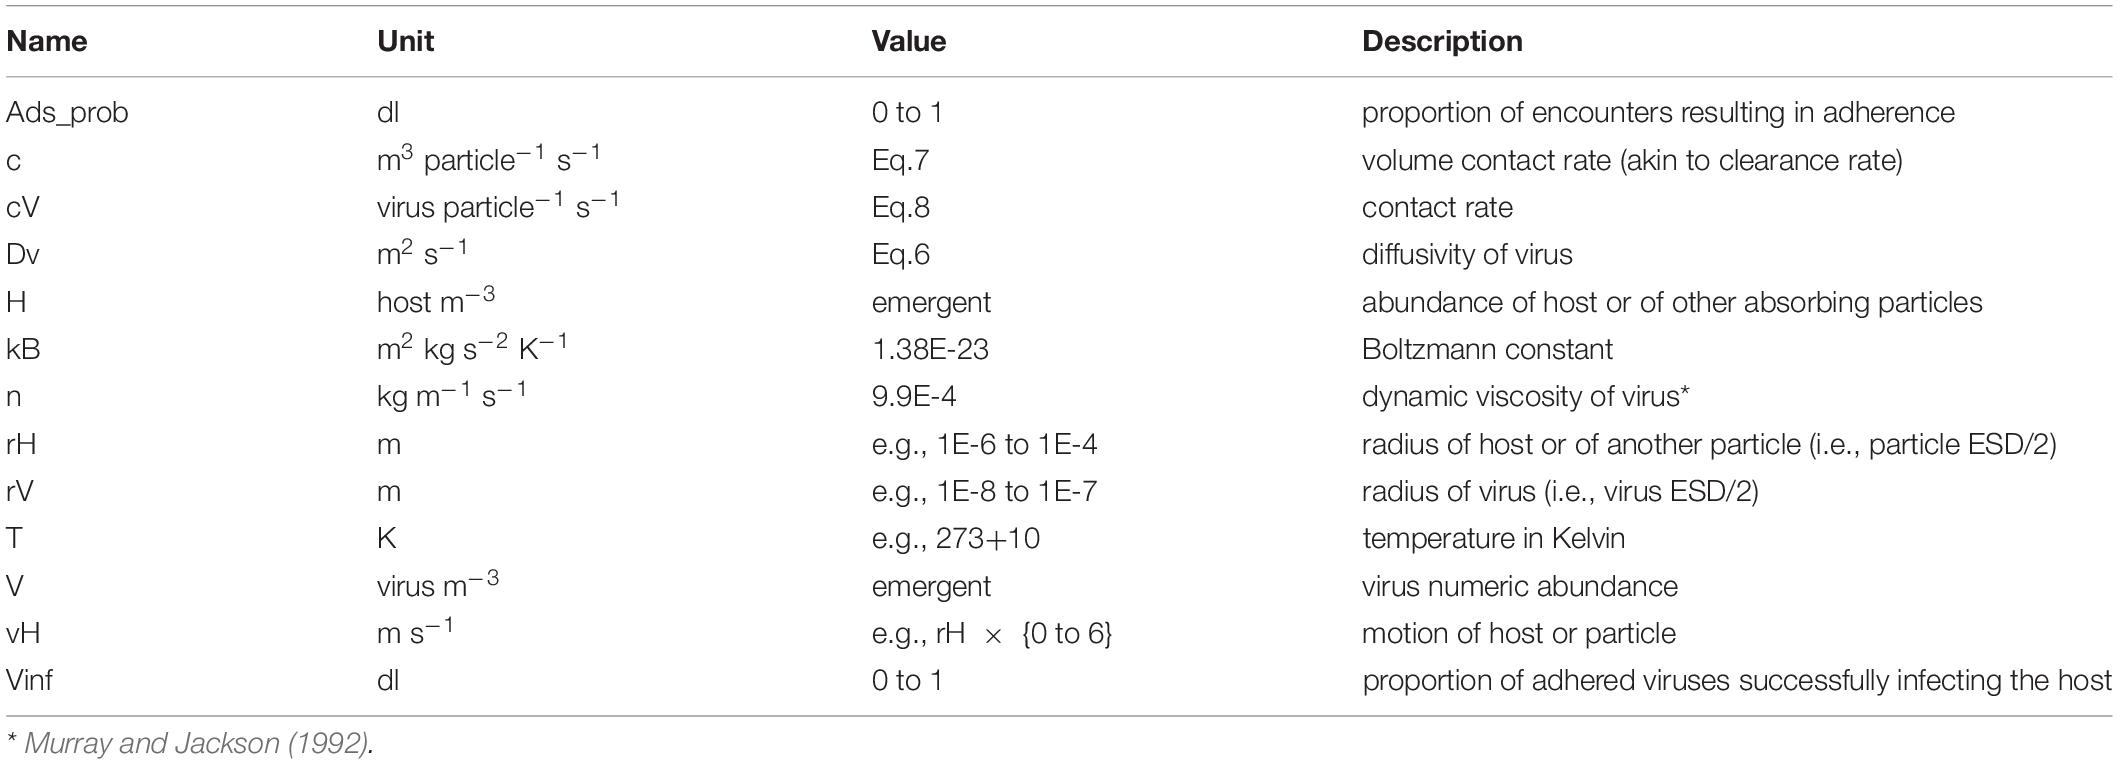
Table 1. Parameters for virus-particle encounter.
Diffusivity of the virus particle is computed as:
Emergent values of Dv from this equation are in the order of 1E-13 – 1E-12 m2 s–1. This compares well with values tabulated in Murray and Jackson (1992) for different virus sizes and types of ca. 5–15 μm2 s–1, which is 5E-12 to 1.5E-11 m2 s–1.
The contact rate for viruses and other particles, c, as a function of advection enhanced diffusion and equivalent to swept volume, is computed as:
Note that the involvement of rV (virus size) within Eq.7 is enacted via Dv (Eq.6). The reader is directed to the work of Murray and Jackson (1992) for explanations and discussions on the formulae in Eq. 6 - 9.
The number of viruses encountered by an individual particle per second is thus:
For comparison with the documentation given in Murray and Jackson (1992), we have for contacts made by diffusion alone the equation:
Here Sh is the Sherwood number, a unit-less parameter describing the ratio of convective mass transfer to the diffusive mass transport rate. Sh values for microbes are highly dependent on particle size and motion, but for a 5 μm ESD organism Sh is ca. 2.5. We consider the implications of different sized hosts and viruses in Results.
The value from Eq.7 (or Eq.9) has units of virus particle–1 s–1. To correct this to a rate per day we multiple by 24 × 60 × 60 (= 86400). With parameter H describing abundance of absorbing particles (nos m3), the number of viruses potentially absorbed per day (by the particles in that volume of water) per 1 m3 is:
The total number of viruses removed is calculated, by reference to Eq.10, for every different particle type (i.e., different H, with different particle size and different motion speeds).
A collision need not result in adherence of the virus with the particle; the likelihood of that event is controlled by the value of Ads_prob (dl, a quotient between 0 and 1). In the absence of any other information, Ads_prob is set constant for all particle types, at 0.1 (i.e., 10% of contacts remove viruses from suspension; see also Section “Virus Replication; the Burst Size and Latent Period”). Adherence of a virus onto a particle removes it from the infection cycle and the virus then decays.
In all instances, the collisions and allied events are computed on a virus-particle basis, and the state variables (in mass units) are adjusted with reference to the virus and particle mass per individual. Mass conservation is tracked including the conversion (decay) of adhered viruses to ammonium (which is the N-source simulated by the model). At each time step the number of virus particles that attach to different particle types is calculated, and that sum total (converted into a biomass) is removed from the pool of free viruses, V1.
Virus Replication; The Burst Size and Latent Period
We consider only non-infected host cells as being potential new hosts, and we also assume that it only takes a single successful contact to infect a host. The number of hosts infected is then calculated with reference to the value of c × Ad_prob computed for the host-virus couple of interest. Success on contact, that is in penetration and entrance of the viral genome into the host, is set by Vinf (a quotient between 0 and 1). In the absence of any other information, we set Vinf at 0.2 (i.e., 20%). So, for an individual virus-host combination the rate of infection is given by c × Ad_prob × Vinf. The consequence of using different values of Ad_prob and Vinf are considered in Results, where we also consider the implications of having different suspended particle loads (particle number and size).
We now consider whether allometric relationships may provide a basis for modelling. There is a linear relationship between nucleic acid content and virus size, just as there is for their hosts (Figures 2A,B). There is also a positive relationship between virus size and C content (Figure 2C). The resultant C-density (i.e., gC/L) calculated from the relationship in Figure 2C is not that dissimilar (within 20%) from that computed using the relationship for microbial plankton in Menden-Deuer and Lessard (2000) extrapolated down to virus ESD values. This provides some confidence in this relationship, which is important given that the data in Jover et al. (2014) covers a very narrow size range (30–36 nm radius). The average C:N and C:P mass ratios from Jover et al. (2014) are 2.643 gC gN–1 and 7.67 gC gP–1. From this, and a knowledge of the host cell size with a given elemental composition, it is possible to calculate the likely maximum burst size as a minimum function of virus N and P demands, and host N and P content.
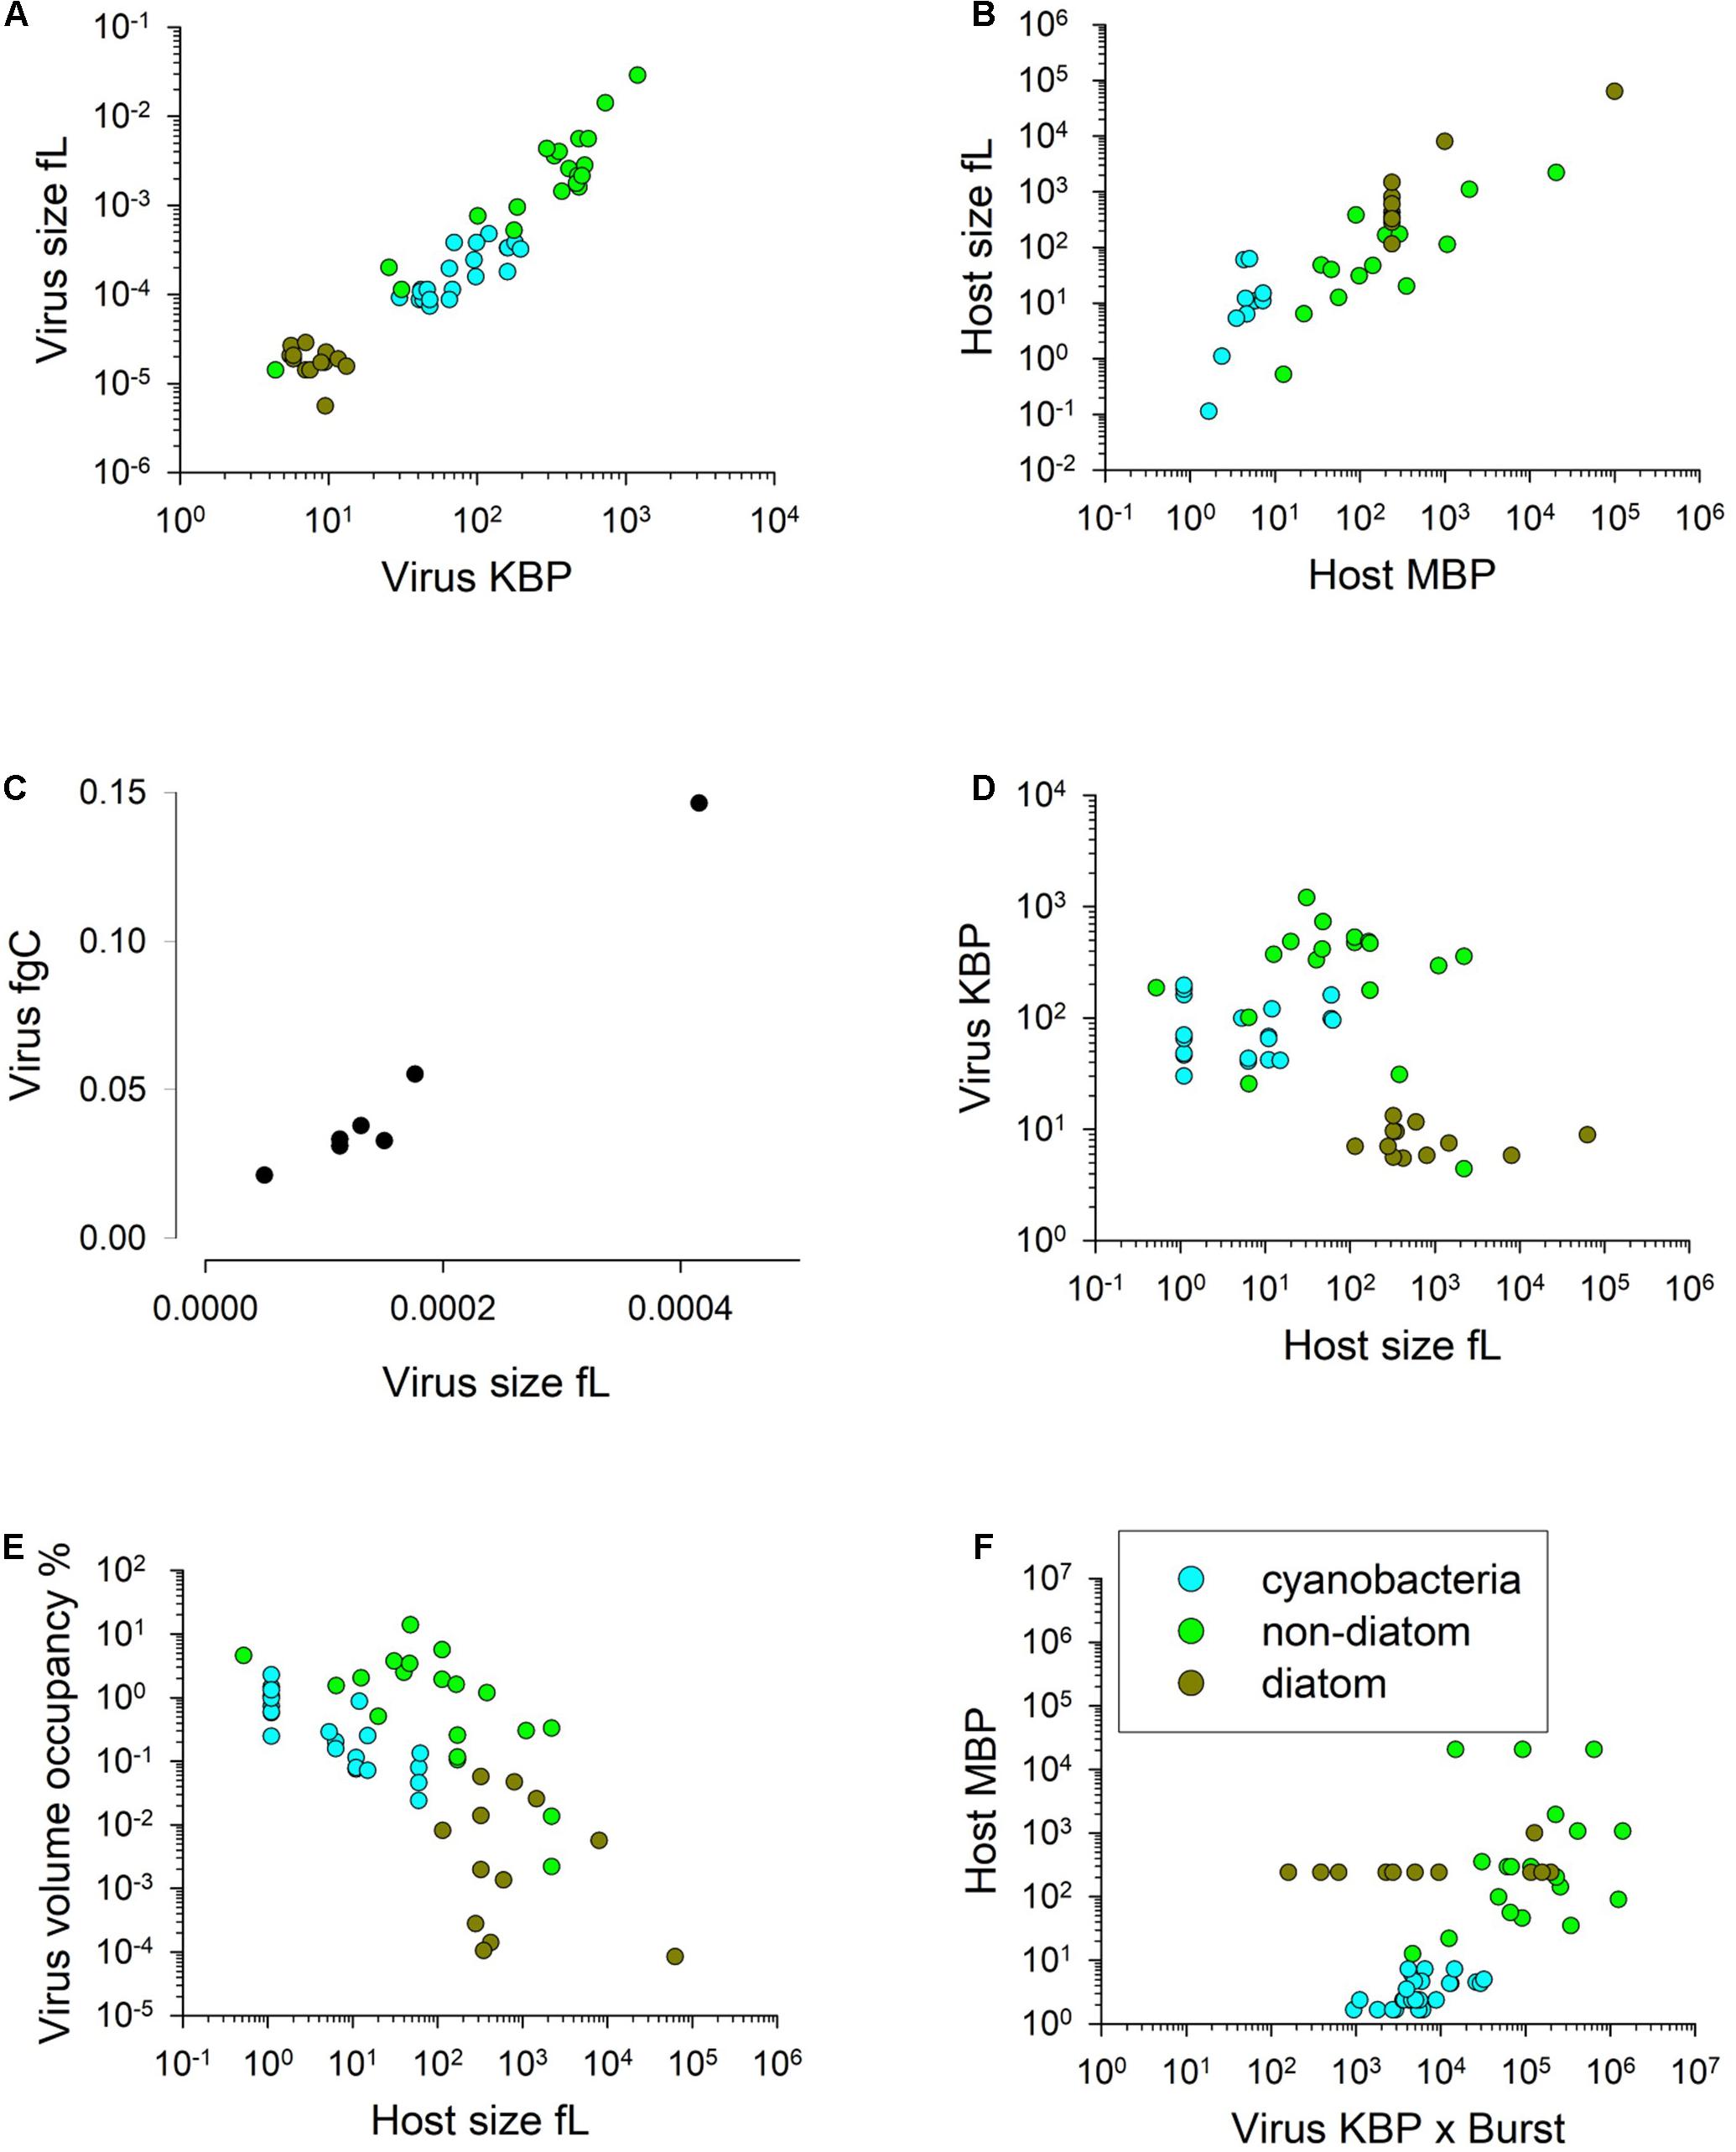
Figure 2. Allometric relationships. Relationships between virus genome size (K base-pairs) and virus volume (panel A; R2 = 0.91, y = 1E6x1.2278) and host genome size (M base-pairs) and host cell volume (panel B; R2 = 0.77, y = 0.7483x0.9679). Relationship between virus volume and virus fgC (panel C; R2 = 0.89, y = 160.2x0.9283). Panel (D) shows virus size (in terms of KBP) versus the size of their host (overall R2 = 0.14). Panel (E) shows the relationships between host cell volume and virus progeny space occupancy (i.e., virus size x burst size) relative to host cell volume expressed at % (all data R2 = 0.38, y = 1.625x–0.656); the highest % occupancy is 14%; most are < 1% (i.e., 100). Panel (F) shows the lack of relationship between the product of (virus genome size) × (burst size) and host genome size (R2 = 0.26); even the highest demand of nucleic acids for viral replication equates to only ca. 0.1% of the host base pair size. Data transformed and manipulated from that collated by Edwards et al. (2020), except panel (C) from Jover et al. (2014).
There is no evidence that larger hosts support the replication of larger viruses (Figure 2D). The potential trade-off for small vs large viruses is discussed by Edwards et al. (2020). Even at extreme values of virus ESD x burst size the volume occupied by the progeny is less than 15% of the host, and most data suggest less than 10% occupancy (Figure 2E). The demand for nucleic acid material for viral replication (as the product of virus stoichiometry and burst size; Figure 2F) also shows no robust relationship that could guide general model construction. Indeed, for most it seems that the amount of nucleic material needed, referenced as base pair equivalents required for just the DNA/RNA content of the virus progeny compared with the host DNA, is trivial.
We may conclude that neither physical space nor provision of nucleic acids typically constrain viral replication and thus that these factors do not provide a robust basis upon which to model the interactions. Data for burst size and virus ESD, versus host size show only a weak positive relationship (larger hosts typically produce a larger viral biomass at burst; Figure 3A). However, in terms of just numeric abundance for the release of progeny, larger phytoplankton hosts typically have a higher maximum burst size (Figure 3B). Under optimal conditions for virus replication, a maximum burst size (Bmax) will be attained. It is important to note that burst size as modelled here is of non-defective, infectious, progeny. The biomass associated with defective viruses is assumed in the model to be associated with host cell fragments.
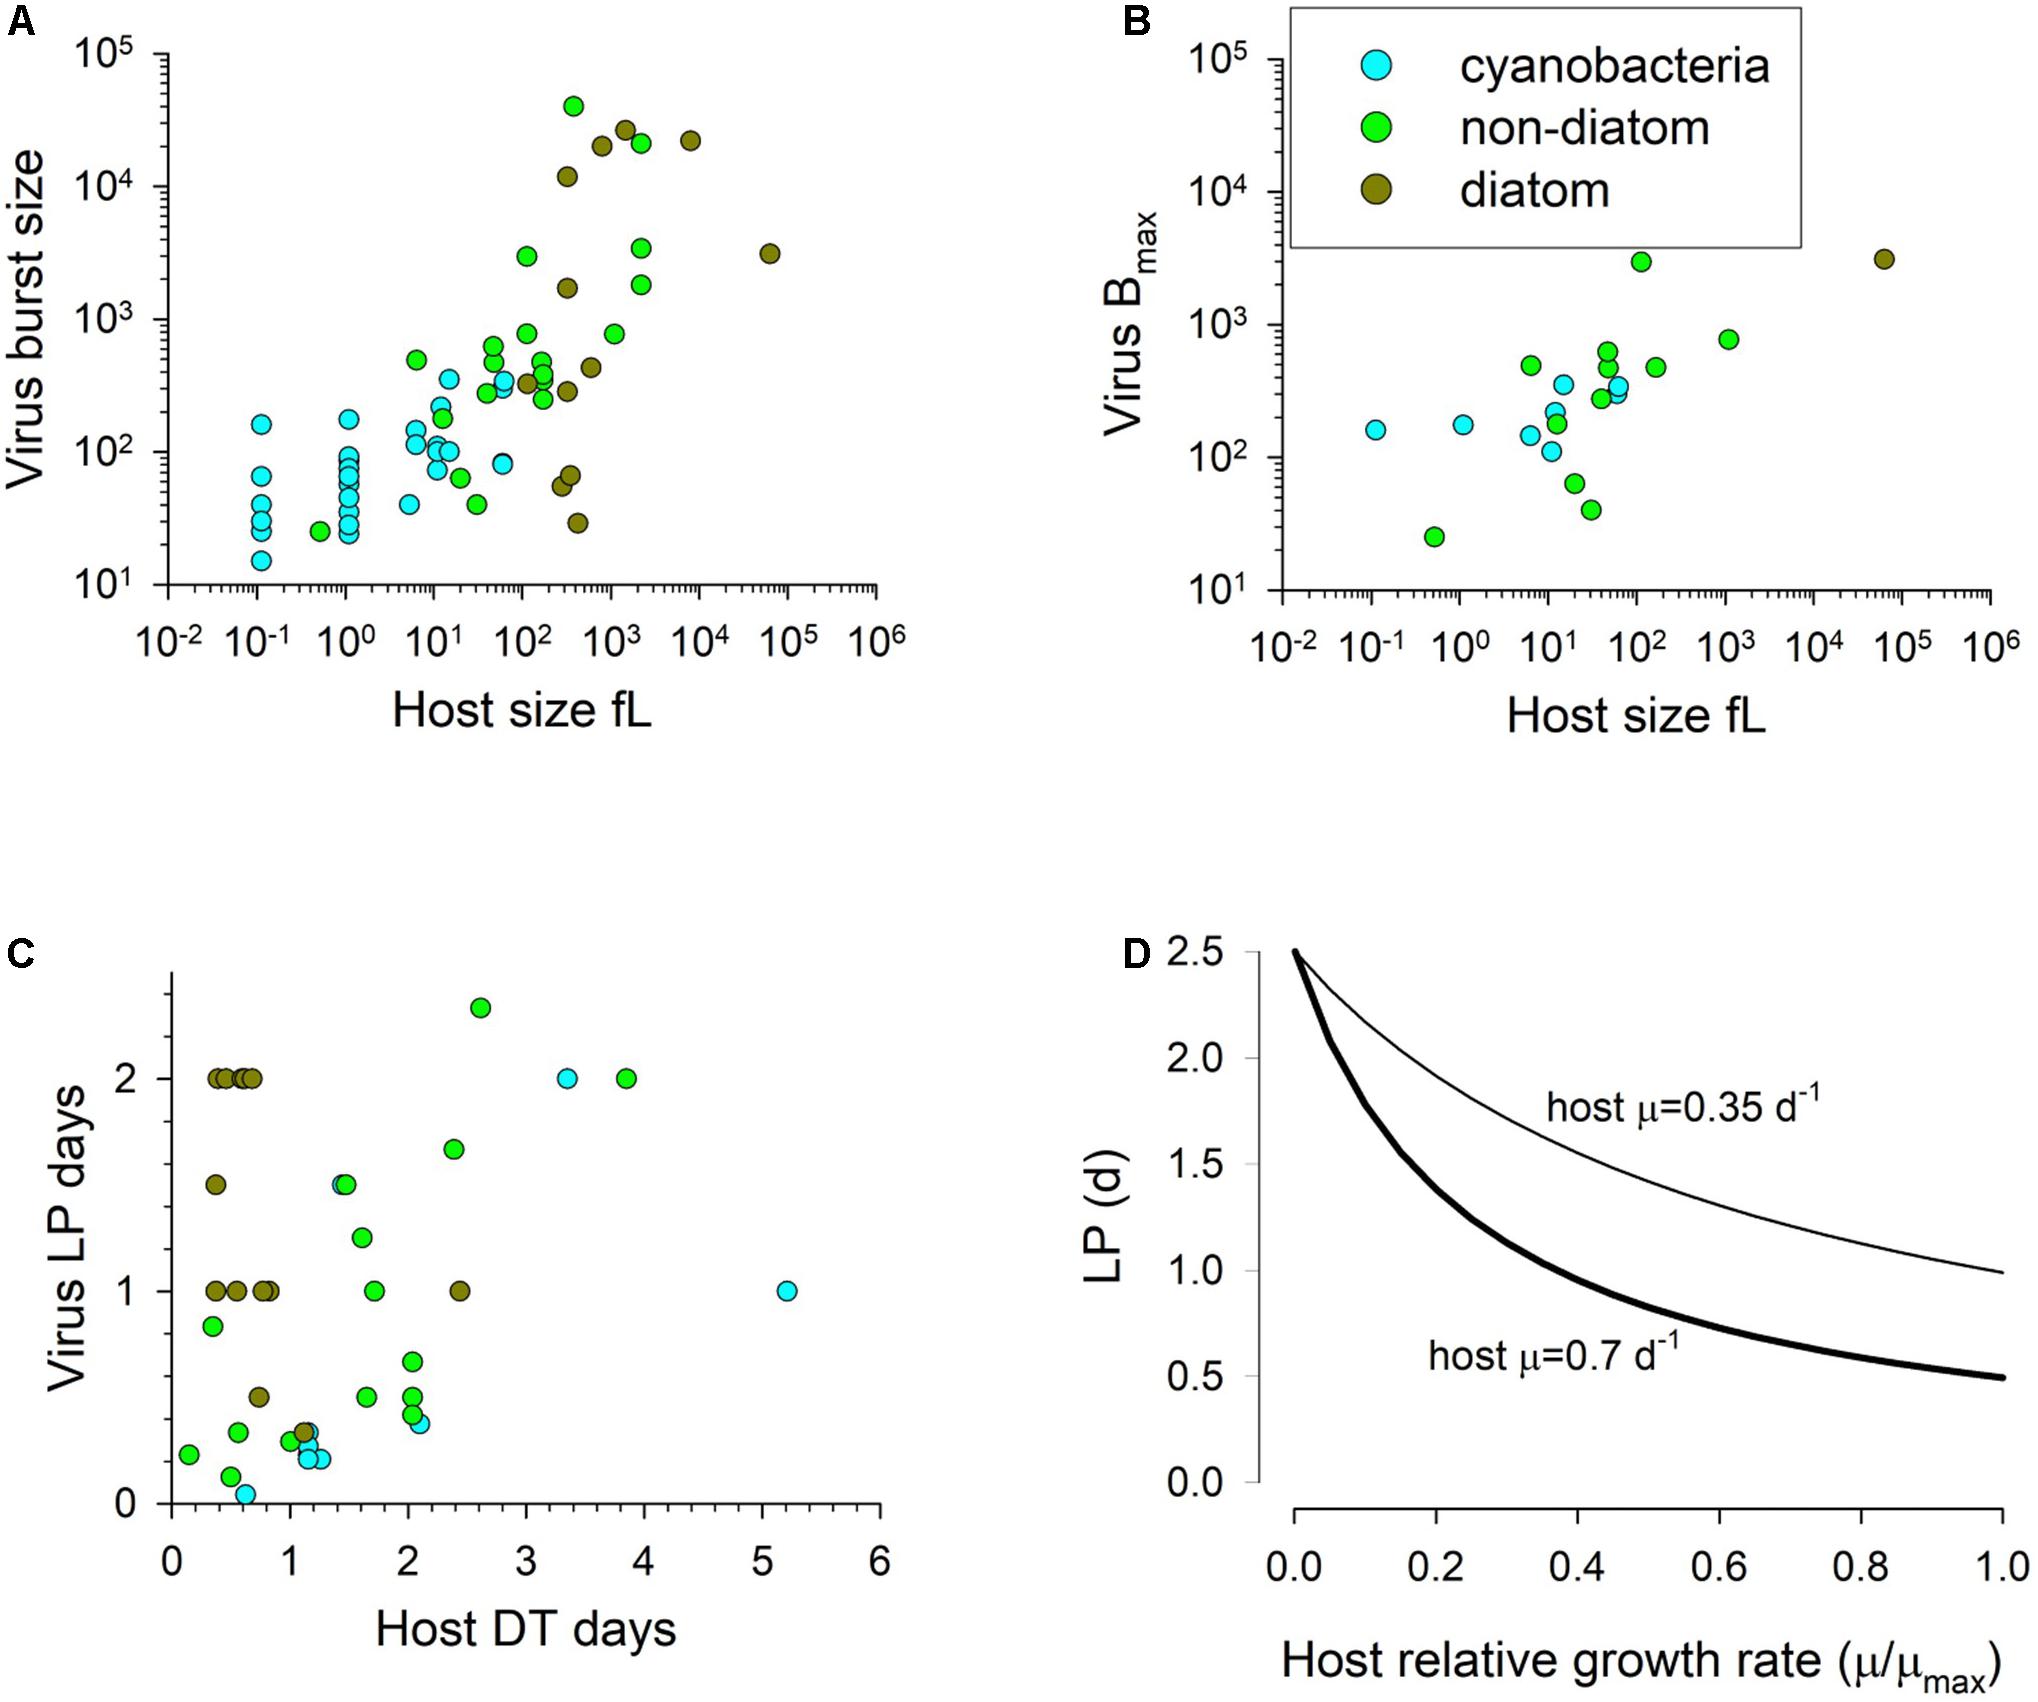
Figure 3. Panels (A) and (B) show the burst size vs host cell volume; panel (A) has an all- data relationship of R2 = 0.54, y = 56.56x0.4647, while panel (B) shows the maximum burst size per species with an all-data relationship of R2 = 0.47, y = 86.6x0.4753. Panel (C) shows the relationship between host doubling time and the latent period, while panel (D) shows the functional relationship between normalised host growth rate and latent period from Eq.11 for two different maximum host growth rates (0.35 and 0.7 d–1) with LPmin normalised to the value of μmaxT (LPDTmin) as 0.5. LP = 2.5d at relative growth rate of 0. Source data from that collated by Edwards et al. (2020).
As the virus makes use of the host biochemical machinery, there is logic in relating the production process to the physiological and energetic state of the host, and (in the absence of information to the contrary) to relate it to the state of the concurrent uninfected host. Accordingly, we relate the doubling time of the host to the LP of virus production. Table 2 describes the variables.
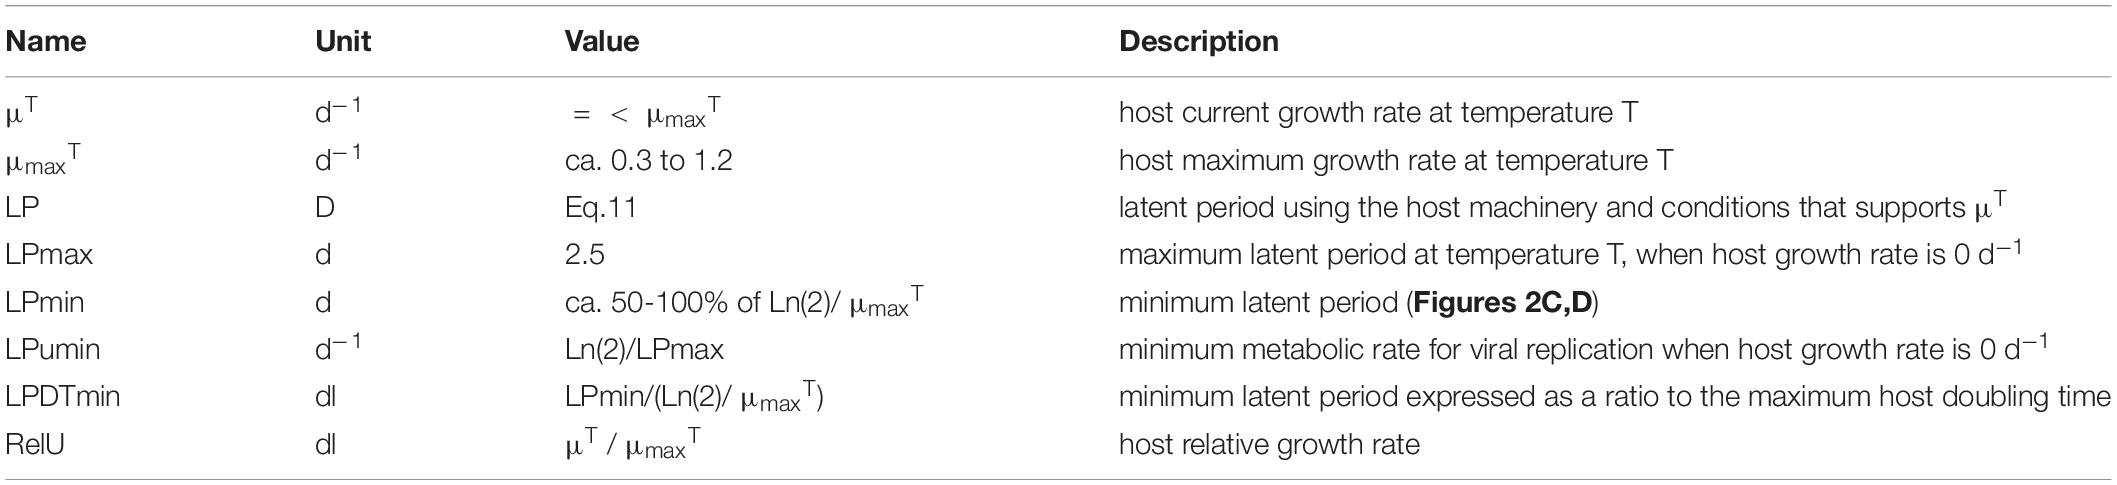
Table 2. Parameters describing the latent period.
The duration of LP documented in the literature is highly variable. The data in Table 2 of Edwards et al. (2020), transformed to give host doubling times (DT) and LP in days, show an average ratio of LP:DT of 1.2, but a median of 0.6 (minimum 0.067, maximum 5.1, with a minimum LP of 0.042d and maximum of 2.3d). The slope of the line through the data in Figure 3C suggests a LP:DT of ca. 0.5. However, these data were not specifically collected for the purpose of comparing LP with the concurrent (uninfected) host DT. We thus do not know what the maximum latent period may be.
In the model we make the assumption that LP has a minimum time related to biochemical processing limitations, but is then lengthened pro rata with the division time of the uninfected host (i.e., it is linked to the growth rate potential of the host) up to a maximum period (Figure 3D). Pragmatically, the maximum duration of LP and the timestep used in the simulation define the array size needed to document the passage of generations of viruses through the host population.
If we assume a host growth rate at the extant temperature to be μT (d–1), then its doubling time is Ln(2)/μT days. We can state the minimum latent period (LPmin, d) as a ratio of that host doubling time value when μT = μmaxT. Thus, if temperature affects the host growth rate, assuming sufficient nutrient and light availability, it automatically affects the ability to replicate viruses as well. There needs also to be a maximum latent period. While that period is likely to change as a function of temperature as well, for computational reasons (as it affects the size of the array for the infected A1) it is easiest if it is held constant; the value (set here as 2.5d) is at the upper bound in Figures 3C,D. Changing this value between 5 and 20 d increases the resulting latent period by approximately only 10% at a relative growth rate (i.e., μT/μmaxT) of 0.5.
Accordingly, we compute the resultant latent period (in days) as:
The form of this function is shown in Figure 3D; see also Table 2.
To take full account of temperature, whatever Q10 factor (Q10f) is applied to the reference growth rate (μmaxRT) to obtain μmaxT should also be applied to the value of LPmax (i.e., LPmaxT = LPmaxRT/Q10f, just as μmaxT = μmaxRT x Q10f). However, care must be taken to ensure that if the simulated temperature falls, then LPmax does not exceed the size dimension of the array used for the infected host (i.e., for arrayed state variable A1V1). We consider the implications of using different values for LPmin and LPmax in Results.
From the information considered above (see Figures 2, 3), we conclude that there is only one systematic relationship useful for modelling between virus and host size (whether that is in terms of base-pair content or physical size), and that is for burst size and host size.
We thus proceed on the assumption that the modeller will define the maximum burst size (Bmax) informed by empirical knowledge, or to use the power description noted in the legend Figure 3. Parameters describing burst size are described in Table 3. We thus have for an allometric description, the equation:
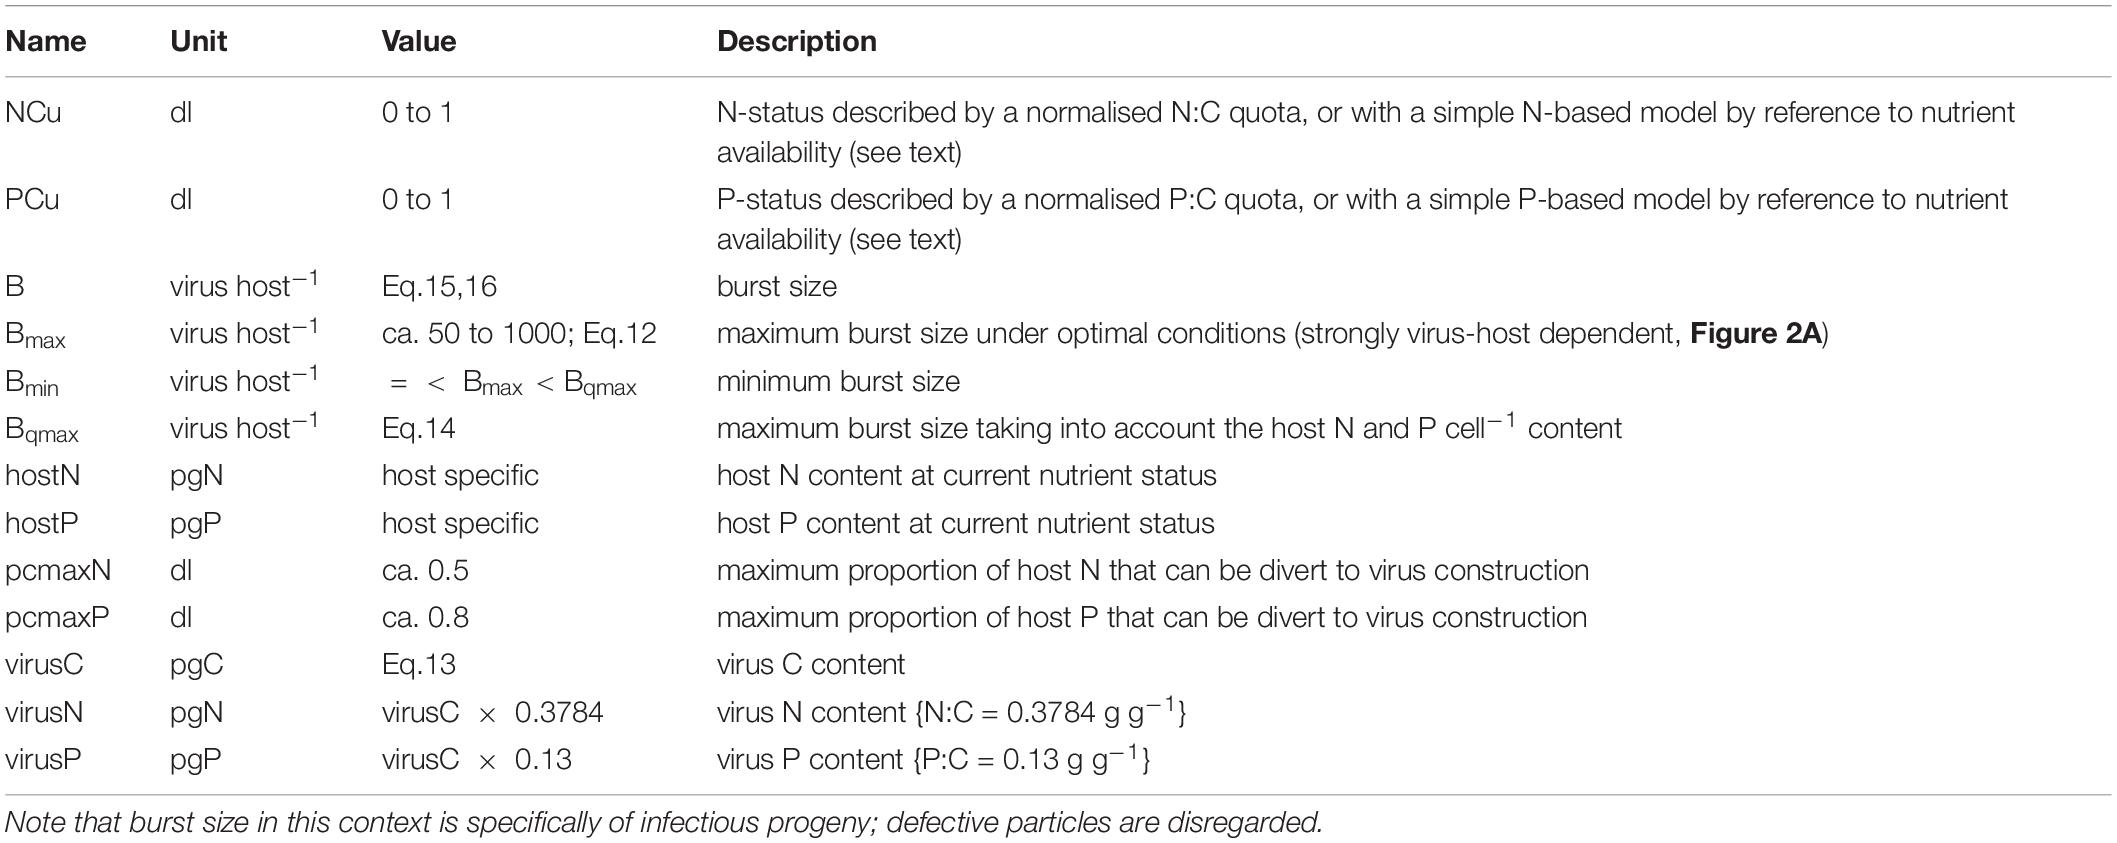
Table 3. Parameters describing the burst size.
The following describes the modelling of the relationship between host physiological status and burst size (B). We refer to indices of host N resource availability, which defines the physiological status in this N-based model, as NCu.
The value of the minimum burst size, Bmin, is unknown; here we assume it is around ca. 10% of Bmax and explore the implications of changing values of Bmax and Bmin in Results. Data for elemental composition of viruses is sparse, but from those in Jover et al. (2014) we can estimate a relationship between virus volume ({virus vol} in fL (i.e., μm3) and calculated assuming a sphere) and C per virus (virusC; see also Figure 2C) of:
The average C:N and C:P mass ratios from Jover et al. (2014) are 2.643 gC gN–1 and 7.67 gC gP–1; quota models for algal growth tend to use the inverse of this ratio, giving us 0.3784 gN gC–1 and 0.13 gP gC–1, respectively. From this, and a knowledge of the host cell size with a given elemental composition, it is possible to calculate the likely maximum burst size as a minimum function of virus N and P demands, and host N and P content:
The values of pcmaxN or pcmaxP define the maximum proportion of host N or P (respectively) that is available to support virus production. If we consider the relative values of the minimum N:C or P:C quotas to that supporting maximum growth (e.g., Flynn, 2008), assuming that the difference describes non-structural N or P, then as an extreme value pcmaxPC may attain a value approaching 0.8. We can then calculate the burst size (B) as a value between Bmax and Bmin, controlled by a quotient for N-status (NCu) and for P-status (PCu), with a minimum size set by Bqmax.
If, however, we are confident that P resource limitation is not an issue (which we assume here), so we only need reference the N-status (NCu), then we can use a simpler approach such as that in Eq.16.
Here BminRel is the value of Bmin set relative to Bmax (i.e., BminRel = Bmin/Bmax).
Decay and Loss Processes
Virus particles, specifically infectious non-defective progeny, are lost from the infection cycle by the following routes:
(i). adsorption onto non-host particles (see section on encounters, above), which may or may not then be associated with consumption by grazers
(ii). decay mediated by exoenzymes of (especially) bacteria
(iii). abiotic factors such as UV light and dilution effects of mixing over the ergocline
(iv). direct consumption of free viruses by protists that are so equipped to capture such small particles (noting that virus consumption is likely mainly indirect by ingestion of larger items on to which viruses are already attached)
(v). consumption of viruses within infected hosts during predation of those cells by grazers
None of these will be 100% effective in removing all infective viruses; given the extremely high abundance of viral particles even a small fraction percentage survival may be sufficient to continue the infection. Here we consider routes (i) to (iii) as the others require placement of the model in an ecological setting (which will be considered in subsequent papers). Any differential losses on infected vs non-infected hosts can be readily explored by reference to the explicitly described infected hosts via the arrayed state variable A1V1.
Abiotic factors (route (iii)) are primarily associated with washout from the mixed layer and with chemical changes to virus particles due to light (especially UV-B). Absorption onto particles that sediment out of the surface waters will remove viruses; we do not consider such a loss route here as particles with high adsorption rates are very small (< 4 μm) with low sedimentation rates, though aggregates may sink more rapidly. Like all (non-vertical migratory) members of the plankton, the effective population growth of the virus-plankton must at least match the wash-out rate (of ca. 0.02 – 0.05 d–1) to retain a presence in the mixed layer.
Light, specifically UV light, is generally considered to be a significant (if not the most significant) decay route for viruses and is suspected to result in loss rates of the order of 0.5 d–1 (Suttle and Chen, 1992). That rate will depend on temperature and light penetration. Light penetration depends on the mixing depth, and the presence of light-absorbing matter in the water. The latter includes colloids and other materials that may act as adsorption surfaces for viruses and, while protecting against UV-B damage, will also result in the rapid loss of virus particles from the infection cycle. The other source of light attenuation is the plankton biomass, which may well include the biomass of the host itself. The significance of UV-enacted decay will depend on the lighting of the water column (seasonal and weather), the mixed layer depth and the nutrient load. It will also depend on the relative abundance of non-host biomass that may shield the virus from light until that biomass is consumed by grazer or viral attack.
In the model, viral decay linked to light is described using Eq.17 as a rate (d–1) between the maximum (V1decmax) that occurs under full surface UV and the minimum that occurs in darkness (V1decmin).
The value of UVavg is the average light within the MLD, and is given by Eq.18.
The total attenuation (from all sources, but here attributed to that by water and that by the organics) is described by UVatt_tot, which is given by MLD × (attco_wUV+attco_OrgCUV); attco_wUV is the attenuation of UV light by water, and attco_OrgCUV is UV light attenuation by organics, both with units of m–1. The consequences of changing V1decmax and V1decmin are explored in Results.
Simulation Configurations
This paper considers 1 phytoplankton host (A1) and 1 virus (V1) interacting in a system of different depth, light, nutrient, and commencing with different V1 inoculation levels relative to that of the host (and hence impacting growth of A1 at different stages during the bloom development). Different trait configurations are considered for both the host and virus.
The model was constructed using Powersim Studio-10 (www.powersim.com) and run as a set of ODEs under an Euler integration routine with time-step size of 0.03125 d (= 45min).
Results
General Features of the Model
The results are presented for the most part with one feature varied at a time, and thus assume all else remains constant, unless otherwise indicated. Results are generally presented in the order of abiotic, host and virus-specific features.
Parameter values for the default model are given in Table 4 with simulation output in Figure 1B; this includes output in the absence of the virus. Fragments are of the lysed host. The saw-tooth appearance of the host plots reflect growth in the light:dark irradiance cycle. This simulation is used as the control for other simulations and is reproduced in each of the other simulation figures to aid comparisons. Figure 1B with the virus shows how the virus attack destroys the host, liberating fragments into the water. Even at the peak, the virus accounts for only 1% of the N in the system. As the nutrient (DIN) concentration is significantly decreased prior to the attack taking hold, the burst size decreases as the host becomes N-stressed. The increase in burst size from day 12 onwards is due to recovery of the nutrient status associated here with a rapid remineralisation of the host fragments to DIN. The dynamics in nature would depend on the decay of the fragments, and thence to bacterial and bactivorous-protozooplankton activity which are not modelled explicitly here.
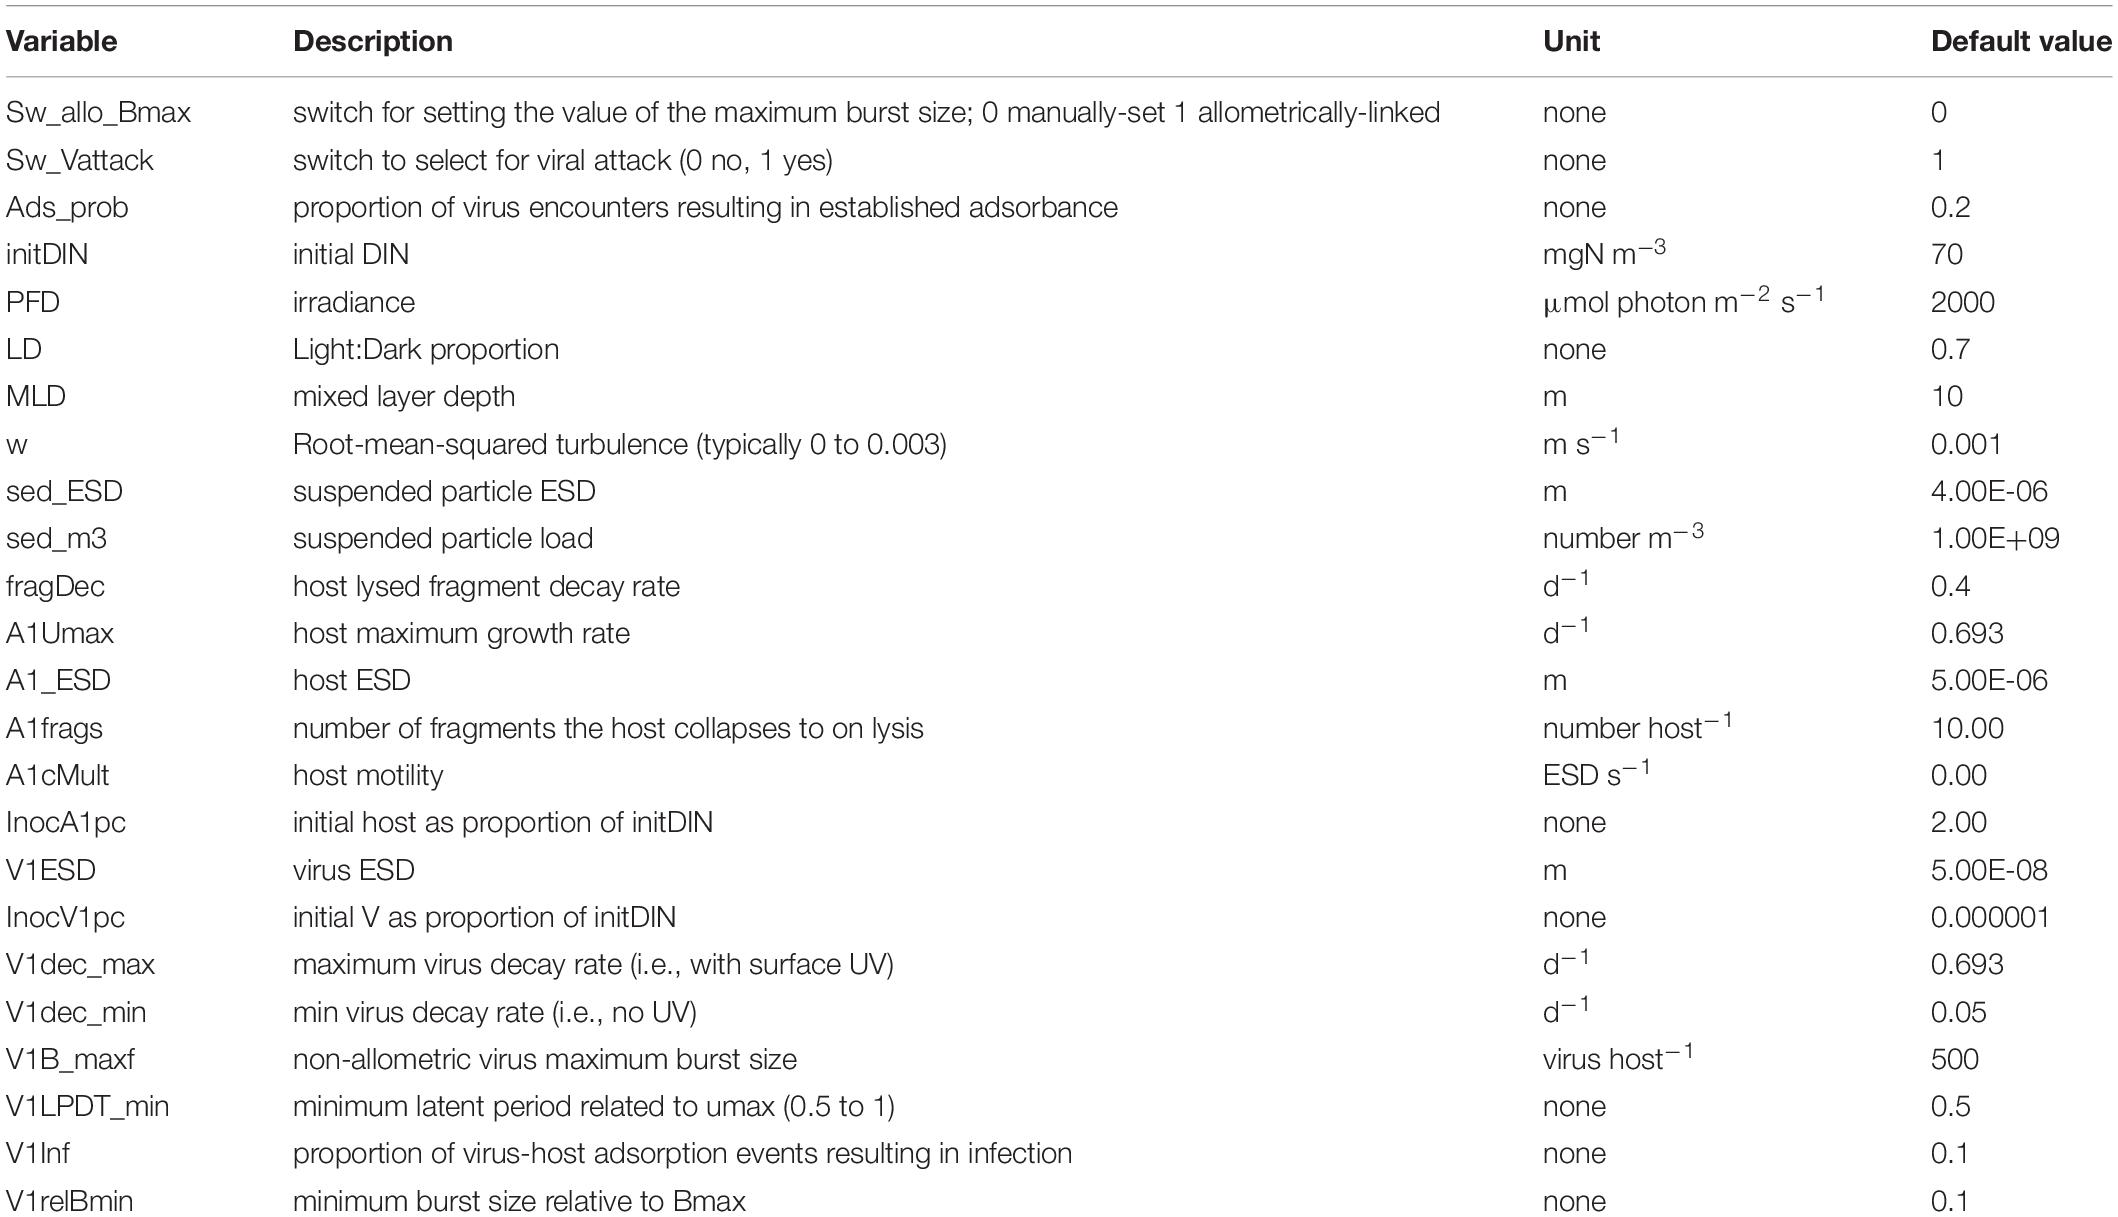
Table 4. Variables changed during the simulations and the values in the default (control) simulation. ESD – equivalent spherical diameter.
Abiotic Effects
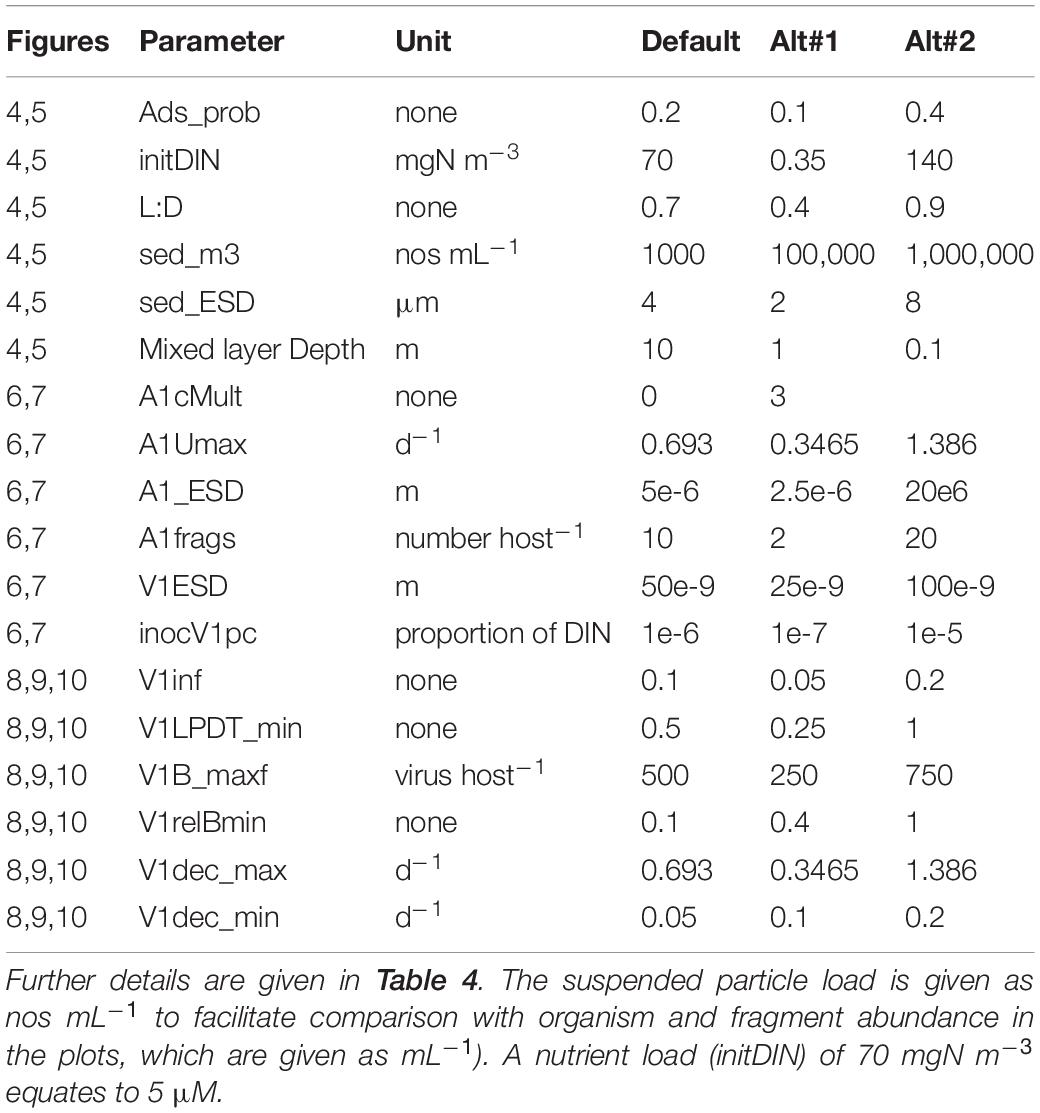
From Figure 4 it is apparent that the global absorbance value (Ads_prob) has a very significant effect on the whole simulation. The amount of nutrient in the system (initDIN) has effects that are both direct (more host biomass from more nutrient) and indirect (affecting the likelihood of nutrient stress and thence decreased burst size). The light:dark periodicity (LD), and the mixed layer depth (MLD, which also affects light penetration supporting phototrophic host growth) also affects the dynamics, as does the onset of nutrient exhaustion in consequence of host growth. Only with a very shallow MLD is UV light damaging to the virus population (Figure 4; see also below Virus Trait Effects).
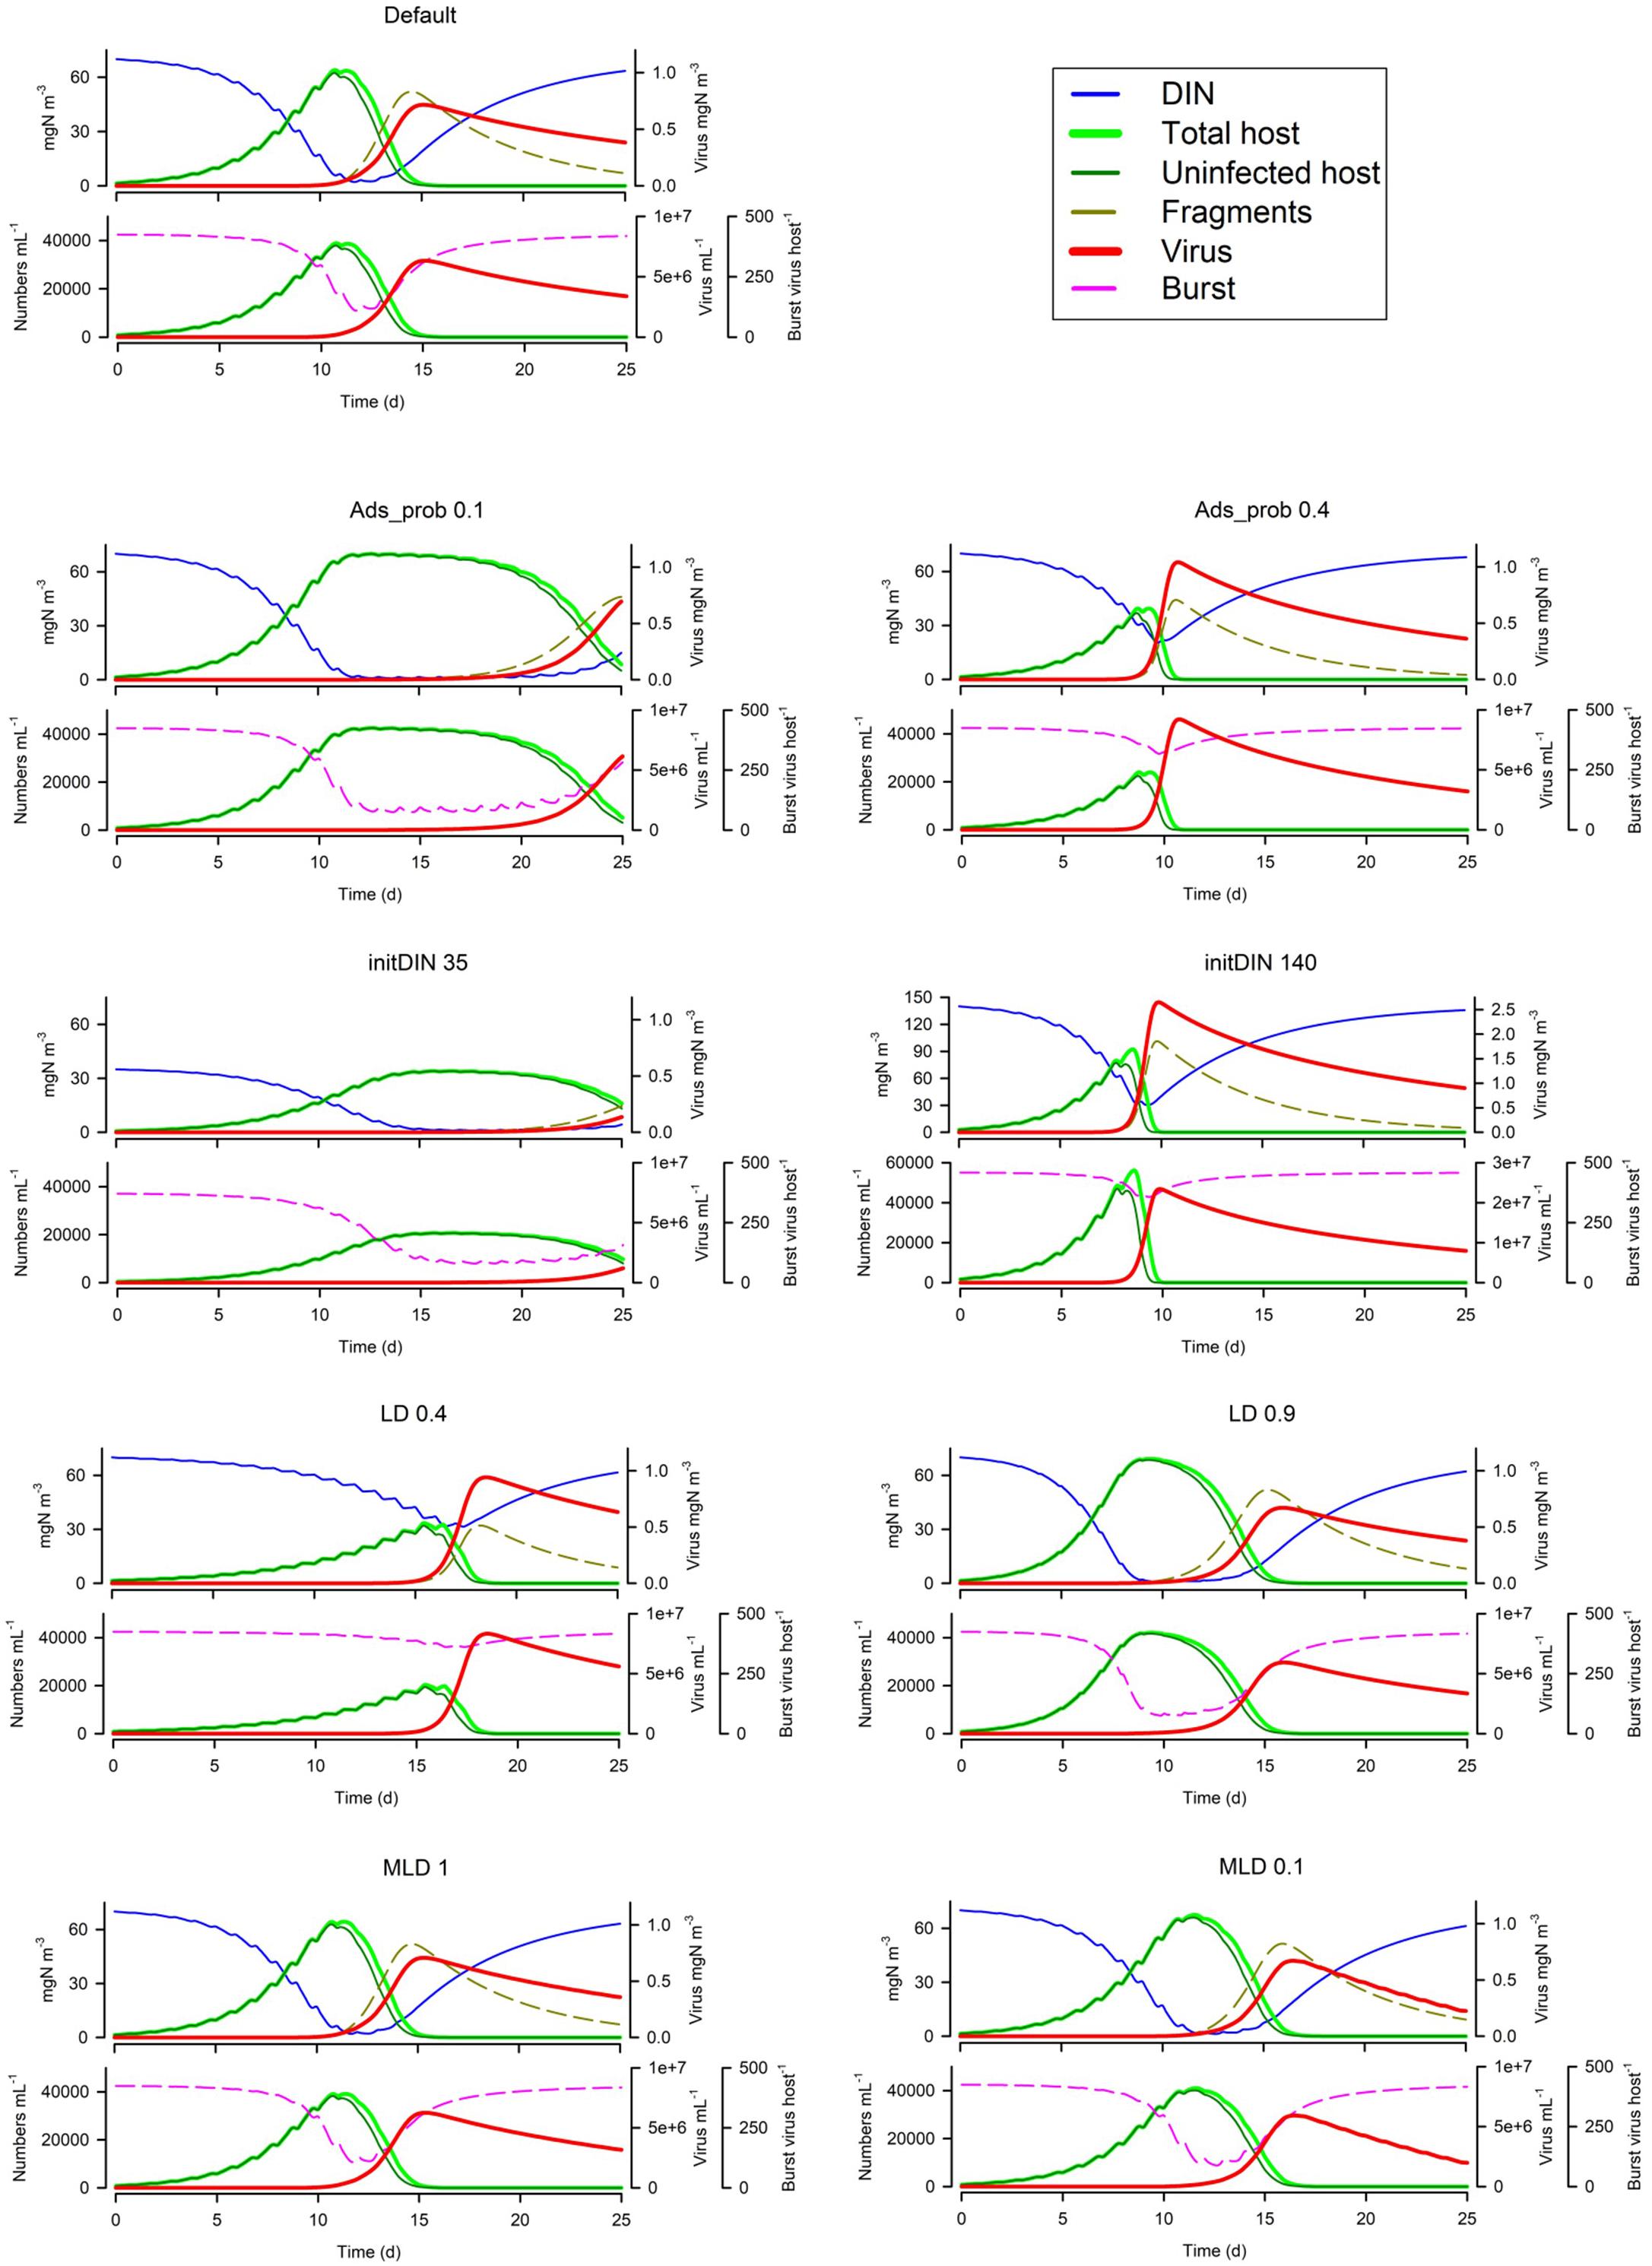
Figure 4. Effects of changing the global absorbance value (Ads_prob), the amount of nutrient in the system (initDIN), the light:dark periodicity (LD), and the mixed layer depth (MLD). The Default (Figure 1B) is reproduced in the top left-hand corner. See also Table 5.
In Figure 5 we see the effects of suspended particle abundance, and also of their size. Above a certain level of particle abundance, the consequential adsorbance of viruses onto this material de facto prevents the attack on the host. Larger particles exacerbate this effect (though in reality larger particles, above ca. 4 μm ESD, would also sediment out of the water column quicker).
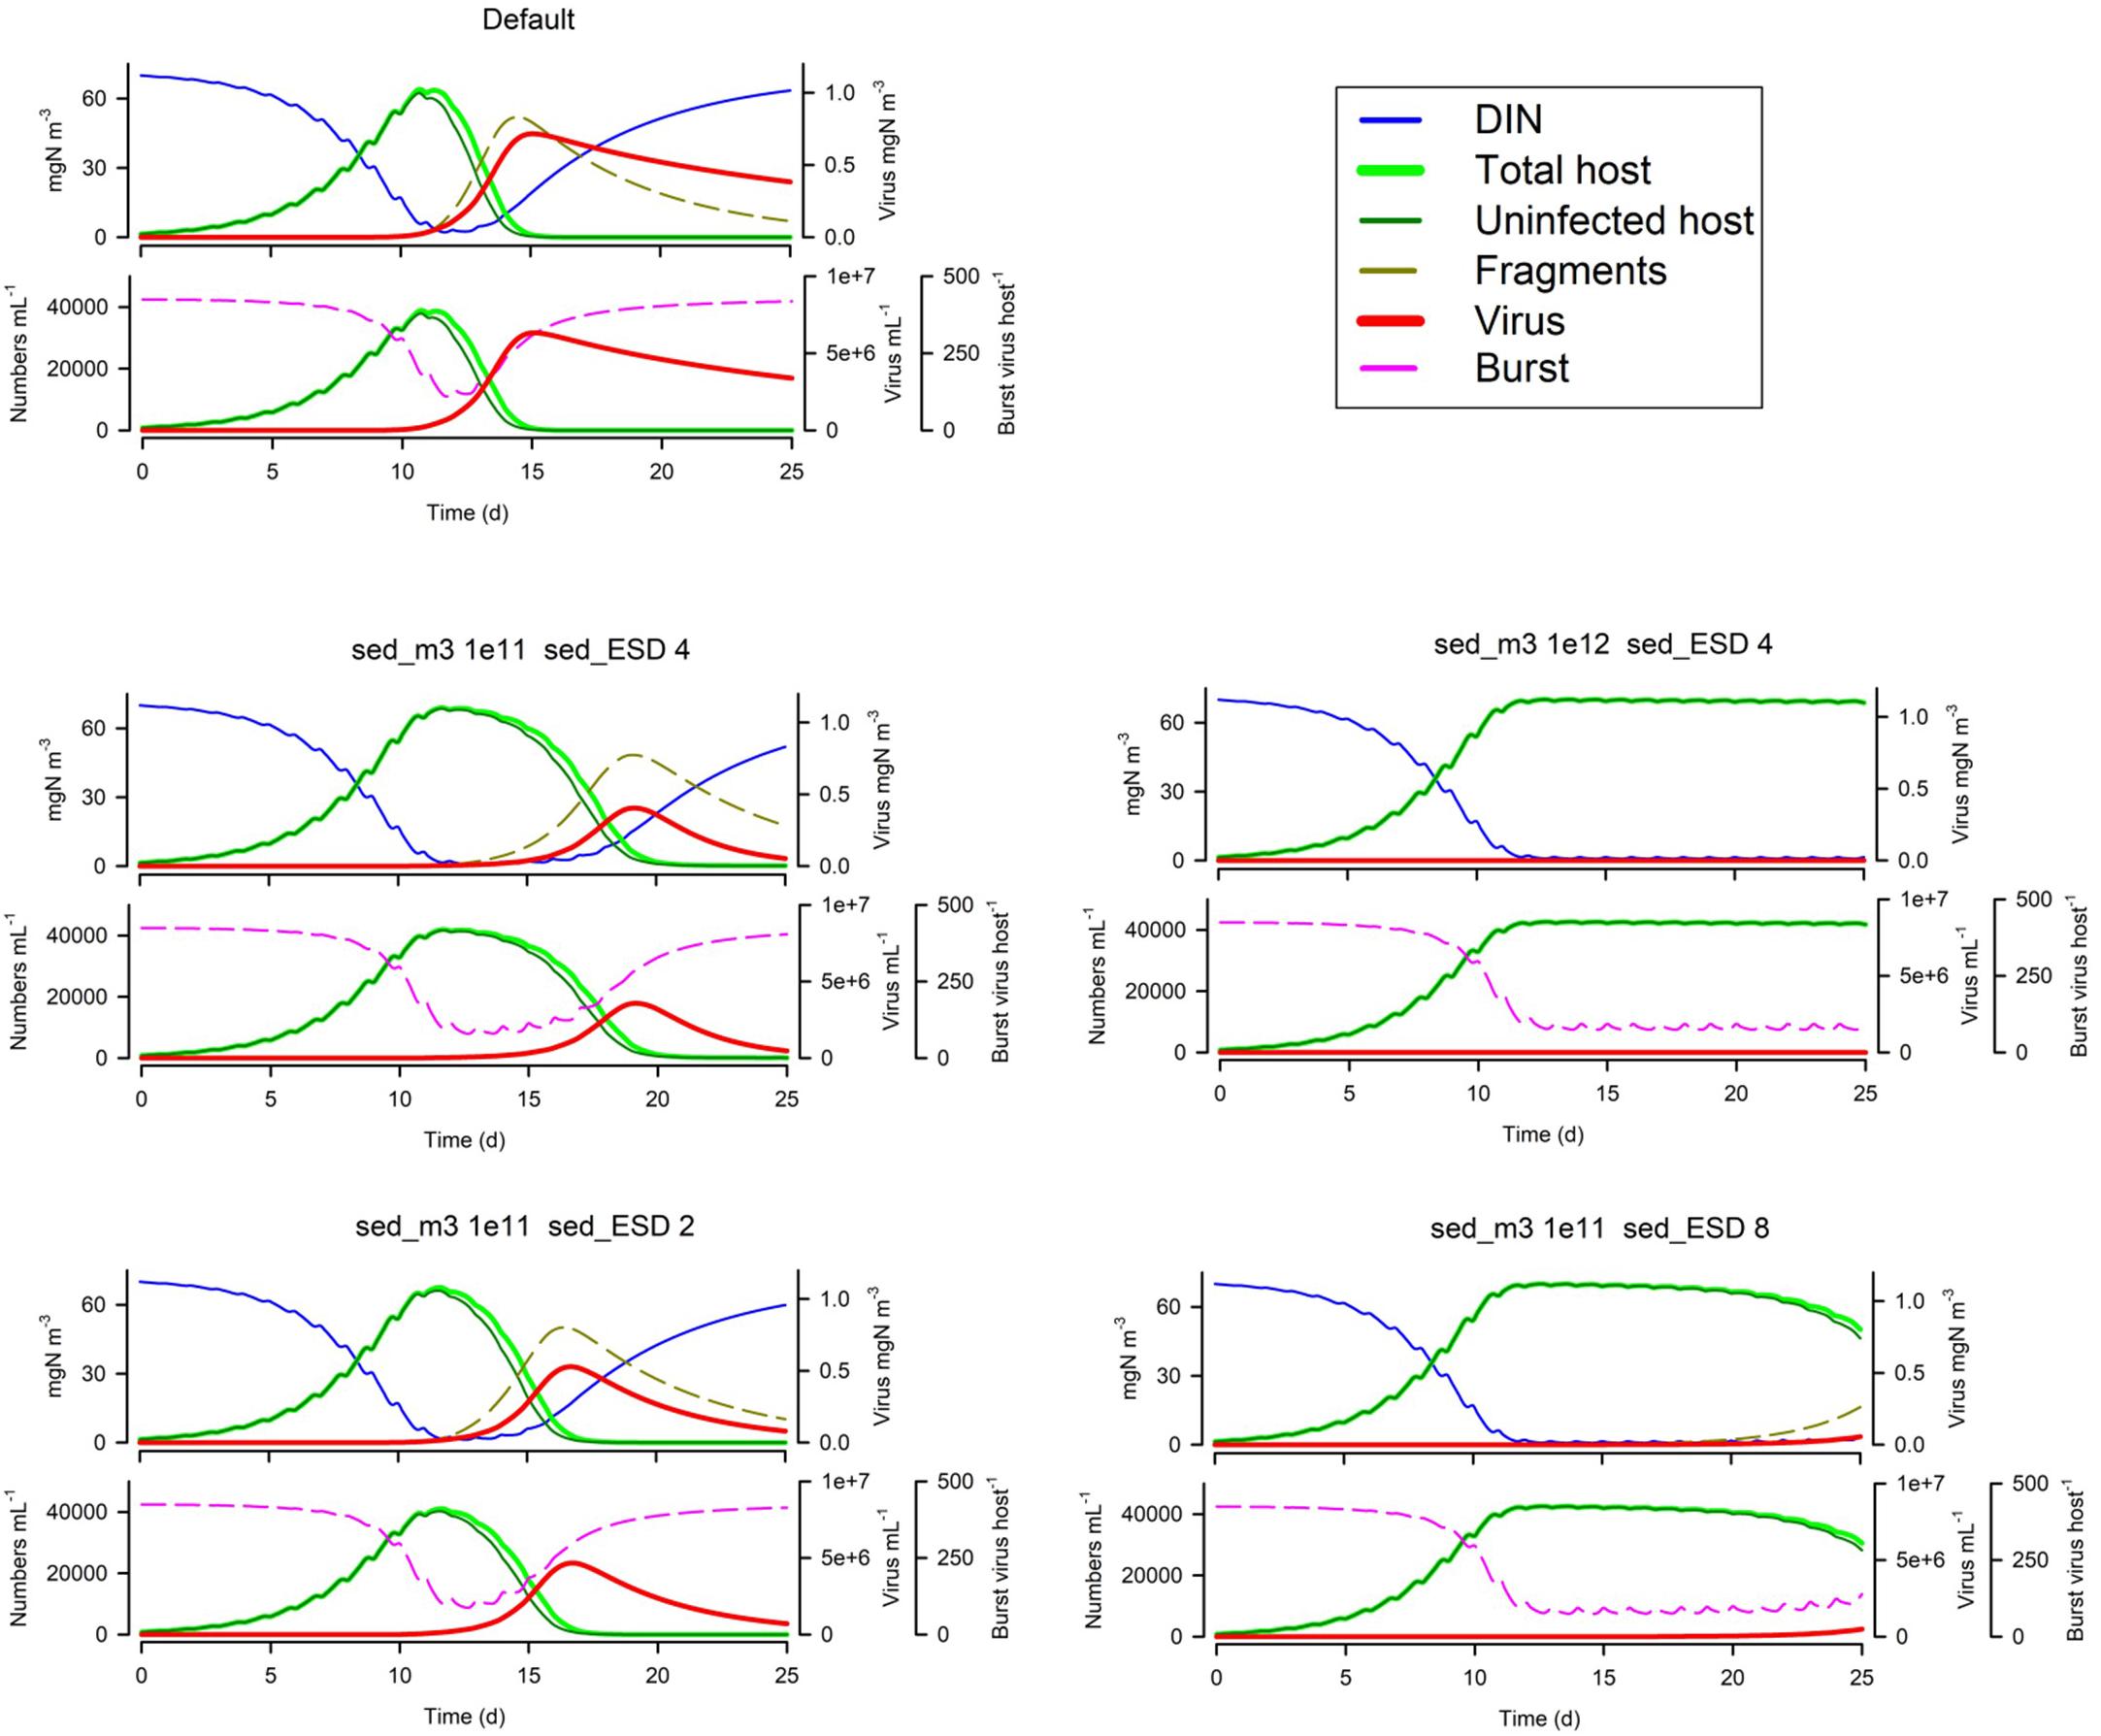
Figure 5. Effects of suspended particle abundance 1E11 or 1E12 m–3 vs Default of 1E3 m–3) and suspended particle size (2 or 8 μm ESD vs Default of 4 μm). The Default (Figure 1B) is reproduced in the top left-hand corner. See also Table 5.
Host Trait Effects
Figure 6 shows that motile host cells are more vulnerable as motility increases the likelihood of encountering viruses; note that all other simulation use non-motile hosts. The host maximum growth rate (Umax; Figure 6) has an interesting effect depending on the system; in the simulation shown the actual virus yield is higher for slower growing hosts, because in the scenario with the faster growing host, the nutrients become exhausted before the virus takes hold and also the burst size is decreased. More commonly, a higher host growth rate increases virus yield. Host fragmentation on lysis has a relatively minor effect on the dynamics (Figure 6); more fragments provide some protection for the host (consistent with the effect of suspended particle loading, Cf. Figure 5). Also in Figure 6, we see that with a fixed maximum burst size (as used in all simulations except Figure 7), smaller hosts are far more vulnerable, and indeed larger hosts here are not affected at all. However, when an allometric-linked maximum burst size is used (Figure 7) much of this advantage for larger hosts is lost, as these larger cells also produce more progeny. Nonetheless a distinct advantage for larger hosts against virus attack is still apparent, in that the final virus abundance is much lower (The size and initial inoculum of viruses was the same in the simulations shown in Figures 6, 7).
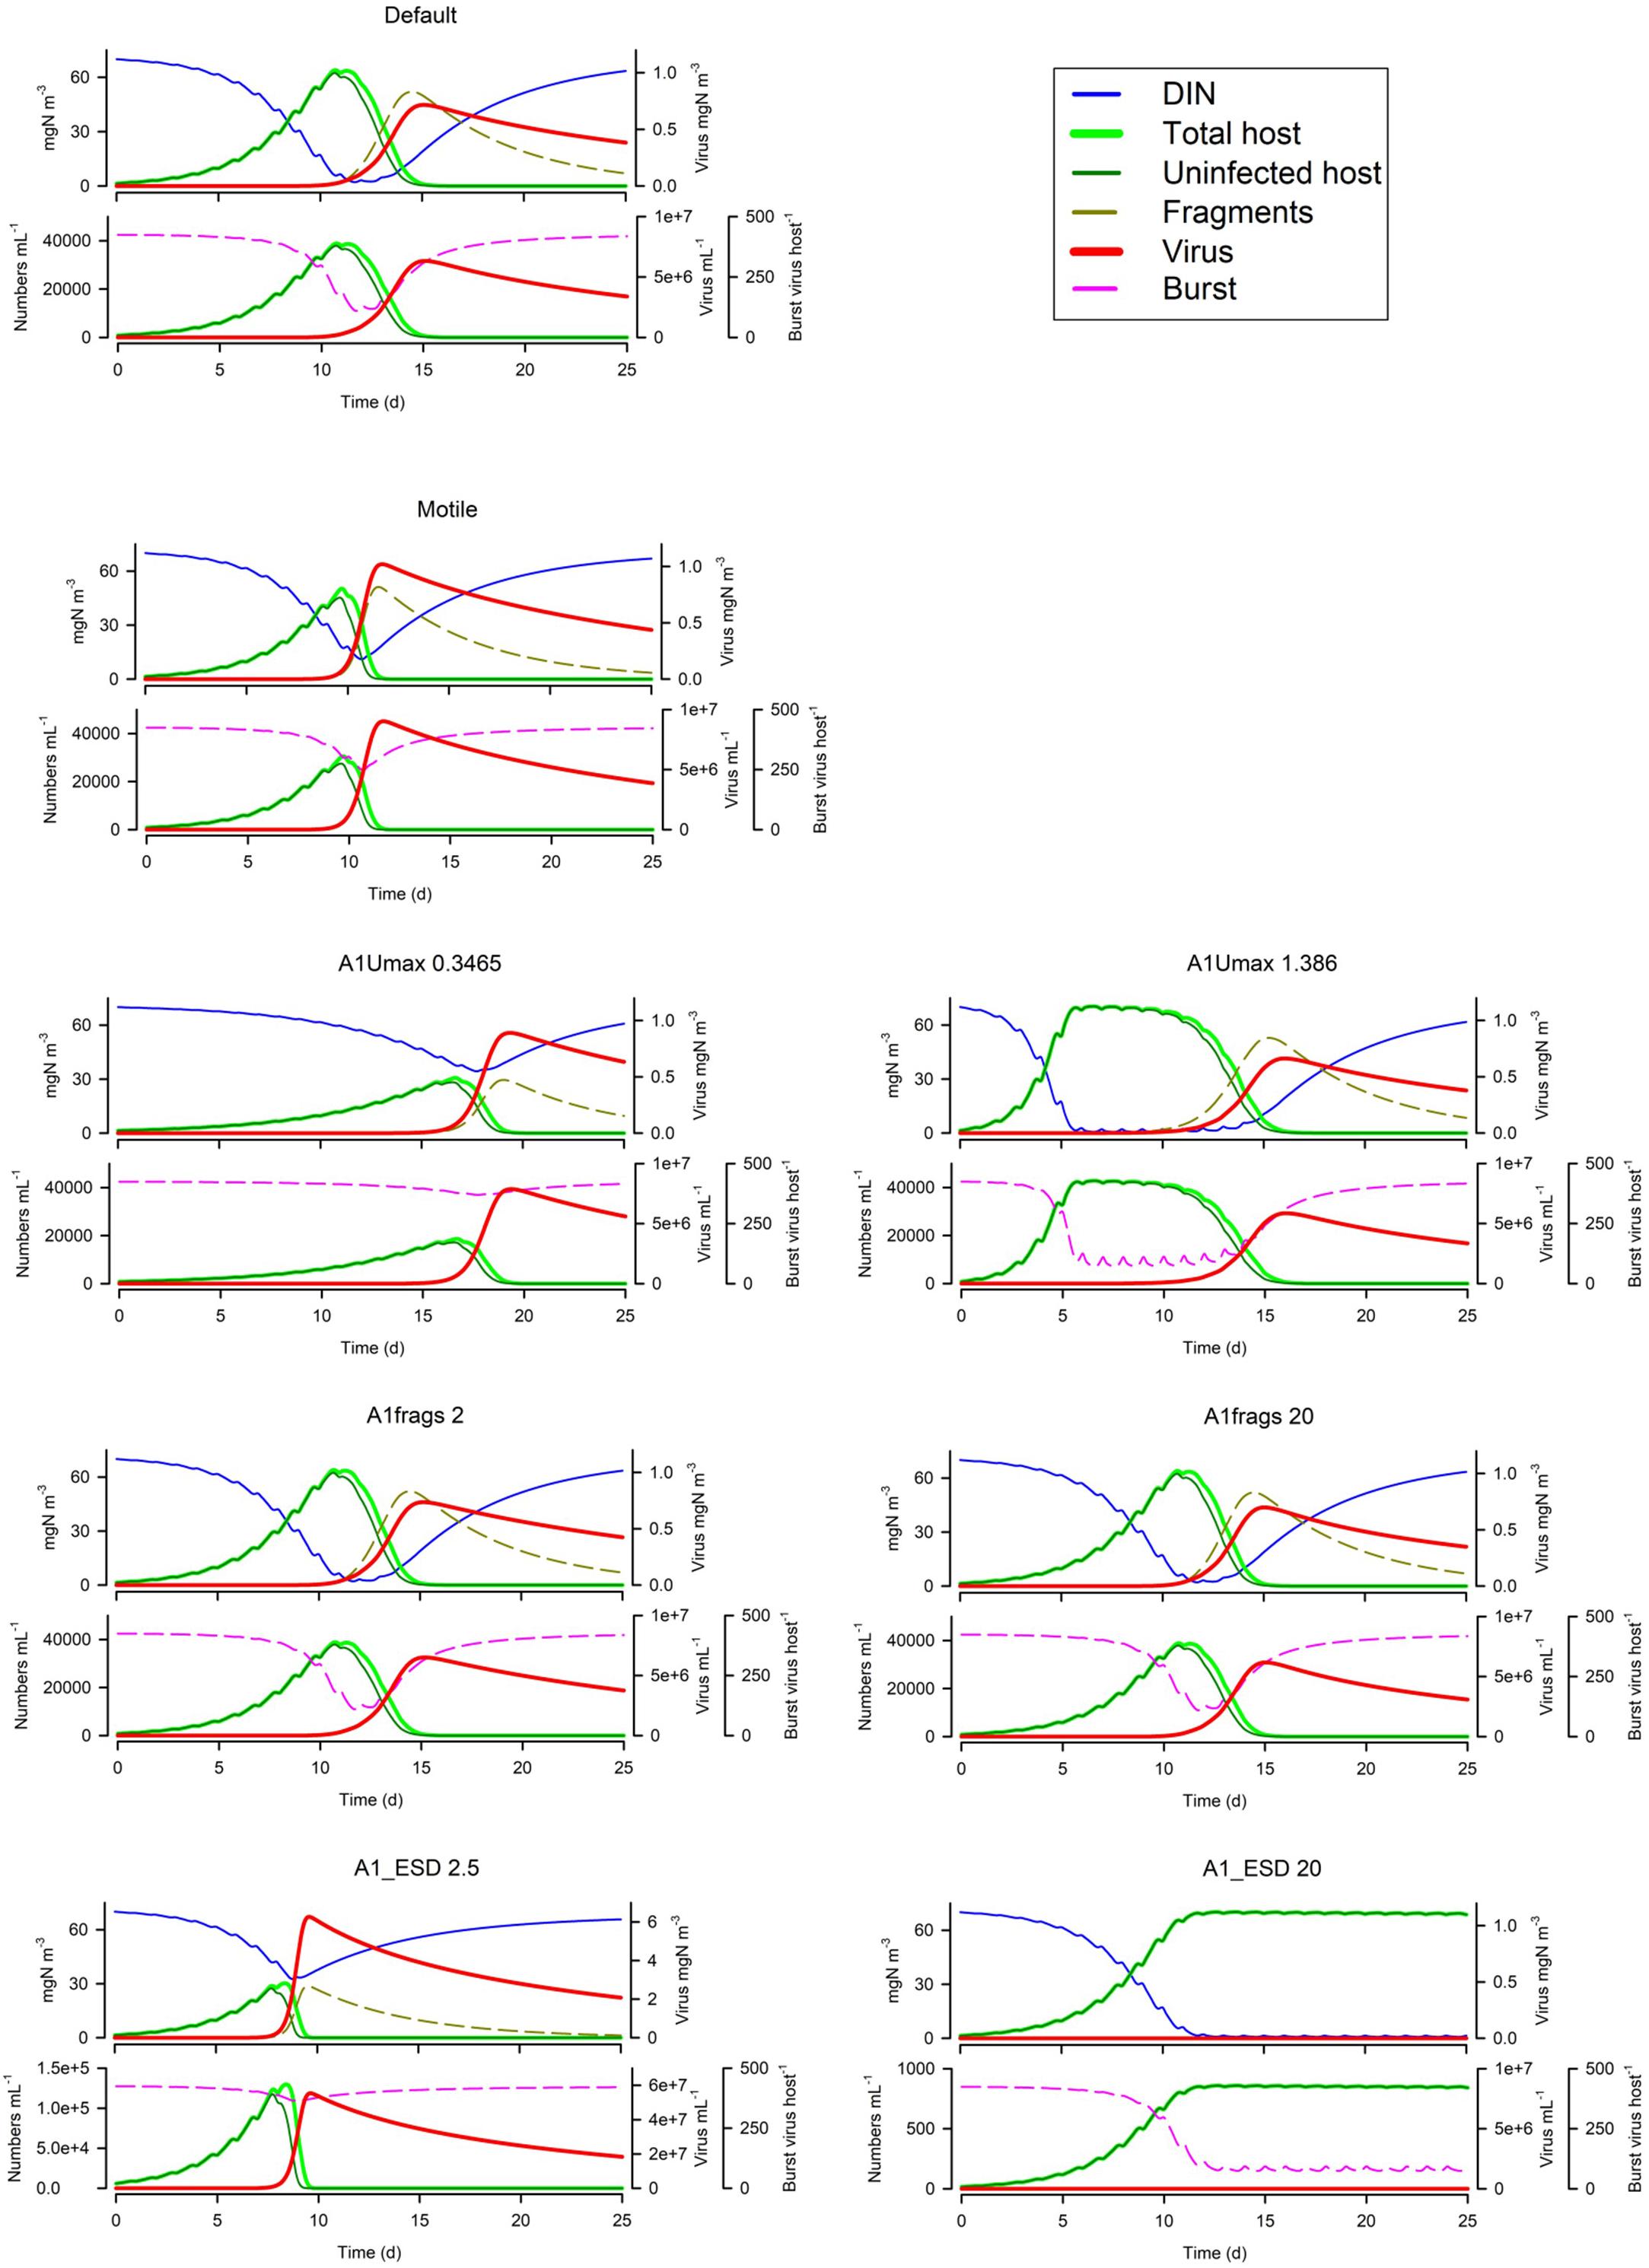
Figure 6. Effects of host motility (the Default being non-motile), host maximum growth rate (0.3486 or 1.388 d–1 vs Default of 0.693 d−1), fragment count on lysis (2 or 20 host–1 vs Default of 10 host–1), host ESD (2.5 μm or 20 μm vs Default of 5 μm) with fixed virus maximum burst size. The Default (Figure 1B) is reproduced in the top left-hand corner. See also Table 5.
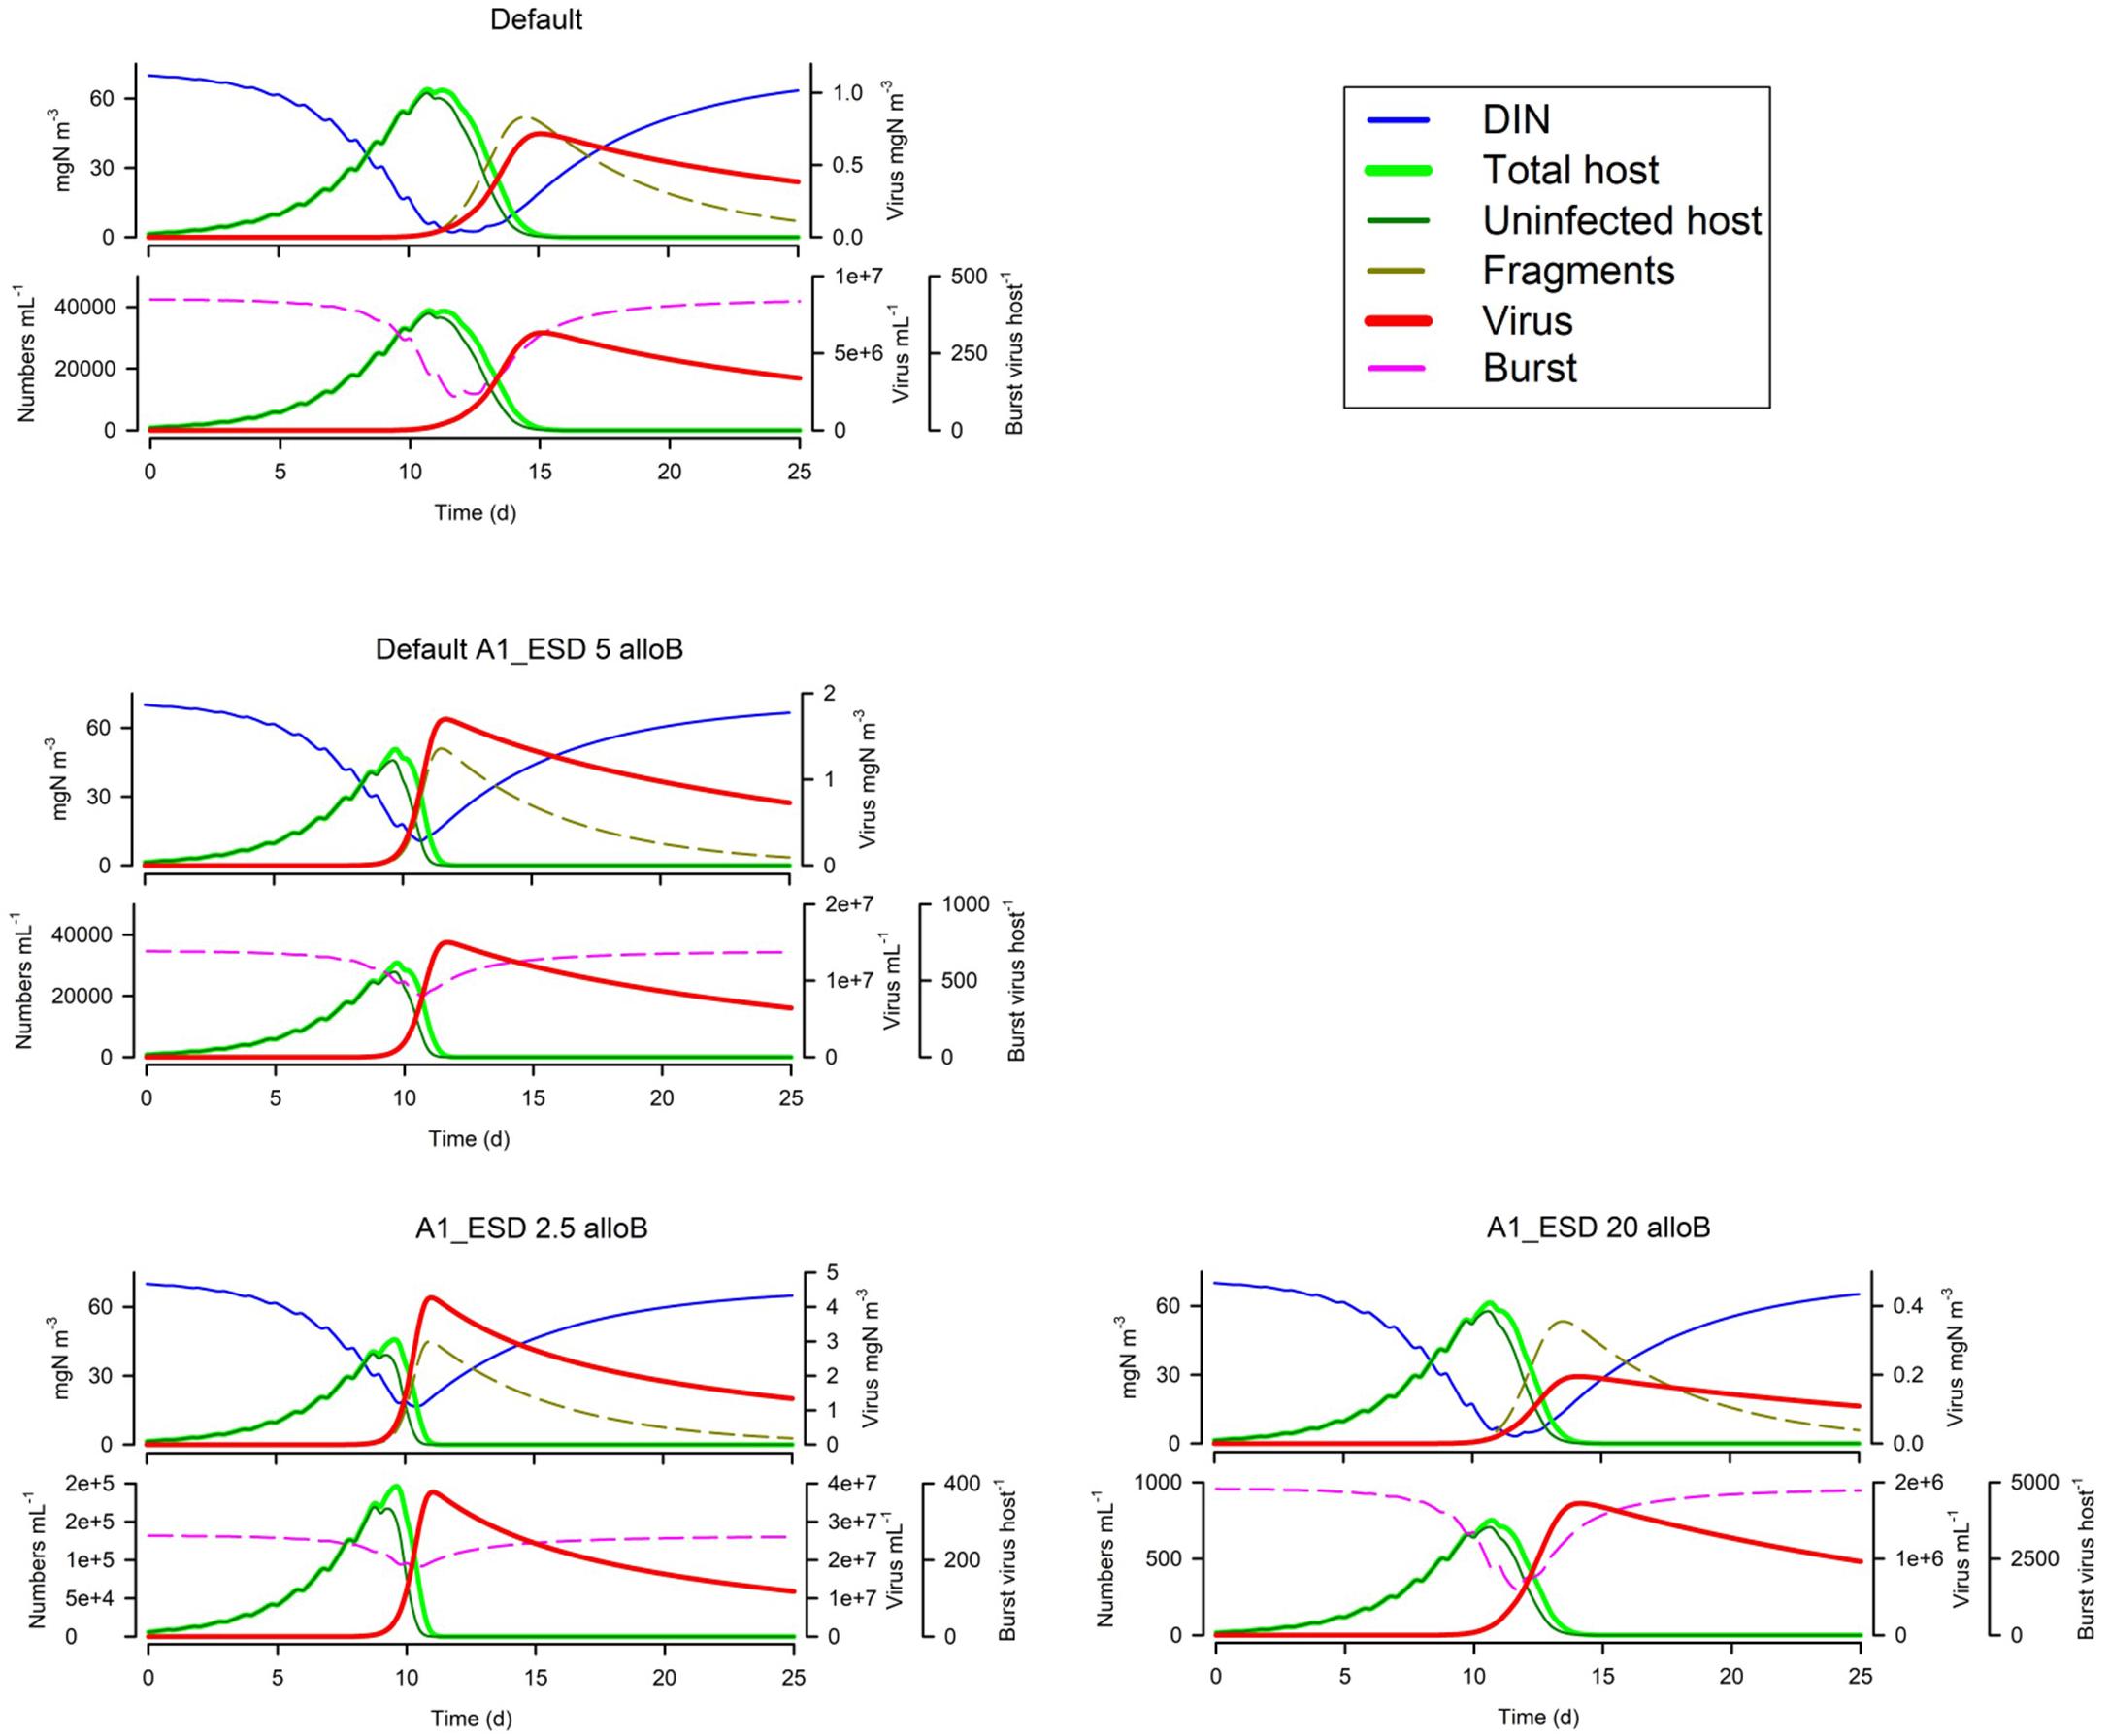
Figure 7. Effect of host ESD (2.5 μm or 20 μm vs Default of 5 μm) with allometric-linked maximum burst size. The Default with the non-allometric burst size (Figure 1B), is reproduced in the top left-hand corner. See also Table 5.
Virus Trait Effects
The size of the virus inoculum makes a big difference (Figure 8), not only for the obvious reason that having more viral particles increases the probability to encounter a host, but also because it impacts on whether the host exhausts nutrients (thus affecting burst size). For any given simulation and model configuration, there will be a ‘sweet spot’ for the size of the virus inoculum that will maximise viral production. The virus size (V1ESD) also has a big impact on dynamics (Figure 8) for a given biomass-specific inoculum (i.e., same biomass but thus a different numeric abundance), but even when the numeric inoculum is the same (i.e., same numeric abundance but thus a different biomass), a virus with a smaller ESD is much more potent (Figure 8). Finally, in Figure 8, we see that infectivity (V1inf) has an impact akin to the virus inoculum size; it has the obvious consequences plus a secondary one, as it affects the speed of the whole event and hence the risk of host nutrient-exhaustion with the consequential decrease in burst size.
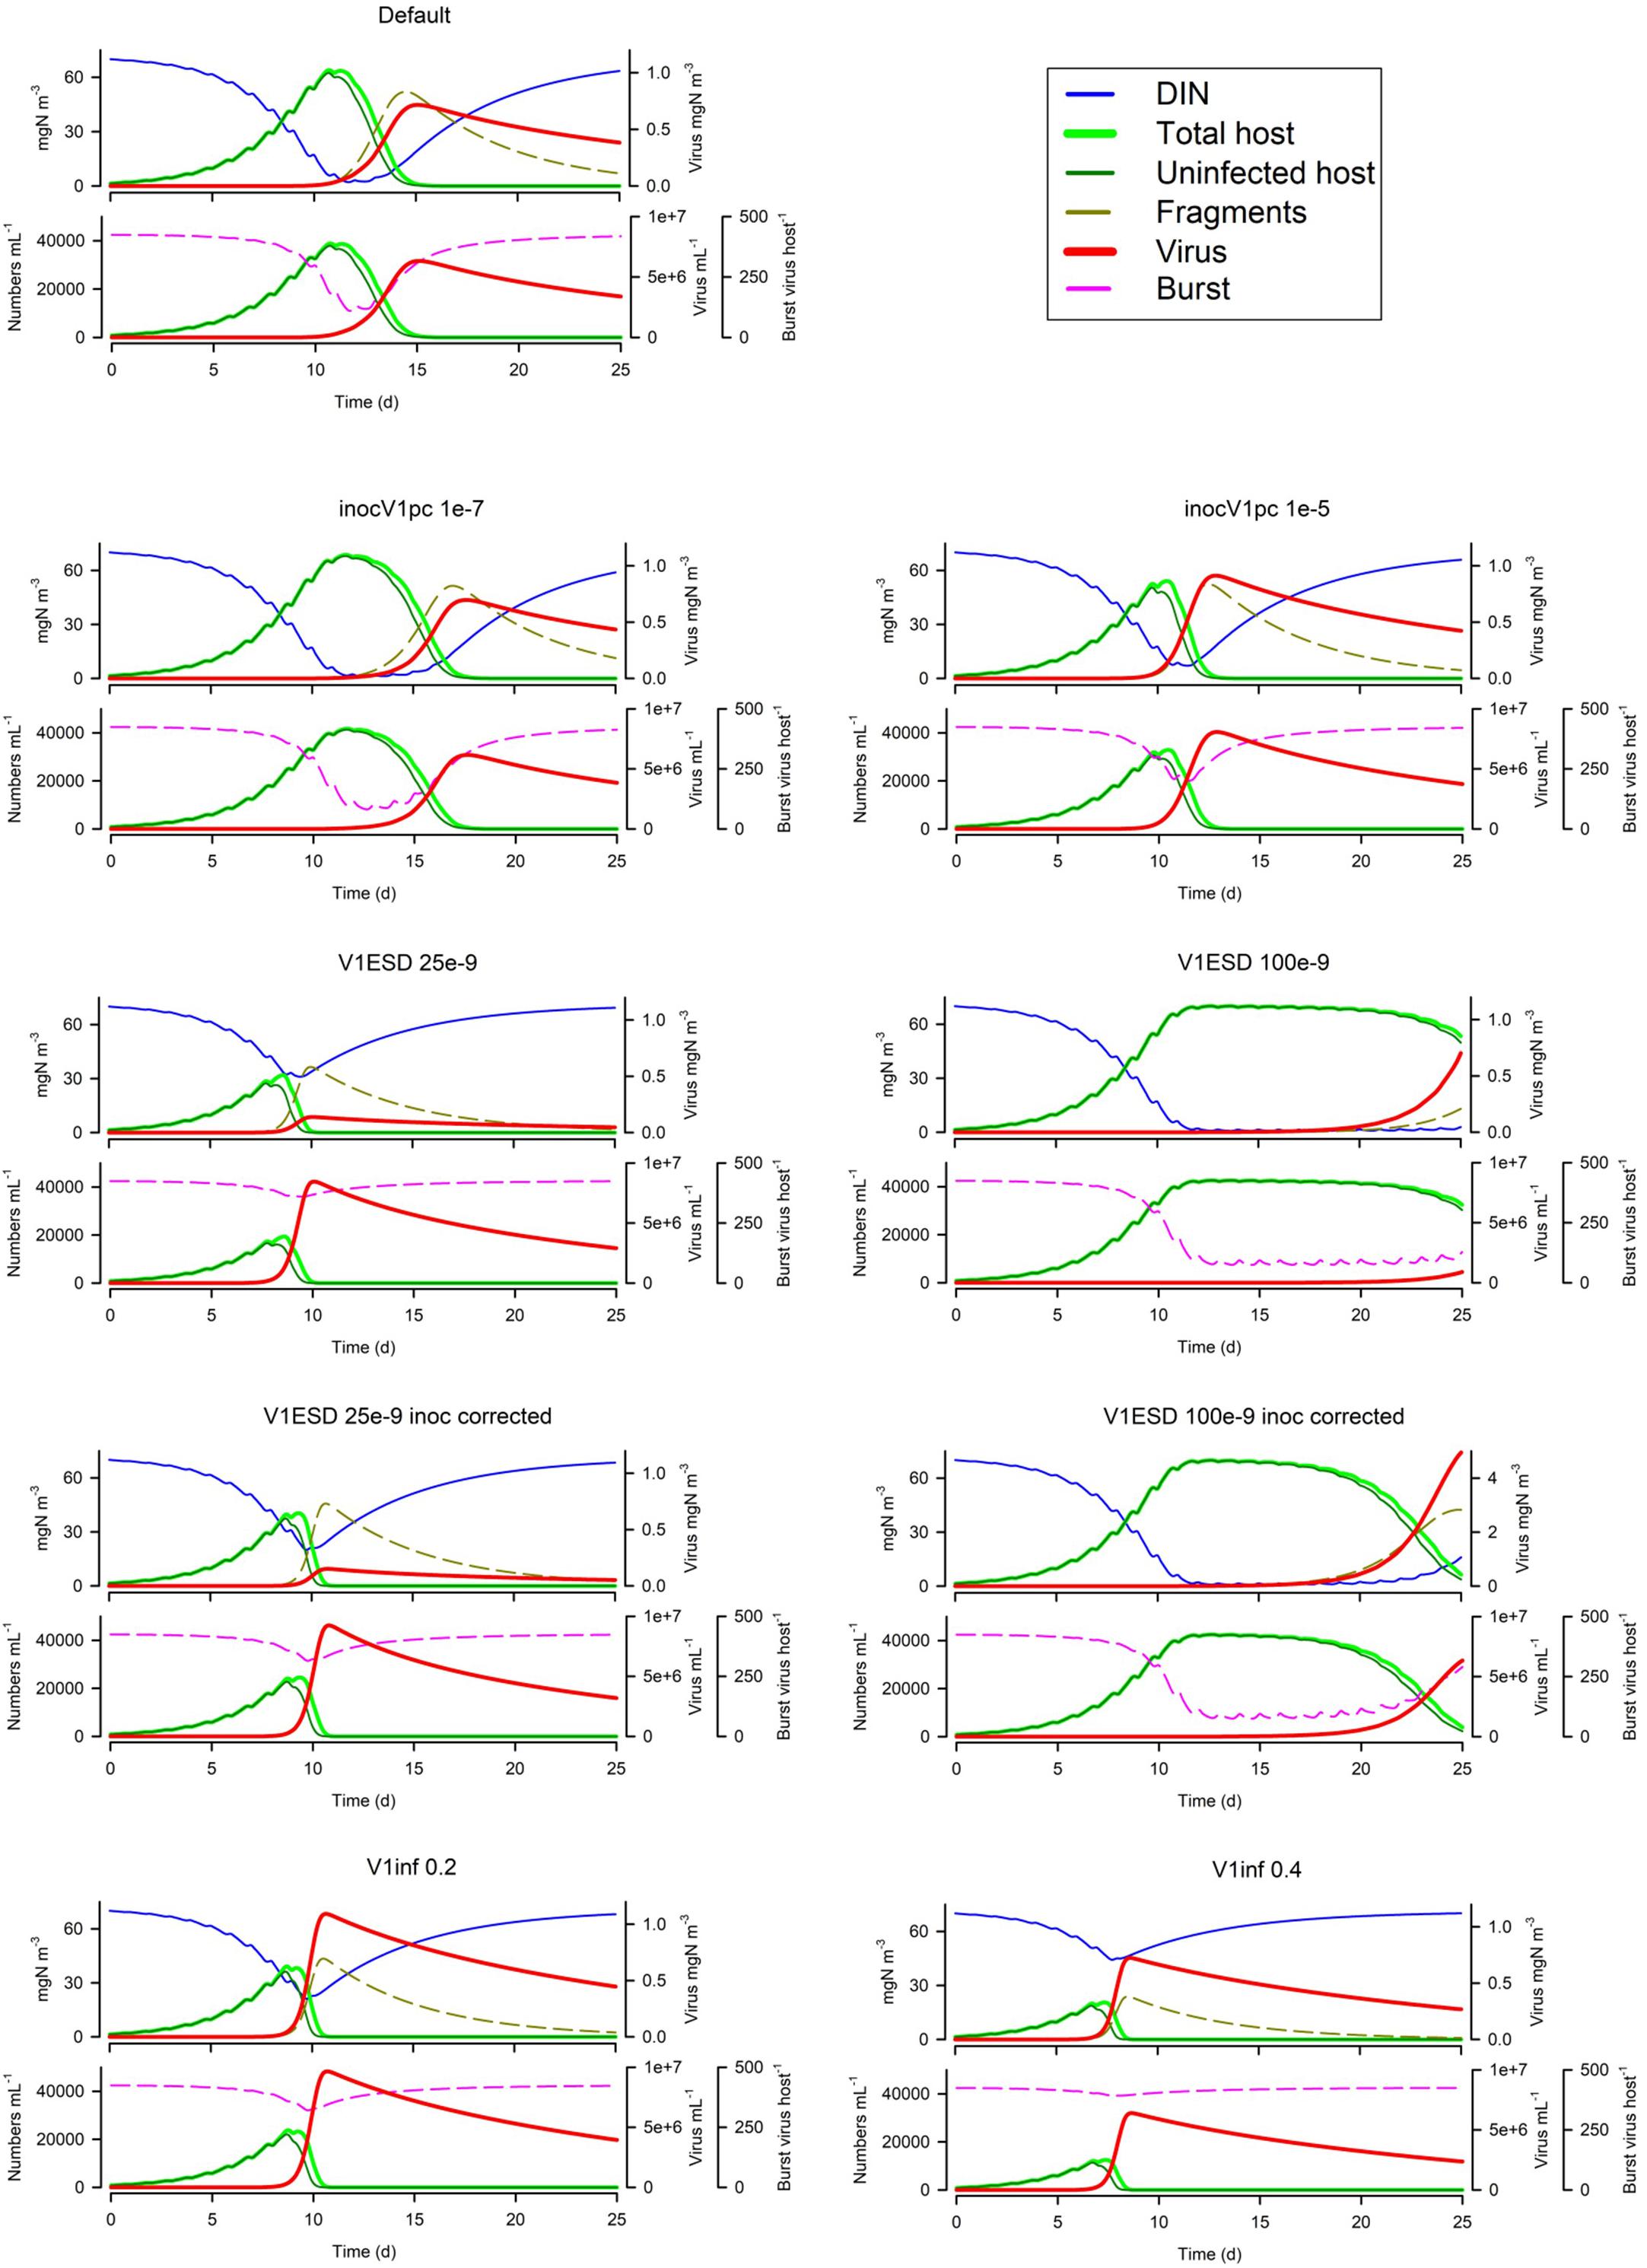
Figure 8. Effects of virus inoculum size as a proportion of the nutrient load (1E-7 or 1E-5 vs Default of 1E-6), virus ESD (25E-9 m or 100E-9 m vs Default of 50e-9 m) with the same biomass inoculum, virus ESD with the same numeric abundance inoculum through adjustment of the virus biomass inoculum, and virus infectivity (V1inf 0.2 or 0.4 vs Default of 0.1). The Default (Figure 1B) is reproduced in the top left-hand corner. See also Table 5.
Changing the latent period (V1LPDT_min) has surprisingly little effect (Figure 9); the default has a LP equating to 0.5 of the host maximum doubling time; halving this or doubling it has little impact at all. In contrast, the maximum burst size (V1B_maxf) is very important (Figure 9); the default is 500 virus per host and halving this slows the virus growth dynamics so much that the consequential nutrient limitation of the host then has an even greater negative impact. The importance of the burst size is further explored by decreasing or removing the linkage between host nutrient status and burst size (V1relBmin; Figure 9). Given the implications of the secondary effects of many other factors leading to nutrient-damaged host physiology noted earlier, the effect of the host physiology being compromised is clearly an important factor.
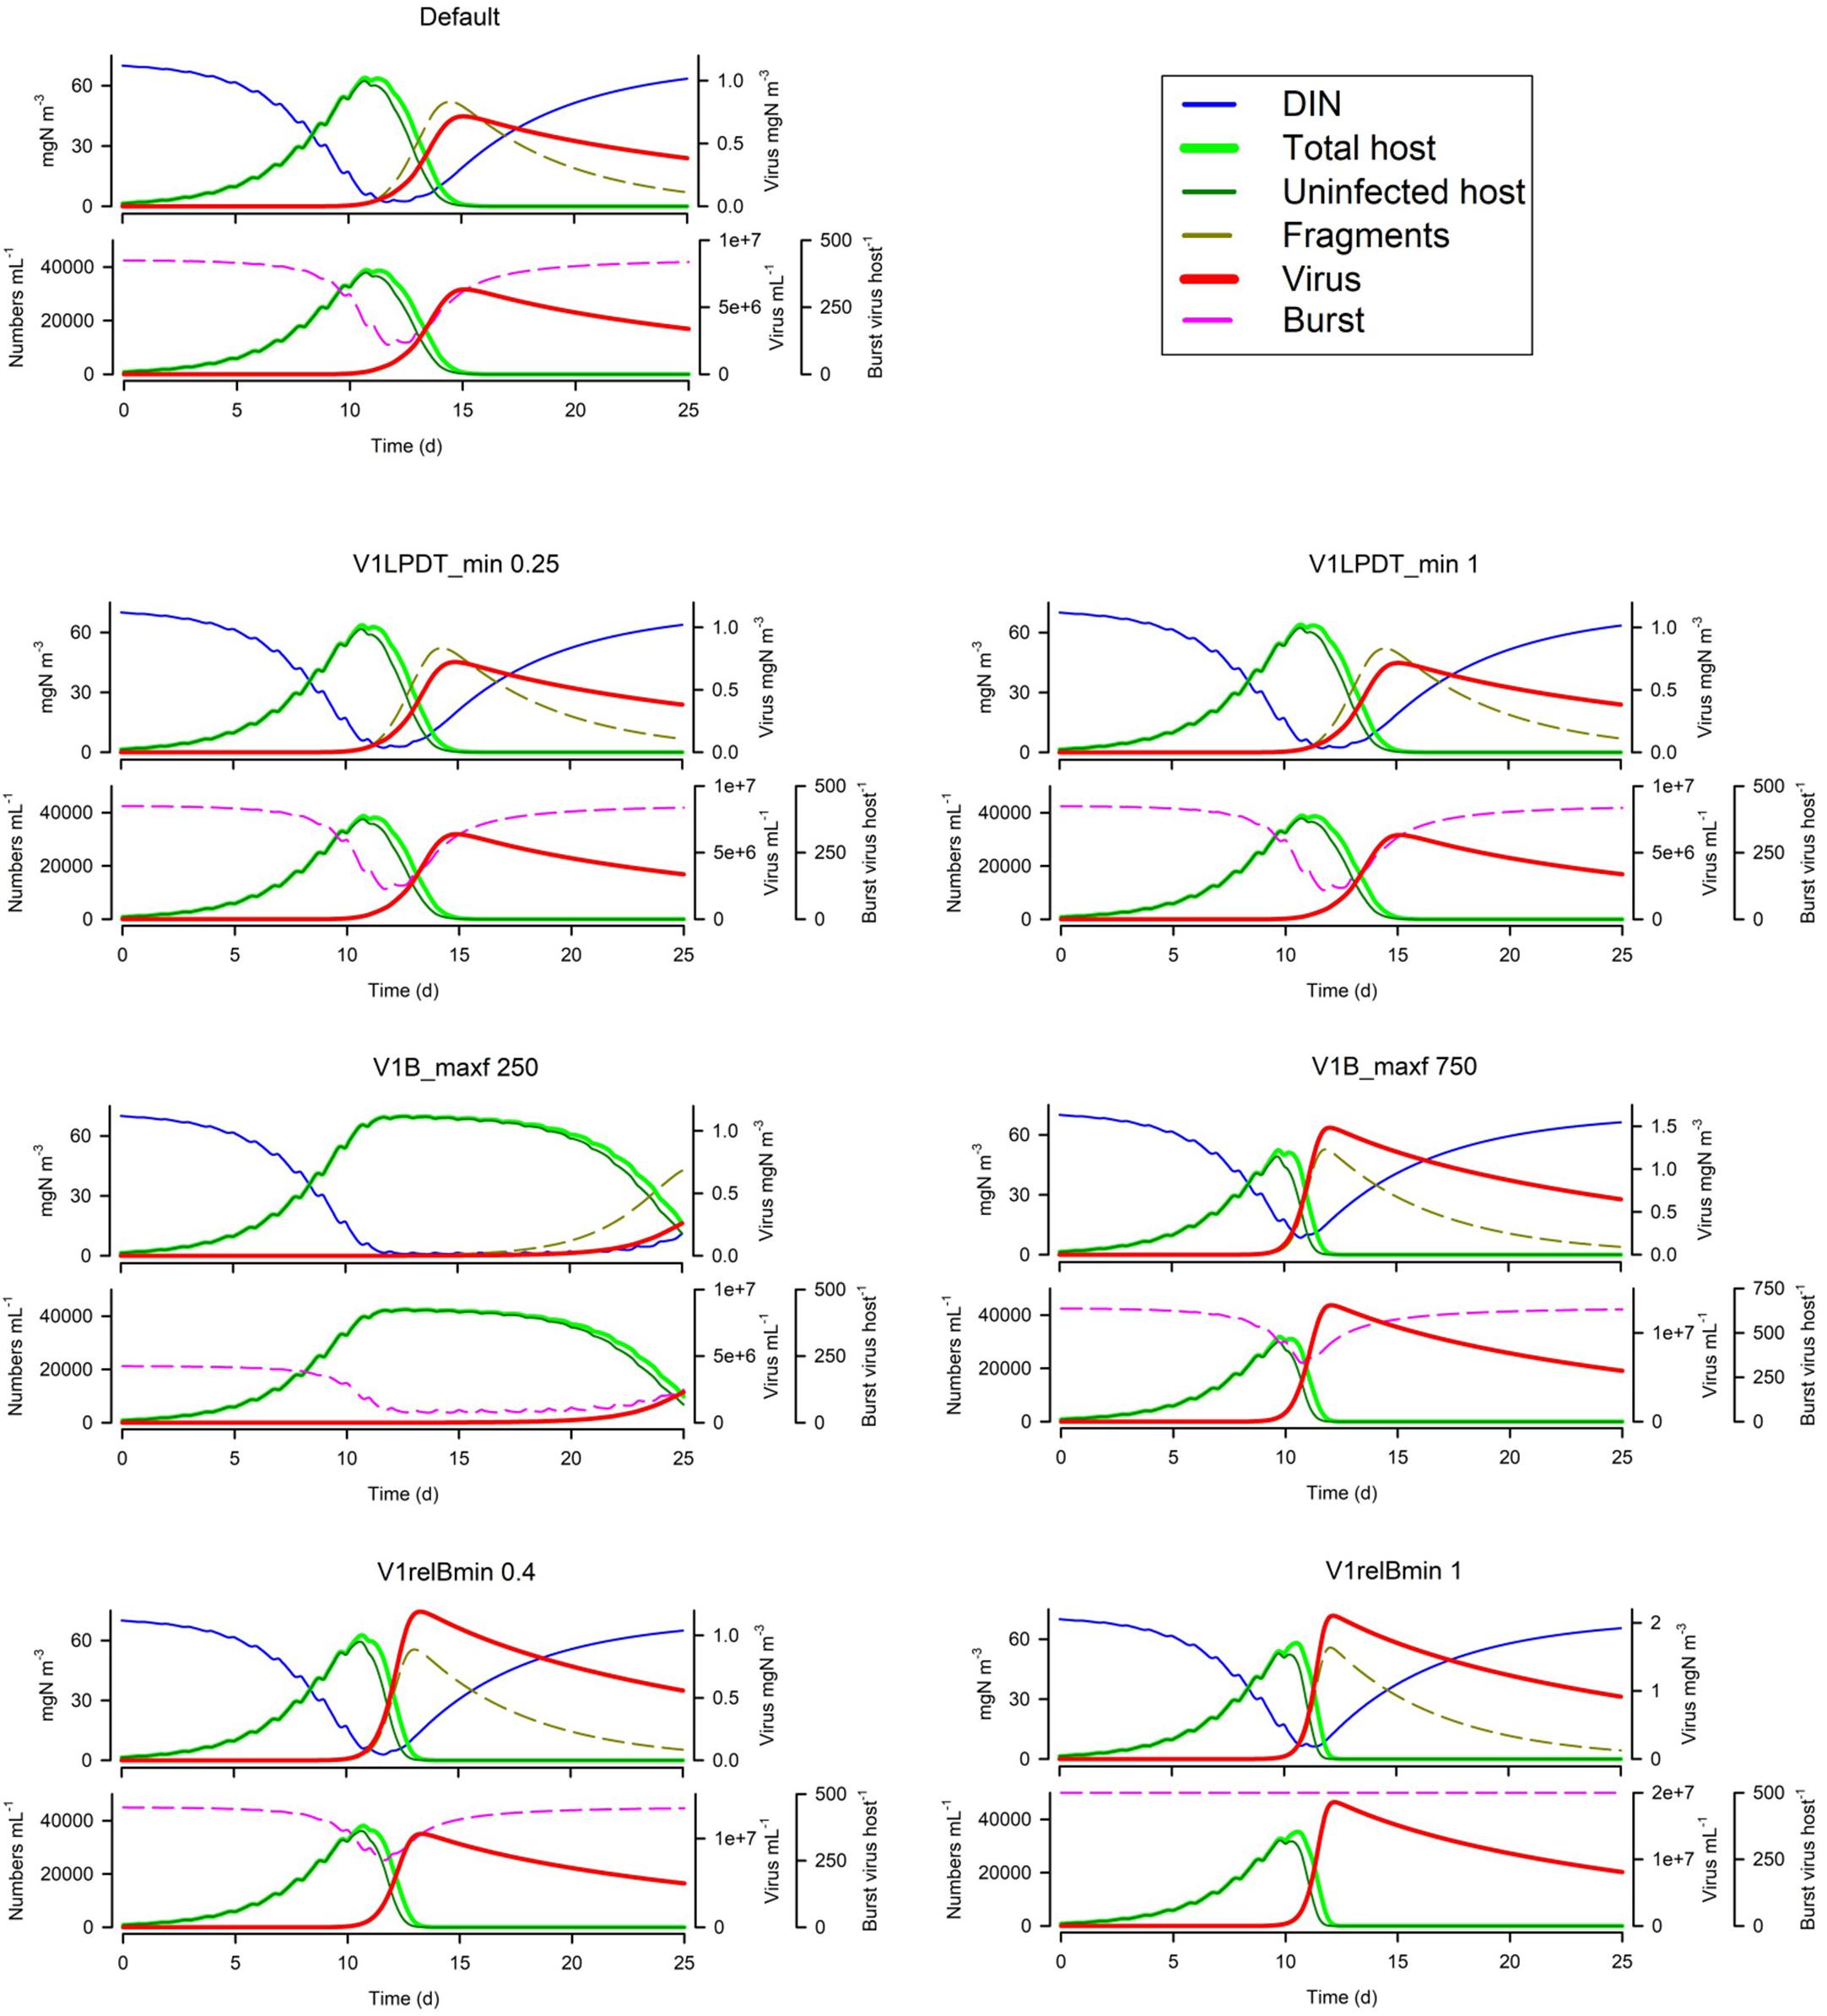
Figure 9. Effects of the relationship between the minimum latent period and host doubling time (V1LPDT_min 0.25 or 1 vs Default of 0.5), maximum burst size (V1B_maxf 250 or 750 vs Default of 500 host–1), and the relative minimum nutrient-compromised burst size (V1relBmin 0.4 or 1 vs Default of 0.2). The Default (Figure 1B) is reproduced in the top left-hand corner. See also Table 5.
Turning now to loss processes, in Figure 10 we see that changing the maximum (UV enhanced) decay rate (V1dec_max) has, unsurprisingly, little impact in simulations with a MLD of 10m. Only in very shallow water (here with MLD 0.1m) is there an effect, which is to slow the dynamic such that nutrient limitation of the host has a more pronounced effect. There will, in addition, be a pronounced impact on second-generation infections as the decay of V1 is doubled. Increasing the default decay rate (the Default V1dec_min being 0.05d–1) has some impact on the first generation dynamic (increasing the period of nutrient stress on burst size; Figure 10) and will clearly impact the second generation.
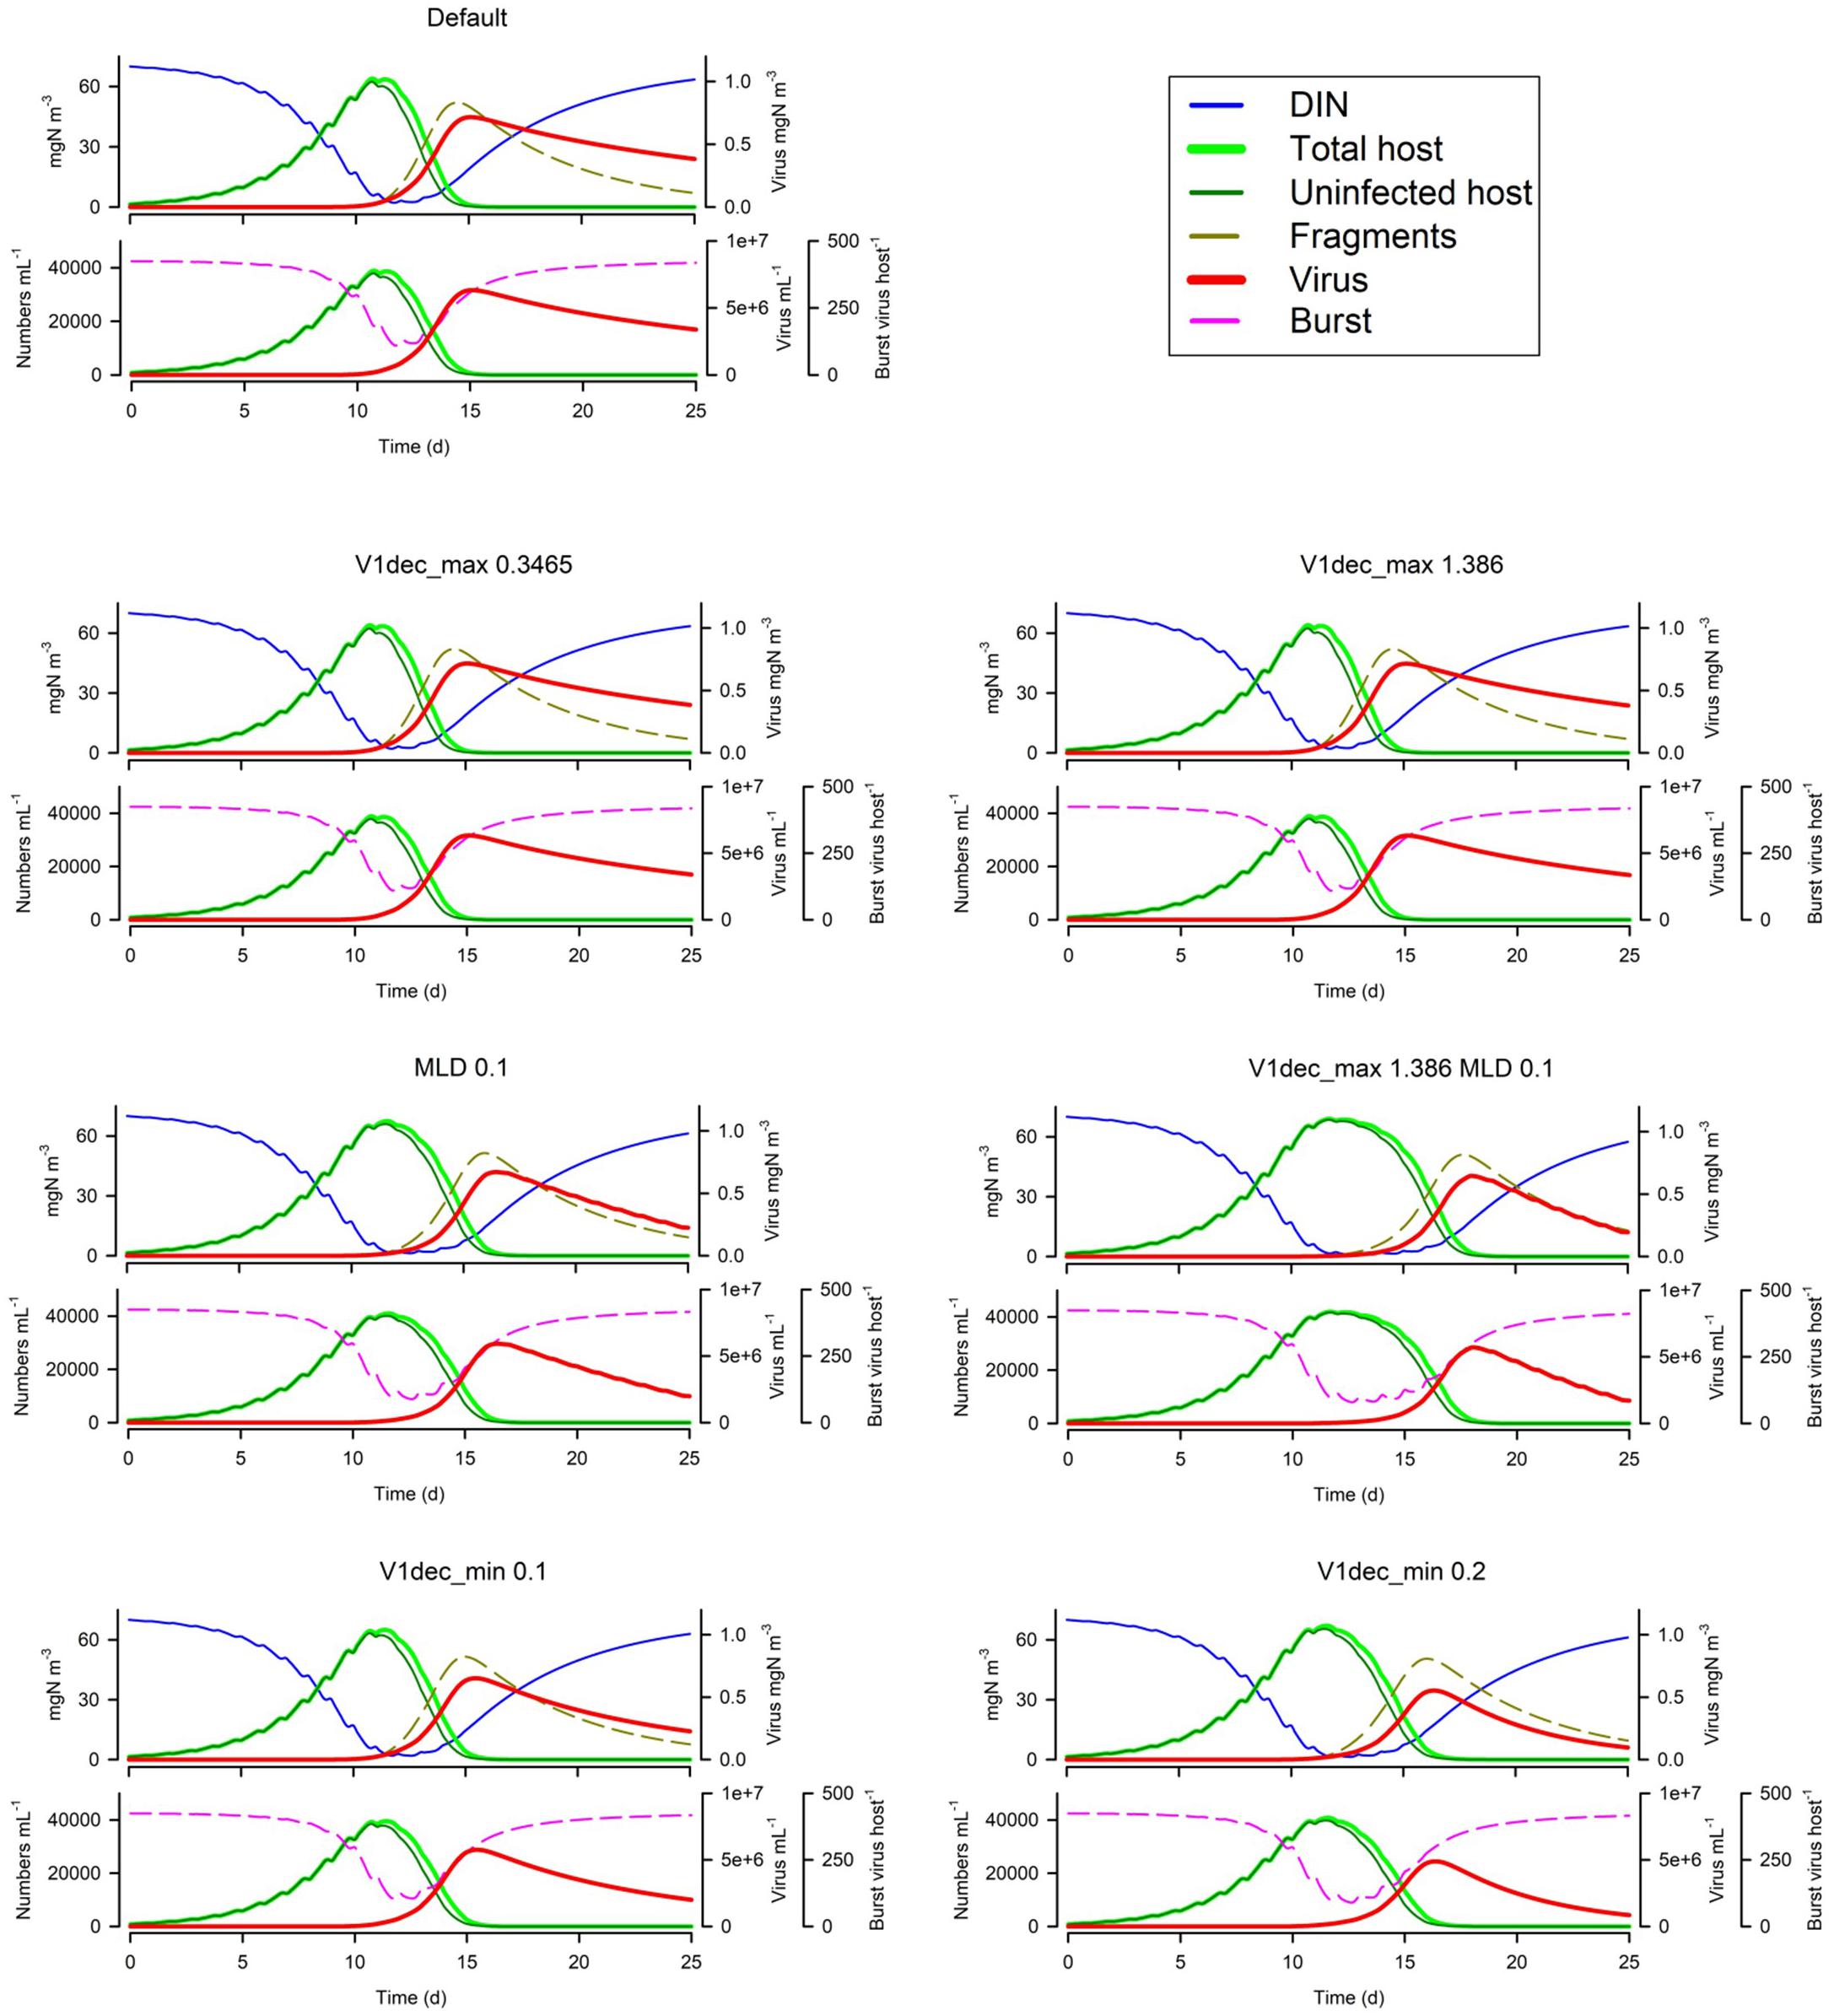
Figure 10. Effects of the maximum (UV-induced) decay rate (V1dec_max 0.3465 or 1.386 vs Default of 0.693 d–1) at 10m MLD, or at 0.1m MLD for the Default vs V1dec_max = 1.386 d–1, and for the minimum decay rate (V1dec_min 0.1 or 0.2 vs Default of 0.05 d–1). The Default (Figure 1B) is reproduced in the top left-hand corner. See also Table 5.
Discussion
General Comments
This is the first model that mechanistically describes the interactions between viruses and a plankton host considering facets of virus and host allometry together with growth dynamics and abiotic features to provide a simulation of the interactions. Previous virus-host models have considered virus-host dynamics either in a medical or phage-limited context (e.g., Jover et al., 2013; Best and Perelson, 2018), investigated specific interactions (such as the impact of compromised, nutrient-stressed, host on burst size – Choua and Bonachela, 2019; Choua et al., 2020), or for plankton and biogeochemical models simply as a loss process associated with host abundance (Suttle, 1994; Stock et al., 2014; Butenschön et al., 2016).
While the relative rate of virus proliferation within the infected host to that of host growth (affecting the latent period) was found to be of minor importance to the dynamics (V1LPDT_min; Figure 9), our model suggests that virus proliferation is strongly affected by host growth rate (A1Umax; Figure 6). In the model we assumed that the duration of the latent period is mainly a function of growth rate (Figures 3C,D; Eq.11), which for a phytoplankton is a function of light, temperature and nutrient, as well as the maximum growth potential. The burst size was made a function of nutrient status alone (Eq.16). Such relationships need to be more strongly supported by experimental data. In particular, the consequences of a compromised host physiology for viral growth dynamics, requires a more detailed characterisation to support the development of generic functional response curves. The model structure is itself flexible and mechanistic enough to be readily modified to take account of such information when it becomes available.
Light limitation in the context of plankton blooms is an interesting factor because (and ignoring changes in surface PAR due to changes in the weather) self-shading during bloom development tracks the increase in host abundance which also then affects infection rates. Model behaviour is thus consistent with in situ observations that virus attacks on the HAB species Aureococcus anophagefferens are slowed by the low light available to the host within dense blooms (Gobler et al., 2007). Especially in coastal areas with high nutrients, the transition to nutrient limitation is often coupled with light limitation (factors that will prolong LP and decrease burst size), though light limitation will also decrease viral decay rates in surface waters.
The model shows that larger phytoplankton have an inherent advantage against viral attack (Figures 6, 7). This is because the lower numeric abundance of the large host cells more than compensates for the higher burst size of those large hosts. However, perhaps of equal or more importance is the size of the virus population at the time that the host starts to bloom (inocV1pc; Figure 8). The interaction between the relative and absolute abundances of virus and host, together with the abiotic conditions allowing for non-nutrient limited host growth, can be seen to be of paramount importance for the development of the ensuing dynamics. If the virus abundance develops too slowly then there is the risk of nutrient limitation decreasing burst size (various examples in Figures 4–10). Motile hosts are more likely to be infected (because the encounter rate is enhanced); however, this is not always an advantage for the virus as the interaction may then develop too early leading to an early collapse of the host population without exploiting its maximum production potential (Figure 6).
The model shows that in natural systems, there is great potential for mismatch between virus and host. Thus, if the virus attack is too slow, there is an increasing risk of grazers removing the host biomass. Conversely, if the virus attack develops too rapidly then the host is effectively removed before the optimal virus production is attained (e.g., A1Umax; Figure 6). These contrary matters, which are beyond the evolutionary control of the virus, are related to changing abiotic factors such as the timing of the host bloom, and the behaviour of the whole ecosystem over the previous seasons that affect seen populations of both virus and host, as well as of grazers and competitors of the host.
Loss processes, which affect the available virus inoculum at the time of the next host bloom, will play a pivotal role. UV light has very little potential to enhance viral decay except in very shallow clear water (Figures 4, 10). The non-UV decay rate is important (V1dec_min; Figure 10); it is also worth noting that dilution of the surface waters by mixing (which may have a rate of ca. 0.02 – 0.03d–1) adds an important additional loss term. Loss of viruses onto other particles, most notably onto suspended particles (Figure 5), also provides an important loss route in conditions that one may expect in coastal systems and have been suggested to delay virus control of ice algae liberated into polar waters (Maat et al., 2019). There is also potential for a significant loss of viruses onto fragments of lysed host (A1frags; Figure 6) and indeed onto other organisms and debris fields (e.g., non-host cells, grazers including direct consumption; not simulated here).
The virus contribution to total biomass is trivial; at most a few % (e.g., Figure 1B; initDIN; Figure 4). Set against the potential of the host to double its biomass every few days under normal conditions, the demands for resources allocated to virus production is also low (Figures 2E,F) even if it is expended over a fraction (ca. ¼ or ½) of the normal host replication cycle. However, although the virus biomass production itself is very low, the effective trophic consequence of virus attack is vast. In pragmatic terms, given that viruses themselves form part of DOM (DOM often being defined as material passing through a 0.2 to 0.7 μm filter pore; Anderson et al., 2015), the bulk of the host production enters the DOM pool. No other trophic event achieves such a large transfer, and in such a short time scale; this then is the basis of the viral shunt (Wilhelm and Suttle, 1999). While the bulk of this transfer to DOM will be rapidly consumed, there is the potential production of refractory DOM (rDOM) and thus a contribution to the Microbial Carbon Pump (Jiao et al., 2010). Some viruses express polysaccharide-degrading enzyme activity to aid their entry to extracellular polysaccharide (EPS) -coated hosts and it has also been suggested that such activity may contribute directly to DOM dynamics (Lelchat et al., 2019). The significance of viral activity to overall rDOM production depends on all of the factors explored in this work, plus other trophic and abiotic interactions. Understanding the year-on-year virus-host interactions is pivotal in this context. However, the simulations here show that even in an idealised extremely simple system, the potential for high levels of variability will prevent a simple estimate of how climate change and other stressors may affect this route for rDOM production. The presence of other organisms as hosts, competitors, grazers, and viruses, plus abiotic interactions, will inevitably greatly complicate an inherently already complex dynamic, as revealed by our work.
Traits
The model was run here as a simple single virus-host system where the host was phototrophic. Its operation shows that any factors affecting host growth rate (e.g., total photon dose as surface light x L:D, Umax and hence also temperature) and health (nutrient limitation) strongly affect virus proliferation. This, together with absolute abundance of the host affecting encounter rates, controls dynamics. Too small a burst size, or too large a burst size may be detrimental. Gons et al. (2006) modelled virus attack dynamics on cyanobacteria, noting that burst rates of over a few 100 led to extinction of the host; but such a potential is decreased markedly if a large proportion of virus progeny are lost by absorption onto non-host particles. The “ideal” trait configuration can only possibly exist in a steady-state idealised scenario.
There has been much attention paid to trait-based descriptions of phytoplankton physiology (e.g., Litchman et al., 2007) and recently also to viruses (Record et al., 2016; Edwards et al., 2020). The complexity of viruses affecting near-identical hosts with different consequential dynamics (Howard-Varona et al., 2018) presents scientists with details beyond the scope of exploration within the typical ecosystem model. Further, many microbes are hosts to many viruses, although (unlike the situation in a multicellular organism), an individual microplankton host is most likely exploited by only a single virus at a time. Like all organism-organism interactions (predator-prey, parasite-host, etc.) there is then the issue of co-evolution that will occur within and between hosts and viruses that will affect the optimization of virus proliferation. Fedida and Lindell (2017) report that, in Synechococcus, some host genes are defensive towards viral attack while others are exploited by the virus for its own (viral) replication. The level of co-evolution affects the infectivity and performance of the virus, and differentially affects clades. The material costs of the viruses (i.e., virus × burst size) is so small set against the metabolic costs normally incurred by the host in cell replication every day or so, that any additional cost in virus evolution would most likely be minor (see also Figures 1B, 2E). Evolution of viruses is also matched by evolution of resistance in the host (Ruiz et al., 2017), a process that itself may cost the host little to achieve (Thingstad et al., 2014), especially when set against all other metabolic costs (Heath et al., 2017).
Attempts to simplify the combinations, through locating trait trade-offs (Record et al., 2016), appear less than simple in practice (Edwards et al., 2020), with traits likely of utility in models (notably the burst size) being highly variable between and within hosts, and compounded by variation in physiological status of those hosts. It is clear that virus trait evolution will be strongly influenced by trait evolution of the host. In turn, evolution of the host will be affected by competition with others for common nutrients and growth against grazing activity, the latter also likely expressed by grazers who will attack those competitors. The virus-host interaction, though drawing some parallels with predator-prey interactions, differs especially with respect to specificity of the interaction. Attempting to locate organism trade-offs in metabolism and allometry in members of any ecosystems is complex and multifaceted, and so it is also for viruses.
From the simplest of virus-host systems, as simulated here, there appears to be no clear advantageous virus configuration with respect to reproduction rate and long-term survival. All else being equal though, small viruses appear to be at an advantage (V1ESD; Figure 8), and that is before considering that larger virus particles are more likely to be directly predated (González and Suttle, 1993). This, however, does not include any advantage that may be expected in larger viruses with respect to exploitation of multiple host types and to particle adsorbance selectivity. Large potential hosts also appear to be at an advantage, not because they are intrinsically safer from attack (on the contrary, they are less safe at the individual level) but because there are fewer of them for a given amount of nutrient within what is invariably a resource-limited ecosystem. Ultimately, though, we need more data, and importantly we need data collected specifically to aid modelling of plankton viruses. This is a problem shared with phytoplankton-zooplankton studies (Mitra et al., 2014), and requires a concerted effort to overcome with involvement of modellers at the outset to aid in experiment design.
Models and Data
Plankton virus traits and growth dynamics may be expected to be different to those expressed by viruses in other systems (notably medically related, phage-dominant systems) as studied in classic virology. The low nutrient density (e.g., 14–280 mgN m–3; equating to 1 – 20 μM N) results in very low host and virus abundances and thence in low encounter rates; and that assumes dominance of the system by just one virus-host system, as simulated here. Some of the virus-host interactions seen in laboratory and non-plankton situations, such as interference between viruses during multiple encounters with hosts (Baltes et al., 2017), are far less likely in natural environments, and on the contrary, encounter with non-host particles may be more prevalent. Interactions with other non-host organisms, and indeed with competing viruses for the same host add complexity. Virus proliferation success depends on extrinsic (external) and intrinsic (within host) factors (Mojica and Brussaard, 2014; Horas et al., 2018) that together conspire to greatly decrease the likelihood of the collapse of the host population. And from an ecological standpoint it is arguably more the fate of the host that is important than the success of the virus.
Ideally, to better simulate lytic plankton virus dynamics we would have data for the host maximum growth rate, the actual growth rate and C:N:P of uninfected cells prior to infection, physiological indicators of biochemical rates during virus replication, the latent period and the burst size. Burst size, in this context, especially relates to the production of infectious progeny; a host with a poor nutrient status may still produce a high burst particle count, but many may be defective, and worse they may conflict with successful adsorption of non-defective progeny (Frank, 2002; Slagter et al., 2016; Cheng et al., 2019). The impact of temperature, and understanding whether host maximum growth rate potential affects viral replication, also remain important unknowns; do slow-growing hosts have longer latent periods, or do viruses push the host physiology into overdrive, such that LP is never very long? Winter et al. (2012) attempted to use an artificial neural network approach to link intrinsic and extrinsic factors to virus growth dynamics, to rather mixed effect; it did identify the importance of temperature changes, likely linking virus-host dynamics to up-shocks in host physiology with temperature increases (Demory et al., 2017; Maat et al., 2017; Ashy and Agusti, 2020; Frenken et al., 2020). Additionally, Mojica and Brussaard (2014, their Table 1) document some temperature interactions with virus-host dynamics, but temperature and climate change in general will also affect the type of hosts that dominate both directly and indirectly via impacts on their grazers and nutrient regenerators (Frenken et al., 2020). Thus, in the Atlantic, phytoplankton are increasingly dominated by the presence of Synechococcus. Coello-Camba et al. (2020) conducted a mesocosm study where they injected nutrients which promoted a bloom of Synechococcus (but not of Prochlorococcus) which then crashed due to viral attack on the dominant faster growing Synechococcus clade, with the larger diatoms then blooming. Maat et al. (2017) noted that with elevated temperatures, the Arctic mixoplankton Micromonas (another example of a small plankton projected to become increasingly important with climate change) showed shorter latent periods and larger burst sizes for its viruses, though with significant variation between virus types. How much of such variation can be ascribed to Q10 type responses directly upon the host is not clear, but the results are consistent with changes in physiological status and growth rate with temperature. Maat et al. (2017) commented that modelling would likely help to resolve how earlier spring bloom growths of Micromonas polaris may be impacted by viral attack.
In the absence of readily accessible data of use in modelling, we can explore the sensitivity of virus-host dynamics to these factors to determine the likely most important parameters, a process that will also help direct future experimental design. It is not meaningful to run steady-state models and allied sensitivity analyses on the plankton virus-host model. As our results show, there is too much scope for a complex series of interactions which are difficult to consider in a meaningful way in a steady-state scenario; this is because the dynamics of the virus-host relationship is so fundamental to the role of viruses in the ecosystem (e.g., Wilhelm et al., 2002). However, by analogy with the standard single-parameter steady-state analysis (Haefner, 1996) we can gain information from the simulations presented. The model did not show any overly sensitive behaviour; when a parameter was halved or doubled (the basis for most of the simulation plots shown in Figures 4–10) the consequence was not more than a halving or doubling of the default (control).
Of the model parameters having most impact upon simulation dynamics, the adsorbance quotient was most important (Ads_prob; Figure 4). For the simulations shown here that value was set as a global constant, but it must surely vary greatly between particle types. It would be easy to allocate particle-specific values within the model should such data be available to justify such an action. Experimental data are required to better establish the value of this parameter for different virus types upon different particle types. Likewise, infectivity (V1inf; Figure 8) and the linkage between host nutrient status and burst size of non-defective viruses (V1relBmin; Figure 9) needs much better parameterisation. Non-UV related decay rates are also important (V1dec_min; Figure 10).
Conclusion
We have constructed and demonstrated a new simulation tool with which to explore interactions between viruses and their planktonic hosts. This tool has a more conceptually realistic and holistic basis than previous models. Using this tool, we have shown that:
• While virus and host allometry have some impact on the interactions, the outcome depends greatly upon the relative magnitude of the virus and host abundances and the dynamics of host growth affected by its physiological nutrient-status (via light and nutrient availability), and the maximum growth rate potential of the host (which will be affected by temperature).
• While larger hosts may support larger burst sizes and have a greater adsorption rate per individual, because for a given nutrient load there are fewer larger cells to propagate viruses, smaller and more motile, plankton appear more susceptible to virus control.
• The presence of suspended, non-host, particles can strongly suppress the impact of viruses on host populations.
The coupling between the above-mentioned interactions may be expected to strongly influence the spatial-temporal variability of virus-host dynamics especially in coastal systems, due to the proximity to river plumes, seasonal production of other particles and particle re-suspensions, and plankton successions overlain by weather and nutrient loadings as stratification breaks down.
The dynamics of the whole plankton food web are suspected to be of importance in setting the scene for virus infections (Sandaa et al., 2017), and for viruses affecting nutrient cycling (Weitz et al., 2015). From our results, it also seems likely that adding viruses to models is a complicated process due to the way they interact with their environment. Future applications of the approach we develop will explore virus-food web dynamics.
Data Availability Statement
The original contributions presented in the study are included in the article/Supplementary Material, further inquiries can be directed to the corresponding author/s.
Author Contributions
KF conceived the idea, and all authors were responsible for its elaboration and the construction and running of the models. KF ran the simulations. All authors contributed to analysis of the results and writing of the manuscript.
Funding
This work was part funded by the Natural Environment Research Council (NERC, United Kingdom) through its UKRI-NERC project NE/R011087/1.
Conflict of Interest
The authors declare that the research was conducted in the absence of any commercial or financial relationships that could be construed as a potential conflict of interest.
Supplementary Material
The Supplementary Material for this article can be found online at: https://www.frontiersin.org/articles/10.3389/fmars.2021.667184/full#supplementary-material
References
Anderson, T. R., Christian, J. R., and Flynn, K. J. (2015). “Modelling DOM biogeochemistry,” in Biogeochemistry of Marine Dissolved Organic Matter, eds D. A. Hansell, D. A. Hansell, and C. A. Carlson (Amsterdam: Elsevier), 635–667. doi: 10.1016/b978-0-12-405940-5.00015-7
Arora, V. K., Boer, G. J., Friedlingstein, P., Eby, M., Jones, C. D., Christian, J. R., et al. (2013). Carbon–concentration and carbon–climate feedbacks in CMIP5 earth system models. J. Clim. 26, 5289–5313. doi: 10.1175/jcli-d-12-00494.1
Ashy, R. A., and Agusti, S. (2020). Low host abundance and high temperature determine switching from lytic to lysogenic cycles in planktonic microbial communities in a tropical sea (Red Sea). Viruses 12:761. doi: 10.3390/v12070761
Baltes, A., Akpinar, F., Inankur, B., and Yin, J. (2017). Inhibition of infection spread by co-transmitted defective interfering particles. PLoS One 12:e0184029. doi: 10.1371/journal.pone.0184029
Best, K., and Perelson, A. S. (2018). Mathematical modeling of within−host Zika virus dynamics. Immunol. Rev. 285, 81–96. doi: 10.1111/imr.12687
Breton, S., Jouhet, J., Guyet, U., Gros, V., Pittera, J., Demory, D., et al. (2020). Unveiling membrane thermoregulation strategies in marine picocyanobacterial. New Phytol. 225, 2396–2410. doi: 10.1111/nph.16239
Butenschön, M., Clark, J., Aldridge, J. N., Allen, J. I., Artioli, Y., Blackford, J., et al. (2016). ERSEM 15.06: a generic model for marine biogeochemistry and the ecosystem dynamics of the lower trophic levels. Geosci. Model Dev. 9, 1293–1339. doi: 10.5194/gmd-9-1293-2016
Cheng, K., Frenken, T., Brussaard, C. P. D., and Van de Waal, D. B. (2019). Cyanophage propagation in the freshwater cyanobacterium Phormidium is constrained by phosphorus limitation and enhanced by elevated pCO2. Front. Microbiol. 10:617. doi: 10.3389/fmicb.2019.00617
Choua, M., and Bonachela, J. A. (2019). Ecological and evolutionary consequences of viral plasticity. Am. Nat. 193, 346–358. doi: 10.1086/701668
Choua, M., Heath, M. R., Speirs, D. C., and Bonachela, J. A. (2020). The effect of viral plasticity on the persistence of host-virus systems. J. Theor. Biol. 498:110263. doi: 10.1016/j.jtbi.2020.110263
Clerissi, C., Desdevises, Y., and Grimsley, N. (2012). Prasinoviruses of the marine green alga Ostreococcus tauri are mainly species specific. J. Virol. 86, 4611–4619. doi: 10.1128/jvi.07221-11
Coello-Camba, A., Diaz-Rua, R., Duarte, C. M., Irigoien, X., Pearman, J. K., Alam, I. S., et al. (2020). Picocyanobacteria community and cyanophage infection responses to nutrient enrichment in a mesocosms experiment in oligotrophic waters. Front. Microbiol. 11:1153. doi: 10.3389/fmicb.2020.01153
Danovaro, R., Corinaldesi, C., Dell’Anno, A., Fuhrman, J. A., Middelburg, J. J., Noble, R. T., et al. (2011). Marine viruses and global climate change. FEMS Microbiol. Rev. 35, 993–1034.
Demory, D., Arsenieff, L., Simon, N., Six, C., Rigaut-Jalabert, F., Marie, D., et al. (2017). Temperature is a key factor in Micromonas-virus interactions. ISME J. 11, 601–612. doi: 10.1038/ismej.2016.160
Demory, D., Liu, R. Y., Chen, Y., Zhao, F. X., Coenen, A. R., Zeng, Q. L., et al. (2020a). Linking light-dependent life history traits with population dynamics for Prochlorococcus and cyanophage. Mar. Syst. 5:e00586-19. doi: 10.1128/mSystems.00586-19
Demory, D., Weitz, J. S., Baudoux, A.-C., Touzeau, S., Simon, N., Rabouille, S., et al. (2020b). A thermal trade-off between viral production and degradation drives phytoplankton-virus population dynamics. bioRxiv [Preprint]. doi: 10.1101/2020.08.18.256156
Derelle, E., Yau, S., Moreau, H., and Grimsley, N. H. (2018). Prasinovirus attack of Ostreococcus is furtive by day but savage by night. J. Virol. 92:e01703-17. doi: 10.1128/JVI.01703-17
Edwards, K. F., and Steward, G. F. (2018). Host traits drive viral life histories across phytoplankton viruses. Am. Nat. 191, 566–581. doi: 10.1086/696849
Edwards, K. F., Steward, G. F., and Schvarcz, C. A. (2020). Making sense of virus size and the tradeoffs shaping viral fitness. bioRxiv [Preprint]. doi: 10.1101/2020.04.01.020628
Fasham, M. J. R., Ducklow, H. W., and McKelvie, S. M. (1990). A nitrogen-based model of plankton dynamics in the oceanic mixed layer. J. Mar. Res. 48, 591–639. doi: 10.1357/002224090784984678
Fedida, A., and Lindell, D. (2017). Two Synechococcus genes, two different effects on cyanophage infection. Viruses 9, 136–148. doi: 10.3390/v9060136
Field, C. B., Behrenfeld, M. J., Randerson, J. T., and Falkowski, P. (1998). Primary production of the biosphere: integrating terrestrial and oceanic components. Science 281, 237–240. doi: 10.1126/science.281.5374.237
Finiguerra, M. B., Escribano, D. F., and Taylor, G. T. (2011). Light-independent mechanisms of virion inactivation in coastal marine systems. Hydrobiologia 665, 51–66. doi: 10.1007/s10750-011-0603-x
Flynn, K. J. (2008). Use, abuse, misconceptions and insights from quota models: the Droop cell-quota model 40 years on. Oceanogr. Mar. Biol. Ann. Rev. 46, 1–23. doi: 10.1201/9781420065756.ch1
Flynn, K. J., and Mitra, A. (2016). Why plankton modelers should reconsider using rectangular hyperbolic (Michaelis-Menten, Monod) descriptions of predator-prey interactions. Front. Mar. Sci. 3:165. doi: 10.3389/fmars.2016.00165
Frank, S. A. (2002). Within-host spatial dynamics of viruses and defective interfering particles. J. Theor. Biol. 206, 279–290. doi: 10.1006/jtbi.2000.2120
Frenken, T., Brussaard, C. P. D., Velthuis, M., Aben, R., Kazanjian, G., Hilt, S., et al. (2020). Warming advances virus population dynamics in a temperate freshwater plankton community. Limnol. Oceanogra. Lett. 5, 295–304. doi: 10.1002/lol2.10160
Garza, D. R., and Suttle, C. A. (1998). The effect of cyanophages on the mortality of Synechococcus spp. and selection for UV resistant viral communities. Microb. Ecol. 36, 281–292. doi: 10.1007/s002489900115
Gobler, C. J., Anderson, O. R., Gastrich, M. D., and Wilhelm, S. W. (2007). Ecological aspects of viral infection and lysis in the harmful brown tide alga Aureococcus anophagefferens. Aquat. Microb. Ecol. 47, 25–36. doi: 10.3354/ame047025
Gons, H. J., Hoogveld, H. L., Simis, S. G. H., and Tijdens, M. (2006). Dynamic modelling of viral impact on cyanobacterial populations in shallow lakes: implications of burst size. J. Mar. Biol. Assoc. 86, 537–542. doi: 10.1017/s0025315406013440
González, J. M., and Suttle, C. A. (1993). Grazing by marine nanoflagellates on viruses and virus-sized particles: ingestion and digestion. Mar. Ecol. Prog. Ser. 94, 1–10. doi: 10.3354/meps094001
Gustavsen, J. A., Winget, D. M., Tian, X., and Suttle, C. A. (2014). High temporal and spatial diversity in marine RNA viruses implies that they have an important role in mortality and structuring plankton communities. Front. Microbiol. 5:703. doi: 10.3389/fmicb.2014.00703
Heath, S. E., Knox, K., Vale, P. F., and Collins, S. (2017). Virus resistance is not costly in a marine alga evolving under multiple environmental stressors. Viruses 9, 39–65. doi: 10.3390/v9030039
Horas, E. L., Theodosiou, L., and Becks, L. (2018). Why are algal viruses not always successful? Viruses 10, 474–491. doi: 10.3390/v10090474
Howard-Varona, C., Hargreaves, K. R., Solonenko, N. E., Markillie, L. M., White, R. A. III, Brewer, H. M., et al. (2018). Multiple mechanisms drive phage infection efficiency in nearly identical hosts. ISME J. 12, 1605–1618. doi: 10.1038/s41396-018-0099-8
Jacquet, S., Miki, T., Noble, R., Peduzzi, P., and Wilhelm, S. (2010). Viruses in aquatic ecosystems: important advancements of the last 20 years and prospects for the future in the field of microbial oceanography and limnology. Adv. Oceanogra. Limnol. 1, 97–141. doi: 10.1080/19475721003743843
Jiao, N., Herndl, G. J., Hansell, D. A., Benner, R., Kattner, G., Wilhelm, S. W., et al. (2010). Microbial production of recalcitrant dissolved organic matter: long-term carbon storage in the global ocean. Nat. Rev. Microbiol. 8, 593–599. doi: 10.1038/nrmicro2386
Jiao, N., and Zheng, Q. (2011). The microbial carbon pump: from genes to ecosystems. Appl. Environ. Microbiol. 77, 7439–7444. doi: 10.1128/AEM.05640-11
Johannessen, T. V., Larsen, A., Bratbak, G., Pagarete, A., Edvardsen, B., Egge, E. D., et al. (2017). Seasonal dynamics of haptophytes and dsDNA algal viruses suggest complex virus-host relationship. Viruses 9, 84–101. doi: 10.3390/v9040084
Jover, L., Effler, T., Buchan, A., Wilhelm, S. W., and Weitz, J. S. (2014). The elemental composition of virus particles: implications for marine biogeochemical cycles. Nat. Rev. Microbiol. 12, 519–528. doi: 10.1038/nrmicro3289
Jover, L. F., Cortez, M. H., and Weitz, J. S. (2013). Mechanisms of multi-strain coexistence in host–phage systems with nested infection networks. J. Theor. Biol. 332, 65–77. doi: 10.1016/j.jtbi.2013.04.011
Lelchat, F., Mocaer, P. Y., Ojima, T., Michel, G., Sarthou, G., Bucciarelli, E., et al. (2019). Viral degradation of marine bacterial exopolysaccharides. FEMS Microbiol. Ecol. 95:fiz079. doi: 10.1093/femsec/fiz079
Litchman, E., Klausmeier, C. A., Schofield, O. M., and Falkowski, P. G. (2007). The role of functional traits and trade-offs in structuring phytoplankton communities: scaling from cellular to ecosystem level. Ecol. Lett. 10, 1170–1181. doi: 10.1111/j.1461-0248.2007.01117.x
Maat, D. S., Biggs, T., Evans, C., van Bleijswijk, J. D. L., van derWel, N. N., Dutilh, B. E., et al. (2017). Characterization and temperature dependence of Arctic Micromonas polaris viruses. Viruses 9, 134–153. doi: 10.3390/v9060134
Maat, D. S., de Blok, R., and Brussaard, C. P. D. (2016). Combined phosphorus limitation and light stress prevent viral proliferation in the phytoplankton species Phaeocystis globosa, but not in Micromonas pusilla. Front. Mar. Sci. 3:160. doi: 10.3389/fmars.2016.00160
Maat, D. S., Prins, M. A., and Brussaard, C. P. D. (2019). Sediments from arctic tide-water glaciers remove coastal marine viruses and delay host infection. Viruses 11, 123–137. doi: 10.3390/v11020123
Mateus, M. D. (2017). Bridging the gap between knowing and modeling viruses in marine systems–an upcoming frontier. Front. Mar. Sci. 3:284. doi: 10.3389/fmars.2016.00284
Menden-Deuer, S., and Lessard, E. J. (2000). Carbon to volume relationships for dinoflagellates, diatoms, and other protist plankton. Limnol. Oceanogr. 45, 569–579. doi: 10.4319/lo.2000.45.3.0569
Mitra, A., Castellani, C., Gentleman, W. C., Jónasdóttir, S. H., Flynn, K. J., Bode, A., et al. (2014). Bridging the gap between marine biogeochemical and fisheries sciences; configuring the zooplankton link. Prog. Oceanogr. 129, 176–199. doi: 10.1016/j.pocean.2014.04.025
Mojica, C. D. A., and Brussaard, C. P. D. (2014). Factors affecting virus dynamics and microbial host–virus interactions in marine environments. FEMS Microbiol. Ecol. 89, 495–515. doi: 10.1111/1574-6941.12343
Murray, A. G., and Jackson, G. A. (1992). Viral dynamics: a model of the effects of size, shape, motion and abundance of single-celled planktonic organisms and other particles. Mar. Ecol. Prog. Ser. 89, 103–116. doi: 10.3354/meps089103
Record, N. R., Talmy, D., and Våge, S. (2016). Quantifying tradeoffs for marine viruses. Front. Mar. Sci. 3:251. doi: 10.3389/fmars.2016.00251
Ruiz, E., Oosterhof, M., Sandaa, R.-A., Larsen, A., and Pagarete, A. (2017). Emerging interaction patterns in the Emiliania huxleyi-EhV system. Viruses 9, 61–74. doi: 10.3390/v9030061
Sahlsten, E. (1998). Seasonal abundance in Skagerrak-Kattegat coastal waters and host specificity of viruses infecting the marine photosynthetic flagellate Micromonas pusilla. Aquat. Microb. Ecol. 16, 103–108. doi: 10.3354/ame016103
Sandaa, R.-A., Pree, B., Larsen, A., Våge, S., Töpper, B., Töpper, J. P., et al. (2017). The response of heterotrophic prokaryote and viral communities to labile organic carbon inputs is controlled by the predator food chain structure. Viruses 9, 238–253. doi: 10.3390/v9090238
Schroeder, D. C., Oke, J., Hall, M., Malin, G., and Wilson, W. H. (2003). Virus succession observed during an Emiliania huxleyi bloom. Appl. Environ. Microbiol. 69, 2484–2490. doi: 10.1128/aem.69.5.2484-2490.2003
Slagter, H. A., Gerringa, L. J. A., and Brussaard, C. P. D. (2016). Phytoplankton virus production negatively affected by iron limitation. Front. Mar. Sci. 3:156. doi: 10.3389/fmars.2016.00156
Stock, C. A., Dunne, J. P., and John, J. G. (2014). Global-scale carbon and energy flows through the marine planktonic food web: an analysis with a coupled physical–biological model. Prog. Oceanogr. 120, 1–28. doi: 10.1016/j.pocean.2013.07.001
Suttle, C. A. (1994). The significance of viruses to mortality in aquatic microbial communities. Microb. Ecol. 28, 237–243. doi: 10.1007/bf00166813
Suttle, C. A. (2007). Marine viruses – major players in the global ecosystem. Nat. Rev. Microbiol. 5, 801–812. doi: 10.1038/nrmicro1750
Suttle, C. A., and Chen, F. (1992). Mechanisms and rates of decay of marine viruses in seawater. Appl. Environ. Microbiol. 58, 3721–3729. doi: 10.1128/aem.58.11.3721-3729.1992
Thingstad, T. F., Våge, S., Storesund, J. E., Sandaa, R.-A., and Giske, J. (2014). A theoretical analysis of how strain-specific viruses can control microbial species diversity. Proc. Natl. Assoc. Sci. U.S.A. 111, 7813–7818. doi: 10.1073/pnas.1400909111
Weitz, J. S., Stock, C. A., Wilhelm, S. W., Bourouiba, L., Coleman, M. L., Buchan, A., et al. (2015). A multitrophic model to quantify the effects of marine viruses on microbial food webs and ecosystem processes. ISME J. 9, 1352–1364. doi: 10.1038/ismej.2014.220
Wilhelm, S. W., Brigden, S. M., and Suttle, C. A. (2002). A dilution technique for the direct measurement of viral production: a comparison in stratified and tidally mixed coastal waters. Microb. Ecol. 43, 168–173. doi: 10.1007/s00248-001-1021-9
Wilhelm, S. W., and Suttle, C. A. (1999). Viruses and nutrient cycles in the sea – viruses play critical roles in the structure and function of aquatic food webs. Bioscience 49, 781–788. doi: 10.2307/1313569
Wilhelm, S. W., Weinbauer, M. G., Suttle, C. A., and Jeffrey, W. H. (1998). The role of sunlight in the removal and repair of viruses in the sea. Limnol. Oceanogr. 43, 586–592. doi: 10.4319/lo.1998.43.4.0586
Winter, C., Payet, J. P., and Suttle, C. A. (2012). Modeling the winter–to–summer transition of prokaryotic and viral abundance in the Arctic Ocean. PLoS One 7:e52794. doi: 10.1371/journal.pone.0052794
Zimmerman, A. E., Bachy, C., Ma, X., Roux, S., Jang, H. B., Sullivan, M. B., et al. (2019). Closely related viruses of the marine picoeukaryotic alga Ostreococcus lucimarinus exhibit different ecological strategies. Environ. Microbiol. 21, 2148–2170. doi: 10.1111/1462-2920.14608
Keywords: phytoplankton, virus, trait-trade-off, system-dynamics-model, burst-size, latent-period, adsorption, bloom
Citation: Flynn KJ, Kimmance SA, Clark DR, Mitra A, Polimene L and Wilson WH (2021) Modelling the Effects of Traits and Abiotic Factors on Viral Lysis in Phytoplankton. Front. Mar. Sci. 8:667184. doi: 10.3389/fmars.2021.667184
Received: 12 February 2021; Accepted: 07 April 2021;
Published: 21 May 2021.
Edited by:
Télesphore Sime-Ngando, Centre National de la Recherche Scientifique (CNRS), FranceReviewed by:
Tron Frede Thingstad, University of Bergen, NorwayMarcos Mateus, University of Lisbon, Portugal
Copyright © 2021 Flynn, Kimmance, Clark, Mitra, Polimene and Wilson. This is an open-access article distributed under the terms of the Creative Commons Attribution License (CC BY). The use, distribution or reproduction in other forums is permitted, provided the original author(s) and the copyright owner(s) are credited and that the original publication in this journal is cited, in accordance with accepted academic practice. No use, distribution or reproduction is permitted which does not comply with these terms.
*Correspondence: Kevin J. Flynn, S0pGQFBNTC5hYy51aw==