 Lonneke L. IJsseldijk
 Kees C. J. Camphuysen2,3
 Gerard Troost
- 1Division of Pathology, Department of Biomolecular Health Sciences, Faculty of Veterinary Medicine, Utrecht University, Utrecht, Netherlands
- 2Royal Netherlands Institute for Sea Research, Texel, Netherlands
- 3Nederlandse Zeevogelgroep, Den Helder, Netherlands
- 4Naturalis Biodiversity Center, Leiden, Netherlands
- 5Sovon Dutch Centre for Field Ornithology, Nijmegen, Netherlands
- 6Trektellen.org, Middelburg, Netherlands
- 7Wageningen Marine Research, Wageningen University and Research, Den Helder, Netherlands
- 8Wildlife Ecology and Conservation Group, Wageningen University and Research, Wageningen, Netherlands
The increase in anthropogenic activities and their potential impact on wildlife requires the establishment of monitoring programs and identification of indicator species. Within marine habitats, marine mammals are often used as ecosystem sentinels, which has led to investigations into their abundance, distribution, and mortality patterns. However, trends in sightings and strandings are rarely analyzed in combination. This is necessary to distinguish elevated stranding rates caused by changes in local abundance from increased mortality as a consequence of other natural, environmental or anthropogenic factors. Therefore, the objective of this study was to assess whether harbor porpoise (Phocoena phocoena) stranding frequency in the southern North Sea can be explained by local population density derived from more than 400 thousand hours of systematic observations along the Dutch coast between 1990 and 2018. Since the late 1990s, both the number of stranded porpoises and the sighting rate increased rapidly up to around the mid-2000s, after which they remained high, but with large inter-annual fluctuations. On an annual basis there was a strong correlation between porpoise strandings and sightings, but with a seasonal mismatch. Highest stranding rates occur in late summer, while highest sighting rates occur in early spring. Despite low sighting rates in late summer, August appears to be the best predictor for the monthly variation in the number of stranded porpoises, which could be explained by post-reproductive dispersal and mortality. Excessive high porpoise stranding numbers after accounting for variations in local density could signpost unusual mortality events (UMEs). The corrected stranding rates show that in the early 1990s, when porpoise sightings were rare, and after 2010, the number of stranded porpoises exceeds the expected number. Especially in the summer of 2011, the number of dead porpoises found ashore was excessively high and this might reflect an UME. These results demonstrate that a comparative interpretation of marine mammal strandings and coastal sightings can be a valuable management and conservation tool that could provide an early warning signal for population change.
Introduction
The increasing human impact on the marine environment has created a responsibility to monitor human effects on wildlife (Tyne et al., 2016; Tablado and Jenni, 2017). A successful monitoring program should detect changes in population parameters, which can be related to conservation objectives (Bubb et al., 2005). In the marine environment, marine mammals are often used as environmental indicator species, because they are long-lived and feed at or near the top of the food chain (Moore, 2008; Bossart, 2011). Furthermore, most marine mammal species are protected by a range of international and national regulations (Camphuysen and Siemensma, 2011; Evans, 2019). This comes with the need to assess their abundance and distribution. For cetaceans, population assessment is mainly achieved through ship-based or aerial line-transect surveys (Hammond et al., 2002; Scheidat et al., 2012; Geelhoed and Scheidat, 2018; Nachtsheim et al., 2021). Disadvantages of line-transect surveys are that they are costly, logistically challenging and often only sample a very small proportion of the population, despite a considerable effort. In addition, it is only possible to get snap-shot population abundance estimates, with precipitous declines or smaller-scale changes not easily detected (Taylor et al., 2007; Peltier et al., 2013; Ten Doeschate et al., 2018). This demonstrates a need for other methods that could provide an early warning signal for population change.
Due to the statutory requirement of several international conventions, stranding networks that record and sample marine mammals found ashore have been implemented in several European countries for decades. While spatiotemporal changes in stranding frequencies have been used as indicator of population health (Hart et al., 2006; Pyenson, 2011; Williams et al., 2011; IJsseldijk et al., 2018a; Betty et al., 2020), it remains unknown whether they are representative for the at-sea population. This is caused by the complexity in quantifying the various components that influences the stranding process (Hart et al., 2006; Peltier et al., 2013; Ten Doeschate et al., 2018; IJsseldijk et al., 2020). In particular, an increase in marine mammal strandings may not only reflect an increase in the per-capita mortality, it may also result from increases in local abundance, or environmental conditions.
In North-western Europe, the North Sea basin is inhabited by approximately 350.000 harbor porpoises (Phocoena phocoena) (Hammond et al., 2002, 2013, 2017). Their summer distribution appears to have shifted from north (SCANS, 1994) to south (SCANSII, 2005) (Hammond et al., 2002, 2013). Both sightings and strandings of harbor porpoises in the southern North Sea have increased significantly since the early 1990s (Camphuysen, 2004; Camphuysen et al., 2008; Keijl et al., 2016; Haelters et al., 2018; IJsseldijk et al., 2020). Since 2005, there were periods with excessively high numbers of stranded porpoises (IJsseldijk et al., 2020), raising concerns whether this was solely a result of a higher abundance or may (also) reflected elevated or unusual mortality.
Elevated mortality could be a result of increased threats and pressures that negatively affect the population. The North Sea is a hotspot of anthropogenic activities, where many anthropogenic stressors occur and overlap (Halpern et al., 2008, 2015; Nachtsheim et al., 2021). Harbor porpoises in the North Sea are impacted by fishery activities (bycatch and competition) (Kirkwood et al., 1997; Leeney et al., 2008; IJsseldijk et al., 2018c), chemical pollution (Pierce et al., 2008; Weijs et al., 2009; Jepson et al., 2016), noise pollution from shipping (Wisniewska et al., 2018), seismic surveys and underwater explosions (von Benda-Beckmann et al., 2015; Aarts et al., 2016), and more recently, habitat loss due to the rapid growth of offshore activities related to the construction of wind farms (Madsen et al., 2006; Gilles et al., 2009). International legislation requires these activities to minimize impacts on marine mammal populations, It is therefore essential to quantify and qualify spatiotemporal mortality trends and threat-specific mortality patterns (Peltier et al., 2012; IJsseldijk et al., 2020).
To investigate if excessive strandings are the result of changes in porpoise occurrence or reflect elevated mortality caused by other factors, the objective of this study is to assess whether the temporal variability in the number of porpoise strandings on the Dutch coast can be explained by local population density, as derived from shore-based observations. We estimate discrepancies between the observed strandings and predicted strandings based on sightings, which may signpost temporal excessive high or low mortality rates. These analyses will define the credibility of stranding records as a population indicator and serve a key example on how comparative analyses of long-term sightings and strandings data could provide insight into fine-scale population density and mortality patterns.
Materials and Methods
Strandings Data
Harbor porpoise stranding records in The Netherlands are managed by Naturalis Biodiversity Center in Leiden1. The Dutch strandings network consists of a consortium of organizations and volunteers. Given the high human population density and the accessibility of (sandy) shorelines, it is expected that there is full coverage along the mainland coast and in the southern Delta area (province of Zeeland), but a slightly lower coverage (expected 80%) in the more remote Wadden Sea area and Frisian islands (Camphuysen et al., 2008; Camphuysen and Siemensma, 2011; Peltier et al., 2013; Keijl et al., 2016; IJsseldijk et al., 2020). A total of 9,229 harbor porpoise stranding records from 1990 to 2019, both dead and alive, were included in this study, with each record representing a stranding event of a single individual. For those records with information on the status of the stranded individual, a distinction could be made between alive (n = 301), freshly dead (n = 2129) and animals with advanced signs of decomposition (n = 3906). This information was unknown for n = 2893 strandings.
Coastal Sighting Data
Harbor porpoise local abundance was analyzed by extracting sightings from the database of the Dutch Seabird Group (Nederlandse Zeevogelgroep NZG/CVZ database) and www.trektellen.nl (Camphuysen, 2011; Troost and Boele, 2019; Hornman et al., 2020). For the analysis, we used coastal sightings data from 1989 to June 2018 and records from observation sites with >5,000 h of effort (Figure 1). In all years, total sighting effort exceeded 100,000 h (Supplementary Figure 1). Counts were conducted year-round, but with increased intensity during periods of bird migration in spring (March–May) and autumn (August–October). Observers used binoculars or telescopes mounted on a tripod with magnification of 10–30 times, and watched uninterrupted perpendicular to the coastline, normally for at least one hour, sometimes up to ten hours or more per day (de Miranda and Koenekoop, 1980; Camphuysen and van Dijk, 1983; Camphuysen, 1985; Fijn et al., 2017). Observations were made from vantage points (dune-tops, piers, dikes), with observatories normally at a height of 5–15 m above sea level, to provide views over the near shore strip (up to 10 km distance). Harbor porpoises were detected predominantly within 2 km from the location of the observer. Observers recorded date, duration of the observation period (start and end time), and weather characteristics, and log their sightings usually per hour of observation. Weather conditions logged per observation hour are: wind force (in Beaufort), wind direction, cloud cover (8-point scale) and visibility (in kms). The observers are well-trained and sufficiently experienced in porpoise identification.
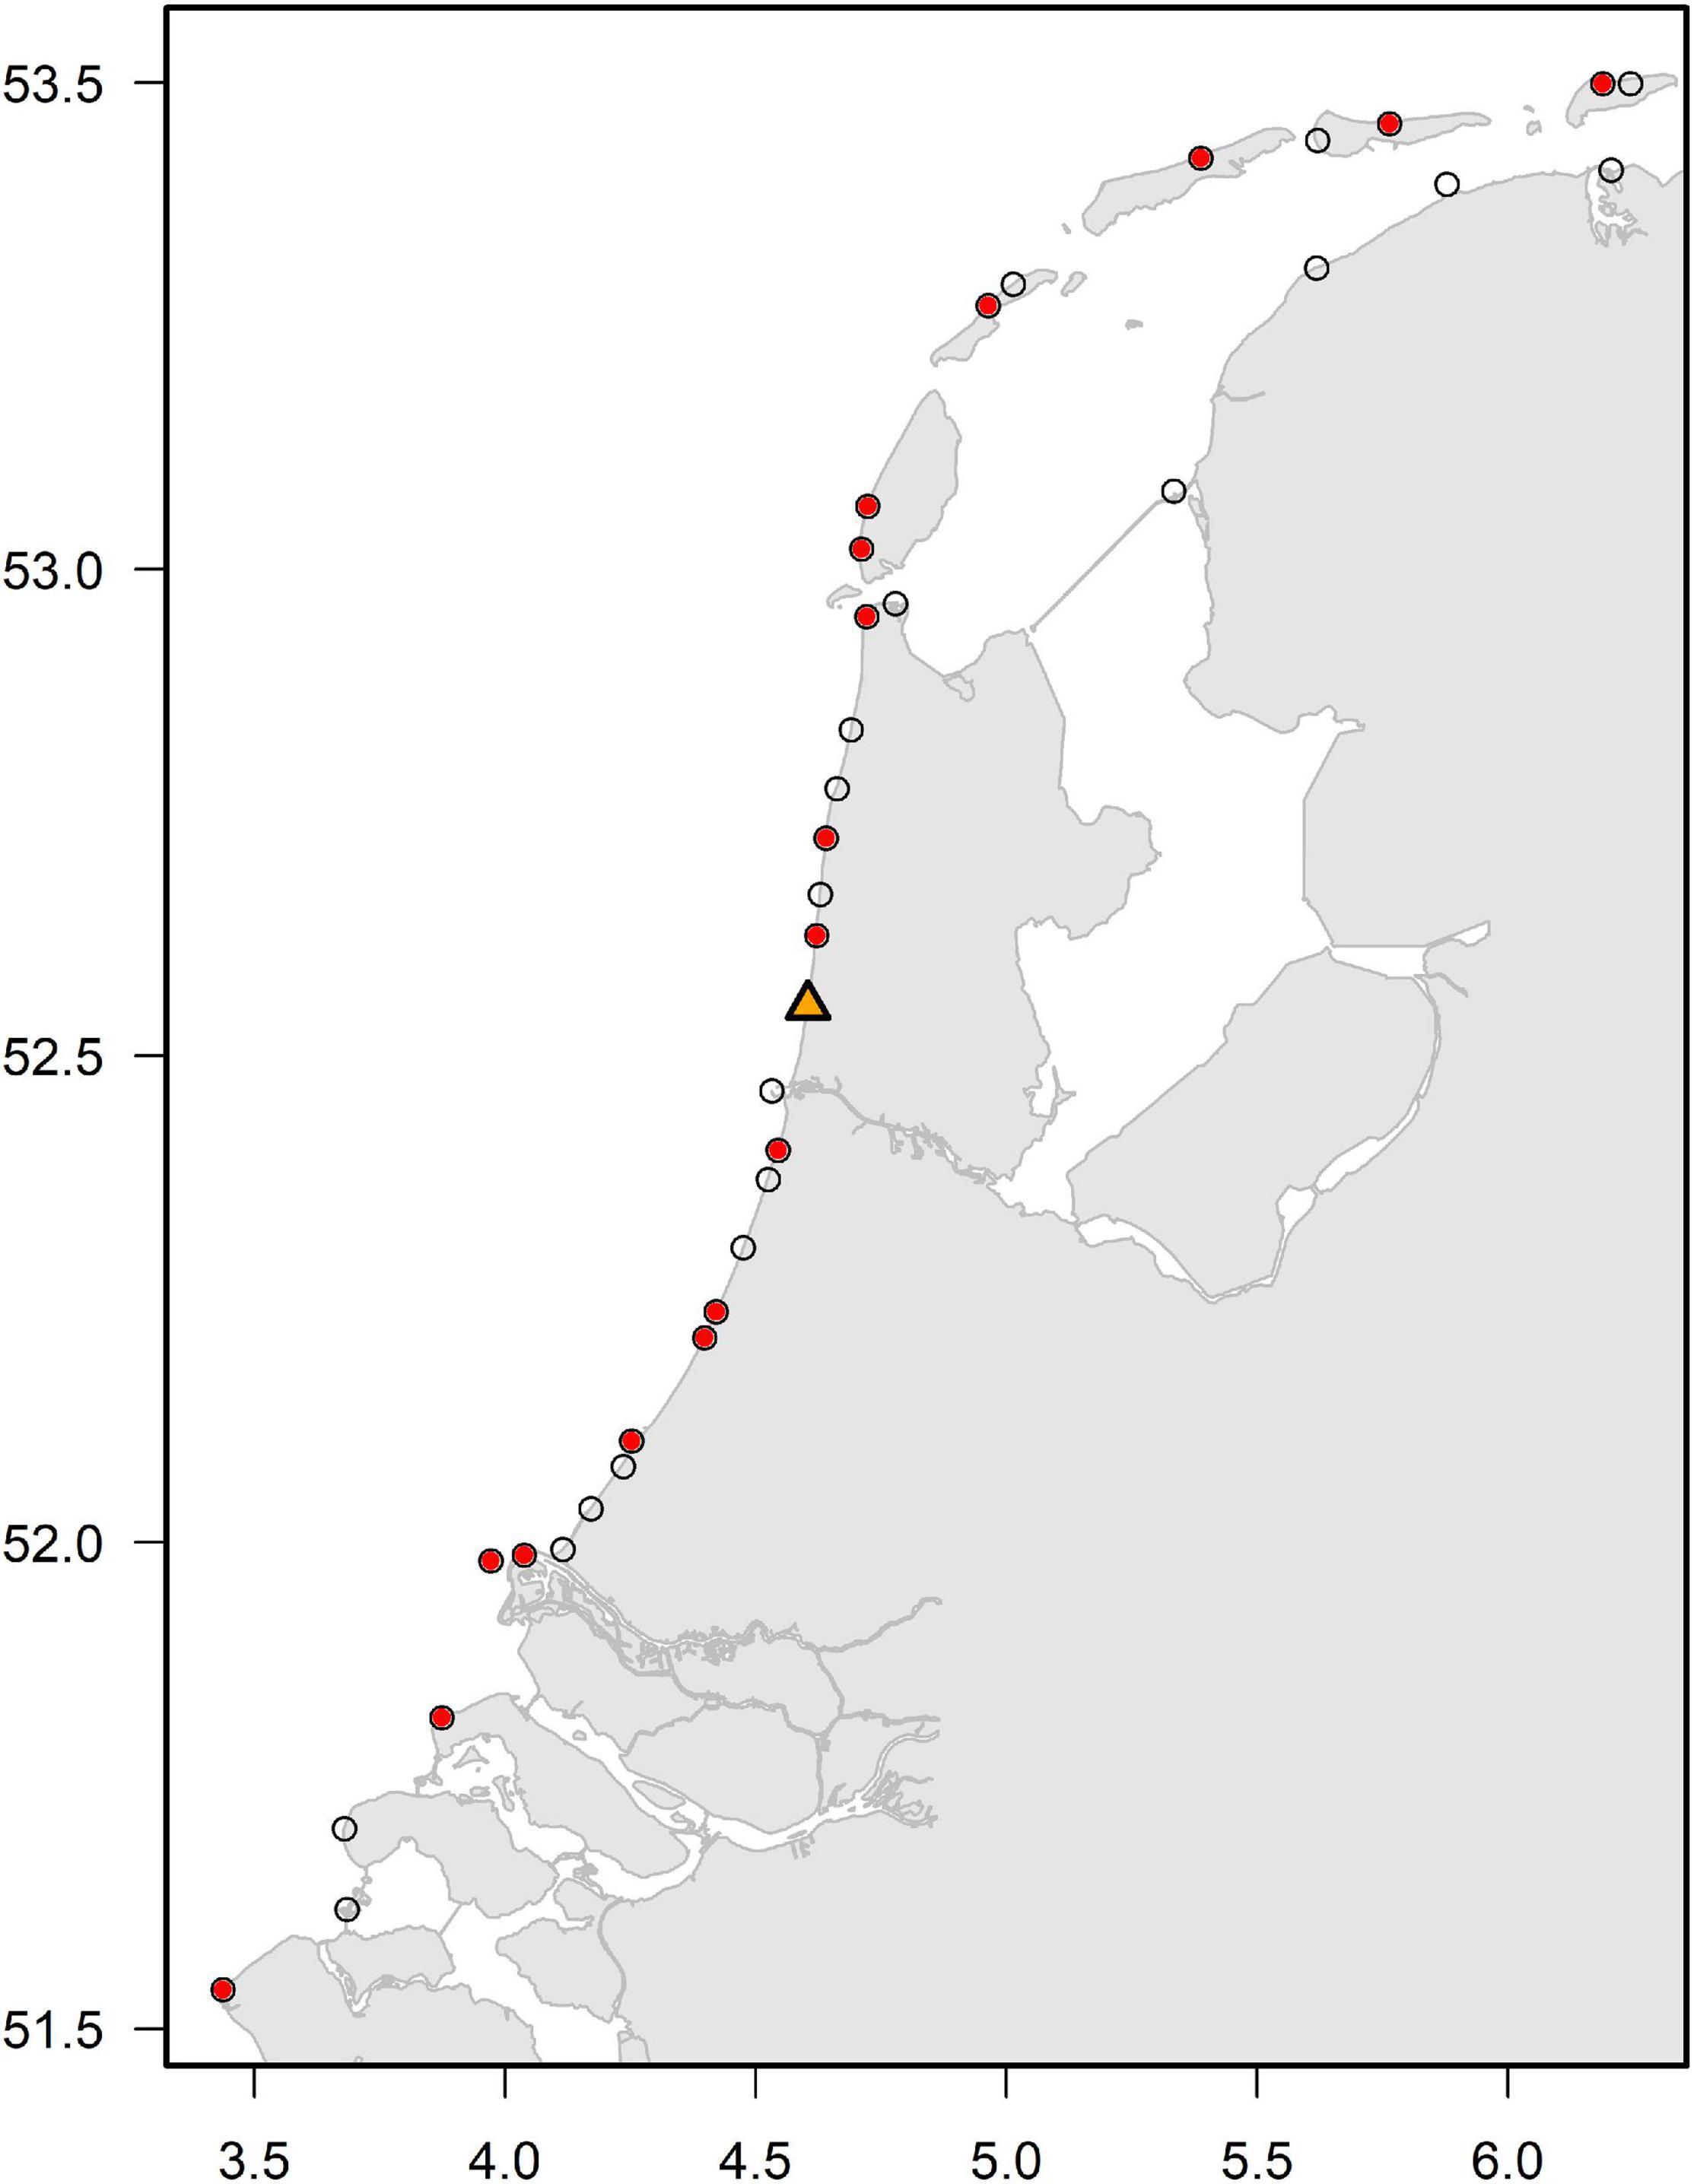
Figure 1. Location of coastal observation points in The Netherlands (black open circles) and those with sufficient data (red circles, observation sites with >5,000 h of effort) to be included in the analysis. The orange triangle represents the observation site “Castricum aan Zee” (site id = 527) which was used as reference site for further analysis.
Correcting for Weather Effect on Sightings
To correct for the effect of weather conditions on sighting probability, the number of porpoises observed Ntwas modeled as a function of several weather-related covariates:
where NB represents a negative binomial distribution, γt the expected sighting rate and θ the dispersion parameter (based on Soldaat and Poot, 2020). All explanatory variables were included as factor variables. The explanatory variables were year (1989–2018), month (January–December), part of day (morning, mid-day or late afternoon), observation site (18 unique sites), wind force (weak, moderate and strong), wind direction (onshore, offshore or other), cloud cover (overcast, partly and no cloud cover) and visibility (good, moderate and poor). The log of the observation duration was included as the model offset. Next, the fitted model was used to predict the expected sighting rate (number of porpoises per hour) for each year and month combination using fixed values for the observation conditions. Predictions were made for one observation site, namely “Castricum aan Zee” (site id = 527), which is centrally located along the Dutch shore and had a high observation effort (Figure 1). The fixed values for the other conditions were part of day = morning, wind force = weak, wind direction = onshore, cloud cover = overcast and visibility = good. These model-based estimates of the sighting rate (X_t; number of porpoises per hour) were used in subsequent analyses (Supplementary Figure 2).
Data Exploration
Data exploration consisted of estimating and presenting total number of strandings by month and year. A distinction was made between all strandings and those classified as “fresh” or “alive,” based on photographs and comments collected during stranding events. The porpoise sighting rates in any month might predict the stranding rate in any other month. For example, sightings in summer might reflect local recruitment and influence the stranding rates in the following winter. Therefore, we investigated how well the number of porpoise stranded in a month m could be explained by the porpoise sighting rate in any of the other n months in the same year.
This resulted in 144 models (i.e., 12 strandings months × 12 sighting months). For each model, the General Linear Model (GLM) equivalent of R2 [i.e., 1-(deviance/null deviance)] was calculated and plotted as raster object (library: raster). Models were fitted using the R-function glm.nb (library: MASS).
Modeling Strandings as Function of Coastal Sightings
The temporal variation in stranded porpoises was modeled as a function of the coastal sightings to examine and quantify general trends and seasonal patterns. In addition, we assessed differences between the observed and predicted strandings based on coastal sightings, to determine anomalies in the observed monthly porpoise strandings.
Predicting Porpoise Strandings Based on Coastal Sighting Rates
A model formulation was designed to investigate if the monthly number of stranded porpoises S_t could be explained by porpoise sighting rate X_t. The baseline model was formulated as follows:
where St and λt are the observed and expected number of strandings per month, respectively. NB is a negative binomial distribution with mean λt and dispersion parameter ϕ. β0 is the intercept and υi represents an autoregressive AR1 temporal correlation:
This base model (Eq. 4) was extended by adding αmXt to the linear predictor:
where αm represent the month (m) specific parameters for the effect of sighting rate X_t on the observed variation in porpoise strandings. We explored a variety of models with different formulations for X_t, where X_t was defined as:
(1) The porpoise sighting rate in the same year and month (i.e., Xt = Xy,m)
(2) The porpoise sighting rate of the month preceding stranding month (i.e., Xt = Xy,m−1)
(3) The sighting rate in each of the 12 months of the same year (i.e., Xt = Xy,1,Xt = Xy,2,…orXt = Xy,12). This involves 12 models.
(4) Like 3, except that year breaks occurred on the first of July, instead of the first of January. For example, when Xt = Xy,8, the number of strandings in March are related to the porpoise sighting rate in August of the preceding year.
The performance of each model was assessed based on the Deviance Information Criterium (DIC) and compared to the baseline model without the inclusion of a dependence on the sighting rate, but with inclusion of the autoregressive temporal correlation structure (see Eq. 4).
The model with the lowest DIC value was subsequently used to predict the expected number of porpoises found ashore. Particular attention was paid to υt, which describes the seasonal trend in deviations in the number of stranded animals relative to the expected values based on coastal sightings.
Results
Corrected Coastal Porpoise Sightings
The model, fitted to the coastal sightings of porpoises to correct for the effect of weather related environmental conditions (see Supplementary Data 1), showed that the highest porpoise sighting rates were recorded during low wind force (i.e., highest parameter estimate for “wind force weak,” Supplementary Data 1), while strong winds resulted in the lowest sighting rate. Sighting rates were also higher under good visibility, high cloud cover and offshore winds (see Supplementary Data 1). Sighting rates were also slightly higher later during the day (day section 2 and 3). There were also differences in sighting rates between the observation sites. The sighting rate (corrected for conditions) was highest at Castricum aan Zee (site no. 527), Maasvlakte II (no. 1272) and Camperduin (no. 429) and lowest at Ouddorp Light house (no. 410), Westkapelle (no. 3) and Maasmond (no. 147). The fitted model was subsequently used to estimate the sighting rate for one central observation site (Castricum aan Zee, no. 527) and a fixed set observation conditions (weak onshore wind, good visibility and high cloud cover). Despite the potential effect of weather, there was still a large correspondence between the observed and corrected porpoise sighting rates (Supplementary Figures 2–4). Note that the absolute values of the corrected model-based sighting rates were on average higher because the model-based estimates were made for more favorable weather conditions.
Annual and Seasonal Patterns in Sighting Rate
The observed porpoise sighting rate rapidly and consistently increased up to 2005 (Figure 2), but after 2005 sighting rate fluctuated and remained relatively high with around 0.08 porpoise per hour (Figure 3). The highest average sighting rate was in 2013, but in 2015, it dropped to the lowest values since 2000 (Figure 3A).
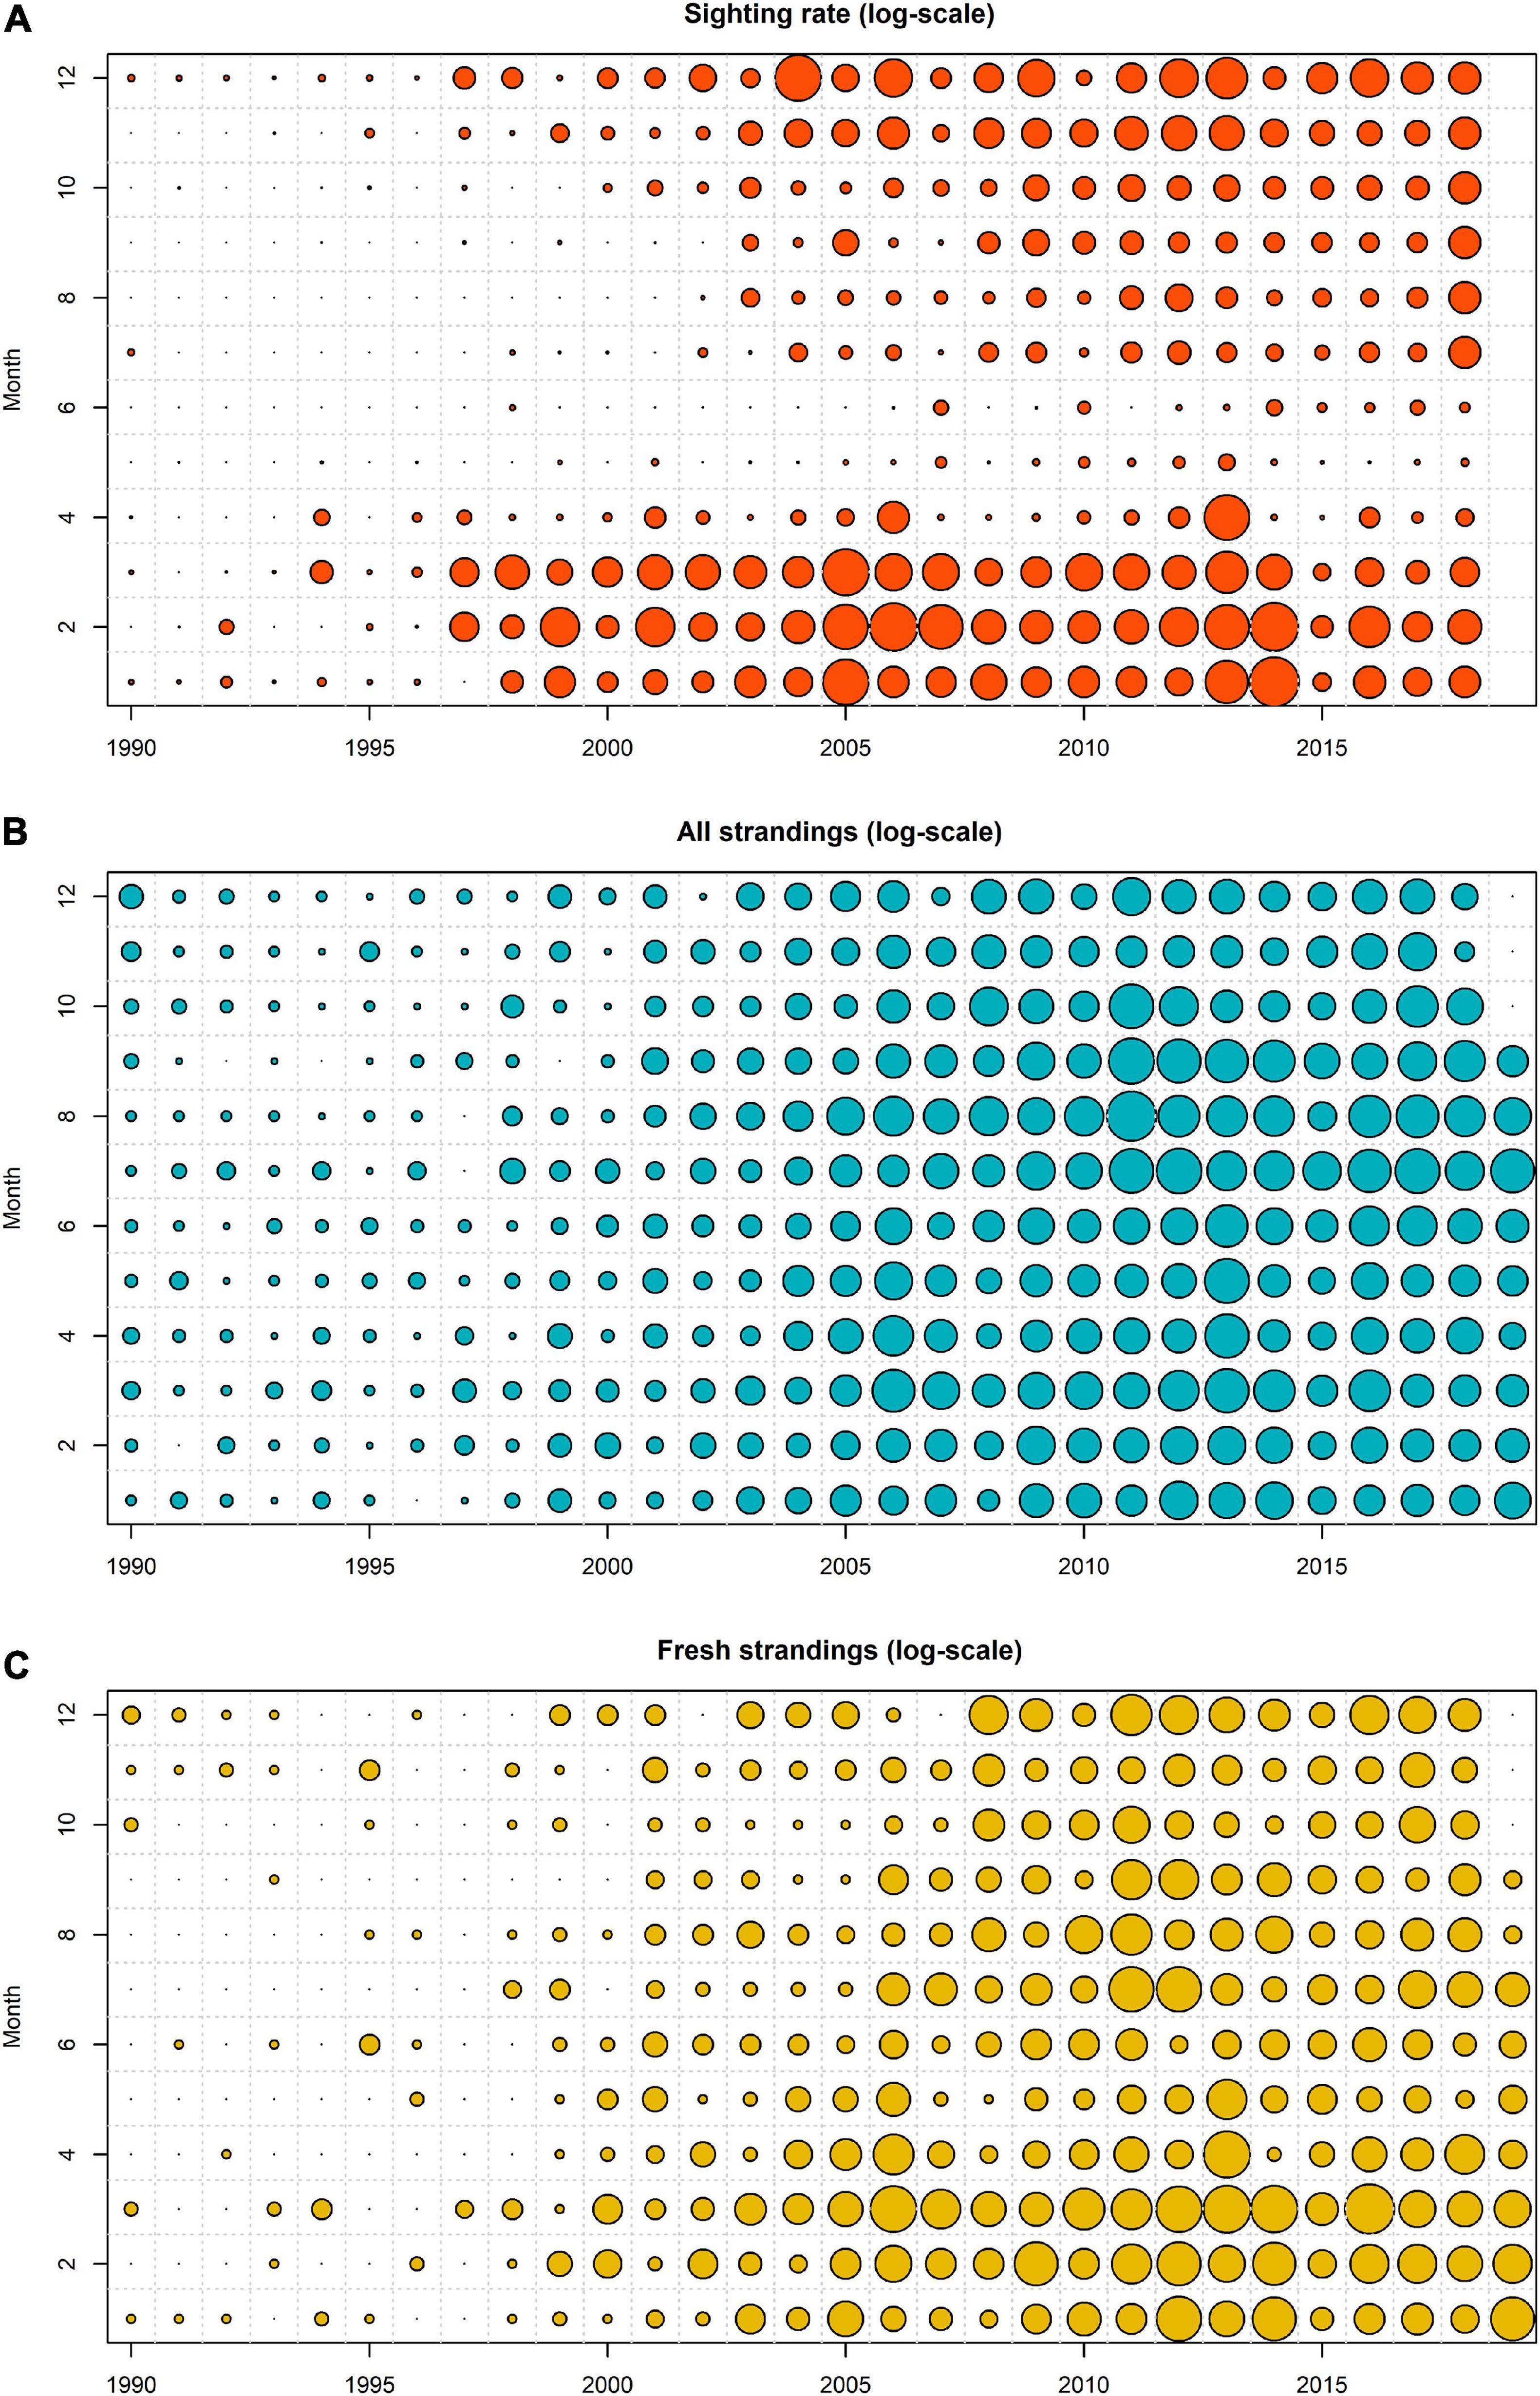
Figure 2. Seasonal and annual patterns in observed sighting rate (A), all strandings (B), fresh and alive strandings (C) with the size of the circles representing the respective variables (on the log-scale).
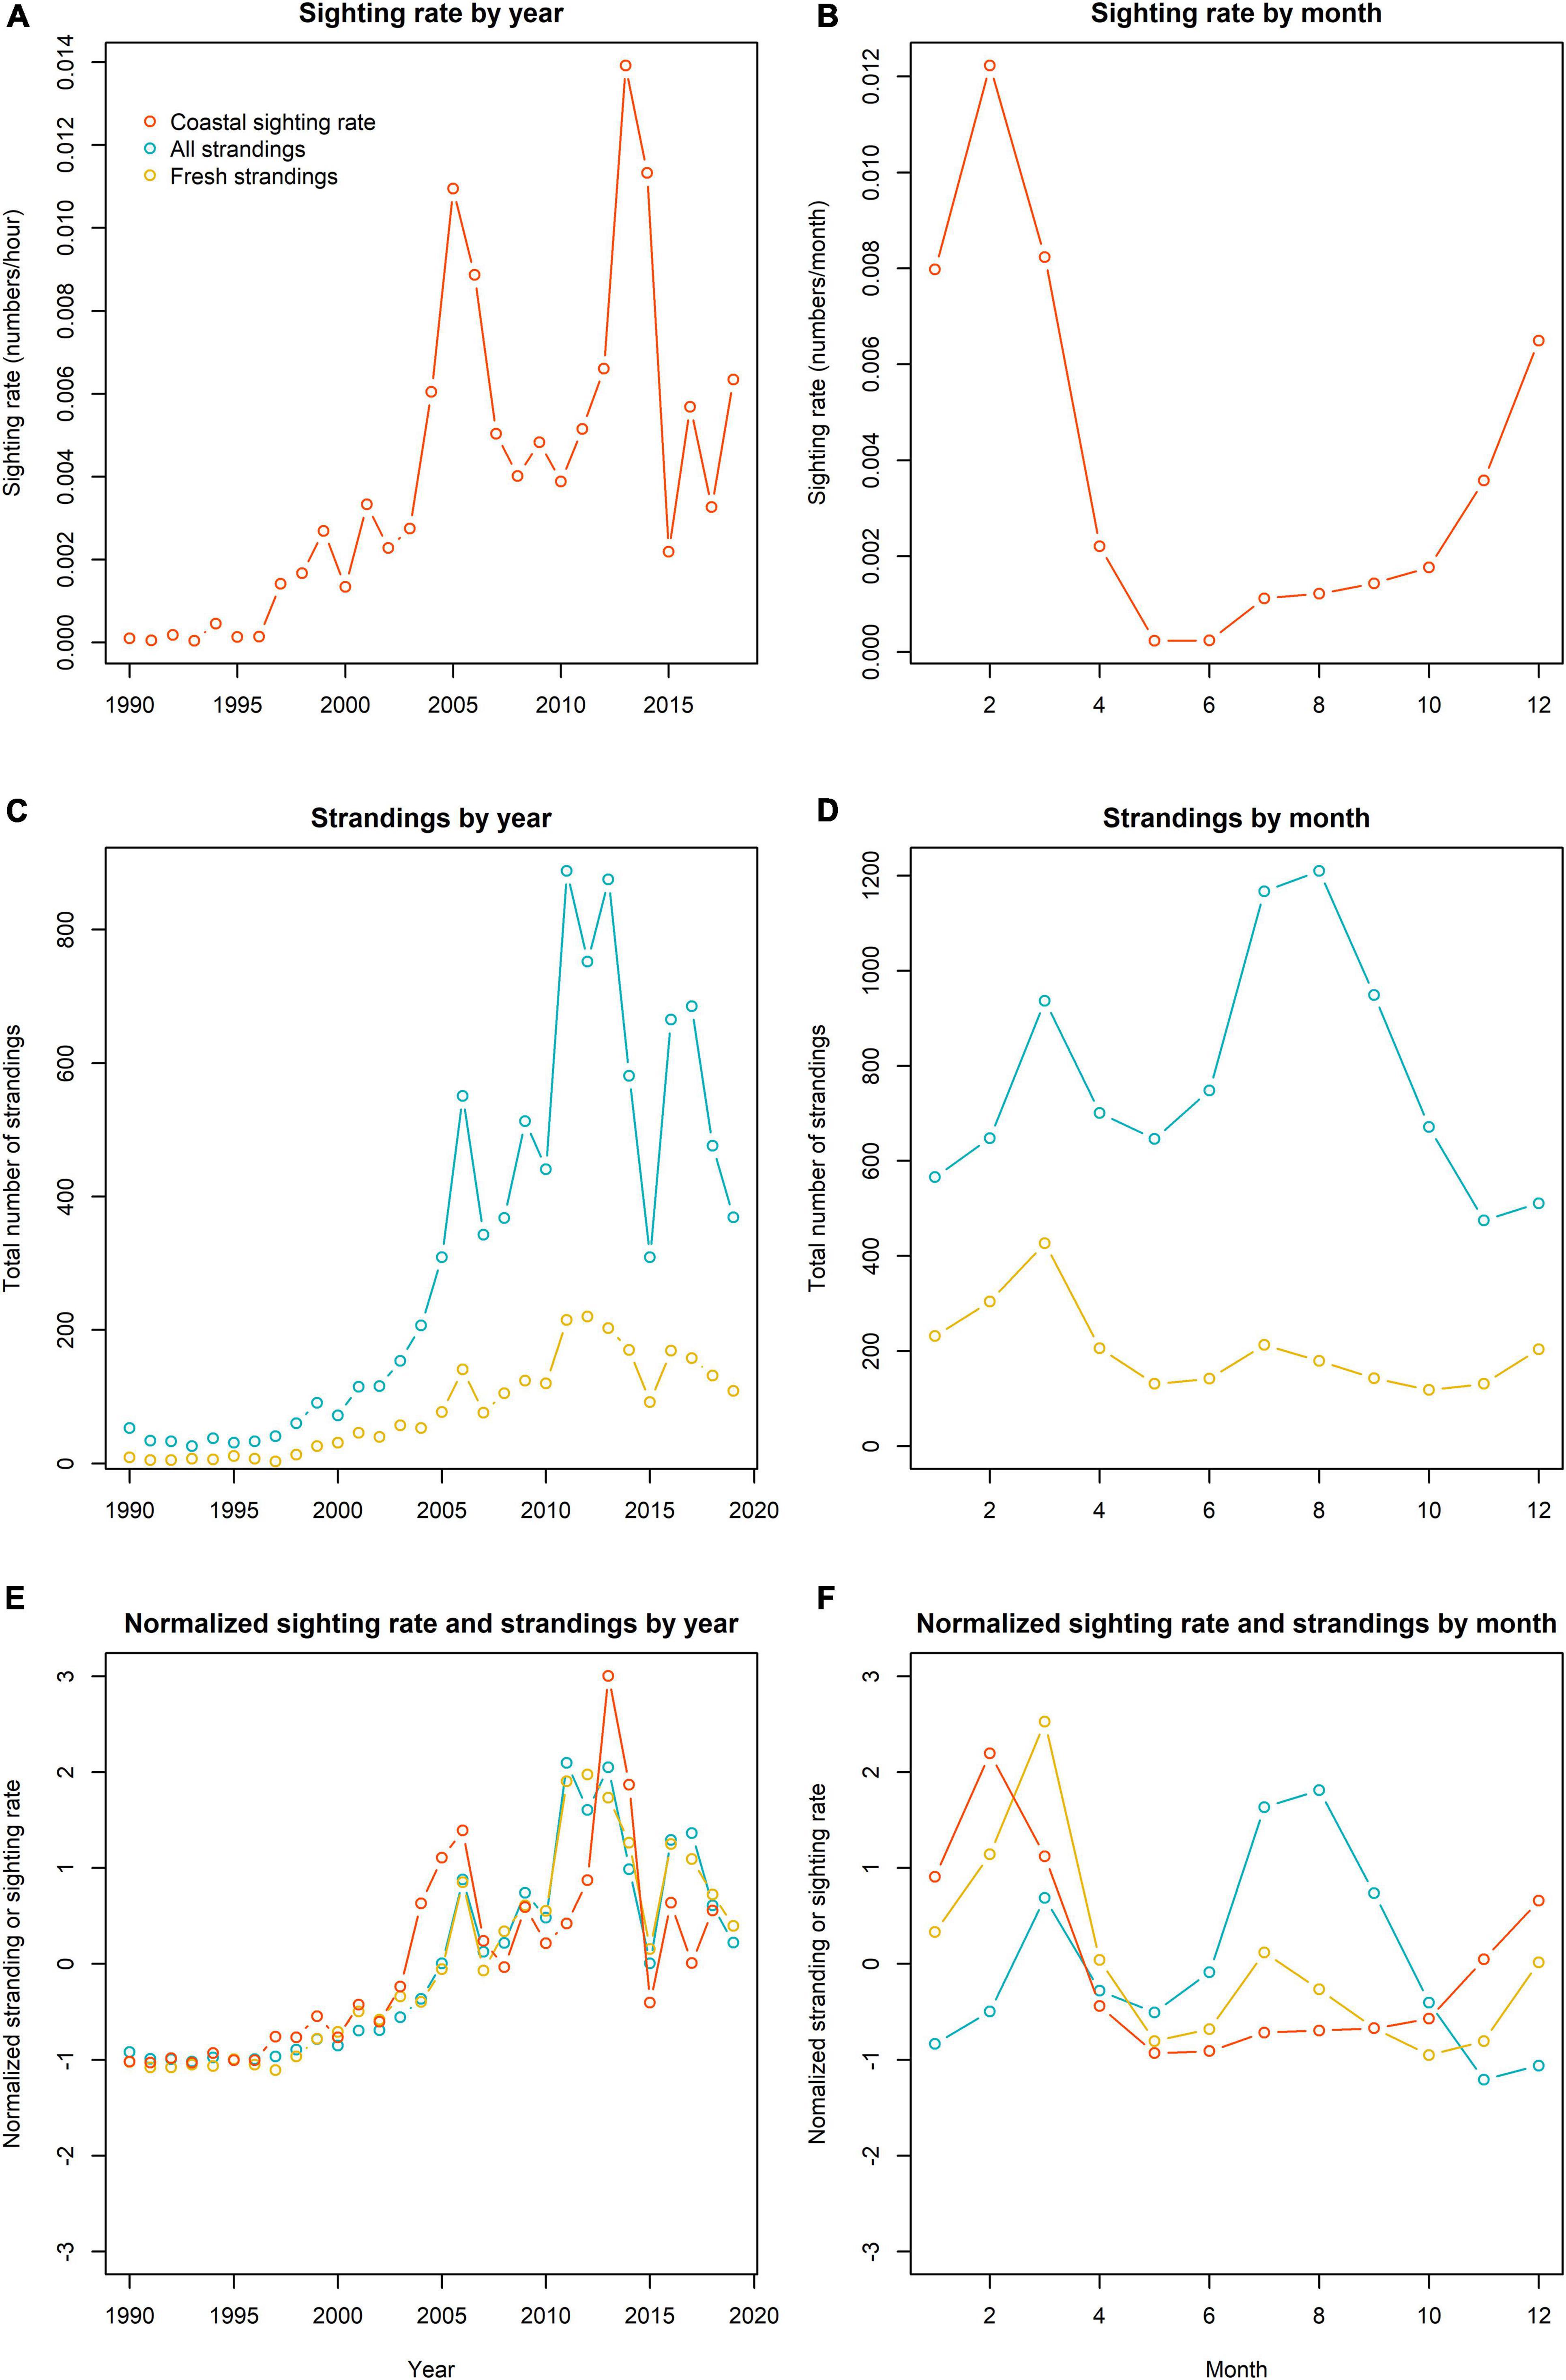
Figure 3. Annual and monthly sightings and stranding patterns (orange = sightings, blue = all strandings, yellow = fresh and alive strandings). The lines reflect the variability in the sighting rate averaged by year (A) and month (B), all strandings, and fresh and alive strandings by year (C) and month (D) and the normalized sightings and strandings by year (E) and month (F).
Seasonal patterns revealed that sighting rates were highest during the winter months, with overall high values between December and March, and a peak in February. The sighting rates were very low in May and June (Figure 3B). Although the monthly pattern in porpoise sighting rate was fairly consistent between years, there were some annual variations. For example, the highest average sighting rate was in January 2014 (Figure 2).
Annual and Seasonal Patterns in Strandings
The number of stranded animals rapidly increased up to 2006, after which the trend seemed to be less consistent with large inter-annual variability (Figures 2, 3C,D). The largest number of stranded animals were reported in 2011 and 2013. In the last decade, the lowest stranding number was recorded in 2015. In this year, porpoise sightings were also very low (Figures 2, 3A). When the annual pattern in strandings and coastal sightings were normalized (i.e., subtracting the average value and dividing by its standard deviation), normalized strandings were lower from 1997 to 2007 (Figure 3E). From 2008 to 2018 the normalized strandings exceeded the normalized sighting rate, except for 2013 and 2014. While both 2011 and 2013 were characterized by a high number of porpoises washing ashore, only 2011 was particularly high compared to the normalized stranding rate. The total number of stranded porpoises (between 1990 and 2018) revealed that most porpoises were found in July and August, with a smaller peak in March (Figures 3D,F). In March, a much larger proportion of fresh and alive animals were found ashore and total number of porpoises recorded as fresh and alive are highest in that month. The normalized monthly pattern in porpoise strandings and coastal sightings showed some similarity in early spring, although the peak in strandings (March) occurs a month after the peak in coastal sightings (February) (Figure 3F). Both strandings and sightings were very low in May and June. However, while strandings were at their highest in July and August, the coastal sightings were very low. The monthly pattern of strandings of fresh and alive porpoises appears to show more similarity with the monthly pattern in coastal sighting rate, although patterns in the summer months still differ (Figure 3F).
When we inspect the porpoise strandings for all year and month combinations, some inter-annual changes become apparent, with the summer peak in porpoise strandings becoming more prominent in the last decade, compared to the peak in March which was more prominent in the 2000s.
The Ability to Predict Strandings Based on Coastal Sightings
Sightings in a specific month can be related to the number of stranded porpoises in any other month, and this reveals large differences in the strength of the correlation. Sightings in July, August and September correlated well with the number of strandings observed in most months (Figure 4), despite the relatively low absolute sighting rate in those summer months. For example, the number of stranded porpoises in January in year y correlate strongly with the porpoise sighting rate in July and August the preceding year (i.e., R2 was 0.82 and 0.79, respectively, with a slope coefficient p-value < 0.0001 for both months). In contrast, while February and March were characterized by the highest sighting rates, they correlated less well with the number of stranded porpoises in the same month (February R2 = 0.53, March R2 = 0.52). Sighting rates in February and March also correlated less well with strandings in other months. For example, the R2-value of August strandings as function of the sighting rate in March was only 0.36. Temporal variability in the sighting rates in June showed very little correlation with the patterns in the strandings (i.e., average R2-values of 0.27).
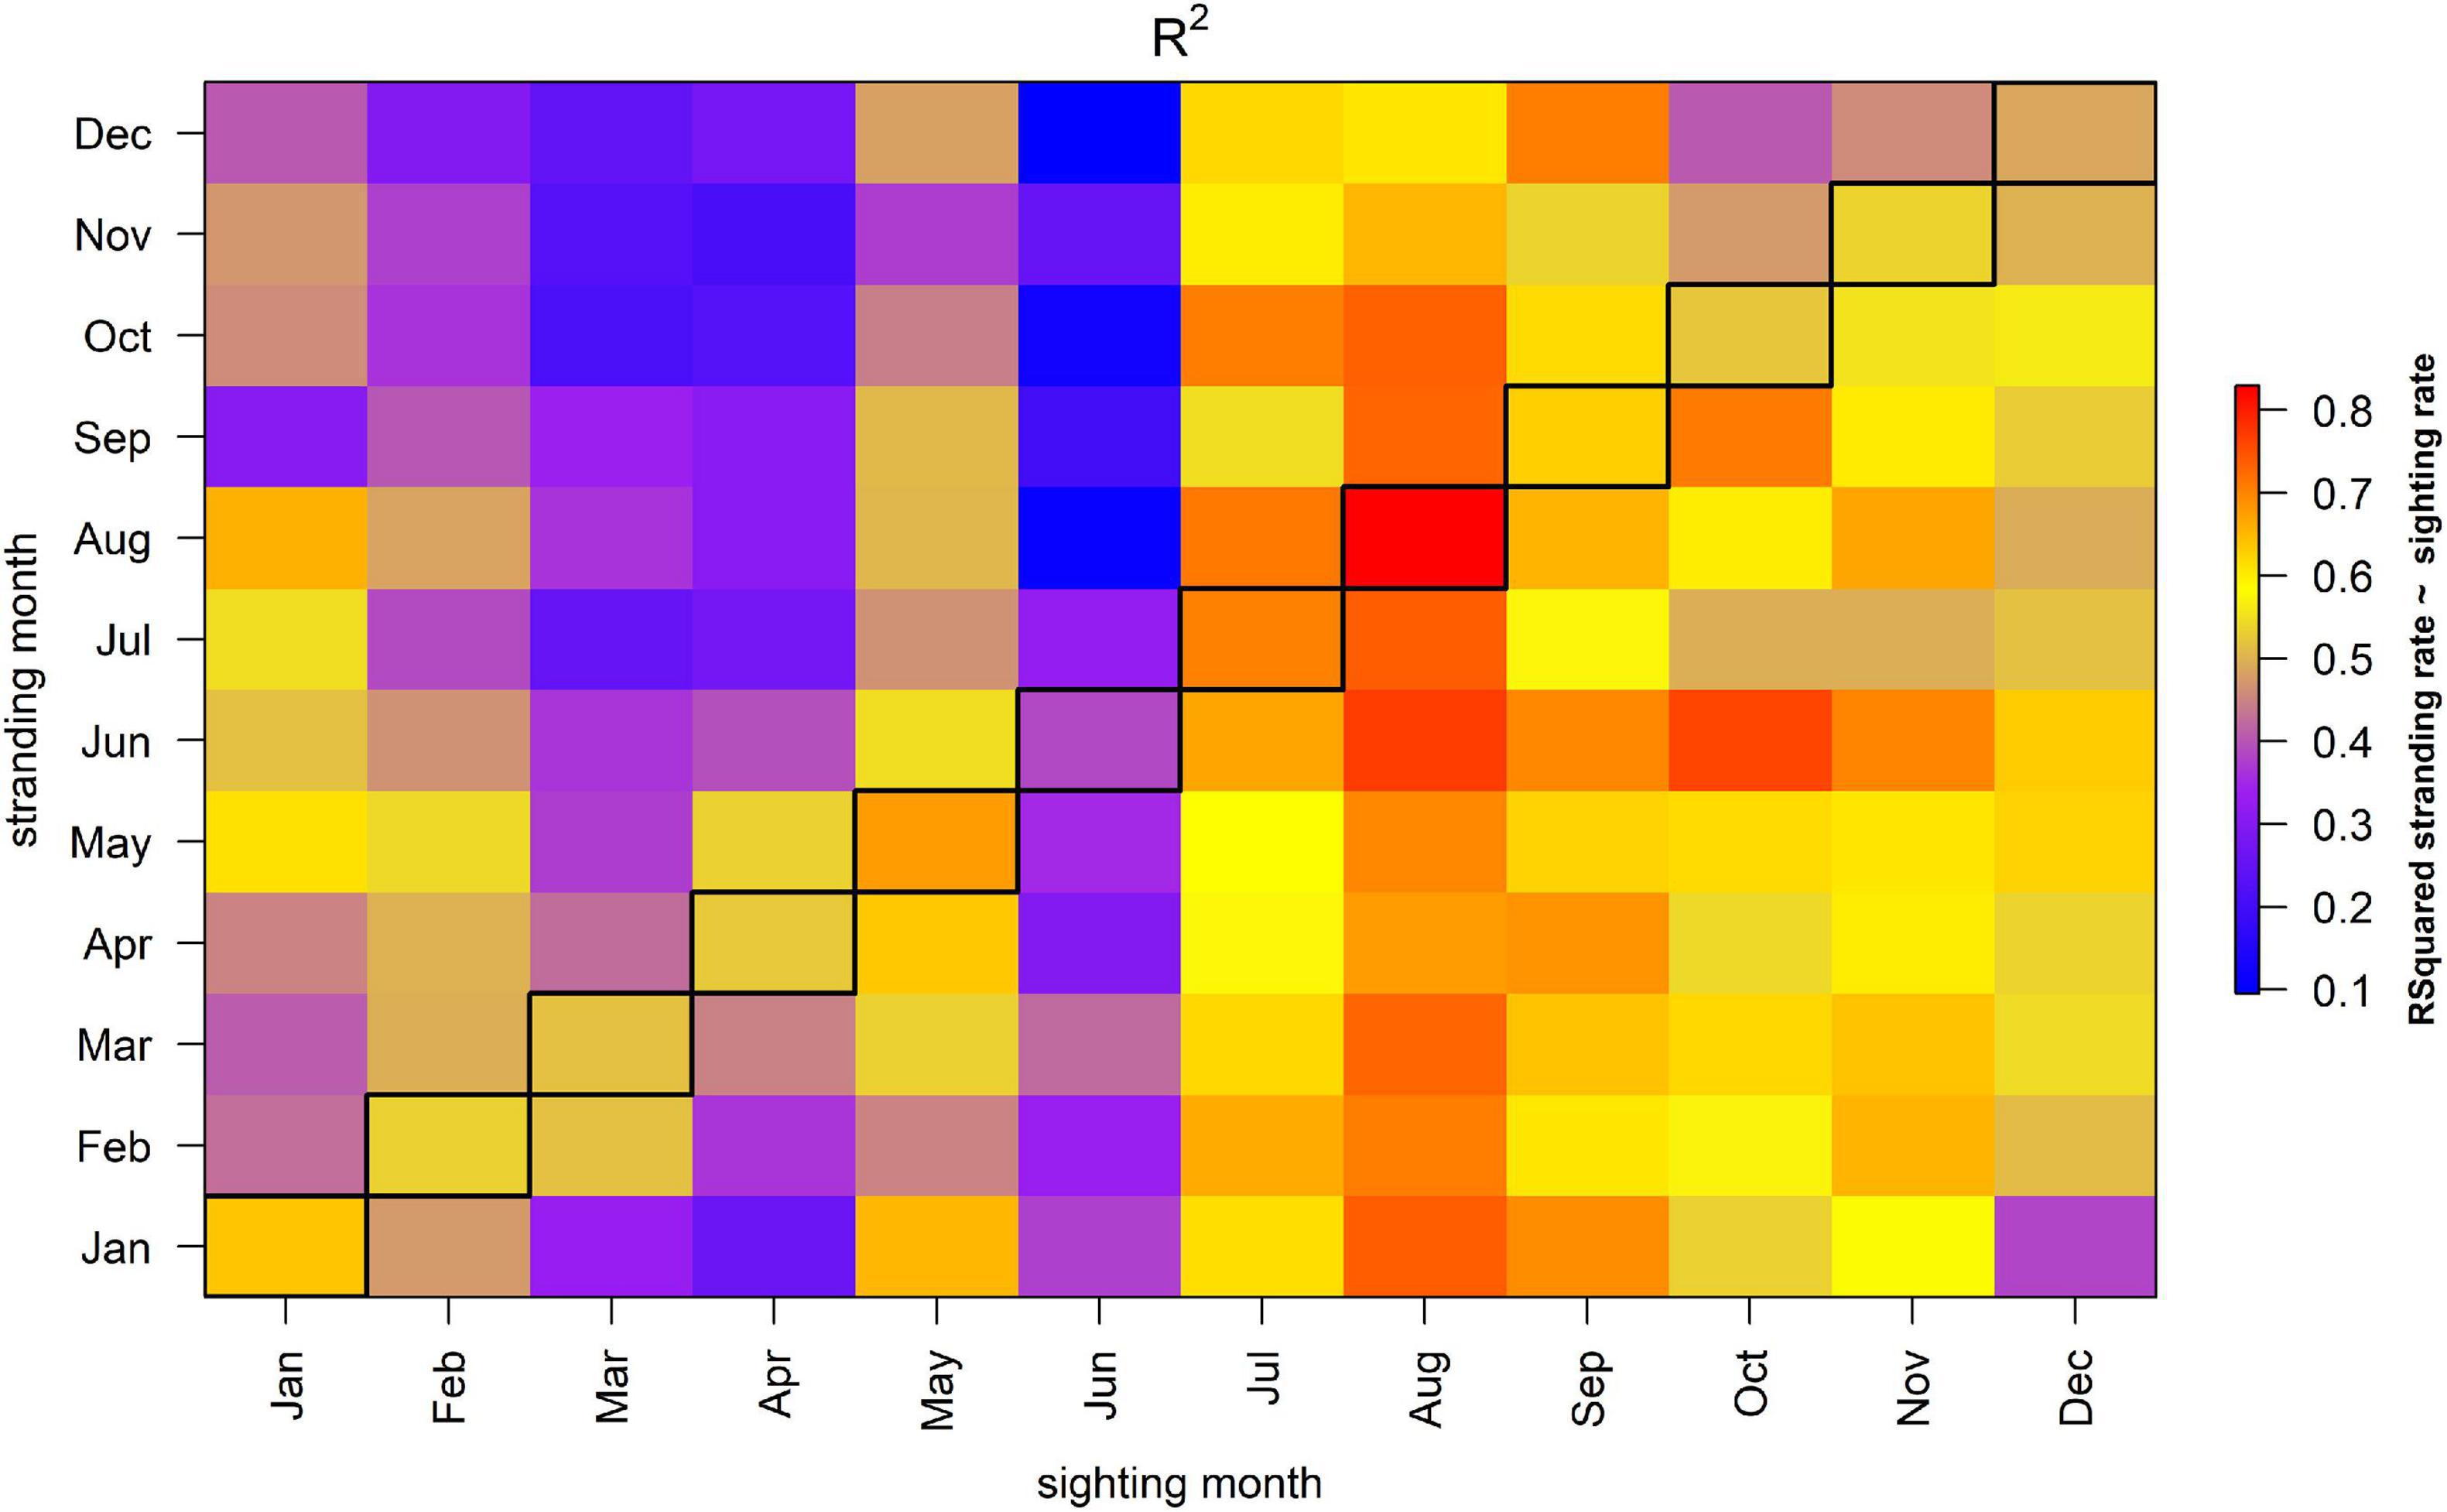
Figure 4. R2 of model where a stranding in each month is explained by the sighting rate in another month in the same year. The diagonal, bordered column represents coastal sighting rates from the same month and year as a stranding.
If there would be a strong correlation between the monthly stranding and sighting rate, the diagonal in Figure 4 would reveal overall high R2-values, which is not the case. This suggests that the sighting rate in a specific month is a poor predictor of the number of strandings in that month.
The observed correlation between sightings and strandings as shown in Figure 4 might be the consequence of confounding temporal processes. To test whether sighting rates significantly contribute to explaining the observed variation in porpoise strandings, a model with only an AR1 structure (Eq. 6) was compared to a model with an AR1 structure and also the inclusion of a dependency on the sighting rate of August in the corresponding year (Eq. 4). The latter resulted in a lower DIC (2074.8 versus 2163.8). A model without an AR1 structure but with the inclusion of a dependency on the August sighting rate resulted in a much lower DIC compared to a similar model with an AR1 structure (i.e., 2074.8 versus 2445.6, Table 1). The observed and predicted stranding rate of the best model with and without an AR1 correlation structure are shown in Supplementary Figure 5.
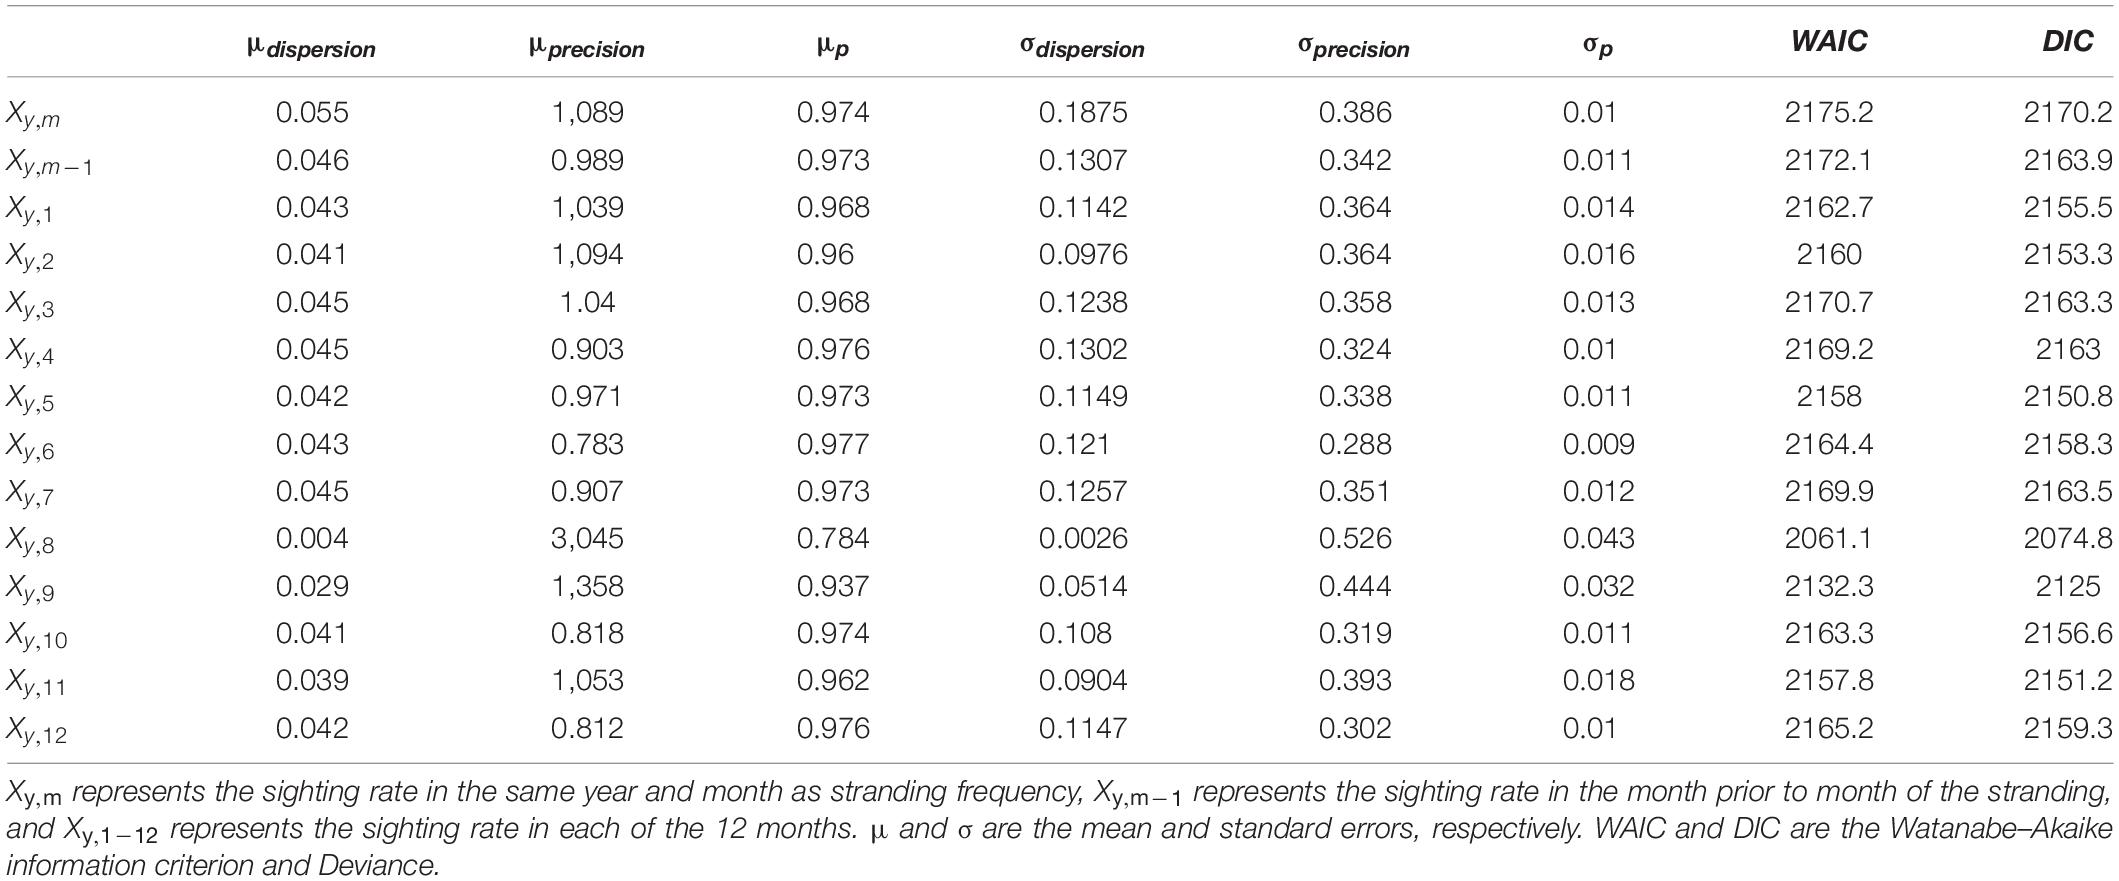
Table 1. Estimates and performance of models with different explanatory variables for the sighting rate.
When this comparison is repeated for the fresh and alive stranded porpoises, the inclusion of a dependency on sighting rate leads to a much better model fit, compared to a model with only an AR1 correlation structure (DIC 1524.6 versus 1582.2). A model without an AR1 structure but with the inclusion of a dependency on the sighting rate resulted in a much higher DIC compared to a similar model with the inclusion of an AR1 structure, i.e., 1674.627 and 1524.6 versus. In summary, coastal sightings can explain patterns in strandings, particularly for the fresh and alive stranded porpoises. A first order autoregressive correlation structure can absorb a large part of the temporal variability.
Residuals Observed and Predicted Strandings
The autoregressive correlation (AR1) term in the model captures the residual variability in the observed strandings that could not be explained by the variability in sighting rates in August. In the first 8 years (1990–1997) the variance of the estimated residuals in strandings was large which was partly due to very low and stochastic sighting rates in those years (Figure 5). Between 2002 and 2005, less porpoises stranded than expected based on the sightings. This, however, changed in more recent years, with the number of porpoise strandings exceeding the predicted number of strandings based on the coastal sightings (Figures 5, 6). Particularly the number of harbor porpoise strandings in summer 2011 was excessively high.
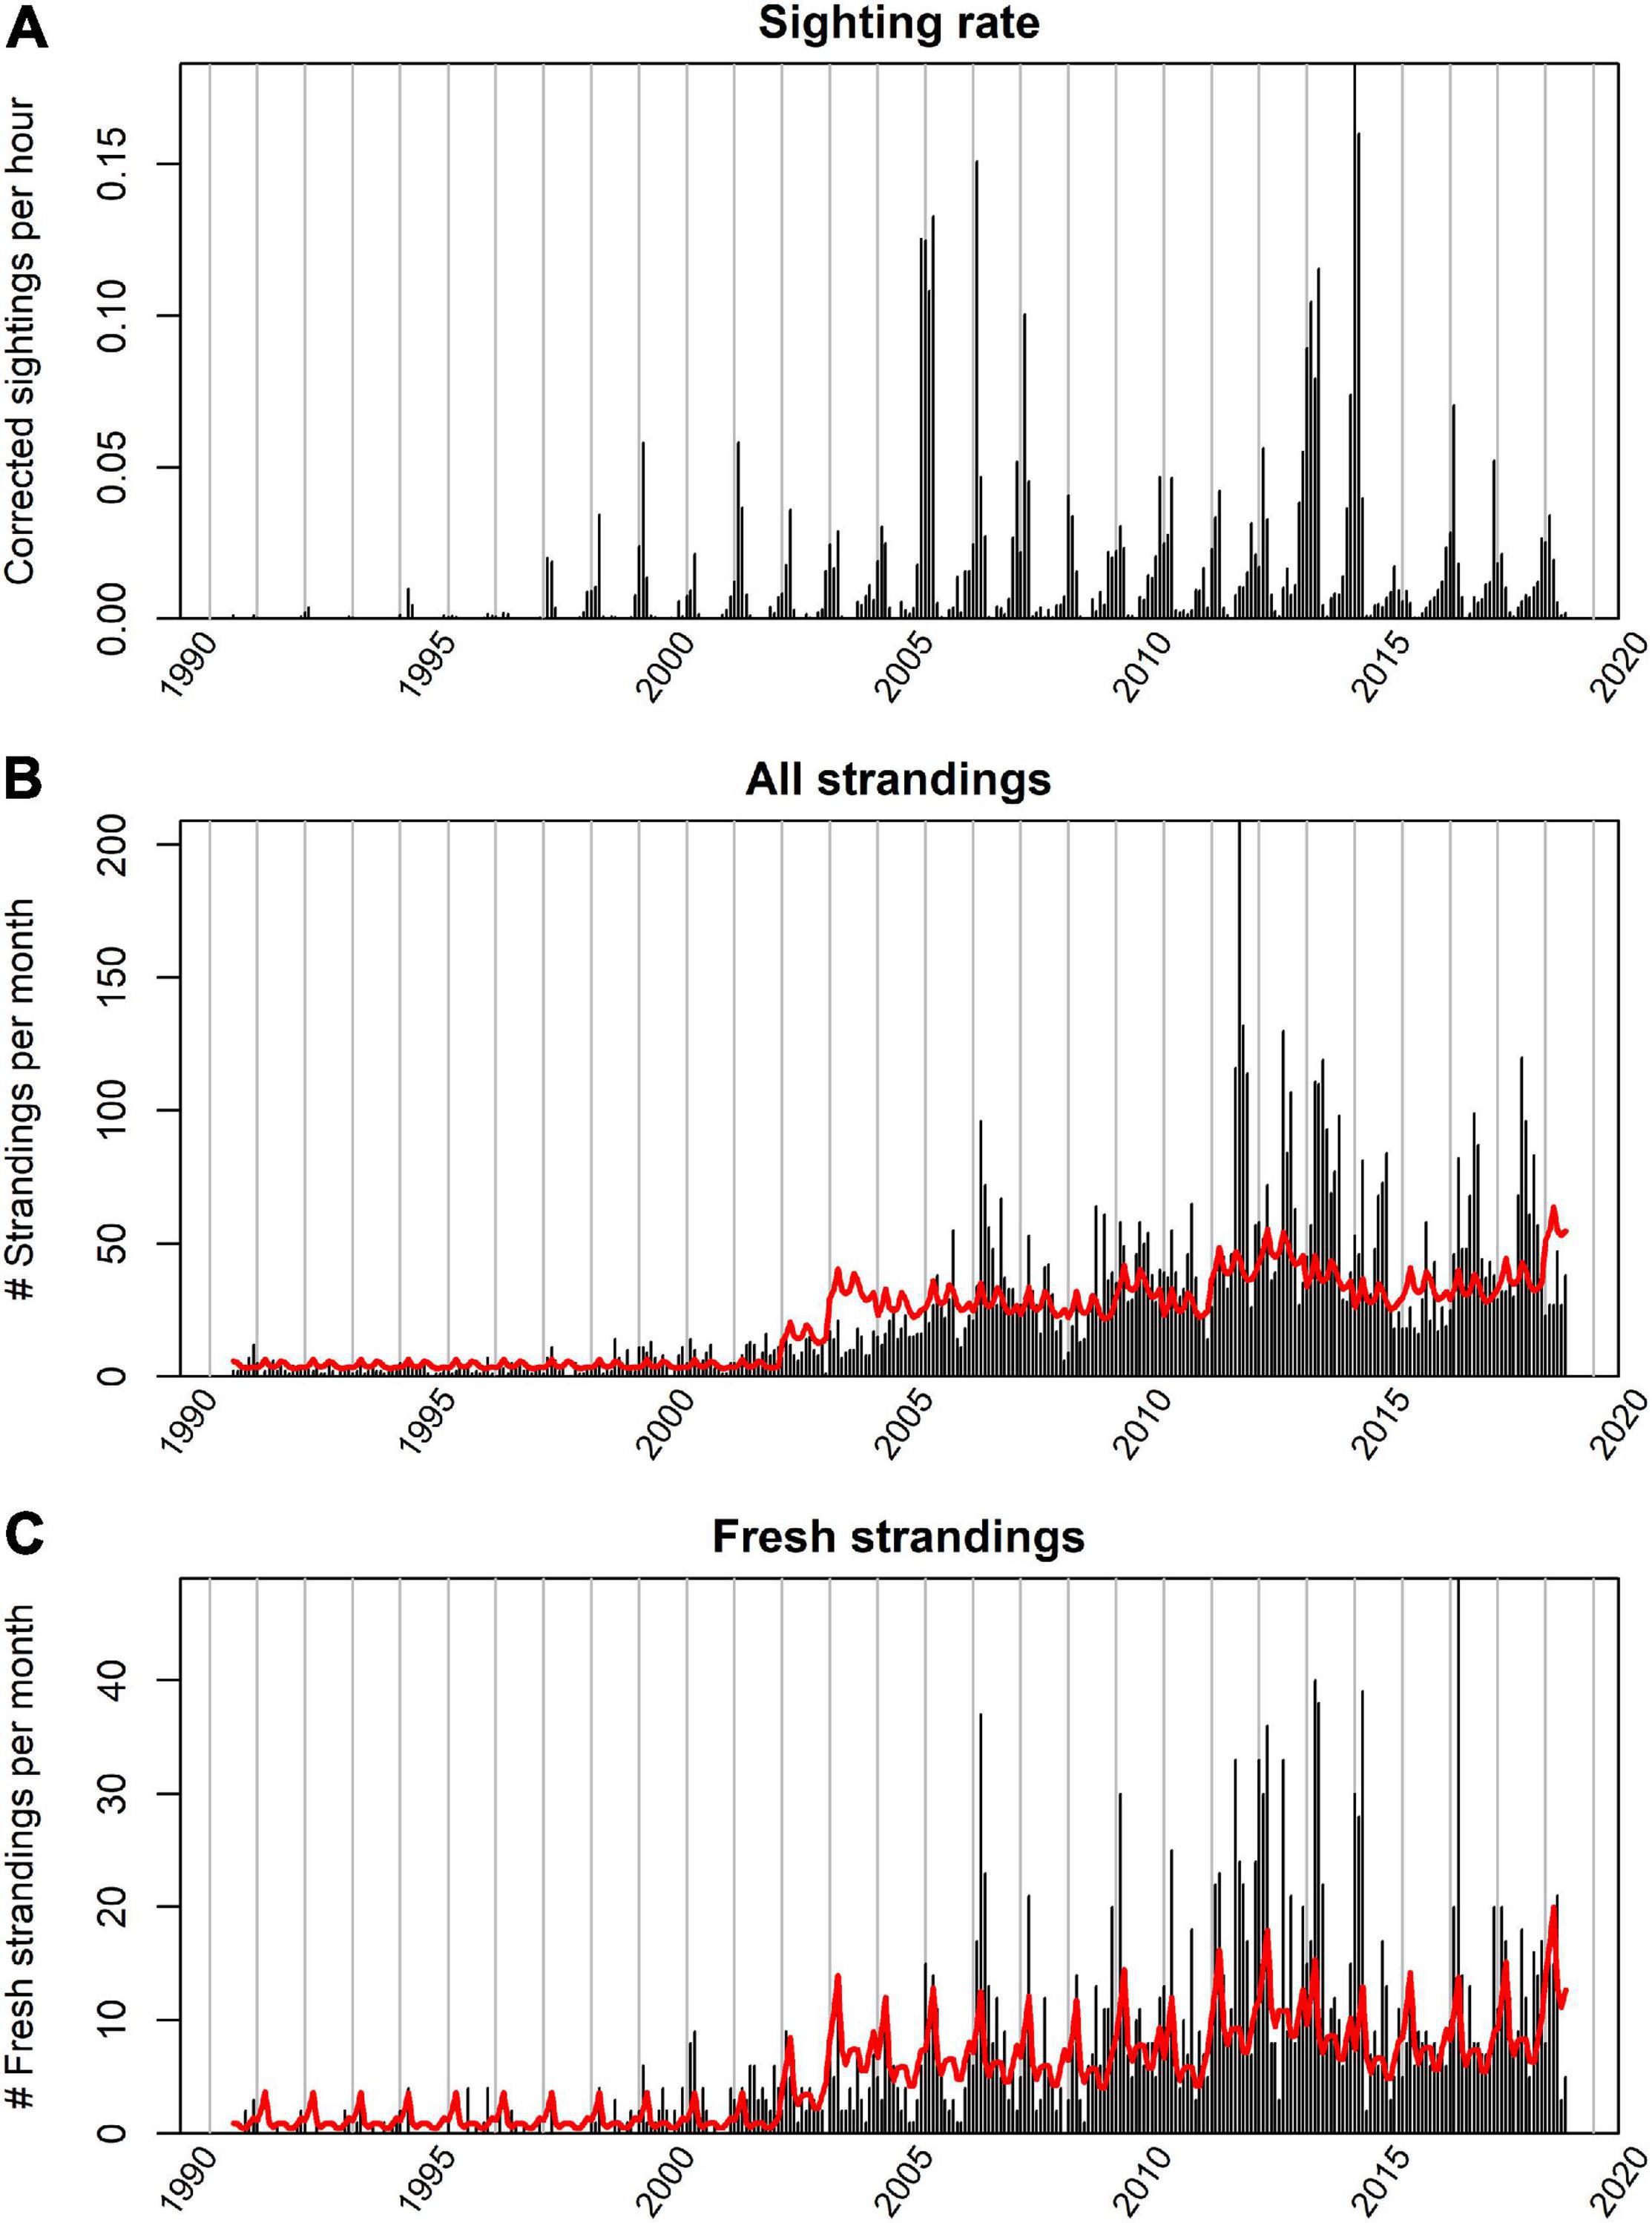
Figure 5. Temporal pattern in the observed and predicted strandings. The top figure (A) shows the temporal pattern in sightings used to predict the stranding rate. The middle figure (B) represents the observed (vertical bars) and expected number of all stranded porpoises based on a model relying solely on the sighting rate in August (red line). The bottom figure (C) represents the observed (vertical bars) and expected number of fresh and alive stranded porpoises.
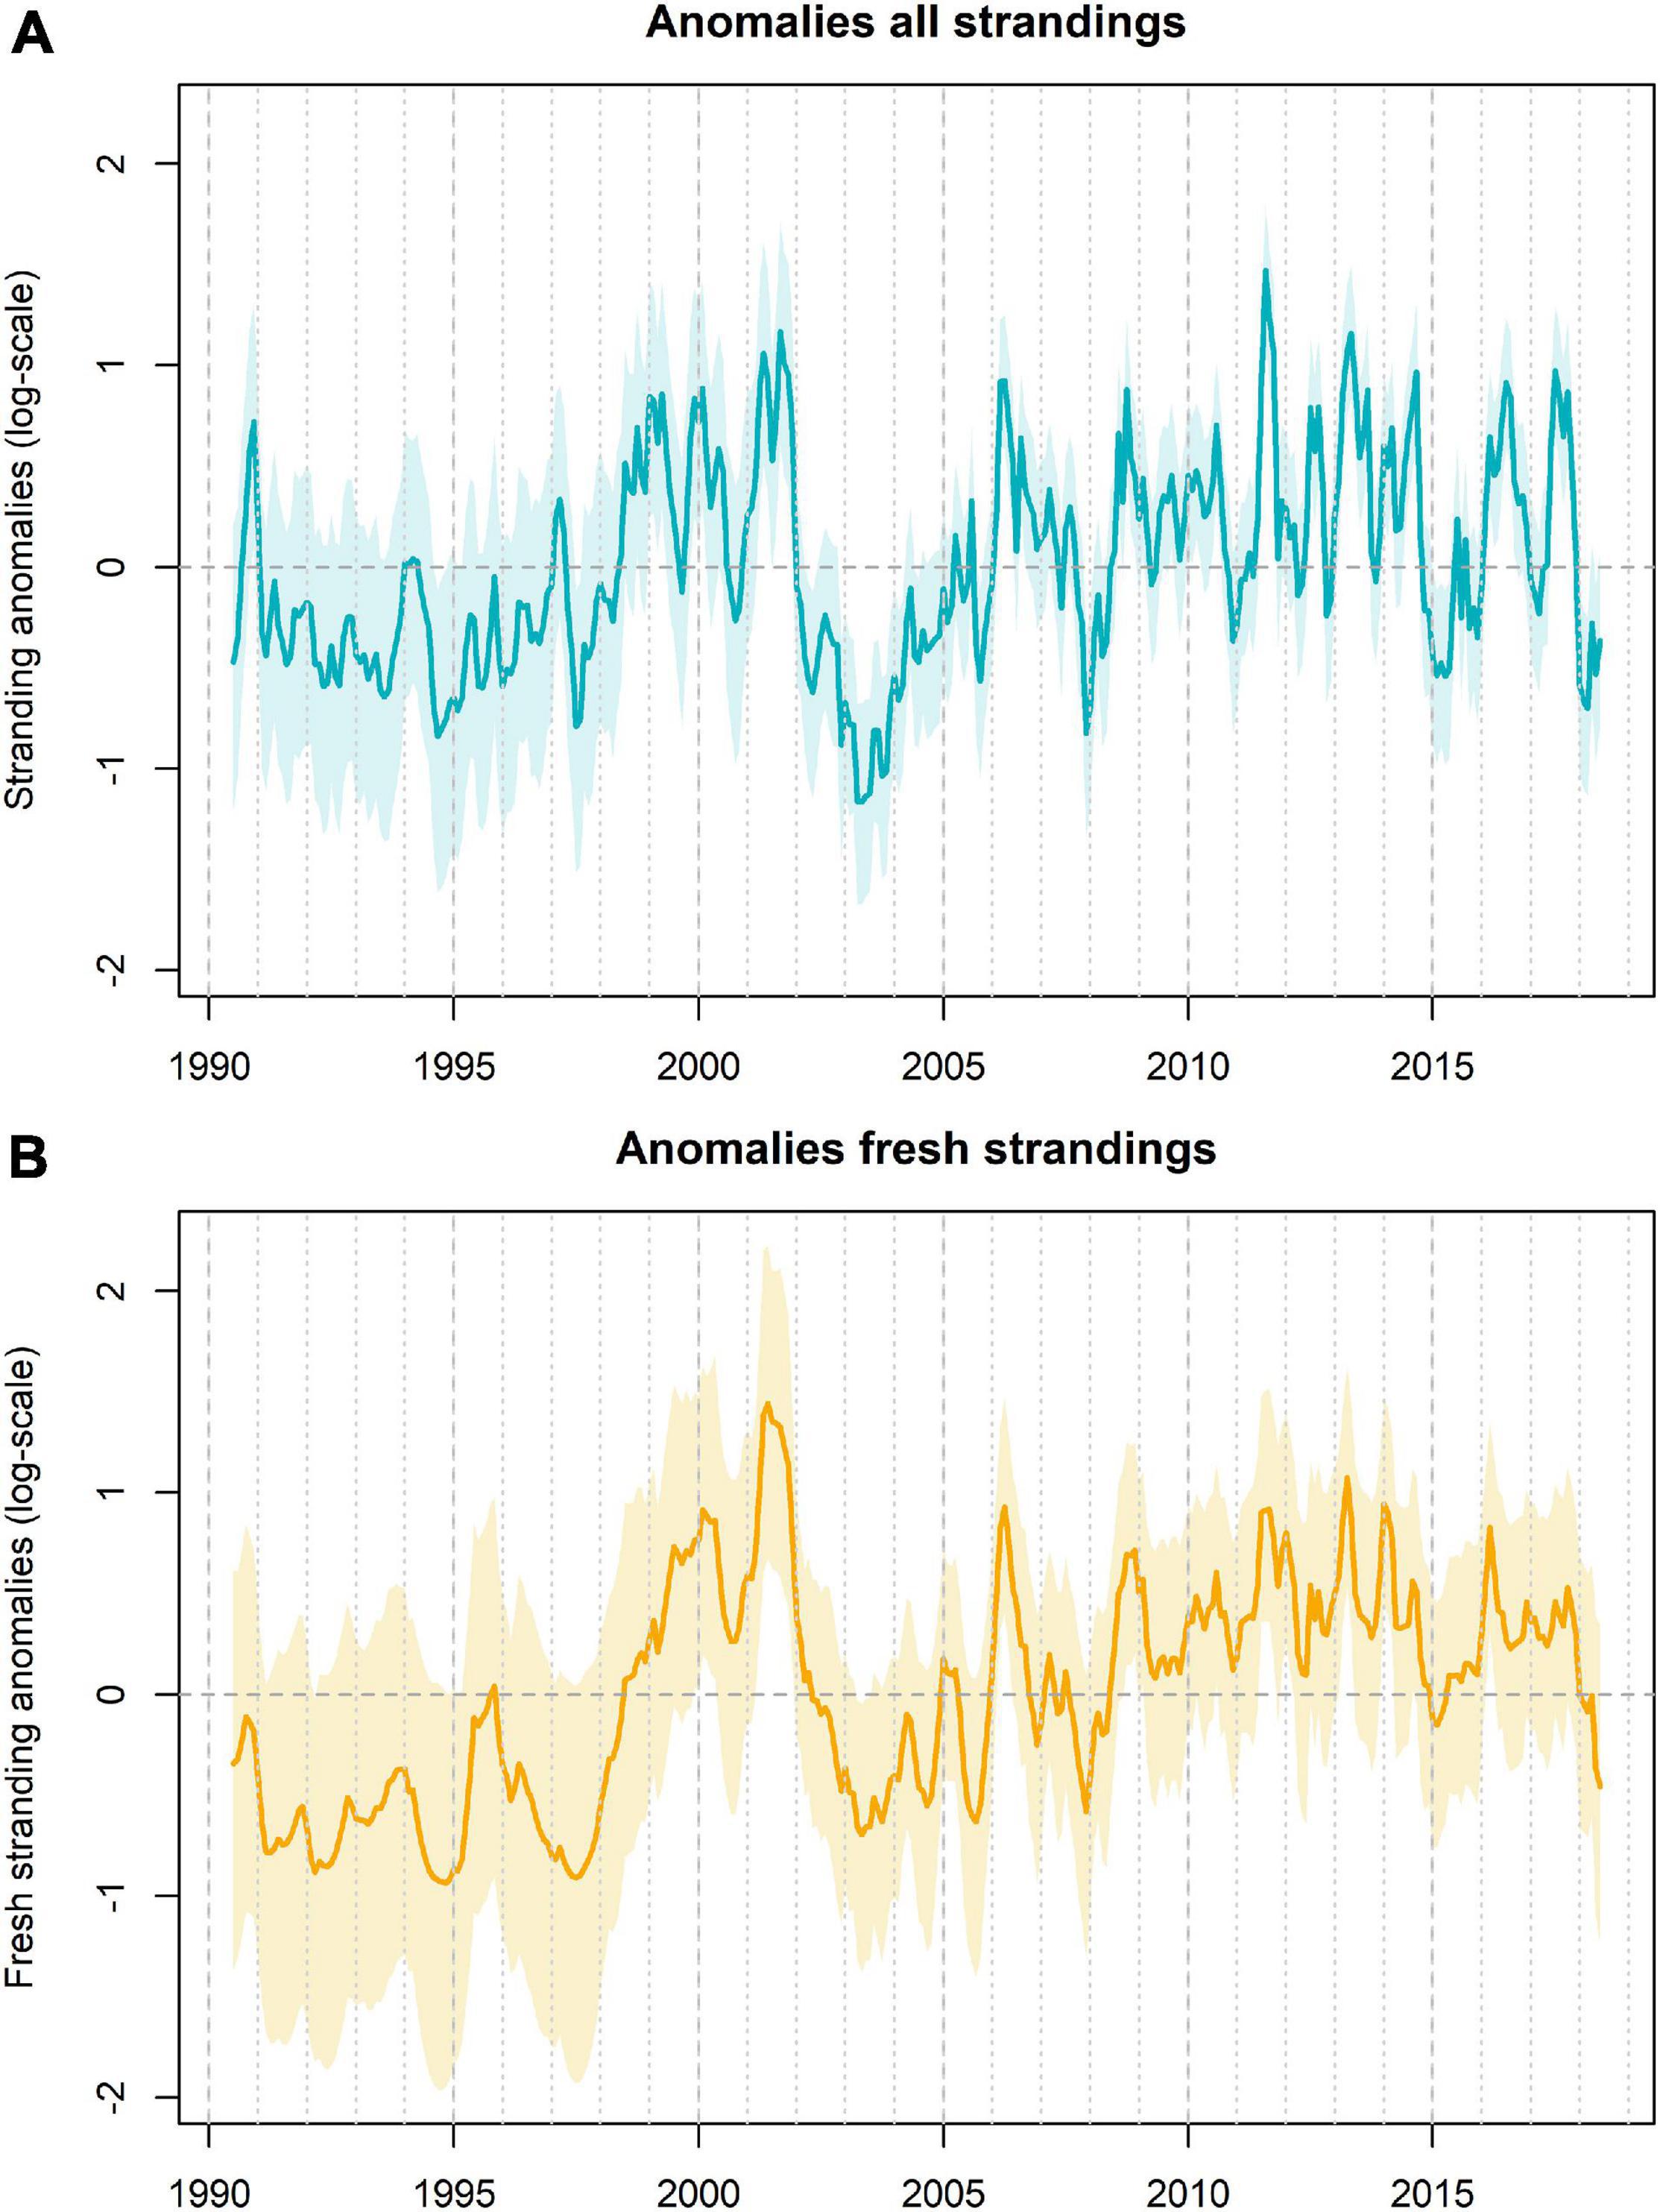
Figure 6. Residual pattern between the observed and expected porpoise strandings (based on the sightings) as captured by the temporal correlation structure (A). Values are on log-scale. Peak values (above the mean of 0) imply more porpoise strandings than expected and low values (below the mean of 0) imply less strandings than expected. A fairly similar pattern was observed for the fresh and alive strandings, although this showed a closer resemblance between the observed and expected strandings (B).
Discussion
Coastal sightings of harbor porpoises strongly correlated with stranding rates throughout the study period (1990–2018). Hence, an increase in local abundance largely explains the increase in strandings of harbor porpoises on the Dutch coast. There was, however, a strong seasonal mismatch between stranding and sighting rates. While most porpoises were sighted in February, porpoises stranded more frequently in summer (July and August). Interestingly, despite low absolute sighting rates in late summer, sighting rates in August were the best predictor for the observed monthly variability in the number of stranded porpoises, even for other seasons like late winter and early spring. In addition, the number of porpoises classified as fresh and live stranded were more related to the seasonal and annual variability in coastal sightings. Finally, the number of stranded porpoises exceeded the number expected based on the sightings in the last decade (except for 2013 and 2014), perhaps revealing temporal elevated mortality levels in recent years.
Variability in Strandings and Sightings in Relation to Phenology
The rapid growth in the porpoise sighting and stranding rate in the southern North Sea has been reported extensively (Camphuysen, 2004; Hammond et al., 2013; Gilles et al., 2016; IJsseldijk et al., 2020; Nachtsheim et al., 2021). It has been suggested that this increase is linked to North Sea wide changes in prey distribution and abundance, although currently solid evidence is lacking (Camphuysen, 2004; Hammond et al., 2013). Another hypothesis is that porpoises disappeared after the second World War for reasons unrelated to food (e.g., detonations of explosives, von Benda-Beckmann et al., 2015; Aarts et al., 2016), and that the southern region experienced a delayed return in the last decades. The steady increase in porpoise sightings and strandings since the early 1990s continued up to 2006, but since that year the numbers showed considerable inter-annual variations. This pattern resembles that of other populations reaching carrying capacity, whereby the trajectory is initially unconstrained by resource availability, while variations in resource availability are subsequently reflected in predator abundance (e.g., Brown et al., 2005).
Porpoise sighting and stranding rates showed large seasonal variability. Sightings usually peaked in late winter (i.e., February and March), a period characterized by the lowest water temperatures. Although low temperatures may facilitate capture of (cold-blooded and slower moving) prey (Grady et al., 2019), it also results in large thermo-regulatory costs for marine mammals. We therefore hypothesize that a large proportion of porpoises sighted in February and March are winter visitors that remain in the southern North Sea only temporarily. This is supported by aerial surveys that reveal much higher population size estimates for the Dutch North Sea in March compared to summer (Geelhoed et al., 2013; Aarts et al., 2016; Gilles et al., 2016). From April onward, the coastal sighting rates decrease rapidly. Few animals are seen from coastal vantage points in May–July, a timing which corresponds with the calving period (Sørensen and Kinze, 1994; Addink et al., 1995; Lockyer, 2003). Apparently, porpoises move away from the nearshore regions out of sight from the Seabird watchers, who detect porpoises predominantly within 2 km from shore. These porpoises possibly move to nearby offshore waters (e.g., Geelhoed and Scheidat, 2018) or elsewhere (e.g., toward German and Danish waters) to give birth and nurse (Gilles et al., 2009; IJsseldijk et al., 2020; Nachtsheim et al., 2021). Porpoise coastal sighting rates slowly increases from August and into autumn. The increase in coastal sighting rate in late summer might be due to an increase in prey availability or accessibility in the coastal zone, however, porpoises may also actively move toward warmer waters to facilitate skin maintenance, as observed for several other cetacean species (Frost et al., 1993; Pitman et al., 2020). Porpoises in captivity also show rapid skin turn-over when exposed to sudden changes in temperature and salinity (Personal Communication, Ron Kastelein). Despite the relative low coastal sighting rates in August, the nearshore abundance in this month turns out to be the best predictor for the overall observed variation in porpoises found ashore.
Another explanation for the seasonal variation in stranding frequency may be varying coastal anthropogenic activities in time. For example, in the North Sea, accidental bycatch in gillnet fisheries is considered to be a major threat to harbor porpoises (Leeney et al., 2008; Dolman et al., 2016; IJsseldijk et al., 2018c; Evans, 2019). Also gillnet fishery in the coastal waters of the southern North Sea has increased from the early 90’s onward, at least up to 2007 (Couperus et al., 2009). However, studies investigating porpoise stranding rate as a function of fishery intensity are still lacking for the southern North Sea.
Residual Porpoise Strandings Unrelated to Coastal Sightings
When correcting the strandings rate for the coastal sightings rate, the temporal patterns showed that in the early 1990s, when porpoise sightings were still rare (Camphuysen, 2004, 2011), and after 2010, the number of stranded porpoises in most years exceeded the expected number of porpoise strandings based on coastal sightings. Especially in the summer of 2011, numbers of porpoises found ashore were excessively high. The elevated mortality most likely reflects a period of unusual mortality. The declaration of an unusual mortality event (UME) for a common species in an area is often challenging and requires understanding of the “normal” stranding patterns, for which the quantification of the multiple components that are involved in the stranding process are needed (Hart et al., 2006; Williams et al., 2011; Ten Doeschate et al., 2018). These include physical processes, like drift and carcass buoyancy, social processes, like changes in reporting effort, and biological processes, like changes in distribution or increases in mortality (Peltier et al., 2012, 2013; Ten Doeschate et al., 2018; IJsseldijk et al., 2020). It should, however, be noted that any changes in distribution relative to the coast could not fully be corrected for, since we focused on observations in the coastal zone (<2 km from the land-based vantage points). Harbor porpoise distribution and occurrence within the coastal zone is likely only a small fraction of the sea area from which strandings may derive. This is therefore not fully representative of the general habitat of the species in the North Sea. Besides, we differentiated alive and fresh strandings from those reported to be more putrefied, but seasonal changes in water and air temperature may influence carcass appearance. Therefore, there may be unknown seasonal, temporal or other patterns which could have confounding effects on our conclusions.
Implications for Conservation and Management
Increases in mortality, including UMEs, are of interest for ecologists as well as in the context of conservation management (Ten Doeschate et al., 2018). Marine mammal mortality events can result from anthropogenic activities (Fernández et al., 2005; Schwacke et al., 2014; Sharp et al., 2019), disease outbreaks (Rubio-Guerri et al., 2013; Kemper et al., 2016), or nutritional deficiency (Trites and Donnelly, 2003; Christiansen et al., 2021). Obviously, there may be combinations of factors involved, and pinpointing one cause is not always possible (Mazzariol et al., 2011; IJsseldijk et al., 2018d). In The Netherlands, post-mortem examinations on stranded marine mammals have been conducted since 2006 (IJsseldijk et al., 2018b). Databases hold information on causes of death, their physical condition, disease burden and nutritional condition. Additionally, data and tissue archives are in place, which facilitate studies into life history, diet and contaminant levels. The assessment of a combination of these data together with time-area information of anthropogenic activities can be analyzed to determine trends.
To minimize negative impacts on wildlife populations when licensing proposed anthropogenic activities, managers need to consider the potential impact of such activities. While North Sea wide assessments of abundance are essential for the identification of population size and structure (Hammond et al., 2002; Evans and Hammond, 2004), they cannot reveal the scale or cause of mortality in a species. The current monitoring frequency (i.e., every 10 years for SCANS (Hammond et al., 2002, 2013, 2017) and 1–2 times a year nationally (Geelhoed and Scheidat, 2018) is probably insufficient to accurately capture temporal or seasonal changes in abundance. When the statistical credibility of the marine mammal stranding records is improved, such as by investigating the discrepancies between stranding rates and measures of local abundance, these records could serve a valuable source of information in a monitoring perspective and a cost-effective method to assess fine-scale population changes.
Data Availability Statement
Publicly available datasets were analyzed in this study. This data can be found here: www.walvisstrandingen.nl and www.trektellen.org.
Author Contributions
LI: conceptualization, methodology, data curation, writing-original draft preparation, and funding acquisition. KC: conceptualization, investigation, and writing-reviewing and editing. GK and GT: investigation and writing-reviewing and editing. GA: conceptualization, methodology, formal analysis, visualization, and writing-original draft preparation. All authors contributed to the article and approved the submitted version.
Funding
These analyses were funded by Rijkswaterstaat – Wind op Zee Ecologisch Programma, under project reference number 31153649.
Conflict of Interest
The authors declare that the research was conducted in the absence of any commercial or financial relationships that could be construed as a potential conflict of interest.
The reviewer AG declared a past co-authorship with several of the authors, LI, GK, and GA, to the handling editor.
Acknowledgments
The data on coastal sightings as well as strandings only exists thanks to the dedicated effort of all Dutch seabird-watchers and the Dutch volunteers and organizations of the stranding network. It was through the thousands of hours of reporting alive and deceased animals by these volunteers that the databases with which we could work were generated. We are also thankful for the contributions from Steve Geelhoed, Jeroen Hoekendijk, Martin Poot, and Leo Soldaat into the study design and discussion of the results. Finally, we thank Aylin Erkman and Inger van den Bosch for their help in requiring the funding and for their constructive feedback on earlier versions of this document.
Supplementary Material
The Supplementary Material for this article can be found online at: https://www.frontiersin.org/articles/10.3389/fmars.2021.668038/full#supplementary-material
Supplementary Figure 1 | Sighting effort in hours per year.
Supplementary Figure 2 | The observed sighting rate (not corrected for observation conditions) versus the model-based predicted sighting rate for each year-month combination.
Supplementary Figure 3 | Annual variation in sighting rate. Note that for plotting purposes, the model-based estimates were corrected to ensure that the mean model-based estimated sighting rate was equal to the observed sighting rate.
Supplementary Figure 4 | Monthly variation in sighting rate (number/hour).
Supplementary Figure 5 | The observed and predicted stranding rate of the best model with and without an AR1 correlation structure.
Supplementary Data 1 | Output of model fitted to the coastal sightings of porpoises to correct for the effect of weather related environmental conditions.
Footnotes
References
Aarts, G., Von Benda-Beckmann, A. M., Lucke, K., Sertlek, H. Ö, Van Bemmelen, R., Geelhoed, S. C. V., et al. (2016). Harbour porpoise movement strategy affects cumulative number of animals acoustically exposed to underwater explosions. Mar. Ecol. Prog. Ser. 557, 261–275. doi: 10.3354/meps11829
Addink, M., Sørensen, T. B., and García-Hartmann, M. (1995). Aspects of reproduction and seasonality in the harbour porpoise. Dev. Mar. Biol. 4, 459–464. doi: 10.1016/s0163-6995(06)80046-6
Betty, E. L., Bollard, B., Murphy, S., Ogle, M., Hendriks, H., Orams, M. B., et al. (2020). Using emerging hot spot analysis of stranding records to inform conservation management of a data-poor cetacean species. Biodivers. Conserv. 29, 1–23.
Bossart, G. D. (2011). Marine mammals as sentinel species for oceans and human health. Vet. Pathol. 48, 676–690. doi: 10.1177/0300985810388525
Brown, R. F., Wright, B. E., Riemer, S. D., and Laake, J. (2005). Trends in abundance and current status of harbor seals in Oregon: 1977–2003. Mar. Mamm. Sci. 21, 657–670. doi: 10.1111/j.1748-7692.2005.tb01258.x
Bubb, P., Jenkins, M., and Kapos, V. (2005). Biodiversity Indicators for National Use. Cambridge: UNEP World Conservation Monitoring Centre.
Camphuysen, C. J. (1985). “Zeetrektellingen,” in Page Vogelinventarisatie, eds M. F. H. Hustings, R. G. M. Kwak, P. F. M. Opdam, and M. J. S. M. Reijnen (Wageningen: Pudoc).
Camphuysen, C. J. (2004). The return of the harbour porpoise (Phocoena phocoena) in Dutch coastal waters. Lutra 47, 113–122.
Camphuysen, C. J. (2011). Recent trends and spatial patterns in nearshore sightings of harbour porpoises (Phocoena phocoena) in the Netherlands (Southern Bight, North Sea). Lutra 54, 39–47.
Camphuysen, C. J., and Siemensma, M. L. (2011). Conservation Plan for the Harbour Porpoise Phocoena phocoena in the Netherlands: Towards a favourable conservation status. Texel: NIOZ.
Camphuysen, C. J., Smeenk, C., Addink, M., van Grouw, H., and Jansen, O. E. (2008). Cetaceans stranded in the Netherlands from 1998 to 2007. Lutra 51, 87–122.
Camphuysen, C. J., and van Dijk, J. (1983). Zee- en kustvogels langs de Nederlandse kust. Limosa 56, 81–230.
Christiansen, F., Rodríguez-González, F., Martínez-Aguilar, S., Urbán, J., Swartz, S., Warick, H., et al. (2021). Poor body condition associated with an unusual mortality event in gray whales. Mar. Ecol. Prog. Ser. 658, 237–252. doi: 10.3354/meps13585
Couperus, A. S., Aarts, G., van Giels, J., de Haan, D., and van Keeken, O. (2009). Onderzoek naar Bijvangst Bruinvissen in de Nederlandse Visserij. IJmuiden: IMARES.
Dolman, S., Baulch, S., Evans, P. G. H., Read, F., and Ritter, F. (2016). Towards an EU action plan on cetacean bycatch. Mar. Policy 72, 67–75. doi: 10.1016/j.marpol.2016.06.020
Evans, P. G. H. (2019). European Whales, Dolphins, and Porpoises. Marine Mammal Conservation in Practice. Cambridge, MA: Academic Press.
Evans, P. G. H., and Hammond, P. S. (2004). Monitoring cetaceans in European waters. Mamm. Rev. 34, 131–156. doi: 10.1046/j.0305-1838.2003.00027.x
Fernández, A., Edwards, J. F., Rodríguez, F., Espinosa De Los Monteros, A., Herráez, P., Castro, P., et al. (2005). Gas and fat embolic syndrome” involving a mass stranding of beaked whales (Family Ziphiidae) exposed to anthropogenic sonar signals. Vet. Pathol. 42, 446–457. doi: 10.1354/vp.42-4-446
Fijn, R., Leopold, M. F., Dirksen, S., Arts, F., van Asch, M., Baptist, M., et al. (2017). Een onverwachte concentratie van Zwarte Zee-eenden in de Hollandse kustzone in een gebied met hoge dichtheden van geschikte schelpen. Limosa 90, 97–117.
Frost, K. J., Lowry, L. F., and Carroll, G. (1993). Beluga whale and spotted seal use of a coastal lagoon system in the northeastern Chukchi Sea. Arctic 46, 8–16.
Geelhoed, S. C., and Scheidat, M. (2018). Abundance of harbour porpoises (Phocoena phocoena) on the Dutch Continental Shelf, aerial surveys 2012-2017. Lutra 61, 127–136.
Geelhoed, S. C. V., Scheidat, M., van Bemmelen, R. S. A., and Aarts, G. (2013). Abundance of harbour porpoises (Phocoena phocoena) on the Dutch Continental Shelf, aerial surveys in July 2010-March 2011. Lutra 56, 45–57.
Gilles, A., Scheidat, M., and Siebert, U. (2009). Seasonal distribution of harbour porpoises and possible interference of offshore wind farms in the German North Sea. Mar. Ecol. Prog. Ser. 383, 295–307. doi: 10.3354/meps08020
Gilles, A., Viquerat, S., Becker, E. A., Forney, K. A., Geelhoed, S. C. V., Haelters, J., et al. (2016). Seasonal habitat-based density models for a marine top predator, the harbor porpoise, in a dynamic environment. Ecosphere 7:e01367.
Grady, J. M., Maitner, B. S., Winter, A. S., Kaschner, K., Tittensor, D. P., Record, S., et al. (2019). Biodiversity patterns: metabolic asymmetry and the global diversity of marine predators. Science 363:6425.
Haelters, J., Kerckhof, F., and Jauniaux, T. (2018). Strandings of cetaceans in Belgium from 1995 to 2017. Lutra 61, 107–126.
Halpern, B. S., Frazier, M., Potapenko, J., Casey, K. S., Koenig, K., Longo, C., et al. (2015). Spatial and temporal changes in cumulative human impacts on the world’s ocean. Nat. Commun. 6:7615.
Halpern, B. S., Walbridge, S., Selkoe, K. A., Kappel, C. V., Micheli, F., D’Agrosa, C., et al. (2008). A global map of human impact on marine ecosystems. Science 319, 948–952.
Hammond, P. S., Berggren, P., Benke, H., Borchers, D. L., Collet, A., Heide-Jørgensen, M. P., et al. (2002). Abundance of harbour porpoise and other cetaceans in the North Sea and adjacent waters. J. Appl. Ecol. 39, 361–376. doi: 10.1046/j.1365-2664.2002.00713.x
Hammond, P. S., Lacey, C., Gilles, A., Viquerat, S., Börjesson, P., Herr, H., et al. (2017). Estimates of Cetacean Abundance in European Atlantic Waters in Summer 2016 From the SCANS-III Aerial and Shipboard Surveys. St Andrews: University of St Andrews.
Hammond, P. S., Macleod, K., Berggren, P., Borchers, D. L., Burt, L., Cañadas, A., et al. (2013). Cetacean abundance and distribution in European Atlantic shelf waters to inform conservation and management. Biol. Conserv. 164, 107–122. doi: 10.1016/j.biocon.2013.04.010
Hart, K. M., Mooreside, P., and Crowder, L. B. (2006). Interpreting the spatio-temporal patterns of sea turtle strandings: going with the flow. Biol. Conserv. 129, 283–290. doi: 10.1016/j.biocon.2005.10.047
Hornman, M., Schekkerman, H., Troost, G., and Soldaat, L. (2020). Zeetrektellingen ingezet voor trendberekeningen van zeevogels. Sovon Nieuws Jaargang 33, 8–9.
IJsseldijk, L. L., Brownlow, A., Davison, N. J., Deaville, R., Haelters, J., Keijl, G., et al. (2018a). Spatiotemporal trends in white-beaked dolphin strandings along the North Sea coast from 1991-2017. Lutra 61, 153–163.
IJsseldijk, L. L., Kik, M. J., and Gröne, A. (2018b). Postmortaal Onderzoek van Bruinvissen (Phocoena phocoena) uit Nederlandse Wateren, 2017: Biologische Gegevens, Gezondheidsstatus en Doodsoorzaken. Wageningen: Wettelijke Onderzoekstaken Natuur & Milieu.
IJsseldijk, L. L., ten Doeschate, M. T. I., Brownlow, A. C., Davison, N. J., Deaville, R., Galatius, A., et al. (2020). Spatiotemporal mortality and demographic trends in a small cetacean: strandings to inform conservation management. Biol. Conserv. 249:108733. doi: 10.1016/j.biocon.2020.108733
IJsseldijk, L. L., ten Doeschate, M. T. I., Davison, N. J., Gröne, A., and Brownlow, A. C. (2018c). Crossing boundaries for cetacean conservation: setting research priorities to guide management of harbour porpoises. Mar. Policy 95, 77–84. doi: 10.1016/j.marpol.2018.07.006
IJsseldijk, L. L., Van Neer, A., Deaville, R., Begeman, L., van de Bildt, M., van den Brand, J. M. A., et al. (2018d). Beached bachelors: an extensive study on the largest recorded sperm whale Physeter macrocephalus mortality event in the North Sea. PLoS One 13:e0201221. doi: 10.1371/journal.pone.0201221
Jepson, P. D., Deaville, R., Barber, J. L., Aguilar, À, Borrell, A., Murphy, S., et al. (2016). PCB pollution continues to impact populations of orcas and other dolphins in European waters. Sci. Rep. 6:18573.
Keijl, G. O., Begeman, L., Hiemstra, S., IJsseldijk, L. L., and Kamminga, P. (2016). Cetaceans stranded in the Netherlands in 2008-2014. Lutra 59, 75–107.
Kemper, C. M., Tomo, I., Bingham, J., Bastianello, S. S., Wang, J., Gibbs, S. E., et al. (2016). Morbillivirus-associated unusual mortality event in South Australian bottlenose dolphins is largest reported for the Southern Hemisphere. R. Soc. Open Sci. 3:160838. doi: 10.1098/rsos.160838
Kirkwood, J. K., Bennett, P. M., Jepson, P. D., Kuiken, T., Simpson, V. R., and Baker, J. R. (1997). Entanglement in fishing gear and other causes of death in cetaceans stranded on the coasts of England and Wales. Vet. Rec. 141, 94–98. doi: 10.1136/vr.141.4.94
Leeney, R. H., Amies, R., Broderick, A. C., Witt, M. J., Loveridge, J., Doyle, J., et al. (2008). Spatio-temporal analysis of cetacean strandings and bycatch in a UK fisheries hotspot. Biodivers. Conserv. 17, 2323–2338. doi: 10.1007/s10531-008-9377-5
Lockyer, C. (2003). Harbour porpoises (Phocoena phocoena) in the North Atlantic: biological parameters. NAMMCO Sci. Publ. 5:71. doi: 10.7557/3.2740
Madsen, P. T., Wahlberg, M., Tougaard, J., Lucke, K., and Tyack, P. (2006). Wind turbine underwater noise and marine mammals: Implications of current knowledge and data needs. Mar. Ecol. Prog. Ser. 309, 279–295. doi: 10.3354/meps309279
Mazzariol, S., Di Guardo, G., Petrella, A., Marsili, L., Fossi, C. M., Leonzio, C., et al. (2011). Sometimes sperm whales (Physeter macrocephalus) cannot find their way back to the high seas: a multidisciplinary study on a mass stranding. PLoS One 6:e19417. doi: 10.1371/journal.pone.0019417
Moore, S. E. (2008). Marine mammals as ecosystem sentinels. J. Mammal. 89, 534–540. doi: 10.1644/07-mamm-s-312r1.1
Nachtsheim, D. A., Viquerat, S., Ramírez-Martínez, N. C., Unger, B., Siebert, U., and Gilles, A. (2021). Small cetacean in a human high-use area: trends in harbor porpoise abundance in the North Sea over two decades. Front. Mar. Sci. 7:606609. doi: 10.3389/fmars.2020.606609
Peltier, H., Baagøe, H. J., Camphuysen, K. C. J., Czeck, R., Dabin, W., Daniel, P., et al. (2013). The stranding anomaly as population indicator: the case of harbour porpoise Phocoena phocoena in North-Western Europe. PLoS One 8:e62180. doi: 10.1371/journal.pone.0062180
Peltier, H., Dabin, W., Daniel, P., Van Canneyt, O., Dorémus, G., Huon, M., et al. (2012). The significance of stranding data as indicators of cetacean populations at sea: modelling the drift of cetacean carcasses. Ecol. Indic. 18, 278–290. doi: 10.1016/j.ecolind.2011.11.014
Pierce, G. J., Santos, M. B., Murphy, S., Learmonth, J. A., Zuur, A. F., Rogan, E., et al. (2008). Bioaccumulation of persistent organic pollutants in female common dolphins (Delphinus delphis) and harbour porpoises (Phocoena phocoena) from western European seas: geographical trends, causal factors and effects on reproduction and mortalit. Environ. Pollut. 153, 401–415. doi: 10.1016/j.envpol.2007.08.019
Pitman, R. L., Durban, J. W., Joyce, T., Fearnbach, H., Panigada, S., and Lauriano, G. (2020). Skin in the game: epidermal molt as a driver of long-distance migration in whales. Mar. Mamm. Sci. 36, 565–594. doi: 10.1111/mms.12661
Pyenson, N. D. (2011). The high fidelity of the cetacean stranding record: insights into measuring diversity by integrating taphonomy and macroecology. Proc. R. Soc. B Biol. Sci. 278, 3608–3616. doi: 10.1098/rspb.2011.0441
Rubio-Guerri, C., Melero, M., Esperón, F., Bellière, E. N., Arbelo, M., Crespo, J. L., et al. (2013). Unusual striped dolphin mass mortality episode related to cetacean morbillivirus in the Spanish Mediterranean Sea. BMC Vet. Res. 9:106. doi: 10.1186/1746-6148-9-106
Scheidat, M., Verdaat, H., and Aarts, G. (2012). Using aerial surveys to estimate density and distribution of harbour porpoises in Dutch waters. J. Sea Res. 69, 1–7. doi: 10.1016/j.seares.2011.12.004
Schwacke, L. H., Smith, C. R., Townsend, F. I., Wells, R. S., Hart, L. B., Balmer, B. C., et al. (2014). Health of common bottlenose dolphins (Tursiops truncatus) in Barataria Bay, Louisiana, following the Deepwater Horizon oil spill. Environ. Sci. Technol. 48, 93–103.
Sharp, S. M., McLellan, W. A., Rotstein, D. S., Costidis, A. M., Barco, S. G., Durham, K., et al. (2019). Gross and histopathologic diagnoses from North Atlantic right whale Eubalaena glacialis mortalities between 2003 and 2018. Dis. Aquat. Organ. 135, 1–31. doi: 10.3354/dao03376
Soldaat, L., and Poot, M. (2020). Analyse Bruinvisgegevens en Evaluatie Monitoring Noordzee – Kwaliteitsborging IHM 2019. Den Haag: Centraal Bureau voor de Statistiek.
Sørensen, T. B., and Kinze, C. C. (1994). Reproduction and reproductive seasonality in Danish harbour porpoises, Phocoena phocoena. Ophelia 39, 159–176. doi: 10.1080/00785326.1994.10429541
Tablado, Z., and Jenni, L. (2017). Determinants of uncertainty in wildlife responses to human disturbance. Biol. Rev. 92, 216–233. doi: 10.1111/brv.12224
Taylor, B. L., Martinez, M., Gerrodette, T., Barlow, J., and Hrovat, Y. N. (2007). Lessons from monitoring trends in abundance of marine mammals. Mar. Mamm. Sci. 23, 157–175. doi: 10.1111/j.1748-7692.2006.00092.x
Ten Doeschate, M. T. I., Brownlow, A. C., Davison, N. J., and Thompson, P. M. (2018). Dead useful: methods for quantifying baseline variability in stranding rates to improve the ecological value of the strandings record as a monitoring tool. J. Mar. Biol. Assoc. U. K. 98, 1205–1209. doi: 10.1017/s0025315417000698
Trites, A. W., and Donnelly, C. P. (2003). The decline of Steller sea lions Eumetopias jubatus in Alaska: a review of the nutritional stress hypothesis. Mamm. Rev. 33, 3–28. doi: 10.1046/j.1365-2907.2003.00009.x
Troost, G., and Boele, A. (2019). Trektellen.org — store, share and compare migration data. Bird Census News 32, 17–26.
Tyne, J. A., Loneragan, N. R., Johnston, D. W., Pollock, K. H., Williams, R., and Bejder, L. (2016). Evaluating monitoring methods for cetaceans. Biol. Conserv. 201, 252–260. doi: 10.1016/j.biocon.2016.07.024
von Benda-Beckmann, A. M., Aarts, G., Sertlek, H. Ö, Lucke, K., Verboom, W. C., Kastelein, R. A., et al. (2015). Assessing the impact of underwater clearance of unexploded ordnance on harbour porpoises (Phocoena phocoena) in the Southern North Sea. Aquat. Mamm. 41, 503–523. doi: 10.1578/am.41.4.2015.503
Weijs, L., Dirtu, A. C., Das, K., Gheorghe, A., Reijnders, P. J. H., Neels, H., et al. (2009). Inter-species differences for polychlorinated biphenyls and polybrominated diphenyl ethers in marine top predators from the Southern North Sea: part 1. Accumulation patterns in harbour seals and harbour porpoises. Environ. Pollut. 157, 437–444. doi: 10.1016/j.envpol.2008.09.024
Williams, R., Gero, S., Bejder, L., Calambokidis, J., Kraus, S. D., Lusseau, D., et al. (2011). Underestimating the damage: interpreting cetacean carcass recoveries in the context of the Deepwater Horizon/BP incident. Conserv. Lett. 4, 228–233. doi: 10.1111/j.1755-263x.2011.00168.x
Keywords: Phocoena phocoena, marine mammal, indicator species, abundance, distribution, unusual mortality event
Citation: IJsseldijk LL, Camphuysen CJ, Keijl GO, Troost G and Aarts G (2021) Predicting Harbor Porpoise Strandings Based on Near-Shore Sightings Indicates Elevated Temporal Mortality Rates. Front. Mar. Sci. 8:668038. doi: 10.3389/fmars.2021.668038
Received: 15 February 2021; Accepted: 02 June 2021;
Published: 08 July 2021.
Edited by:
Karen A. Stockin, Massey University, New ZealandReviewed by:
Luis Cardona, University of Barcelona, SpainAnders Galatius, Aarhus University, Denmark
Copyright © 2021 IJsseldijk, Camphuysen, Keijl, Troost and Aarts. This is an open-access article distributed under the terms of the Creative Commons Attribution License (CC BY). The use, distribution or reproduction in other forums is permitted, provided the original author(s) and the copyright owner(s) are credited and that the original publication in this journal is cited, in accordance with accepted academic practice. No use, distribution or reproduction is permitted which does not comply with these terms.
*Correspondence: Lonneke L. IJsseldijk, TC5MLklKc3NlbGRpamtAdXUubmw=
†These authors have contributed equally to this work