 Franck Lejzerowicz1,2*
 Andrew John Gooday3,4
 Inés Barrenechea Angeles5,6Tristan Cordier5,7
 Raphaël Morard8Laure Apothéloz-Perret-Gentil9
 Lidia Lins10
 Lenaick Menot11
 Angelika Brandt12,13
 Lisa Ann Levin14
 Pedro Martinez Arbizu15
 Craig Randall Smith16
 Jan Pawlowski5,9,17
- 1Center for Microbiome Innovation, University of California, San Diego, San Diego, CA, United States
- 2Department of Pediatrics, University of California, San Diego, San Diego, CA, United States
- 3National Oceanography Centre, Southampton, United Kingdom
- 4Life Sciences Department, Natural History Museum, London, United Kingdom
- 5Department of Genetics and Evolution, University of Geneva, Geneva, Switzerland
- 6Department of Earth Sciences, University of Geneva, Geneva, Switzerland
- 7NORCE Climate, NORCE Norwegian Research Centre AS, Bjerknes Centre for Climate Research, Bergen, Norway
- 8MARUM – Center for Marine Environmental Sciences, University of Bremen, Bremen, Germany
- 9ID-Gene Ecodiagnostics, Campus Biotech Innovation Park, Geneva, Switzerland
- 10Marine Biology Research Group, Ghent University, Ghent, Belgium
- 11IFREMER, REM/EEP/LEP, Centre de Bretagne, Plouzané, France
- 12Senckenberg Research Institute and Natural History Museum, Frankfurt, Germany
- 13Institute for Ecology, Evolution and Diversity, Goethe University Frankfurt, Frankfurt, Germany
- 14Integrative Oceanography Division, Center for Marine Biodiversity and Conservation, Scripps Institution of Oceanography, University of California, San Diego, San Diego, CA, United States
- 15German Centre for Marine Biodiversity Research, Senckenberg am Meer, Wilhelmshaven, Germany
- 16Department of Oceanography, University of Hawai‘i at Mānoa, Honolulu, HI, United States
- 17Institute of Oceanology, Polish Academy of Sciences, Sopot, Poland
The abyssal seafloor is a mosaic of highly diverse habitats that represent the least known marine ecosystems on Earth. Some regions enriched in natural resources, such as polymetallic nodules in the Clarion-Clipperton Zone (CCZ), attract much interest because of their huge commercial potential. Since nodule mining will be destructive, baseline data are necessary to measure its impact on benthic communities. Hence, we conducted an environmental DNA and RNA metabarcoding survey of CCZ biodiversity targeting microbial and meiofaunal eukaryotes that are the least known component of the deep-sea benthos. We analyzed two 18S rRNA gene regions targeting eukaryotes with a focus on Foraminifera (37F) and metazoans (V1V2), sequenced from 310 surface-sediment samples from the CCZ and other abyssal regions. Our results confirm huge unknown deep-sea biodiversity. Over 60% of benthic foraminiferal and almost a third of eukaryotic operational taxonomic units (OTUs) could not be assigned to a known taxon. Benthic Foraminifera are more common in CCZ samples than metazoans and dominated by clades that are only known from environmental surveys. The most striking results are the uniqueness of CCZ areas, both datasets being characterized by a high number of OTUs exclusive to the CCZ, as well as greater beta diversity compared to other abyssal regions. The alpha diversity in the CCZ is high and correlated with water depth and terrain complexity. Topography was important at a local scale, with communities at CCZ stations located in depressions more diverse and heterogeneous than those located on slopes. This could result from eDNA accumulation, justifying the interim use of eRNA for more accurate biomonitoring surveys. Our descriptions not only support previous findings and consolidate our general understanding of deep-sea ecosystems, but also provide a data resource inviting further taxon-specific and large-scale modeling studies. We foresee that metabarcoding will be useful for deep-sea biomonitoring efforts to consider the diversity of small taxa, but it must be validated based on ground truthing data or experimental studies.
Introduction
The deep seabed encompasses a vast mosaic of poorly sampled habitats, many of them characterized by fine-grained sediments that, for more than 50 years, have been known to host surprisingly high levels of biodiversity (Hessler and Sanders, 1967; Ramirez-Llodra et al., 2010; Rex and Etter, 2010). It conceals a variety of material resources, services and history that are of cultural value to human societies (Wenhai et al., 2019; Turner et al., 2020) as well as ecosystems of considerable and growing economic importance (Armstrong et al., 2012; Thurber et al., 2014). However, estimating and conserving deep-sea biodiversity remain major challenges (Costello and Chaudhary, 2017), with many of the species found in deep-sea samples being undescribed (Glover et al., 2018). In some groups, this novelty is often at high taxonomic levels (Goineau and Gooday, 2019). Alongside biodiversity, understanding biogeographic patterns of benthic species on the ocean floor has been a long-standing and fundamental concern in deep-sea biology (Ekman, 1953; Vinogradova, 1997). In some cases, species horizontal ranges appear to be wider in the deep sea, particularly at abyssal depths, than in shelf and coastal waters (McClain and Hardy, 2010; Costello and Chaudhary, 2017), as landscapes of overlooked habitats such as bedrock offer corridors for dispersal (Riehl et al., 2020). However, the sheer scale of undescribed deep-sea biodiversity, combined with the rarity of many species and the vast spatial extent and chronic under-sampling of the deep seabed, make it very difficult to establish geographical ranges and the prevalence of endemicity, particularly for species that are small in size.
Previous attempts to tackle deep-sea biodiversity and biogeography have been based mainly on morphological analyses, with a bias toward larger, more conspicuous animals (Higgs and Attrill, 2015). These issues have been explored using metabarcoding (Taberlet et al., 2012), which is mainly based on environmental DNA (eDNA) and thus rather biased toward small, more inconspicuous taxa. Metabarcoding studies targeting the DNA of bacteria (Zinger et al., 2011), Foraminifera (Lecroq et al., 2011) as well as protists and meiofaunal animals (Bik et al., 2012; Guardiola et al., 2015; Sinniger et al., 2016) were conducted at global scale in the deep sea, but with relatively few samples. Evidence for DNA preservation, notably in the deep-sea sediment (Lejzerowicz et al., 2013a; Corinaldesi et al., 2018), justifies the use of environmental RNA (eRNA). Indeed, eRNA has been proposed as a proxy for active species in various environments (Logares et al., 2012; Adamo et al., 2020; Giner et al., 2020). It yields compositions that differ from eDNA in deep-sea sediments (Guardiola et al., 2016) and may therefore be more useful for interpreting biodiversity and biogeographic patterns. Yet further understanding of deep-sea processes can be obtained using metabarcoding, since this environment offers ideal conditions for the preservation of biomolecules, including eRNA which may persist in complex forms (Cristescu, 2019; Wood et al., 2020).
Besides fundamental methodological issues, the use of metabarcoding has practical benefits in the context of current and likely future human impacts on ocean-floor communities (Glover and Smith, 2003; Thiel, 2003; Levin et al., 2020a; Le et al. in revision), combined with the growing and far-reaching effects of global climatic changes (Levin and Le Bris, 2015; Danovaro et al., 2017; Sweetman et al., 2017; Morato et al., 2020), which will alter areas targeted for deep seabed mining (Levin et al., 2020b). The largest proportion of our samples was obtained in the eastern equatorial Pacific Clarion-Clipperton Zone (CCZ). This area lies beyond national jurisdictions (Rabone et al., 2019) and hosts vast deposits of polymetallic nodules (Hein et al., 2013; Petersen et al., 2016) that are the focus of an emerging seabed mining industry regulated by the International Seabed Authority (ISA). These activities will impact benthic ecosystems in a variety of ways (Levin et al., 2016) and likely lead to the irreversible loss of biodiversity (Niner et al., 2018), at least locally (Vonnahme et al., 2020). The ISA requires contractors licensed for mineral exploration and prospecting within the CCZ to conduct baseline surveys of benthic biodiversity, and subsequent exploitation contracts will require monitoring of mined areas to evaluate environmental impacts. Metabarcoding in the CCZ has been restricted to eDNA. It has been used to document prokaryotes in nodules (Blöthe et al., 2015) and in comparison with surrounding sediments and overlying water (Lindh et al., 2017, 2018), whereas eukaryotic studies pointing to the importance of habitat diversity and eDNA transport (Laroche et al., 2020a,b) were limited to the Western CCZ. No comparison with other abyssal regions was yet attempted.
Here, we perform eDNA and eRNA metabarcoding on 310 deep-sea sediment samples from the Eastern CCZ and other abyssal regions, including Northwest Pacific, Southern Ocean and several Atlantic regions in order to identify biogeographic patterns at larger scales and their relation to key environmental parameters at local scales, notably topographic heterogeneity. We rely on two 18S rRNA gene markers to reconstruct the taxonomic composition, diversity and distribution of benthic Foraminifera (37F marker) and Metazoa (V1V2 marker) that live or have lived in the Eastern CCZ region and explore some basic questions concerning: (1) the composition of sediment-dwelling eukaryotic assemblages at abyssal depths in the oceans; (2) levels of alpha diversity at particular abyssal sites and how they compare over different spatial scales; and (3) global (between oceans) to local (between stations) biogeographic patterns based on beta diversity turnover and dispersion. We rely on compositionally aware techniques that are necessary for omics data analysis, and on phylogenetic metrics to reflect on the evolutionary relatedness of communities sampled from eDNA or eRNA, that we systematically compare for more insightful interpretation. We discuss our conclusions in the context of recent metabarcoding and eco-evolutionary studies in the CCZ, in order to understand how environmental molecular data can be applied in future baseline surveys and the importance of small-sized organisms for deep-sea management and conservation in the face of rising pressures to mine minerals from the abyssal seafloor.
Materials and Methods
Description of the Deep-Sea Sediment Sampling and Environmental Variable
Deep-sea sediments were collected at abyssal depths during eight expeditions to the Atlantic, Southern and Pacific Oceans (Figure 1). The largest number of samples originated from the Clarion-Clipperton Zone (CCZ) in the eastern Equatorial Pacific. They were taken mainly at the eastern end of this region, during the MANGAN’16 cruise in the BGR exploration license area and during the second ABYSSLINE cruise (AB02) in Stratum B (one of two 30 × 30 km study areas in which most samples were collected) of the UK-1 license area (hereafter called UK-1B) and a similar stratum within the OMS area. These two AB02 strata have very different topographies: UK-1B has approximately ten volcanic seamounts and hills on the abyssal plain, whereas the OMS stratum is much flatter with low, gently undulating abyssal ridges and troughs. Some samples were taken in the French (IFREMER) license area, located further to the west although still in the eastern half of the CCZ, during the BIONOD cruise. Sterile or disposable spoons were used to subsample the top surface sediment centimeter (ca. 2 g) according to a nested sampling design: up to three replicates per core; up to two cores per coring device deployment, and up to three deployments per station that were grouped into 16 areas and six larger regions (Table 1). Approximately 2 ml of fresh surficial sediments were collected with a multiple corer and placed in sterile tubes at −80°C with (VEMA, SYSTCO II, KuramBio I, MANGAN’16, and AB02) or without (MSM39, DIVA-3, and BIONOD) LifeGuard (Qiagen) Preservation Solution (6 ml) before shipment to the University of Geneva (Switzerland). For each station, the latitude and longitude were used to obtain environmental data layers presented in Howell et al. (2016), including seafloor slope (in degrees) and Bathymetric Position Indices (BPI, Broad, and Fine). A positive BPI value indicates a location higher than its surroundings (e.g., ridges) whereas a negative value indicates features such as valleys and troughs (Weiss, 2001).
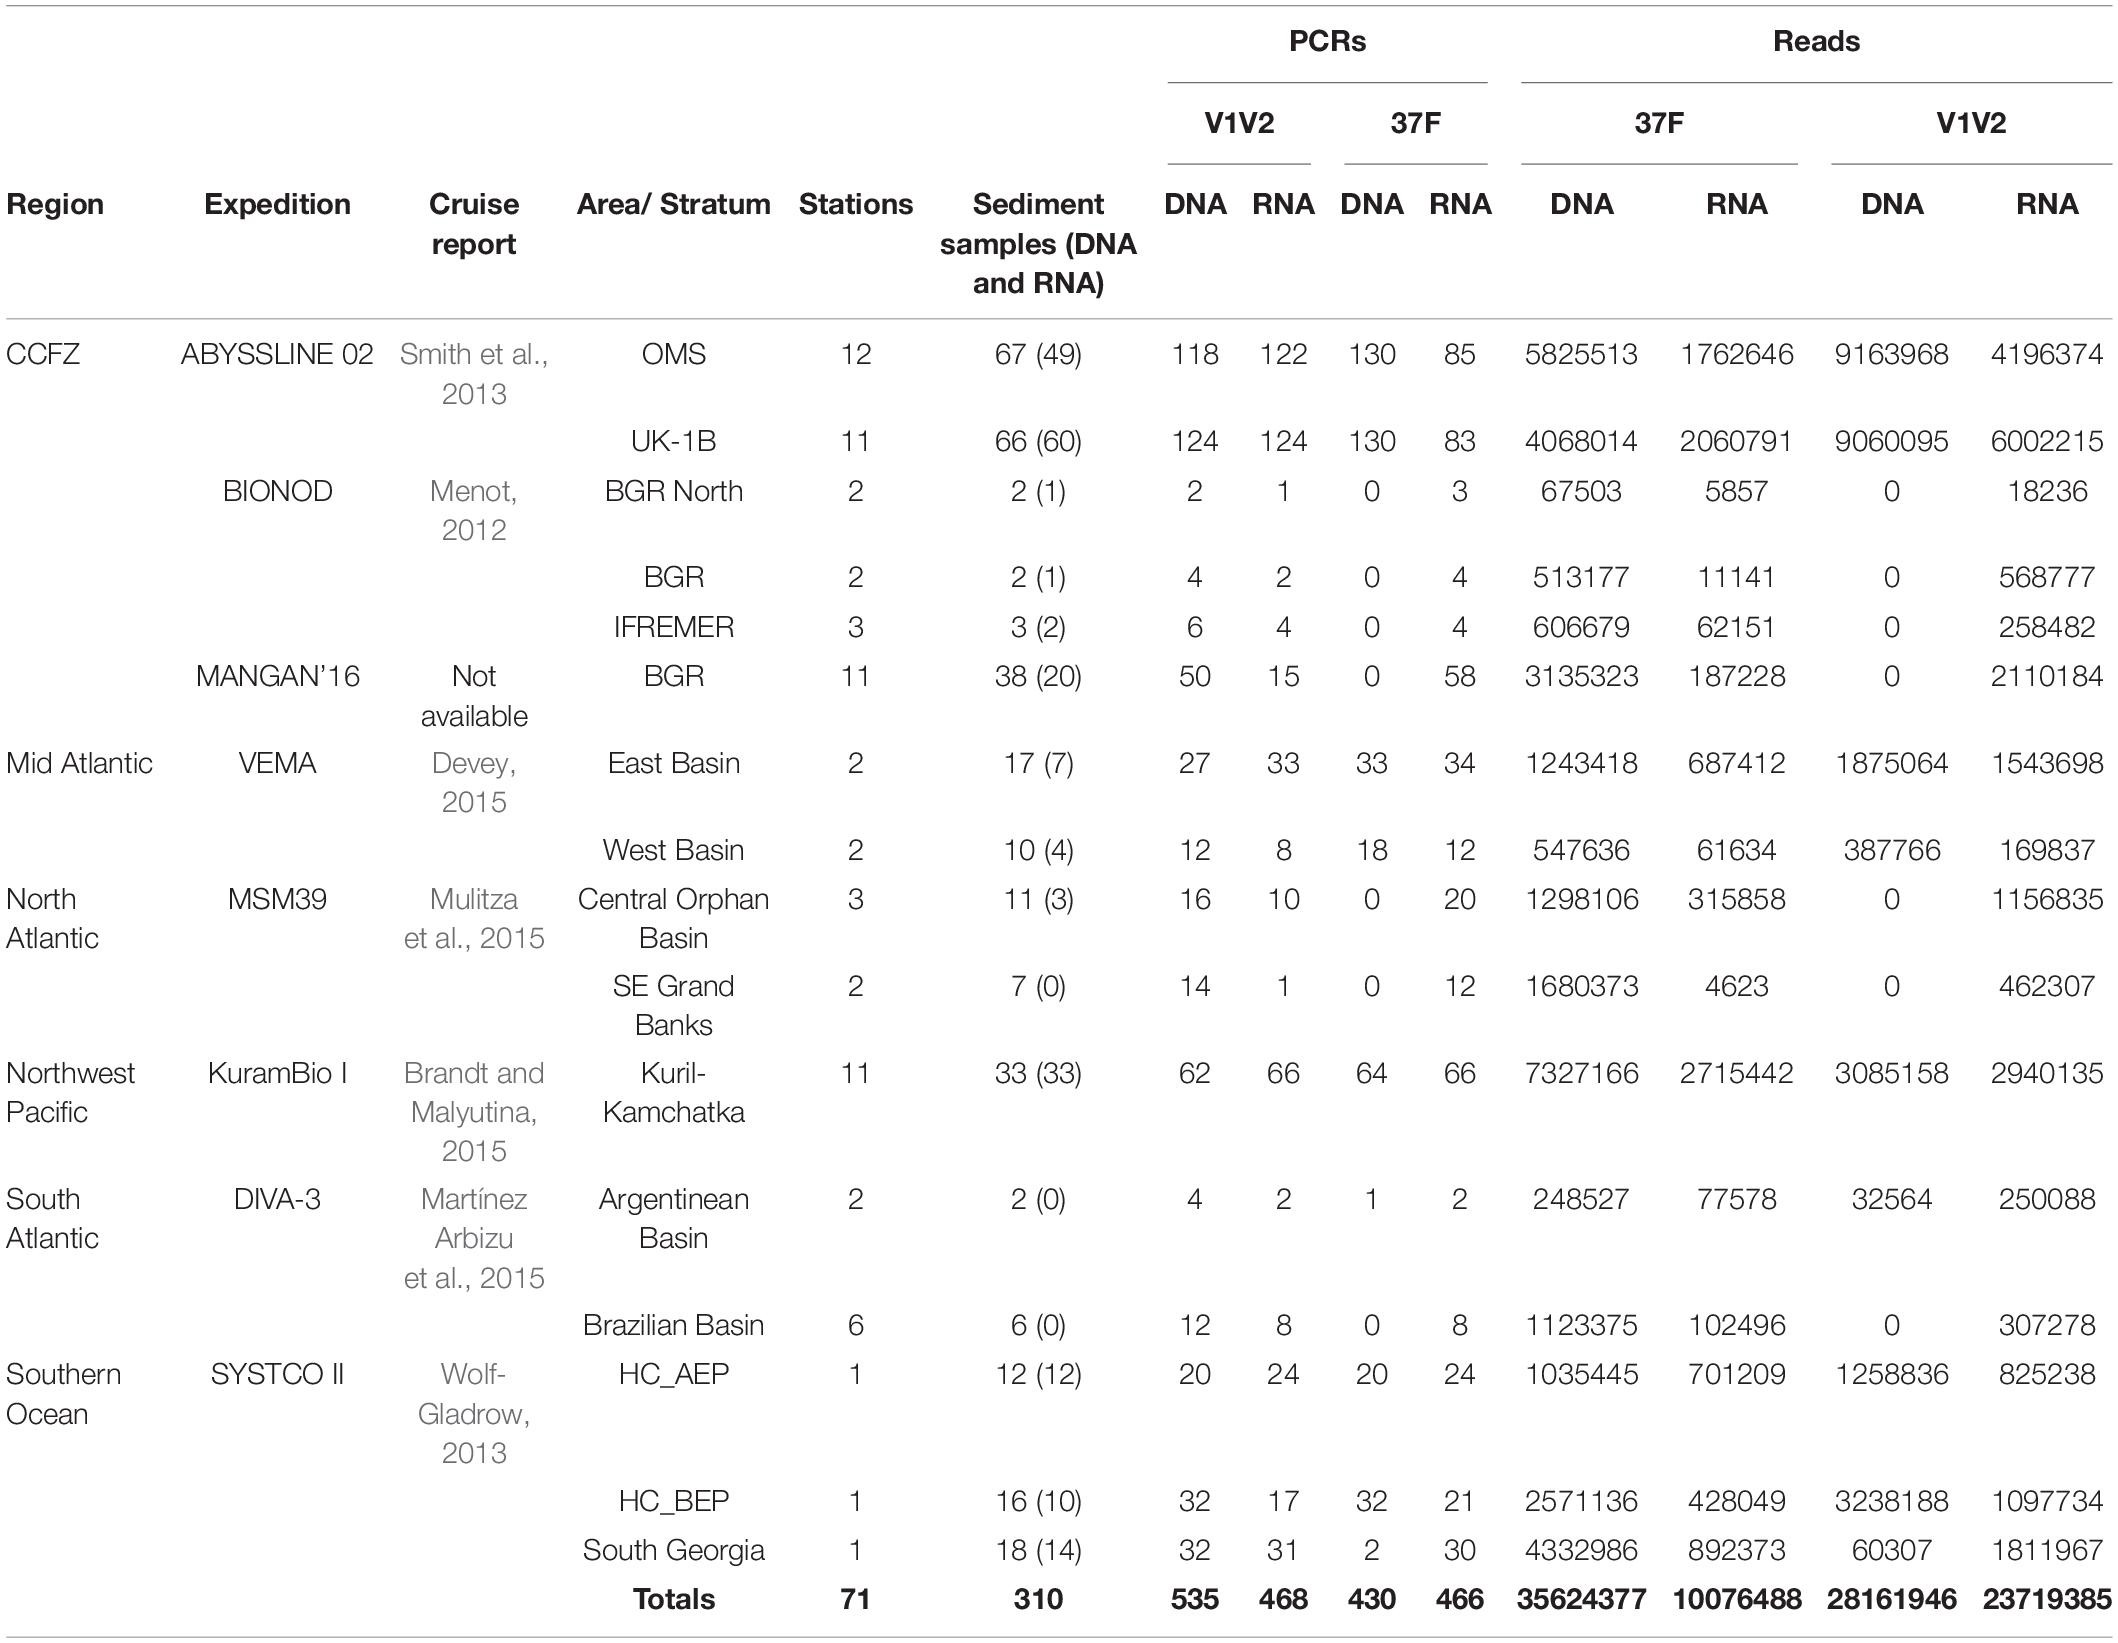
Table 1. Origins and numbers of deep-sea sediment material, and successfully PCR-amplified and sequenced samples.
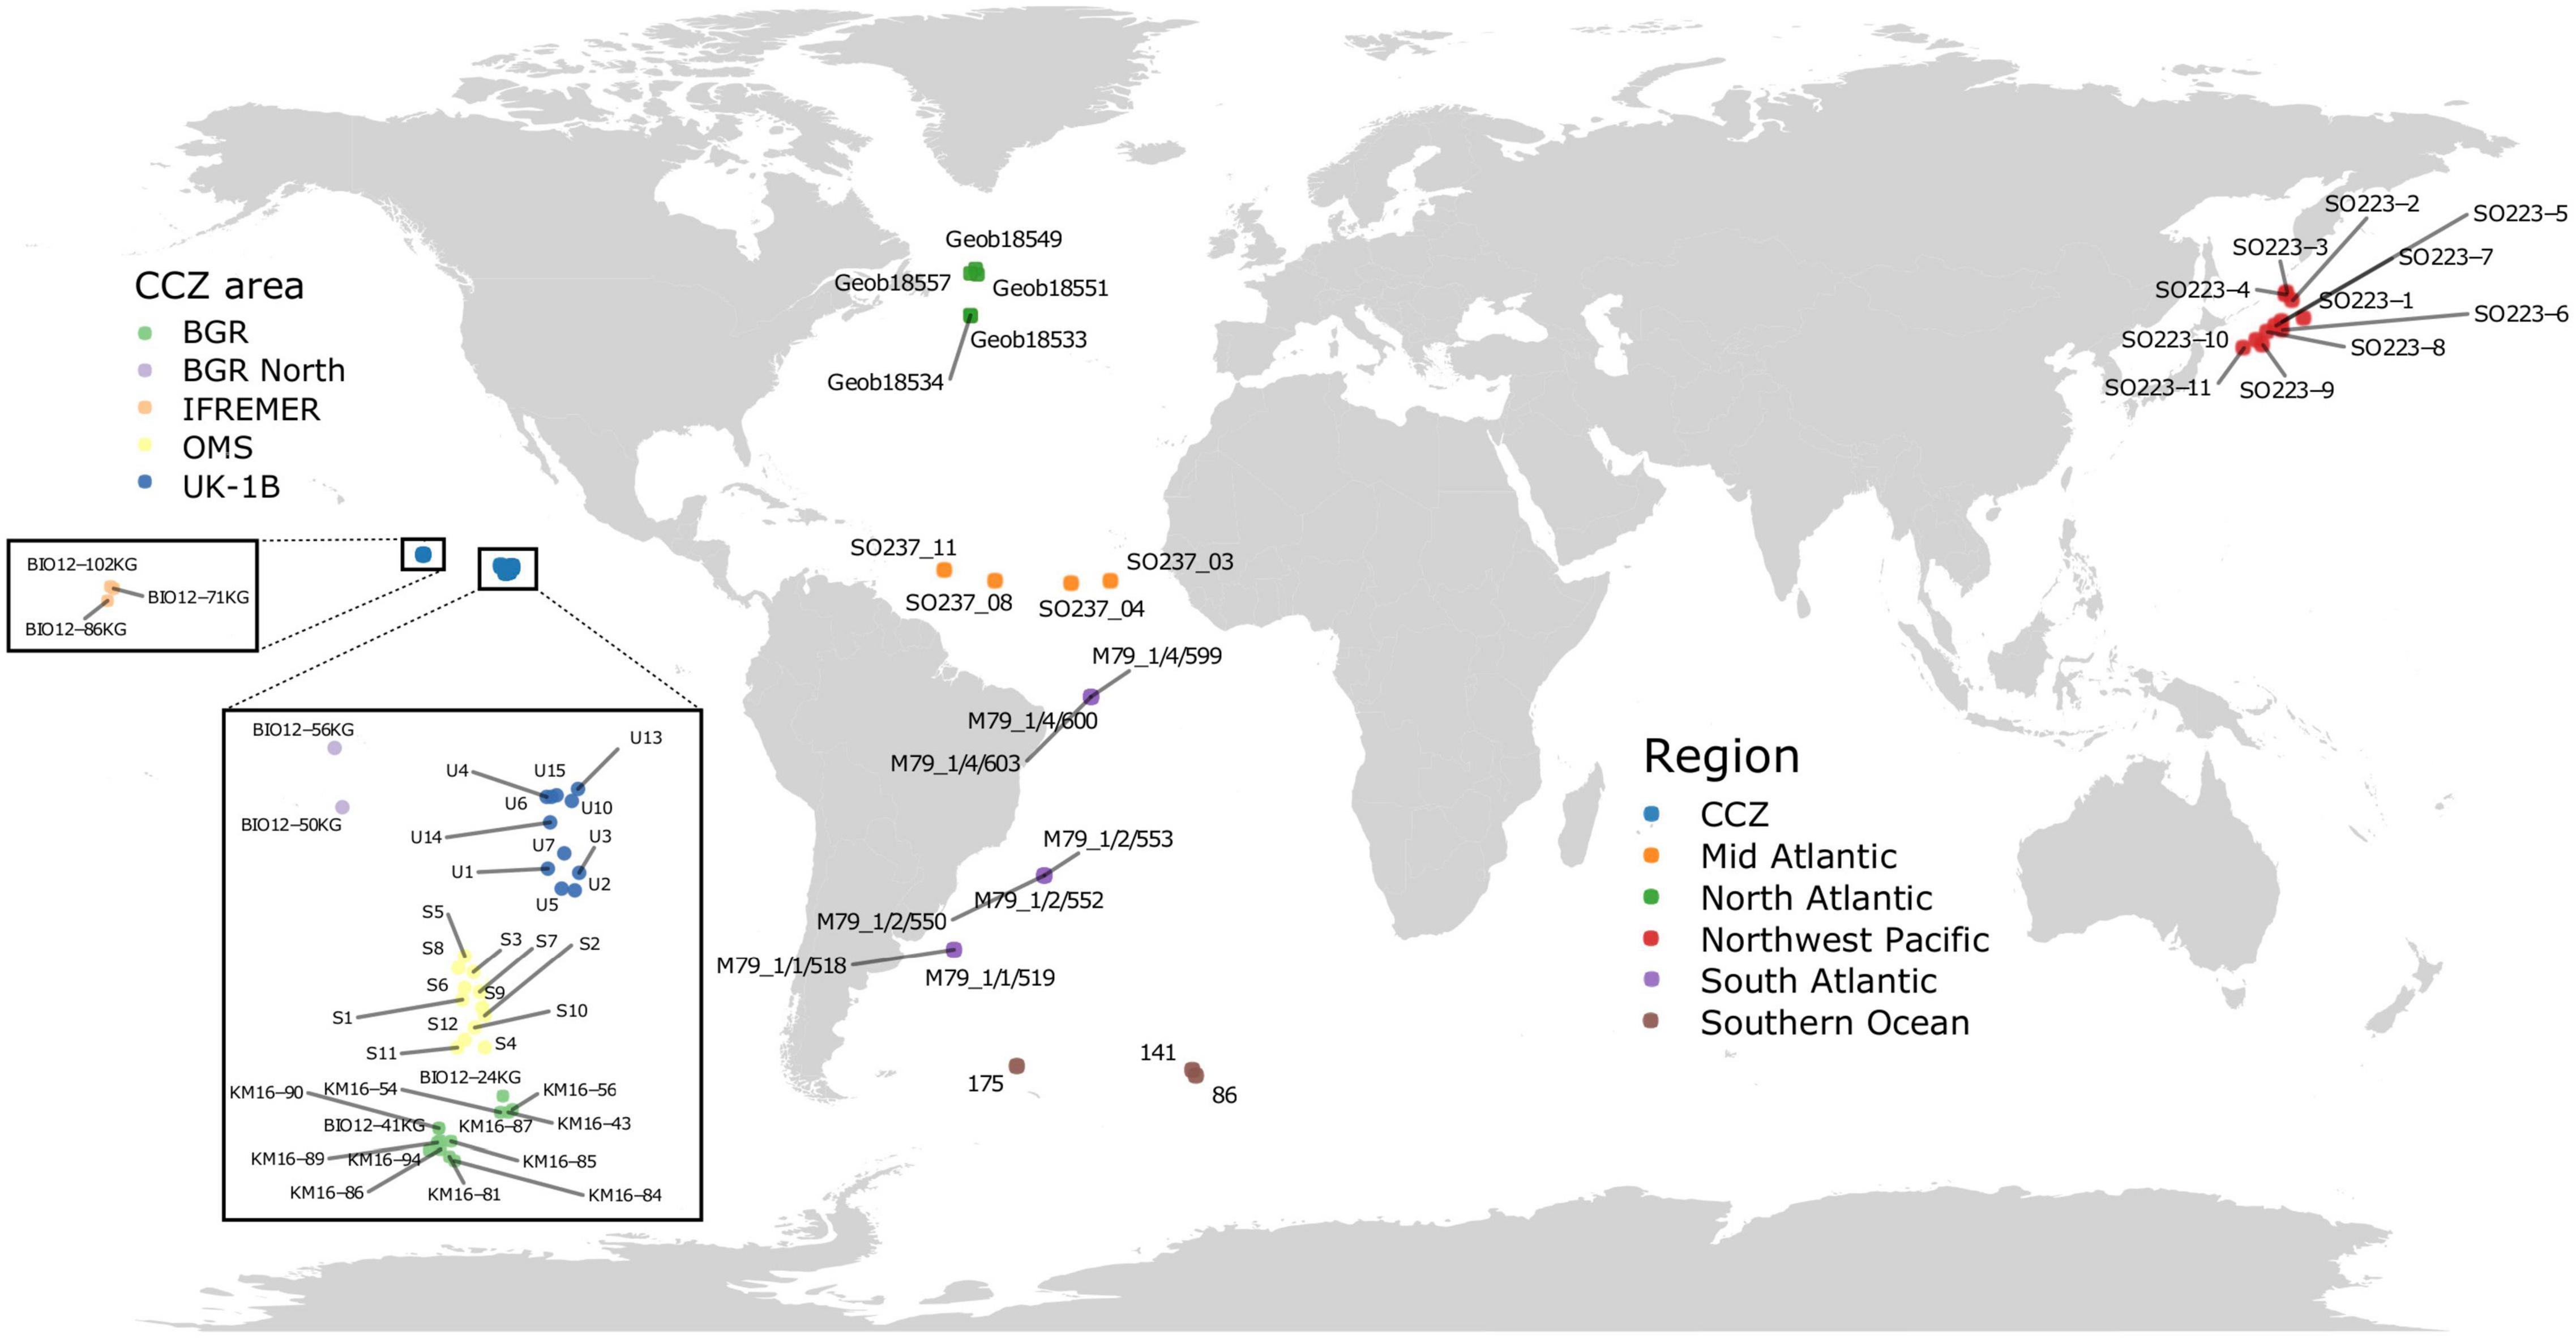
Figure 1. Location of the sequenced sediment samples. Samples in the Pacific Ocean include two regions: the CCZ (five different areas, see inset) and the Northwest Pacific (Kuril-Kamchatka area). Samples in the Atlantic Ocean include three regions (North, Mid, and South Atlantic), as well as three areas (and stations) in the Southern Ocean region.
Nucleic Acids Extraction, PCR Amplification and High-Throughput Sequencing
For each of 310 sediment samples, the total RNA and DNA contents of ca. 2 g of material were extracted as in Lejzerowicz et al. (2015) and cDNA was generated from DNase-treated RNA as in Pawlowski et al. (2014). It was ensured that no DNA molecules carried over into the RNA extracts based on the absence of PCR amplification with each primer set and after 60 cycles. From each sample, approximately 21 ng of DNA and cDNA extract were incorporated in 30-μl volume PCR amplifications performed in duplicate for each of the two 18S rRNA gene amplification primers pairs targeting Foraminifera and Eukaryota (Supplementary Table 1 and Supplementary Material): the 37F hypervariable region using primers s14F1 and s15 (Lejzerowicz et al., 2014), and the V1V2 region using R22mod and F04 (Sinniger et al., 2016). Forward and reverse primers tagged at their 5′-ends with 8-nt tags were used in order to pool different amplicons to the same libraries and demultiplex the resulting reads to samples. The tagged primer combinations and their dispatching to libraries were designed to avoid and detect sequence-to-sample misidentifications due to mistagging (Esling et al., 2015) and to balance the base composition of the first sequenced positions (Illumina template cycles, see Mitra et al., 2015). The PCR duplicates of a given sample were amplified using the same tagged primer combinations, but pooled in different sequencing libraries in order to be able to analyze them separately. In total, 1,998 PCR products were mixed into 51 pools (on average: 44 ng per PCR; 39.2 PCRs per pool). The pools were transformed into sequencing libraries using the TruSeq Nano PCR-free Library Preparation Kit, which were Illumina-sequenced on two HiSeq 2500 runs (2 lanes; 36 libraries) and 5 MiSeq runs (5 lanes; 15 libraries). Strict procedures were respected to limit extraneous and cross contamination: (i) maximum 12 samples per session (one PCR session included the four markers and duplicates), (ii) separate laboratory spaces for no-DNA (PCR preparation), low-DNA (extraction and DNA/RNA/cDNA handling) and high-DNA (post-PCR) concentrations, (iii) lab coat and gloves worn at all time, (iv) cleaning with DNA AWAYTM Surface Decontaminant (Thermo Fisher Scientific), and (v) wiping of each pipet tip on absorbent paper to avoid releasing the aerosols of primer, DNA or PCR products before gentle tip disposal. Technical information for each sample along with environmental variables and metadata information required by the MIMARKs standards (Yilmaz et al., 2011), including sequence frequencies after each filtering step (see next section), are available in Supplementary Table 2. Data and metadata are publicly available in FigShare1 and at the European Bioinformatics Institute under accession number PRJEB44134.
Bioinformatic Sequence Data Processing
HiSeq sequencing generated ambiguous bases at a few positions corresponding to the amplification primer sequences (i.e., after the tags; Supplementary Figure 1). A python script was used to correct these ambiguities if their number corresponded to the hamming distance with the closest primer sequence. The corrected paired-end fastq files of each library were processed to (i) demultiplex sequences to samples using DTD (Dufresne et al., 2019)2, which allows the counting of sequences associated with unexpected primer combinations (or mistags, see Esling et al., 2015), (ii) quality-filter and merge paired reads using pandaseq 2.11 (options -t 0.6 -A pear -T 24 -o 30) (Masella et al., 2012), (iii) filter mistags out of each sample (see Esling et al., 2015, Supplementary Material), (iv) dereplicate sequences using mothur (Schloss et al., 2009) and remove the resulting unique sequences that are singletons or that occur in only one of the two PCR replicates, (v) cluster sequences into operational taxonomic units (OTUs) to reduce diversity inflation due to PCR and sequencing errors using swarm v3 (option -f) (Mahé et al., 2015), (vi) filter potentially chimeric sequences using UCHIME (Edgar et al., 2011) in de novo mode as implemented in QIIME2 (Bolyen et al., 2019), and (vii) remove samples with less than 3,000 reads or less than 10 OTUs.
Reference Databases and Taxonomic Assignments
For the taxonomic assignment of foraminiferal OTUs, an alignment of 3,145 18S rRNA gene sequences belonging to classes Monothalamea, Globothalamea, and Tubothalamea as well as planktonic isolates was curated (PRF2, Morard et al., 2015). Each sequence entails the hypervariable 37F region that has proved powerful for foraminiferal species identification (Pawlowski and Lecroq, 2010; Lecroq et al., 2011; Lejzerowicz et al., 2014), is flanked by at least 50 and 150 nucleotides at its 5′ and 3′ ends, and contains no ambiguous nucleotide (N) or species-level duplicate. A phylogeny built using RAxML v8.2.12 (1,000 bootstraps, GTRGAMMAI model; Stamatakis, 2014) was manually inspected using EMPress (Cantrell et al., 2020) to identify and remove rotaliid sequences branching with monothalamids, in contradiction with the current foraminiferal phylogeny (Holzmann and Pawlowski, 2017; Supplementary Figure 2). The resulting 3,002 18S fragments were harmonized to six taxonomic levels (class; order; family; genus; species; and isolate) in order to serve as a reference database.
For the taxonomic assignment of Eukaryota OTUs, both the Protist Ribosomal Reference database (PR2, Guillou et al., 2013) and SILVA 138.1 (SSU Ref NR 99, Quast et al., 2013) were used, without Insecta and harmonized to the eight taxonomic levels of the PR2 taxonomic framework (kingdom; domain; phylum; class; order; family; genus; species). Although the taxonomic ranks from PR2 were employed, SILVA was kept because PR2 is biased toward protists whereas SILVA remains a generalist database useful for Metazoa assignments. It is important to note that the PR2 taxonomy does not include Xenacoelomorpha, which in this database is not distinguished from Platyhelminthes (Ruiz-Trillo et al., 1999).
Each OTU representative sequence was assigned using four different methods, including (i) vsearch 2.7.0 (Rognes et al., 2016) and (ii) BLAST+ (Camacho et al., 2009) both as implemented in QIIME2, as well as (iii) IDTAXA (Murali et al., 2018) and (iv) SINTAX (Edgar, 2016). For every individual method, the deepest assignment associated with a probability of at least 0.9 was retained. Finally, OTUs were classified to the last common ancestor found by at least two out of the four assignment methods, and also across the two databases for Eukaryota OTUs.
Metazoa Novelty
A V1V2 subset composed of OTUs assigned to Metazoa was created for comparison with the OTUs reported in Sinniger et al. (2016). From the corresponding author, the Metazoa OTU read counts table (17 samples) was obtained, as well as their aligned representative sequences (8,517) and associated phylogeny, which was used as a guide tree for RAxML (GTRCAT model) to build a phylogeny suitable for phylogenetic sequence placement with SEPP (Mirarab et al., 2012). Then, our homologous V1V2 OTU sequences were placed onto this tree and their prevalence in CCZ samples was visualised in EMPress (for either or both types of molecule). In order to evaluate the quality of the placements, five SEPP repetitions were performed, using five different placement sizes (parameter “-P”).
In parallel, our OTU sequences were co-clustered with the OTU sequences from Sinniger et al. (2016) in order to evaluate the amount of metazoan novelty in a deep-sea benthic sequencing survey. Two to 17 samples were randomly sub-sampled from Sinniger et al. (2016) and OTUs re-replicated into reads (following table counts) that were concatenated with a similar number of unique sequences per OTU randomly sampled from our study, using the same number of samples and the same reads proportions. Clustering was then performed using swarm v3 (as above) on the concatenated sequences of each sampling size and the proportion of resulting clusters containing sequences from both studies was measured (or “co-clusters”). Each random sub-sampling of sequences from 2 to 17 samples was repeated one hundred times. The whole procedure was also repeated for each of three stations of Sinniger et al. (2016) from which were generated 2–6 samples in this study.
Alpha Diversity
Phylogenetic placement of the 37F OTUs sequences onto the foraminiferal phylogeny (without planktonic sequences) and of the V1V2 OTUs onto the SILVA v128 phylogeny pre-computed for use with SEPP was performed in QIIME2 (Janssen et al., 2018). QIIME2 was used to calculate the Faith’s Phylogenetic Diversity (PD) index (Faith, 1992) based on these trees, in addition to the Shannon’s entropy index for alpha diversity analyses. The Faith’s PD metric computes the amount of root-to-tip branch length on the phylogeny represented by each community’s OTUs, but it does not account for the number of reads associated with these OTUs. Hence, the Shannon’s entropy index was also calculated as it incorporates relative read abundances. Both indices were computed after rarefaction to 3,000 reads per sample. For each marker, the difference between regions, areas, stations and coring device deployments was tested based on the Kruskal–Wallis H test for independent samples (Kruskal and Wallis, 1952) using the python library scipy (Virtanen et al., 2020). To satisfy sample independence, tests were performed for each set of replicates and for DNA and RNA separately, and p-values were adjusted using the python library statsmodels for false discovery rate control on multiple testing (Benjamini and Hochberg, 1995). Post-hoc pairwise comparisons between individual regions and areas were performed using the Faith’s PD index (after Kruskal–Wallis H tests results showed significant differences at these scales; see section “Results”) implemented in the R package conover.test (Conover and Iman, 1979). For these geographic scales, the difference in alpha diversity between DNA and RNA samples was also assessed using paired Kruskal–Wallis tests (Bonferroni adjusted per scale). Finally, the correlation between the Faith’s PD index and each environmental variable was measured using Spearman’s rho with scipy.
The OTU richness found exclusively at intersections of areas was measured across the 37F benthic Foraminifera and V1V2 Eukaryota datasets, as well as at intersections of stations within the CCZ UK-1B and OMS strata. The R package upSetR (Conway et al., 2017) was used to also report the number of sequence reads associated with each of the 30 most-important intersections in terms of OTU richness.
Beta Diversity
Based on placement trees, the Weighted and Unweighted UniFrac distances were computed for beta diversity analyses. These distances measure phylogenetic relatedness by quantifying the amount of unique branch length between communities (Lozupone and Knight, 2005; McDonald et al., 2018b). Metabarcoding and other environmental-sequencing data are compositional, as the true total of each sample is not known (Quinn et al., 2018). Hence, the compositionally robust Aitchison distance was employed to build sample dissimilarity matrices and identify clusters in Robust Principal Component Analysis (RPCA) (Aitchison, 1982, 1986) using the EMPeror visualization tool in QIIME2 (Vázquez-Baeza et al., 2013). This Aitchison metric includes a centered log-ratio transformation step, as performed in DEICODE, which also includes a matrix completion step for sparse data (Martino et al., 2019). Dissimilarity matrices were also built using the more traditional Jaccard and Bray-Curtis dissimilarity metrics (e.g., Legendre and Legendre, 2012).
These dissimilarity matrices were subject to one-way group comparisons of beta diversity between regions, areas or stations using PERMANOVA, as well as for differences in dispersion within each of these groups using PERMDISP (no group with fewer than 10 samples included, 999 permutations, performed using QIIME2). Additionally, the added beta diversity was evaluated by randomly sampling the matrices 10 times for each of an increasing number of samples and measuring the minimum distance among these samples, thus building dissimilarity-decay curves. These curves are similar to rarefaction curves but performed on samples dissimilarity, providing a way to explore the novelty space of communities, as proposed in Huttenhower et al. (2012, see Figures 3D,E) and McDonald et al. (2018a). The dissimilarity matrices and ordinations obtained before and after the removal of non-metazoan OTUs were also compared using Mantel tests (Mantel, 1967) with QIIME2 and PROTESTs (Jackson, 1995) with the R package vegan (Oksanen, 2011), respectively.
Local-Scale Heterogeneity and Relation to Bathymetry in the CCZ
Local-scale heterogeneity was assessed in terms of community turn-over by measuring the beta-diversity dispersion of each station within the UK-1B and OMS strata of the CCZ. First, RPCA ordination was performed (as above) but only for the CCZ samples and separately for the DNA and RNA versions of these samples. Then, the position of the centroid formed in these RPCA spaces (in three dimensions) by the maximum of six samples (three replicates from each of two sediment cores of the same deployment) was calculated at each station and the distances separating these samples from their centroid were collected. For an illustration, see Supplementary Figure 20 where the samples are colored per station on the RPCAs used to calculate distance-to-centroids. This approach is similar to that proposed using the distance-to-plane in the human gut microbial ecosystem (Halfvarson et al., 2017). We describe the average and standard deviation of these distances-to-centroids at each station on the UK-1B and OMS maps and in relation to bathymetry. Maps and their isodepth contour lines were fetched using the function getNOAA.bathy() (R package marmap, Pante and Simon-Bouhet, 2013) and the Bathymetric Position Index environmental variable was smoothed over space using the function Smooth() (sigma = 0.05, R package spatstat, Baddeley et al., 2015). Finally, the DNA and RNA distributions of these distances to stations’ centroids were compared using paired t-tests with the R package ggpubr. All code to perform and reproduce the analyses is available upon request.
Results
Sequence Data and Taxonomic Assignment
Quality, replicates and frequency filtering discarded 13.4 and 26.9% of the 1,158 and 1,226 samples successfully PCR-amplified and sequenced for the 37F and V1V2 marker, respectively, with the more numerous CCZ samples being most affected (Supplementary Figure 3A). We performed analyses of an average of 474.7 ± 44 (standard deviation) samples and 24.4 ± 10.7 million reads per marker and molecule type (Table 1). The rarefaction depth of 3,000 reads per sample was chosen as a tradeoff between a high number of reads and a high number of samples for analysis, with the final number of samples being 1,003 for 37F and 896 for V1V2 (Supplementary Figure 3B). The sequencing depths obtained across PCR replicates are consistent for each marker and for DNA and RNA with an average Pearson’s r correlation of 0.71 (Supplementary Figure 3C, all p-values < 0.001). Sequence clustering across markers and replicates resulted in a total of 12,742 and 43,091 OTUs for the 37F and V1V2 markers, respectively.
For taxonomic assignment of V1V2 OTUs, using PR2 or SILVA resulted in very similar assignment profiles across taxonomic levels and methods intersections (Supplementary Figure 4). When the four methods agree, it is mainly for non-assignments, which is the case for the majority of OTUs, representing 74.5 and 43.6% of the total number of OTUs for 37F and V1V2, respectively. Yet, up to 619 V1V2 OTUs and almost a hundred 37F OTUs are consistently assigned to the same genus by the four methods. A few OTUs (max. 214) are assigned differently by two pairs of methods (“conflicts”), but are resolved at family (37F) and domain (V1V2) levels (Supplementary Figure 5). Assignments found consistent at the genus level by two or three methods represent 20.5 ± 0.01% of all V1V2 OTUs but only 5.6 ± 0.02% of all 37F OTUs.
High-Level Taxonomic Composition
We summarized the taxonomic composition of benthic foraminifera and eukaryotes in terms of OTU proportions and sequence read relative abundances in each area (Figure 2). The foraminiferal dataset is composed mainly of benthic species (Figures 2A,B). The proportion of planktonic sequences (order Globigerinida) is negligible (0.37% of OTUs, Supplementary Figures 7, 8A,B). The foraminiferal dataset is dominated by unassigned sequences, both in number of OTUs and abundance of reads (Supplementary Tables 3, 4). The assigned sequences belong mainly to the single-chambered class Monothalamea. Among them, the groups only known from previous environmental foraminiferal metabarcoding surveys (“ENFOR”) can represent more than half of the reads assigned in a particular area. On average, the single group ENFOR5 accounts for 13.3 ± 3.1% of the reads in the six CCZ areas. The proportion of multi-chambered Globothalamea is minor in the CCZ, although it is well represented in the Kuril-Kamchatka (Northwest Pacific) and South Georgia (Southern Ocean) areas, where it contributes 24.2 and 13.3% of the reads, respectively. Interestingly, the high-level taxonomic composition of OTUs is very similar in all sampled areas, in contrast to the relative abundance of reads, which are much lower for globothalamiids in the CCZ compared to other regions (Wilcoxon-Mann-Whitney tests on log-ratios, for DNA: U = 2.82 × 10⁶, p-value = 3.27 × 10⁻⁷; and for RNA: U = 3.55 × 10⁶, p-value = 2.75 × 10⁻¹⁴, Supplementary Figure 9).
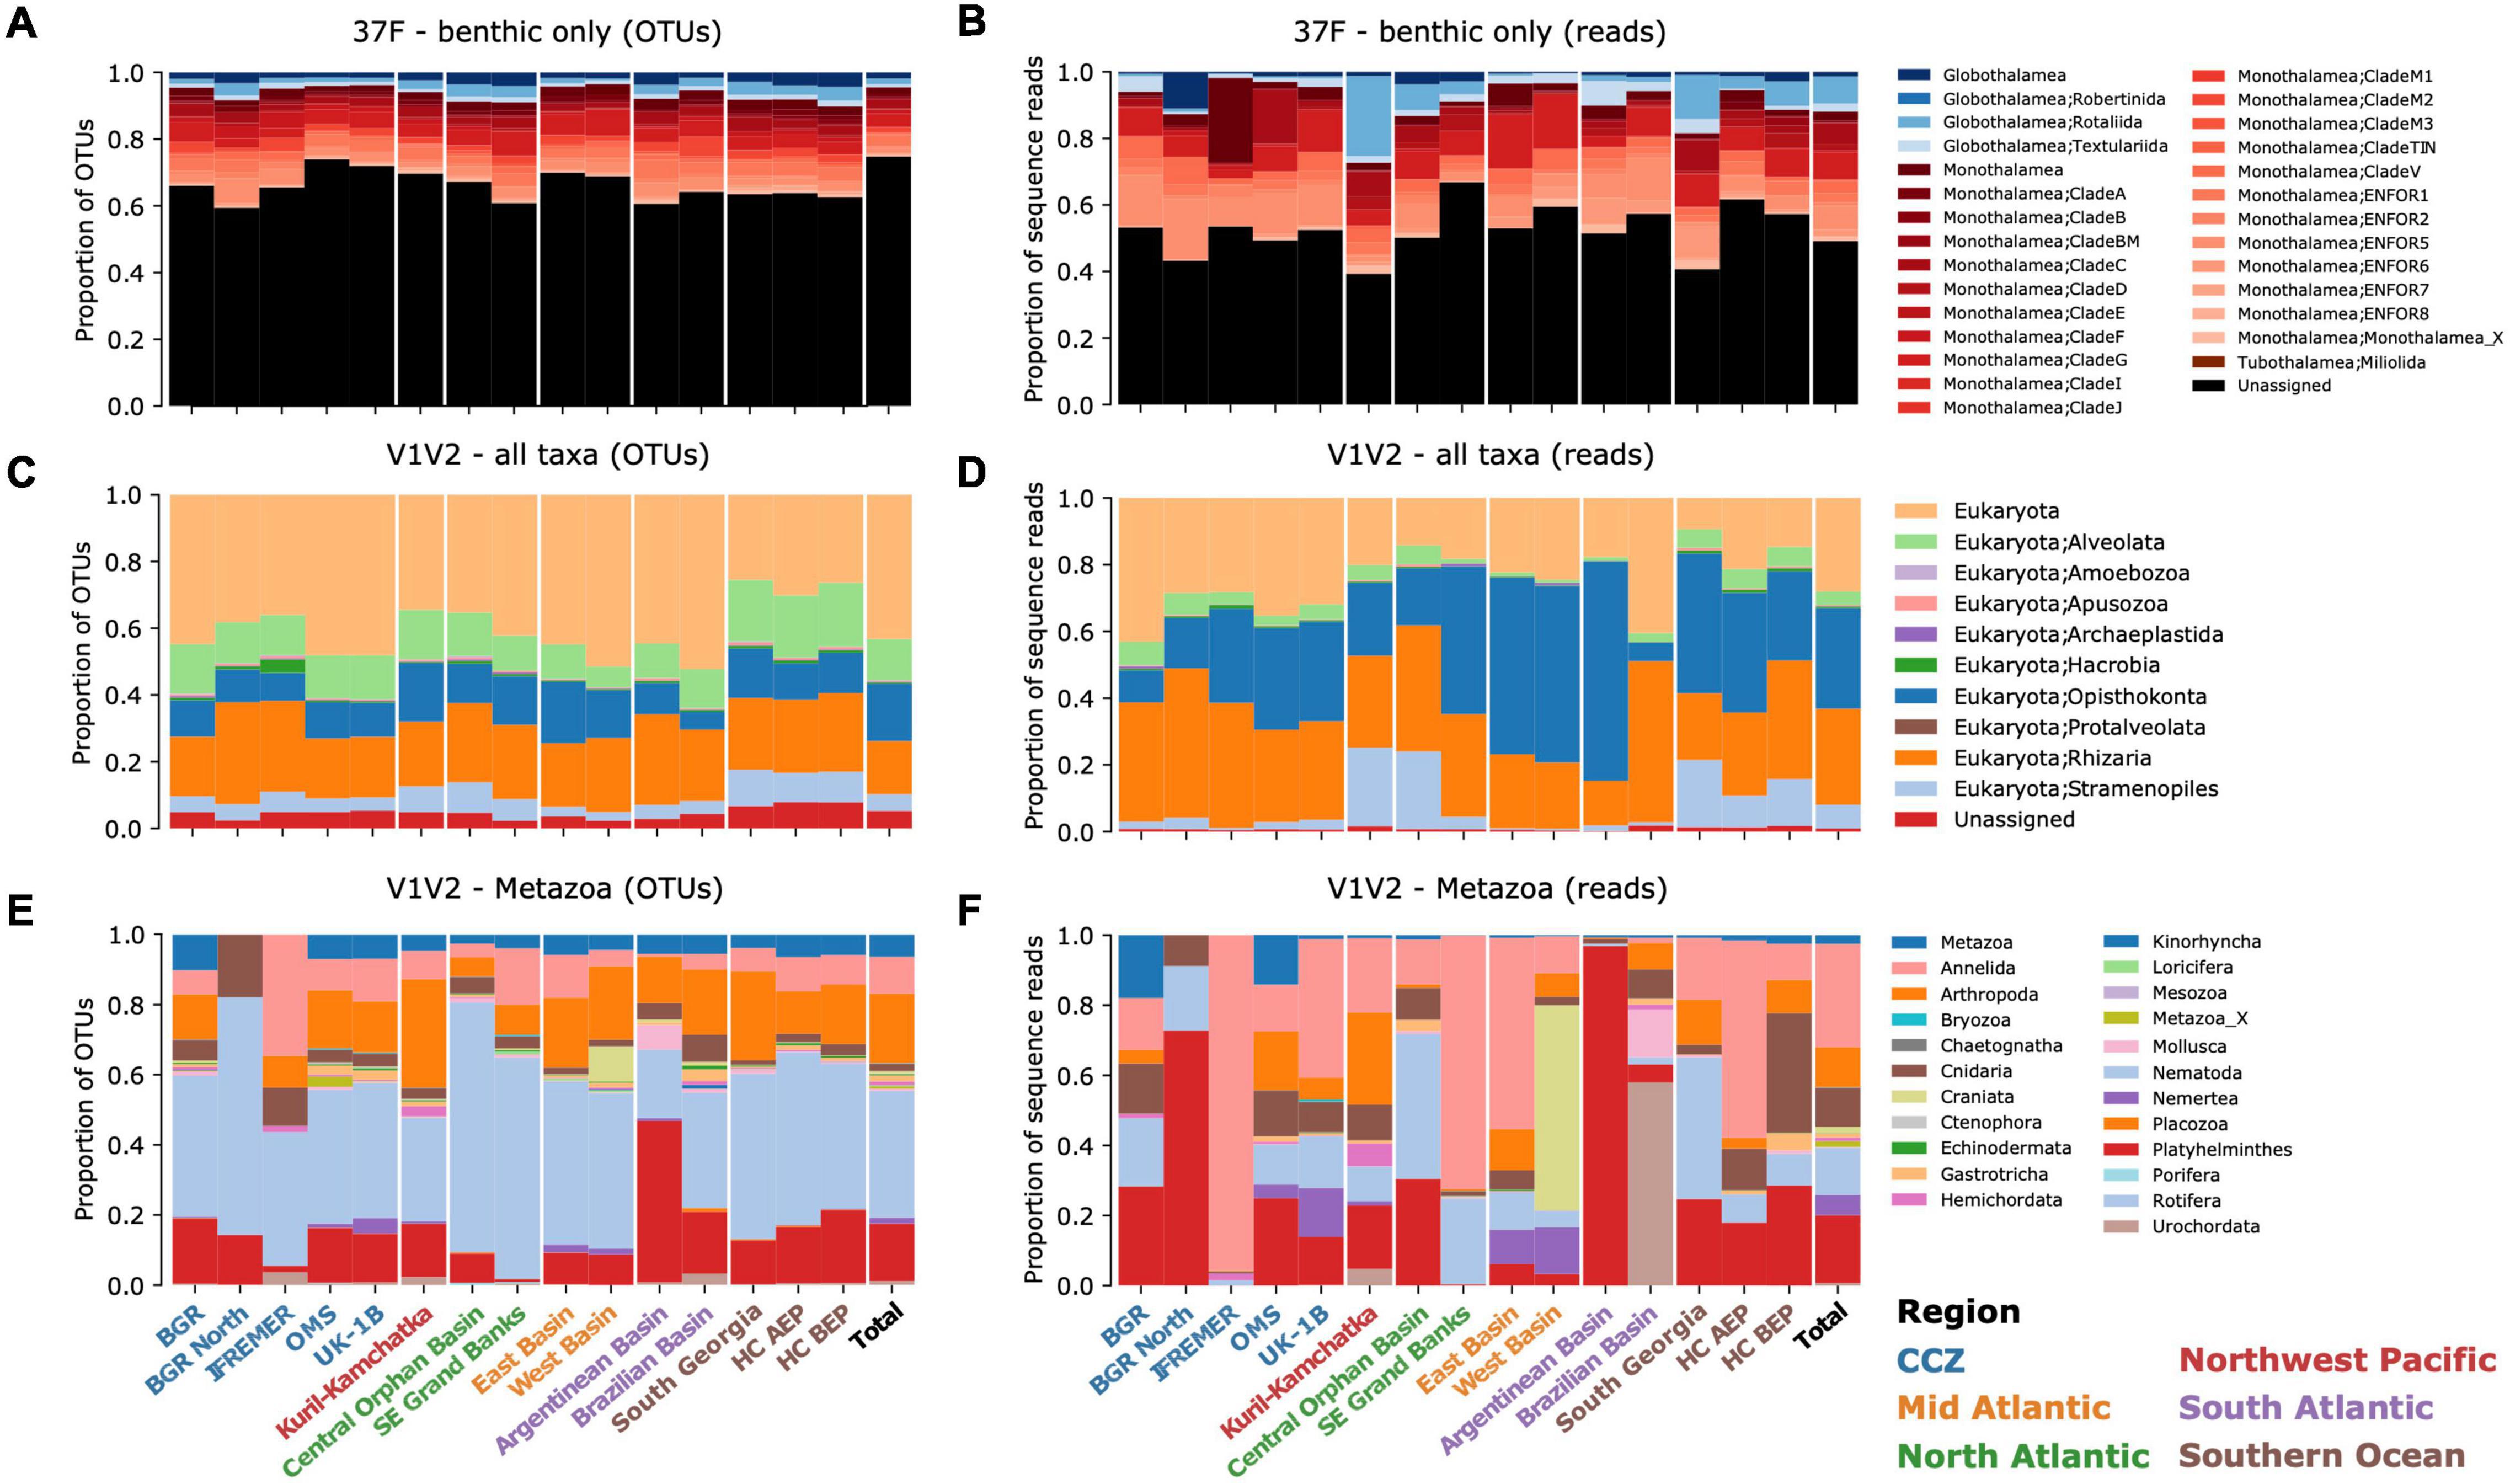
Figure 2. Taxonomic composition and relative abundance. Proportions of OTUs found for each taxon across samples from each area (A,C,E) and relative abundances of reads per taxon (B,D,F). (A,B) the 37F dataset (benthic Foraminifera only), (C,D) the full V1V2 dataset, and (E,F) the V1V2 dataset reduced to Metazoa. Bars are grouped per region and the total proportions are shown on the right of each panel.
The eukaryotic dataset (V1V2 all taxa) is composed mainly of OTUs assigned to Alveolata, Opisthokonta, Rhizaria, and Stramenopiles (Figure 2C), while Opisthokonta and Rhizaria dominate in terms of read abundances (Figure 2D). The average proportion of unassigned OTUs per area is 46.7 ± 0.05%, without the Southern Ocean areas, where it is 34.7 ± 0.02% (Supplementary Tables 5–8). The taxonomic profiles are very similar for the whole CCZ region. Overall, about a fourth of the reads (22.6 ± 0.09%) from CCZ belong to Opisthokonta, and these are distributed in 17.2% of the 43,091 OTUs, a proportion similar to that of the supergroup of Rhizaria (15.9% of OTUs). CCZ Opisthokonta includes Metazoa (6.2 ± 0.02% of OTUs), but also Fungi that represent 14.7 and 15.8% of reads in UK-1B and OMS, respectively (Supplementary Figure 6). In the other regions, the proportion of reads is also similar, except for the supergroup of Stramenopiles (dominated by diatoms), which represents a large fraction of the reads in the Kuril-Kamchatka (Northwest Pacific) and South Georgia (Southern Ocean) areas.
For analyses of the metazoan component, a large part of the V1V2 dataset was removed, including Alveolata, Amoebozoa, Apusozoa, Archaeplastida, Hacrobia, Stramenopiles, Rhizaria, non-metazoan Opisthokonta, as well as unassigned “Eukaryota” (Supplementary Figure 7). In the CCZ samples, these removed taxa are highly prevalent and altogether represent 85.8% of the reads (Supplementary Figures 8C,D). Among the most abundant metazoans prevalent in the CCZ are Nematoda (present in 97.9% of the samples), followed by Platyhelminthes/Xenacoelomorpha (77.9%), and Annelida (63.3%). The Echinodermata, Gastrotricha, Mollusca, Nemertea, and Porifera are present in, at most, only 23.3% of the CCZ samples.
Phylogenetic Novelty
To establish biodiversity novelty in the CCZ region we placed the metazoan and foraminiferal datasets in molecular phylogenies (Figures 3, 4). In the case of metazoans, we performed OTU comparisons with the global-ocean study of Sinniger et al. (2016). An evaluation of the quality of this step reveals that for a given OTU, alternative placements associated with a low probability would place this OTU very close to the retained placement node on the tree (Supplementary Figure 10C). Hence, we are confident that our Metazoa placements can be interpreted in the framework of the Sinniger tree. To further measure metazoan novelty, we co-clustered at similar sampling effort the Metazoa OTUs of this study with the OTUs from Sinniger et al. (2016). With all Sinniger’s samples included, only 1–2% of the clusters contained sequences from both studies (Supplementary Figure 11A) and the proportions remain low when comparing samples from exactly the same stations (Supplementary Figure 11B).
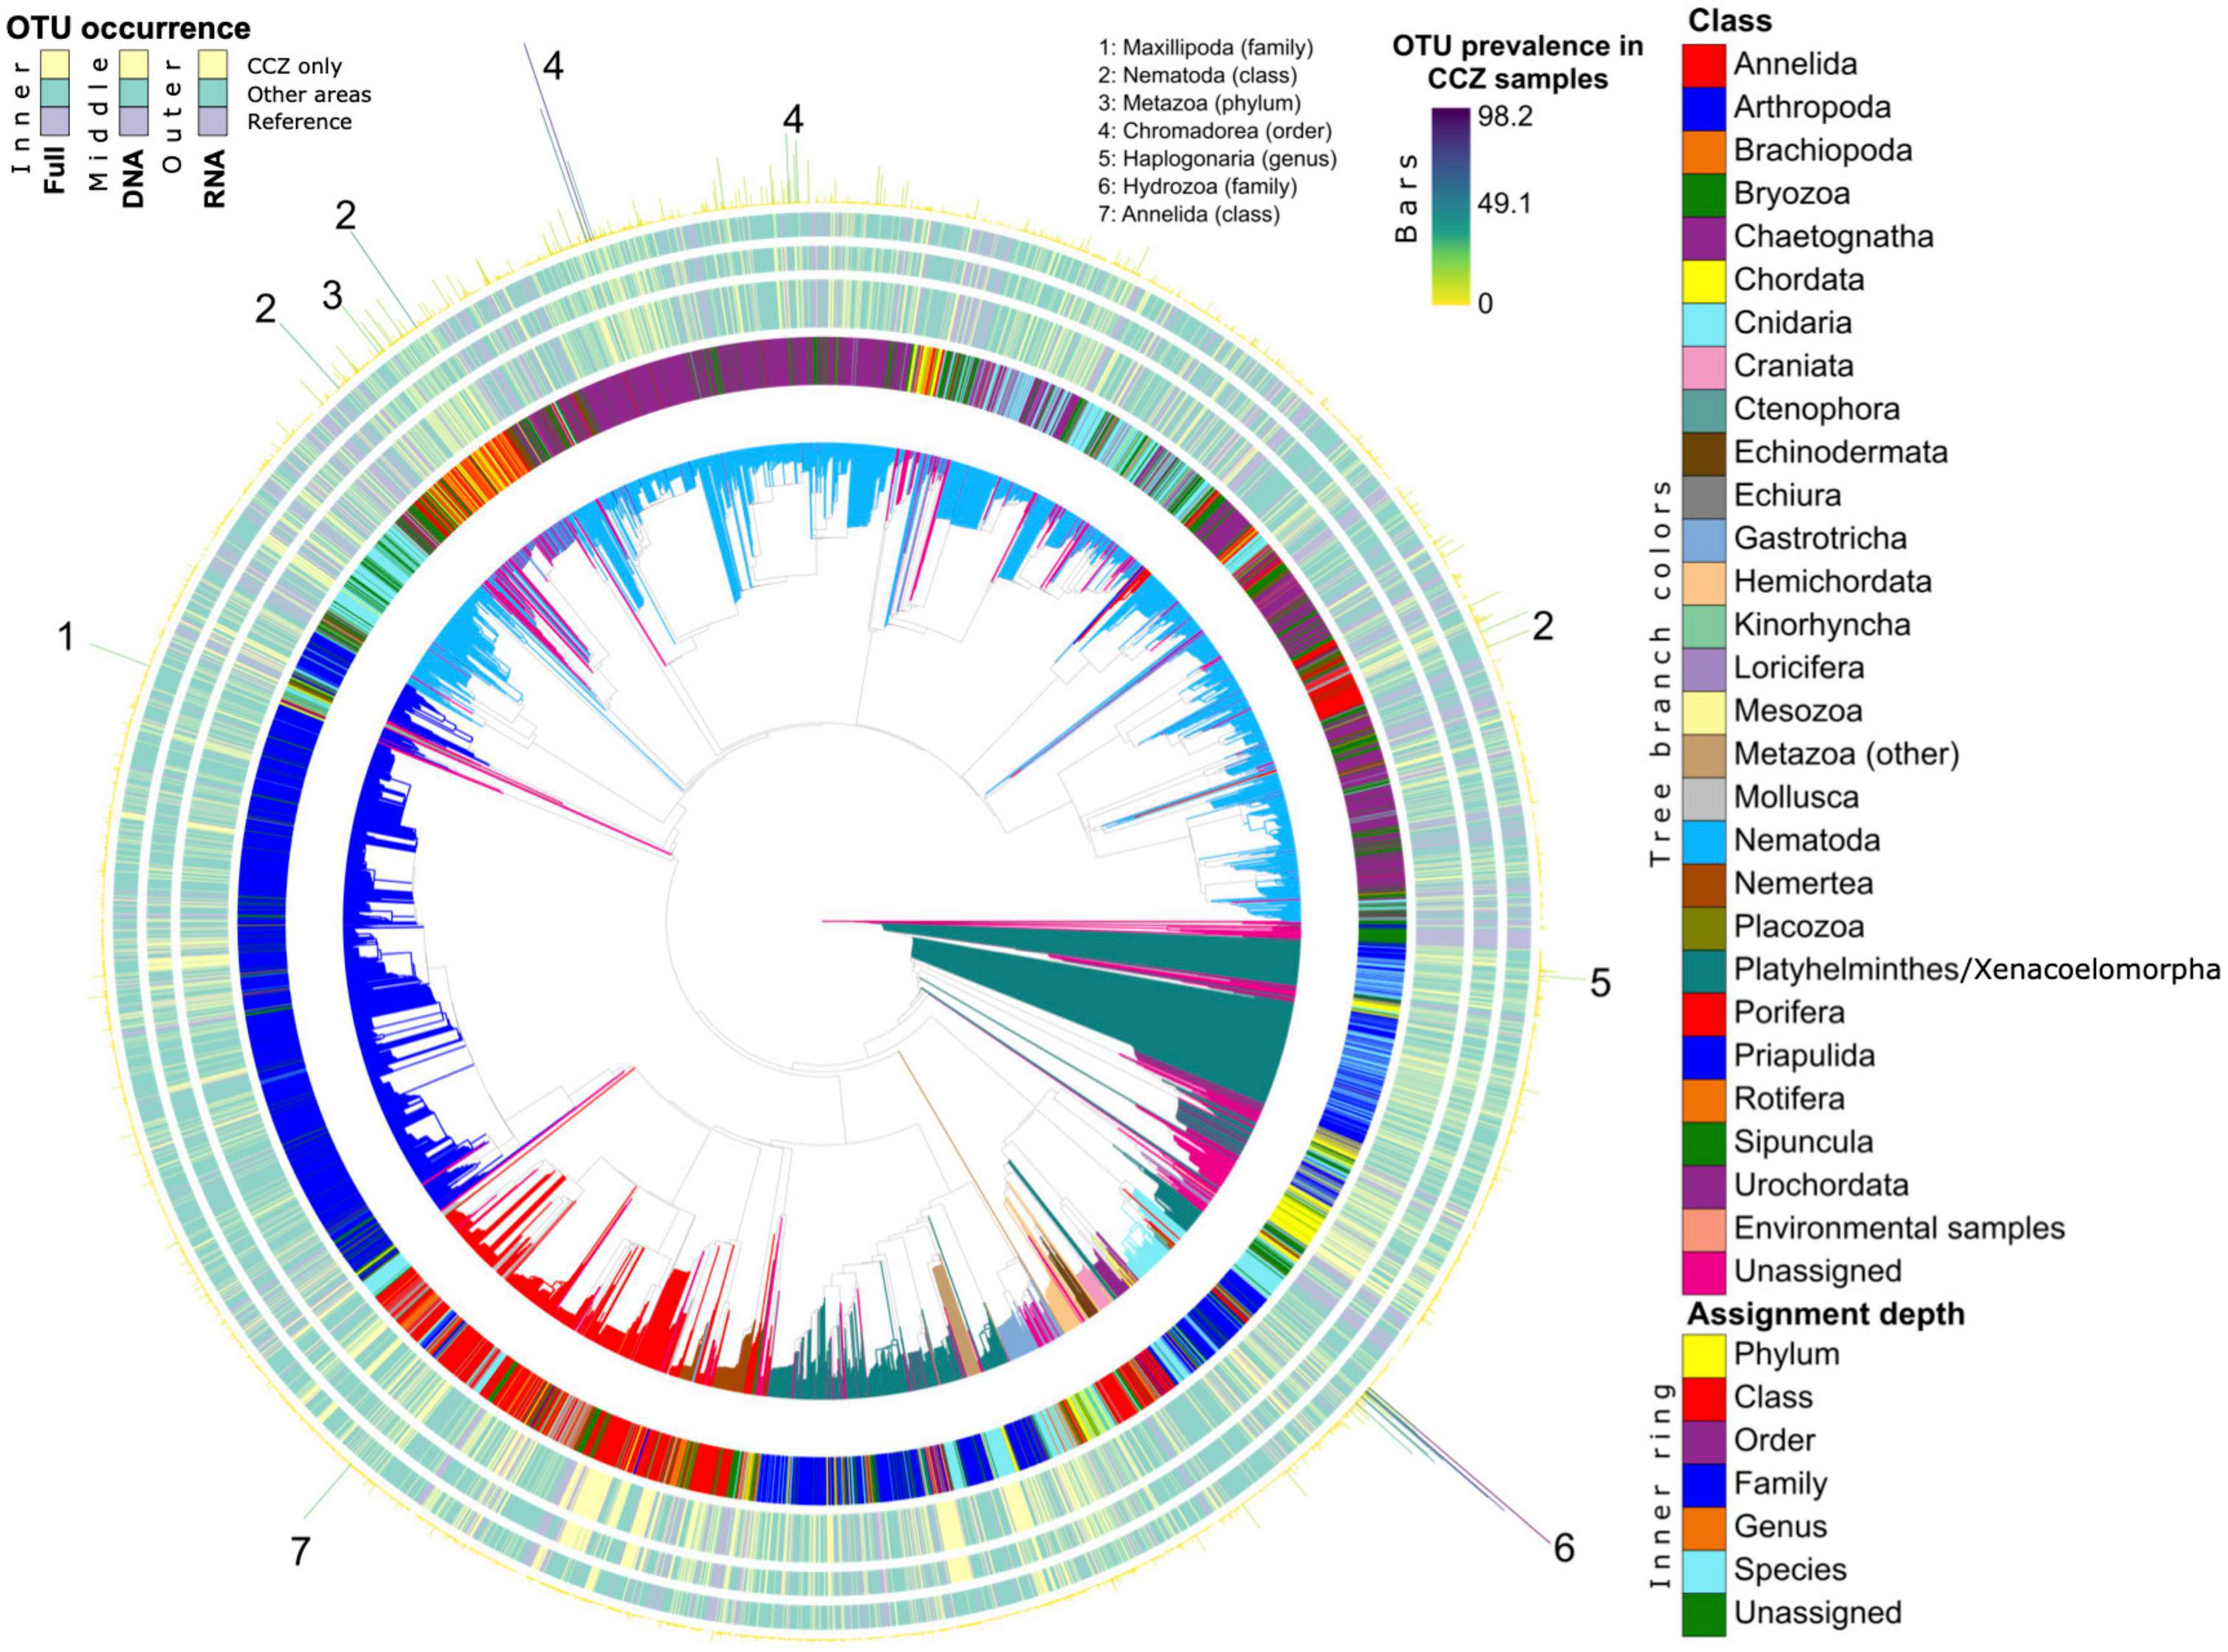
Figure 3. Phylogenetic diversity and novelty of Metazoa OTUs. The phylogeny from Sinniger et al. (2016) is shown, expanded with V1V2 OTUs placements from this study. Tree branches are colored at the Class and Order levels. Concentric bar plots indicate, for each OTU its assignment depth (innermost ring), whether it is exclusive to the CCZ using both DNA and RNA (large inner ring), using DNA only (middle ring) or using RNA only (outer ring). These OTU-occurrence measures indicate whether a tip corresponds to an OTU found only in the CCZ (“CCZ only”, in yellow), to an OTU also found in any other area (“Other areas”, in turquoise), or whether a tip corresponds to a sequence from the reference phylogenies used for placement (“Reference”, in purple). The prevalence of each OTU in the CCZ samples is indicated in terms of percent of samples where it is detected in this area (outermost bars). The finest taxonomy of OTUs highly prevalent in the CCZ are indicated.
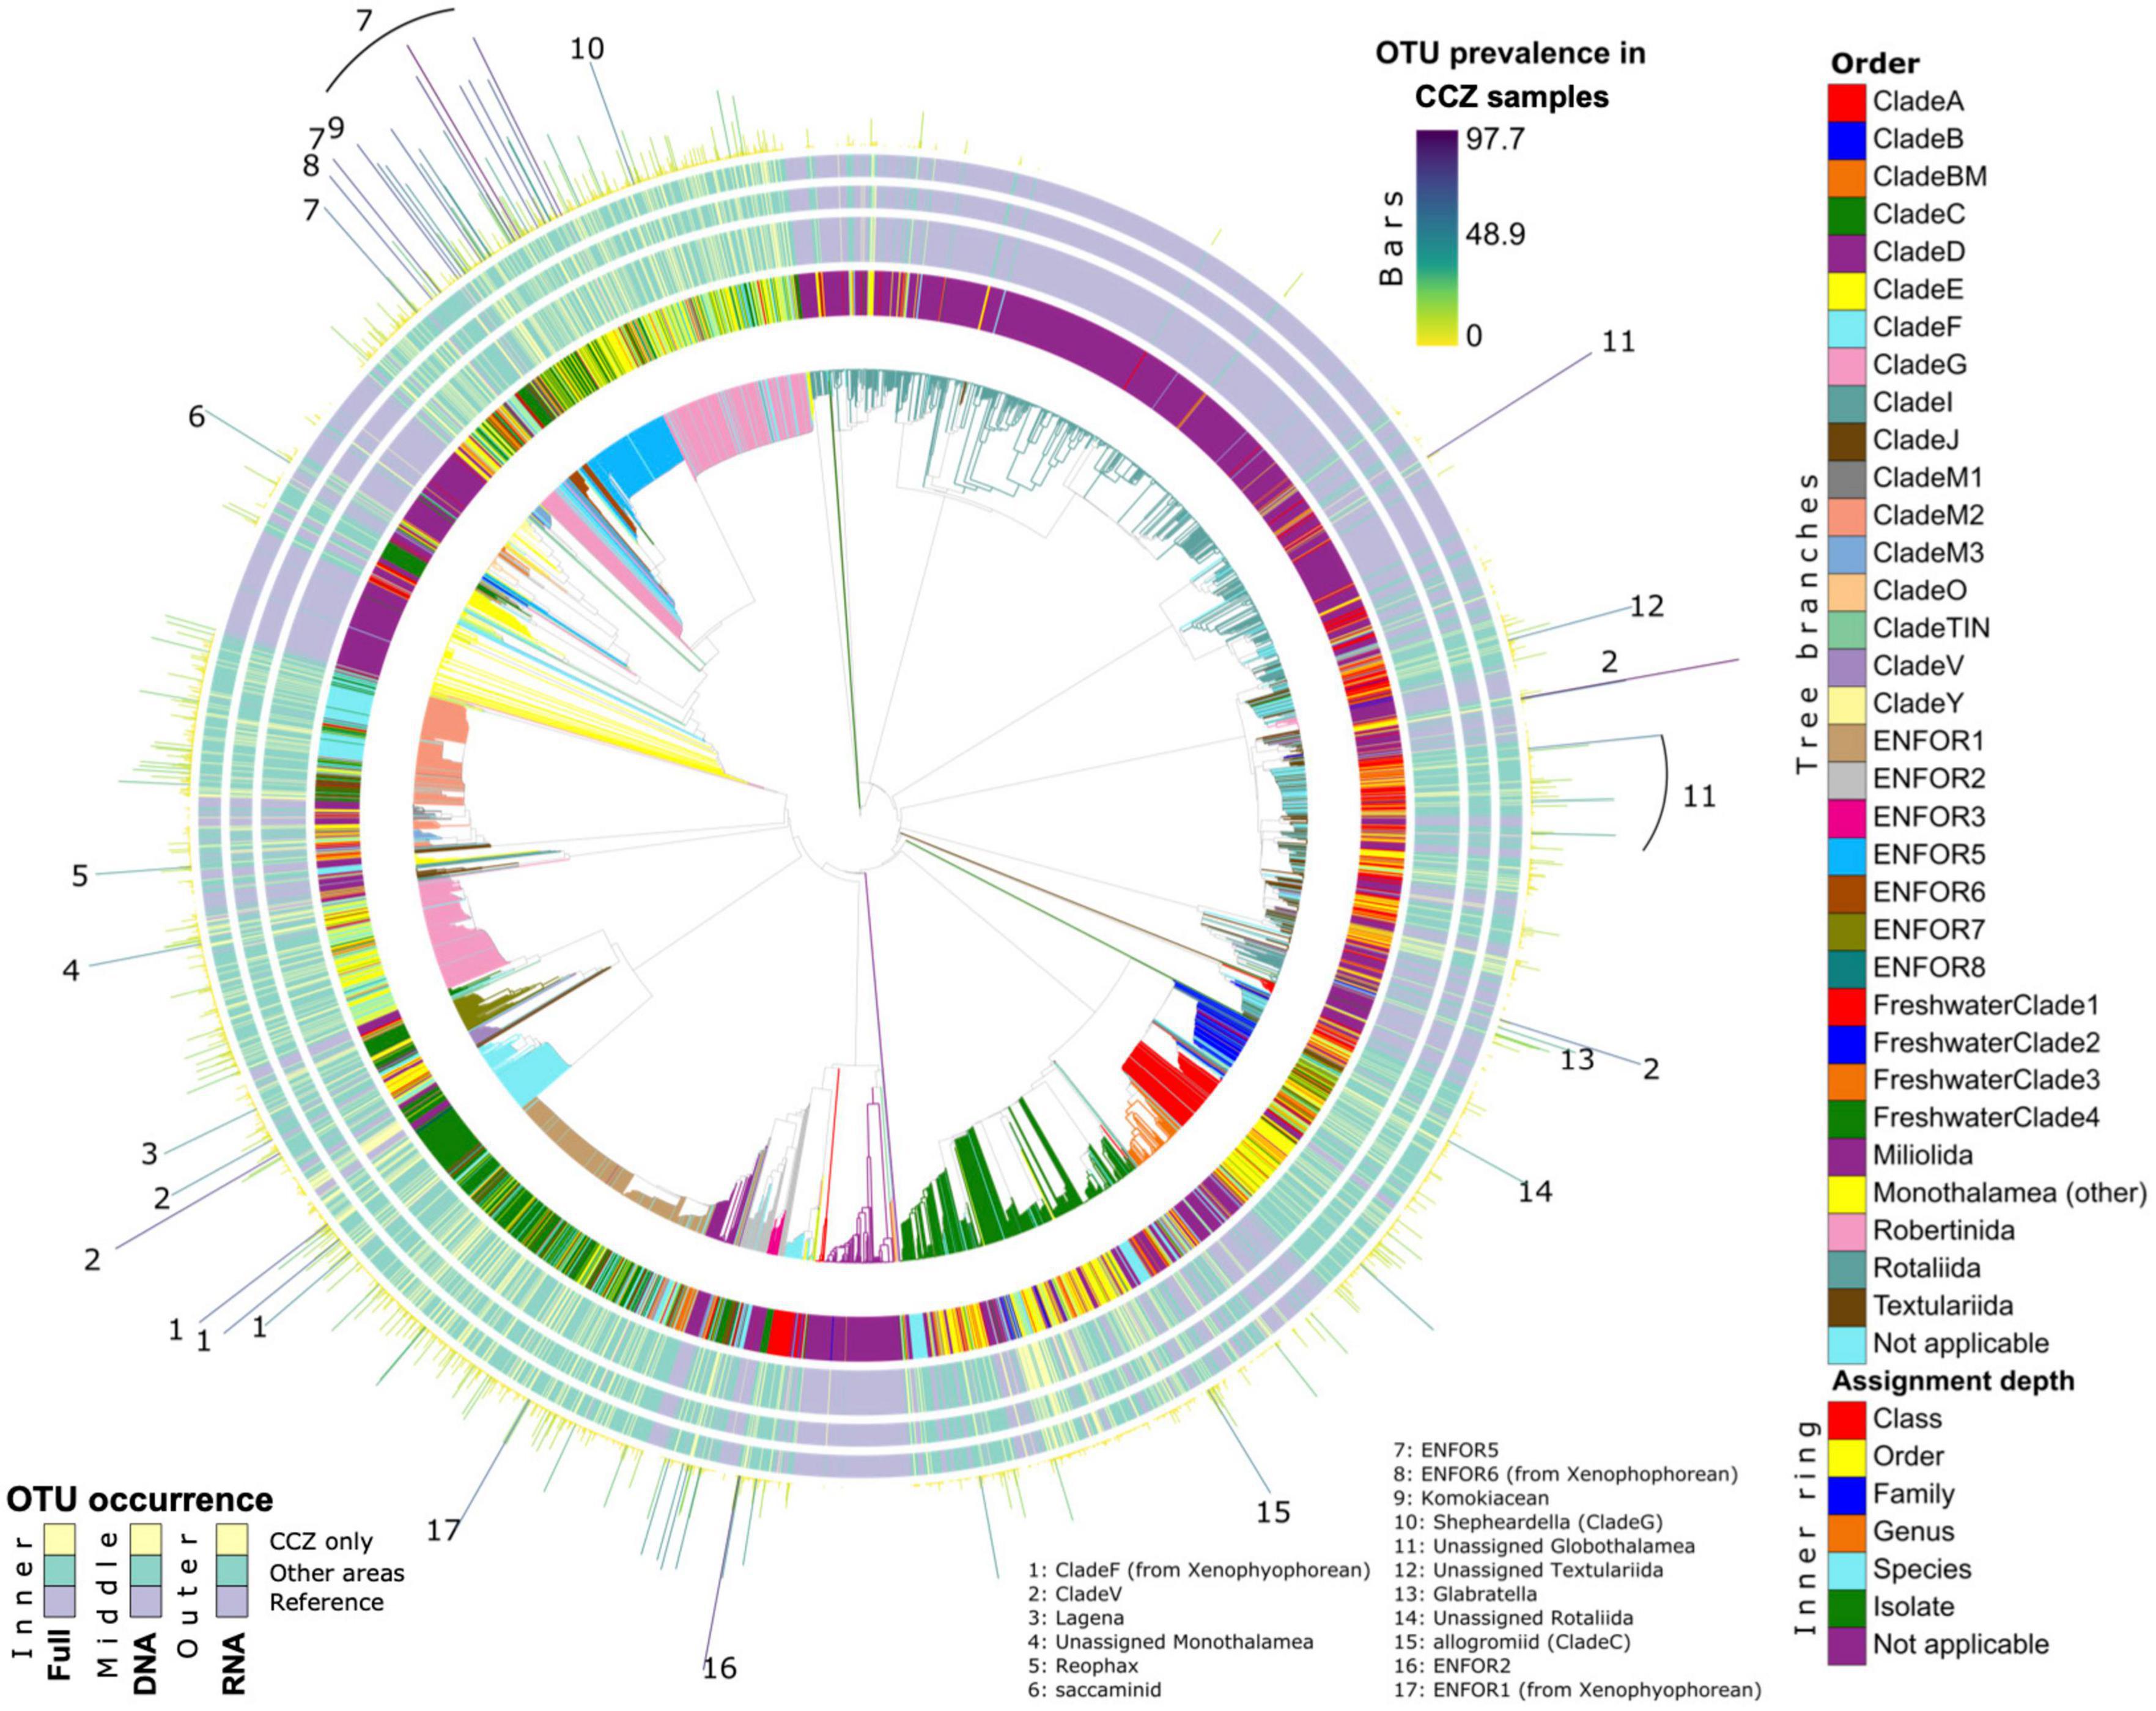
Figure 4. Phylogenetic diversity and novelty of Foraminifera OTUs. The Foraminifera phylogeny is shown, expanded with 37F OTUs placements from this study. All legends similar to Figure 3.
All metazoan clades recovered in Sinniger et al. (2016) are also found in the present study (Figure 3). The taxon that dominates in all deep-sea samples is the phylum Nematoda, the OTUs of which (in light blue) cover almost half of the tree (Figure 3). Some of them are assigned to species or genus level but many remain at order level. Another frequently occurring group is the Arthropoda (in dark blue), generally assigned to family level. Most of them belong to the class Maxillopoda, which includes the benthic harpacticoid and planktonic calanoid copepods. Next to the arthropods in the tree are annelids (in red) that also represent a highly diversified group, but with few OTUs assigned to genus or species level. The platyhelminthes/xenacoelomorphes (in dark green) branch separately and are assigned principally to the class level. The platyhelminthes/xenacoelomorphes branch closely to several unassigned sequences (in pink), which possibly also belong to this group.
An important proportion of metazoan OTUs are unique to the CCZ (Figure 3, yellow in inner ring). Many of them can be found among annelids and platyhelminthes/xenacoelomorphs. They are represented either in DNA or in RNA, but rarely in both datasets. Only a few OTUs have been found to be highly prevalent in CCZ samples (bars). Most of them belong to nematodes, but there are also a few hydrozoans, annelids, and platyhelminthes/xenacoelomorphes that are highly prevalent in the CCZ.
The phylogenetic placement of Foraminifera OTUs results in quite a different image (Figure 4 and Supplementary Figure 10A), mainly because the reference tree comprises several taxonomic groups represented by shallow-water species. This applies particularly to the class Globothalamea and monothalamid Clade E, as well as the freshwater and soil clades. Compared to Metazoa, many foraminiferal sequences are highly prevalent in CCZ samples (both with DNA and RNA) and notably the environmental clades ENFOR5 and the highly diverse ENFOR1. High prevalence in the CCZ is also observed in Clades V and F. All these clades are dominated by undescribed monothalamous species, often represented by environmental sequences only. On the other hand, the CCZ foraminiferal dataset contains very few OTUs assigned to Clade C, despite the fact that this clade comprises the megafaunal xenophyophores, which are common in the CCZ.
Uniqueness of CCZ Areas
Areas within the CCZ region are distinct from the other regions studied in terms of exclusively shared OTUs, with 1,124 37F OTUs and 2,230 V1V2 OTUs (Figure 5) representing 19.8 and 14% of the CCZ OTUs, respectively. The numerous OTUs shared between UK-1B and OMS, the most-heavily sampled areas, are also rare in terms of sequence read abundances and half of them were detected both using eDNA and eRNA (Figure 5 and Supplementary Figure 12). Among other regions, only the three Southern Ocean areas share relatively high numbers of OTUs that are unique to this region. This is especially true for the two stations exposed to high chlorophyll exports in the 37F dataset (HC_AEP and South Georgia), but less so in the V1V2 dataset where there are half the numbers of shared OTUs than in closely located areas (HC_AEP and HC_BEP). Interestingly, the CCZ areas also share exclusive OTUs at several intersections with the Kuril-Kamchatka area (Northwest Pacific region), although the number of shared OTUs is much lower than between CCZ areas.
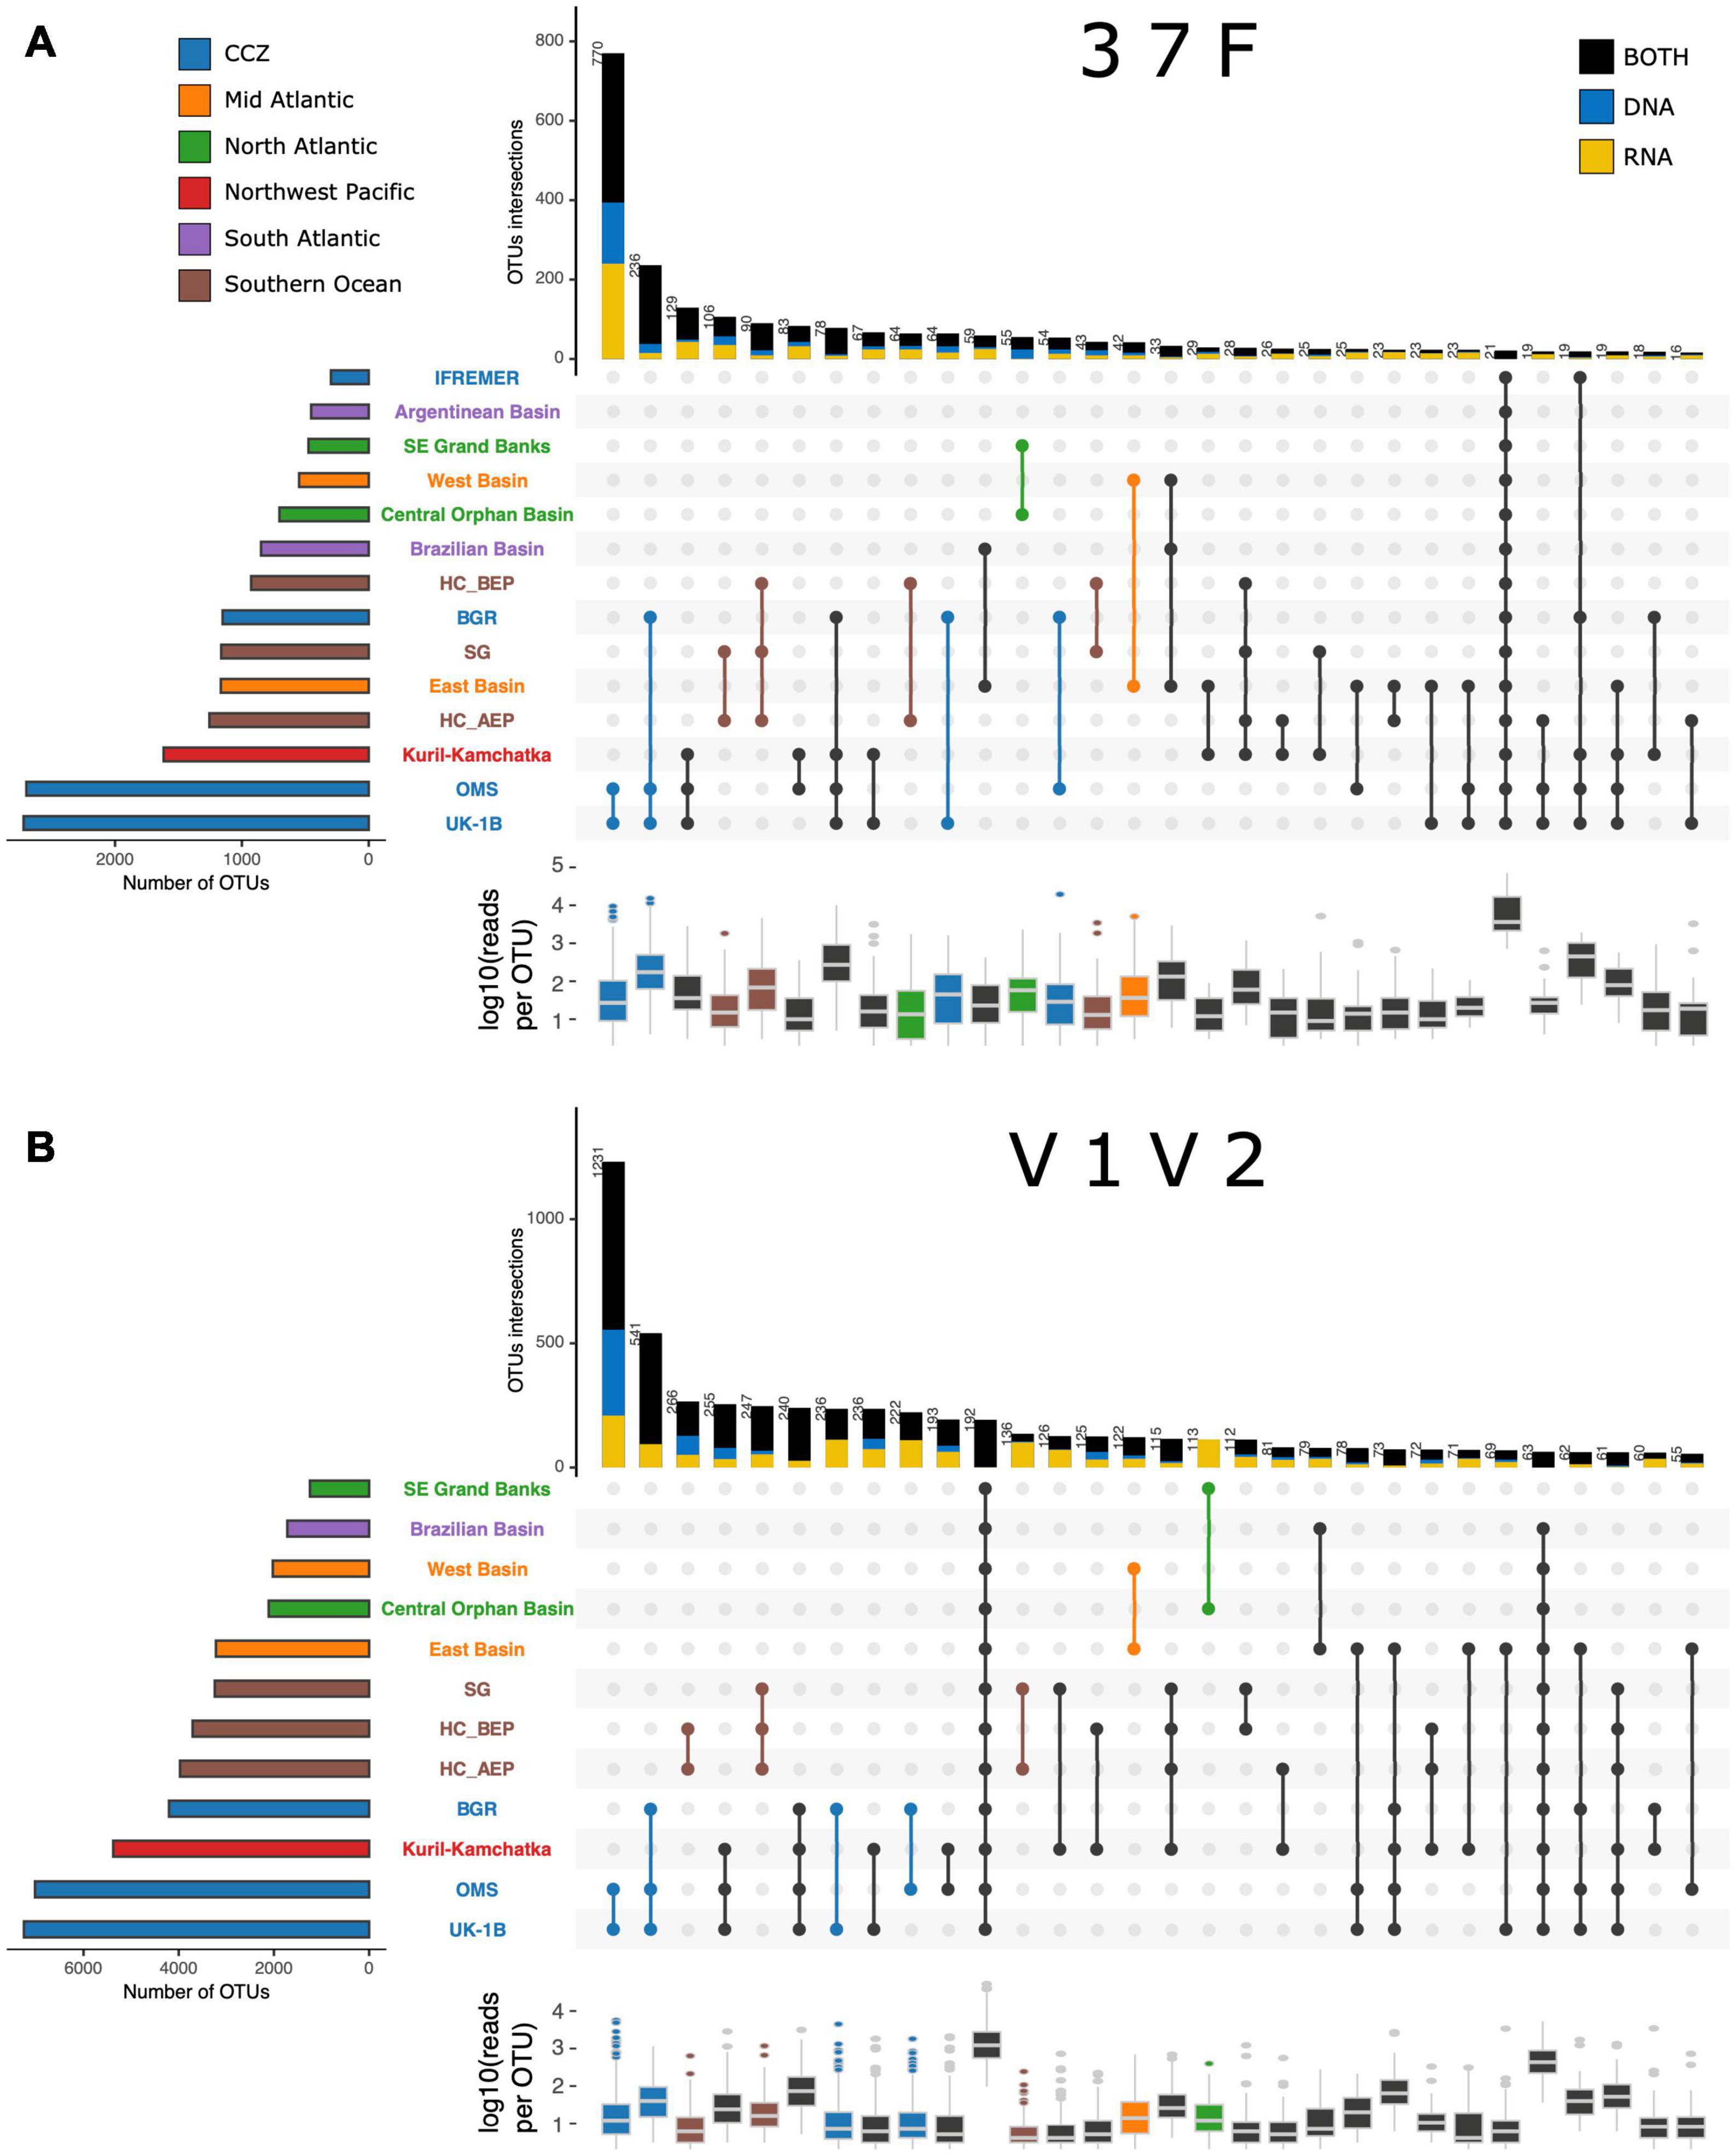
Figure 5. Diversity specific to region intersections. Number and read frequencies for (A) the 37F (benthic) and (B) the V1V2 (all taxa) OTUs shared at different intersections of regions (matrix rows). Only the 30 intersections that are the largest in terms of numbers of OTUs are shown, and ordered by decreasing OTU numbers. The bars on the top panel indicate the number of OTUs in the intersection denoted by the connected dots on the middle panel. Bars are colored according to molecule (blue: DNA; yellow: RNA; black: both). The bars on the left panel indicate the total number of OTUs in each area (or station), while the box plots on the bottom panel indicate the distribution of reads in each OTU per intersection.
There is a relationship between the number of reads in an OTU and the number of areas in which it occurs (Figure 5, box plots). Moreover, highly prevalent OTUs are detected by both DNA and RNA, which is also the case for the many OTUs present at all stations within each CCZ area (Supplementary Figure 12, box plots). Besides these cosmopolitan, high-frequency OTUs, the most important OTU intersections within CCZ areas are between pairs of stations, including OTUs only detected using DNA or RNA molecules (Supplementary Figure 12). Notably, any two stations within UK-1B and OMS strata tend to share between 10 and 15 exclusive 37F OTUs that can be represented by hundreds of reads (Supplementary Figures 12A,B). This number of OTUs exclusive to pairwise CCZ station intersections is higher for V1V2 (c.a. 40–100) than for 37F, and for OTUs associated with fewer reads (Supplementary Figures 12D,E).
Alpha Diversity
Different levels of alpha diversity characterize the benthic foraminiferal and eukaryotic communities at each spatial scale. Overall across datasets, this is seen more clearly when using Faith’s PD (PD) compared to Shannon’s entropy (H’) and in most cases when using DNA (Supplementary Figure 13). For 37F, only the difference between regions using H’ and RNA was not supported statistically, while other significant tests showed the largest difference effect using DNA at the region (Kruskal–Wallis H = 29.1 for PD; 17.8 for H’) and area (H = 105.3 for PD; 77.3 for H’) scales compared to RNA (for PD: H = 16.8 and 36.7 at region and area scales, respectively). Interestingly, this effect size was slightly larger using RNA for 37F PD at local scales, such as between stations (H = 76.7 for DNA; 82.1 for RNA) and deployments (H = 63.4 for DNA; 67 for RNA). For V1V2, the trend remains that RNA does not show alpha diversity difference between regions (for both indices), whereas it yields a greater difference between areas (H = 23.5 for PD; 16.5 for H’) compared to DNA (H = 36.9 for PD; 22.6 for H’). However, alpha diversity differences are much more pronounced using DNA at local scales (between stations) both for PD (H = 92.6 for DNA; 37.3 for RNA) and H’ (H = 89.9 for DNA; 35 for RNA) (all Kruskal–Wallis tests have adjusted p-values < 0.05). Also, it should be noted that for V1V2 not all areas (and stations) are compared since many DNA co-extractions failed (Table 1 and Supplementary Table 2). For the CCZ, DNA and RNA yield similar levels of alpha diversity for V1V2, whereas for 37F, the diversity of DNA is higher than that of RNA, but only using Shannon’s entropy (Figure 6A and Supplementary Figures 14, 15A). Hence, we restricted the following analyses to Faith’s PD index.
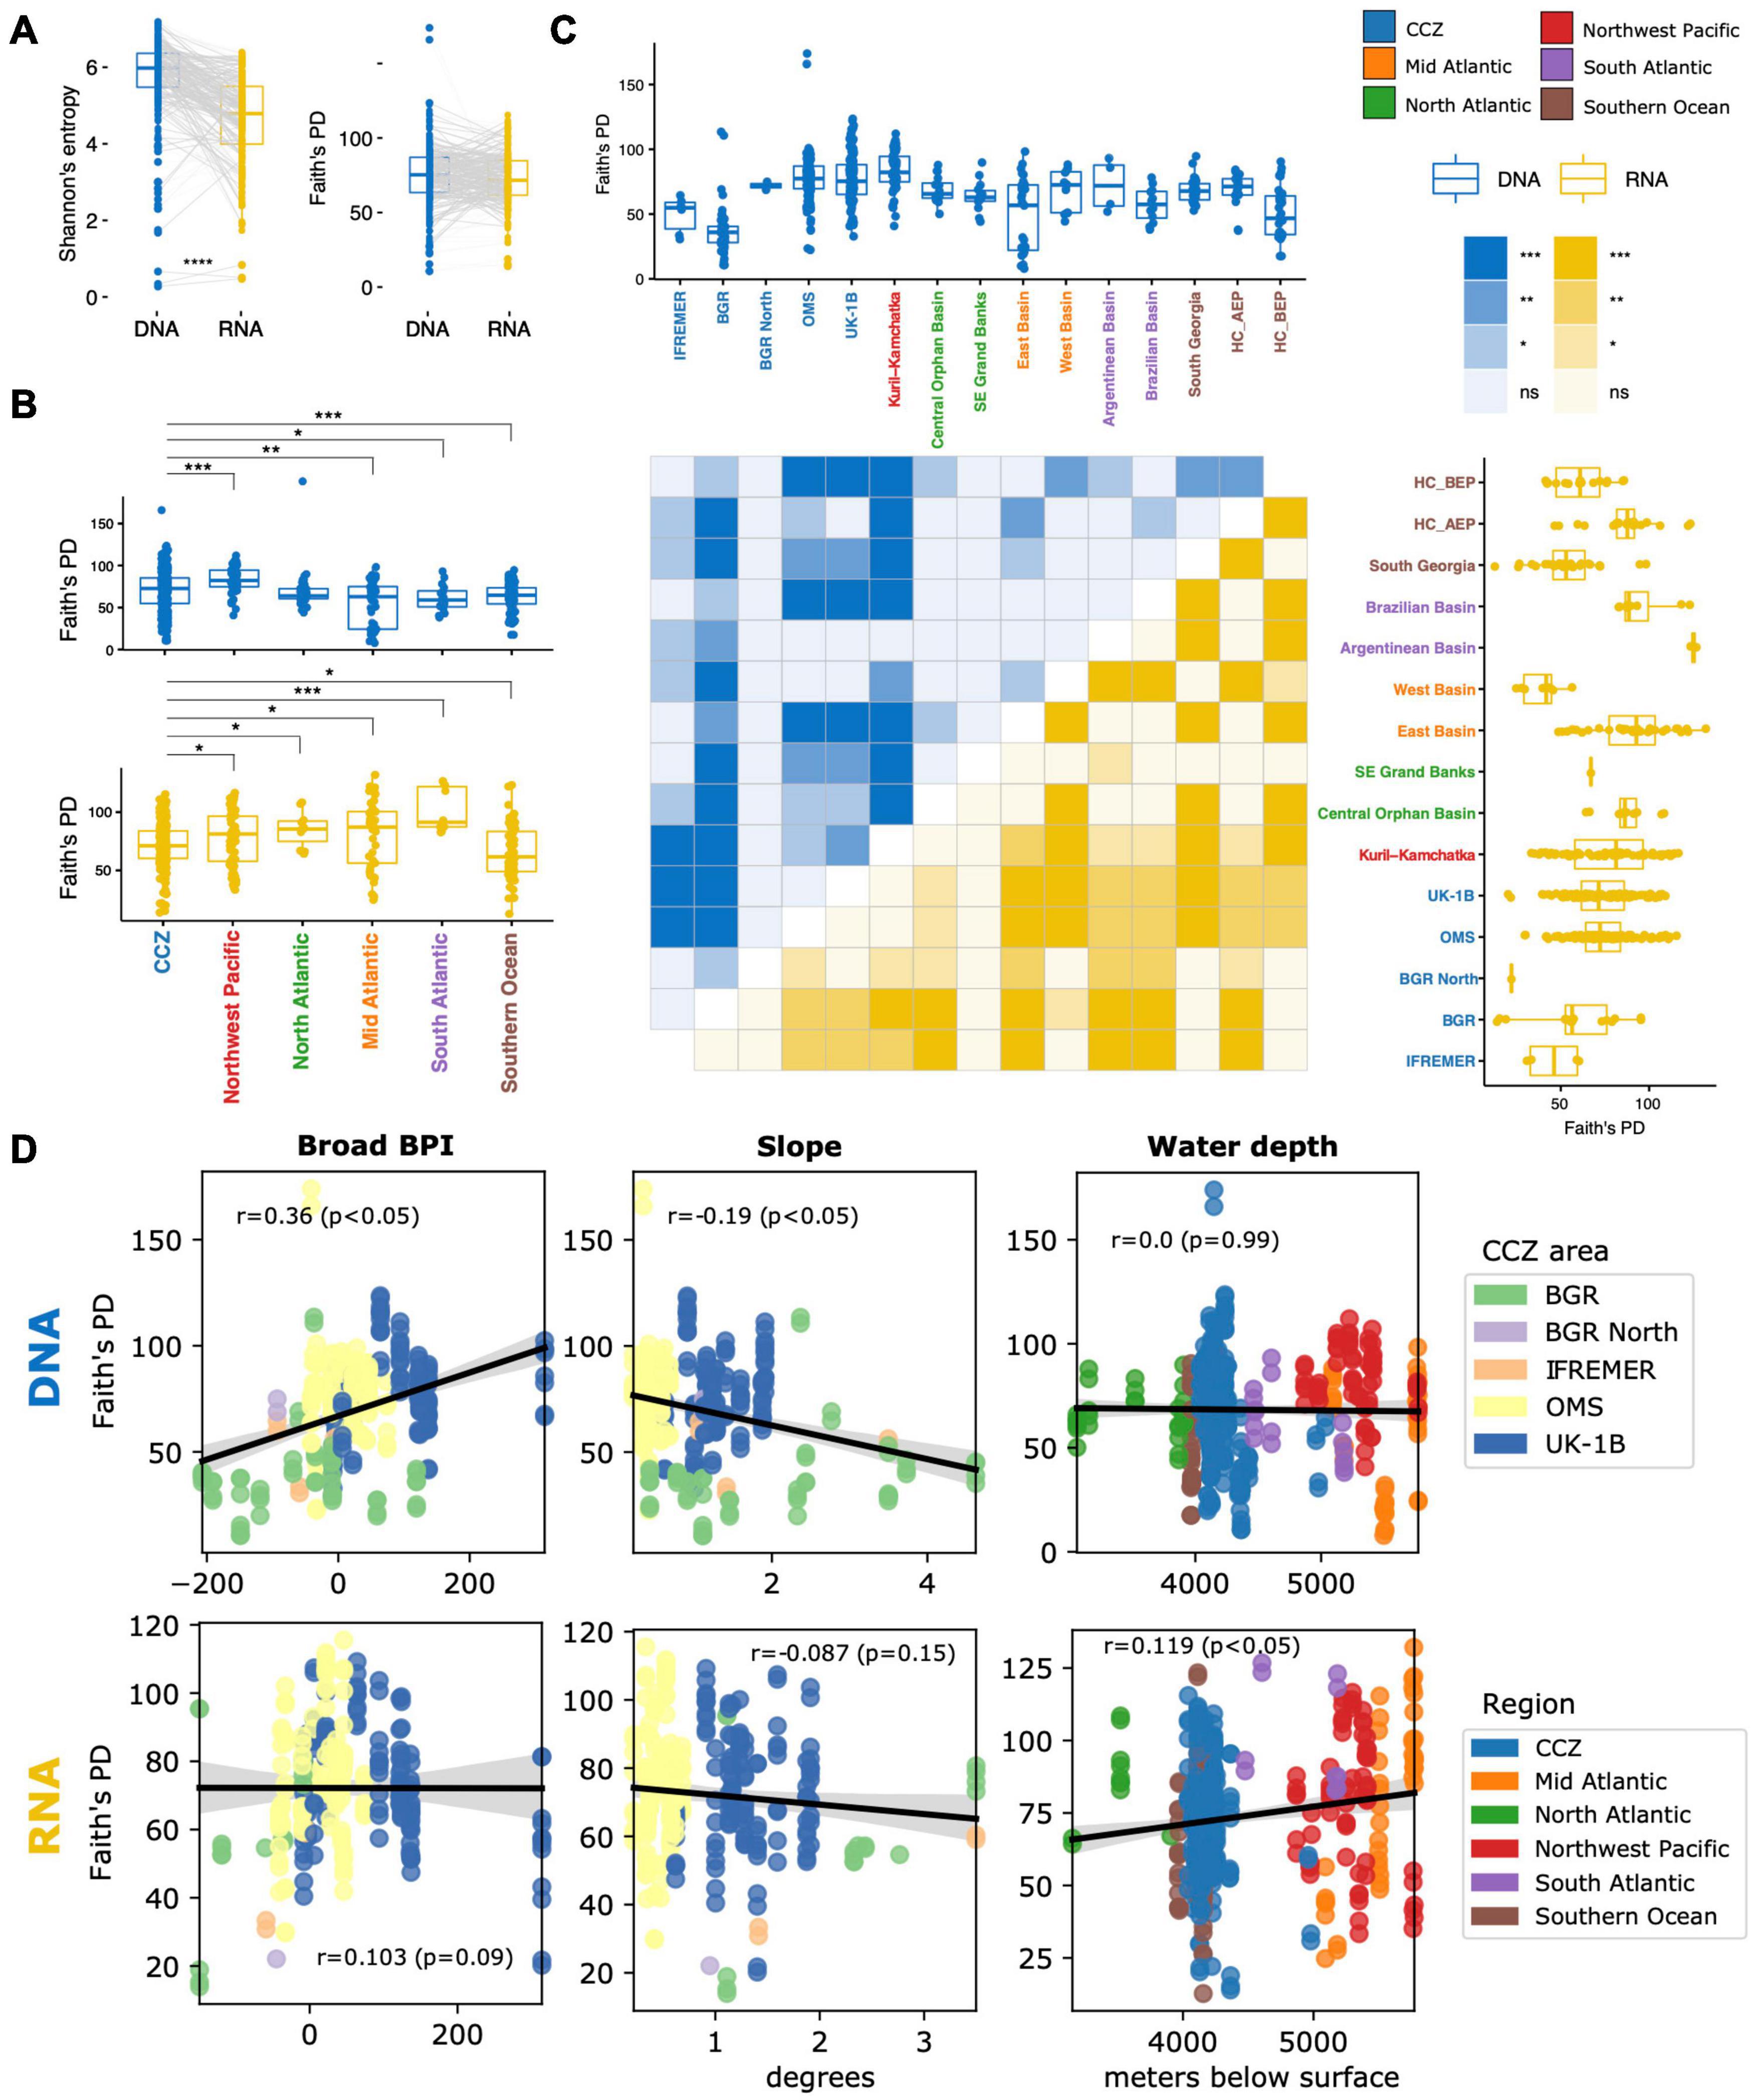
Figure 6. Alpha diversity comparisons between molecules, regions and areas, and correlations with environmental variables for the Foraminifera dataset. (A) Paired Kruskal–Wallis test between DNA and RNA alpha diversity indices within the CCZ. Gray lines indicate same-sample paired comparisons. Pairwise post hoc tests separately for the DNA and RNA samples to compare the Faith’s PD alpha diversity between individual regions (B) and areas (C). Significant differences between regions are shown using box-to-box connectors (B) whereas for areas, these are indicated in the heatmaps (blue triangle: within-DNA comparisons; yellow triangle: within-RNA comparisons). (D) Spearman correlations between the Faith’s PD alpha diversity of DNA or RNA samples and environmental variables in the CCZ. Slope and Broad BPI are only available for the CCZ region whereas water depth is shown across regions. Spearman’s rho statistics and p-values are indicated on insets. ***p-value ≤ 0.01; **p-value ≤ 0.03; *p-value ≤ 0.05; no label/ns: p-values > 0.05; no color (heat map): no testing. Results for the V1V2 dataset are shown in Supplementary Figure 15.
Alpha diversity in the CCZ differs from that of every other region as assessed by post-hoc pairwise comparisons following Kruskal–Wallis H tests (37F: Figure 6B; V1V2: Supplementary Figure 15B). For the foraminiferal DNA dataset, the CCZ appears as the second most diverse region after Kuril-Kamchatka. Alpha diversity of the CCZ as a whole does not differ from the North Atlantic region because the diversity within its individual areas and stations (all confined to the eastern CCZ) varies significantly (Figure 6C and Supplementary Figure 16A). Indeed, the UK-1B and OMS strata have a similar, high Faith’s PD whereas the BGR and IFREMER areas have very low values for this index (there were too few samples for testing against BGR North). In fact, the BGR stations exhibit consistently lower DNA diversity values than all other CCZ stations, with the notable exceptions of the two IFREMER stations where nodule abundance was particularly high (BIO12-102KG and BIO12-86), and station SO237-3 in the West Basin in the central Atlantic (Supplementary Figure 16A). This Atlantic station is also characterized by the presence of large polymetallic nodules (see cruise report; Devey, 2015). For the eukaryotic DNA dataset, the CCZ stands out as the most diverse region (no data for BGR and IFREMER) (Supplementary Figures 15B,C). Interestingly, within-station DNA and RNA diversity vary more for Eukaryota than for Foraminifera, as is clear from the wider dynamic range of values for the former dataset (Supplementary Figures 16A vs. 16B, box plots). It also appears that between-station RNA diversity differences are more frequent for Foraminifera than for Eukaryota, as illustrated by the higher number of significant post hoc tests for the latter dataset (see dark yellow cells in heatmaps in Supplementary Figures 16A vs. 16B).
Foraminifera 37F alpha diversity in the CCZ is associated with topography, but only for DNA (Figure 6D). Faith’s PD was positively correlated with Broad BPI (Spearman’s rho = 0.36, p-value < 0.05) and negatively with seafloor slope (rho = −0.19, p < 0.05). Eukaryota V1V2 alpha diversity is also associated with topography for DNA, but only with Fine BPI (Spearman’s rho = 0.23, p-value < 0.05) (Supplementary Figure 15D). In relation to water depth, the Foraminifera RNA diversity exhibits a positive but weak correlation with increasing depth (rho = 0.119, p-value < 0.05). Conversely, only DNA associates with depth for the Eukaryota, in a stronger negative correlation (rho = −0.222, p-value < 0.05) (Supplementary Figure 15D).
Beta Diversity
For both Foraminifera and Eukaryota, the CCZ samples form clusters on the Robust PCAs that are well separated from the samples of other deep-sea regions (Figures 7A,B), except for the Mid Atlantic samples that intermingle to some extent with the CCZ samples in the case of V1V2 (Figure 7B). Strikingly, the DNA and RNA samples also formed two larger clusters, each of which shows separate groupings of CCZ samples. We therefore performed RPCA on DNA and RNA separately (as for alpha diversity analyses). For both 37F and V1V2, this also resulted in grouping samples according to region, and even areas, with the notable exception of CCZ areas, which formed a large and highly variable cluster (Supplementary Figure 17). Indeed, the beta diversity that we demonstrate within the CCZ is far from being representative of all that can be sampled there, as indicated by the dissimilarity-decay curves that do not saturate to an asymptotic minimum for both 37F and V1V2 and both for DNA and RNA (Supplementary Figure 18). Unsurprisingly, this pattern holds when sampling globally, with an increased baseline value of added beta diversity (Supplementary Figure 18, see “All samples”).
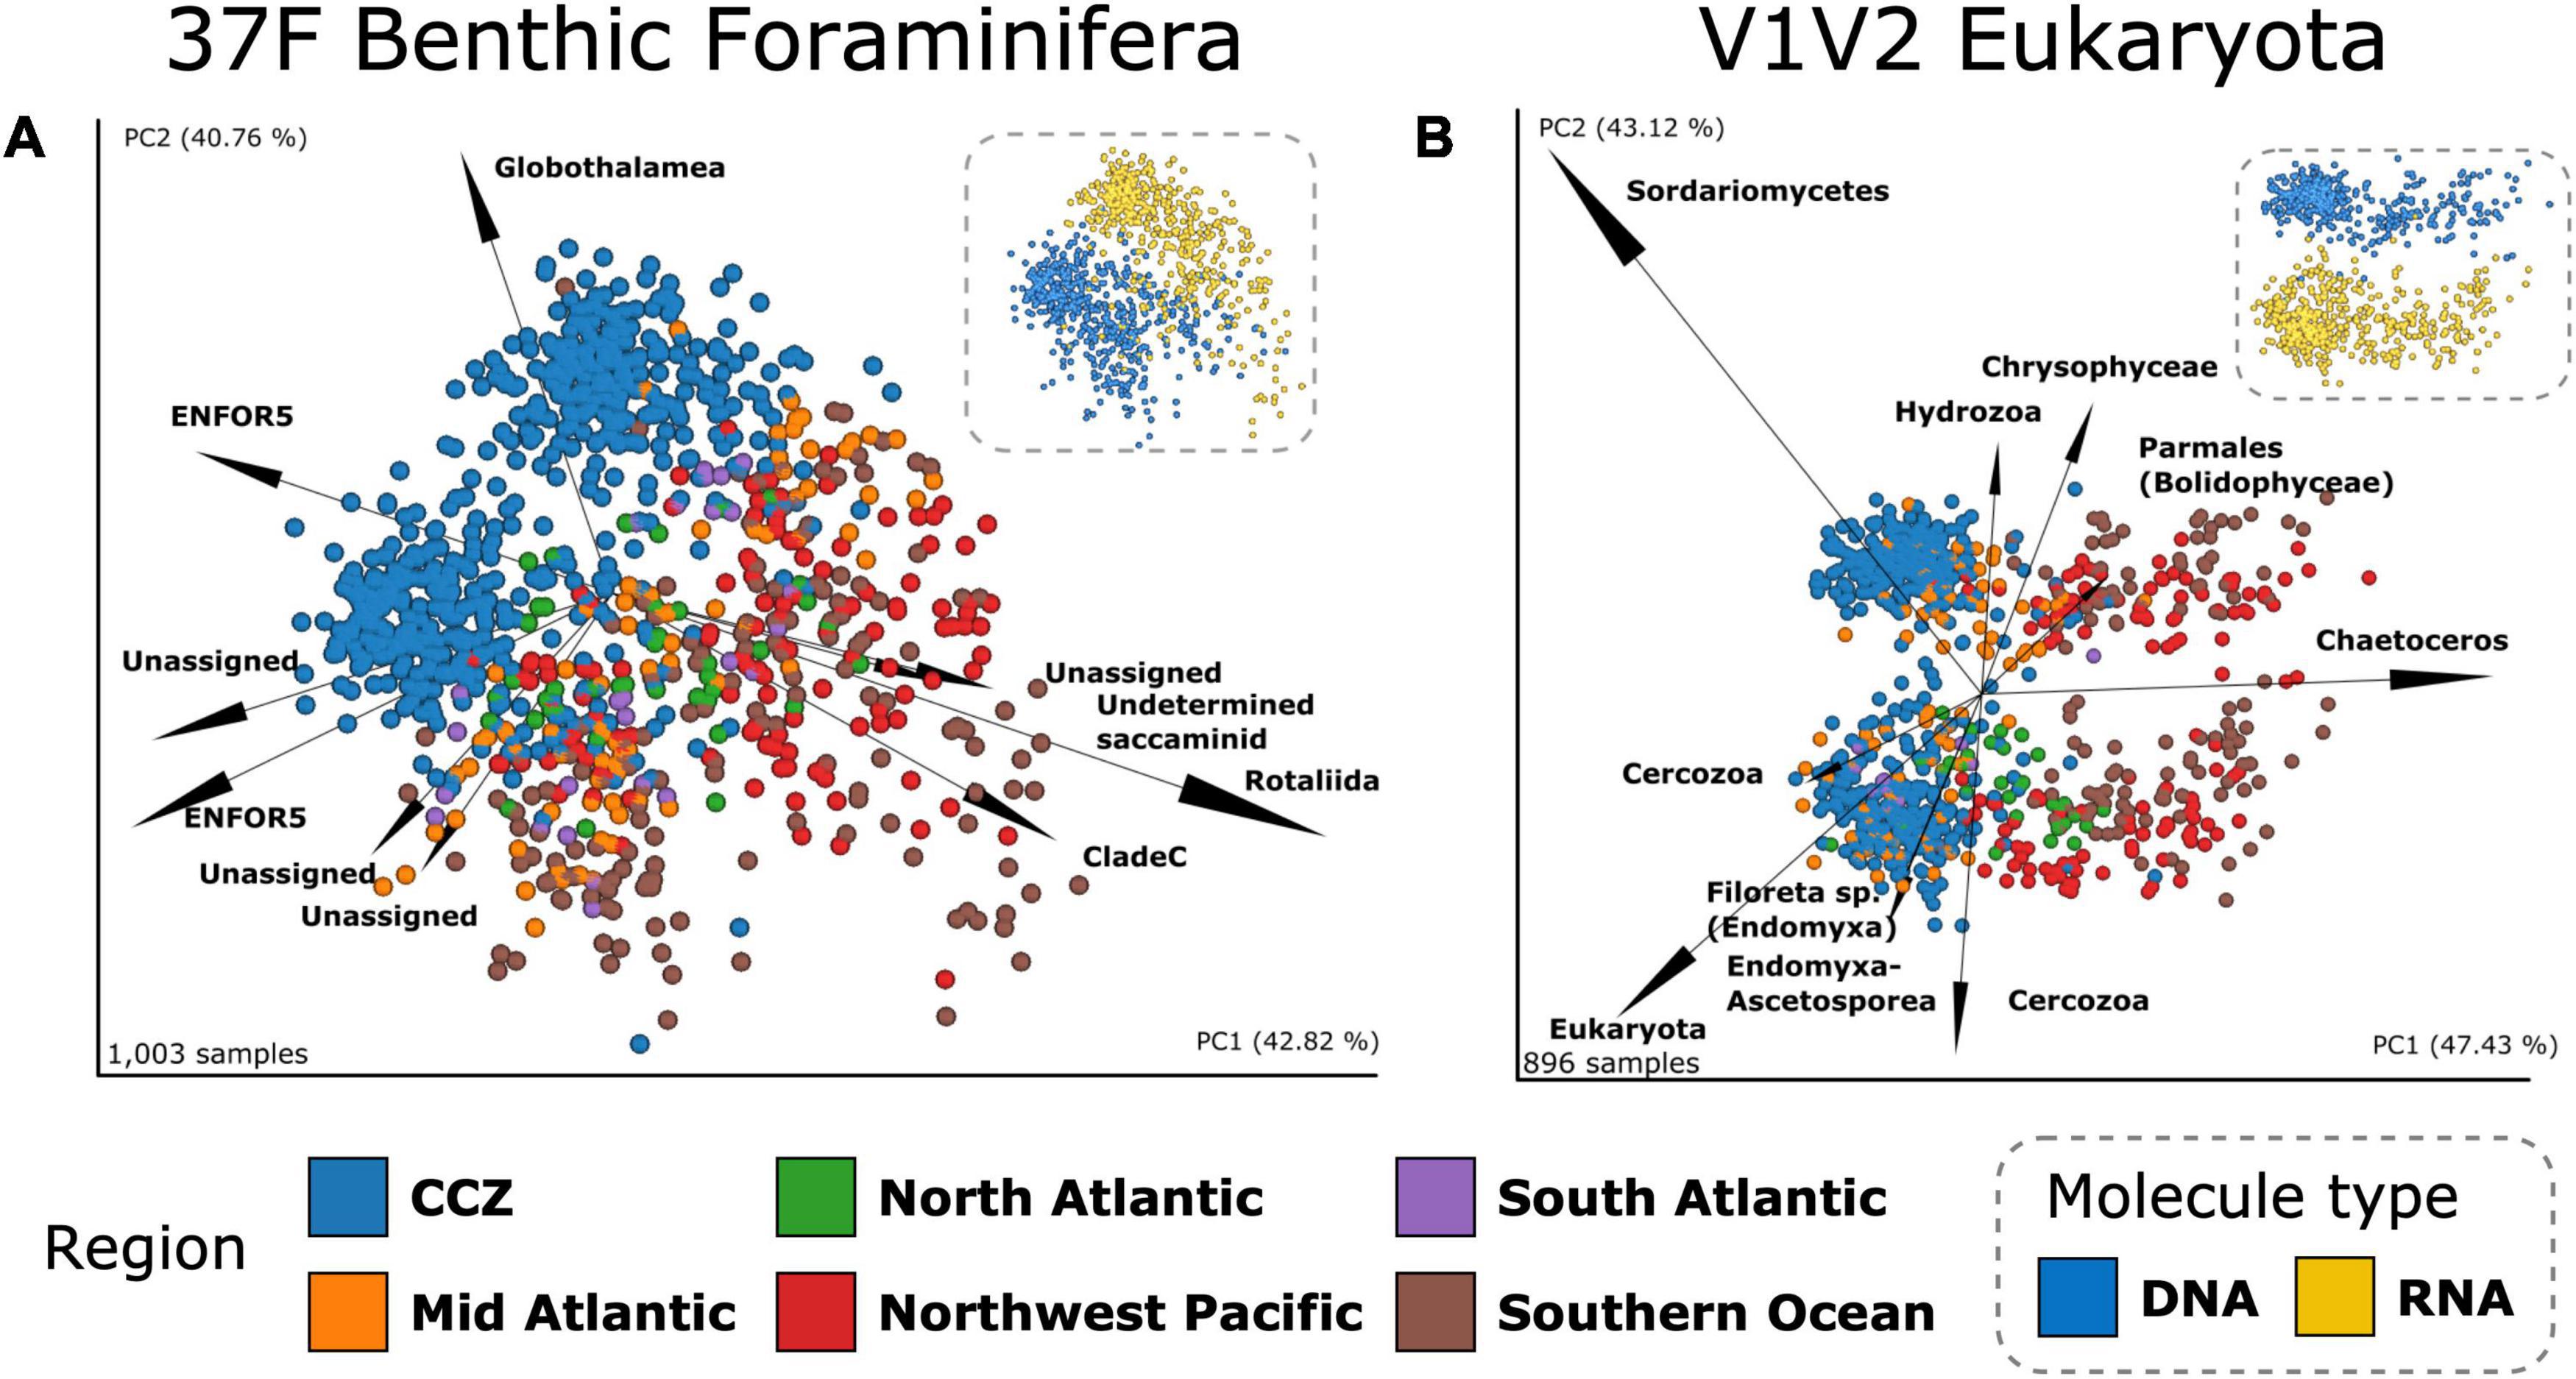
Figure 7. Deep-sea benthic communities beta diversity. Robust PCAs based on the Aitchison metric for (A) the 1,003 37F samples (B) the 896 V1V2 samples. PCR-amplified samples (scatter), are colored according to region and the top 10 most influential OTUs biplots (arrows) are labeled with their deepest taxonomic assignment. Insets represent the same RPCAs but colored according to molecule type. The percentages indicated for PC1 and PC2 are large because they represent the variance explained in the three first dimensions.
For 37F, the separation between CCZ and Atlantic areas is driven by several ENFOR5 OTUs and several Unassigned OTUs pointing for DNA in these different, respective area directions whereas for RNA, it is two Unassigned and one poorly assigned Globothalamea OTUs that characterize CCZ samples, as opposed to two Rotaliida OTUs that are strongly associated with OTU-rich Atlantic samples. In the case of V1V2, it appears that for the DNA RPCA ordination, two OTUs assigned to the diatom Chaetoceros (pelagic) acting in one direction, and an OTU assigned the fungal taxon Sordariomycetes acting in the opposite direction, drive the separation along the first axis (PC1), i.e., the separation of Kuril-Kamchatka, Southern Ocean and CCZ samples (these taxa were already most influential with both DNA and RNA on the RPCA, Figure 7B). For the RNA ordination, the CCZ and Southern Ocean separate under the influence of an unassigned eukaryotic OTU and a Fungi OTU (along PC1) whereas a diversity of Cercozoa OTUs (including some assigned to Endomyxa-Ascetosporea parasites), and two OTUs assigned to Radiolaria (pelagic), strongly influence sample separation along the second axis (PC2).
No clear clustering of the areas results from the RPCAs based on the Metazoa subset, except for DNA where one Annelida OTU drives the separation between UK-1B and OMS samples and most of the Southern Ocean samples (Supplementary Figure 17). Beta diversity comparisons, performed before and after removal of non-Metazoa OTUs using Mantel tests on dissimilarity matrices or PROTEST on three-dimensional ordinations, revealed that the beta diversity changed considerably as a result of this filter. Mantel’s r correlations were 0.65 and 0.59 for the Aitchison metric on DNA and RNA matrices, respectively, with an even lower procrustes PROTEST fit of ca. 0.4 for both DNA and RNA (Supplementary Table 9). Nevertheless, a relatively good conservation of the beta diversity pattern was achieved using the Jaccard binary metric (Mantel’s r = 0.75 and PROTEST’s 1-M2 = 0.78, all p-values < 0.001, Supplementary Table 9).
Differences between regions, areas and stations were statistically supported for each dataset in PERMANOVA performed on the Aitchison metric (DNA Pseudo-F37F/V1V2 = 20.44/20.43; RNA Pseudo-F37F/V1V2 = 16.03/16.43; all p-values < 0.001) and for all other beta diversity metrics (Supplementary Figures 19A–C). However, the dispersion of the samples within each group was also significantly different between groups, except for the phylogenetic beta diversity metric Weighted UniFrac, which yielded the greatest difference between regions using DNA (Pseudo-F = 35.54, p-value < 0.01). We also tested for differences between areas and stations within the CCZ only and found statistical support unaffected by PERMDISP dispersion for comparisons based on DNA among 37F stations and V1V2 areas (PERMANOVA Pseudo-F = 4.027 and 3.194, respectively, both p-values < 0.001, Supplementary Figures 19B–D).
Spatial Heterogeneity
Since PERMDISP testing revealed differences in group dispersions and notably for stations, we calculated as a measure of local heterogeneity the distances to centroids for samples from each station on 37F CCZ RPCAs (for DNA and RNA separately, see section “Materials and Methods”). Since stations associated with steeper slopes seem more dissimilar on these RPCAs (Supplementary Figure 20), we plotted these distances to station centroids on bathymetric maps of the CCZ strata UK-1B and OMS (Figure 8A). Communities at stations located in depressions (i.e., associated with low Broad BPI values, blue background) were systematically more variable, as indicated by higher values for the distances to centroids in terms of average and standard deviation values (green circles). This relation was highly pronounced for the DNA samples and in the OMS stratum where distances to stations centroids increased with BPI, yielding more variable communities locally. Overall, the distances to station centroids computed based on the compositionally robust Aitchison metric are not different between DNA and RNA, while using the phylogenetic, Unweighted UniFrac metric, we found RNA heterogeneity to be significantly greater than DNA (Figure 8B).
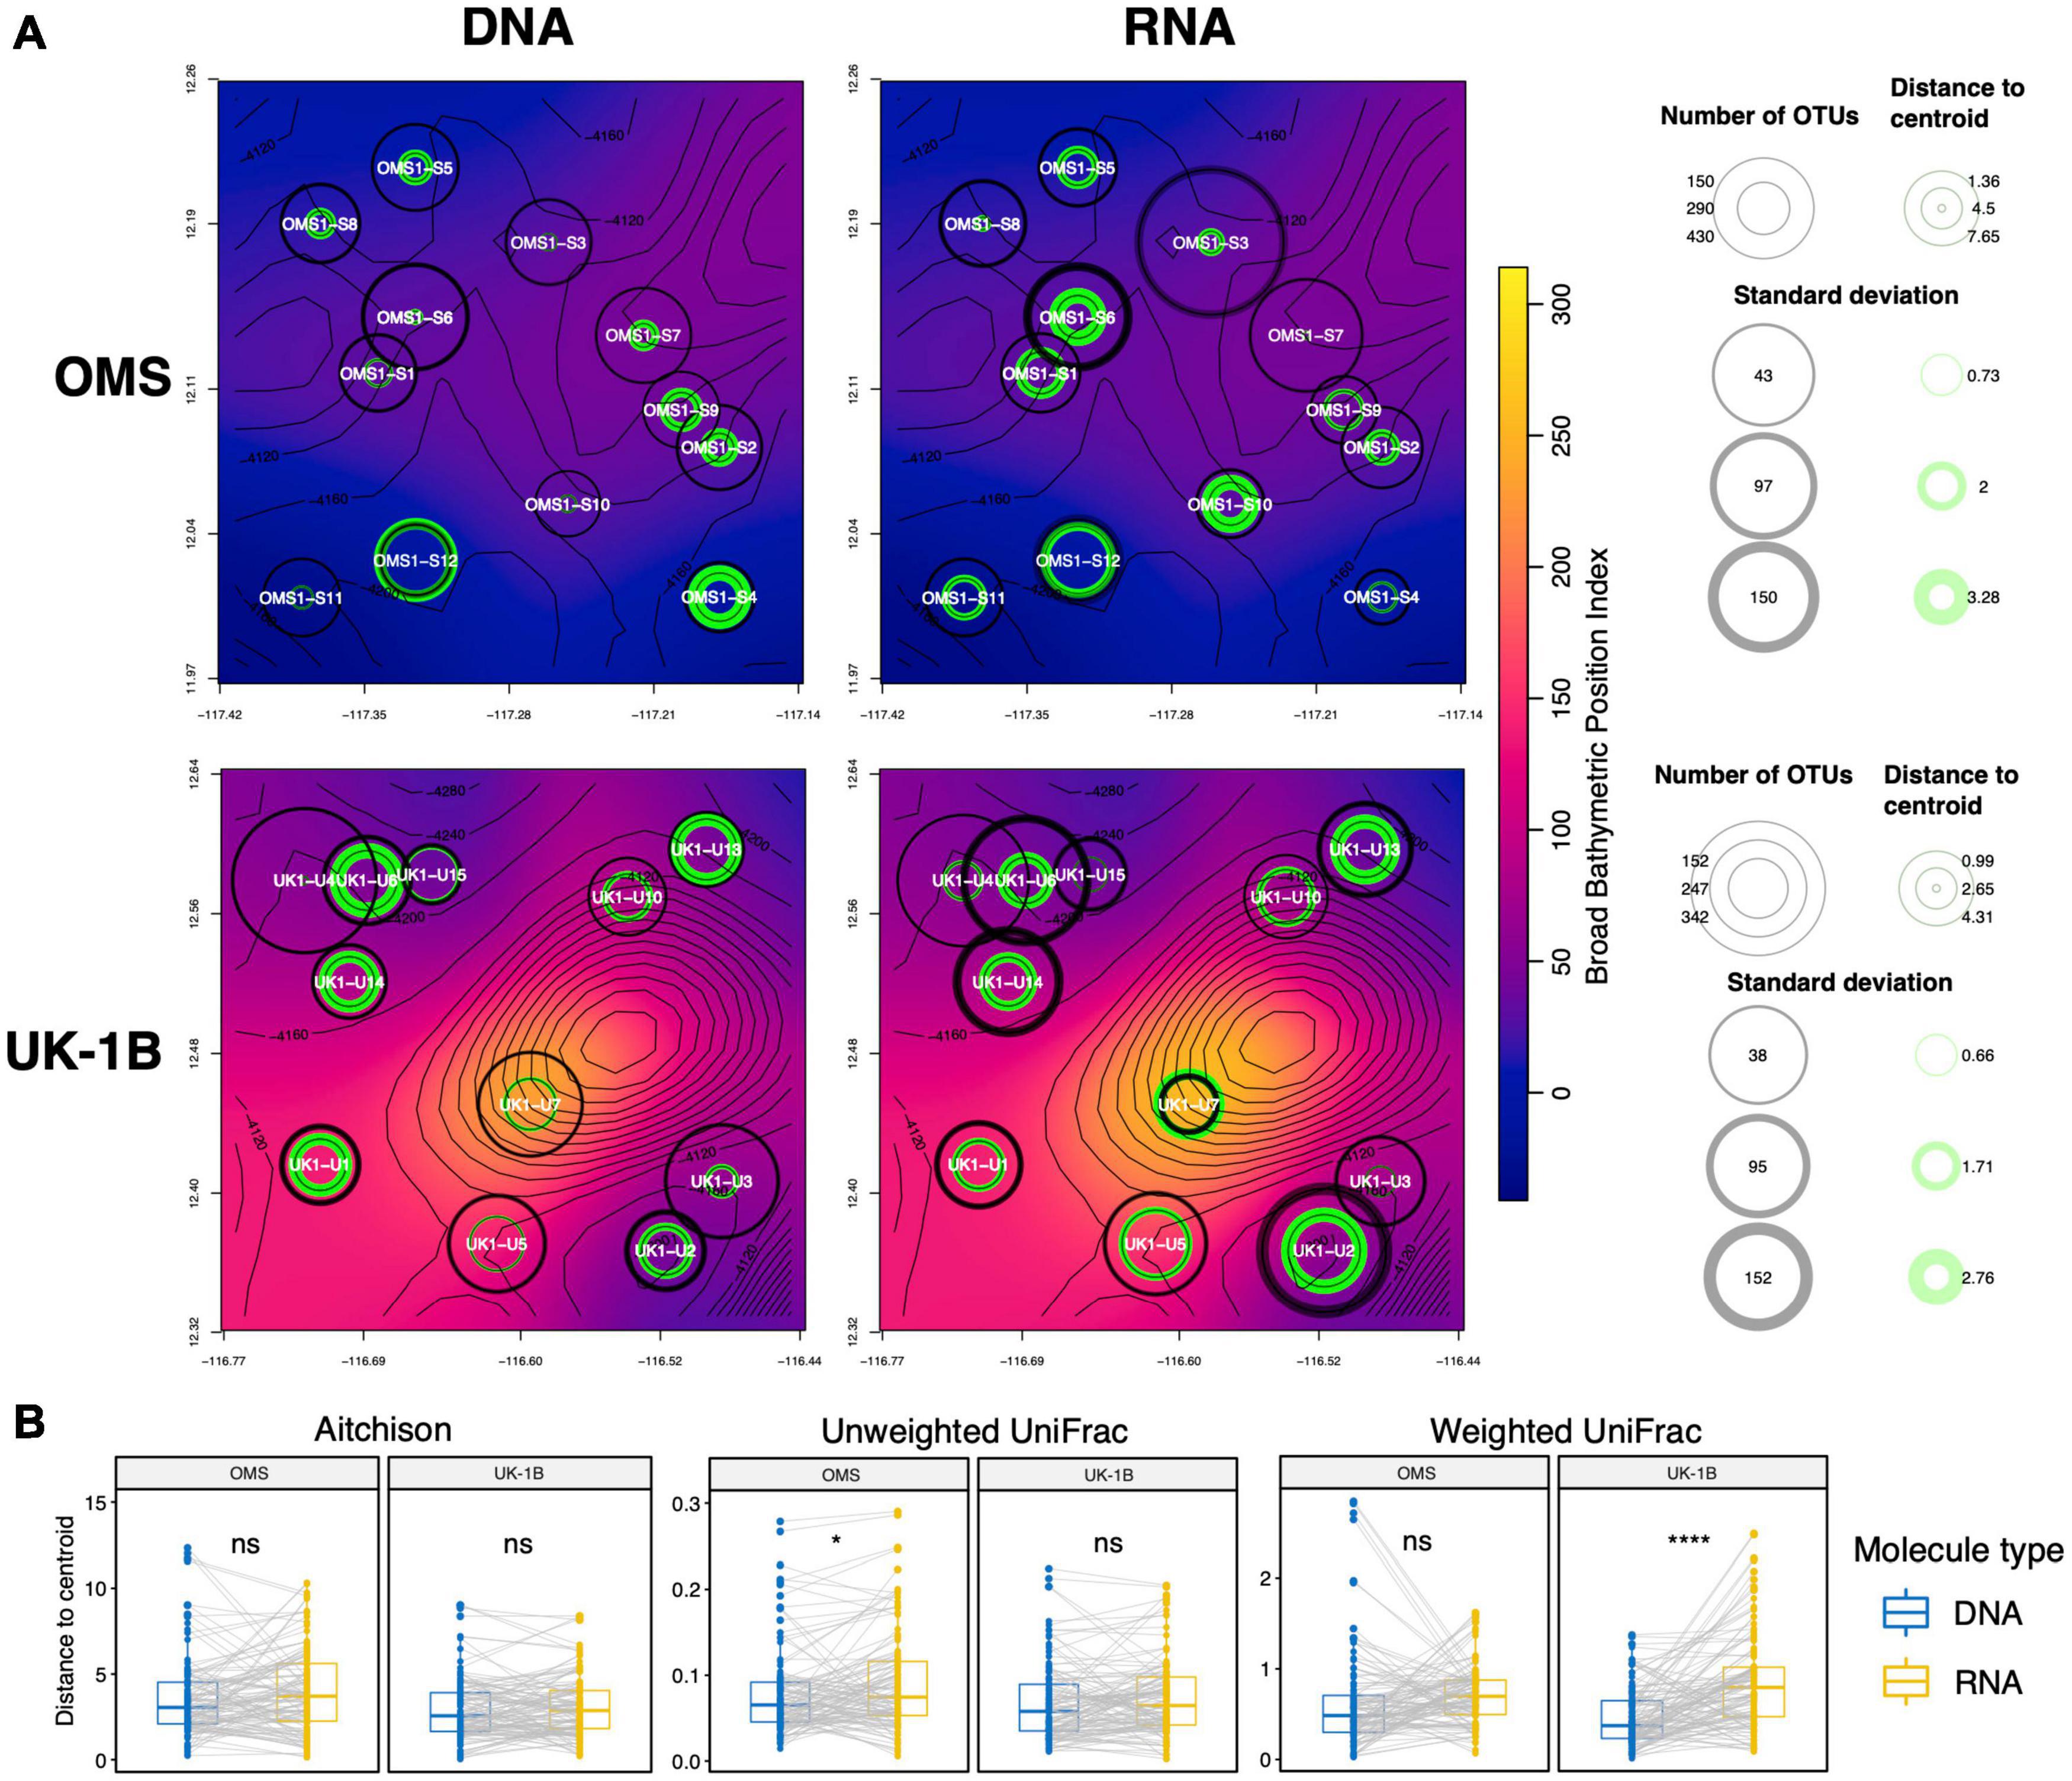
Figure 8. Spatial heterogeneity expressed in terms of station beta diversity dispersion in relation to bathymetry for the 37F dataset. (A) At each station of the UK-1B and OMS strata (CCZ), we computed the distance separating the samples to the station centroid they form in the RPCA spaces obtained separately for DNA and RNA. Average and standard deviations for these distances-to-centroids are shown at each station (max. six samples per station) of each map panel (green rings), as well as for the number of OTUs (gray rings). The background color represents the Broad Scale BPI (Bathymetric Position Index) values smoothed over the plotted area. (B) Paired t-tests comparing the distributions of distance-to-centroid values between DNA and RNA are shown for the Aitchison dissimilarity metric (also used for the Robust PCA and maps) as well as for the phylogenetic, Weighted UniFrac dissimilarity metric.
Discussion
Metabarcoding Data and the Abyss
Omics techniques allowing rapid and standardized profiling of environmental molecules may represent a powerful approach to filling deep-sea knowledge gaps (Levin et al., 2019) and addressing key goals for this decade (Howell et al., 2020). Metabarcoding, in particular, is being increasingly developed for biomonitoring purposes in marine environments (Chariton et al., 2010; Aylagas et al., 2018, 2020; Brandt et al., 2020; Le et al. in review). It has successfully documented the local impacts of marine industries, including aquaculture (Pawlowski et al., 2014; Lejzerowicz et al., 2015; Pochon et al., 2015; Cordier et al., 2018) and oil and gas extraction in coastal ecosystems (Lanzén et al., 2016; Laroche et al., 2016; Cordier et al., 2019; Mauffrey et al., 2020) where extensive ecological knowledge has allowed ground truthing. Metabarcoding has also been used for surveys of CCZ areas focusing on prokaryotic microbial communities (Shulse et al., 2017), metazoans (Laroche et al., 2020a) and allochthonous pelagic eDNA deposited in sediments (Laroche et al., 2020b).
General methodological considerations regarding eukaryotic metabarcoding have been reviewed recently (Santoferrara et al., 2020). Besides the robust multiplexing design and PCR replicates that we used to filter cross-contaminations and spurious data (Esling et al., 2015), and extraction replicates to improve diversity estimates (Lanzén et al., 2017), another commonly overlooked issue is the compositional nature of sequencing data, which includes metabarcoding (Gloor et al., 2016, 2017; Martino et al., 2019). Indeed, a simple transformation (e.g., with the Aitchison metric) allows circumventing the fact that, following sediment sampling, extraction, PCR and sequence subsampling, it is impossible to know the true total abundance of taxa in samples and thus to compare compositions on the basis of abundance (or relative abundance) (Morton et al., 2017; Knight et al., 2018). Our analyses of beta diversity turnover and dispersion were performed in PCA spaces that are robust to this effect, allowing comparison and testing. These outstanding technical aspects are particularly relevant for the deep seafloor, which is characterized by substantial small-scale faunal patchiness (Snelgrove and Smith, 2002) that is difficult to sample, particularly using metabarcoding (Lejzerowicz et al., 2014).
Although metabarcoding is an important tool that can overcome some of the limitations inherent in morphology-based studies of deep-sea biota (Le et al., in review), there are some caveats to be born in mind when considering metabarcoding data obtained in deep-sea settings. First, because the amounts of sediment analyzed are small (2–10 g), the data will be weighted toward small-sized organisms (meiofauna and smaller). Macro- to megafauna would necessarily occur only as sloughed cells, eggs, larvae, or tissue fragments, which would yield high amounts of fresh, readily amplified molecules and explain the occasional dominance of large animals when taxonomic composition is expressed in terms of the relative abundances of reads (e.g., see Craniata in Figure 2F). This caveat may also apply to some protists, notably megafaunal xenophyophores. Although these giant agglutinated Foraminifera are abundant and diverse across the CCZ (Gooday et al., 2017, 2020), no OTU was assigned to them, confirming the lack of representativeness of the metabarcoding samples for macro- to mega-fauna sized organisms.
Second, the V1V2 data also includes planktonic organisms, such as diatoms, radiolarians or calanoid copepods and hydrozoans among the Metazoa. It is well established that export fluxes deposit pelagic DNA traces, as well as entire cells, to the seafloor and that this DNA also conveys a strong biogeographic signal, as demonstrated for planktonic Foraminifera (Morard et al., 2017; Barrenechea et al., 2020). As a testament to this phenomenon, we were able recover the same clustering patterns for the CCZ and other regions using the benthic Foraminifera only, as well as the full V1V2 dataset that included a majority of planktonic sequences, as observed previously (Pawlowski et al., 2011). One compelling example is that of the Southern Ocean and Northwest Pacific regions (both highly productive), which clustered opposite to the CCZ (least productive), a separation associated with one OTU belonging to the large diatom genus Chaetoceros. Frustules from this diatom genus constituted the bulk of Southern Ocean sediment (Würzberg et al., 2014) and it was also found to be dominant in the Kuril-Kamchatka area (Golovan et al., 2019). One Chaetoceros OTU drove separation for the DNA samples, further highlighting the importance of pelagic DNA deposits in our data set.
A third point is that enormous quantities of extracellular DNA accumulate across the seafloor (Dell’Anno and Danovaro, 2005) and this material remains accessible for metabarcoding for extended periods of time ranging from centuries for settling, pelagic fish DNA (Kuwae et al., 2020) to millenia for benthic Foraminifera and even planktonic organisms (Coolen et al., 2013; Lejzerowicz et al., 2013a). The deep-sea environment favors the preservation of biomolecules and it has been found that up to half of 16S rDNA copies at abyssal depth originate from extracellular DNA pools (Corinaldesi et al., 2018). We found that the local heterogeneity for foraminiferal DNA is higher at stations characterized by low BPI values, compared to RNA and to stations located on slopes. This suggests that eDNA but not eRNA accumulates in depressions. In addition, we found that for eDNA – but again not for eRNA - there were significant correlations between alpha diversity and both BPI and slope. Faith’s PD decreased with slope, suggesting winnowing (i.e., reduced permanent deposition) of eDNA in elevated areas, but increased with BPI. We stress that BPI interpretation is tightly linked to scale, and since this correlation is made across areas, it indicates that eDNA has a higher diversity in localities where there are more topographic depressions in which eDNA deposition may be focused. This suggests that eDNA winnowed off a slope would tend to become concentrated in these pools. Similar mechanisms of sediment winnowing and focusing related to abyssal seafloor topography have been postulated for labile particulate organic matter (Turnewitsch et al., 2015) and may determine its degradation (Volz et al., 2018). Nucleic acid is organic matter as well, and since RNA degrades more rapidly than DNA, it should be possible to model how these complex processes influence the distribution patterns inferred from environmental sequencing data. Interestingly, abyssal hills and more subtle topographic changes also appear to influence the distribution of live Foraminifera (Stefanoudis et al., 2016) and metazoan megafauna (Durden et al., 2020). Hence, if it can be assumed that DNA spreads with organic matter on the abyssal seafloor, we envision metabarcoding as a quantitative tool for trophic ecology and recommend RNA, which is likely to reflect contemporary faunas more accurately, for biodiversity assessments.
Corroborating this observation, we found that only beta-diversity comparisons measured from DNA (between regions, areas or stations) were not subject to differences in dispersion. The slow degradation time scales for DNA mentioned above may cause environmental DNA to integrate biodiversity over much longer time scales, combining past and present communities (Brandt et al., 2020), and thereby lowering variability amongst overlapping communities in RPCA ordinations. This can also explain the higher Shannon’s entropy (compared to Faith’s PD), because entropy increases with evenness, which will increase in turn with each set of DNA OTUs added to the pool. In contrast, RNA is more labile and therefore may exhibit more compositional variation that likely reflects spatial patchiness over shorter time scales. This potential advantage that RNA may confer by more accurately delineating deep-sea community patchiness in space and time is further indicated by the fact that we observe a higher distance to centroid for RNA compared to DNA across the entire CCZ (although reflecting local-scale, within-CCZ station heterogeneity). Higher RNA heterogeneity is a general trend for all beta-diversity metrics (higher median values, see Figure 8B) but was only statistically supported when accounting for evolutionary histories (i.e., using phylogenetic, UniFrac metrics). Interestingly, Macheriotou et al. (2020) relied on similar metrics to show a strong phylogenetic clustering for Nematoda in the CCZ, indicating highly heterogeneous, patchy communities, although their metabarcoding data derived from density-separated nematodes and not from bulk sediment. This makes their results more comparable to what eRNA conveys best, i.e., active, live species as shown for Foraminifera (Langlet et al., 2013; Lejzerowicz et al., 2013b), further strengthening our advocacy for use of eRNA for biomonitoring.
Wide Spectrum of Novel Benthic Taxa Revealed
This study is based on the largest collection ever assembled of deep-sea sediment samples covering a wide range of geographic areas. Using eDNA as well as eRNA sequence data, it represents a first attempt at understanding global to local biodiversity and distribution patterns for deep-sea benthic eukaryotes. Some metazoan clades could be assigned at the genus or species level, notably those belonging to the Nematoda, which are the best represented metazoan group in our data and consistently the dominant meiofaunal taxon in the deep sea (Thiel, 1983), including the CCZ (Pape et al., 2017). However, for many metazoan taxa, assignment was only possible to a Class, Order or Family (Figure 3). Among the Foraminifera, a large proportion of reads and OTUs could not be assigned to any known taxon (Figures 2A,B), a result that is also consistent with previous studies (Lecroq et al., 2009a; Lejzerowicz et al., 2014). Most of those that were assigned could only be placed in a Class, Order, or Family, or in a particular isolate (i.e., an unidentified specimen).
These results undoubtedly indicate the existence of many new taxa, but it should be noted that the incompleteness of reference database coverage remains a major impediment to taxon assignment in biodiversity surveys. In a recent study based on samples from a well-studied and heavily sampled area of the North Sea, Hestetun et al. (2020) estimated that for the 18S rRNA gene, species coverage was 36% for GenBank and 27% for SILVA, which we used in this study (along with the curated, protist-focused PR2). The species coverage in these databases is certain to be substantially lower for the sparsely sampled, species-rich deep sea. Molecular reference databases are undergoing major developments for animal groups that are important constituents of CCZ assemblage. However, these mainly concern macro- and mega-faunal taxa (e.g., Cnidaria, Mollusca and Polychaeta: Dahlgren et al., 2016; Glover et al., 2016; Wiklund et al., 2017, 2019) rather than meiofaunal organisms, which are potentially important ecologically (Smith et al., 2008; Ingels et al., 2020) and dominate metabarcoding data. We also recognize that querying very large, lightly curated databases may help improve high-level assignment, but relying on consistency across assignment methods applied to less complex databases could offer an equally interesting avenue to high-level assignment and with high confidence at the scale of such high-throughput data. In fact, one highly valuable approach is to improve such assignments using taxon-specific databases, as demonstrated for Nematoda (Macheriotou et al., 2020). Curated phylum-specific databases would best resolve assignments associated with long, detailed taxonomic paths that are not aligned with that of other phyla, as in the case of Platyhelminthes and Xenacoelomorpha. Indeed, these two distinct phyla are lumped together in the generalist, protist-oriented PR2 database, whereas their taxonomic paths include more than the eight taxonomic ranks used here for taxonomic assignment.
Despite these caveats, the large proportion of reads that can only be assigned at higher taxonomic levels is quite consistent with the low level of basic taxonomic knowledge of deep-sea faunas (Glover et al., 2018). Many deep-sea species remain scientifically undescribed, particularly at abyssal depths, despite belonging to higher taxa that are commonly seen in deep-sea samples. Among the metazoan meiofauna, almost all (99.3%) of the 632 morphospecies of harpacticoid copepods recognized at two stations in the SE Atlantic (>5,000 m water depth) were considered to be new to science (George et al., 2014). In the eastern CCZ, 94.1% of 170 macrofaunal isopod species were undescribed (Brix et al., 2020). In the same area, undescribed monothalamid morphospecies, many of them previously unseen, are an important constituent of both meiofaunal (Goineau and Gooday, 2017, 2019; Gooday and Goineau, 2019) and macrofaunal (Gooday et al., 2021) foraminiferal assemblages.
Foraminifera and metazoan meiofaunal animals such as nematodes and harpacticoid copepods are common and familiar constituents of the abyssal sediment biota, as are, for example, polychaetes, isopods, and tanaids among the macrofauna and holothurians and sponges among the megafauna (Gage and Tyler, 1991; Washburn et al., 2021). However, as earlier shown by Sinniger et al. (2016), our V1V2 data reveal the presence in the eastern CCZ of animals that are rarely seen in deep-sea samples; for example, xenacoelomorphs (Rouse et al., 2016) platyhelminthes (Christensen, 1981), and priapulids (van der Land, 1972). As far as we know, the Placozoa and Mesozoa, for which we recovered some sequences from the Pacific and Southern Oceans, have never been reported from deep sea samples. Some of these taxa, notably some platyhelminthes (trematodes) and mesozoans, probably occur mainly as parasites (Bray, 2020), but others (turbellarian platyhelminthes, placozoans) may be free-living but too fragile to survive in a recognizable form in fixed samples. Thus, our metabarcoding data appears to reveal a fuller spectrum of animal diversity at our abyssal sites than could be recovered by traditional morphology-based methods. The same applies to the foraminifera, with OTUs that are known only from the environmental sequences constituting an important proportion of the assemblages, with an average of 8.4 ± 1.98% of OTUs of an area.
Interestingly, the metazoan diversity that Sinniger et al. (2016) revealed using eDNA metabarcoding is more readily detected at a similar sampling effort in our study using eRNA than eDNA. This suggests that this molecule is more reliable for analyzing diversity across studies and possibly, for future biomonitoring surveys. Yet, the amount of novel sequences that re-sampling yields is huge, as only c.a. 2% of the OTUs formed across studies contained sequences from both Sinniger et al. (2016) and the present study, even in the case of sediment sample extracts originating from the same station in the South Atlantic (DIVA-3 expedition, Martínez Arbizu et al., 2015).
Biogeographic Patterns From Global to Local Scales
The breadth and heterogeneity of the seafloor habitats (Howell et al., 2016) makes it challenging to establish patterns of deep-sea benthic biodiversity and biogeography at the spatial scales relevant to conservation efforts related to seabed mining (McQuaid et al., 2020) and climate change (Levin et al., 2020b). There is a general trend for morphological and genetic divergence to decrease with increasing water depth, and for species ranges to increase, reaching a maximal extent on abyssal plains where there should be fewer barriers for dispersal, in contrast to the topographically, hydrographically and environmentally more complex continental margins (Grassle and Morse-Porteous, 1987; Etter et al., 2005; McClain and Hardy, 2010). For example, in the geologically orientated literature, a number of well-documented, abyssal hard-shelled species of foraminifera, are considered to have ‘cosmopolitan’ distributions (Murray, 2006; Holbourn et al., 2013). This is confirmed by genetic data in the case of Epistominella exigua (Pawlowski et al., 2007; Lecroq et al., 2009b) and Cibicidoides wuellerstorfi (Burkett et al., 2020). Wide ranges are reported for certain species of harpacticoid copepods (Menzel et al., 2011) and polychaetes (Schüller and Hutchings, 2012; Guggolz et al., 2020), in the latter case with genetic support. At the same time, it is also common for abyssal assemblages of a particular taxon to combine a few dominant, widely distributed species with many more rare species that are found only in one or two samples (e.g., Glover et al., 2002; Wilson, 2017; Washburn et al., 2021). Notably, Foraminifera OTUs that only occur in a single CCZ stratum also tend to occur in only one station of this stratum, even when highly sequenced (Gooday et al., 2021). Because rarity is often correlated with small species ranges in better known ecosystems (e.g., Pimm et al., 2014), these rare abyssal species may have limited distributions as well. Our metabarcoding data, as well as earlier genetic results (Janssen et al., 2015; Macheriotou et al., 2019), reveal a similar assemblage structure, with relatively few, highly sequenced OTUs but many rare OTUs that were confined to single or pairs of areas or stations (Figure 5). In addition to rare OTUs, the likely contribution of extracellular DNA (Corinaldesi et al., 2018) is another factor to consider in trying to generalize about biogeographic patterns and species ranges in the abyss based on metabarcoding.
Since establishing cosmopolitan and endemic patterns depends on sampling and sequencing efforts, we used rarefaction and propose to focus on the well-sampled UK-1B and OMS strata of the eastern CCZ. Here, the presence of cosmopolitan foraminiferal OTUs, and notably their high prevalence, are not surprising. Indeed, since the Pacific is the oldest ocean and nodule-rich environments are particularly stable, it is possible that the ‘stability-time’ hypothesis (Sanders, 1968), suggested as a key driver of niche diversification for Nematoda in the CCZ (Macheriotou et al., 2020), might also explain the diversity of Foraminifera, although other explanations are equally plausible (Snelgrove and Smith, 2002). Interestingly, the early evolution of Foraminifera is characterized by a large radiation of monothalamous species (Pawlowski et al., 2003) which remain highly diverse today in the abyss. Given the genomic potential of Foraminifera to adapt to changing environmental conditions (e.g., anoxia, Orsi et al., 2020), and the dramatic ecosystem transformation that could result from mining, it is important to also explore the distribution of functional-adaptation determinants and consider these for spatial planning in order to preserve adequate sources of biodiversity for recolonization.
At a global scale, we observed distinct faunal patterns in the foraminiferal and eukaryotic datasets. In particular, the CCZ is clearly different from the other regions from which we have data. The Southern Ocean and Kuril-Kamchatka, regions that were also well sampled and sequenced, also appear to be faunally distinct. The large-scale patterns observed in our data are broadly consistent with the abyssal seafloor provinces proposed by Watling (2013) and the marine realms of Costello et al. (2017), which integrate pelagic and benthic data. The CCZ sites fall within abyssal province A11 of Watling (2013), the Southern Ocean sites within AB5 and the SW Atlantic sites within AB3. Interestingly, we found the highest Faith’s PD alpha diversity in the DNA data from the Kuril-Kamchatka region. This could reflect the location of this region at the intersection of three realms in Costello et al. (2017) and near the boundary of two benthic provinces in Watling (2013), although again other factors, including habitat heterogeneity, may also drive higher diversity.
Strong differences at the larger scale between regions do not necessarily indicate that sample compositions are homogeneous within these regions (especially when looking at tight clusters on global RPCAs). In fact, there exists a high degree of heterogeneity at smaller scales within regions and within areas. The dissimilarity-decay curves indicate that an enormous amount of faunal variability remains to be explored in deep-sea ecosystems, including within the CCZ. If seafloor areas such as the CCZ were sampled enough for random sampling to yield populations of truly comparable communities (e.g., for more specific statistical assessments), these curves would plateau out, as is the case in extensively sampled ecosystems (e.g., McDonald et al., 2018a). In addition, we hypothesize that exploring other habitats of the CCZ, such as nodules and other hard substrates hosting attached faunas (Amon et al., 2016; Smith, 2020), would shift the baseline we observe for this curve. Therefore, we propose this dissimilarity-decay analysis as a useful approach to evaluate sufficiency of biodiversity sampling for a given spatial scale. This beta diversity analysis can be made robust to the compositional nature of the data and is thus preferable to comparisons based on alpha diversity extrapolations, which remain promising to evaluate the importance of nodule habitats in the CCZ (Laroche et al., 2020b).
Implications for CCZ Conservation in the Face of Deep Seabed Mining
Although most of our samples originate from the CCZ, they cover only a tiny fraction of the CCZ’s habitat heterogeneity, effectively 3 out of 24 habitat classes defined for the CCZ (McQuaid et al., 2020). This very uneven coverage limits the relevance of our results to conservation across the entire CCZ, as all samples come from the eastern half and, with the exception of the IFREMER area, from the eastern end of the CCZ. We did not obtain samples from the western half or from any of the no-mining protected areas, termed Areas of Particular Environmental Interest (APEIs). There is a general bias in our current knowledge toward the eastern half across all biological studies in the CCZ (e.g., Washburn et al., 2021), which limits our understanding of trends in relation to depth and productivity gradients. However, new knowledge for the CCZ and its comparison with the five other soft-bottom areas we included in our survey contributes to understanding of fine-sediment habitats in the deep sea. More widely, we suggest that the rapidly evolving field of environmental genomics has the potential to deliver new tools that could provide consistency across the kind of large international research efforts that are likely to dominate deep-ocean research in coming decades (e.g., Howell et al., 2020).
An important advance that will follow naturally from the present, descriptive study is the testing of predictive models that account for scale, topography and habitat heterogeneity. A plethora of statistical learning techniques are mature enough to make such predictions and inform the design of sampling protocols for baseline and monitoring studies in the CCZ and other industrially impacted areas, provided that high accuracy can be achieved. Machine learning predictions based on metabarcoding data are useful for classification into biotic indices that are used for biomonitoring purposes in polluted, well-studied shallow-water benthic communities (e.g., Cordier et al., 2018, 2019), as well as for regressions accounting for the rare species of taxa susceptible to climate change at global scales (Busseni et al., 2020). By applying a similar approach, it also may be possible to test whether the cosmopolitan patterns we observed are real. Although we employed rigorous laboratory procedures comparable to those used in research on ancient DNA in order to avoid cross-contamination, OTUs that appear in every sample could, if rare, still be artifactual. Thus, studies based on the same genetic marker should be reanalyzed jointly to confirm patterns of cosmopolitanism and prove that harmonized, open-source metabarcoding data is a powerful tool for testing reproducibility and promoting capacity building.
To conclude, our study confirms the potential of metabarcoding for describing the deep-sea microbial and meiofaunal diversity of abyssal seafloor ecosystems. However, its use for the assessment of anthropogenic impacts, such as polymetallic nodule mining, would require better ecological understanding of the response of seafloor ecosystem to mining relating stressors (e.g., removal of nodules and surface sediments, enhanced turbidity, burial/smothering in disturbed-sediment plumes, Smith et al., 2020). Such ecological knowledge is necessary for ground truthing the metabarcoding analyses. As the ecological interpretation of metrics derived from metabarcoding improves, we anticipate that future surveys, combined with other omics analyses, will prove to be a powerful method for assessing the impact of deep-seabed mining on fragile benthic ecosystems.
Data Availability Statement
The datasets presented in this study can be found in online repositories. The names of the repository/repositories and accession number(s) can be found below: European Nucleotide Archive accession PRJEB44134 and https://figshare.com/projects/Eukaryotic_eDNA_eRNA_From_CCZ_Benthos/98972.
Author Contributions
AB, PMA, LM, LA-P-G, RM, and CRS organized deep-sea expedition or provided sediment material. FL, JP, and AJG conceived the study and wrote the manuscript. FL, IBA, and TC prepared the samples. FL performed the analyses. All authors provided comments and edits to the manuscript.
Funding
FL was supported by an Early Postdoc.Mobility Grant from the Swiss National Science Foundation (P2GEP3_171829). JP, LA-P-G, and IBA were supported by the Swiss National Science Foundation grants 31003A_179125 and 316030_150817. FL, TC, LAL, and JP were also supported by the Swiss Network for International Studies award (20170024). Samples from the UK-1 and OMS license areas in the Clarion-Clipperton Zone were collected as part of the ABYSSLINE project, funded by UK Seabed Resources Ltd. This funder was not involved in the study design, collection, analysis, interpretation of data, the writing of this article or the decision to submit it for publication. The material was collected and sorted within the framework of several large international projects. The expeditions with RV Polarstern were supported by the German Research Foundation, both expeditions with RV Sonne by the German Ministry for Science and Education. Pew Charitable Trusts payed for publications charges and for the Deep CCZ Biodiversity Synthesis Workshop which helped develop this manuscript.
Conflict of Interest
JP and LA-P-G were employed by ID-Gene Ecodiagnostics.
The remaining authors declare that the research was conducted in the absence of any commercial or financial relationships that could be construed as a potential conflict of interest.
Acknowledgments
We thank the crews of the research vessels FS Polarstern, RV Sonne, FS Maria S. Merian, FS Meteor, R/V Kilo Moana, R/V Thompson, and RV L’Atalante for their help on board and all student helpers and technicians for support and help with sorting of the extensive expedition material. EU JPIO-Oceans project MinigImpact-2 (German BMBF contract 03F0812E). Samples from the German Contractor Area were kindly made available by Carsten Rühlemann and Annemiek Vink (Bundesanstalt für Geowissenschaften und Rohstoffe). We also thank Stefan Mulitza and MARUM for the North Atlantic samples collected during MSM39, Maria Holzmann for the alignments of the reference foraminifera tree, Frédéric Sinniger for the data and reference Metazoa tree, Stefan Janssen for early advice on placement in the eukaryotic SILVA reference tree, Kerry Howell for the collection of environmental data layers, Aurélie Goineau, Alexandra Anh-Thu Weber, Gan Bin Qi, Laura Würzberg, Tomas Cedhagen, and Ivan Voltsky for assistance during sampling at sea. Pew Charitable Trusts for supporting the participation of CRS, AJG and FL in the Deep CCZ Biodiversity Synthesis Workshop and for paying the publications charges.
Supplementary Material
The Supplementary Material for this article can be found online at: https://www.frontiersin.org/articles/10.3389/fmars.2021.671033/full#supplementary-material
Footnotes
- ^ https://figshare.com/account/home#/projects/98972
- ^ github.com/yoann-dufresne/DoubleTagDemultiplexer
References
Adamo, M., Voyron, S., Chialva, M., Marmeisse, R., and Girlanda, M. (2020). Metabarcoding on both environmental DNA and RNA highlights differences between fungal communities sampled in different habitats. PLoS One 15:e0244682. doi: 10.1371/journal.pone.0244682
Aitchison, J. (1982). The statistical analysis of compositional data. J. R. Stat. Soc. Ser. B Stat. Methodol. 44, 139–160.
Aitchison, J. (1986). The Statistical Analysis of Compositional Data. Monographs on Statistics and Applied Probability. (Reprinted in 2003 with additional material by Blackburn Press), London: Chapman & Hall, 416.
Amon, D. J., Ziegler, A. F., Dahlgren, T. G., Glover, A. G., Goineau, A., Gooday, A. J., et al. (2016). Insights into the abundance and diversity of abyssal megafauna in a polymetallic-nodule region in the eastern Clarion-Clipperton Zone. Sci. Rep. 6:30492.
Armstrong, C. W., Foley, N. S., Tinch, R., and van den Hove, S. (2012). Services from the deep: steps towards valuation of deep sea goods and services. Ecosyst. Serv. 2, 2–13. doi: 10.1016/j.ecoser.2012.07.001
Aylagas, E., Borja, A., Pochon, X., Zaiko, A., Keeley, N., Bruce, K., et al. (2020). Translational molecular ecology in practice: linking DNA-based methods to actionable marine environmental management. Sci. Total Environ. 744:140780. doi: 10.1016/j.scitotenv.2020.140780
Aylagas, E., Borja, Á, Muxika, I., and Rodríguez-Ezpeleta, N. (2018). Adapting metabarcoding-based benthic biomonitoring into routine marine ecological status assessment networks. Ecol. Indic. 95, 194–202. doi: 10.1016/j.ecolind.2018.07.044
Baddeley, A., Rubak, E., and Turner, R. (2015). Spatial Point Patterns: Methodology and Applications with R. Boca Raton, FL: CRC press, 828.
Barrenechea, I. A., Lejzerowicz, F., Cordier, T., Scheplitz, J., Kucera, M., Ariztegui, D., et al. (2020). Planktonic Foraminifera eDNA signature deposited on the seafloor remains preserved after burial in marine sediments. Sci. Rep. 10:20351.
Benjamini, Y., and Hochberg, Y. (1995). Controlling the false discovery rate: a practical and powerful approach to multiple testing. J. R. Stat. Soc. B 57, 289–300. doi: 10.1111/j.2517-6161.1995.tb02031.x
Bik, H. M., Sung, W. A., De Ley, P., Baldwin, J. G., Sharma, J., Rocha-Olivares, A. X., et al. (2012). Metagenetic community analysis of microbial eukaryotes illuminates biogeographic patterns in deep-sea and shallow water sediments. Mol. Ecol. 21, 1048–1059. doi: 10.1111/j.1365-294x.2011.05297.x
Blöthe, M., Wegorzewski, A., Müller, C., Simon, F., Kuhn, T., and Schippers, A. (2015). Manganese-cycling microbial communities inside deep-sea manganese nodules. Environ. Sci. Technol. 49, 7692–7700. doi: 10.1021/es504930v
Bolyen, E., Rideout, J. R., Dillon, M. R., Bokulich, N. A., Abnet, C. C., Al-Ghalith, G. A., et al. (2019). Reproducible, interactive, scalable and extensible microbiome data science using QIIME 2. Nat. Biotechnol. 37, 852–857.
Brandt, A., and Malyutina, M. V. (2015). The German-Russian deep-sea expedition KuramBio (Kurile Kamchatka biodiversity studies) on board of the RV Sonne in 2012 following the footsteps of the legendary expeditions with RV Vityaz. Deep Sea Res. II Top. Stud. Oceanogr. 111, 1–9. doi: 10.1016/j.dsr2.2014.11.001
Brandt, M. I., Trouche, B., Henry, N., Liautard-Haag, C., Maignien, L., De Vargas, C., et al. (2020). An assessment of environmental metabarcoding protocols aiming at favoring contemporary biodiversity in inventories of deep-sea communities. Front. Mar. Sci. 7:234. doi: 10.3389/fmars.2020.00234
Bray, R. A. (2020). Digenean parasites of deep-sea teleosts: a progress report. Int. J. Parasitol. Parasites Wildl. 12, 251–264. doi: 10.1016/j.ijppaw.2020.01.007
Brix, S., Osborn, K. J., Kaiser, S., Truskey, S. B., Schnurr, S. M., Brenke, N., et al. (2020). Adult life strategy affects distribution patterns in abyssal isopods–implications for conservation in Pacific nodule areas. Biogeosciences 17, 6163–6184. doi: 10.5194/bg-17-6163-2020
Burkett, A., Rathburn, A., Pratt, R. B., and Holzmann, M. (2020). Insights into the ecology of epibenthic calcareous Foraminifera from a colonization study at 4000 m (Station M) in the NE Pacific Ocean. Deep Sea Res. II Top. Stud. Oceanogr. 173:104709. doi: 10.1016/j.dsr2.2019.104709
Busseni, G., Caputi, L., Piredda, R., Fremont, P., Hay Mele, B., Campese, L., et al. (2020). Large scale patterns of marine diatom richness: drivers and trends in a changing ocean. Glob. Ecol. Biogeogr. 29, 1915–1928. doi: 10.1111/geb.13161
Camacho, C., Coulouris, G., Avagyan, V., Ma, N., Papadopoulos, J., Bealer, K., et al. (2009). BLAST+: architecture and applications. BMC Bioinformatics 10:421. doi: 10.1186/1471-2105-10-421
Cantrell, K., Fedarko, M. W., Rahman, G., McDonald, D., Yang, Y., Zaw, T., et al. (2020). EMPress enables tree-guided, interactive, and exploratory analyses of multi-omic datasets. bioRxiv [Preprint] doi: 10.1101/2020.10.06.327080
Chariton, A. A., Court, L. N., Hartley, D. M., Colloff, M. J., and Hardy, C. M. (2010). Ecological assessment of estuarine sediments by pyrosequencing eukaryotic ribosomal DNA. Front. Ecol. Environ. 8:233–238. doi: 10.1890/090115
Christensen, A. M. (1981). The geographical and bathymetrical distribution of the Fecampiidae (Turbellaria, Rhabdocoela). Hydrobiologia 84, 13–16. doi: 10.1007/978-94-009-8668-8_3
Conover, W. J., and Iman, R. L. (1979). On Multiple-Comparisons Procedures. Technical report. New Mexico, NM: Los Alamos Scientific Laboratory.
Conway, J. R., Lex, A., and Gehlenborg, N. (2017). UpSetR: an R package for the visualization of intersecting sets and their properties. Bioinformatics 33, 2938–2940. doi: 10.1093/bioinformatics/btx364
Coolen, M. J., Orsi, W. D., Balkema, C., Quince, C., Harris, K., Sylva, S. P., et al. (2013). Evolution of the plankton paleome in the Black Sea from the deglacial to anthropocene. Proc. Natl. Acad. Sci. U.S.A. 110, 8609–8614. doi: 10.1073/pnas.1219283110
Cordier, T., Forster, D., Dufresne, Y., Martins, C. I., Stoeck, T., and Pawlowski, J. (2018). Supervised machine learning outperforms taxonomy-based environmental DNA metabarcoding applied to biomonitoring. Mol. Ecol. Resour. 18, 1381–1391. doi: 10.1111/1755-0998.12926
Cordier, T., Lanzén, A., Apothéloz-Perret-Gentil, L., Stoeck, T., and Pawlowski, J. (2019). Embracing environmental genomics and machine learning for routine biomonitoring. Trends Microbiol. 27, 387–397. doi: 10.1016/j.tim.2018.10.012
Corinaldesi, C., Tangherlini, M., Manea, E., and Dell’Anno, A. (2018). Extracellular DNA as a genetic recorder of microbial diversity in benthic deep-sea ecosystems. Sci. Rep. 8:1839.
Costello, M. J., and Chaudhary, C. (2017). Marine biodiversity, biogeography, deep-sea gradients, and conservation. Curr. Biol. 27, R511–R527.
Costello, M. J., Tsai, P., Wong, P. S., Cheung, A. K., Basher, Z., and Chaudhary, C. (2017). Marine biogeographic realms and species endemicity. Nat. Commun. 8:1057.
Cristescu, M. E. (2019). Can environmental RNA revolutionize biodiversity science? Trends Ecol. Evol. 34, 694–697. doi: 10.1016/j.tree.2019.05.003
Dahlgren, T. G., Wiklund, H., Rabone, M., Amon, D. J., Ikebe, C., Watling, L., et al. (2016). Abyssal fauna of the UK-1 polymetallic nodule exploration area, Clarion-Clipperton Zone, central Pacific Ocean: Cnidaria. Biodivers. Data J. 4:e9277. doi: 10.3897/bdj.4.e9277
Danovaro, R., Corinaldesi, C., Dell’Anno, A., and Rastelli, E. (2017). Potential impact of global climate change on benthic deep-sea microbes. FEMS Microbiol. Lett. 364:fnx214.
Dell’Anno, A., and Danovaro, R. (2005). Extracellular DNA plays a key role in deep-sea ecosystem functioning. Science 309:2179. doi: 10.1126/science.1117475
Devey, C. (2015). Short Cruise Report R.V. “Sonne” Cruise SO-237 [SO237], Las Palmas - Santo Domingo, 14.12.2014 - 26.01.2015, Vol. 11. Kiel: GEOMAR Helmholtz Centre for Ocean Science, doi: 10.3289/SCR_SO_237
Dufresne, Y., Lejzerowicz, F., Perret-Gentil, L. A., Pawlowski, J., and Cordier, T. (2019). SLIM: a flexible web application for the reproducible processing of environmental DNA metabarcoding data. BMC Bioinformatics 20:88. doi: 10.1186/s12859-019-2663-2
Durden, J. M., Bett, B. J., and Ruhl, H. A. (2020). Subtle variation in abyssal terrain induces significant change in benthic megafaunal abundance, diversity, and community structure. Prog. Oceanogr. 186:102395. doi: 10.1016/j.pocean.2020.102395
Edgar, R. C. (2016). SINTAX: a simple non-bayesian taxonomy classifier for 16S and ITS sequences. bioRxiv [Preprint]
Edgar, R. C., Haas, B. J., Clemente, J. C., Quince, C., and Knight, R. (2011). UCHIME improves sensitivity and speed of chimera detection. Bioinformatics 27, 2194–2200. doi: 10.1093/bioinformatics/btr381
Esling, P., Lejzerowicz, F., and Pawlowski, J. (2015). Accurate multiplexing and filtering for high-throughput amplicon-sequencing. Nucleic Acids Res. 43, 2513–2524. doi: 10.1093/nar/gkv107
Etter, R., Rex, M. A., Chase, M. R., and Quattro, J. M. (2005). Population differentiation decreases with depth in deep-sea bivalves. Evolution 59, 1479–1491. doi: 10.1554/04-538
Faith, D. P. (1992). Conservation evaluation and phylogenetic diversity. Biol. Conserv. 61, 1–10. doi: 10.1016/0006-3207(92)91201-3
Gage, J. D., and Tyler, P. A. (1991). Deep-Sea Biology: A Natural History of Organisms at the Deep-Sea Floor. Cambridge: Cambridge University Press.
George, K. H., Veit-Köhler, G., Martinez Arbizu, P., Seifried, S., Rose, A., Willen, E., et al. (2014). Community structure and species diversity of Harpacticoida (Crustacea: Copepoda) at two sites in the deep sea of the Angola Basin (Southeast Atlantic). Org. Divers. Evol. 14, 57–73. doi: 10.1007/s13127-013-0154-2
Giner, C. R., Pernice, M. C., Balagué, V., Duarte, C. M., Gasol, J. M., Logares, R., et al. (2020). Marked changes in diversity and relative activity of picoeukaryotes with depth in the world ocean. ISME J. 14, 437–449. doi: 10.1038/s41396-019-0506-9
Gloor, G. B., Macklaim, J. M., Pawlowsky-Glahn, V., and Egozcue, J. J. (2017). Microbiome datasets are compositional: and this is not optional. Front. Microbiol. 8:2224. doi: 10.3389/fmicb.2017.02224
Gloor, G. B., Wu, J. R., Pawlowsky-Glahn, V., and Egozcue, J. J. (2016). It’s all relative: analyzing microbiome data as compositions. Ann. Epidemiol. 26, 322–329. doi: 10.1016/j.annepidem.2016.03.003
Glover, A. G., Dahlgren, T. G., Wiklund, H., Mohrbeck, I., and Smith, C. R. (2016). An end-to-end DNA taxonomy methodology for benthic biodiversity survey in the Clarion-Clipperton Zone, central Pacific abyss. J. Mar. Sci. Eng. 4:2. doi: 10.3390/jmse4010002
Glover, A. G., and Smith, C. R. (2003). The deep-sea floor ecosystem: current status and prospects of anthropogenic change by the year 2025. Environ. Conserv. 1, 219–241. doi: 10.1017/s0376892903000225
Glover, A. G., Smith, C. R., Paterson, G. L., Wilson, G. D., Hawkins, L., and Sheader, M. (2002). Polychaete species diversity in the central Pacific abyss: local and regional patterns, and relationships with productivity. Mar. Ecol. Prog. Ser. 240, 157–170. doi: 10.3354/meps240157
Glover, A. G., Wiklund, H., Chen, C., and Dahlgren, T. G. (2018). Point of view: managing a sustainable deep-sea ‘blue economy’requires knowledge of what actually lives there. Elife 7:e41319.
Goineau, A., and Gooday, A. J. (2017). Novel benthic Foraminifera are abundant and diverse in an area of the abyssal equatorial Pacific licensed for polymetallic nodule exploration. Sci. Rep. 7:45288.
Goineau, A., and Gooday, A. J. (2019). Diversity and spatial patterns of foraminiferal assemblages in the eastern Clarion–Clipperton zone (abyssal eastern equatorial Pacific). Deep Sea Res. I Oceanogr. Res. Pap. 149:103036. doi: 10.1016/j.dsr.2019.04.014
Golovan, O. A., Błażewicz, M., Brandt, A., Jażdżewska, A. Ì, Jóźwiak, P., Lavrenteva, A. V., et al. (2019). Diversity and distribution of peracarid crustaceans (Malacostraca) from the abyss adjacent to the Kuril-Kamchatka Trench. Mar. Biodivers. 49, 1343–1360. doi: 10.1007/s12526-018-0908-3
Gooday, A. J., and Goineau, A. (2019). The contribution of fine sieve fractions (63–150 μm) to foraminiferal abundance and diversity in an area of the eastern Pacific Ocean licensed for polymetallic nodule exploration. Front. Mar. Sci. 6:114. doi: 10.3389/fmars.2019.00114
Gooday, A. J., Holzmann, M., Caulle, C., Goineau, A., Kamenskaya, O., Weber, A. A., et al. (2017). Giant protists (Xenophyophores, Foraminifera) are exceptionally diverse in parts of the abyssal eastern Pacific licensed for polymetallic nodule exploration. Biol. Conserv. 207, 106–116. doi: 10.1016/j.biocon.2017.01.006
Gooday, A. J., Schoenle, A., Dolan, J. R., and Arndt, H. (2020). Protist diversity and function in the dark ocean–challenging the paradigms of deep-sea ecology with special emphasis on foraminiferans and naked protists. Eur. J. Protistol. 75:125721. doi: 10.1016/j.ejop.2020.125721
Gooday, A. J., Lejzerowicz, F., Goineau, A., Holzmann, M., Kamenskaya, O., and Kitazato, H., et al. (2021). The biodiversity and distribution of abyssal benthic Foraminifera and their possible ecological roles: a synthesis across the Clarion-Clipperton Zone. Front. Mar. Sci. doi: 10.3389/fmars.2021.634726
Grassle, J. F., and Morse-Porteous, L. S. (1987). Macrofaunal colonization of disturbed deep-sea environments and the structure of deep-sea benthic communities. Deep Sea Res. A Oceanogr. Res. Pap. 34, 1911–1950.
Guardiola, M., Uriz, M. J., Taberlet, P., Coissac, E., Wangensteen, O. S., and Turon, X. (2015). Deep-sea, deep-sequencing: metabarcoding extracellular DNA from sediments of marine canyons. PLoS One 10:e0139633. doi: 10.1371/journal.pone.0139633
Guardiola, M., Wangensteen, O. S., Taberlet, P., Coissac, E., Uriz, M. J., and Turon, X. (2016). Spatio-temporal monitoring of deep-sea communities using metabarcoding of sediment DNA and RNA. PeerJ 4:e2807. doi: 10.7717/peerj.2807
Guggolz, T., Meißner, K., Schwentner, M., Dahlgren, T. G., Wiklund, H., Bonifácio, P., et al. (2020). High diversity and pan-oceanic distribution of deep-sea polychaetes: Prionospio and Aurospio (Annelida: Spionidae) in the Atlantic and Pacific Ocean. Org. Divers. Evol. 18, 171–187. doi: 10.1007/s13127-020-00430-7
Guillou, L., Bachar, D., Audic, S., Bass, D., Berney, C., Bittner, L., et al. (2013). The protist ribosomal reference database (PR2): a catalog of unicellular eukaryote small sub-unit rRNA sequences with curated taxonomy. Nucleic Acids Res. 41, D597–D604.
Halfvarson, J., Brislawn, C. J., Lamendella, R., Vázquez-Baeza, Y., Walters, W. A., Bramer, L. M., et al. (2017). Dynamics of the human gut microbiome in inflammatory bowel disease. Nat. Microbiol. 2:17004.
Hein, J. R., Mizell, K., Koschinsky, A., and Conrad, T. A. (2013). Deep-ocean mineral deposits as a source of critical metals for high-and green-technology applications: comparison with land-based resources. Ore Geol. Rev. 51, 1–4. doi: 10.1016/j.oregeorev.2012.12.001
Hessler, R. R., and Sanders, H. L. (1967). Faunal diversity in the deep-sea. Deep Sea Res. 14, 65–78. doi: 10.1016/0011-7471(67)90029-0
Hestetun, J. T., Bye-Ingebrigtsen, E., Nilsson, R. H., Glover, A. G., Johansen, P. O., and Dahlgren, T. G. (2020). Significant taxon sampling gaps in DNA databases limit the operational use of marine macrofauna metabarcoding. Mar. Biodivers. 50, 1–9.
Higgs, N. D., and Attrill, M. (2015). Biases in biodiversity: wide-ranging species are discovered first in the deep sea. Front. Mar. Sci. 2:61. doi: 10.3389/fmars.2015.00061
Holbourn, A., Henderson, A. S., and MacLeod, N. (2013). Atlas of Benthic Foraminifera. Hoboken, NJ: John Wiley & Sons, 642.
Holzmann, M., and Pawlowski, J. (2017). An updated classification of rotaliid Foraminifera based on ribosomal DNA phylogeny. Mar. Micropaleontol. 132, 18–34. doi: 10.1016/j.marmicro.2017.04.002
Howell, K. L., Hilário, A., Allcock, A. L., Bailey, D., Baker, M., Clark, M. R., et al. (2020). A decade to study deep-sea life. Nat. Ecol. Evol. 25, 265–267.
Howell, K. L., Piechaud, N., Downie, A. L., and Kenny, A. (2016). The distribution of deep-sea sponge aggregations in the North Atlantic and implications for their effective spatial management. Deep Sea Res. I Oceanogr. Res. Pap. 115, 309–320. doi: 10.1016/j.dsr.2016.07.005
Huttenhower, C., Gevers, D., Knight, R., Abubucker, S., Badger, J. H., Chinwalla, A. T., et al. (2012). Structure, function and diversity of the healthy human microbiome. Nature 486:207. doi: 10.1038/nature11234
Ingels, J., Valdes, Y., Pontes, L. P., Silva, A. C., Neres, P. F., Corrêa, G. V., et al. (2020). Meiofauna life on loggerhead sea turtles-diversely structured abundance and biodiversity hotspots that challenge the meiofauna paradox. Diversity 12:203. doi: 10.3390/d12050203
Jackson, D. A. (1995). PROTEST: a PROcrustean randomization TEST of community environment concordance. Ecoscience 2, 297–303. doi: 10.1080/11956860.1995.11682297
Janssen, A., Kaiser, S., Meissner, K., Brenke, N., Menot, L., and Martinez Arbizu, P. (2015). A reverse taxonomic approach to assess macrofaunal distribution patterns in abyssal Pacific polymetallic nodule fields. PLoS One 10:e0117790. doi: 10.1371/journal.pone.0117790
Janssen, S., McDonald, D., Gonzalez, A., Navas-Molina, J. A., Jiang, L., Xu, Z. Z., et al. (2018). Phylogenetic placement of exact amplicon sequences improves associations with clinical information. mSystems 3:e21-18.
Knight, R., Vrbanac, A., Taylor, B. C., Aksenov, A., Callewaert, C., Debelius, J., et al. (2018). Best practices for analysing microbiomes. Nat. Rev. Microbiol. 16, 410–422.
Kruskal, W. H., and Wallis, W. A. (1952). Use of ranks in one-criterion variance analysis. J. Am. Stat. Assoc. 47, 583–621. doi: 10.1080/01621459.1952.10483441
Kuwae, M., Tamai, H., Doi, H., Sakata, M. K., Minamoto, T., and Suzuki, Y. (2020). Sedimentary DNA tracks decadal-centennial changes in fish abundance. Commun. Biol. 3:558.
Langlet, D., Geslin, E., Baal, C., Metzger, E., Lejzerowicz, F., Riedel, B., et al. (2013). Foraminiferal survival after long-term in situ experimentally induced anoxia. Biogeosciences 10, 7463–7480. doi: 10.5194/bg-10-7463-2013
Lanzén, A., Lekang, K., Jonassen, I., Thompson, E. M., and Troedsson, C. (2016). High-throughput metabarcoding of eukaryotic diversity for environmental monitoring of offshore oil-drilling activities. Mol. Ecol. 25, 4392–4406. doi: 10.1111/mec.13761
Lanzén, A., Lekang, K., Jonassen, I., Thompson, E. M., and Troedsson, C. (2017). DNA extraction replicates improve diversity and compositional dissimilarity in metabarcoding of eukaryotes in marine sediments. PLoS One 12:e0179443. doi: 10.1371/journal.pone.0179443
Laroche, O., Kersten, O., Smith, C. R., and Goetze, E. (2020a). Environmental DNA surveys detect distinct metazoan communities across abyssal plains and seamounts in the western Clarion Clipperton Zone. Mol. Ecol. 29, 4588–4604. doi: 10.1111/mec.15484
Laroche, O., Kersten, O., Smith, C. R., and Goetze, E. (2020b). From sea surface to seafloor: a benthic allochthonous eDNA survey for the abyssal ocean. bioRxiv [Preprint] doi: 10.1101/2020.05.07.082602
Laroche, O., Wood, S. A., Tremblay, L. A., Ellis, J. I., Lejzerowicz, F., Pawlowski, J., et al. (2016). First evaluation of foraminiferal metabarcoding for monitoring environmental impact from an offshore oil drilling site. Mar. Environ. Res. 120, 225–235. doi: 10.1016/j.marenvres.2016.08.009
Lecroq, B., Gooday, A. J., Cedhagen, T., Sabbatini, A., and Pawlowski, J. (2009a). Molecular analyses reveal high levels of eukaryotic richness associated with enigmatic deep-sea protists (Komokiacea). Mar. Biodivers. 39, 45–55.
Lecroq, B., Gooday, A. J., and Pawlowski, J. (2009b). Global genetic homogeneity in the deep-sea foraminiferan Epistominella exigua (Rotaliida: Pseudoparrellidae). Zootaxa 2096, 23–32. doi: 10.11646/zootaxa.2096.1.4
Lecroq, B., Lejzerowicz, F., Bachar, D., Christen, R., Esling, P., Baerlocher, L., et al. (2011). Ultra-deep sequencing of foraminiferal microbarcodes unveils hidden richness of early monothalamous lineages in deep-sea sediments. Proc. Natl. Acad. Sci. U.S.A. 108, 13177–13182. doi: 10.1073/pnas.1018426108
Lejzerowicz, F., Esling, P., Majewski, W., Szczuciński, W., Decelle, J., Obadia, C., et al. (2013a). Ancient DNA complements microfossil record in deep-sea subsurface sediments. Biol. Lett. 9:20130283. doi: 10.1098/rsbl.2013.0283
Lejzerowicz, F., Voltsky, I., and Pawlowski, J. (2013b). Identifying active Foraminifera in the Sea of Japan using metatranscriptomic approach. Deep Sea Res. II Top. Stud. Oceanogr. 86, 214–220. doi: 10.1016/j.dsr2.2012.08.008
Lejzerowicz, F., Esling, P., and Pawlowski, J. (2014). Patchiness of deep-sea benthic Foraminifera across the Southern Ocean: insights from high-throughput DNA sequencing. Deep Sea Res. II Top. Stud. Oceanogr. 108, 17–26. doi: 10.1016/j.dsr2.2014.07.018
Lejzerowicz, F., Esling, P., Pillet, L., Wilding, T. A., Black, K. D., and Pawlowski, J. (2015). High-throughput sequencing and morphology perform equally well for benthic monitoring of marine ecosystems. Sci. Rep. 5:13932.
Levin, L. A., Amon, D. J., and Lily, H. (2020a). Challenges to the sustainability of deep-seabed mining. Nat. Sustain. 3, 784–794. doi: 10.1038/s41893-020-0558-x
Levin, L. A., Wei, C. L., Dunn, D. C., Amon, D. J., Ashford, O. S., Cheung, W. W., et al. (2020b). Climate change considerations are fundamental to management of deep-sea resource extraction. Glob. Change Biol. 26, 4664–4678. doi: 10.1111/gcb.15223
Levin, L. A., Bett, B. J., Gates, A. R., Heimbach, P., Howe, B. M., Janssen, F., et al. (2019). Global observing needs in the deep ocean. Front. Mar. Sci. 6:241. doi: 10.3389/fmars.2019.00241
Levin, L. A., and Le Bris, N. (2015). The deep ocean under climate change. Science 350, 766–768. doi: 10.1126/science.aad0126
Levin, L. A., Mengerink, K., Gjerde, K. M., Rowden, A. A., Van Dover, C. L., Clark, M. R., et al. (2016). Defining “serious harm” to the marine environment in the context of deep-seabed mining. Mar. Policy 74, 245–259. doi: 10.1016/j.marpol.2016.09.032
Lindh, M. V., Maillot, B. M., Shulse, C. N., Gooday, A. J., Amon, D. J., Smith, C. R., et al. (2017). From the surface to the deep-sea: bacterial distributions across polymetallic nodule fields in the clarion-clipperton zone of the Pacific Ocean. Front. Microbiol. 8:1696.
Lindh, M. V., Maillot, B. M., Smith, C. R., and Church, M. J. (2018). Habitat filtering of bacterioplankton communities above polymetallic nodule fields and sediments in the Clarion-Clipperton zone of the Pacific Ocean. Environ. Microbiol. Rep. 10, 113–122. doi: 10.1111/1758-2229.12627
Logares, R., Audic, S., Santini, S., Pernice, M. C., De Vargas, C., and Massana, R. (2012). Diversity patterns and activity of uncultured marine heterotrophic flagellates unveiled with pyrosequencing. ISME J. 6, 1823–1833. doi: 10.1038/ismej.2012.36
Lozupone, C., and Knight, R. (2005). UniFrac: a new phylogenetic method for comparing microbial communities. Appl. Environ. Microbiol. 71, 8228–8235. doi: 10.1128/aem.71.12.8228-8235.2005
Macheriotou, L., Guilini, K., Bezerra, T. N., Tytgat, B., Nguyen, D. T., Phuong Nguyen, T. X., et al. (2019). Metabarcoding free-living marine nematodes using curated 18S and CO1 reference sequence databases for species-level taxonomic assignments. Ecol. Evol. 9, 1211–1226. doi: 10.1002/ece3.4814
Macheriotou, L., Rigaux, A., Derycke, S., and Vanreusel, A. (2020). Phylogenetic clustering and rarity imply risk of local species extinction in prospective deep-sea mining areas of the Clarion–Clipperton Fracture Zone. Proc. R. Soc. B 287:20192666. doi: 10.1098/rspb.2019.2666
Mahé, F., Rognes, T., Quince, C., de Vargas, C., and Dunthorn, M. (2015). Swarm v2: highly-scalable and high-resolution amplicon clustering. PeerJ 3:e1420. doi: 10.7717/peerj.1420
Mantel, N. (1967). The detection of disease clustering and a generalized regression approach. Cancer Res. 27, 209–220.
Martínez Arbizu, P., Brix, S., Kaiser, S., Brandt, A., George, K., Arndt, H., et al. (2015). Deep-Sea Biodiversity, Current Activity, and Seamounts in the Atlantic–Cruise no. M79/1–June 10–August 26, 2009–Montevideo (Uruguay)–Ponta Delgada (Portugal). METEOR-Berichte M79/1: 5–92, DFG-Senatskommission für Ozeanographie. Berlin: Leibniz Assication.
Martino, C., Morton, J. T., Marotz, C. A., Thompson, L. R., Tripathi, A., Knight, R., et al. (2019). A novel sparse compositional technique reveals microbial perturbations. mSystems 4:e00016-19. doi: 10.1128/mSystems.00016-19
Masella, A. P., Bartram, A. K., Truszkowski, J. M., Brown, D. G., and Neufeld, J. D. (2012). PANDAseq: paired-end assembler for illumina sequences. BMC Bioinformatics 13:31. doi: 10.1186/1471-2105-13-31
Mauffrey, F., Cordier, T., Apothéloz-Perret-Gentil, L., Cermakova, K., Merzi, T., Delefosse, M., et al. (2020). Benthic monitoring of oil and gas offshore platforms in the North Sea using environmental DNA metabarcoding. Mol. Ecol. doi: 10.1111/mec.15698 Online Print ahead.
McClain, C. R., and Hardy, S. M. (2010). The dynamics of biogeographic ranges in the deep sea. Proc. R. Soc. B Biol. Sci. 277, 3533–3546. doi: 10.1098/rspb.2010.1057
McDonald, D., Hyde, E., Debelius, J. W., Morton, J. T., Gonzalez, A., Ackermann, G., et al. (2018a). American gut: an open platform for citizen science microbiome research. mSystems 3:e31-18. doi: 10.1128/mSystems.00031-18
McDonald, D., Vázquez-Baeza, Y., Koslicki, D., McClelland, J., Reeve, N., Xu, Z., et al. (2018b). Striped UniFrac: enabling microbiome analysis at unprecedented scale. Nat. Methods 15, 847–848. doi: 10.1038/s41592-018-0187-8
McQuaid, K. A., Attrill, M. J., Clark, M. R., Cobley, A., Glover, A. G., Smith, C. R., et al. (2020). Using habitat classification to assess representativity of a protected area network in a large, data-poor area targeted for deep-sea mining. Front. Mar. Sci. 7:1066. doi: 10.3389/fmars.2020.558860
Menot, L. (2012). BIONOD Cruise, RV L’Atalante. Available online at: https://doi.org/10.17600/12010030 (accessed April 29, 2021).
Menzel, L., George, K. H., and Martinez Arbizu, P. (2011). Submarine ridges do not prevent large-scale dispersal of abyssal fauna: a case study of Mesocletodes (Crustacea, Copepoda, Harpacticoida). Deep Sea Res. I Oceanogr. Res. Pap. 58, 839–864. doi: 10.1016/j.dsr.2011.05.008
Mirarab, S., Nguyen, N., and Warnow, T. (2012). SEPP: SATé-enabled phylogenetic placement. InBiocomputing 2012, 247–258. doi: 10.1142/9789814366496_0024
Mitra, A., Skrzypczak, M., Ginalski, K., and Rowicka, M. (2015). Strategies for achieving high sequencing accuracy for low diversity samples and avoiding sample bleeding using illumina platform. PLoS One 10:e0120520. doi: 10.1371/journal.pone.0227431
Morard, R., Darling, K. F., Mahé, F., Audic, S., Ujiié, Y., Weiner, A. K., et al. (2015). PFR2: a curated database of planktonic Foraminifera 18S ribosomal DNA as a resource for studies of plankton ecology, biogeography and evolution. Mol. Ecol. Resour. 15, 1472–1485. doi: 10.1111/1755-0998.12410
Morard, R., Lejzerowicz, F., Darling, K. F., Lecroq-Bennet, B., Winther Pedersen, M., Orlando, L., et al. (2017). Planktonic Foraminifera-derived environmental DNA extracted from abyssal sediments preserves patterns of plankton macroecology. Biogeosciences 14, 2741–2754. doi: 10.5194/bg-14-2741-2017
Morato, T., González-Irusta, J. M., Dominguez-Carrió, C., Wei, C. L., Davies, A., Sweetman, A. K., et al. (2020). Climate-induced changes in the suitable habitat of cold-water corals and commercially important deep-sea fishes in the North Atlantic. Glob. Change Biol. 26, 2181–2202.
Morton, J. T., Sanders, J., Quinn, R. A., McDonald, D., Gonzalez, A., Vázquez-Baeza, Y., et al. (2017). Balance trees reveal microbial niche differentiation. mSystems 2:e162-16. doi: 10.1128/mSystems.00162-16
Mulitza, S., Bergmann, F., Brück, L., Chiessi, C. M., Govin, A., Klann, M., et al. (2015). Cruise No. MSM39 –June 07 –June 25, 2014—St. John’s (Canada)–St. John’s (Canada). MARIA S. MERIAN-Berichte, MSM39. DFG-Senatskommission für Ozeanographie. Berlin: Leibniz Assication, 89. doi: 10.2312/cr_msm39
Murali, A., Bhargava, A., and Wright, E. S. (2018). IDTAXA: a novel approach for accurate taxonomic classification of microbiome sequences. Microbiome 6, 1–4. doi: 10.1016/b978-0-12-512517-8.50014-x
Murray, J. W. (2006). Ecology and Applications of Benthic Foraminifera. Cambridge: Cambridge university press, 426.
Niner, H. J., Ardron, J. A., Escobar, E. G., Gianni, M., Jaeckel, A., Jones, D. O., et al. (2018). Deep-sea mining with no net loss of biodiversity—an impossible aim. Front. Mar. Sci. 5:53. doi: 10.3389/fmars.2018.00053
Oksanen, J. (2011). Multivariate Analysis of Ecological Communities in R: Vegan Tutorial. R Package Version. 1, 1–43.
Orsi, W. D., Morard, R., Vuillemin, A., Eitel, M., Wörheide, G., Milucka, J., et al. (2020). Anaerobic metabolism of Foraminifera thriving below the seafloor. ISME J. 8, 1–5.
Pante, E., and Simon-Bouhet, B. (2013). marmap: a package for importing, plotting and analyzing bathymetric and topographic data in R. PLoS One 8:e73051. doi: 10.1371/journal.pone.0073051
Pape, E., Bezerra, T. N., Hauquier, F., and Vanreusel, A. (2017). Limited spatial and temporal variability in meiofauna and nematode communities at distant but environmentally similar sites in an area of interest for deep-sea mining. Front. Mar. Sci. 4:205. doi: 10.3389/fmars.2017.00205
Pawlowski, J., Christen, R., Lecroq, B., Bachar, D., Shahbazkia, H. R., Amaral-Zettler, L., et al. (2011). Eukaryotic richness in the abyss: insights from pyrotag sequencing. PLoS One 6:e18169. doi: 10.1371/journal.pone.0018169
Pawlowski, J., Esling, P., Lejzerowicz, F., Cedhagen, T., and Wilding, T. A. (2014). Environmental monitoring through protist next-generation sequencing metabarcoding: assessing the impact of fish farming on benthic Foraminifera communities. Mol. Ecol. Resour. 14, 1129–1140. doi: 10.1111/1755-0998.12261
Pawlowski, J., Fahrni, J., Lecroq, B., Longet, D., Cornelius, N., Excoffier, L., et al. (2007). Bipolar gene flow in deep-sea benthic Foraminifera. Mol. Ecol. 16, 4089–4096. doi: 10.1111/j.1365-294x.2007.03465.x
Pawlowski, J., Holzmann, M., Berney, C., Fahrni, J., Gooday, A. J., Cedhagen, T., et al. (2003). The evolution of early Foraminifera. Proc. Natl. Acad. Sci. U.S.A. 100, 11494–11498.
Pawlowski, J., and Lecroq, B. (2010). Short rDNA barcodes for species identification in Foraminifera. J. Eukaryot. Microbiol. 57, 197–205. doi: 10.1111/j.1550-7408.2009.00468.x
Petersen, S., Krätschell, A., Augustin, N., Jamieson, J., Hein, J. R., and Hannington, M. D. (2016). News from the seabed–geological characteristics and resource potential of deep-sea mineral resources. Mar. Policy 70, 175–187. doi: 10.1016/j.marpol.2016.03.012
Pimm, S. L., Jenkins, C. N., Abell, R., Brooks, T. M., Gittleman, J. L., Joppa, L. N., et al. (2014). The biodiversity of species and their rates of extinction, distribution, and protection. Science 344:1246752. doi: 10.1126/science.1246752
Pochon, X., Wood, S. A., Keeley, N. B., Lejzerowicz, F., Esling, P., Drew, J., et al. (2015). Accurate assessment of the impact of salmon farming on benthic sediment enrichment using foraminiferal metabarcoding. Marine Pollution Bulletin 100, 370–382. doi: 10.1016/j.marpolbul.2015.08.022
Quast, C., Pruesse, E., Yilmaz, P., Gerken, J., Schweer, T., Yarza, P., et al. (2013). The SILVA ribosomal RNA gene database project: improved data processing and web-based tools. Nucleic Acids Res. 41, D590–D596.
Quinn, T. P., Erb, I., Richardson, M. F., and Crowley, T. M. (2018). Understanding sequencing data as compositions: an outlook and review. Bioinformatics 34, 2870–2878. doi: 10.1093/bioinformatics/bty175
Rabone, M., Harden-Davies, H., Collins, J. E., Zajderman, S., Appeltans, W., Droege, G., et al. (2019). Access to marine genetic resources (MGR): raising awareness of best-practice through a new agreement for biodiversity beyond national jurisdiction (BBNJ). Front. Mar. Sci. 6:520. doi: 10.3389/fmars.2019.00520
Ramirez-Llodra, E., Brandt, A., Danovaro, R., Mol, B. D., Escobar, E., German, C. R., et al. (2010). Deep, diverse and definitely different: unique attributes of the world’s largest ecosystem. Biogeosciences 7, 2851–2899. doi: 10.5194/bg-7-2851-2010
Rex, M. A., and Etter, R. J. (2010). Deep-Sea Biodiversity: Pattern and Scale. Harvard: Harvard University Press, 388.
Riehl, T., Wölfl, A. C., Augustin, N., Devey, C. W., and Brandt, A. (2020). Discovery of widely available abyssal rock patches reveals overlooked habitat type and prompts rethinking deep-sea biodiversity. Proc. Natl. Acad. Sci. U.S.A. 117, 15450–15459. doi: 10.1073/pnas.1920706117
Rognes, T., Flouri, T., Nichols, B., Quince, C., and Mahé, F. (2016). VSEARCH: a versatile open source tool for metagenomics. PeerJ 4:e2584.
Rouse, G. W., Wilson, N. G., Carvajal, J. I., and Vrijenhoek, R. C. (2016). New deep-sea species of Xenoturbella and the position of Xenacoelomorpha. Nature 530, 94–97. doi: 10.1038/nature16545
Ruiz-Trillo, I., Riutort, M., Littlewood, D. T. J., Herniou, E. A., and Baguña, J. (1999). Acoel flatworms: earliest extant bilaterian metazoans, not members of platyhelminthes. Science 283, 1919–1923. doi: 10.1126/science.283.5409.1919
Sanders, H. L. (1968). Marine benthic diversity: a comparative study. Am. Nat. 102, 243–282. doi: 10.1086/282541
Santoferrara, L., Burki, F., Filker, S., Logares, R., Dunthorn, M., and McManus, G. B. (2020). Perspectives from ten years of protist studies by high-throughput metabarcoding. J. Eukaryot. Microbiol. 67, 612–622. doi: 10.1111/jeu.12813
Schloss, P. D., Westcott, S. L., Ryabin, T., Hall, J. R., Hartmann, M., Hollister, E. B., et al. (2009). Introducing mothur: open-source, platform-independent, community-supported software for describing and comparing microbial communities. Appl. Environ. Microbiol. 75, 7537–7541. doi: 10.1128/aem.01541-09
Schüller, M., and Hutchings, P. A. (2012). New species of Terebellides (Polychaeta: Trichobranchidae) indicate long-distance dispersal between western South Atlantic deep-sea basins. Zootaxa 3254, 1–31. doi: 10.11646/zootaxa.3254.1.1
Shulse, C. N., Maillot, B., Smith, C. R., and Church, M. J. (2017). Polymetallic nodules, sediments, and deep waters in the equatorial North Pacific exhibit highly diverse and distinct bacterial, archaeal, and microeukaryotic communities. MicrobiologyOpen 6:e00428. doi: 10.1002/mbo3.428
Sinniger, F., Pawlowski, J., Harii, S., Gooday, A. J., Yamamoto, H., Chevaldonné, P., et al. (2016). Worldwide analysis of sedimentary DNA reveals major gaps in taxonomic knowledge of deep-sea benthos. Front. Mar. Sci. 3:92. doi: 10.3389/fmars.2016.00092
Smith, C. R. (2020). The heterogeneous abyss. Proc. Natl. Acad. Sci. U.S.A. 117, 16729–16731. doi: 10.1073/pnas.2010215117
Smith, C. R., Dahlgren, T. G., Drazen, J., Gooday, A., Glover, A. G., Kurras, G., et al. (2013). Abyssal Baseline Study (ABYSSLINE) Cruise Report. Seafloor Investigations Report 2013-1304-051J-SRDL-AB01. Washington, DC: Seafloor Investigations. 1–160.
Smith, C. R., De Leo, F. C., Bernardino, A. F., Sweetman, A. K., and Martinez Arbizu, P. (2008). Abyssal food limitation, ecosystem structure and climate change. Trends Ecol. Evol. 23, 518–528. doi: 10.1016/j.tree.2008.05.002
Smith, C. R., Tunnicliffe, V., Colaço, A., Drazen, J. C., Gollner, S., Levin, L. A., et al. (2020). Deep-sea misconceptions cause underestimation of seabed-mining impacts. Trends Ecol. Evol. 35, 853–857. doi: 10.1016/j.tree.2020.07.002
Snelgrove, P., and Smith, C. R. (2002). A riot of species in an environmental calm. Oceanogr. Mar. Biol. 40, 311–342. doi: 10.1201/9780203180594.ch6
Stamatakis, A. (2014). RAxML version 8: a tool for phylogenetic analysis and post-analysis of large phylogenies. Bioinformatics 30, 1312–1313. doi: 10.1093/bioinformatics/btu033
Stefanoudis, P. V., Bett, B. J., and Gooday, A. J. (2016). Abyssal hills: influence of topography on benthic foraminiferal assemblages. Prog. Oceanogr. 148, 44–55. doi: 10.1016/j.pocean.2016.09.005
Sweetman, A. K., Thurber, A. R., Smith, C. R., Levin, L. A., Mora, C., Wei, C. L., et al. (2017). Major impacts of climate change on deep-sea benthic ecosystems. Elementa 5:4.
Taberlet, P., Coissac, E., Pompanon, F., Brochmann, C., and Willerslev, E. (2012). Towards next-generation biodiversity assessment using DNA metabarcoding. Mol. Ecol. 21, 2045–2050. doi: 10.1111/j.1365-294x.2012.05470.x
Thiel, H. (1983). “Meiobenthos and nanobenthos of the deep sea,” in Deep Sea Biology. The Sea, ed. G. T. Rowe (New York, NY: John Wiley and Sons), 167–230.
Thurber, A. R., Sweetman, A. K., Narayanaswamy, B. E., Jones, D. O., Ingels, J., and Hansman, R. L. (2014). Ecosystem function and services provided by the deep sea. Biogeosciences 11, 3941–3963. doi: 10.5194/bg-11-3941-2014
Turner, P. J., Cannon, S., DeLand, S., Delgado, J. P., Eltis, D., Halpin, P. N., et al. (2020). Memorializing the middle passage on the atlantic seabed in areas beyond national jurisdiction. Mar. Policy 122:104254. doi: 10.1016/j.marpol.2020.104254
Turnewitsch, R., Lahajnar, N., Haeckel, M., and Christiansen, B. (2015). An abyssal hill fractionates organic and inorganic matter in deep-sea surface sediments. Geophys. Res. Lett. 42, 7663–7672. doi: 10.1002/2015gl065658
van der Land, J. (1972). Priapulus from the deep sea (Vermes, Priapulida). Zool. Meded. 47, 358–368.
Vázquez-Baeza, Y., Pirrung, M., Gonzalez, A., and Knight, R. (2013). EMPeror: a tool for visualizing high-throughput microbial community data. Gigascience 2:16.
Vinogradova, N. G. (1997). Zoogeography of the abyssal and hadal zones. Adv. Mar. Biol. 32, 325–387. doi: 10.1016/s0065-2881(08)60019-x
Virtanen, P., Gommers, R., Oliphant, T. E., Haberland, M., Reddy, T., Cournapeau, D., et al. (2020). SciPy 1.0: fundamental algorithms for scientific computing in Python. Nat. Methods 17, 261–272.
Volz, J. B., Mogollón, J. M., Geibert, W., Martinez Arbizu, P., Koschinsky, A., and Kasten, S. (2018). Natural spatial variability of depositional conditions, biogeochemical processes and element fluxes in sediments of the eastern Clarion-Clipperton Zone, Pacific Ocean. Deep Sea Res. I Oceanogr. Res. Pap. 140, 159–172. doi: 10.1016/j.dsr.2018.08.006
Vonnahme, T. R., Molari, M., Janssen, F., Wenzhöfer, F., Haeckel, M., Titschack, J., et al. (2020). Effects of a deep-sea mining experiment on seafloor microbial communities and functions after 26 years. Sci. Adv. 6:eaaz5922. doi: 10.1126/sciadv.aaz5922
Washburn, T. W., Menot, L., Bonifácio, P., Pape, E., Błażewicz, M., and Bribiesca-Contreras, G., et al. (2021). Patterns of macrofaunal biodiversity across the Clarion-Clipperton Zone: an area targeted for seabed mining. Front. Mar. Sci. 8:250. doi: 10.3389/fmars.2021.626571
Watling, L., Guinotte, J., Clark, M. R., and Smith, C. R. (2013). A proposed biogeography of the deep ocean floor. Progr. Oceanogr. 111, 91–112.
Weiss, A. (2001). “Topographic position and landforms analysis,” in Proceedings of the Poster Presentation, ESRI user Conference, San Diego, CA.
Wenhai, L., Cusack, C., Baker, M., Tao, W., Mingbao, C., Paige, K., et al. (2019). Successful blue economy examples with an emphasis on international perspectives. Front. Mar. Sci. 6:261. doi: 10.3389/fmars.2019.00261
Wiklund, H., Neal, L., Glover, A. G., Drennan, R., Rabone, M., and Dahlgren, T. G. (2019). Abyssal fauna of polymetallic nodule exploration areas, eastern clarion-clipperton zone, central Pacific Ocean: annelida: capitellidae, opheliidae, scalibregmatidae, and travisiidae. ZooKeys 883, 1–82.
Wiklund, H., Taylor, J. D., Dahlgren, T. G., Todt, C., Ikebe, C., Rabone, M., et al. (2017). Abyssal fauna of the UK-1 polymetallic nodule exploration area, Clarion-Clipperton Zone, central Pacific Ocean: Mollusca. ZooKeys 707, 1–46. doi: 10.3897/zookeys.707.13042
Wilson, G. D. (2017). Macrofauna abundance, species diversity and turnover at three sites in the Clipperton-Clarion Fracture Zone. Marine Biodiversity 47, 323–347. doi: 10.1007/s12526-016-0609-8
Wolf-Gladrow, D. (2013). The expedition of the research vessel” Polarstern” to the Antarctic in 2012 (ANT-XXVIII/3). Ber. Pol. Meeresforschung 661:191. doi: 10.2312/BzPM_0661_2013
Wood, S. A., Biessy, L., Latchford, J. L., Zaiko, A., von Ammon, U., Audrezet, F., et al. (2020). Release and degradation of environmental DNA and RNA in a marine system. Sci. Total Environ. 704:135314. doi: 10.1016/j.scitotenv.2019.135314
Würzberg, L., Zinkann, A. C., Brandt, A., Janussen, D., Bohn, J. M., and Schwabe, E. (2014). Intensity of pelagic–benthic coupling in different regions along the Antarctic Polar Front–Clues from abyssal megafauna. Deep Sea Res. II Top. Stud. Oceanogr. 108, 85–92. doi: 10.1016/j.dsr2.2014.09.003
Yilmaz, P., Kottmann, R., Field, D., Knight, R., Cole, J. R., Amaral-Zettler, L., et al. (2011). Minimum information about a marker gene sequence (MIMARKS) and minimum information about any (x) sequence (MIxS) specifications. Nat. Biotechnol. 29, 415–420.
Keywords: deep-sea sediment, eukaryotic biodiversity, Foraminifera, metazoans, 18S rRNA gene, bioinformatics, seafloor bathymetry
Citation: Lejzerowicz F, Gooday AJ, Barrenechea Angeles I, Cordier T, Morard R, Apothéloz-Perret-Gentil L, Lins L, Menot L, Brandt A, Levin LA, Martinez Arbizu P, Smith CR and Pawlowski J (2021) Eukaryotic Biodiversity and Spatial Patterns in the Clarion-Clipperton Zone and Other Abyssal Regions: Insights From Sediment DNA and RNA Metabarcoding. Front. Mar. Sci. 8:671033. doi: 10.3389/fmars.2021.671033
Received: 22 February 2021; Accepted: 19 April 2021;
Published: 25 May 2021.
Edited by:
Chiara Romano, Center for Advanced Studies of Blanes (CSIC), SpainReviewed by:
Owen S. Wangensteen, UiT The Arctic University of Norway, NorwayVera G. Fonseca, Centre for Environment, Fisheries and Aquaculture Science (CEFAS), United Kingdom
Copyright © 2021 Lejzerowicz, Gooday, Barrenechea Angeles, Cordier, Morard, Apothéloz-Perret-Gentil, Lins, Menot, Brandt, Levin, Martinez Arbizu, Smith and Pawlowski. This is an open-access article distributed under the terms of the Creative Commons Attribution License (CC BY). The use, distribution or reproduction in other forums is permitted, provided the original author(s) and the copyright owner(s) are credited and that the original publication in this journal is cited, in accordance with accepted academic practice. No use, distribution or reproduction is permitted which does not comply with these terms.
*Correspondence: Franck Lejzerowicz, Zmxlanplcm93aWN6QHVjc2QuZWR1